
Study on Seismic Behavior of Cross-Shaped-Steel-Reinforced RPC Columns
Abstract
:1. Introduction
2. Numerical Model of Cross-Shaped-Steel-Reinforced RPC Column
2.1. Basic Assumption
2.2. Constitutive Relationship of Materials
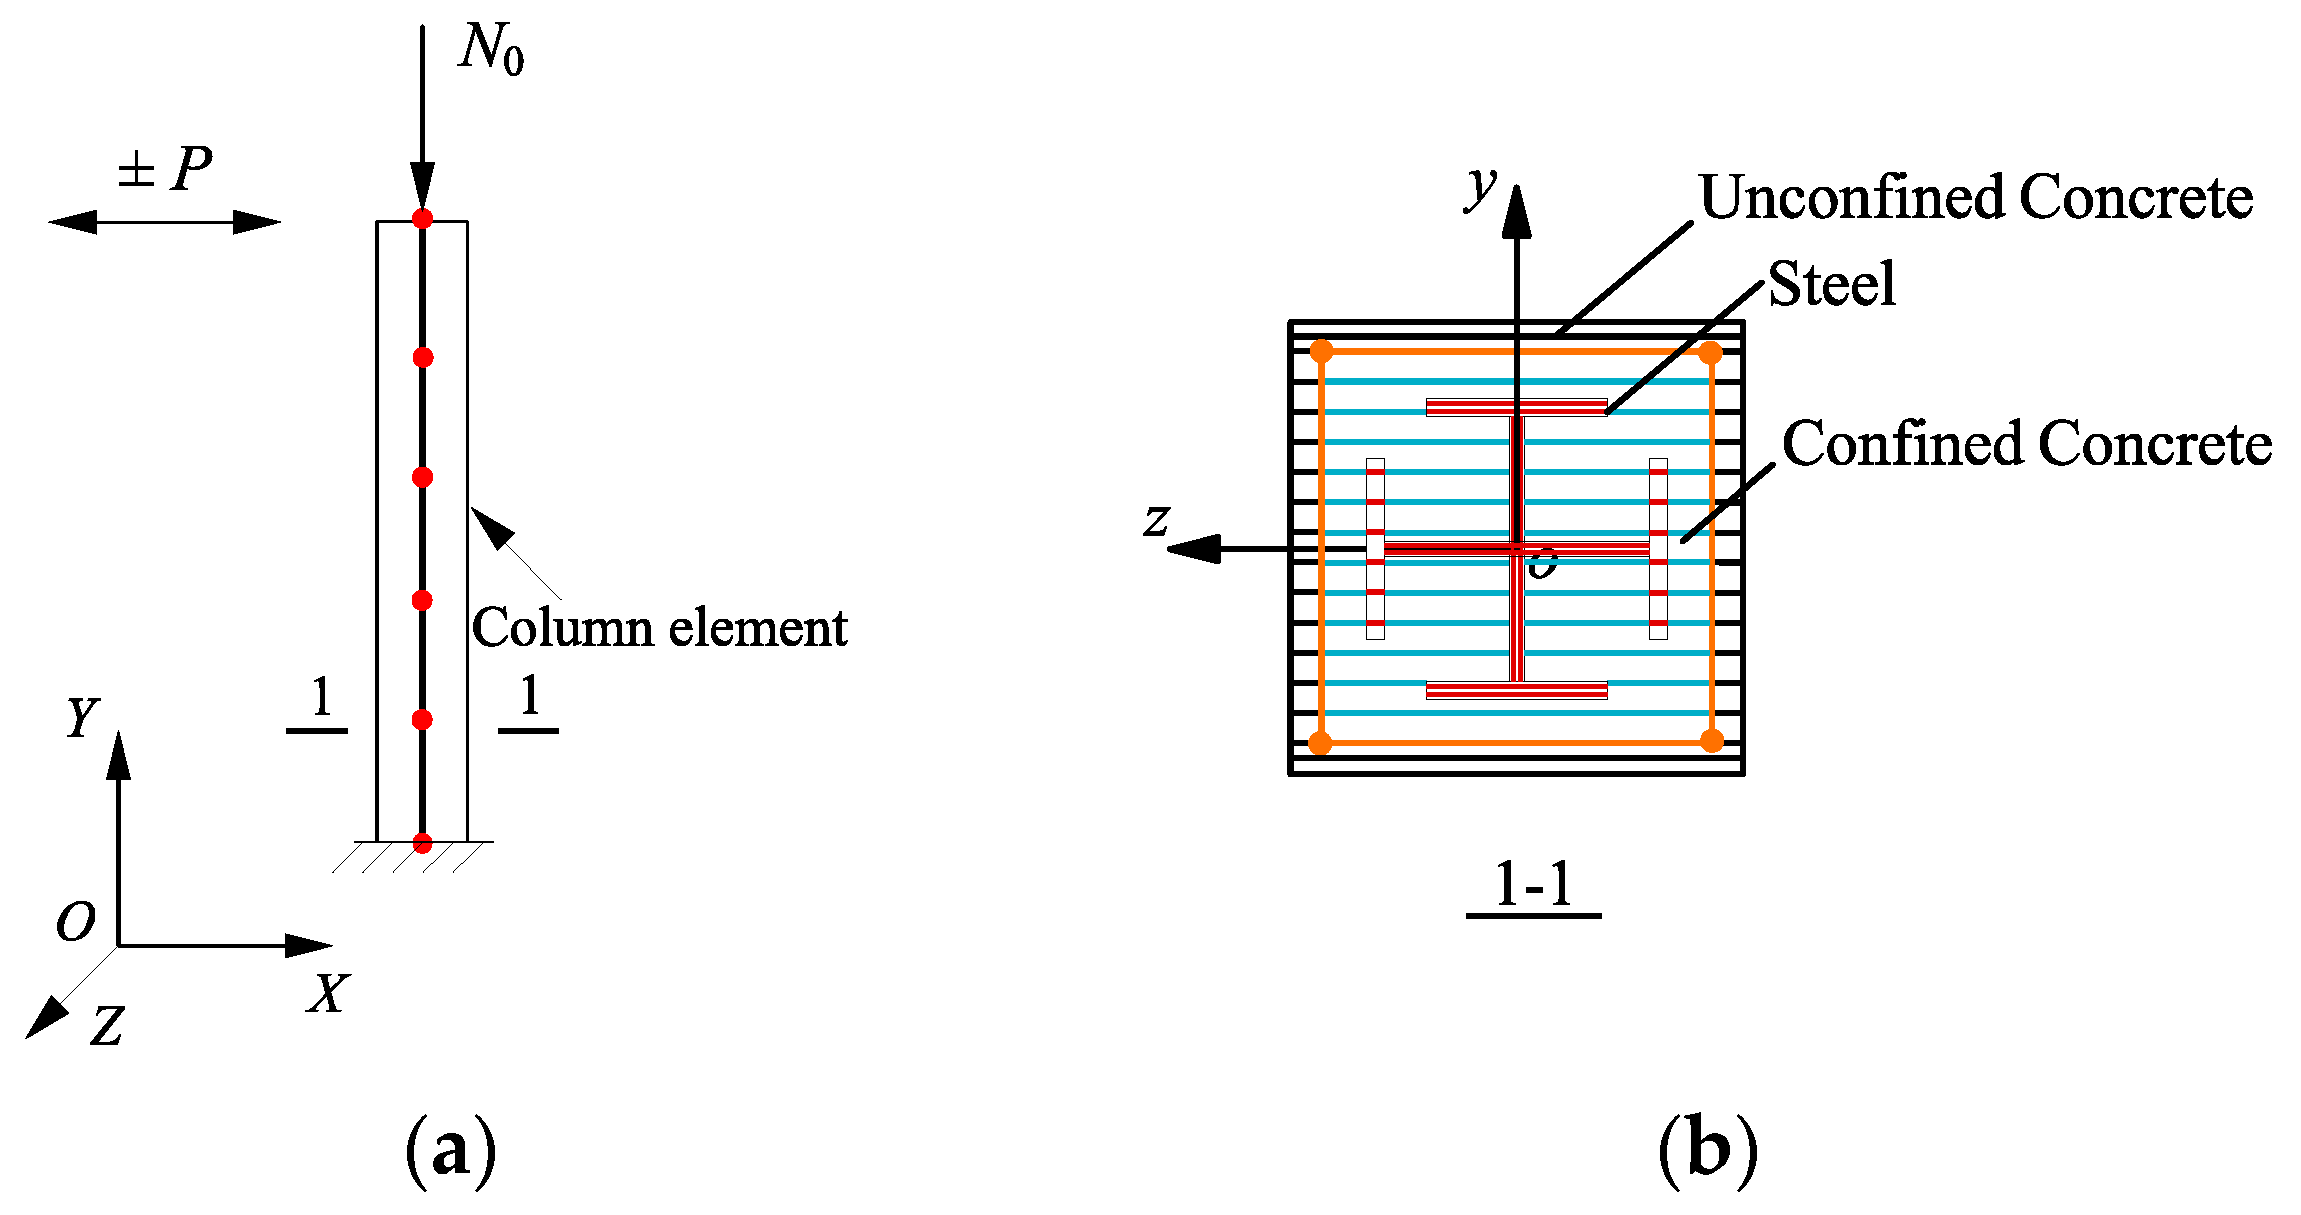
2.3. Establishment of Numerical Model
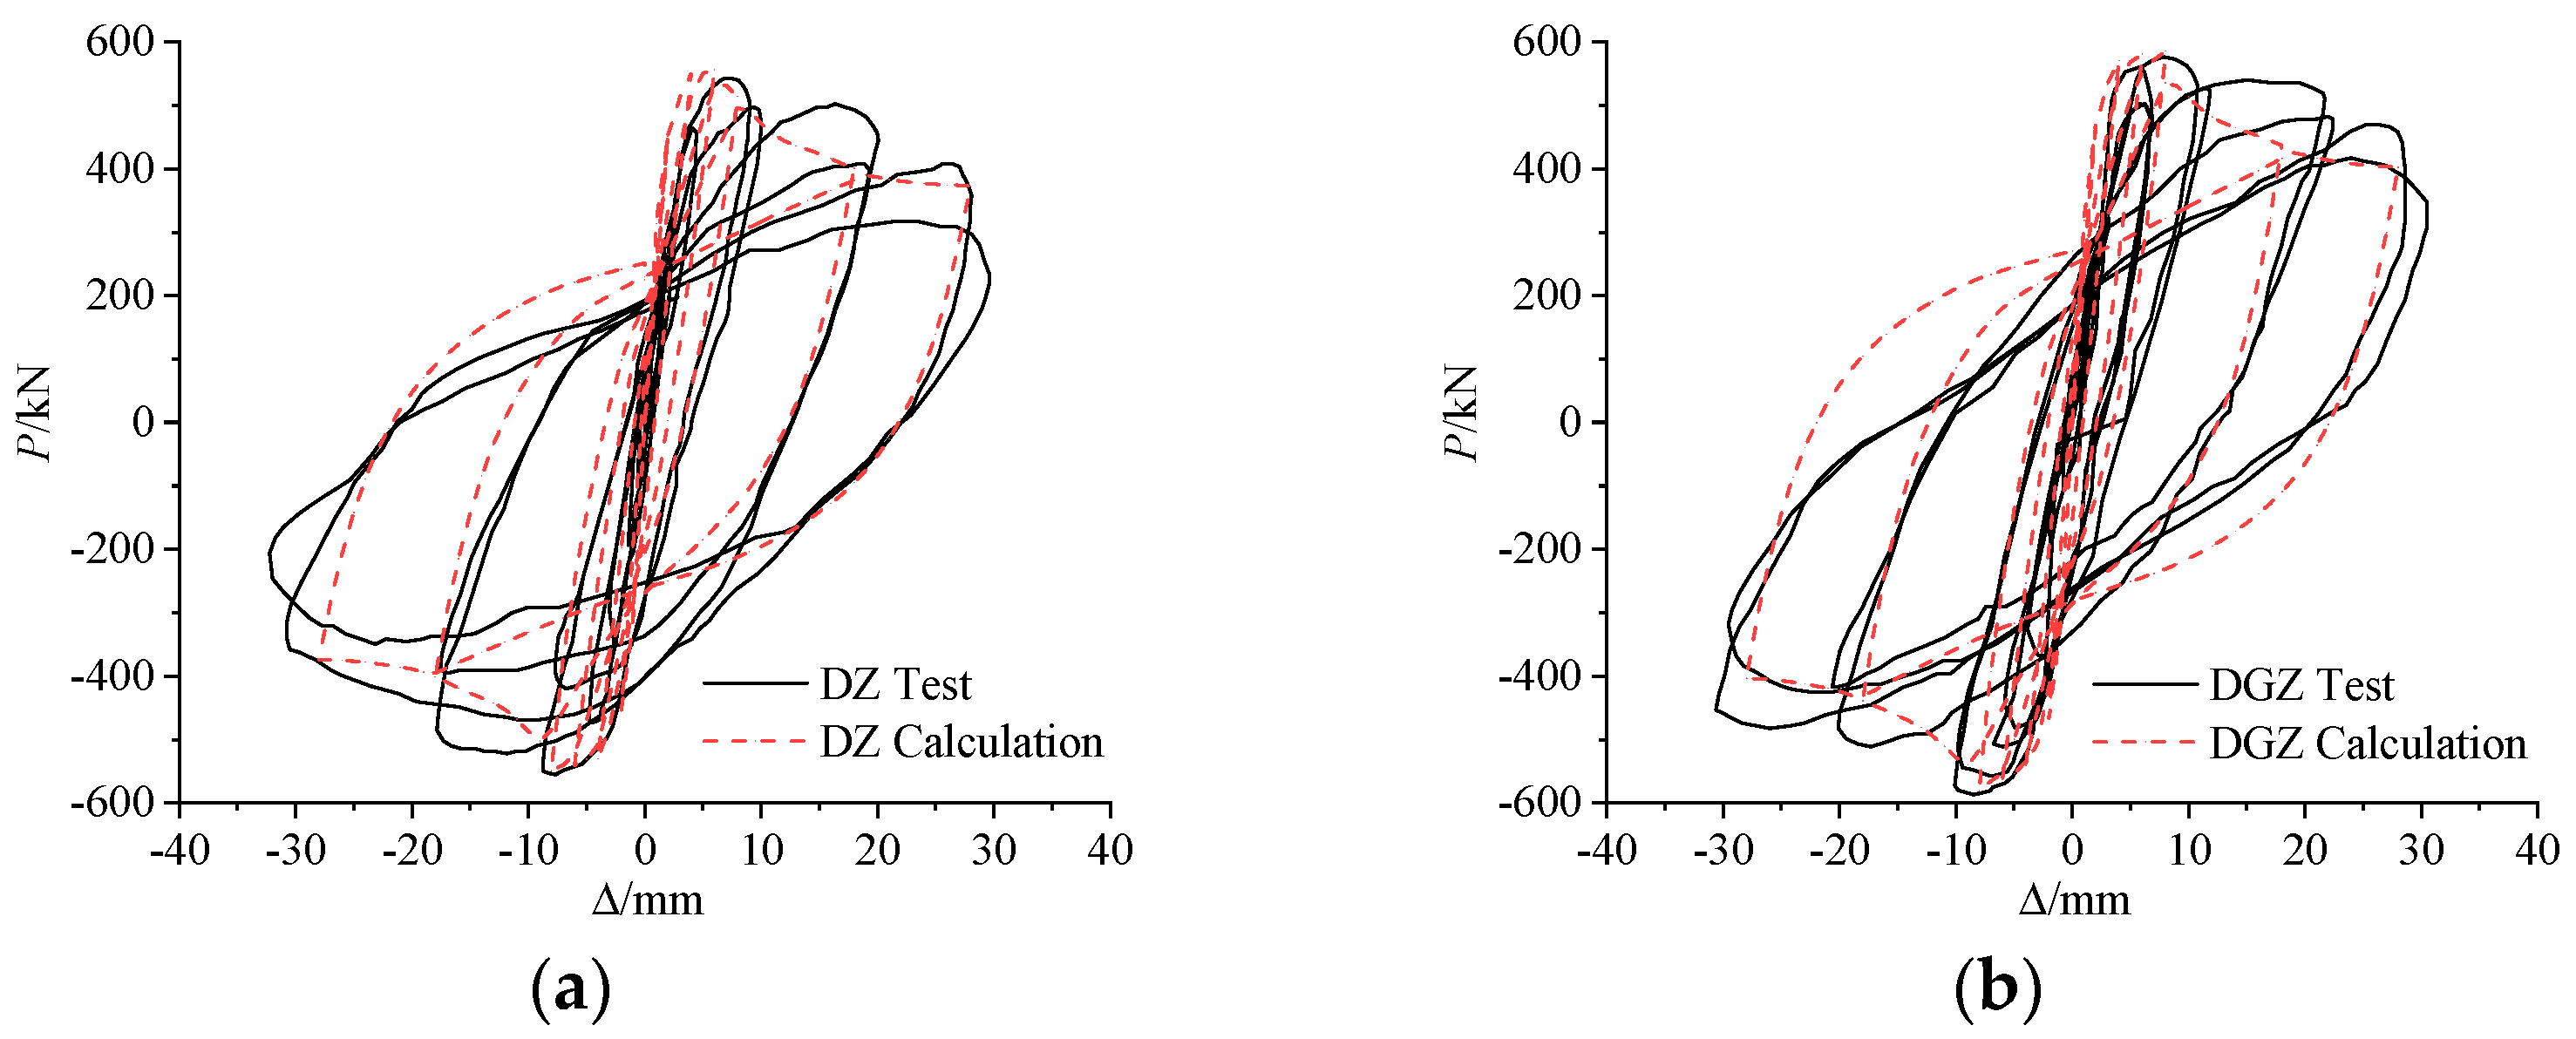
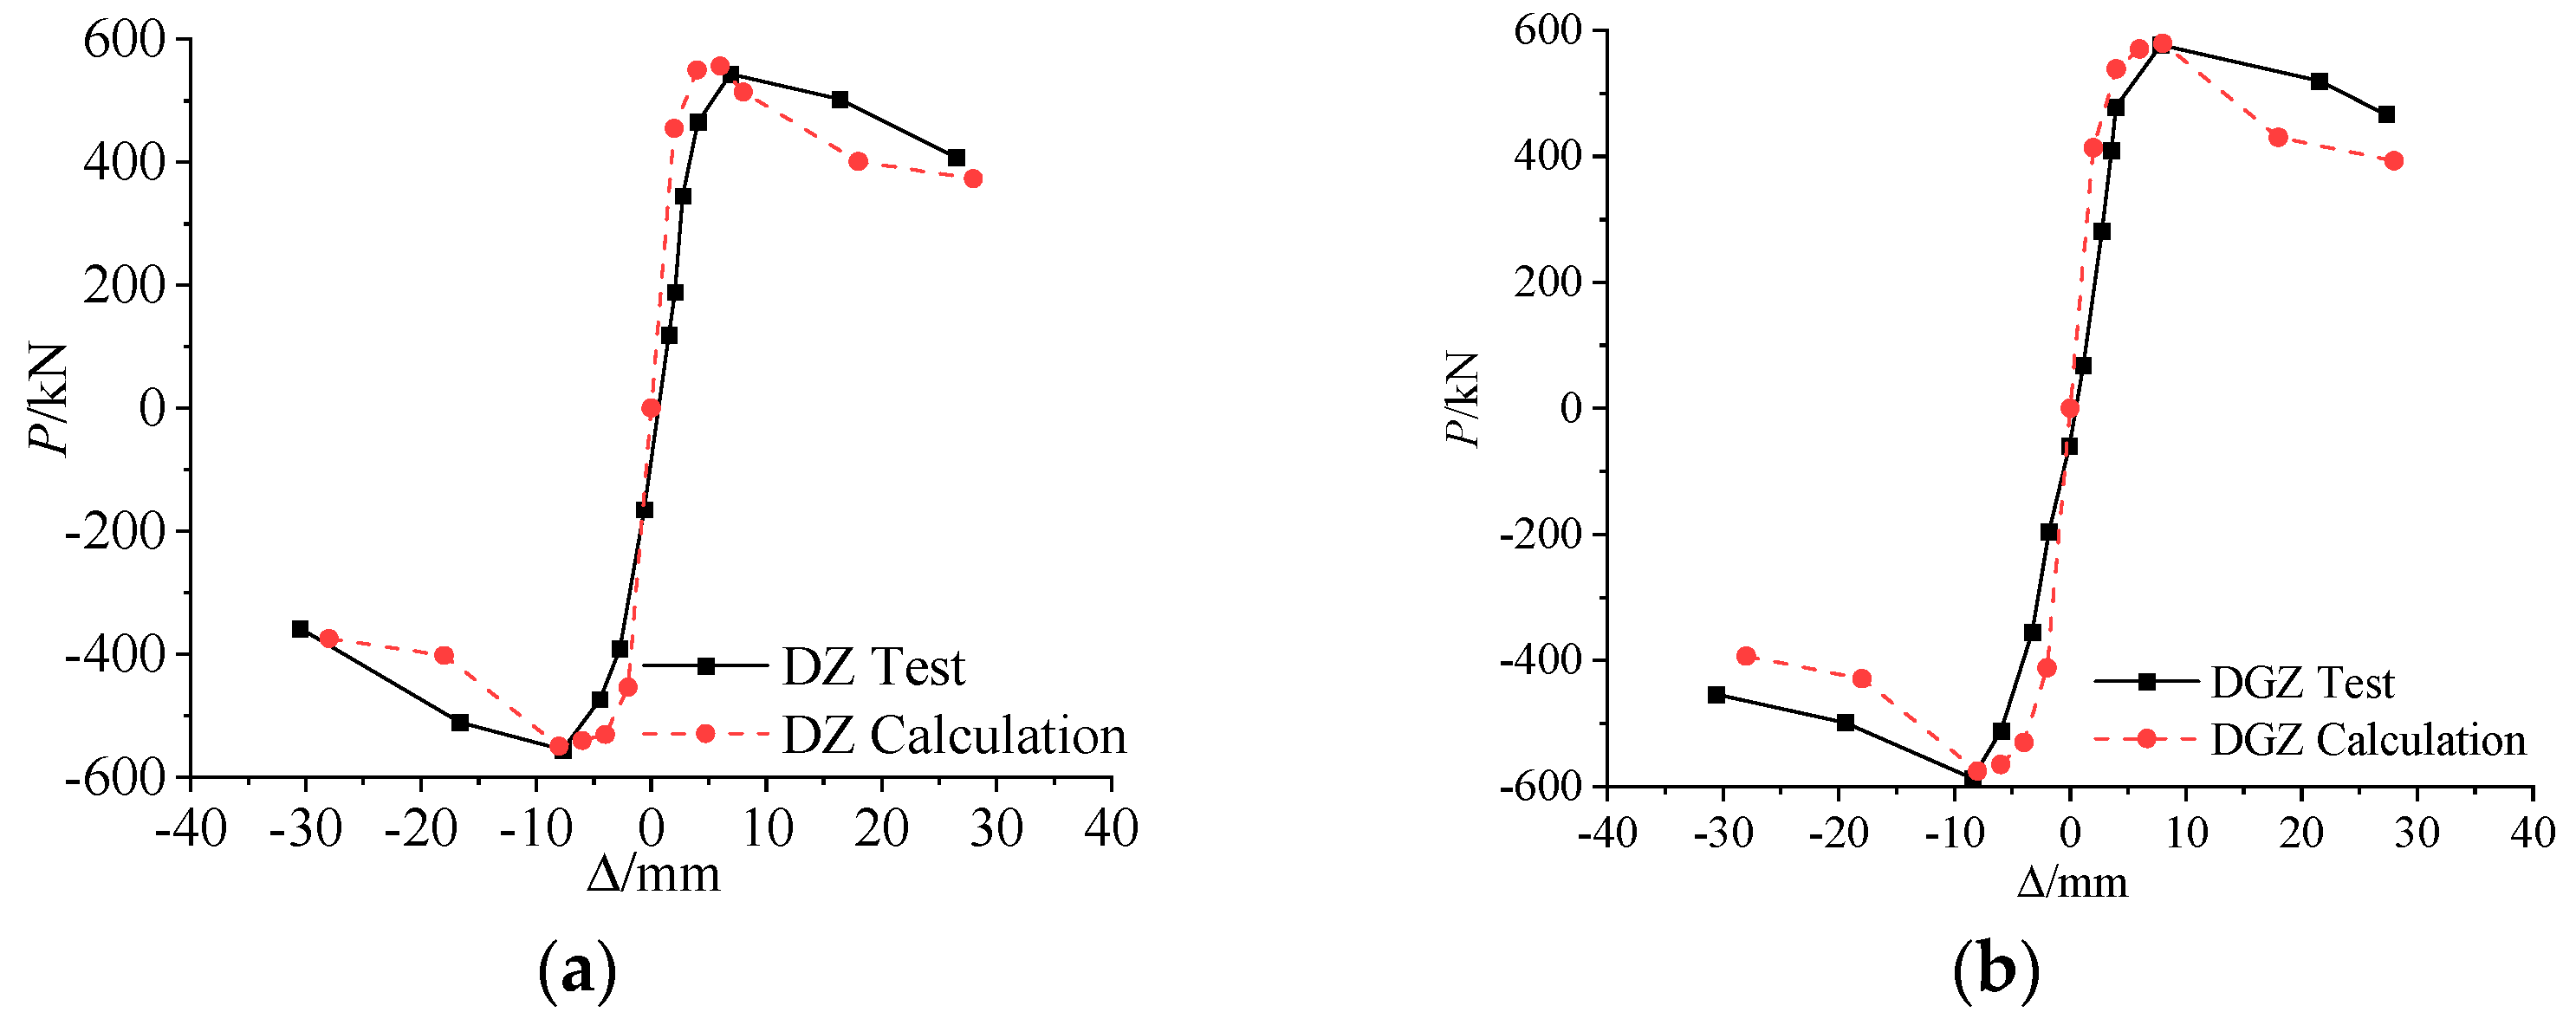
3. Verification of Numerical Model
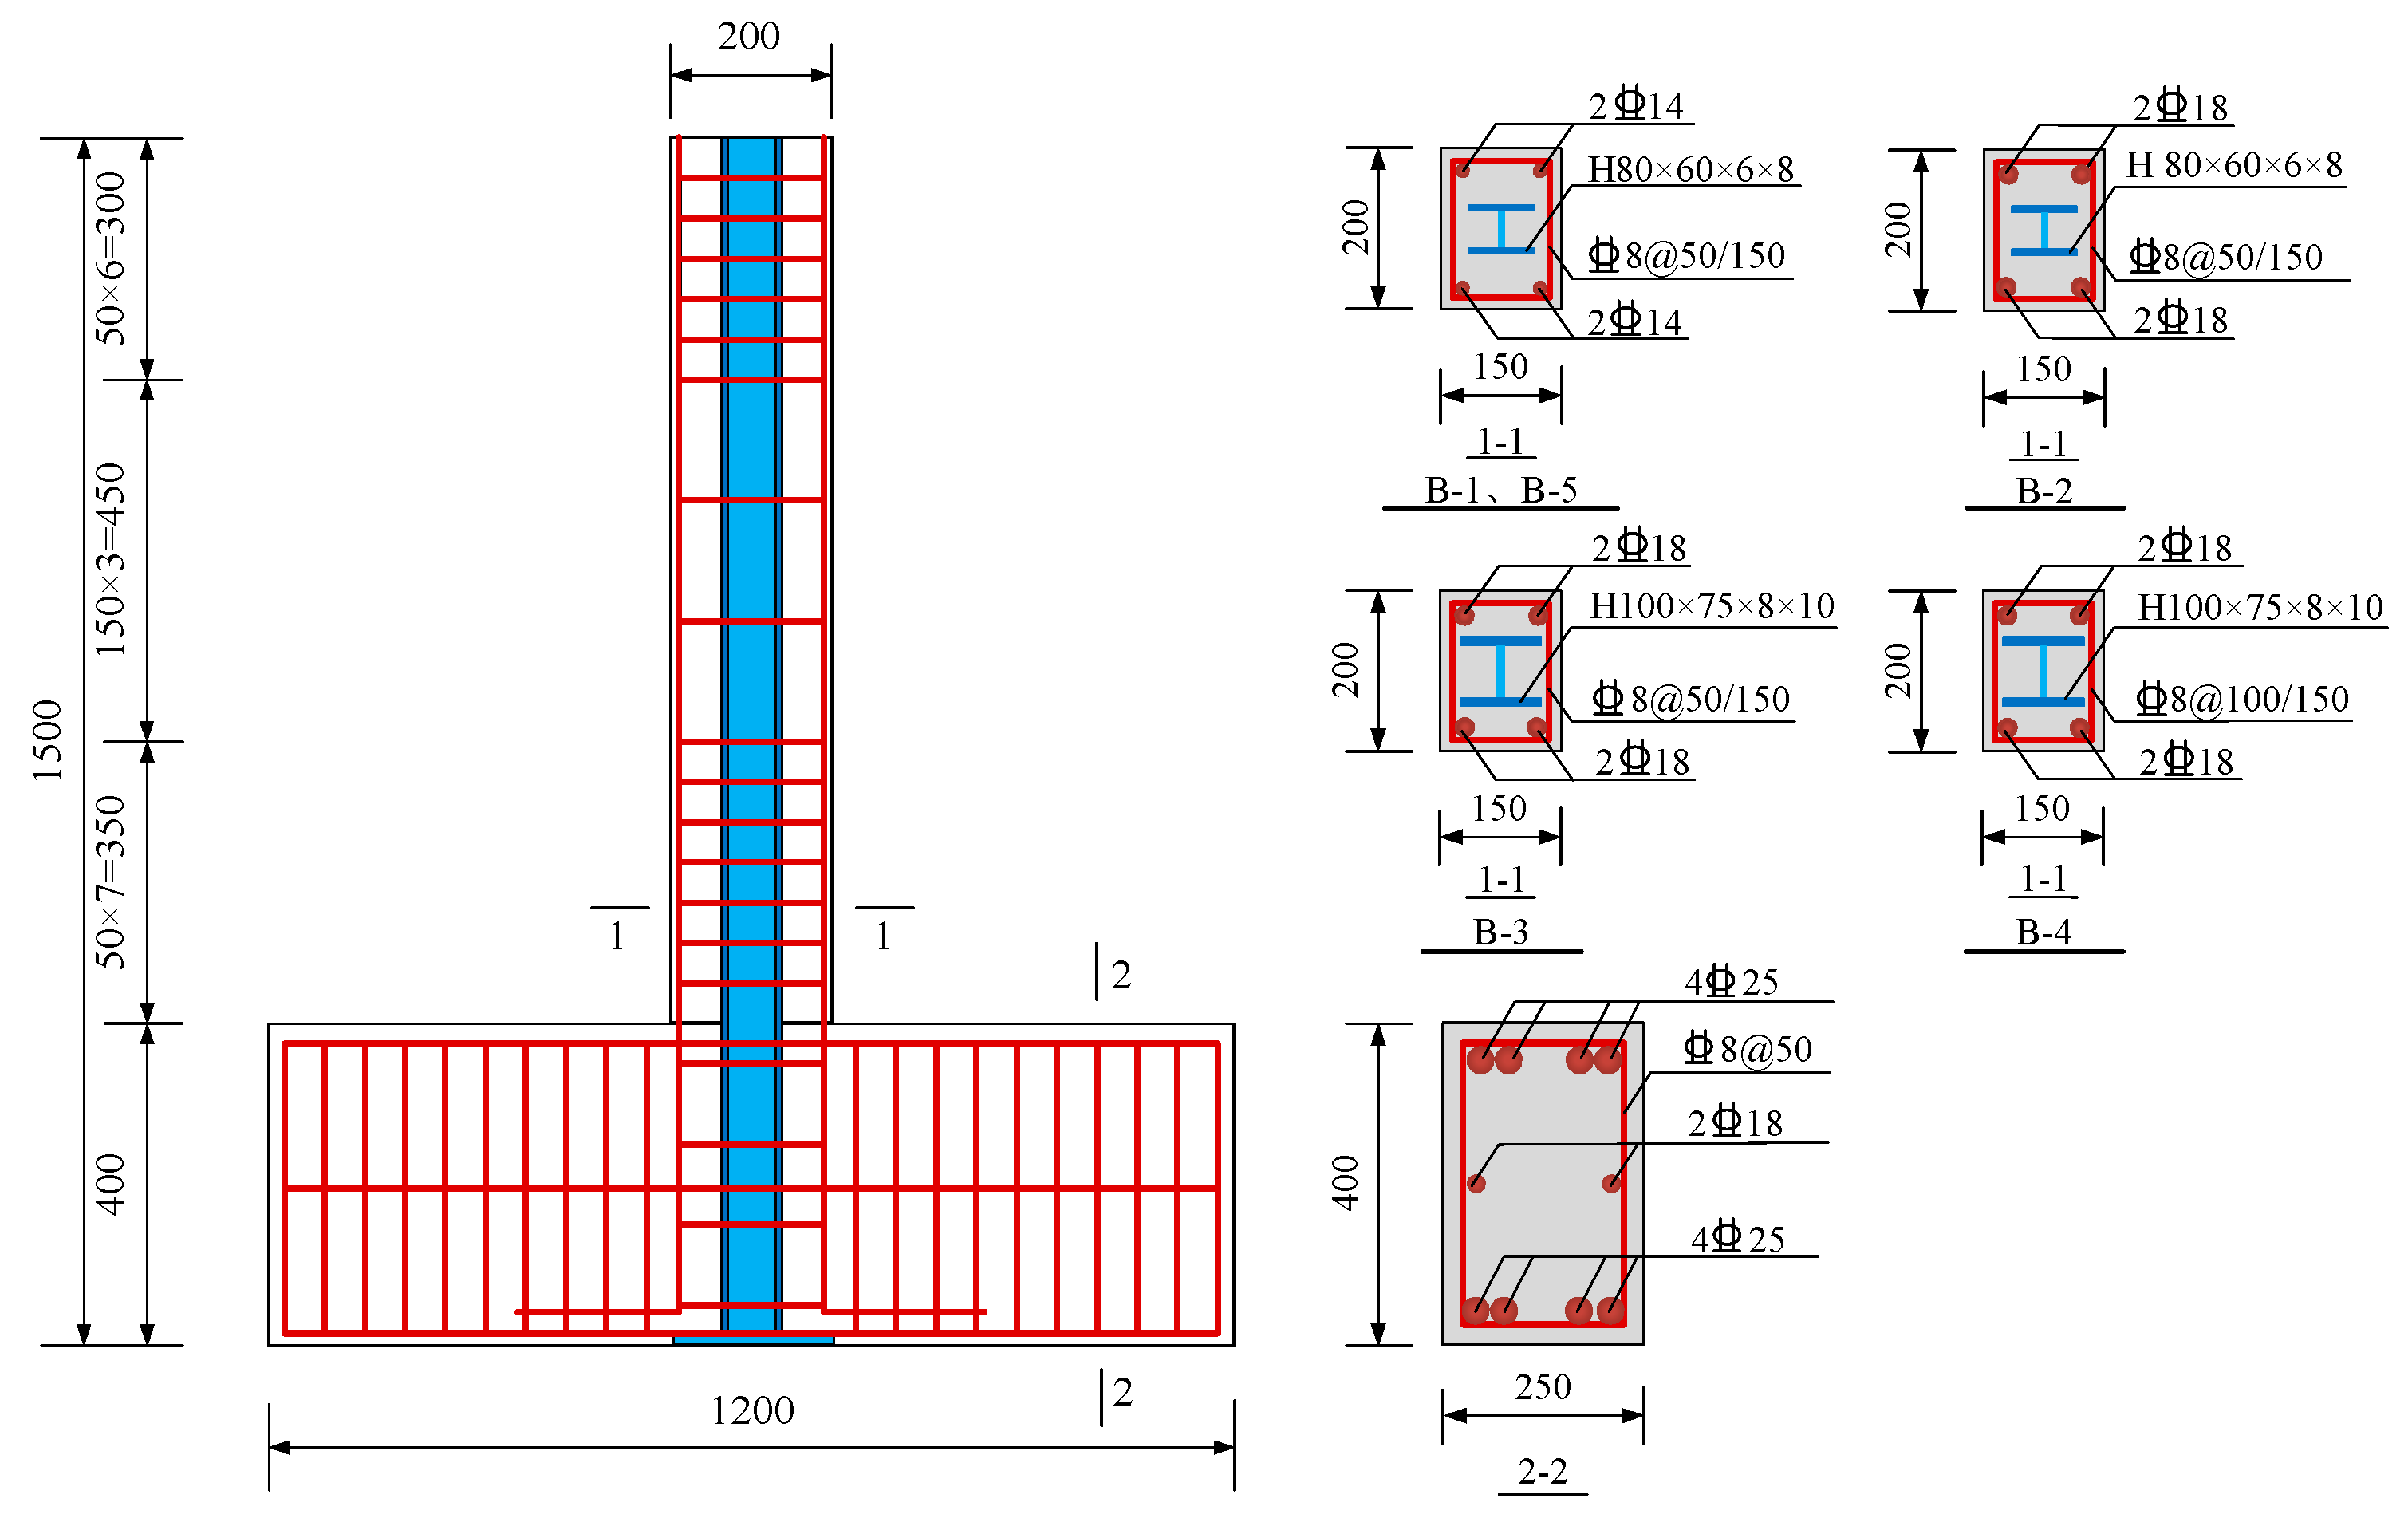
3.1. Reinforced RPC Column
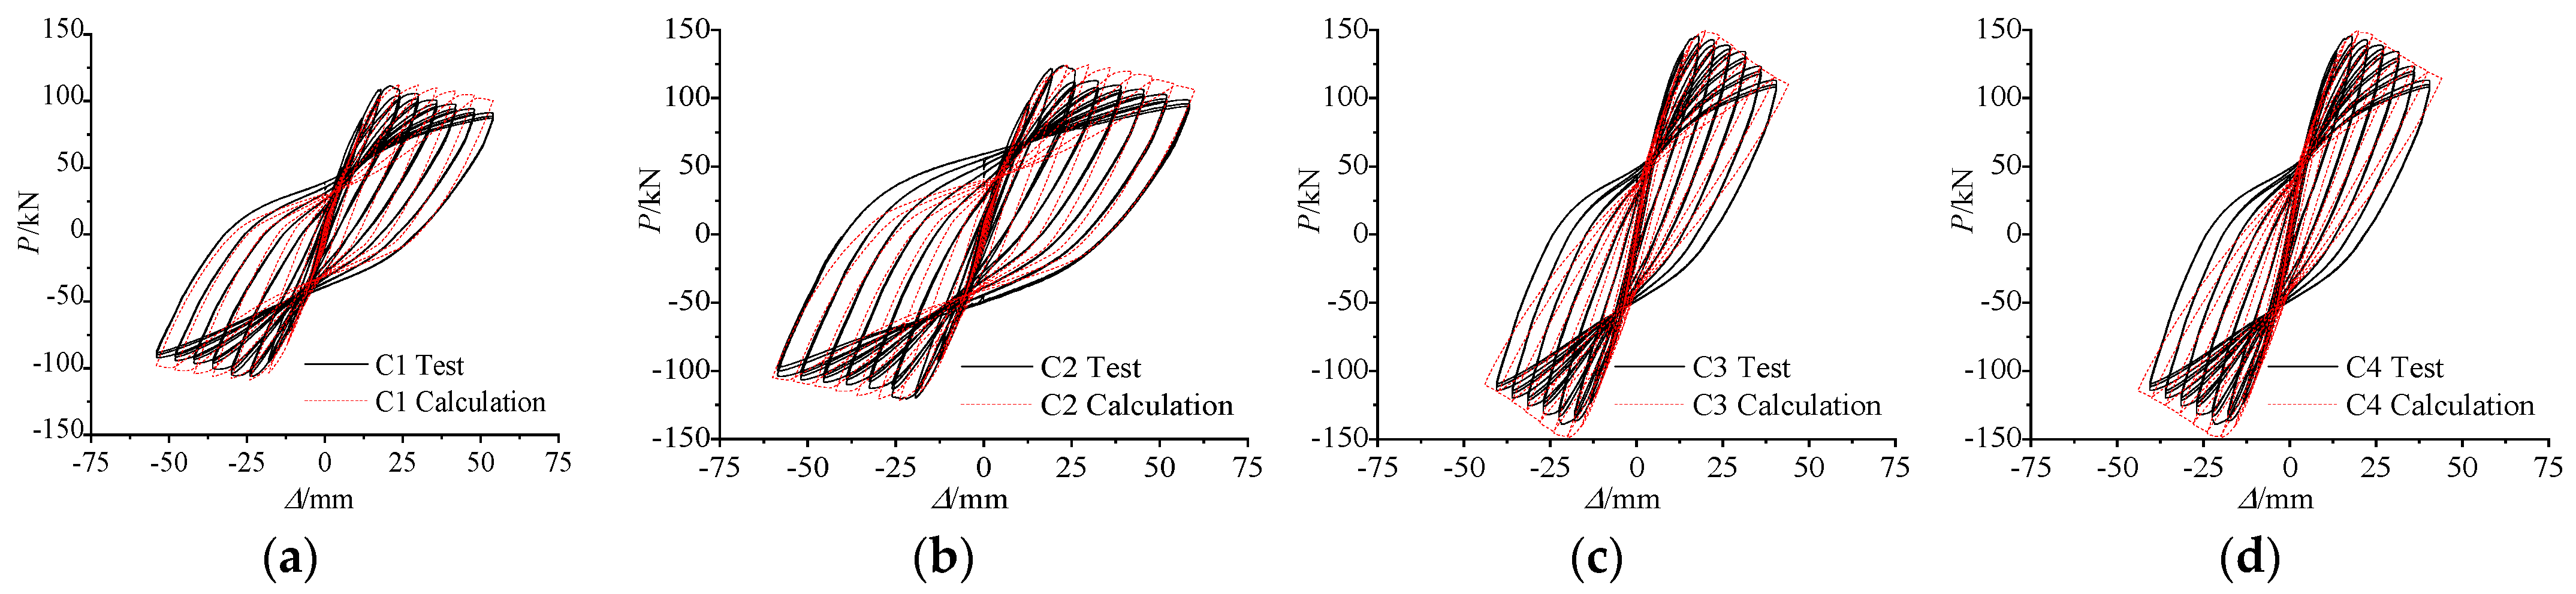
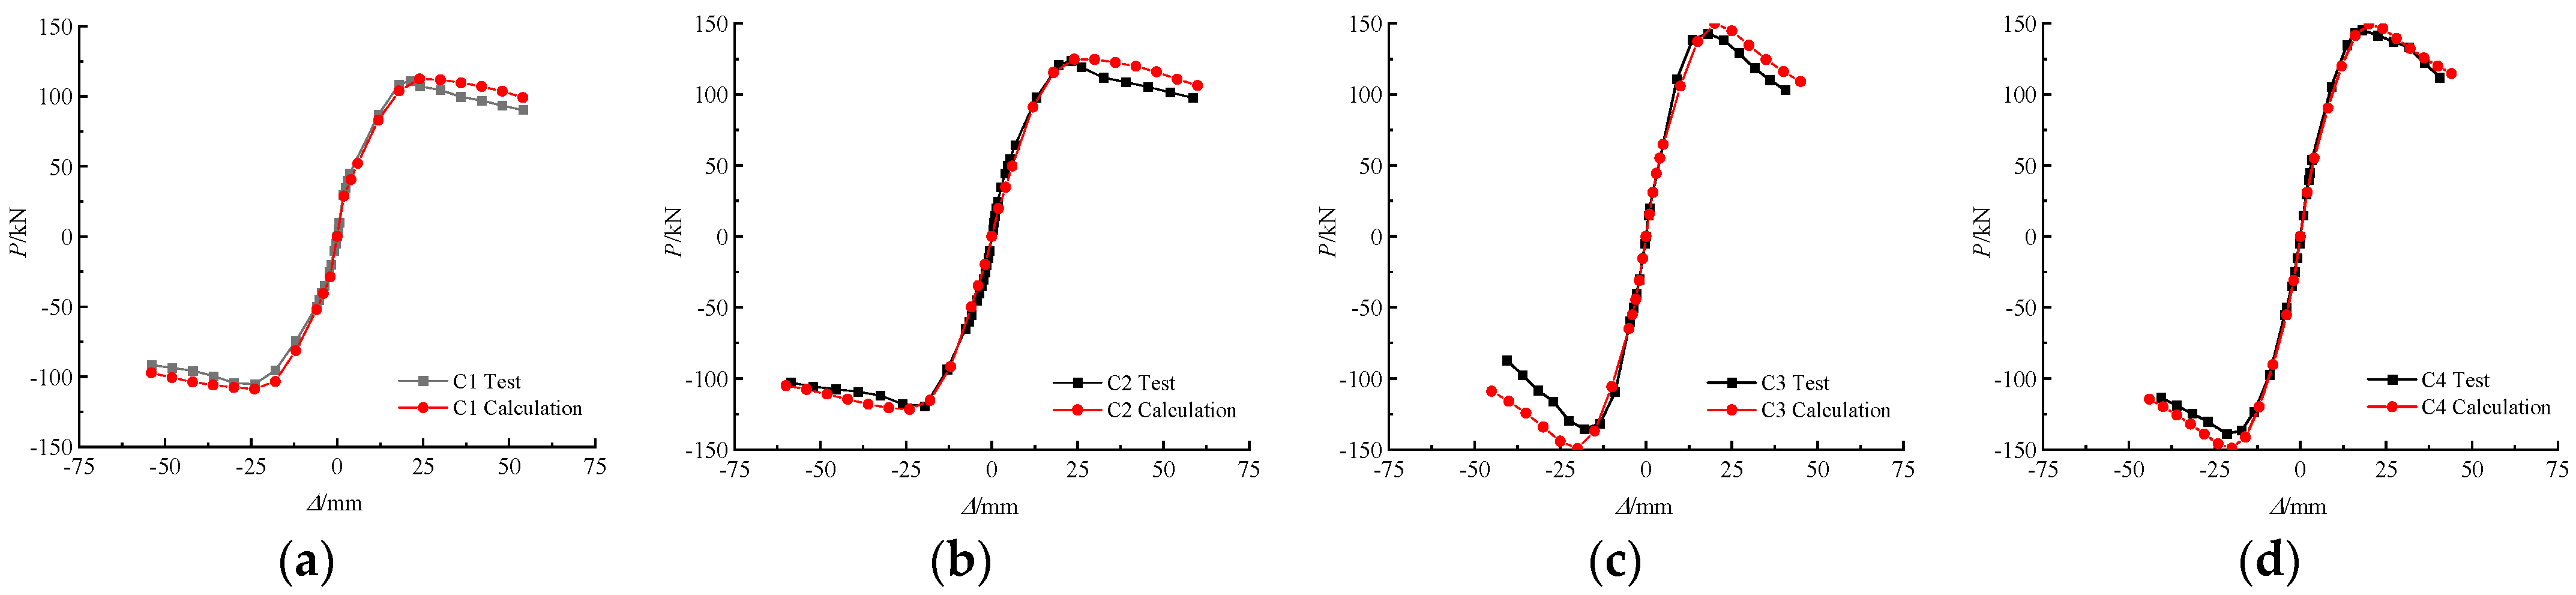
3.2. Steel-Reinforced RPC Column
4. Hysteretic Behavior of Cross-Shaped-Steel-Reinforced RPC Columns
4.1. Analysis Model
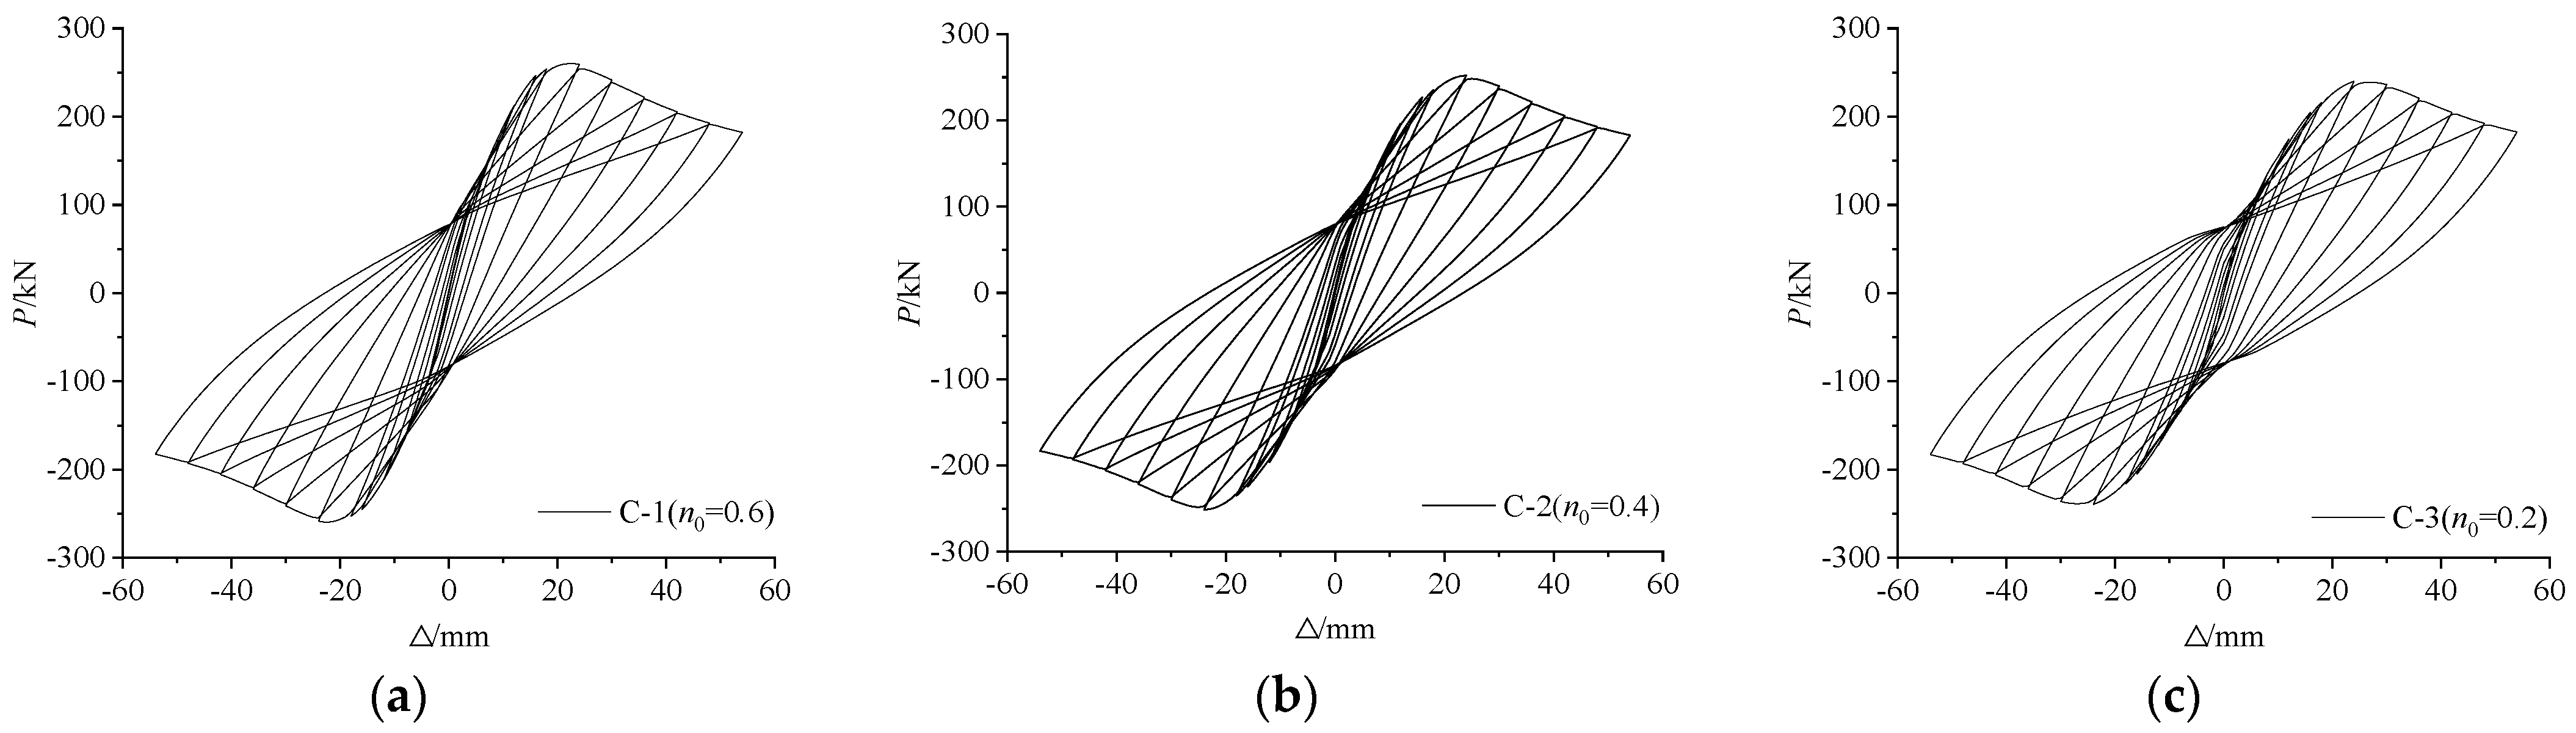
4.2. Hysteretic Curve
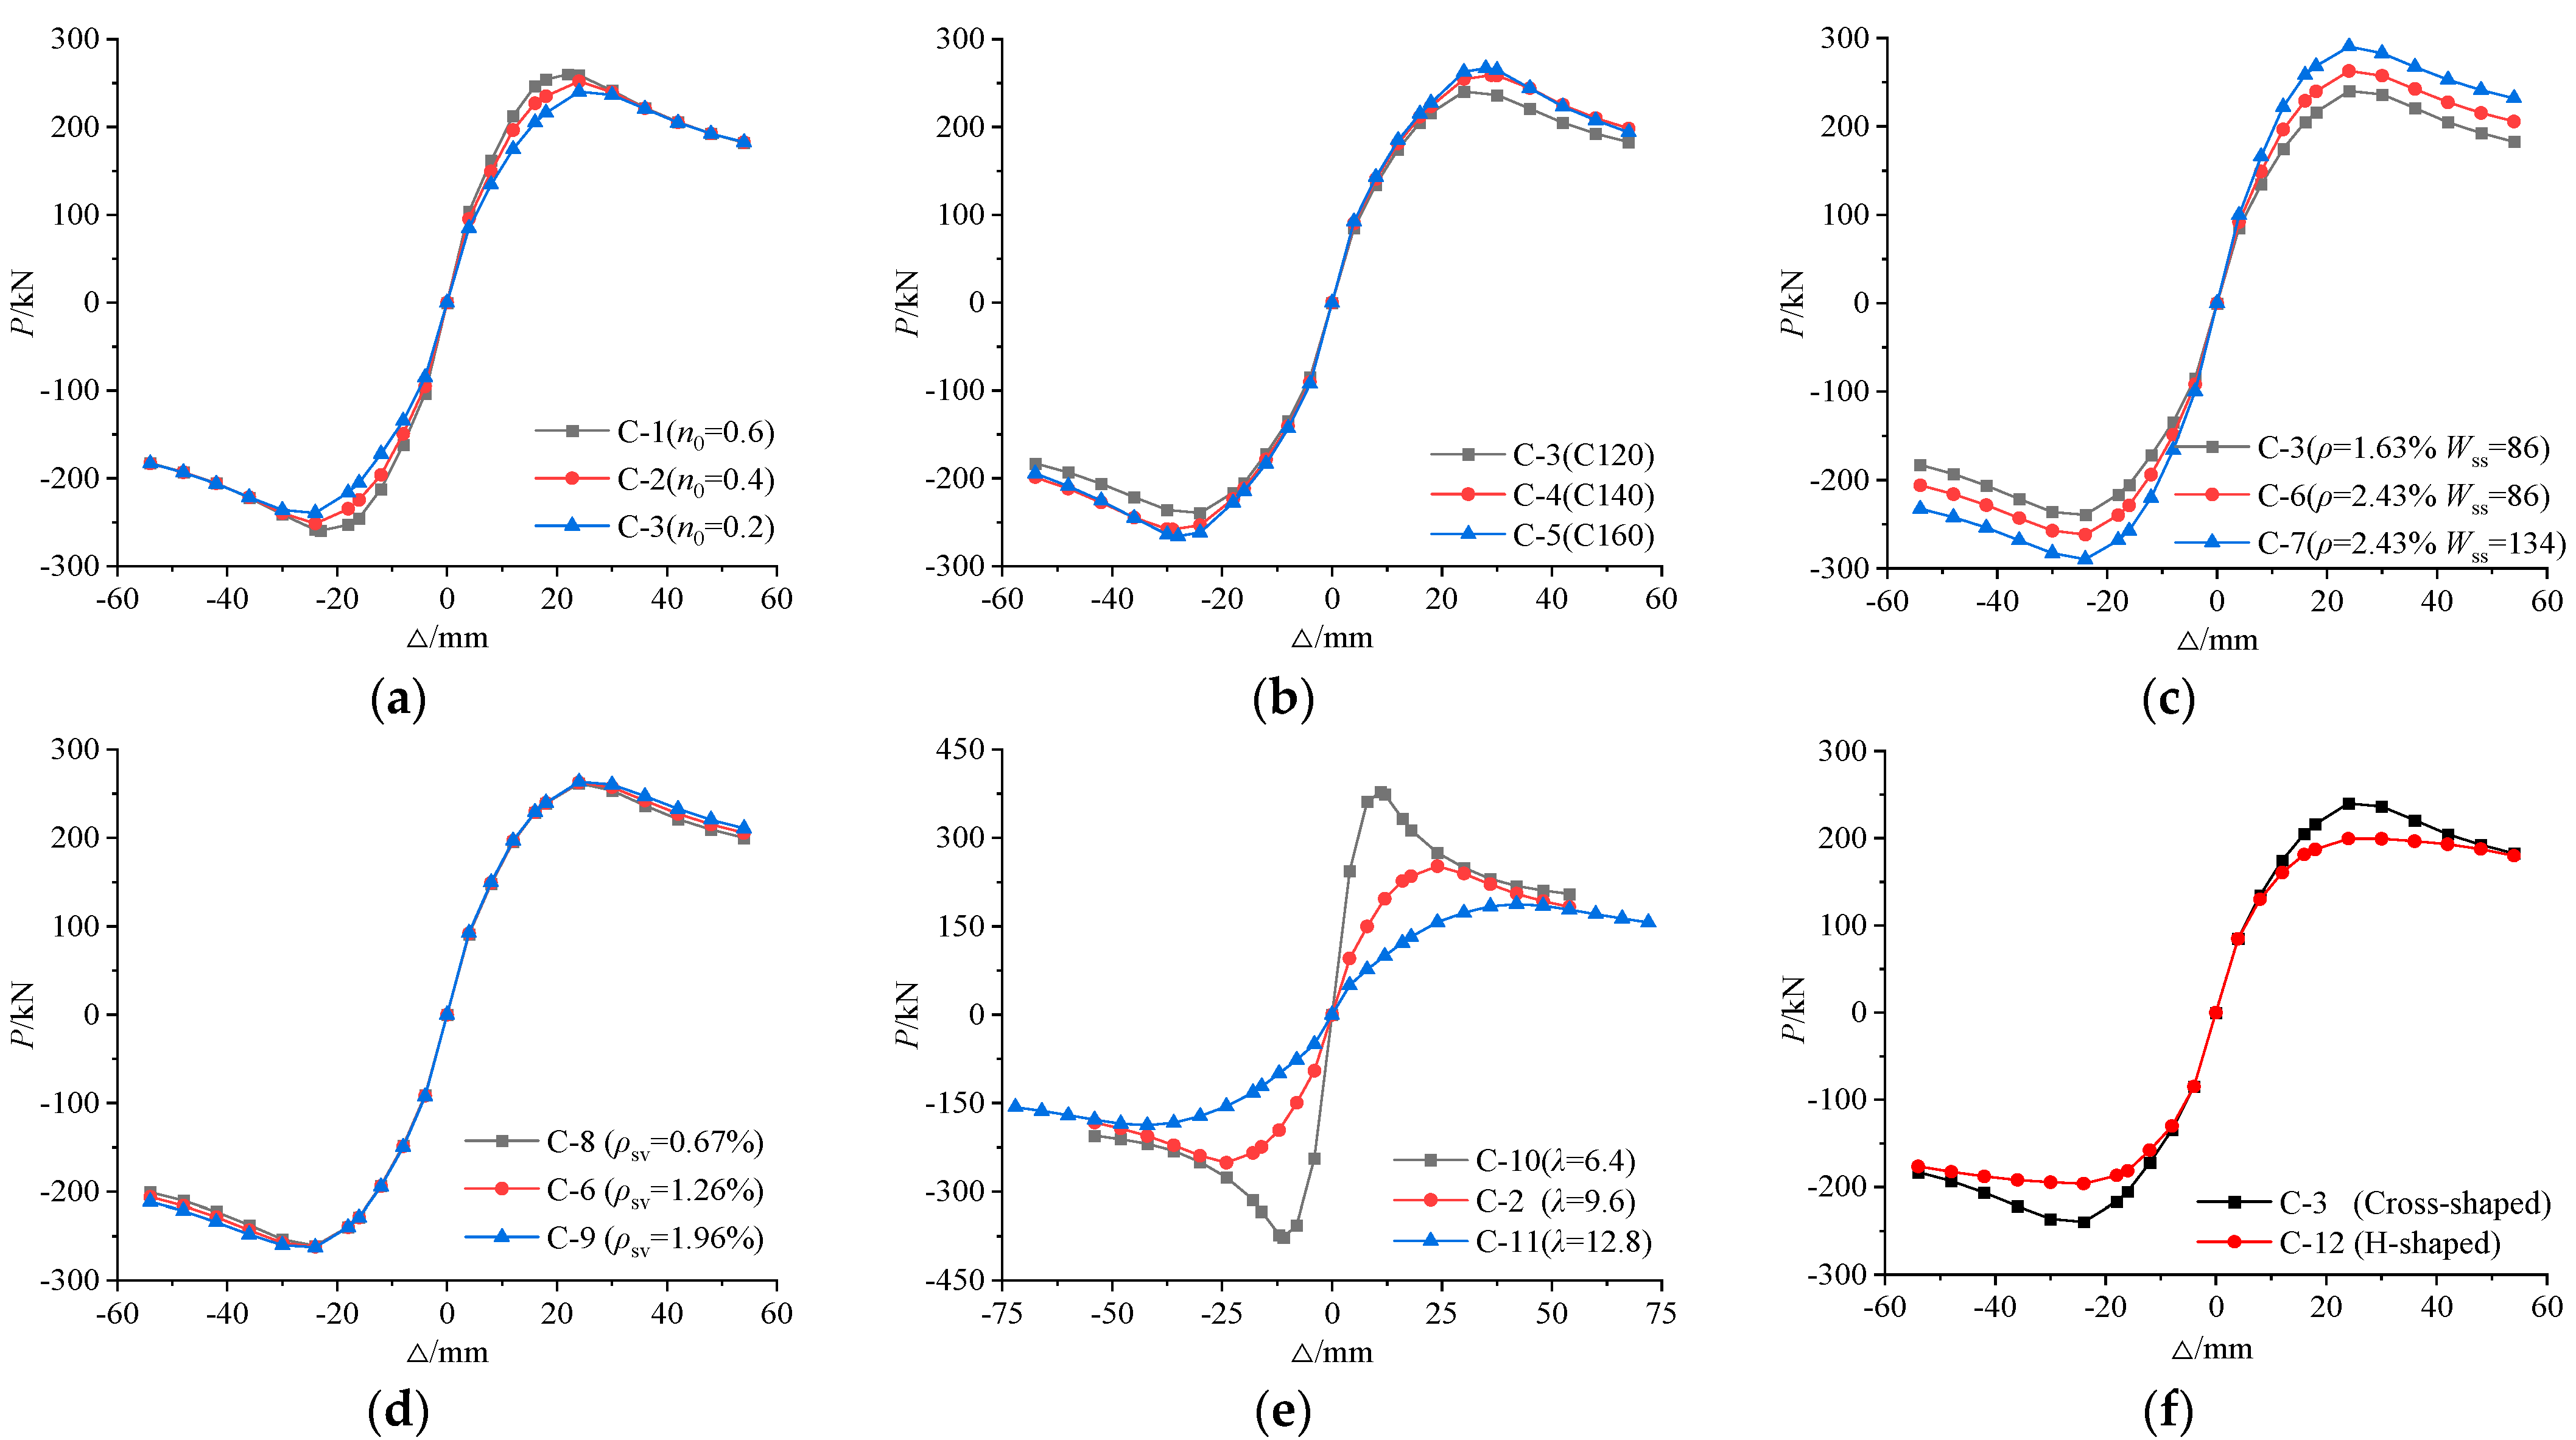
4.3. Skeleton Curve
4.4. Displacement Ductility
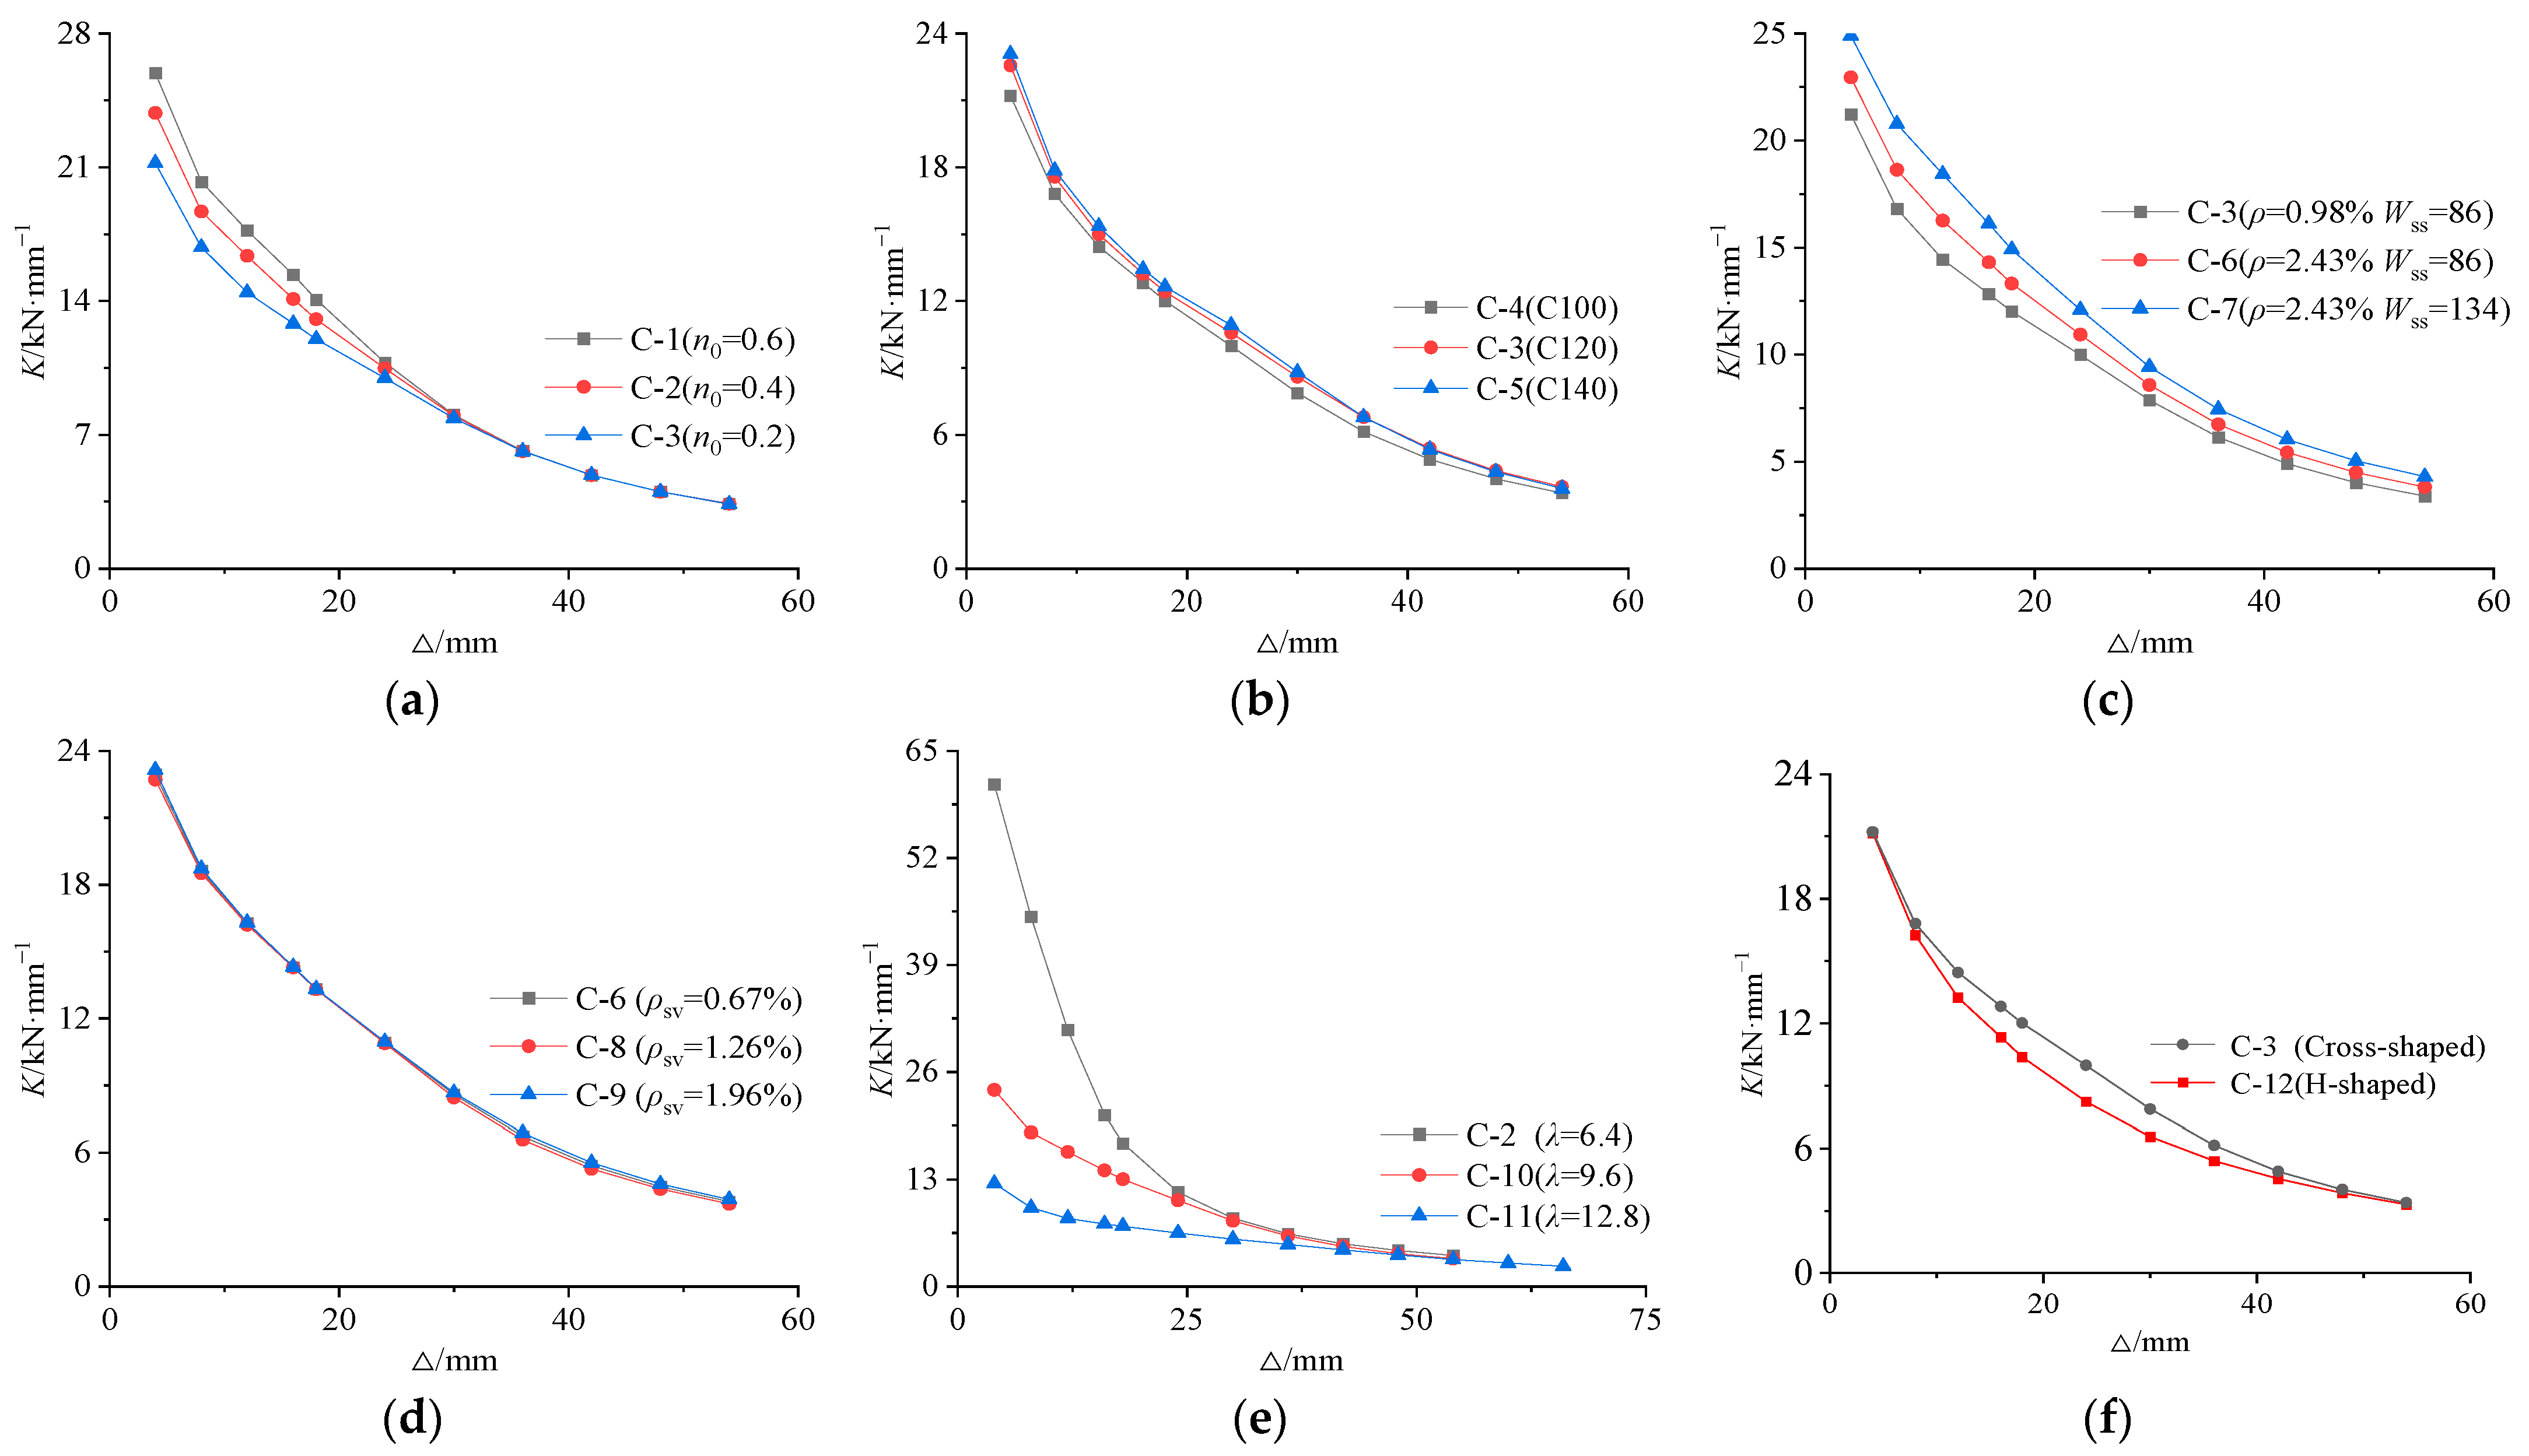
4.5. Stiffness Degradation
4.6. Energy Dissipation Capacity
5. Hysteretic Model
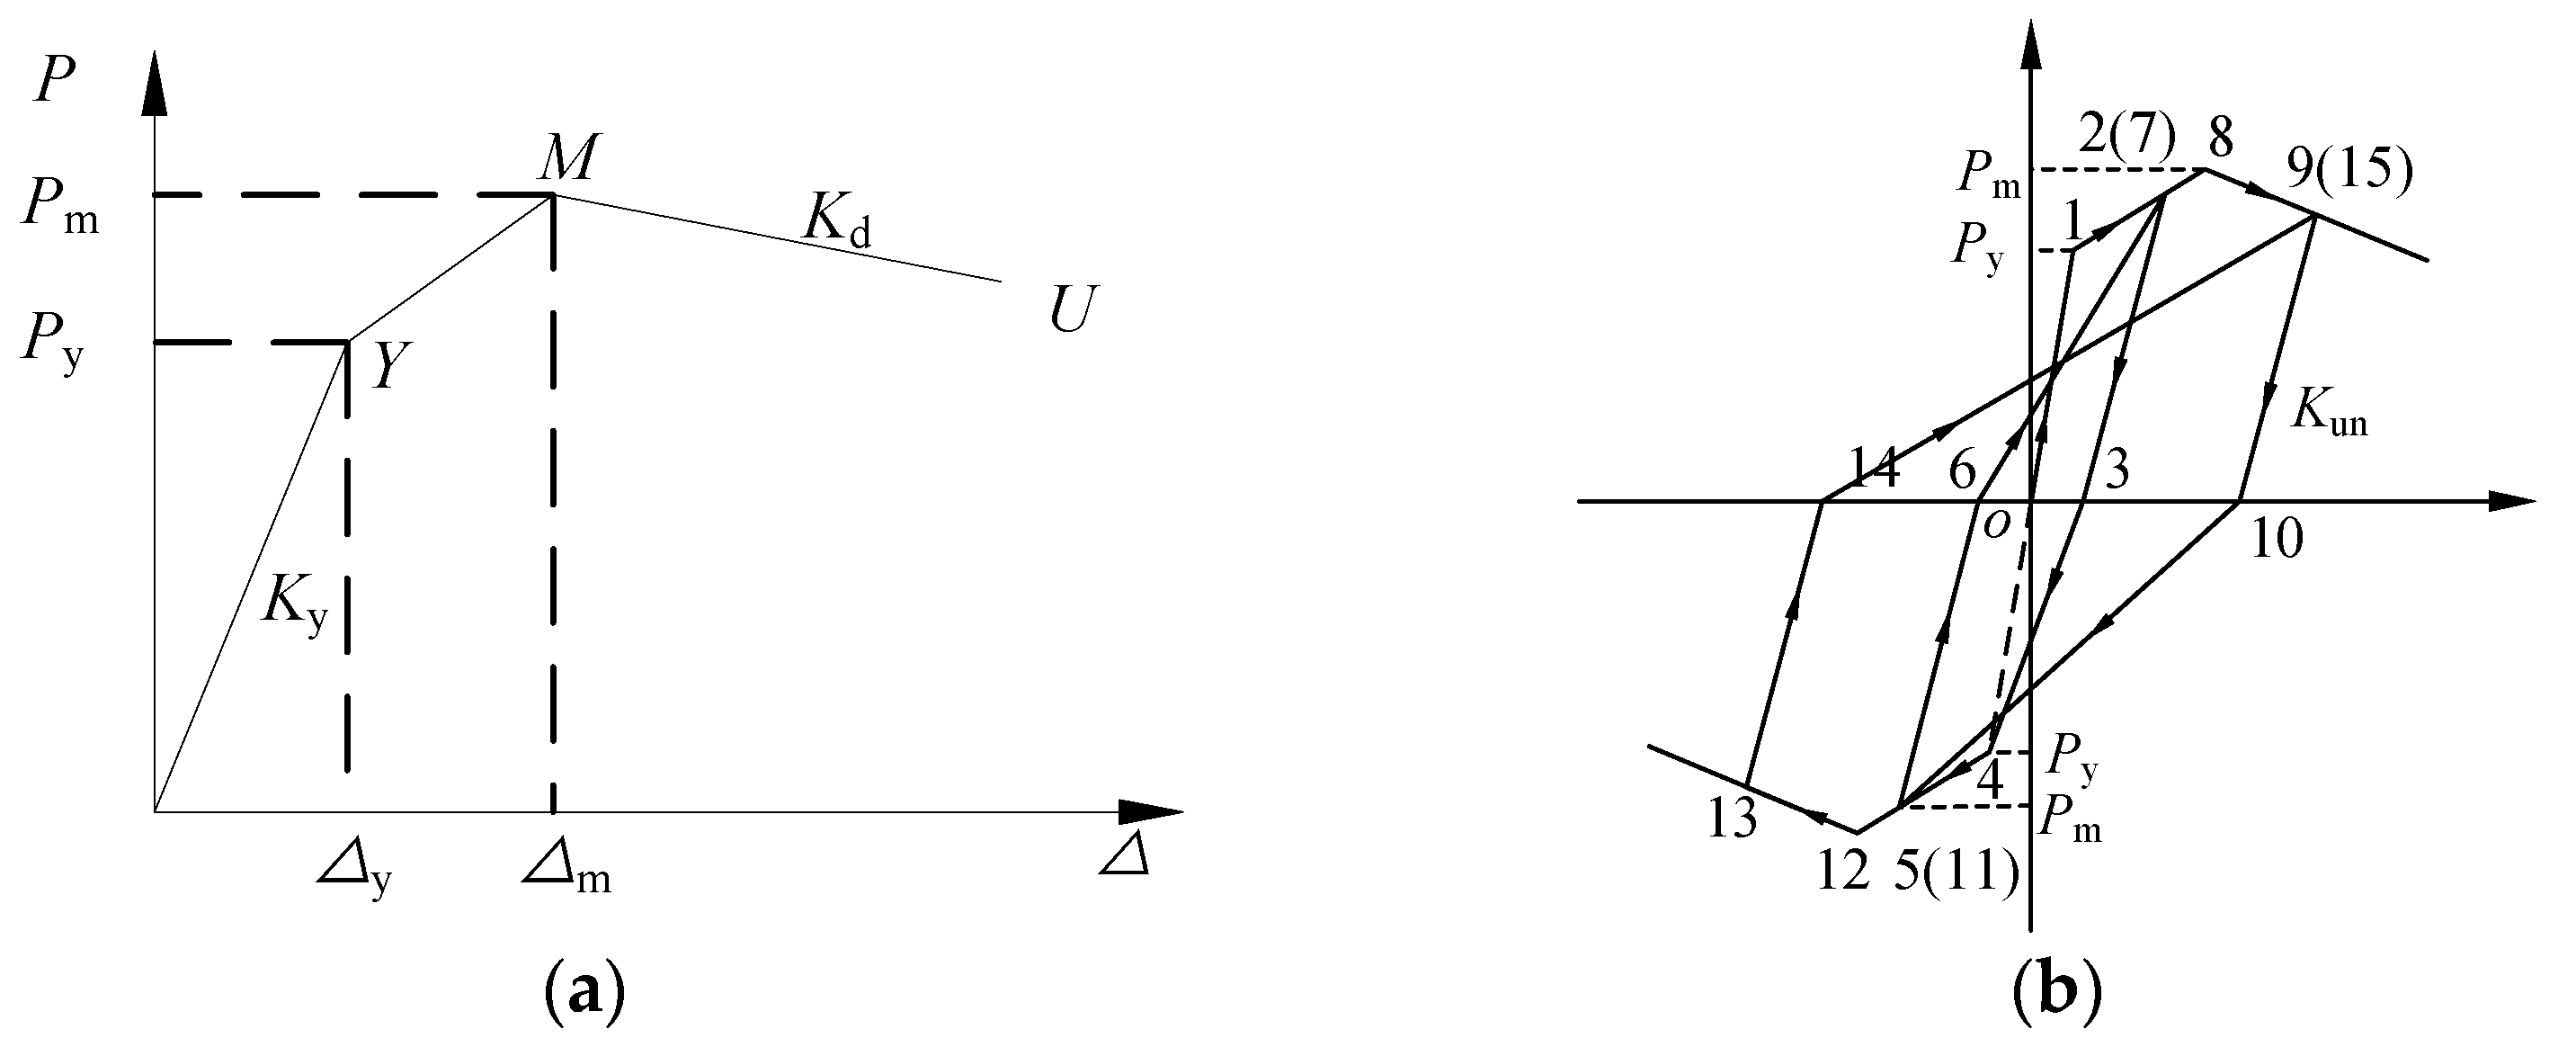
5.1. Skeleton Curve
5.2. Hysteresis Rule
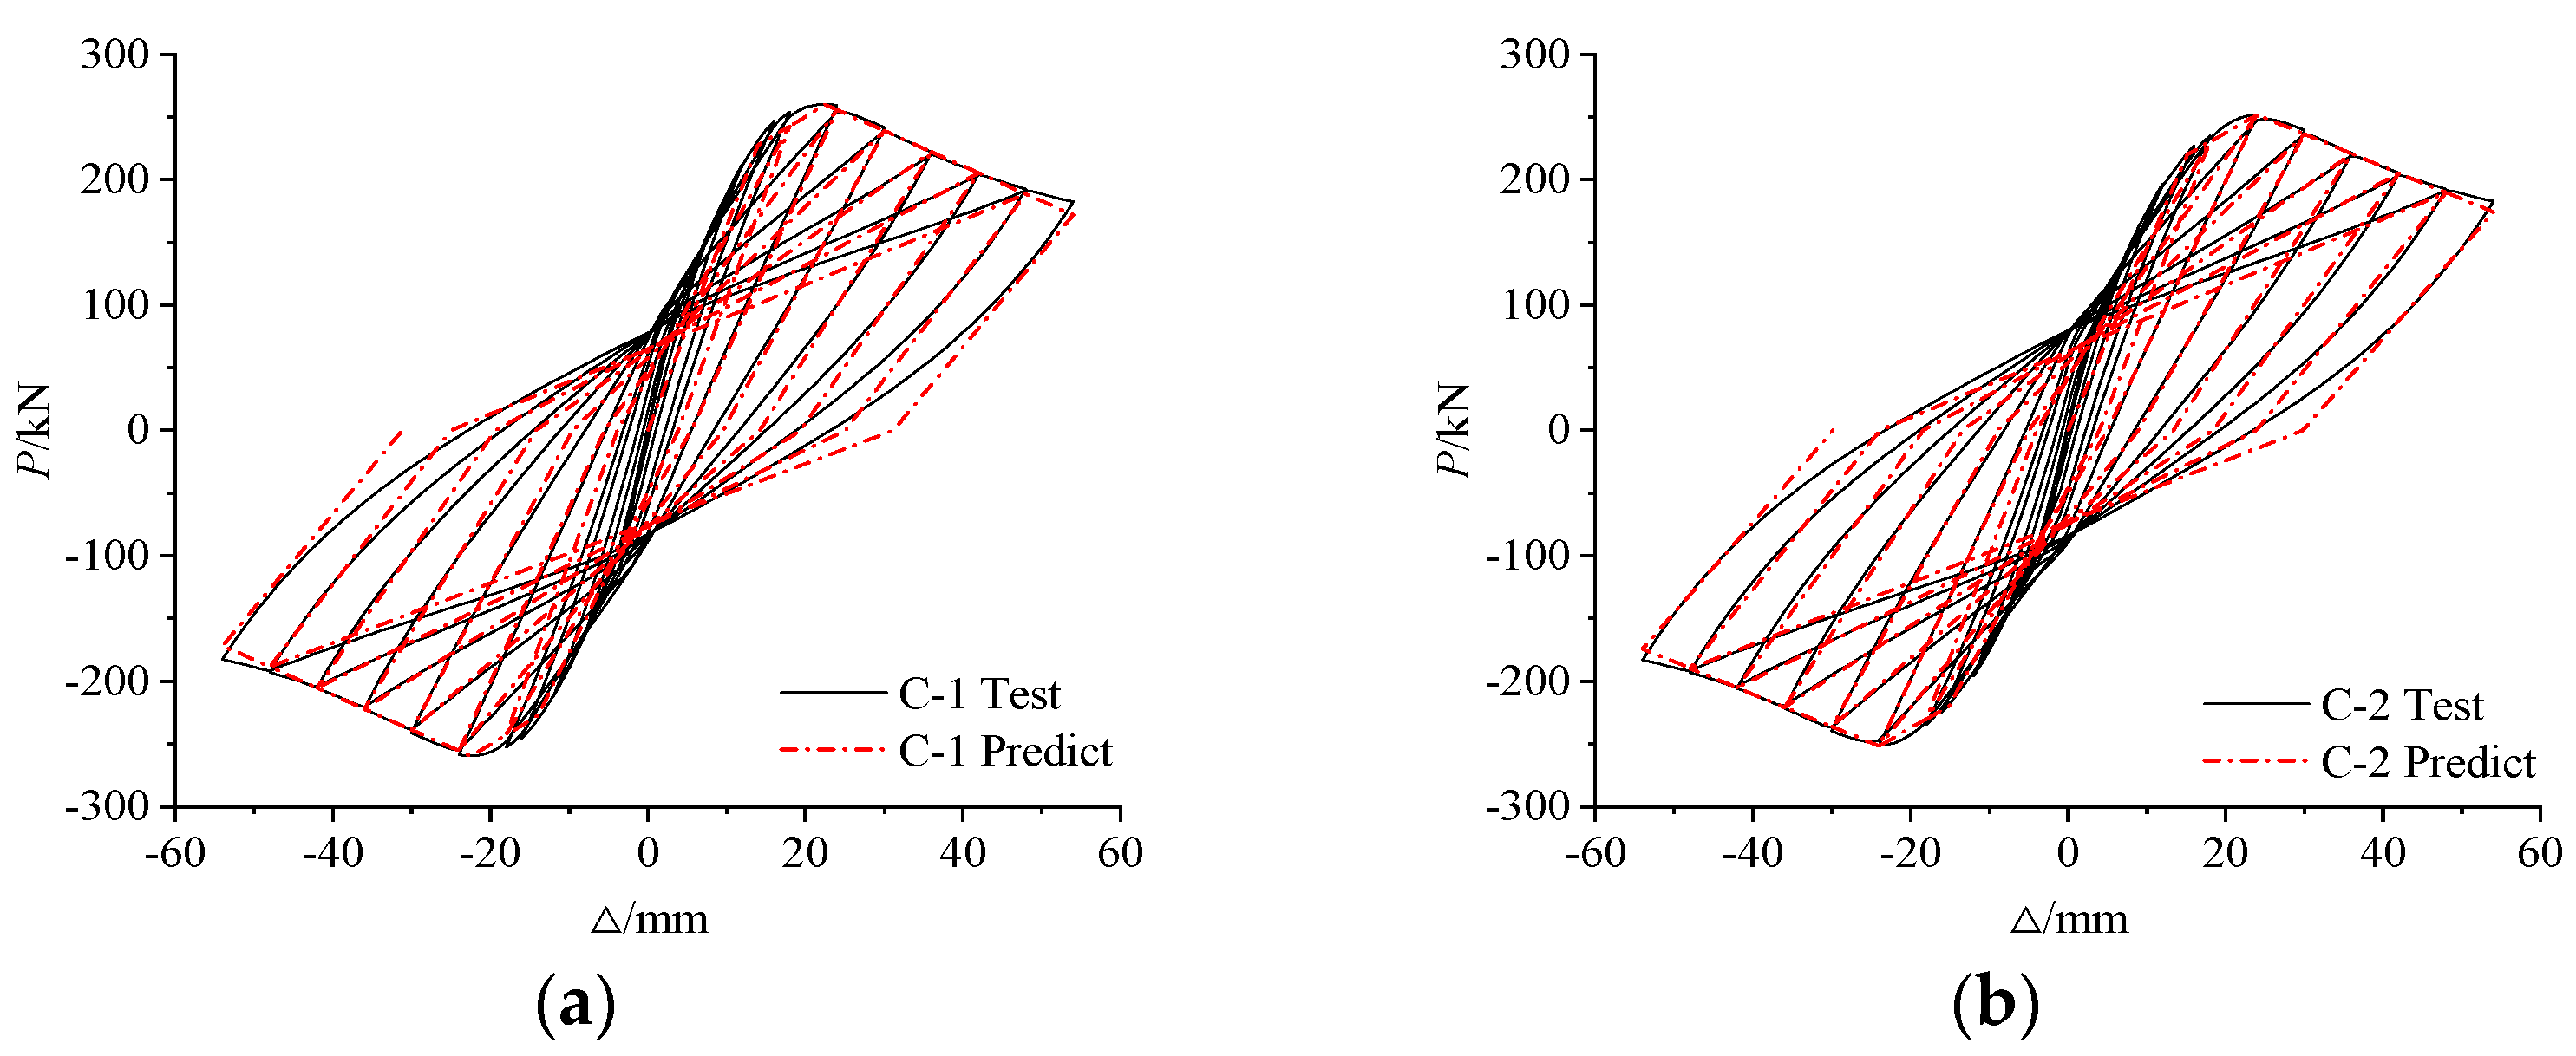
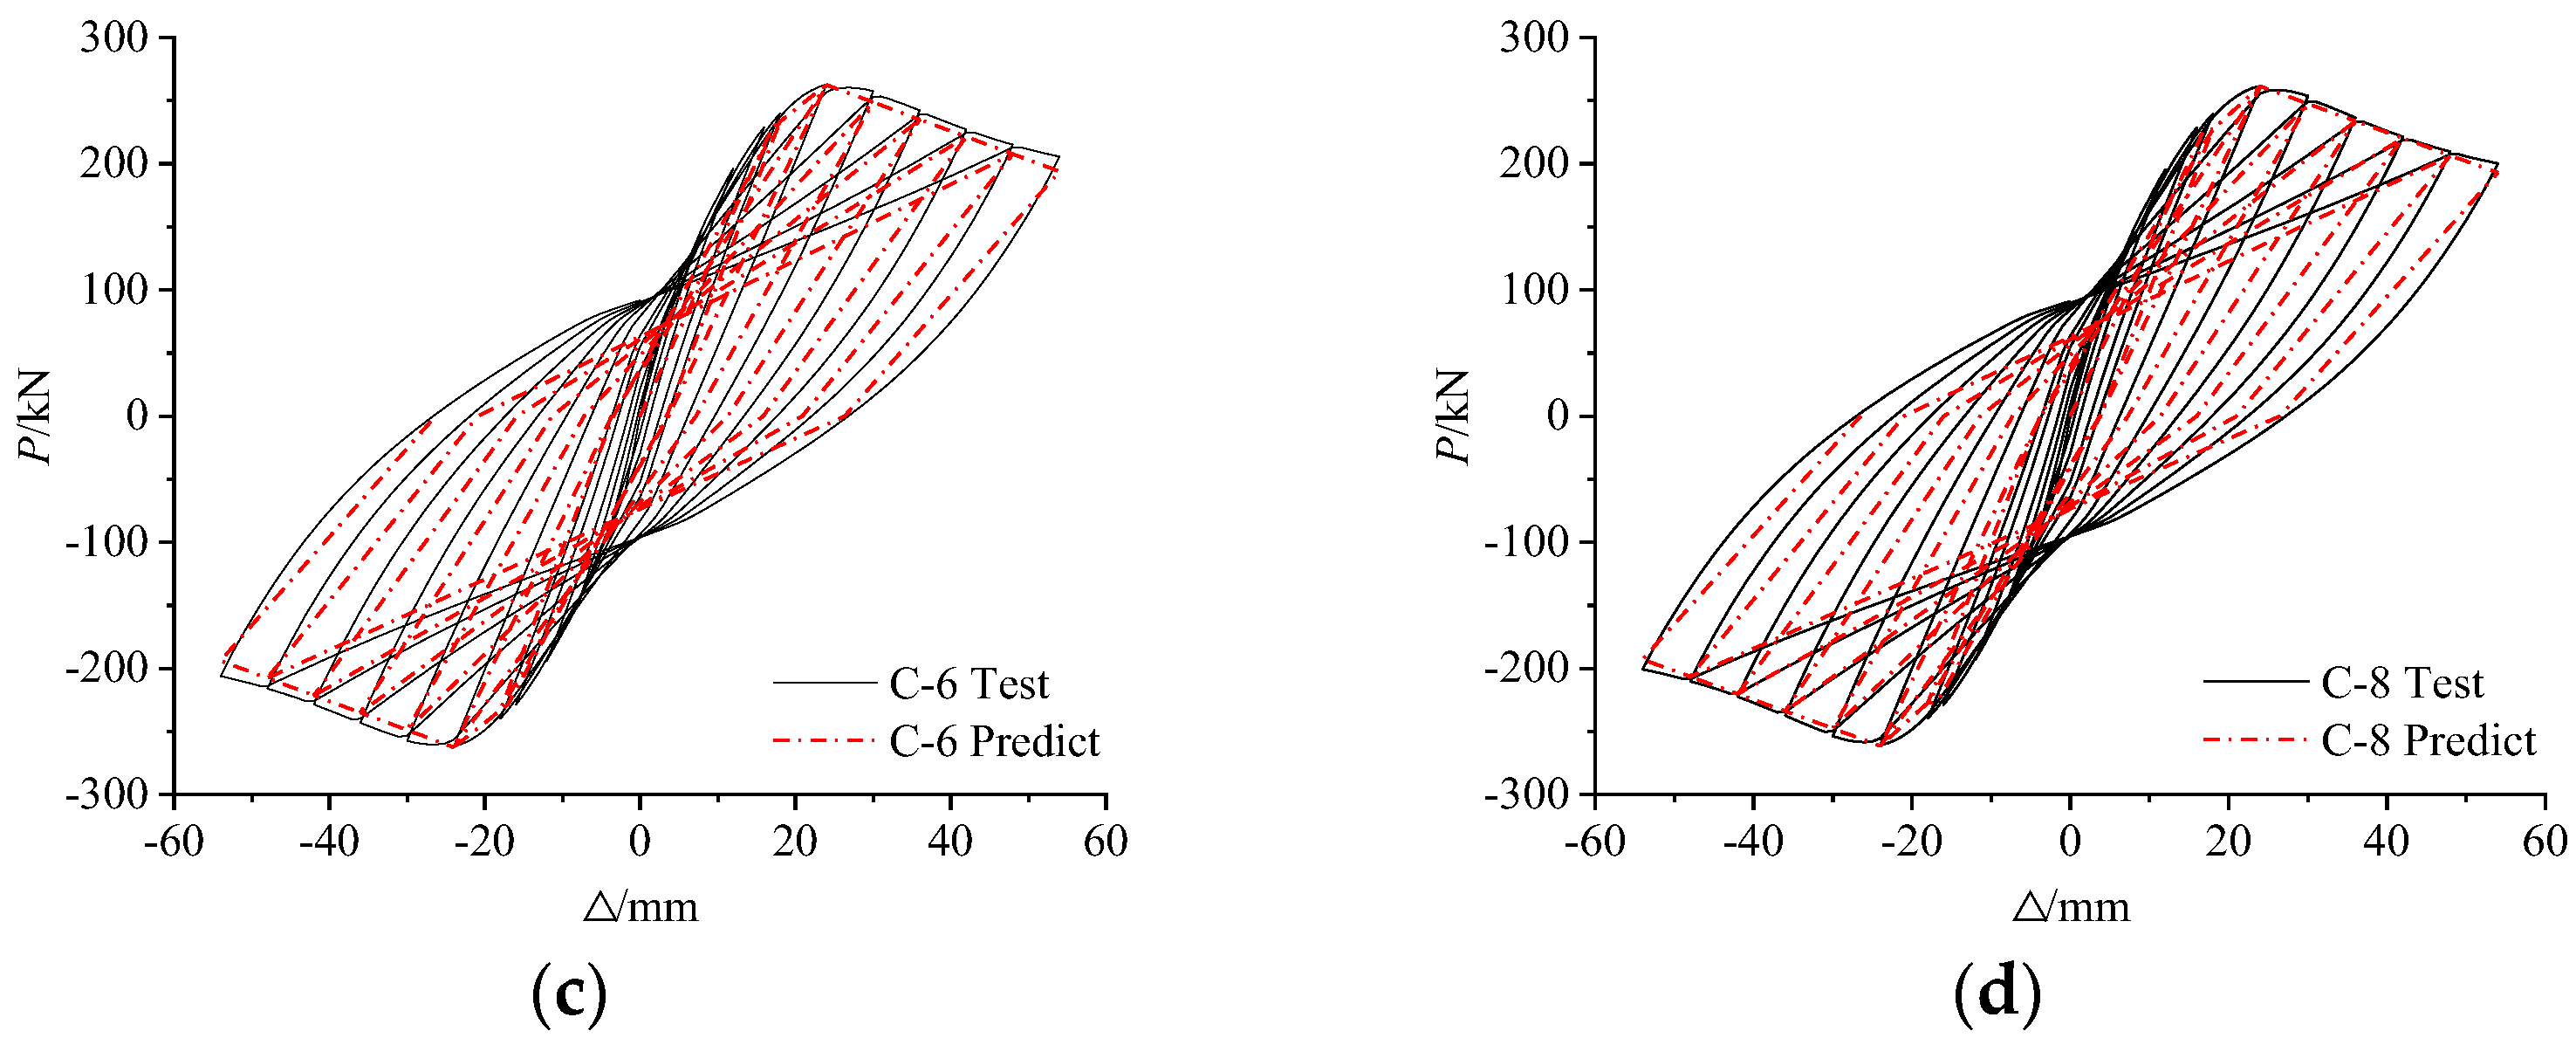
5.3. Comparison between Simulated Hysteretic Curve and Hysteretic Model
6. Discussion
7. Conclusions
- (1)
- The calculated results of the models of reinforced RPC columns and steel-reinforced RPC columns were in good agreement with the test results. The average difference of peak load, yield stiffness and stiffness of descending branch was 2.75%, 5.50% and 1.5%, respectively. It shows that the established numerical model had high reliability and can provide theoretical support for subsequent parameter analysis.
- (2)
- The results of hysteretic analysis show that the cross-shaped-steel-reinforced RPC column had good seismic performance. Steel sectional resistance moment and reinforcement ratio were two important factors that affected the hysteretic behavior of cross-shaped-steel-reinforced RPC columns. With the increase of steel sectional resistance moment and reinforcement ratio, the peak load and energy dissipation capacity were significantly improved, but it has little effect on ductility.
- (3)
- Compared with H-shaped-steel-reinforced RPC columns, the peak bearing capacity of cross-shaped-steel-reinforced RPC columns was increased by 21.2%, but the ductility decreased. The total energy dissipation capacity of the specimen with cross-shaped steel was better than that of the specimen with H-shaped steel.
- (4)
- According to the results of parametric analysis, the hysteretic model of cross-shaped-steel-reinforced RPC columns was established. The hysteretic curves predicted by the hysteretic model were basically consistent with the numerical analysis results. The hysteretic model provides a theoretical basis for the hysteretic analysis of cross-shaped-steel-reinforced RPC columns.
- (5)
- For cross-shaped steel columns, RPC with 140 MPa is an economical choice. In this case, the axial compression ratio and slenderness ratio can be reasonably improved according to the use of the building. Cross-shaped steel columns are recommended in disaster-prone areas where the direction of earthquake load cannot be predicted, because when the earthquake load is perpendicular to the web of the H-beam, its seismic performance will be difficult to give full play.
- (6)
- The conclusions were summarized according to the results of parameter analysis, which was based on the numerical model established by the existing literature. The conclusions are reliable to some extent, but related tests are still needed for further verification.
Author Contributions
Funding
Data Availability Statement
Acknowledgments
Conflicts of Interest
References
- Tsiavos, A.; Amrein, P.; Bender, N.; Stojadinovic, B. Compliance-based estimation of seismic collapse risk of an existing reinforced concrete frame building. Bull. Earthq. Eng. 2021, 19, 6027–6048. [Google Scholar] [CrossRef]
- Vigneri, V.; Kroyer, R.; China, S.; Argentoni, A.; Taras, A. Longitudinal Shear Transfer in Composite Steel Truss and Concrete (CSTC) BEAMS. ce/Papers 2023, 6, 682–693. [Google Scholar] [CrossRef]
- Jonnalagadda, S.; Chava, S. Ultra-High-Performance Concrete (UHPC): A state-of-the-art review of material behavior, structural applications and future. Electron. J. Struct. Eng. 2023, 23, 25–30. [Google Scholar] [CrossRef]
- Saladi, N.; Montanari, L.; De la Varga, I.; Spragg, R.; Graybeal, B. Assessing durability properties of ultra-high performance concrete-class materials. Mater. Struct. 2023, 56, 155. [Google Scholar] [CrossRef]
- Kusumawardaningsih, Y.; Fehling, E.; Ismail, M.; Aboubakr, A.A.M. Tensile strength behavior of UHPC and UHPFRC. Procedia Eng. 2015, 125, 1081–1086. [Google Scholar] [CrossRef]
- Aboukifa, M.; Moustafa, M.A. Experimental seismic behavior of ultra-high performance concrete columns with high strength steel reinforcement. Eng. Struct. 2021, 232, 111885. [Google Scholar] [CrossRef]
- Deng, Z.; Gu, J.; He, S. Numerical simulation on seismic performance of reactive powder concrete short columns. Build. Sci. 2019, 35, 119–127. (In Chinese) [Google Scholar]
- Qian, K.; Xue, T.-Q.; Deng, X.-F.; Ma, J. Experimental investigation on seismic behavior of Ultra-high performance concrete columns reinforced with GFRP bars. Structures 2023, 53, 568–580. [Google Scholar] [CrossRef]
- He, S.; Deng, Z.; Yao, J. Seismic behavior of ultra-high performance concrete long columns reinforced with high-strength steel. J. Build. Eng. 2020, 32, 101740. [Google Scholar] [CrossRef]
- Abbassi, M.; Dabbagh, H. Seismic response of reactive powder concrete columns confined with FRP. Slovak J. Civil Eng. 2019, 27, 12–20. [Google Scholar] [CrossRef]
- Pan, M.; Wang, D. Cyclic axial compression stress-strain model for FRP-confined concrete-encased cross-shaped steel columns. Eng. Struct. 2024, 298, 117063. [Google Scholar] [CrossRef]
- Jiang, H.; Li, Y.; Zhu, J. Numerical simulation of mega steel reinforced concrete columns with different steel sections. Struct. Des. Tall Spec. Build. 2017, 26, e1304. [Google Scholar] [CrossRef]
- Nguyen, D.H.; Hong, W.K. Part I: Failure criteria of the steel-concrete columns (SRC columns) confined by cross-shaped flange sections. J. Asian Archit. Build. Eng. 2021, 20, 179–192. [Google Scholar] [CrossRef]
- Mostafa, M.M.; Chen, S.; Wu, T.; Liu, X.; Liu, Y. Experimental seismic analysis of new types of steel-reinforced lightweight concrete columns with cross-shaped steel section. J. Build. Eng. 2022, 60, 105202. [Google Scholar] [CrossRef]
- Ji, J.; He, L.; Jiang, L.; Ren, H.; Ni, S.; Wang, Z.; Li, Y.; Yu, C.; Lin, Y. Seismic behavior of GFRP tube reactive powder concrete composite columns with encased steel. Front. Mater. 2021, 8, 793392. [Google Scholar] [CrossRef]
- Ma, Y.; Jia, J.; Zhu, W. Comparative analysis of the seismic behaviour of SRUHSC columns and frames under reverse cyclic loading. Mag. Concr. Res. 2018, 70, 189–203. [Google Scholar] [CrossRef]
- Zhang, L.; Wang, K.; Zhang, M.; Yang, Y.; Liu, F.; Yang, D.; Xu, G.; Chen, W. Seismic performance of steel-reinforced reactive powder concrete columns. Structures 2023, 54, 1788–1802. [Google Scholar] [CrossRef]
- Menegotto, M.; Pinto, P.E. Method of Analysis for Cyclically Loaded Reinforced Concrete Plane Frames including Changes in Geometry and Non-elastic Behavior of Elements under Combined Normal Force and Bending. In Proceedings of the IABSE Symposium on Resistance and Ultimate Deformability of Structures Acted on by Well Defined Repeated Loads, Lisbon, Portugal, September 1973. [Google Scholar]
- Chang, G.A.; Mander, J.B. Seismic Energy Based Fatigue Damage Analysis of Bridge Columns: Part 1—Evaluation of Seismic Capacity; State University of New York: New York, NY, USA, 1994. [Google Scholar]
- Waugh, J.D. Nonlinear Analysis of T-Shaped Concrete Walls Subjected to Multi-Directional Displacements; Iowa State University: Ames, IA, USA, 2009. [Google Scholar]
- Lv, X.; Wang, Y.; Fu, C. Basic mechanical property indexes of reactive powder concrete. J. Harbin Inst. Technol. 2014, 46, 9. (In Chinese) [Google Scholar]
- Deng, Z.; Yao, J. The axial compression stress-strain model for ultra-high performance concrete columns confined by high-strength stirrups. Eng. Mech. 2020, 37, 120–128. (In Chinese) [Google Scholar]
- GB 50010-2010; Code for Design of Concrete Structures. China Building Industry Press: Beijing, China, 2010. (In Chinese)
- GB/T 228.1-2010; Tensile Test Method of Metallic Materials at Room Temperature. China Standards Publishing House: Beijing, China, 2010. (In Chinese)
- DBJ 43/T 325-2017; Technical Specification for Reactive Powder Concrete Structure. China Building Industry Press: Beijing, China, 2017. (In Chinese)
- Xue, J.; Zhang, X.; Ke, X.; Ma, L. Seismic resistance capacity of steel reinforced highstrength concrete columns with rectangular spiral stirrups. Constr. Build. Mater. 2019, 229, 116880. [Google Scholar] [CrossRef]


| No. | Direction | /kN | /kN | /kN·mm−1 | /kN·mm−1 | /kN·mm−1 | /kN·mm−1 | |||
|---|---|---|---|---|---|---|---|---|---|---|
| DZ | + | +543.09 | +559.67 | 0.97 | +6.88 | +6.00 | 1.15 | 6.91 | 8.32 | 0.83 |
| − | −555.01 | −549.26 | 1.01 | −7.68 | −8.00 | 0.96 | 8.63 | 8.76 | 0.99 | |
| DGZ | + | +577.00 | +585.56 | 0.99 | +7.84 | +8.00 | 0.98 | 5.92 | 9.14 | 0.65 |
| − | −587.11 | −581.12 | 1.01 | −8.44 | −8.00 | 1.06 | 6.01 | 8.88 | 0.68 |
| No. | Direction | /kN | /kN | /kN·mm−1 | /kN·mm−1 | /kN·mm−1 | /kN·mm−1 | |||
|---|---|---|---|---|---|---|---|---|---|---|
| C1 | + | 111.25 | 112.47 | 0.99 | 6.75 | 6.13 | 1.10 | 0.64 | 0.67 | 0.96 |
| − | −106.00 | −108.83 | 0.97 | 5.41 | 5.61 | 0.96 | 0.46 | 0.36 | 1.28 | |
| C2 | + | 123.65 | 124.74 | 0.99 | 6.92 | 6.52 | 1.06 | 0.73 | 0.54 | 1.35 |
| − | −119.54 | −121.77 | 0.98 | 6.71 | 6.62 | 1.01 | 0.43 | 0.47 | 0.91 | |
| C3 | + | 142.75 | 149.71 | 0.95 | 10.83 | 9.3 | 1.16 | 1.76 | 1.98 | 0.89 |
| − | −135.59 | −149.1 | 0.91 | 10.55 | 9.3 | 1.13 | 2.15 | 1.62 | 1.33 | |
| C4 | + | 145.28 | 149.68 | 0.97 | 10.31 | 9.28 | 1.11 | 1.48 | 1.46 | 1.01 |
| − | −139.05 | −149.07 | 0.93 | 9.14 | 9.3 | 0.98 | 1.34 | 1.43 | 0.94 |
| No. | Shape Steel Size/mm | Section Resistance Distance Wss/cm3 | Longitudinal Bar | Reinforcement Ratio ρ/% | RPC Strength Grade /MPa | Axial Compression Ratio n0 | Stirrup | Volume Stirrup Ratio ρsv/% | Column Length l /m | Slenderness Ratio |
|---|---|---|---|---|---|---|---|---|---|---|
| C-1 | 2 × H150 × 75 × 5 × 7 | 86.1 | 4 18 18 | 1.63% | C120 | 0.6 | 8@80 | 1.26 | 1.2 | 9.6 |
| C-2 | 2 × H150 × 75 × 5 × 7 | 86.1 | 418 | 1.63% | C120 | 0.4 | 8@80 | 1.26 | 1.2 | 9.6 |
| C-3 | 2 × H150 × 75 × 5 × 7 | 86.1 | 418 | 1.63% | C120 | 0.2 | 8@80 | 1.26 | 1.2 | 9.6 |
| C-4 | 2 × H150 × 75 × 5 × 7 | 86.1 | 418 | 1.63% | C140 | 0.2 | 8@80 | 1.26 | 1.2 | 9.6 |
| C-5 | 2 × H150 × 75 × 5 × 7 | 86.1 | 418 | 1.63% | C160 | 0.2 | 8@80 | 1.26 | 1.2 | 9.6 |
| C-6 | 2 × H150 × 75 × 5 × 7 | 86.1 | 422 | 2.43% | C120 | 0.2 | 8@80 | 1.26 | 1.2 | 9.6 |
| C-7 | 2 × H175 × 90 × 5 × 8 | 134.2 | 422 | 2.43% | C120 | 0.2 | 8@80 | 1.26 | 1.2 | 9.6 |
| C-8 | 2 × H150 × 75 × 5 × 7 | 86.1 | 422 | 2.43% | C120 | 0.2 | 8@150 | 0.67 | 1.2 | 9.6 |
| C-9 | 2 × H150 × 75 × 5 × 7 | 86.1 | 422 | 2.43% | C120 | 0.2 | 10@80 | 1.96 | 1.2 | 9.6 |
| C-10 | 2 × H150 × 75 × 5 × 7 | 86.1 | 418 | 1.63% | C120 | 0.4 | 8@80 | 1.26 | 0.8 | 6.4 |
| C-11 | 2 × H150 × 75 × 5 × 7 | 86.1 | 418 | 1.63% | C120 | 0.4 | 8@80 | 1.26 | 1.6 | 12.8 |
| C-12 | 1 × H150 × 75 × 5 × 7 | 86.1 | 418 | 1.63% | C120 | 0.2 | 8@80 | 1.26 | 1.2 | 9.6 |
| No. | Direction | /kN | /mm | /kN | /mm | No. | Direction | /kN | /mm | /kN | /mm | ||
|---|---|---|---|---|---|---|---|---|---|---|---|---|---|
| C-1 | + | 227.45 | 13.74 | 260.15 | 36.30 | 2.64 | C-7 | + | 256.81 | 15.84 | 290.50 | 45.07 | 2.85 |
| − | 226.79 | 13.76 | 259.36 | 36.59 | 2.66 | − | 255.96 | 15.85 | 289.70 | 45.91 | 2.90 | ||
| C-2 | + | 220.30 | 15.12 | 251.96 | 38.64 | 2.56 | C-8 | + | 229.50 | 16.14 | 261.63 | 41.58 | 2.58 |
| − | 218.49 | 15.14 | 251.37 | 39.00 | 2.58 | − | 229.43 | 16.14 | 260.84 | 42.38 | 2.63 | ||
| C-3 | + | 208.05 | 16.53 | 240.01 | 42.37 | 2.56 | C-9 | + | 230.00 | 16.15 | 263.36 | 46.39 | 2.87 |
| − | 208.23 | 16.53 | 239.31 | 43.31 | 2.62 | − | 229.78 | 16.15 | 262.54 | 47.27 | 2.93 | ||
| C-4 | + | 221.47 | 17.65 | 258.98 | 44.02 | 2.49 | C-10 | + | 336.10 | 7.14 | 377.86 | 17.18 | 2.41 |
| − | 221.54 | 17.66 | 258.11 | 45.12 | 2.56 | − | 333.76 | 7.21 | 376.61 | 17.35 | 2.41 | ||
| C-5 | + | 227.00 | 17.91 | 266.90 | 40.97 | 2.29 | C-11 | + | 162.17 | 25.98 | 187.67 | 69.29 | 2.67 |
| − | 226.79 | 17.87 | 265.91 | 41.82 | 2.34 | − | 161.38 | 26.10 | 187.60 | 69.60 | 2.67 | ||
| C-6 | + | 229.92 | 16.16 | 262.8 | 43.88 | 2.72 | C-12 | + | 170.84 | 13.99 | 199.44 | 61.87 | 4.42 |
| − | 229.79 | 16.16 | 261.99 | 44.78 | 2.77 | − | 167.40 | 13.63 | 196.04 | 63.47 | 4.65 |
Disclaimer/Publisher’s Note: The statements, opinions and data contained in all publications are solely those of the individual author(s) and contributor(s) and not of MDPI and/or the editor(s). MDPI and/or the editor(s) disclaim responsibility for any injury to people or property resulting from any ideas, methods, instructions or products referred to in the content. |
© 2024 by the authors. Licensee MDPI, Basel, Switzerland. This article is an open access article distributed under the terms and conditions of the Creative Commons Attribution (CC BY) license (https://creativecommons.org/licenses/by/4.0/).
Share and Cite
Wang, J.; Zhu, Z.; Wang, K. Study on Seismic Behavior of Cross-Shaped-Steel-Reinforced RPC Columns. Buildings 2024, 14, 2310. https://doi.org/10.3390/buildings14082310
Wang J, Zhu Z, Wang K. Study on Seismic Behavior of Cross-Shaped-Steel-Reinforced RPC Columns. Buildings. 2024; 14(8):2310. https://doi.org/10.3390/buildings14082310
Chicago/Turabian StyleWang, Jingmin, Zhiyu Zhu, and Kun Wang. 2024. "Study on Seismic Behavior of Cross-Shaped-Steel-Reinforced RPC Columns" Buildings 14, no. 8: 2310. https://doi.org/10.3390/buildings14082310