


A Quantitative Investigation of the Impact of Climate-Responsive Indoor Clothing Adaptation on Energy Use

Abstract
:1. Introduction
- To propose a climate-responsive indoor temperature control strategy based on the climate-responsive indoor clothing adaptation.
- To devise a methodology for integrating the control strategy into building energy simulations.
- To quantitatively assess the impact on energy use of indoor clothing adaptation among rural residents across different seasons and varying thermal comfort requirements.
2. Methodology
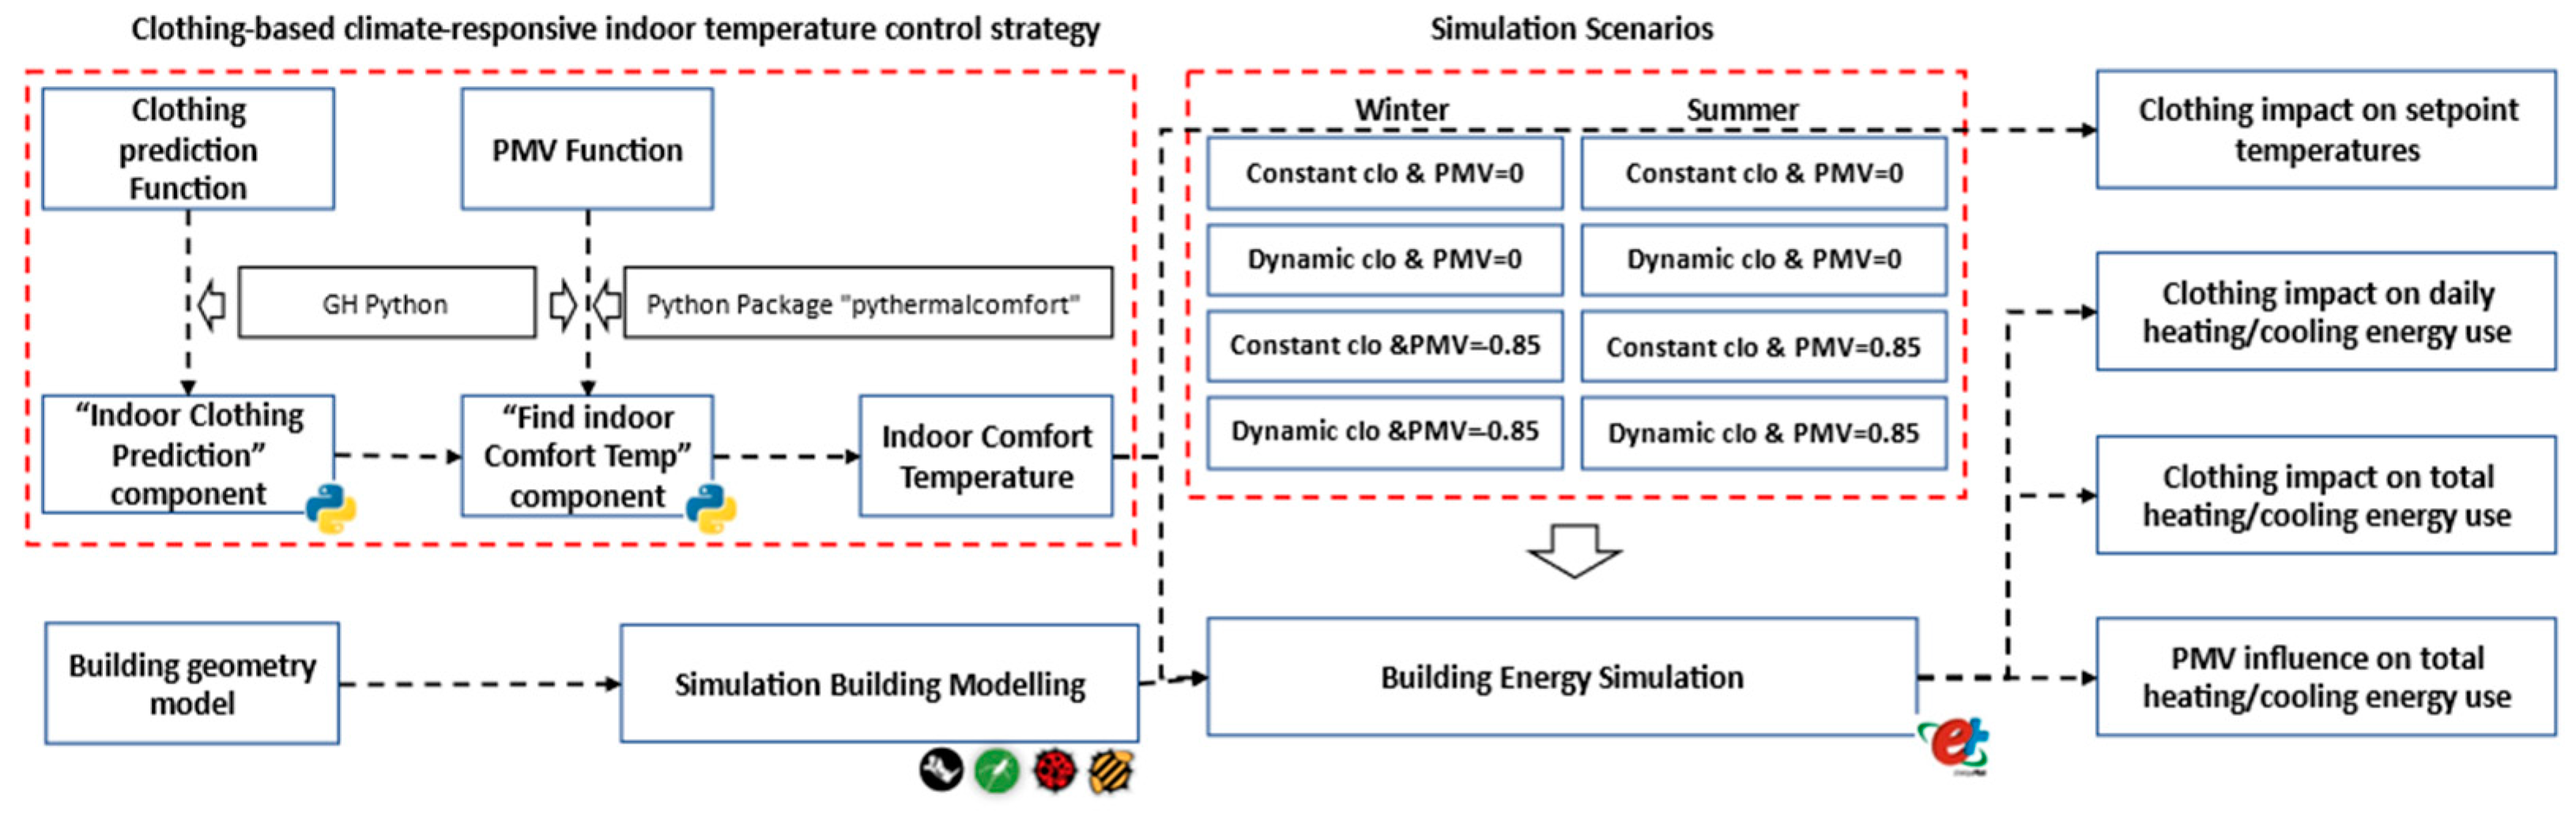
2.1. Climate-Responsive Indoor Temperature Control Strategy
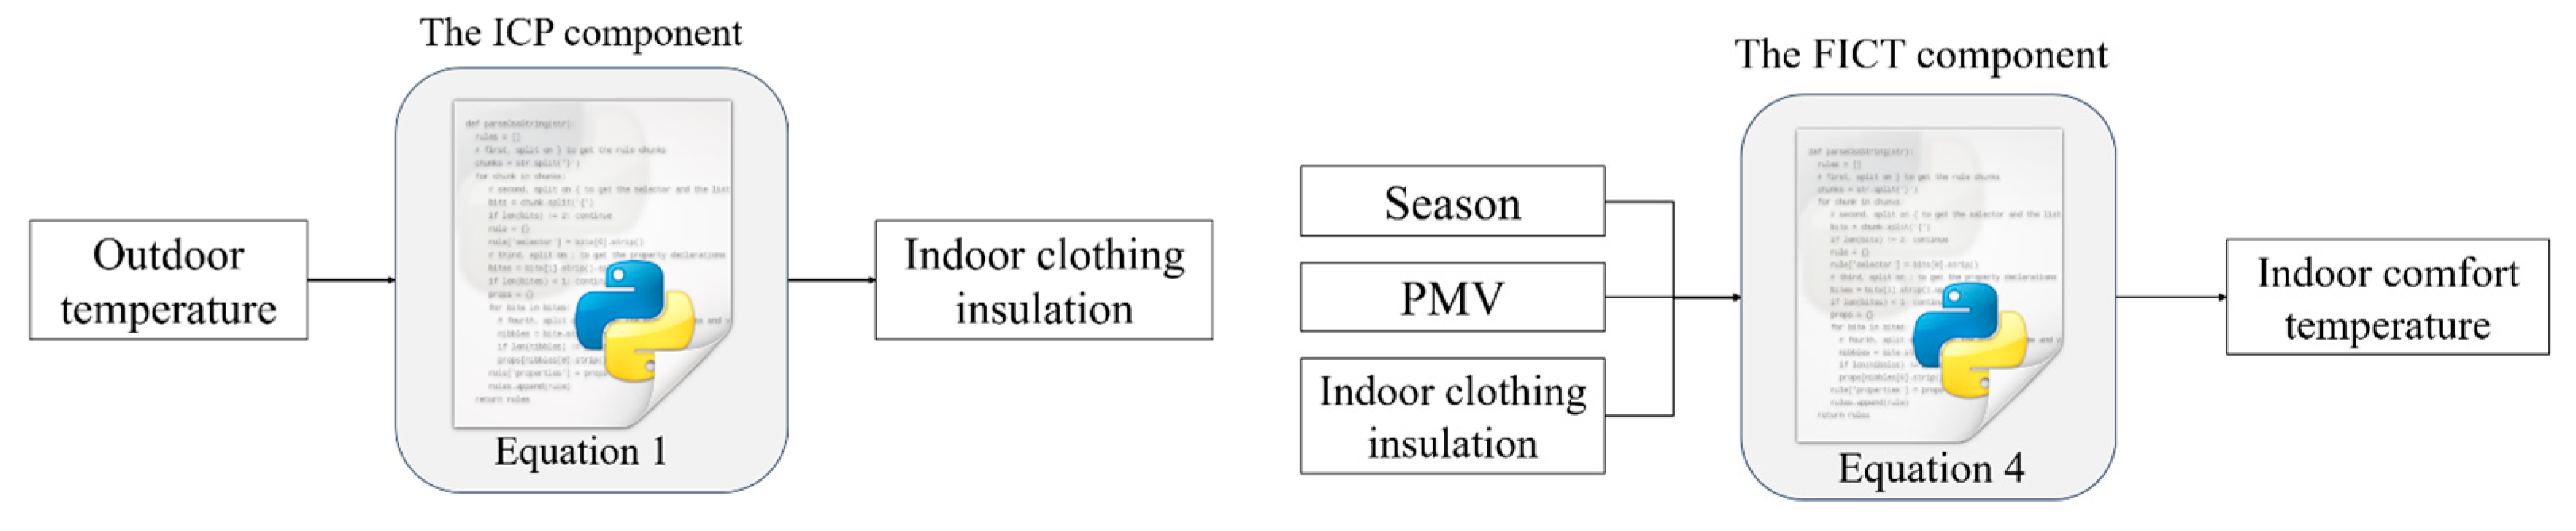
2.1.1. Indoor Clothing Prediction
2.1.2. Indoor Comfort Temperature Calculations
2.2. Building Energy Simulations
2.2.1. Simulation Software
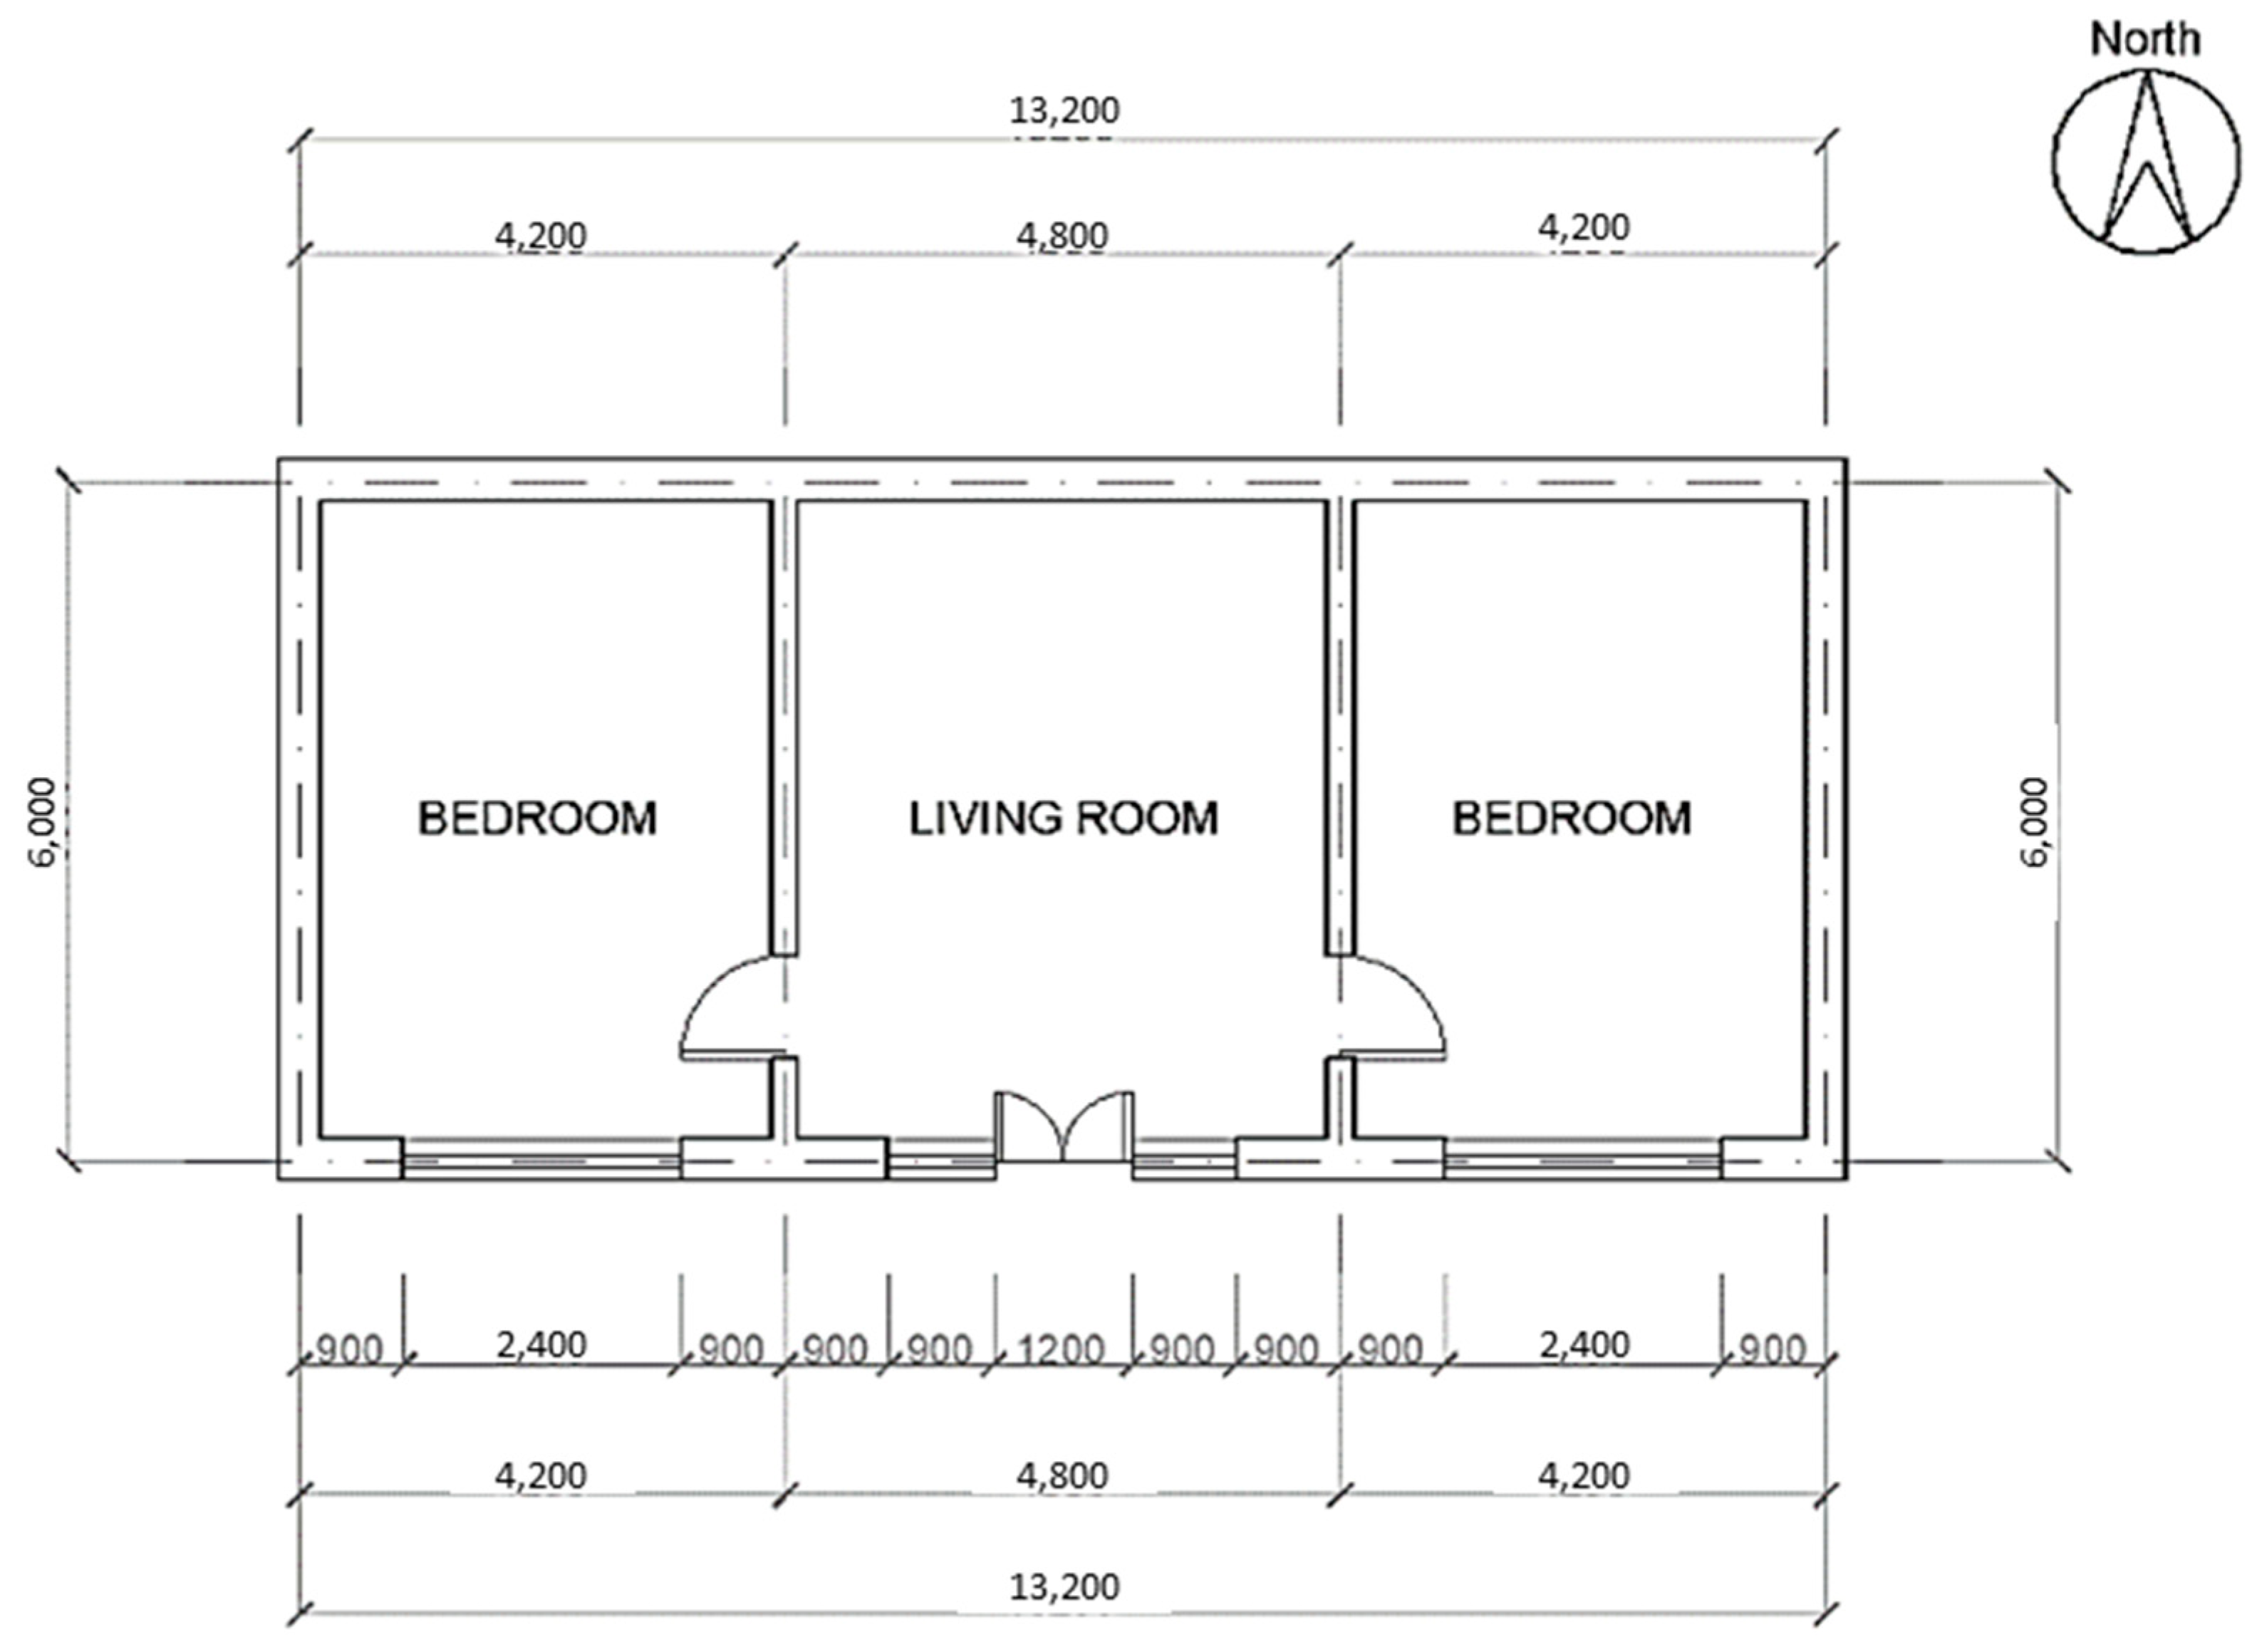
2.2.2. Modeling the Prototype
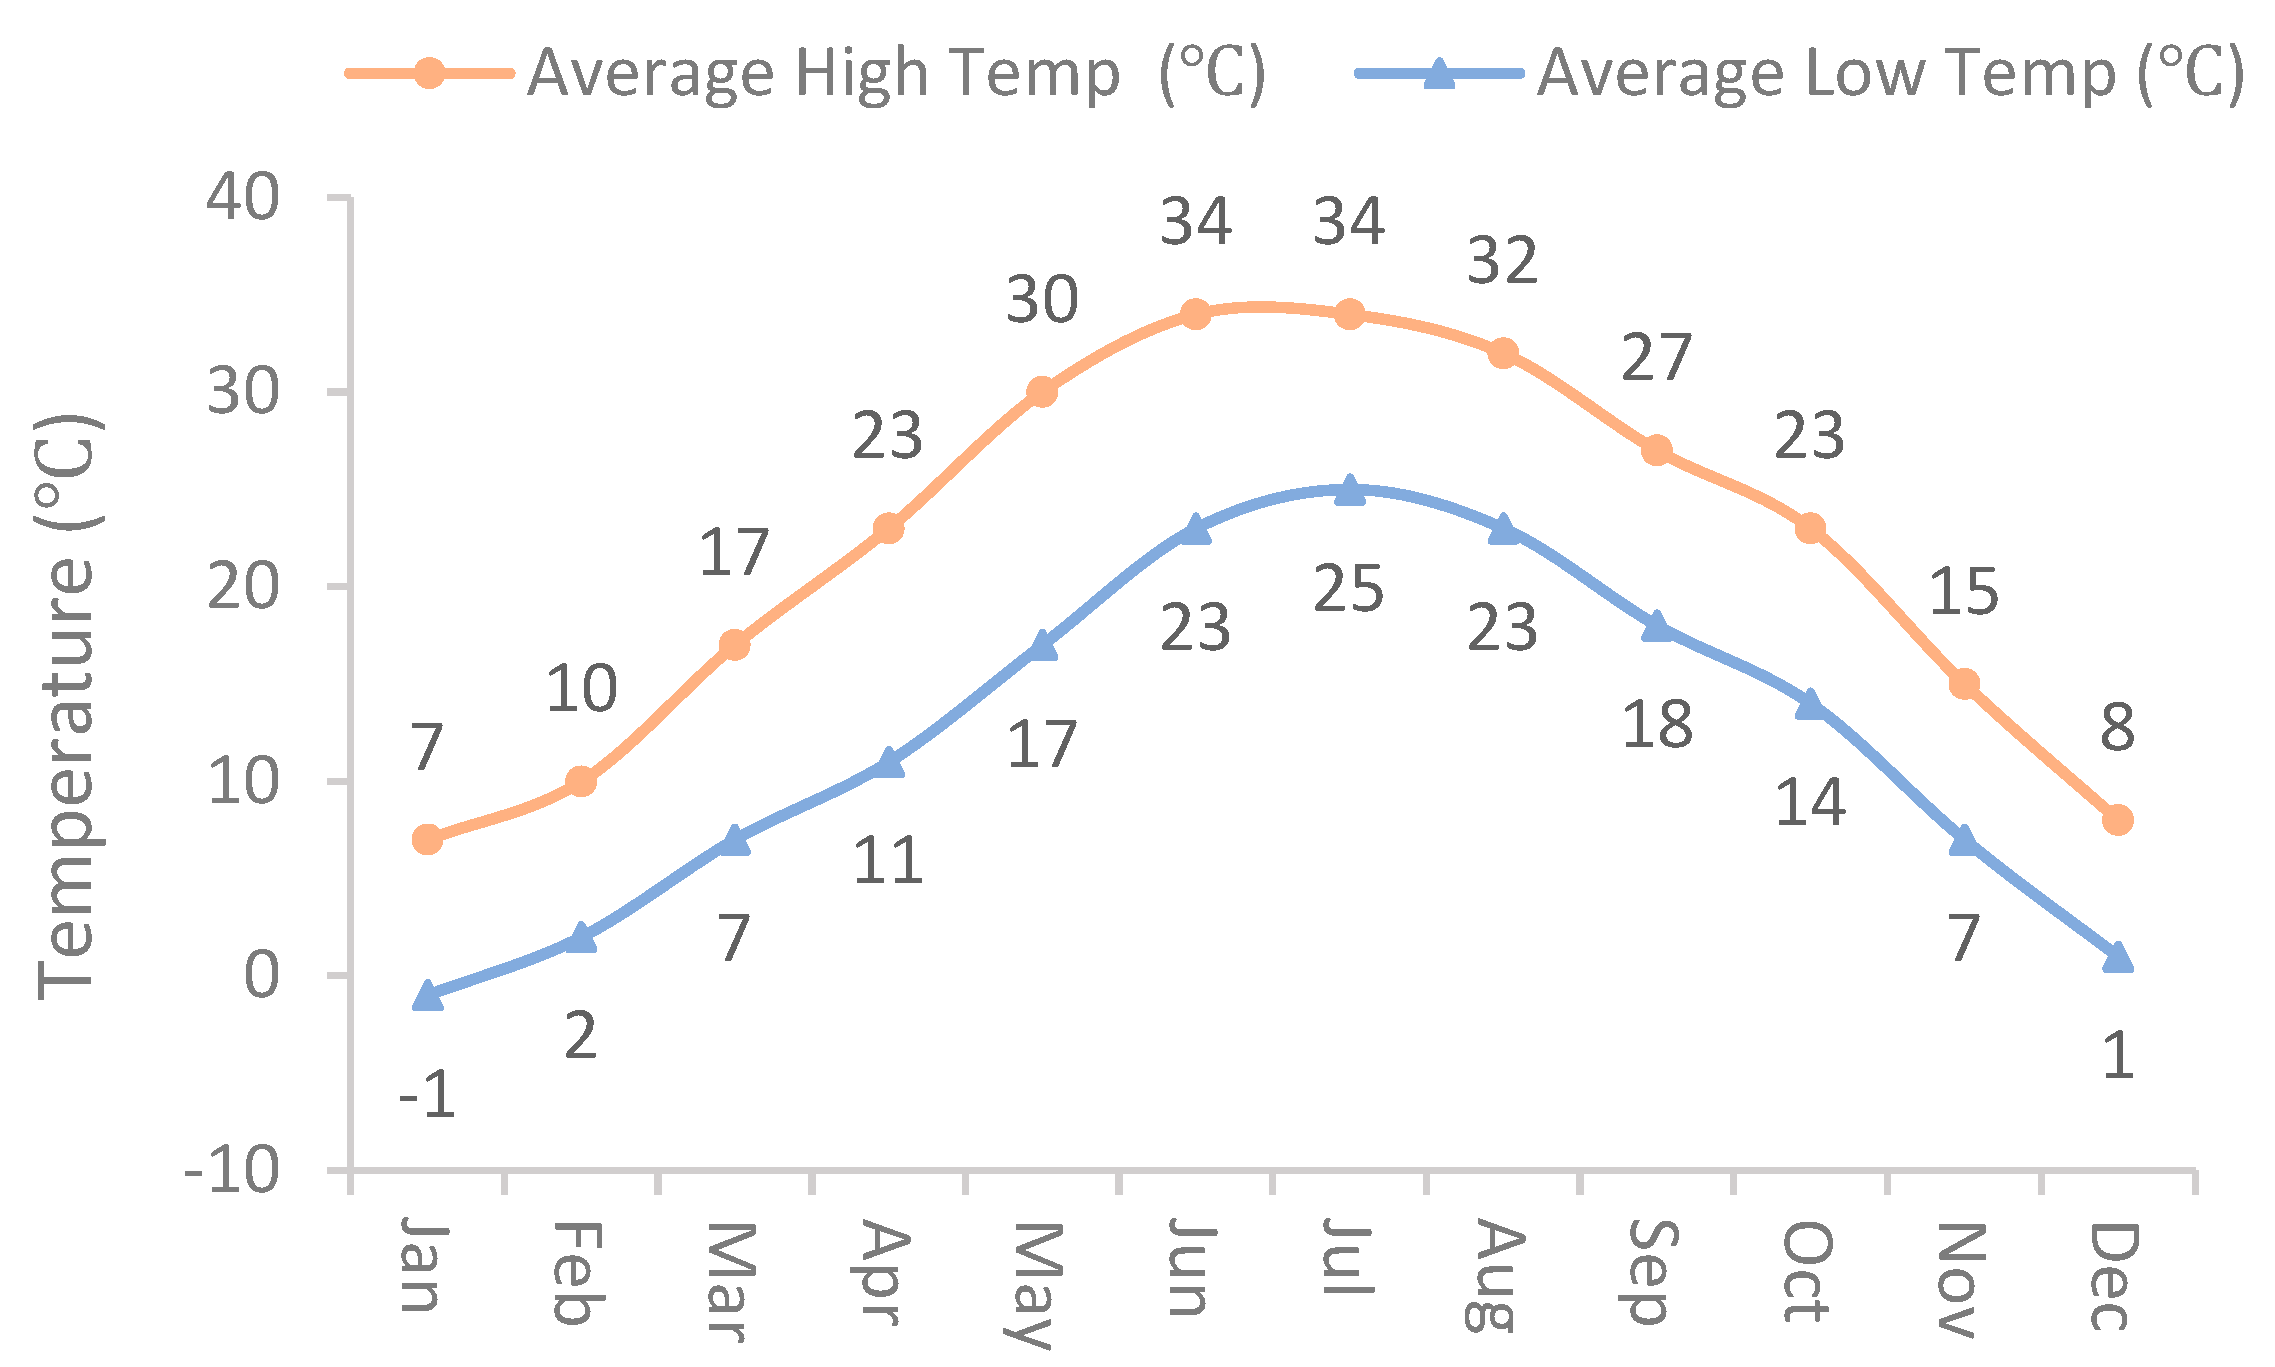
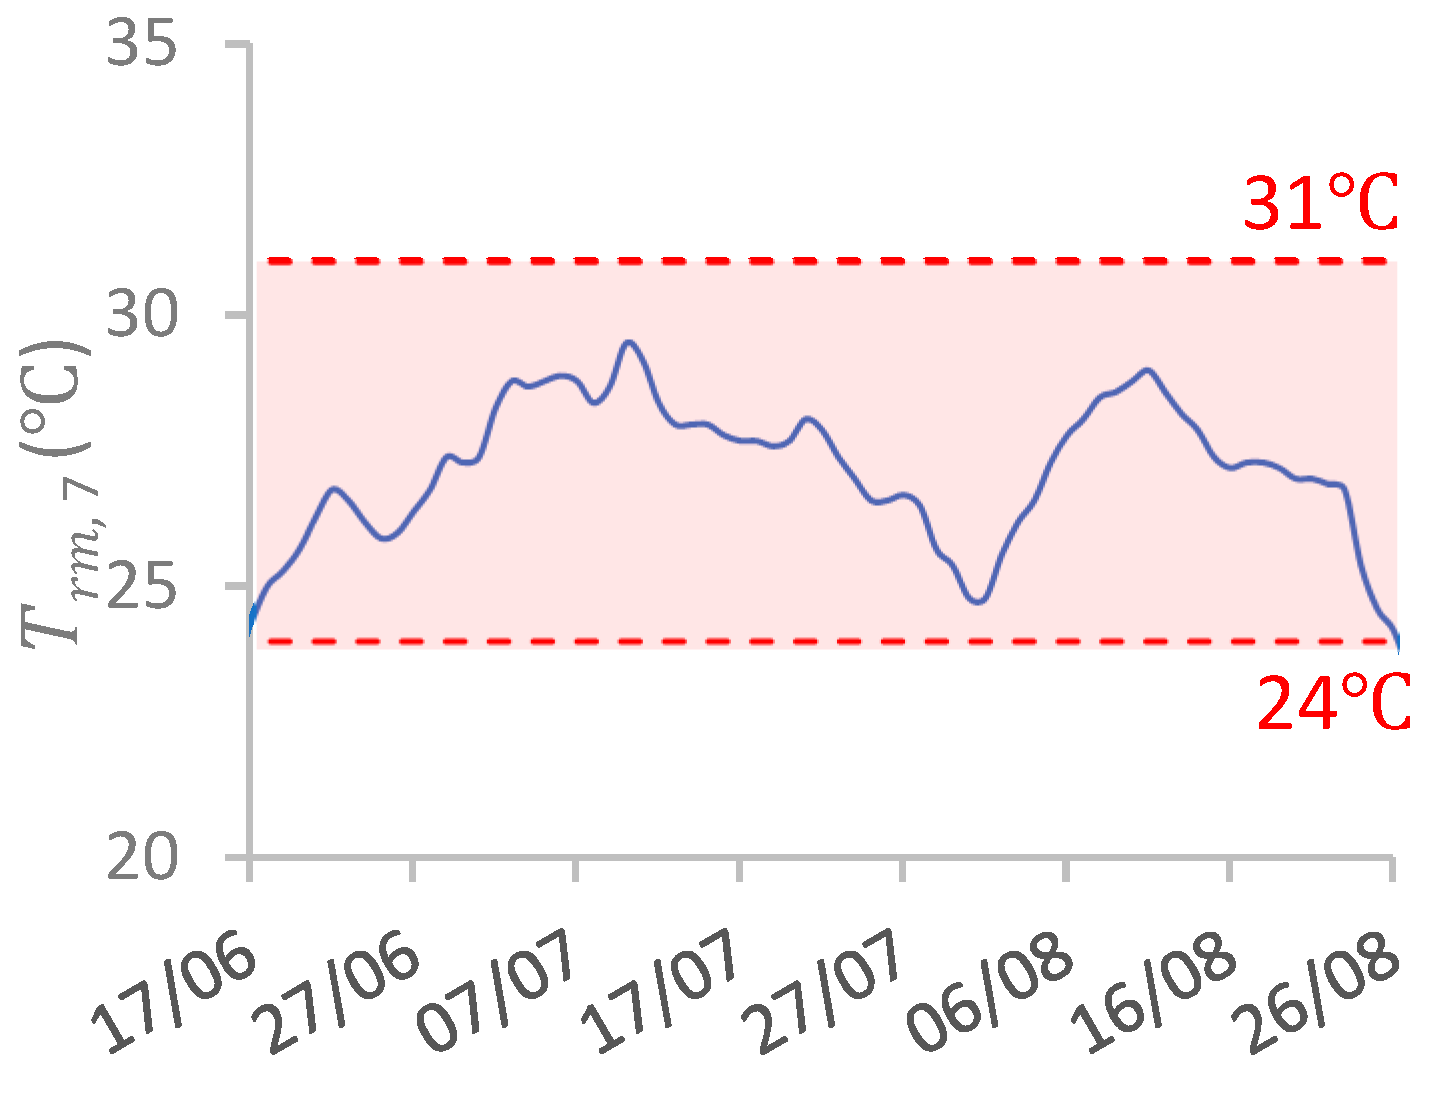
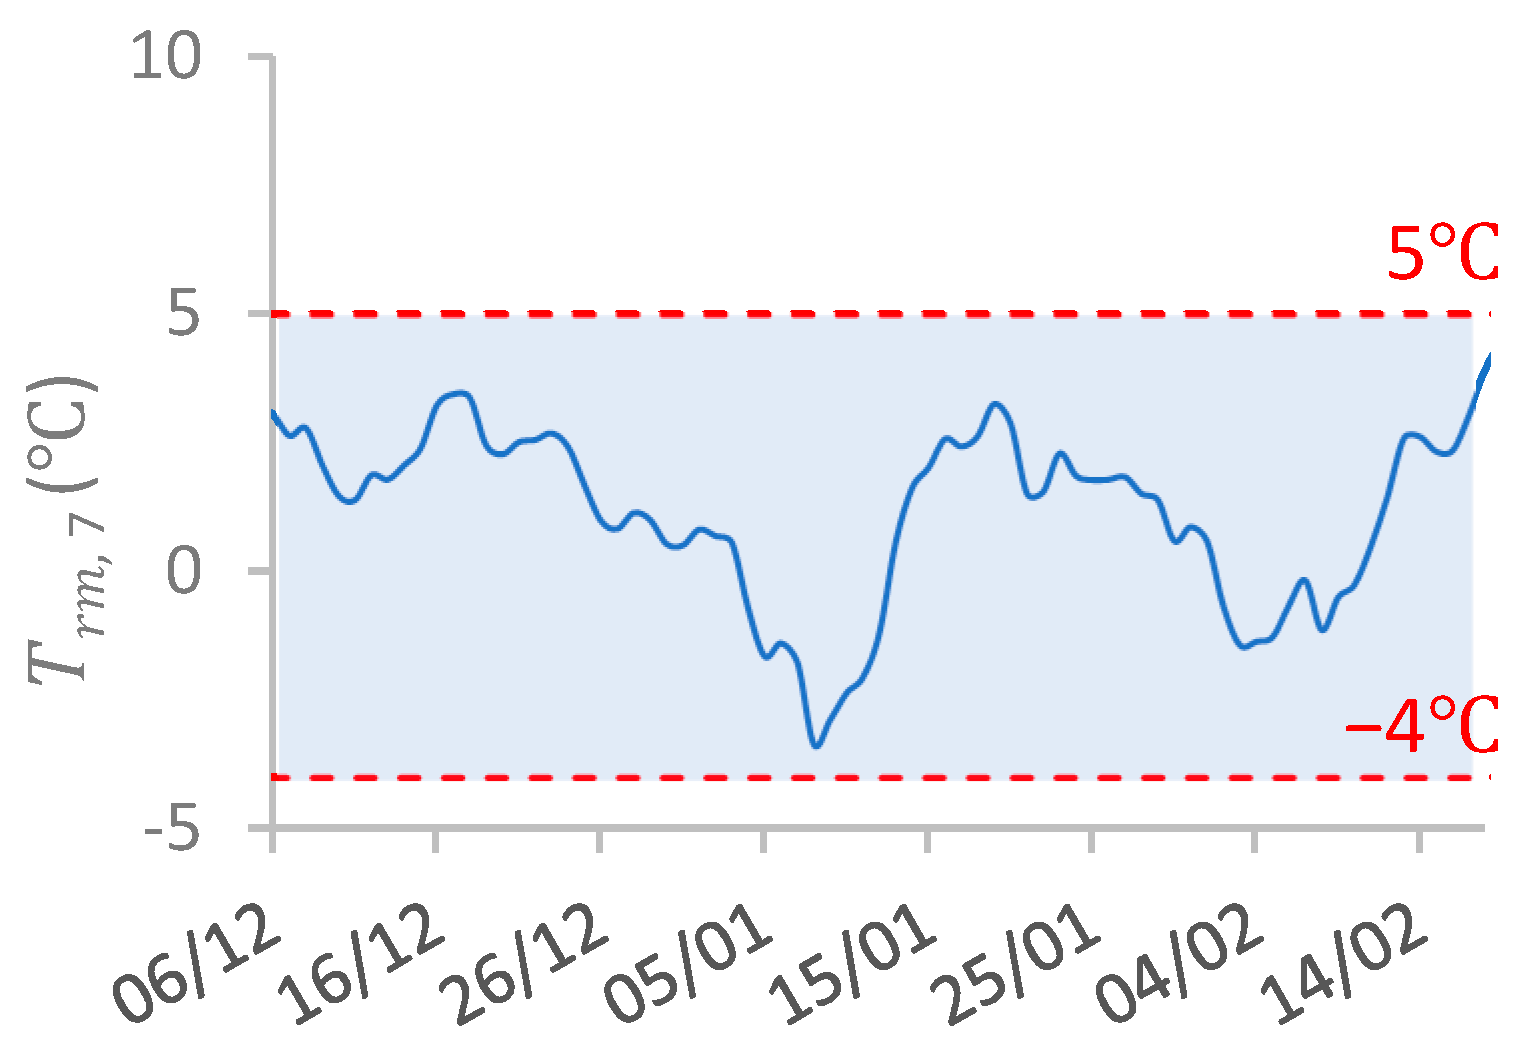
2.2.3. Simulation Periods
2.2.4. Simulation Scenarios
- (1)
- Summer simulation scenarios
- (2)
- Winter simulation scenarios
3. Results
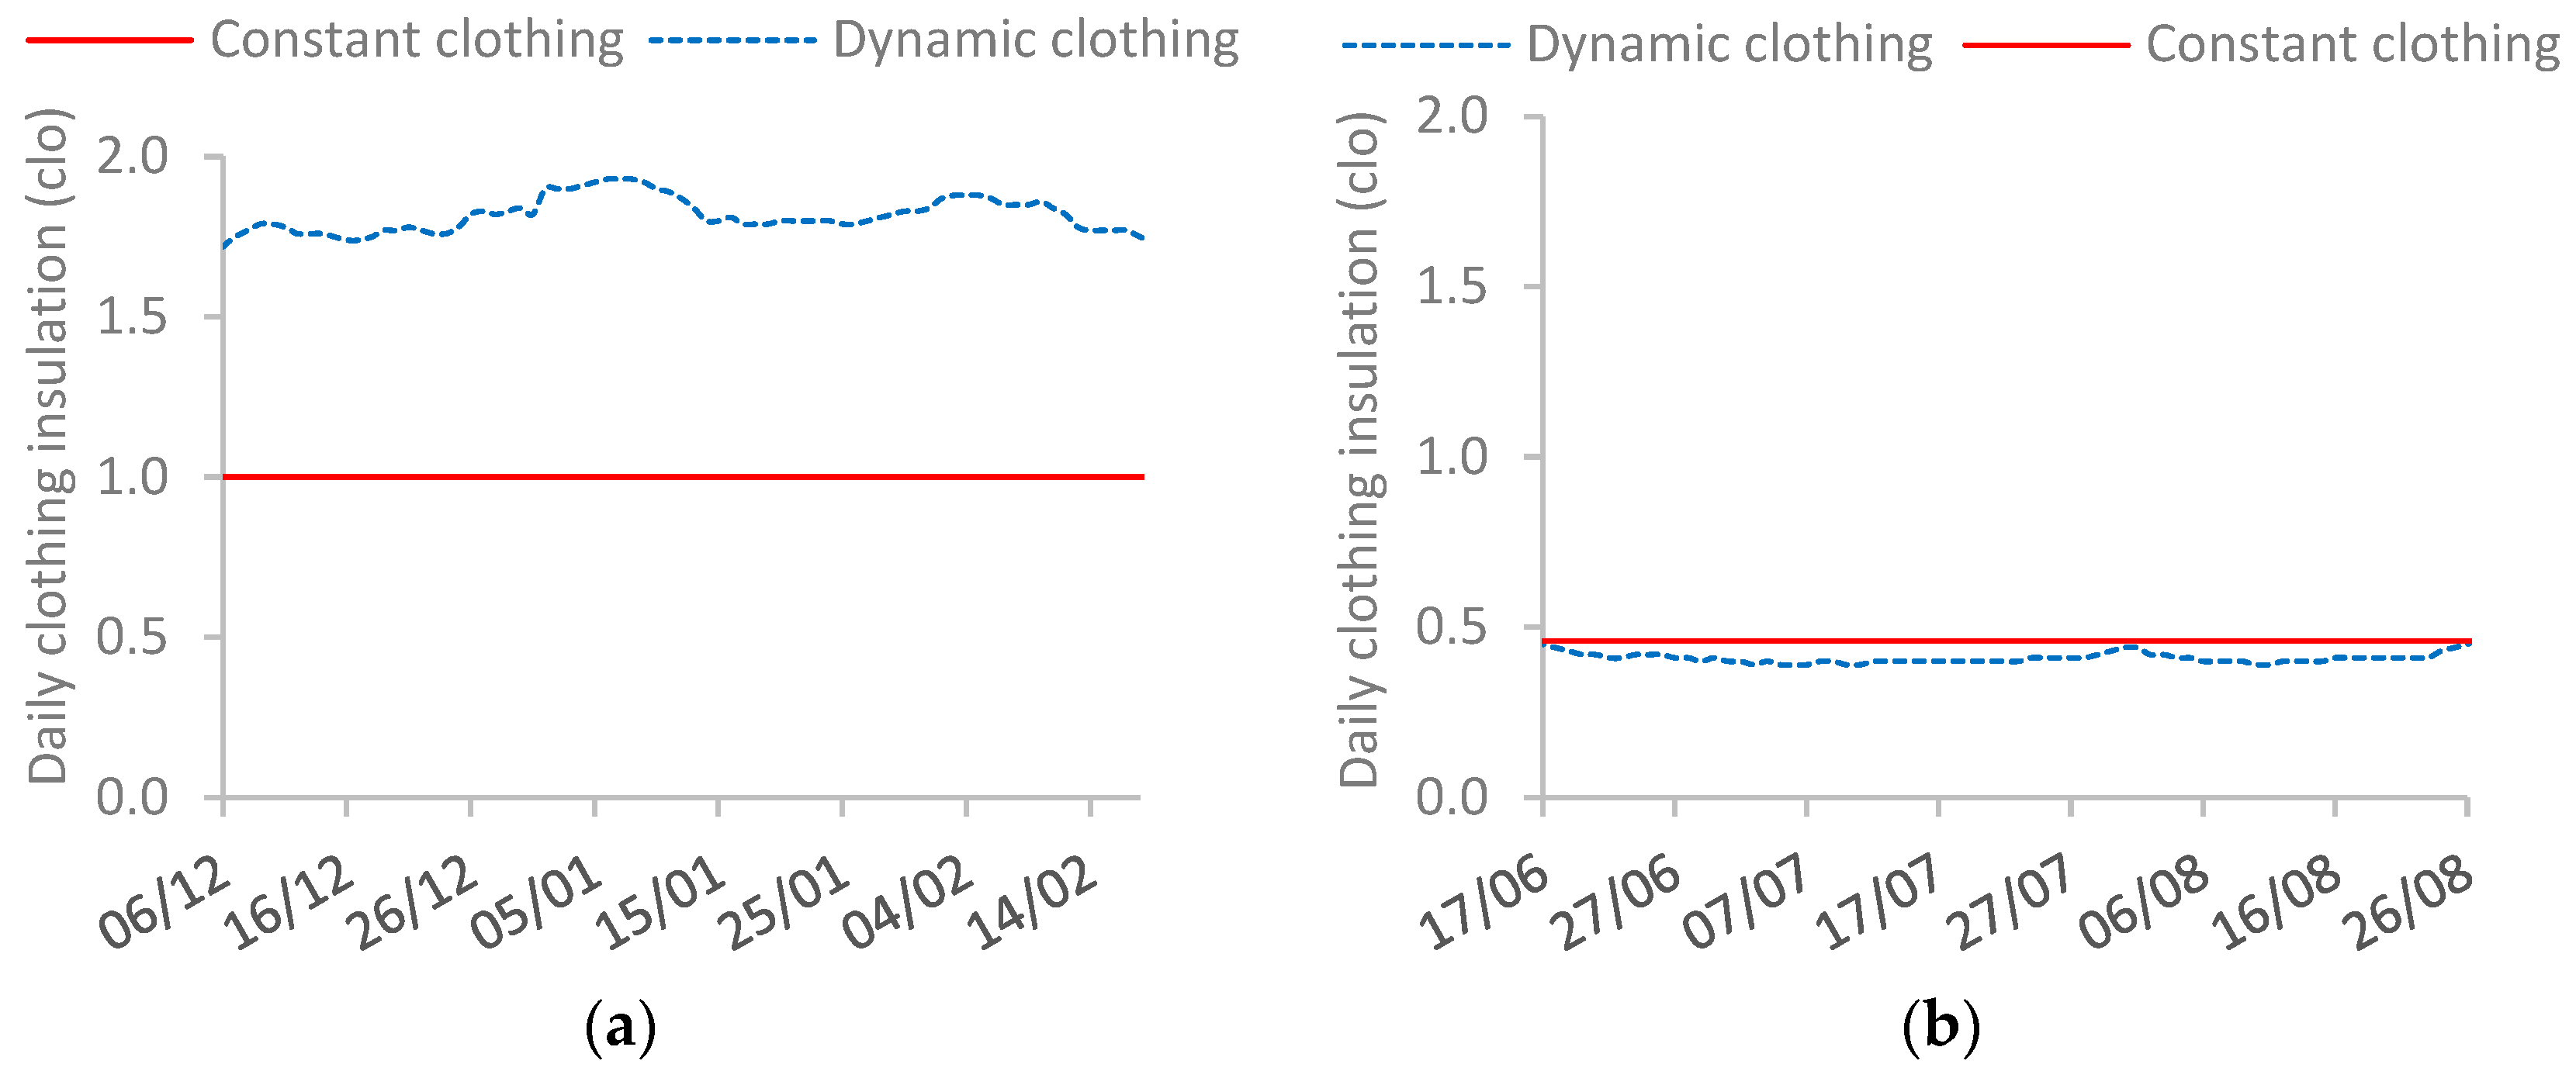
3.1. Predicted Daily Indoor Clothing Insulation
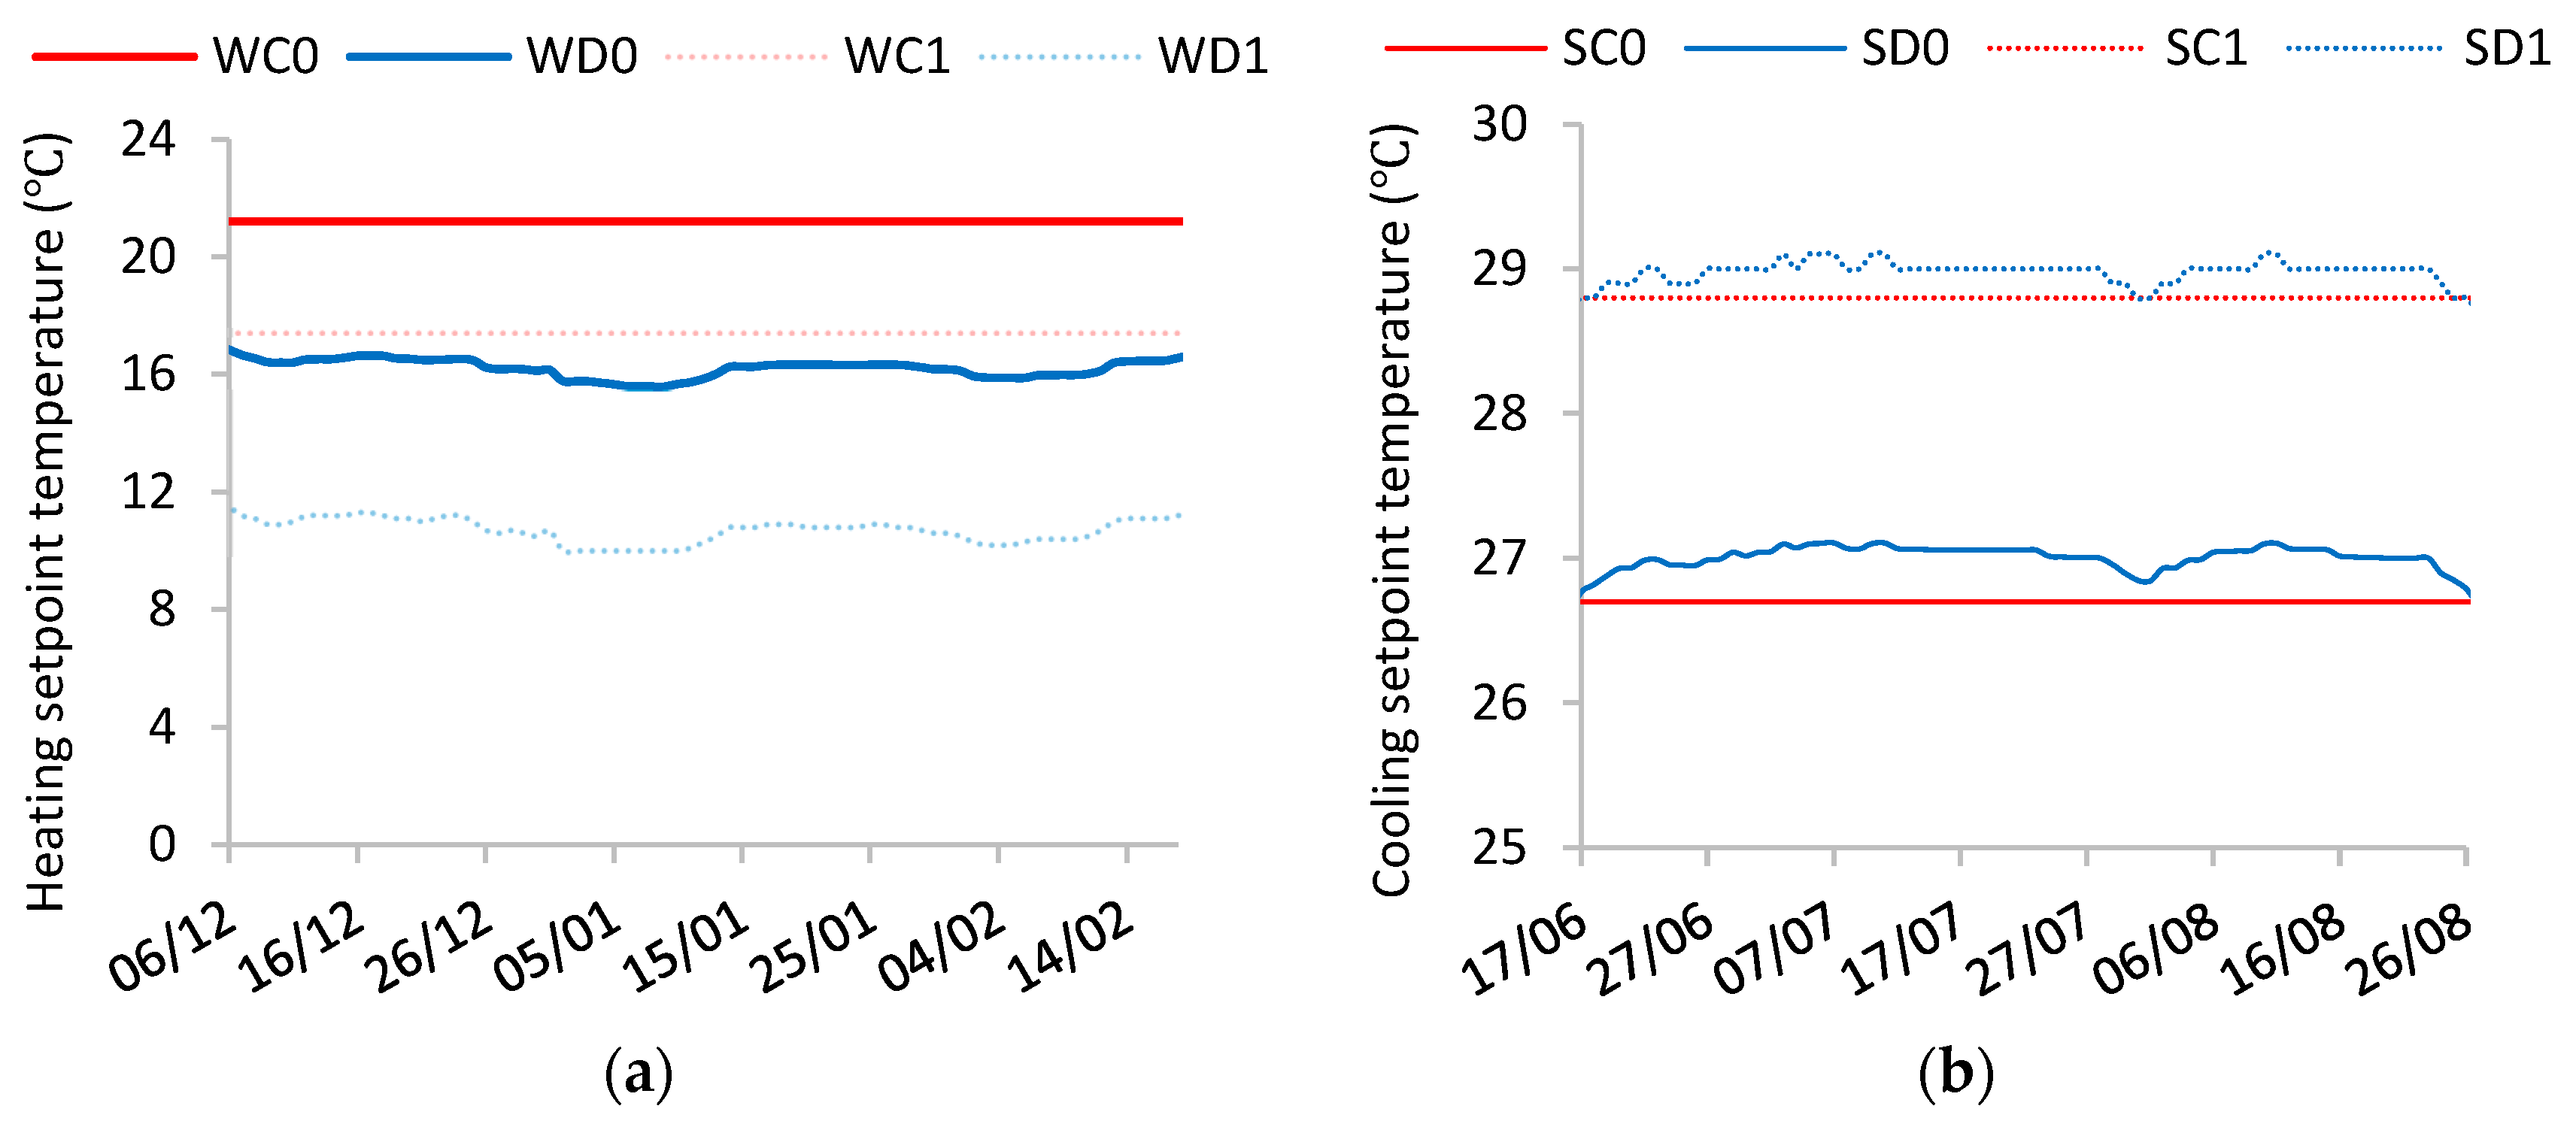
3.2. Daily Indoor Comfort Temperature
- (1)
- Winter simulation scenarios
- (2)
- Summer simulation scenarios
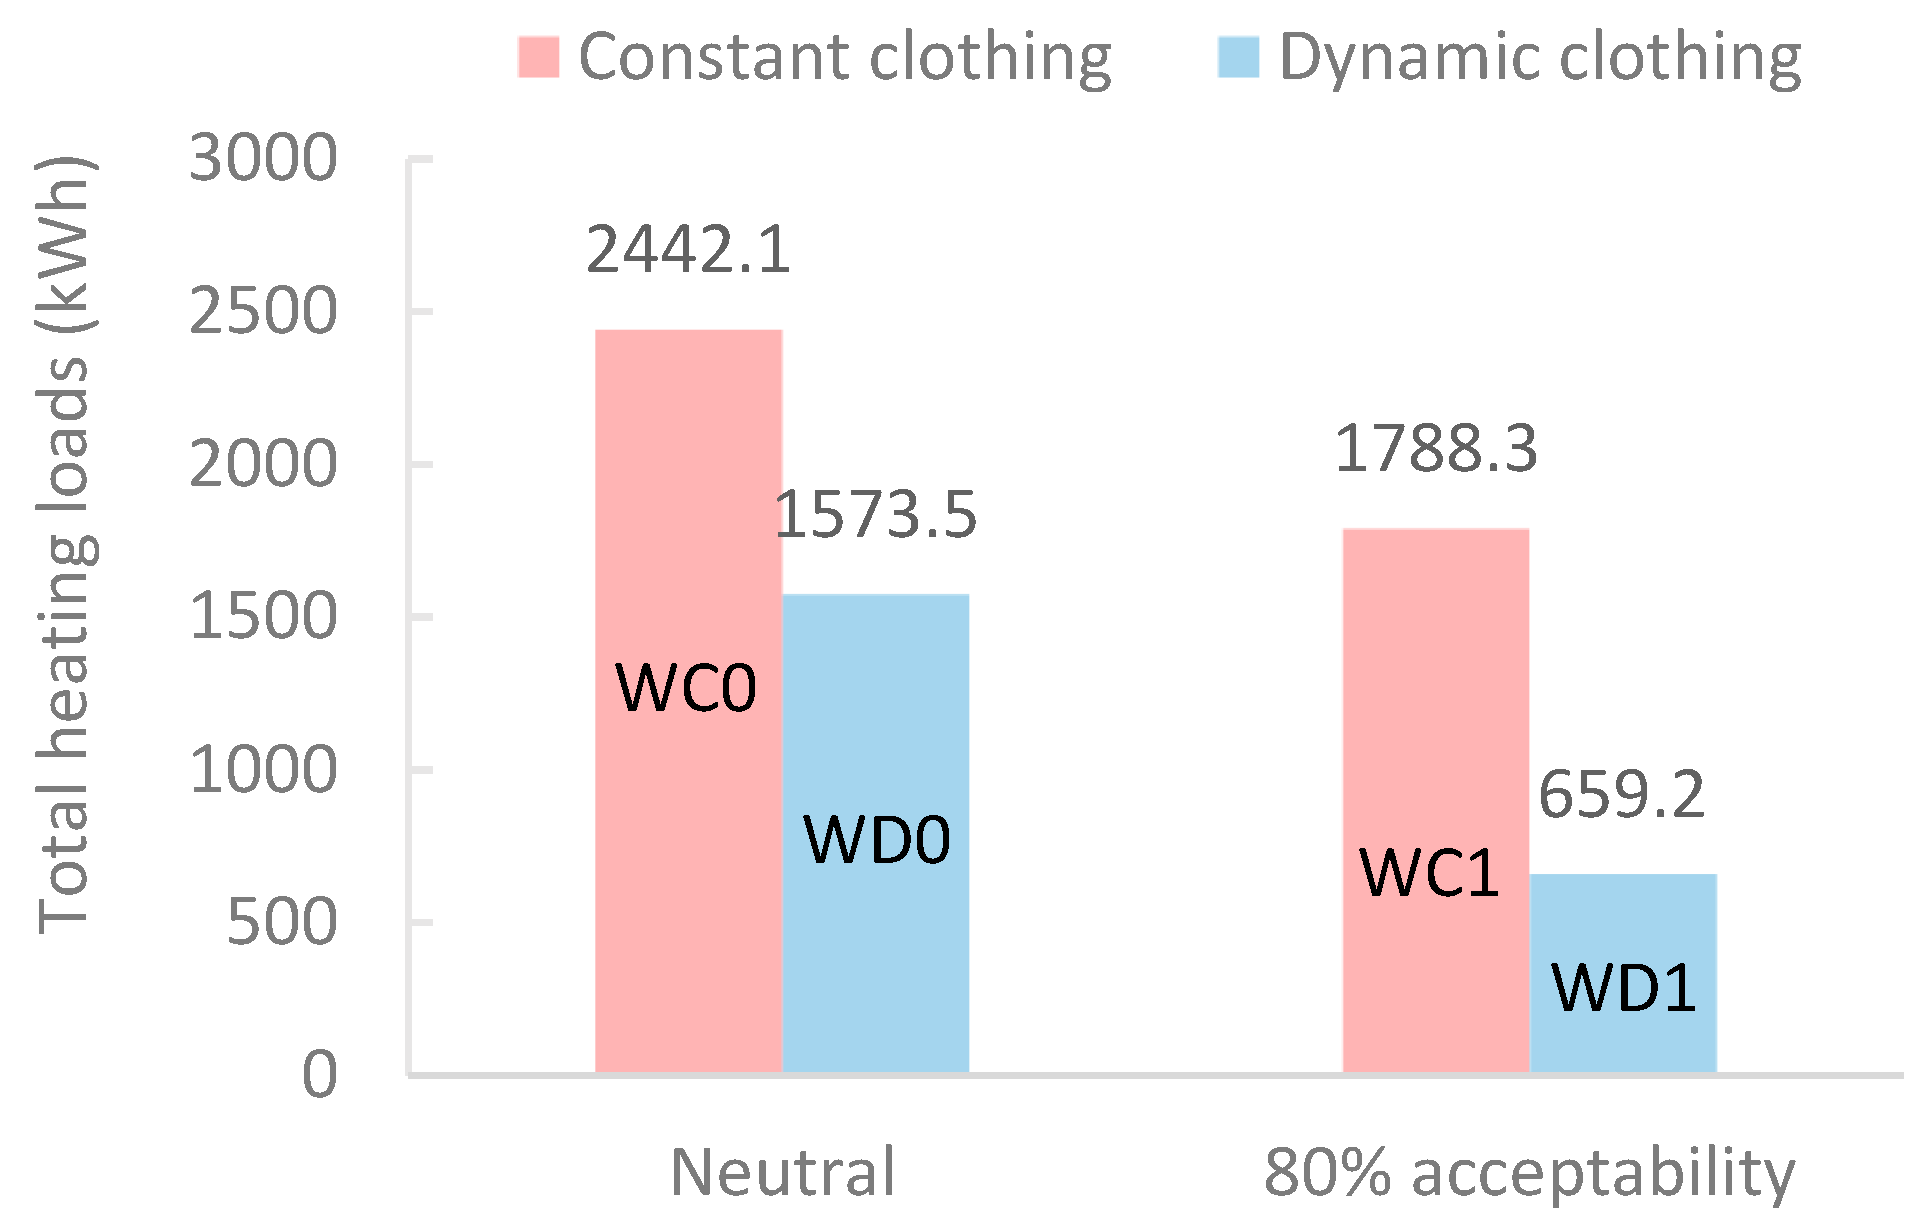
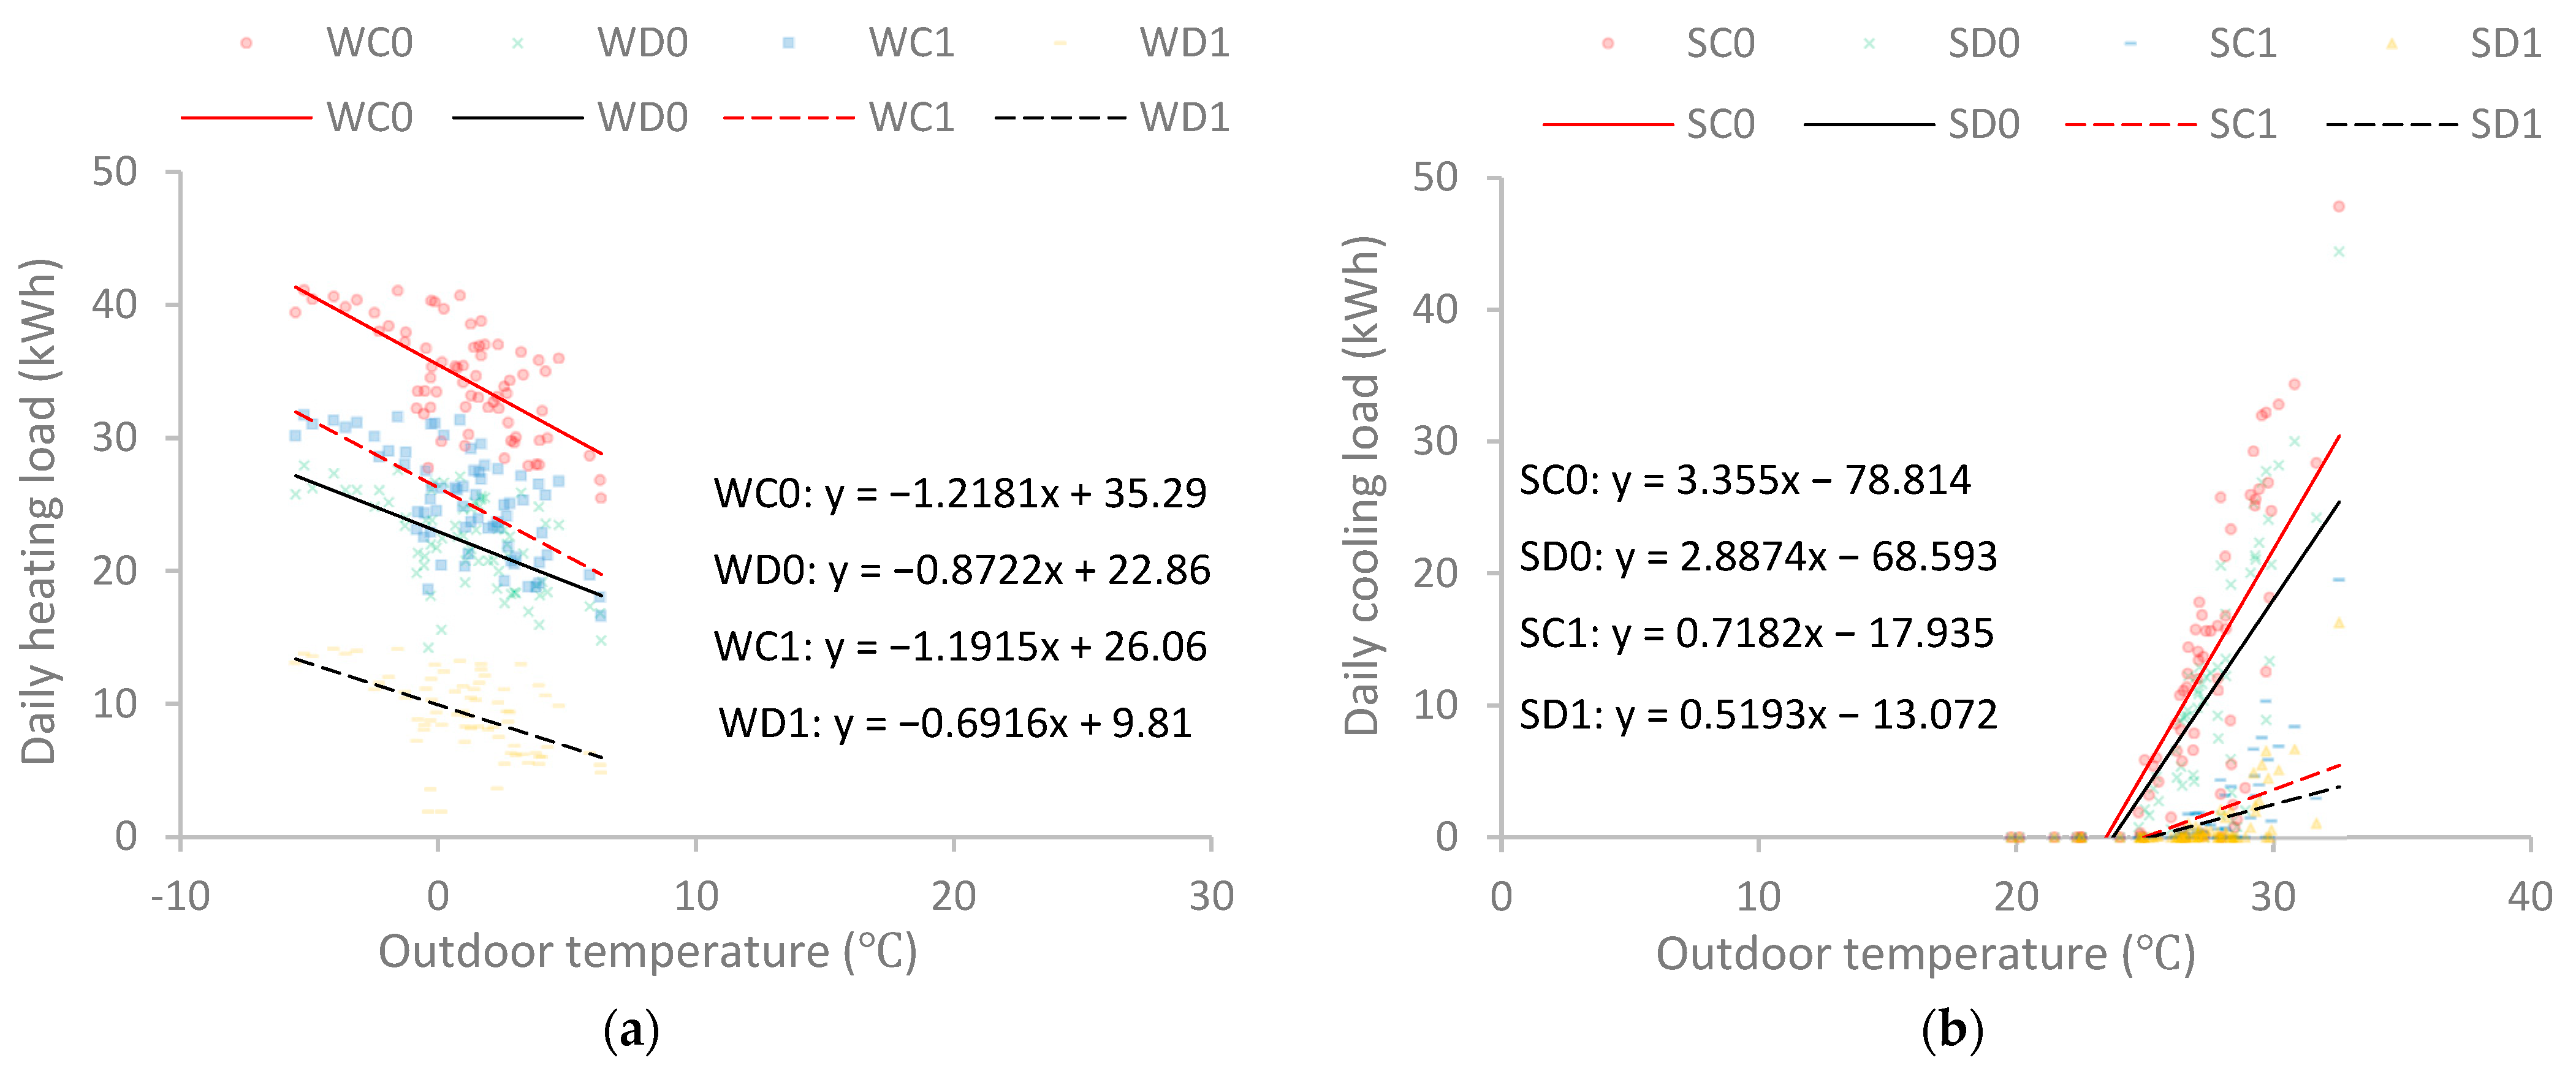
3.3. Heating Loads
3.4. Cooling Loads
4. Discussion
4.1. Impact of Outdoor Temperature on Energy Use Reduction
4.2. Seasonal Differences in Energy Reduction
4.3. Rethinking Setpoint Temperatures
4.4. Research Limitations
5. Conclusions
- The influence of indoor clothing adaptations on indoor comfort temperature varied between winter and summer. During winter, indoor comfort temperature was on average reduced by 5.0 () and 6.7 (). Conversely, in summer, mean indoor comfort temperatures increased marginally by only 0.3 () and 0.2 ().
- The impact of indoor clothing adaptation on energy use was significant in both seasons. Peak loads were significantly reduced during the winter simulations, while the number of no-cooling days increased during the summer simulations. The total heating and cooling energy consumption could be reduced by 35.6% and 20.2%, respectively, under optimal thermal comfort conditions (). The energy use reduction was more significant with lower levels of thermal comfort requirements. The proportion of the reduction in total heating and cooling energy use increased to 63.1% and 34.4%, respectively, under the 80% acceptable thermal comfort conditions ().
- The climate-responsive indoor temperature control strategy based on indoor clothing adaptation and its significant impact on energy consumption suggested a viable approach for improving building energy efficiency in rural China and similar cost-sensitive contexts where economic factors, such as income and fuel costs, take precedence in decision-making regarding air conditioning. This approach leverages rural residents’ climate-responsive indoor clothing adaptation capability, providing acceptable indoor thermal environments while achieving significant energy reductions.
Author Contributions
Funding
Data Availability Statement
Conflicts of Interest
References
- Wu, W.; Skye, H.M.; Domanski, P.A. Selecting HVAC systems to achieve comfortable and cost-effective residential net-zero energy buildings. Appl. Energy 2018, 212, 577–591. [Google Scholar] [CrossRef] [PubMed]
- Li, Z.; Meng, Q.; Zhang, L.; Sun, Z.; Lei, Y.; Yang, L.; Yan, X. Dynamic room temperature setpoints of air-conditioning demand response based on heat balance equations with thermal comfort model as constraint: On-site experiment and simulation. J. Build. Eng. 2023, 65, 105798. [Google Scholar] [CrossRef]
- IEA. The Future of Cooling; OECD/IEA: Paris, France, 2018. [Google Scholar]
- Sánchez-García, D.; Bienvenido-Huertas, D.; Martínez-Crespo, J.; de Dear, R. Using setpoint temperatures based on adaptive thermal comfort models: The case of an Australian model considering climate change. Build. Environ. 2024, 258, 111647. [Google Scholar] [CrossRef]
- Sánchez-García, D.; Bienvenido-Huertas, D.; Pulido-Arcas, J.A.; Rubio-Bellido, C. Extending the use of adaptive thermal comfort to air-conditioning: The case study of a local Japanese comfort model in present and future scenarios. Energy Build. 2023, 285, 112901. [Google Scholar] [CrossRef]
- Wang, X.; Wang, D.; Chen, S.; Wu, J. Simulation of low energy consumption strategy for residential buildings in Hangzhou based on clustering behavior. AIP Conf. Proc. 2018, 1995, 020022. [Google Scholar]
- Zhao, W.; Chow, D.; Yan, H.; Sharples, S. Influential factors and predictive models of indoor clothing insulation of rural residents: A case study in China’s cold climate zone. Build. Environ. 2022, 216, 109014. [Google Scholar] [CrossRef]
- Benton, C. Sunset Building: A Study of Occupant Thermal Comfort in Support of PG&E’S Advanced Customer Technology Test (ACT2) or Maximum Energy Efficiency; Final Report, CEDR-06-94, CEDR; University of California: Berkeley, CA, USA, 1994. [Google Scholar]
- Xu, C.; Li, S.; Zhang, X.; Shao, S. Thermal comfort and thermal adaptive behaviours in traditional dwellings: A case study in Nanjing, China. Build. Environ. 2018, 142, 153–170. [Google Scholar] [CrossRef]
- Jiao, Y.; Yu, H.; Wang, T.; An, Y.; Yu, Y. Thermal comfort and adaptation of the elderly in free-running environments in Shanghai, China. Build. Environ. 2017, 118, 259–272. [Google Scholar] [CrossRef]
- Parsons, K.C. The effects of gender, acclimation state, the opportunity to adjust clothing and physical disability on requirements for thermal comfort. Energy Build. 2002, 34, 593–599. [Google Scholar] [CrossRef]
- Xu, X.; Liu, W.; Lian, Z. Dynamic indoor comfort temperature settings based on the variation in clothing insulation and its energy-saving potential for an air-conditioning system. Energy Build. 2020, 220, 110086. [Google Scholar] [CrossRef]
- Humphreys, R.M. An adaptive approach to the thermal comfort of office workers in North West Pakistan. Renew. Energy 1994, 5, 985–992. [Google Scholar] [CrossRef]
- Indraganti, M.; Boussaa, D. Comfort temperature and occupant adaptive behavior in offices in Qatar during summer. Energy Build. 2017, 150, 23–36. [Google Scholar] [CrossRef]
- Liu, W.; Deng, Q.; Ma, W.; Huangfu, H.; Zhao, J. Feedback from human adaptive behavior to neutral temperature in naturally ventilated buildings: Physical and psychological paths. Build. Environ. 2013, 67, 240–249. [Google Scholar] [CrossRef]
- Newsham, G.R. Clothing as a thermal comfort moderator and the effect on energy consumption. Energy Build. 1997, 26, 283–291. [Google Scholar] [CrossRef]
- Cao, B.; Luo, M.; Li, M.; Zhu, Y. Too cold or too warm? A winter thermal comfort study in different climate zones in China. Energy Build. 2016, 133, 469–477. [Google Scholar] [CrossRef]
- Sheng, X. Field Test and Analysis of Thermal Comfort at Rural Houses and Urban Residential Buildings in Severe Cold Region. Master’s Thesis, Engineering of Harbin Institute of Technology, Harbin, China, 2013. [Google Scholar]
- Wang, Z.; Ning, H.; Ren, J. Human thermal adaptation in severe cold area (1): Field study in residential buildings. Heat. Vent. Air Cond. 2015, 45, 73–78. [Google Scholar]
- Wang, Z. A field study of the thermal comfort in residential buildings in Harbin. Build. Environ. 2006, 41, 1034–1039. [Google Scholar] [CrossRef]
- Yoshino, H.; Guan, S.; Lun, Y.; Mochida, A.; Shigeno, T.; Yoshino, Y.; Zhang, Q. Indoor thermal environment of urban residential buildings in China: Winter investigation in five major cities. Energy Build. 2004, 36, 1227–1233. [Google Scholar] [CrossRef]
- Huang, L.; Zhu, Y.-X.; Ouyang, Q.; Cao, B. Field survey of indoor thermal comfort in rural housing of northern China in heating season. J. Southeast Univ. (Engl. Ed.) 2010, 26, 169–172. [Google Scholar]
- Fan, G.; Xie, J.; Yoshino, H.; Yanagi, U.; Hasegawa, K.; Wang, C.; Zhang, X.; Liu, J. Investigation of indoor thermal environment in the homes with elderly people during heating season in Beijing, China. Build. Environ. 2017, 126, 288–303. [Google Scholar] [CrossRef]
- Zhu, J.; Liu, J. Research on the indoor thermal environment of rural architecture in winter in northwestern areas. China Civ. Eng. J. 2010, 43, 400–404. [Google Scholar]
- Yan, H.; Yang, L.; Zheng, W.; Li, D. Influence of outdoor temperature on the indoor environment and thermal adaptation in Chinese residential buildings during the heating season. Energy Build. 2016, 116, 133–140. [Google Scholar] [CrossRef]
- Yan, H.; Li, D.; Li, H.; Chen, J.; Liu, H. Field study on indoor human thermal comfort in Nanyang rural residential buildings in winter. Heat. Vent. Air Cond. 2018, 48, 91–95. [Google Scholar]
- Li, J.; Yang, L.; Liu, J. Adaptive thermal comfort model for hot summer and cold winter zone. HV&AC 2008, 38, 20–24. [Google Scholar]
- Yang, Q. Study on the Indoor Thermal Comfort in the Cold Zone; Xi’an Architecture and Technology University: Xi’an, China, 2010. [Google Scholar]
- Fanger, P.O. Thermal Comfort. Analysis and Applications in Environmental Engineering; Danish Technical Press: Copenhagen, Denmark, 1970. [Google Scholar]
- ISO 7730; Ergonomics of the Thermal Environment—Analytical Determination and Interpretation of Thermal Comfort Using Calculation of the PMV and PPD Indices and Local Thermal Comfort Criteria. International Standardisation Organisation: Geneva, Switzerland, 2005.
- Mackey, C.C.W. Pan Climatic Humans: Shaping Thermal Habits in an Unconditioned Society. Ph.D. Thesis, Massachusetts Institute of Technology, Cambridge, MA, USA, 2015. [Google Scholar]
- Konis, K.; Gamas, A.; Kensek, K. Passive performance and building form: An optimization framework for early-stage design support. Sol. Energy 2016, 125, 161–179. [Google Scholar] [CrossRef]
- Fang, Y. Optimization of Daylighting and Energy Performance Using Parametric Design, Simulation Modeling, and Genetic Algorithms. Ph.D. Thesis, North Carolina State University, Raleigh, NC, USA, 2017. [Google Scholar]
- Ganji, H.B.; Utzinger, D.M.; Bradley, D.E. Create and Validate Hybrid Ventilation Components in Simulation using Grasshopper and Python in Rhinoceros. In Proceedings of the 16th International Building Simulation Conference, Rome, Italy, 2–4 September 2019. [Google Scholar]
- Tartarini, F.; Schiavon, S. Pythermalcomfort: A Python package for thermal comfort research. SoftwareX 2020, 12, 100578. [Google Scholar] [CrossRef]
- GB/T 50824-2013; Design Standard for Energy Efficiency of Rural Residential Buildings. MOHURD: Beijing, China, 2012.
- Passive House Institute. Criteria for the Buildings: Passive House—EnerPHit—PHI Low Energy Building; Passive House Institute: Darmstadt, Germany, 2023. [Google Scholar]
- EnergyPlus. Energyplus Version 22.1.0 Document: Engineering Reference; U.S. Department of Energy: Pittsburgh, PA, USA, 2022.
- Lawrie, L.K.; Drury, B.C. Development of Global Typical Meteorological Years (TMYx). Available online: http://climate.onebuilding.org (accessed on 20 February 2022).
- ASHRAE. ANSI/ASHRAE Standard 55-2020: Thermal Environmental Conditions for Human Occupancy. In American Society of Heating, Refrigerating and Air Conditioning Engineers; ASHRAE: Atlanta, GA, USA, 2020. [Google Scholar]
- Zhao, W. Adaptive Thermal Comfort and Behavioural Adaptation of Rural Residents and Their Energy-Saving Potentials: A Case Study in Lankao in the Cold Climate Zone of China. Ph.D. Thesis, University of Liverpool, Liverpool, UK, 2022. [Google Scholar]
- Rehfuess, E.; World Health Organization. Fuel for Life: Household Energy and Health; World Health Organization: Lyon, France, 2006. [Google Scholar]


| Envelope | U-Value | U-Value Limit |
|---|---|---|
| Exterior wall | 0.52 | 0.65 |
| Interior wall | 1.95 | \ |
| Roof | 0.30 | 0.50 |
| Ground floor | 0.34 | \ |
| Unit: W/(m2·K) | ||
| Winter Simulation Scenarios | Summer Simulation Scenarios | |||||||
|---|---|---|---|---|---|---|---|---|
| WC0 | WD0 | WC1 | WD1 | SC0 | SD0 | SC1 | SD1 | |
| Relative humidity | 60% | 60% | 60% | 60% | 60% | 60% | 60% | 60% |
| Air velocity | 0.02 m/s | 0.02 m/s | 0.02 m/s | 0.02 m/s | 0.24 m/s | 0.24 m/s | 0.24 m/s | 0.24 m/s |
| Metabolic rate | 1.2 met | 1.2 met | 1.2 met | 1.2 met | 1.0 met | 1.0 met | 1.0 met | 1.0 met |
| PMV | 0 | 0 | −0.85 | −0.85 | 0 | 0 | +0.85 | +0.85 |
| Clothing insulation | 1.0 clo | Dynamic | 1.0 clo | Dynamic | 0.46 clo | Dynamic | 0.46 clo | Dynamic |
| Winter | Summer | |||||||||
|---|---|---|---|---|---|---|---|---|---|---|
| Min | Max | Mean | S.D. | CV (RMSE) | Min | Max | Mean | S.D. | CV (RMSE) | |
| Constant clothing | 1.00 | 1.00 | 1.00 | 0.00 | 81.6% | 0.46 | 0.46 | 0.46 | 0.00 | 11.5% |
| Dynamic clothing | 1.72 | 1.93 | 1.82 | 0.05 | 0.39 | 0.45 | 0.41 | 0.01 | ||
| Unit: clo. | ||||||||||
| PMV | Scenario | Min | Max | Mean | Total | Energy Use Reduction |
|---|---|---|---|---|---|---|
| 0 | WC0 | 25.5 | 41.1 | 34.4 | 2442.1 | 868.6 |
| WD0 | 14.2 | 28.0 | 22.5 | 1573.5 | ||
| −0.85 | WC1 | 16.6 | 31.7 | 25.2 | 1778.3 | 1129.0 |
| WD1 | 2.0 | 14.2 | 9.3 | 659.2 |
| PMV | Scenario | Min | Max | Mean | Total | Energy Use Reduction |
|---|---|---|---|---|---|---|
| 0 | SC0 | 0.0 | 47.8 | 12.1 | 858.4 | 173.8 |
| SD0 | 0.0 | 44.4 | 9.6 | 684.6 | ||
| +0.85 | SC1 | 0.0 | 19.6 | 1.6 | 108.2 | 37.2 |
| SD1 | 0.0 | 16.3 | 1.0 | 71.0 |
Disclaimer/Publisher’s Note: The statements, opinions and data contained in all publications are solely those of the individual author(s) and contributor(s) and not of MDPI and/or the editor(s). MDPI and/or the editor(s) disclaim responsibility for any injury to people or property resulting from any ideas, methods, instructions or products referred to in the content. |
© 2024 by the authors. Licensee MDPI, Basel, Switzerland. This article is an open access article distributed under the terms and conditions of the Creative Commons Attribution (CC BY) license (https://creativecommons.org/licenses/by/4.0/).
Share and Cite
Zhuang, Z.; Liu, Z.; Chow, D.; Zhao, W. A Quantitative Investigation of the Impact of Climate-Responsive Indoor Clothing Adaptation on Energy Use. Buildings 2024, 14, 2311. https://doi.org/10.3390/buildings14082311
Zhuang Z, Liu Z, Chow D, Zhao W. A Quantitative Investigation of the Impact of Climate-Responsive Indoor Clothing Adaptation on Energy Use. Buildings. 2024; 14(8):2311. https://doi.org/10.3390/buildings14082311
Chicago/Turabian StyleZhuang, Zhaokui, Zhe Liu, David Chow, and Wei Zhao. 2024. "A Quantitative Investigation of the Impact of Climate-Responsive Indoor Clothing Adaptation on Energy Use" Buildings 14, no. 8: 2311. https://doi.org/10.3390/buildings14082311