Article

Evaluation of Carbon Neutrality Capacity of Regional Construction Industry Based on the Entropy Weight TOPSIS Model

1
Architectural Engineering Institute, Zhejiang College of Construction, Hangzhou 315000, China
2
School of Civil Engineering and Transportation, South China University of Technology, Guangzhou 510800, China
3
School of Materials Science and Engineering, Shanghai Jiao Tong University, No. 800 Dongchuan Road, Shanghai 200240, China
4
School of Materials Science and Engineering, Shanghai Institute of Technology, Shanghai 201418, China
*
Author to whom correspondence should be addressed.
Buildings 2024, 14(8), 2363; https://doi.org/10.3390/buildings14082363
Submission received: 28 May 2024 / Revised: 12 July 2024 / Accepted: 27 July 2024 / Published: 31 July 2024
(This article belongs to the Section Building Energy, Physics, Environment, and Systems)

Abstract

:
This study examines the overall needs of the green construction scheme with ‘carbon neutrality’ as the centre in the Zhejiang provincial green development target area. By aggregating and organising the construction and development data of Zhejiang Province, the entropy weight TOPSIS model is formed according to the statistical modelling for quantitative examination of the data, and the scientific assessment scheme of ‘carbon neutrality’ in the regional construction industry of Zhejiang Province is developed. This study aids in completely exhibiting and dynamically understanding the advancement of the ‘carbon neutral’ capacity of the urban construction industry. The objective is to discover the weak link in the advancement of carbon neutrality in several regional construction industries, which is of great relevance for further examining and forecasting the strategic outlook of carbon neutrality and modifying the planning of carbon neutrality strategy in special regional construction industries.

1. Research Purpose

1.1. Research Exploration and Analysis

Huang et al. (2022) [1] conducted a study on the evaluation of the carbon neutrality capacity of the regional construction industry using the entropy weight TOPSIS model. The authors emphasized the importance of assessing the carbon neutrality capacity of the construction industry, considering its significant contribution to greenhouse gas emissions. The authors proposed the entropy weight TOPSIS model as an effective approach to evaluate the carbon neutrality capacity of the construction industry at the regional level. The study provides valuable insights into promoting sustainable development in the construction industry by identifying regions with high carbon neutrality capacity [2]. Based on the entropy weight TOPSIS method, the carbon-neutral capacity of the building industry was evaluated comprehensively. Li Gang, Chi Guotai, and Cheng Yanqiu (2011) conducted a comprehensive evaluation of the carbon neutrality capacity of the construction industry using the entropy weight TOPSIS method [3]. The authors emphasized the need for a comprehensive assessment of the carbon neutrality capacity of the construction industry to guide the development of low-carbon strategies. The authors applied the entropy weight TOPSIS method to evaluate the carbon neutrality capacity of different construction enterprises and identified the key factors influencing carbon neutrality. The study contributes to the understanding of the carbon neutrality capacity of the construction industry and provides a basis for formulating effective carbon reduction policies. Fai, L.K., Lam, W.S., & Lam, W.H. (2022) [4]. Evaluation of carbon neutrality capacity of the construction industry based on the entropy weight TOPSIS model. Rahman, A., Fitri, Z., Zulkifli, Z., Ula, M., and Suhendra, B. (2022) conducted an evaluation of the carbon neutrality capacity of the construction industry using the entropy weight TOPSIS model [5]. The authors highlighted the significance of assessing the carbon neutrality capacity of the construction industry in achieving sustainable development goals. They proposed the entropy weight TOPSIS model as a practical tool for evaluating the carbon neutrality capacity of construction enterprises. The study provides a comprehensive analysis of the carbon neutrality capacity of the construction industry and offers insights into promoting low-carbon development in the industry.
Based on the above foreign research status, it can be seen that: the evaluation of the carbon neutrality capacity of the construction industry based on the entropy weight TOPSIS model has gained increasing attention in recent years. Scholars have recognized the importance of assessing the carbon neutrality capacity of the construction industry to guide sustainable development and formulate effective carbon reduction strategies. The entropy weight TOPSIS model has been widely adopted as a practical approach for evaluating the carbon neutrality capacity of construction enterprises at the regional level.
However, there are some shortcomings in the current research. First of all, although the research has involved the assessment of carbon-neutral capacity of different regions and enterprises, there are still some differences in the selection of methods and indicators, and there is a lack of unified evaluation standards. Secondly, most studies only focus on the quantitative assessment of carbon-neutral capacity, and relatively few studies focus on the implementation and effect assessment of carbon-neutral strategies. In addition, most current studies focus on the enterprise-level research [6], and the assessment of the carbon-neutral capacity of the entire building industry still needs to be deeply discussed.
To sum up, the evaluation of the carbon neutrality capacity of the building industry based on the entropy weight TOPSIS model is an important research area, which has attracted extensive attention from scholars. Future research should further unify the evaluation indicators and methods, strengthen the implementation of carbon-neutral strategy and effect evaluation research, and expand the scope of research to the entire construction industry, so as to provide more operational and practical guidance and promote the transformation of the construction industry to low-carbon development.
To discover the creation of a functional, scientific and reasonable statistical monitoring index scheme with great operability [7], the regional green construction scheme is a main strategic measure to accelerate the modernisation of regional construction around the current issue of ‘carbon neutrality’ and to advance the establishment of China’s infrastructure power as a smart construction power. In addition, to investigate the creation of a fully functional, scientific, reasonable and highly operational statistical monitoring system, thoroughly exhibiting the status of the adoption of the intelligent construction strategy is important to understand the promotion of the carbon neutrality capacity of the construction industry in various regions dynamically, discover the weak links in the advancement of the carbon neutrality strategy of the green construction region, examine and forecast the strategic look of green intelligent construction and modify the several plans of regional green intelligent construction in a targeted way [1].

1.2. The Problem and Significance of the Study

This study concentrates on developing a thorough evaluation system for carbon neutrality capacity in the regional construction industry. This study encompasses examining several green, civilisation, management, development and intelligent construction indicators in Zhejiang Province to choose scientifically sound, measurable statistical indicators. This study aims to evaluate quantitatively the carbon neutrality capability of the construction industry in Zhejiang Province through the application of mathematical models and data analysis. Establishing this evaluation system is vital for developing standards and executing intelligent construction practices in the region [3,8].

2. Research Status

2.1. The Development and Research Status of Domestic Index System

China has constantly highlighted the prominence of ‘carbon neutrality’ and has concentrated on dual-carbon efforts in the construction industry across several regions. An analysis of domestic literature exposes that while substantial focus is on carbon neutrality management in the construction industry, the assessment of actual carbon neutrality capacity remains in the early stages [9]. The necessity of developing a complete, effective theoretical evaluation system for evaluating the carbon neutrality capacity of the construction industry is urgent, stressing the critical, timely importance of scientifically assessing carbon neutrality. Focusing on the general requirements of achieving carbon neutrality, and aiming at the overall objectives, tasks and stage arrangements of construction projects in each region, diversified evaluation and comprehensive analysis are carried out on industrial indicators, ecological indicators, governance indicators, characteristic indicators, energy-saving indicators, intelligent construction indicators, etc., and a comprehensive evaluation system is formed, as shown in Figure 1.

2.2. The Development of Foreign Index System

The carbon neutrality standard is a pressing challenge for all countries to solve [10]. As a key concern in the world today, specific evaluation standards are observed for carbon neutrality capability in the international context. In the aspect of evaluation, Melissa Yves Oliveira’s agriculture industry evaluation index system is a representative one. Numerous carbon calculator models are assessed and categorised to supply helpful information for choosing the most applicable calculator for numerous agricultural systems. Farm-scale calculators enable farmers to regulate greenhouse gas emissions and lessen them by implementing viable agricultural practices. Landscape-scale calculators are beneficial in greater areas with dissimilar land use and agricultural practices [4,5,11]. AgRE Calc, Cool Farm Tool and Solagro Carbon Calculators are most suitable for approximating greenhouse gas emissions from agricultural activities. Byeongho Lee [8] explored the idea of ‘carbon carrying capacity’ and accordingly recommended an environmental viability evaluation tool. Moreover, Ali, J., Bashir, Z., Rashid, T. [11] developed a wide-ranging risk assessment model using the fuzzy comprehensive evaluation method, and the appraisal system of the Greenship rating tool also possesses vital influences. Scholars from other countries have accumulated a large amount of research results on the carbon neutrality capacity evaluation mechanism of other industries [2,12].

3. Carbon Neutrality Capacity Evaluation Mechanism—The Entropy Weight TOPSIS Method

On the basis of deciding on a scientific, systematic index system, the entropy weight method is employed to determine the weight of the index, and the TOPSIS method is used to acquire the score of the implementation of carbon neutrality policy in each county with the aid of the weight and data of the index [13]. In this manner, the implementation influence of carbon neutrality policy can be intuitively envisioned, problems can be recognised based on the evaluation mechanism, and policies can be modified in time.

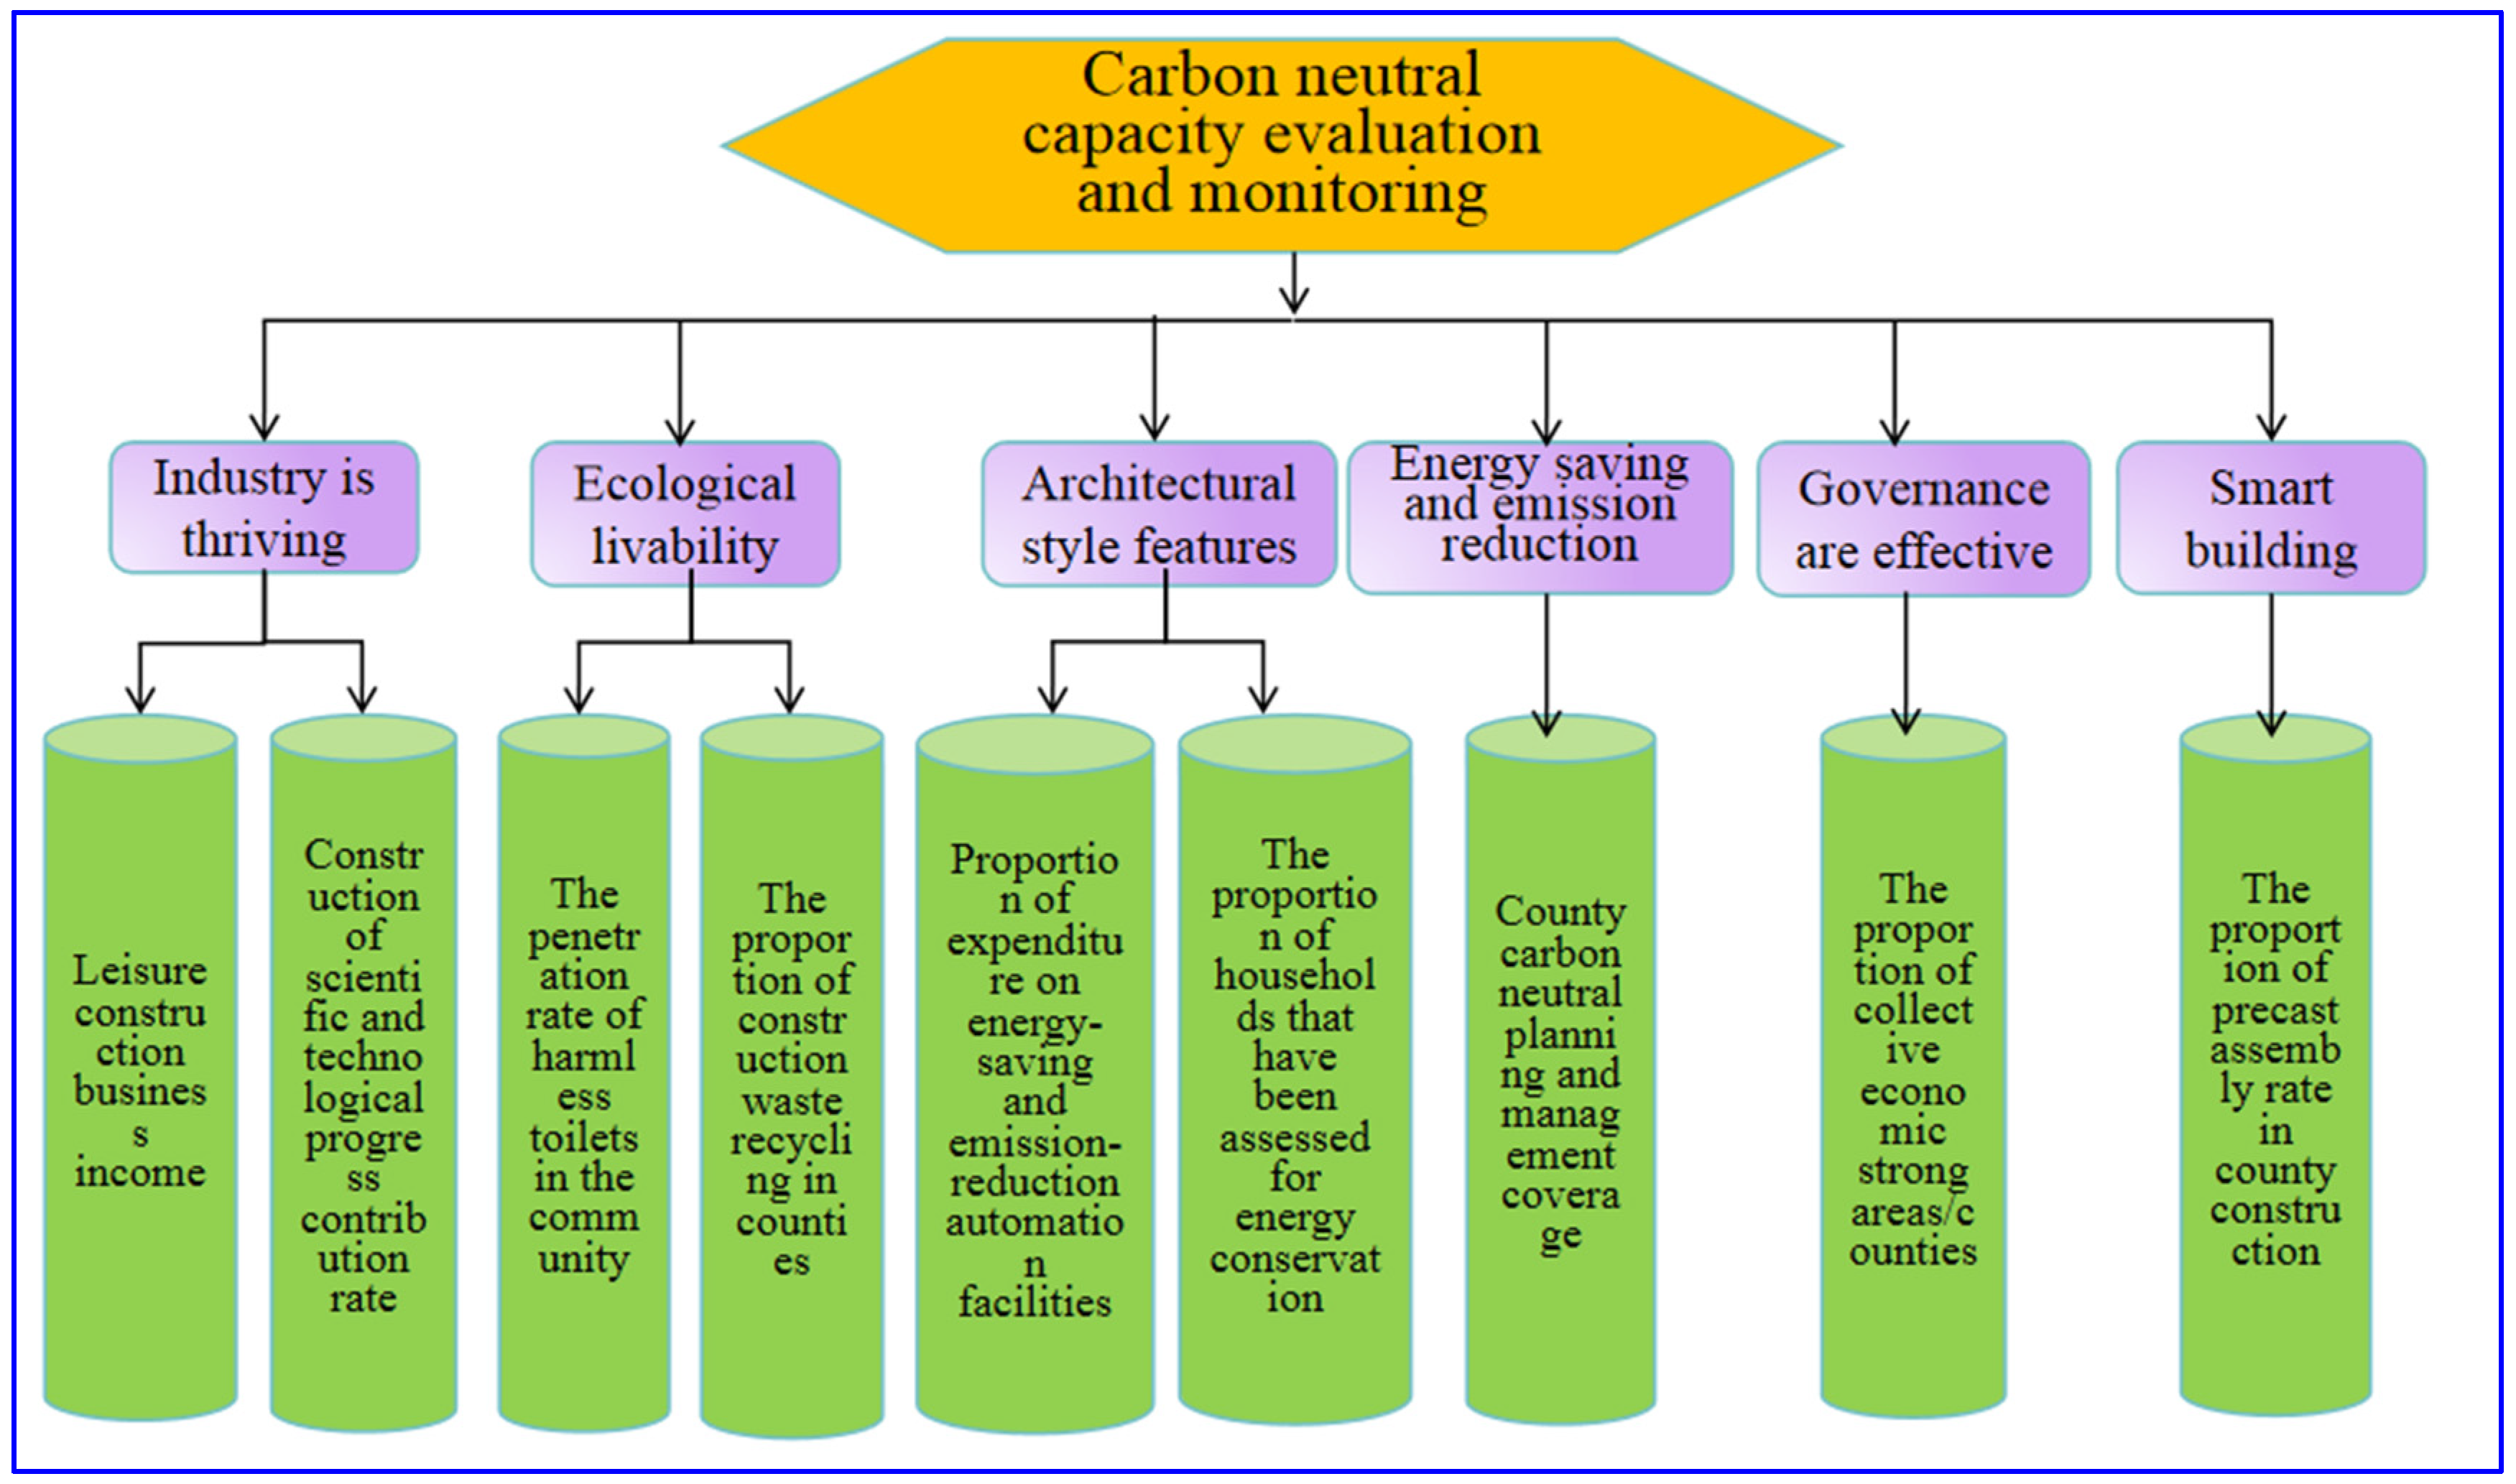
3.1. The Selection of Indicators Should Meet the Overall Requirements

The Party’s 20th National Congress suggested advancing ‘carbon peak carbon neutrality’ to improve the competence to promote green, low-carbon development effectively and to adopt the general requirements of double carbon, that is, achieving carbon peak and carbon neutrality based on the new development stage, implementing the new development concept, building a new development pattern and attaining a high-quality development. At the critical phase of comprehensively establishing a modern socialist country, this intrinsic necessity needs to be translated into a realistic path of high-quality development. First, we need to adjust to the new sequence of technological and industrial changes distinguished by information technology, digitisation, intelligent and low-carbon transformation, advance the innovative application and iterative development of green and low-carbon technologies [14], and facilitate the revolution of economic growth momentum and power reconstruction. Second, we should work as one to accomplish several goals, such as emission reduction, industrial transformation, economic growth and industrial safety. With manufacturing as the centre and industrial parks as the carrier, we should change the industrial construct from a high-carbon consumption to a low-carbon, energy-saving one [15]. Third, we should conform to the evolutionary trend of the demand structure and boost the modification of the demand structure towards low-carbon consumption, low-carbon investment and low-carbon trade. Fourth, consistent with the general planning of the country and the idea of regional policies, we must encourage the organised decrease of regional emissions to attain the peak [16]. Fifth, we must achieve an equilibrium between lowering carbon emissions and meeting people’s requirements for an improved life and collaboratively advance the enhancement of living standards and the achievement of carbon emission reduction targets through cultural guidance, technological progress, commodity structure adjustment and excellent demonstration.
This study chooses the six dimensions of industrial prosperity, ecological liveability, construction wind characteristics, effective governance, energy conservation and emission reduction and intelligent construction as the criterion layers. Thirty indicators, such as the proportion of high-standard occupancy, the level of construction mechanisation, the construction rate of the construction industry, the Engel coefficient of county residents, the afforestation coverage rate of county residents, the penetration rate of harmless toilets in the community, contribution rate of construction science and technology progress and prefabrication rate of county construction, are chosen as the index layer to develop a thorough evaluation system for the carbon neutrality capacity of the construction industry [6,17,18,19]. The dimension level indicators in the comprehensive evaluation model were selected, as presented in Table 1.
The research objects were chosen through the literature review and field visits, concentrating on the ‘National Standardisation Development Outline’ declared by the CPC Central Committee and The State Council on the creation of sound carbon peak and carbon neutrality standards. Fifteen counties with carbon neutrality cultural heritage and digital advances were picked as the research objects, such as the Jiaojiang District of Taizhouy, Longwan District of Wenzhou and Nanhu District of Jiaxing.

3.2. Collection and Sorting of Indicator Data

Data for the chosen regional construction industry metrics were gathered from official sources such as the National Statistical Yearbook, the Ministry of Housing and Urban–Rural Development of China and Zhejiang Construction Information Port. The latest or statistical mean data for each region were selected to guarantee the authenticity and timeliness of the dataset [20]. This method improved the accuracy and efficacy of the carbon neutrality capacity monitoring system for the regional construction industry [21].

3.3. Entropy Weight TOPSIS Evaluation Model

The entropy weight TOPSIS method is an objective approach that employs the original data and removes subjectivity. This method reflects the weight coefficients of the index layer and the gap between the data of the evaluation object and the ideal solution. This method designates scores to the evaluation object, which in this case is the carbon neutrality ability of the construction industry in each region. The goal is to obtain accurate assessment results through quantitative analysis, facilitating better adjustment and enhancing the carbon neutrality capacity target [7].

3.3.1. Standardised Processing of Indicator Data

This work concentrates on determining the initial matrix T = w t j for the indicator data, where w t j is the j th initial value of the t leading county. Fuzzy membership degrees are employed to standardise the index [22]. Through the standardisation of indicators, the value of the original data is regulated within 0–1; that is, compared with the original data, it has the same scale, and the entropy weight TOPSIS method is more impartial and sound for the determination of the entropy weight of indicators and the assessment of the implementation influence of the annual carbon neutrality policy. The standardisation of indicators can be split into positive standardisation and negative standardisation. The positive indicator indicates that the higher the value of the indicator, the better the implementation of the carbon neutrality policy. The negative index is the opposite. According to the indicators of this subject, except for the business income of the leisure construction industry and the Engel coefficient of county residents, the other indicators are positive indicators. Based on this method [23], y t j is set as the standardised value of the t index of the jth evaluation object, and n is the number of objects to be assessed. Then, the indicators can be standardised through the normalisation Formula (1) for positive indicators and the standardisation Formula (2) for negative indicators.
y t j = w t j             m i n                         w t j                       1 j n m a x   w t j                               m i n   w t j                 1 j n                                       1 j n                    
y t j = m a x                         w t j             w t j         1 j n                                                           m a x                         w t j             m i n                         w t j                 1 j n                                           1 j n                    
With the aid of the initially gathered indicator data, the data were preprocessed according to the above standardised data processing method. Part of the data after the preprocessing of the indicator data are presented in Table 2.

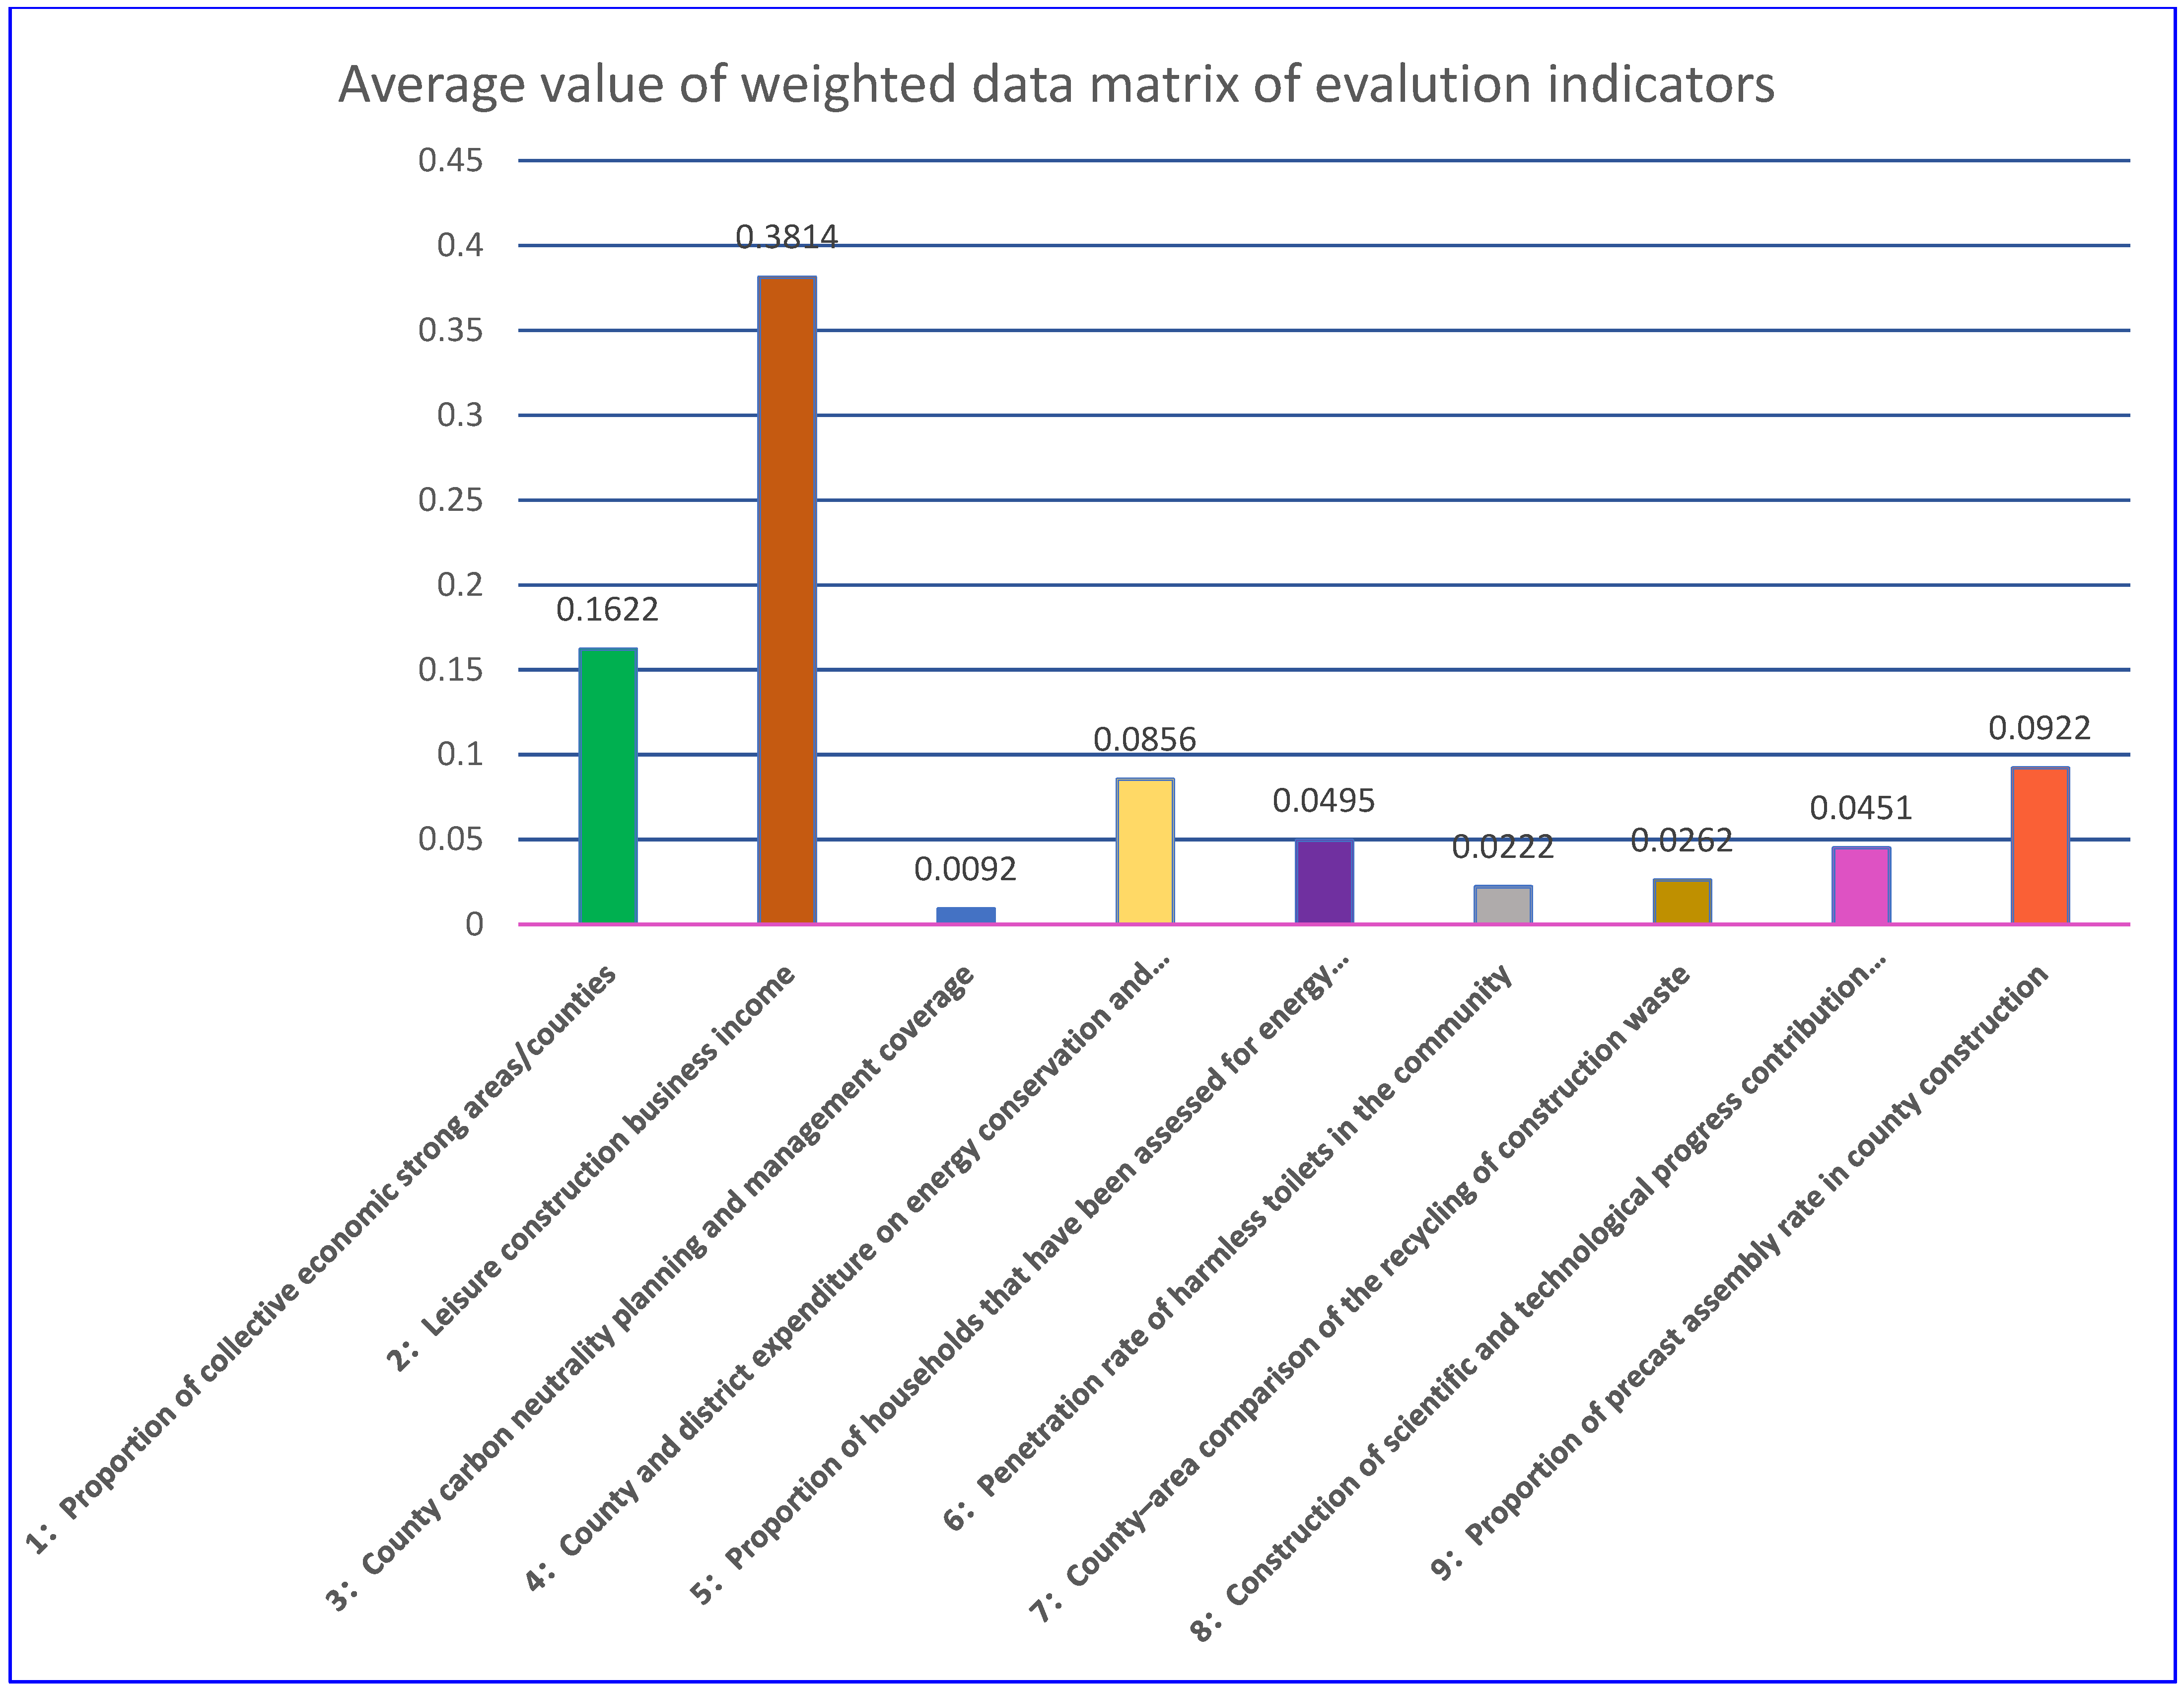
3.3.2. Entropy Value of Carbon Neutrality Capacity Evaluation System Index

Based on the quantitative requirements of the carbon neutrality capacity evaluation system for the work evaluation of the regional construction industry and given the mutual independence of the indicators, the entropy weight method was employed to obtain the entropy value of the indicators. In information theory, entropy is a measure of uncertainty. The higher the uncertainty, the higher the entropy and the more information it contains. In the entropy weight method, the characteristics of the entropy value can be employed to determine the dispersion degree of the carbon neutrality capacity degree index. The higher the dispersion degree of the index, the higher the effect of the index on the evaluation system of the regional construction industry, that is, the higher the weight. This type of quantitative determination of the importance of indicators has greater accuracy and more powerful objectivity. Based on the relationship between the actual situation and the indicators collected [24], 9 of the 30 indicators were chosen as the evaluation index system with accurate data sources and long-term development goals, such as the proportion of prefabricated assembly rate in counties and districts, the penetration rate of harmless toilets and the proportion of households that conducted energy conservation assessment after placing into use in the community. The composition system of the index layer of entropy weight is shown in Figure 2.
The equation for obtaining the corresponding entropy and weight coefficient of an index is as follows: Let e j be the entropy of the j th index, and S t j be the characteristic gravity of the Jth index in the i th system.
S t j = w t j i = 1 n w t j                                         e j = 1 ln n i 1 n s t j ln S t j
where i = 1 n w t j is the sum of all system observation data of the Jth index.
Let the difference coefficient of indicator j be q j and the weight coefficient of 30 indicators be s j . The equation is expressed as follows:
q j = 1 e j s j = q j j = 1 30 w t j
With the aid of preprocessing indicator data, Python software 3-V was used to compute the difference coefficient and weight coefficient of indicators, and the outcomes are presented in Table 3.
The weight coefficient of the proportion of collectively economically powerful areas/counties is the greatest, representing its highest importance in the evaluation system for carbon neutrality capability [25]. Conversely, the weight coefficient of the county–district point ratio for the reuse of construction waste is the smallest, demonstrating its lesser effect on the evaluation system. The notion of entropy weight is confirmed by these results, where higher weights are assigned to indicators with greater data dispersion. This outcome emphasises the value of accurate, diverse data in attaining indicator importance within the assessment system.

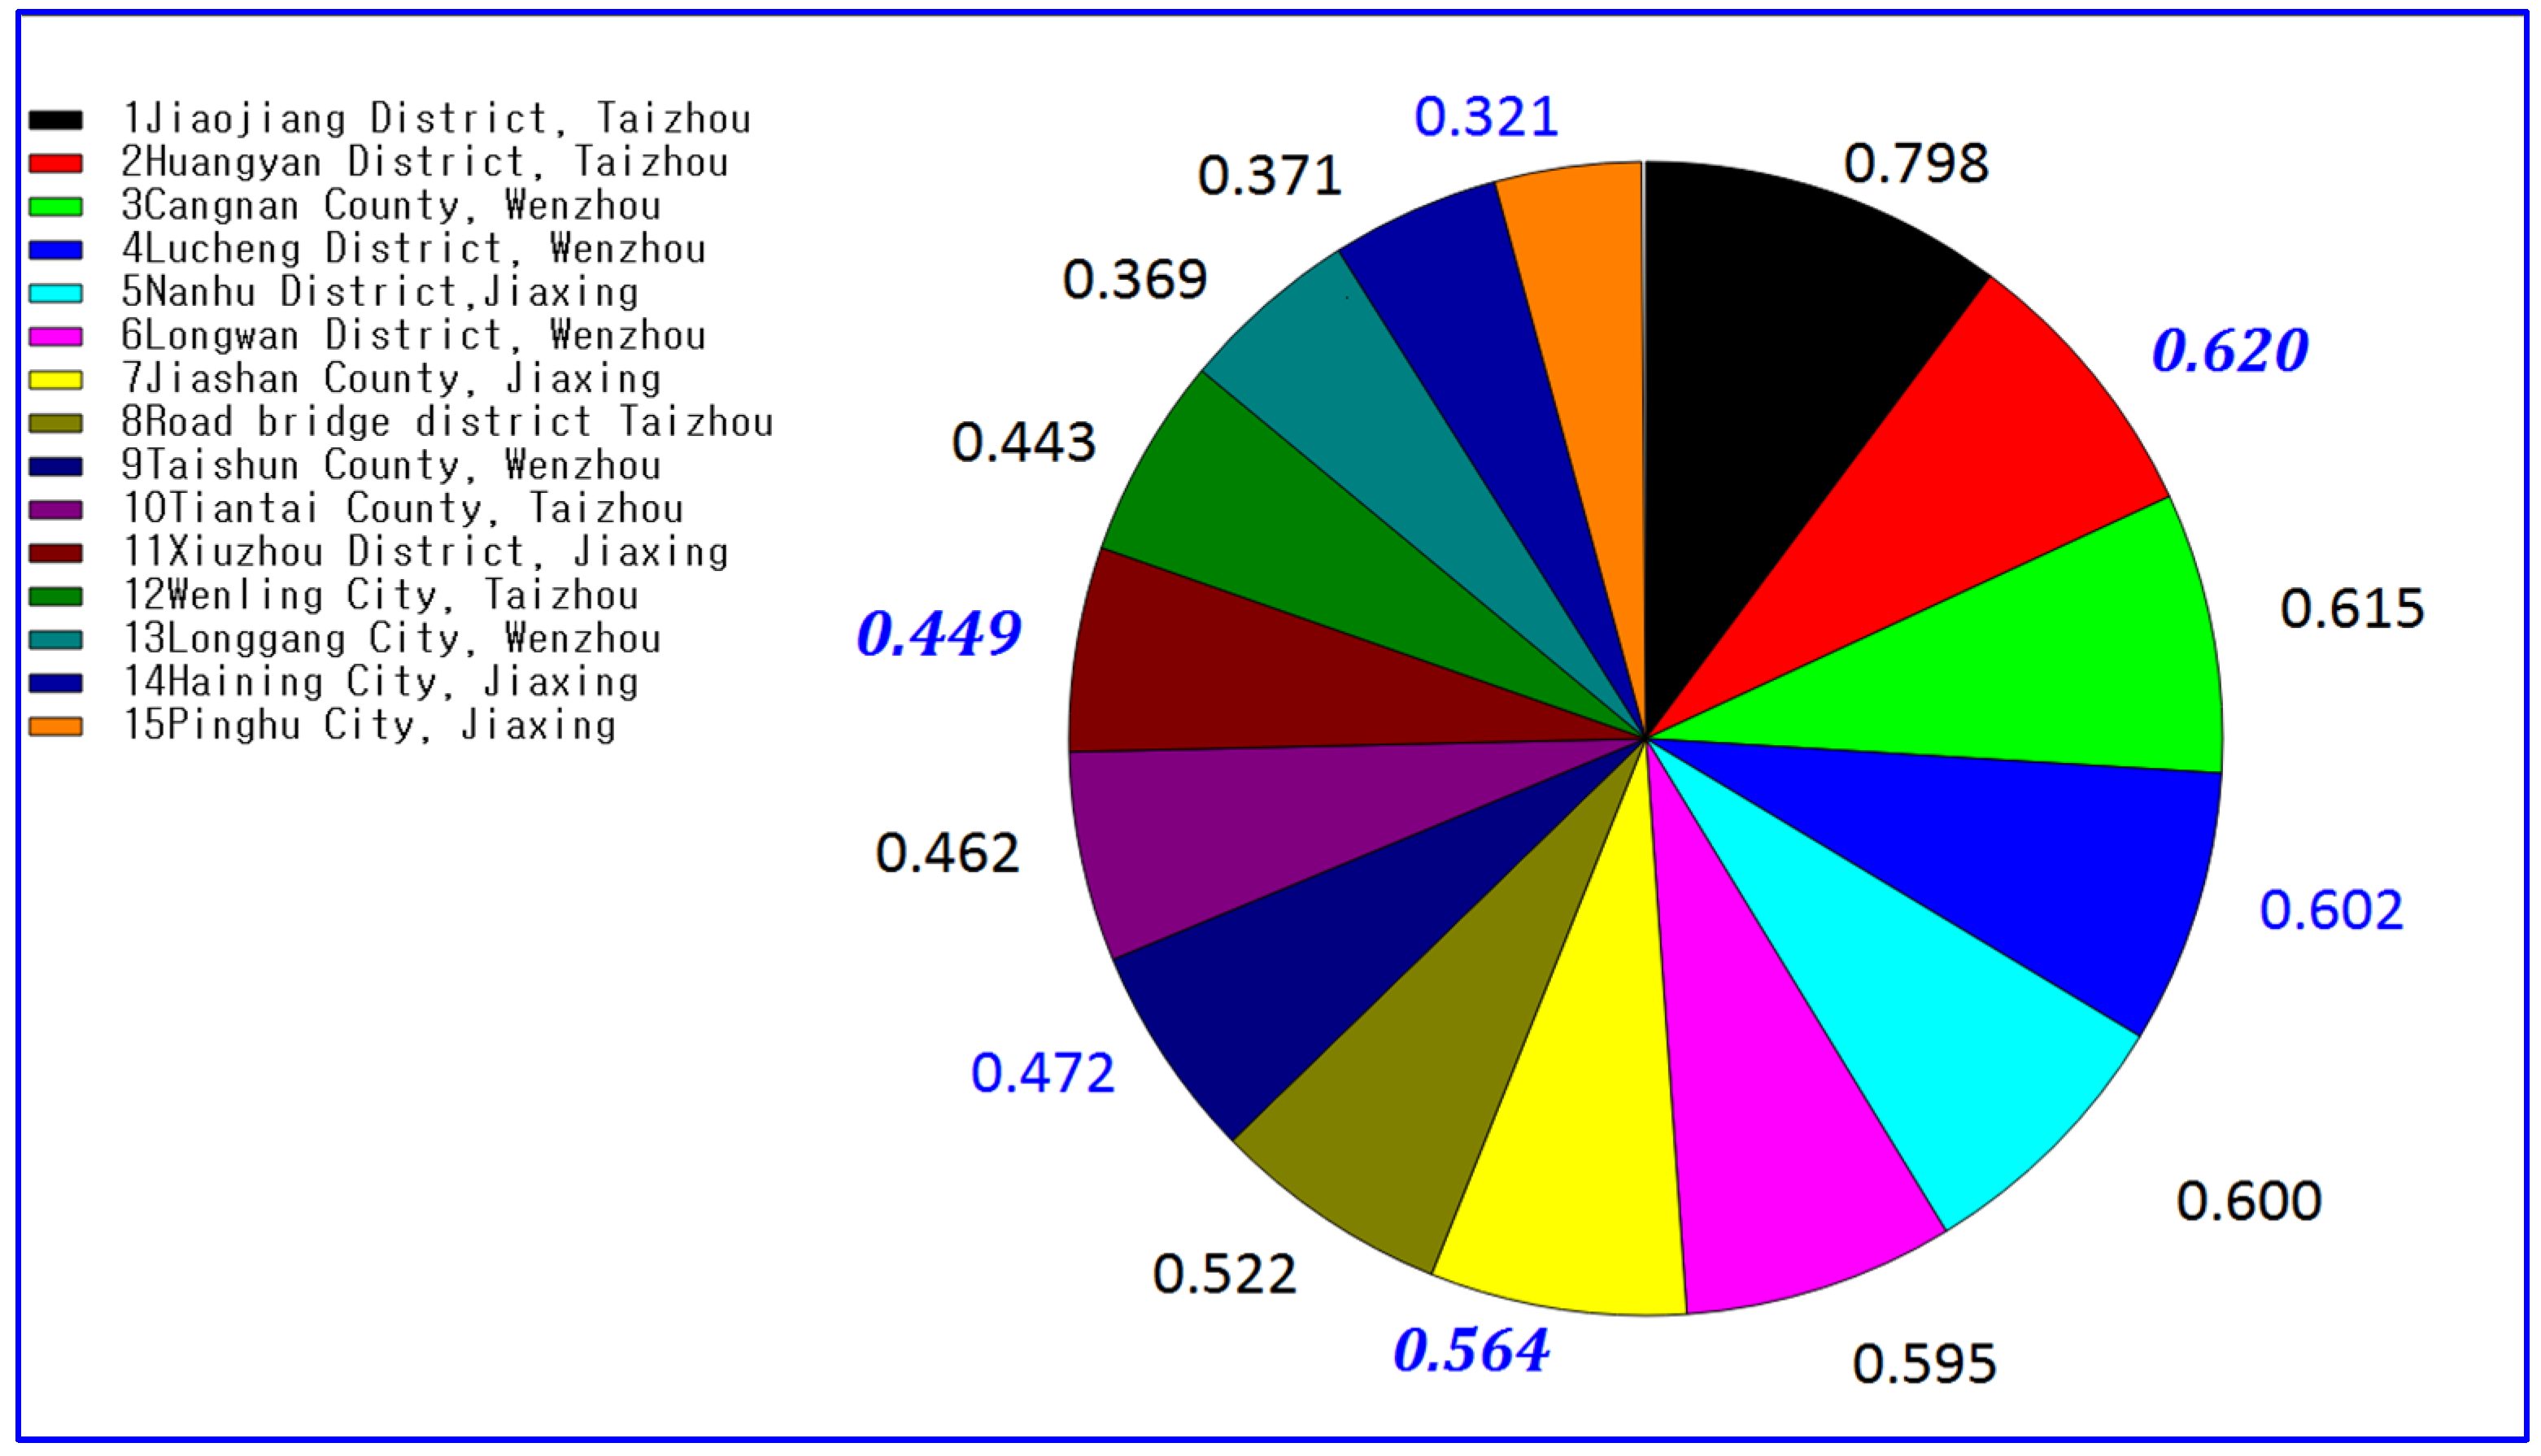
3.3.3. Scores of Carbon Neutrality Capacity Evaluation of the Construction Industry in Each Region

To reflect the carbon neutrality capacity development index of the leading county quantitatively, the weighted value of each indicator data can be known by multiplying the index data and the index weight, stressing the variation in the importance of each indicator and optimising and enhancing the carbon neutrality capacity evaluation mechanism. Z i j is set as the weighted value of the standardised data of the j th indicator in the i leading area, the normalised value of the observation value of the j th indicator in the i leading area and   S j the weight coefficient. According to the above weighted method, the following equation is derived:
Z i j = Q i j s j
With the help of standardised index data and index weights, the data matrix weighted by evaluation indicators can be computed, and the results are presented in Table 4.
Based on the actual condition of the evaluation system, the TOPSIS method is employed to determine the close degree between the development indicators and the ideal solution. In the index system, the maximum value of the positive evaluation index and the minimum value of the negative evaluation index are chosen to develop the ideal optimal solution in the evaluation system and vice versa, and the worst solution is formed. The ideal optimal solution and the worst solution are also positive and negative ideal solutions [26].
Let d i + be the Euclidean distance between the i th leading county and the positive ideal solution, and d i be the Euclidean distance between the i th leading county and the negative ideal solution. Then, the following equations are derived:
d i + = ( y 1 + y i 1 ) 2 + ( y 2 + y i 2 ) 2 + + ( y 30 + y i 30 ) 2
d i = ( y 1 y i 1 ) 2 + ( y 2 y i 2 ) 2 + + ( y 30 y i 30 ) 2
Using the above formula, the distance to the positive and negative ideal solutions corresponding to each leading county can be determined (Table 5).
In the carbon neutrality capability assessment system, to determine the development of each leading county quantitatively, that is, the carbon neutrality development index of the leading county, the notion of relative proximity degree is presented, and f i is set as the proximity degree to the positive ideal solution of each indicator system of the i pioneer county, whose f i value is the carbon neutrality development index of each leading county. The formula is as follows:
f i = d i d i + d i + ,
where i = 1, 2, …, n. For the carbon neutrality development index, if the index system of the leading county is close to the positive ideal solution and far from the negative ideal solution, then f i → 1, and its carbon neutrality ability development index is higher; conversely, if f i → 0, then its carbon neutrality ability development index is lower. Therefore, based on the value of f i in descending order, the precedence counties are ranked. The higher the f i value, the higher the ranking, signifying higher development level of carbon neutrality capacity of the leading county; the smaller the f i value, the lower the ranking, representing lower development level of carbon neutrality capacity of the leading county [27]. With the data, weights and post standardisation of indicators, Python software was used to compute the scores of the leading counties and districts. Finally, the carbon neutrality ability evaluation index results were derived, as detailed in Table 6.
Examining the carbon neutrality ability evaluation index of the leading counties reveals that Jiaojiang District of Taizhou has the highest score, followed by Huangyan District of Taizhou and Cangnan County of Wenzhou. In the middle are Jiashan County of Jiaxing, Taizhou Luqiao District, Haining City of Jiaxing and Pinghu City of Jiaxing.

4. Analysis and Suggestion of Carbon Neutrality Capacity Evaluation System

Based on the establishment of the carbon neutrality capacity assessment and monitoring system with the entropy weight TOPSIS method [28], the weight coefficient of the index and the evaluation index of the construction industry in each region can be determined to examine quantitatively the development strengths of the leading counties with high scores and the development deficiencies of the leading counties with low scores to generate more comprehensive and systematic development suggestions. To visualise the indicator data and the final score results of each leading county and district, pie charts were created, as shown in Figure 3.
This pie chart analysis and the evaluation index show that the proportion of households evaluated for energy conservation and the contribution of construction science and technology progress after the residential district is placed into use varies very much among the leading counties. Moreover, the data are discrete, while other indicators are opposite. The scores reveal that Taizhou Jiaojiang and Huangyan rank higher, and Jiaxing Haining and Jiaxing Pinghu rank lower. To facilitate the determination of the indicator data level of each leading county, the average of the corresponding data of each indicator was calculated, and the results are presented in Figure 4.
The standardised index data and weights corresponding to Jiaojiang District of Taizhou reveal that all the index data exceed the mean.

5. Conclusions

The data in Table 3, Table 4, Table 5 and Table 6 and Figure 4 illustrate that the corresponding weighted index value of 0.3814 of the business income index of the leisure construction industry with the highest weight is much greater than the mean value of 0.0694. Similarly, the weighted index value of 0.0650 for the contribution rate of construction science and technology progress is much greater than the mean value of 0.0451. Moreover, the whole analysis of all weighted index values shows that Jiaojiang District of Taizhou is the closest to the optimal ideal solution. Moreover, for the carbon neutrality planning and management coverage of the least-weighted counties, the weighted index value is greater than the average value. In summary, Jiaojiang District of Taizhou achieved the highest score in the carbon neutrality capability evaluation and monitoring system. In addition, Jiaojiang District of Taizhou is in Taizhou City, one of China’s intelligent construction pilot cities. Situated in the economically developed Zhejiang Province, it is appropriate for the development of construction and production and is the leading county with the most development potential. Hence, in executing the carbon neutrality capacity policy, attention must be given to indicators with high weight coefficients, such as actively advancing the business income of the leisure construction industry and raising the output rate of business buildings to the actual place [29,30,31,32]. Moreover, raising the investment in the research and development of construction science and technology and enhancing the contribution rate of construction scientific and technological progress can improve the production output of the construction industry and lessen labour costs. In this manner, the evaluation index of the carbon neutrality capacity evaluation monitoring system in the first county can be systematically enhanced [33].
The spotlight should be on enhancing the local economic environment and human conditions by raising business housing adaptability and investing in energy-saving automation facilities [34,35,36]. This approach will encourage urban renewal and improve the contribution of scientific progress to the construction industry. Modifying carbon neutrality planning management coverage based on the evaluation system can assist in preserving the current levels while decreasing the burden.
Future research can be carried out from the following aspects: First, the research sample can be further expanded to cover more regions and construction types, so as to improve the universality and representativeness of the research results. Secondly, we can consider introducing more indicators to evaluate the carbon-neutral capacity of the construction industry, such as resource utilization efficiency, building energy efficiency, etc., in order to evaluate the carbon-neutral capacity more comprehensively. In addition, the synergistic development of carbon neutrality in the construction industry and other industries can be deeply studied, and the role and influence of carbon neutrality in regional sustainable development can be explored. Finally, the innovation and application of carbon-neutral technology can be further explored to promote the improvement of carbon-neutral capacity. Research and development and application of carbon-neutral technology can be carried out in depth to explore new technologies and methods, such as carbon capture and storage technology, carbon trading market, etc., to improve the carbon-neutral capacity of the construction industry. In addition, cooperation with other fields, such as the energy industry and the transportation industry, can be strengthened to jointly promote the development of carbon neutrality.
At the same time, future research can also focus on the dynamics and sustainability of carbon-neutral capacity assessment. The evaluation of the carbon-neutral capacity of the construction industry should not be limited to the current situation, but also needs to consider its performance in terms of future development and sustainability. A dynamic evaluation model can be established to track and evaluate the changes in the carbon-neutral capacity of the construction industry, and corresponding improvement measures and policy support can be proposed to promote the sustainable development of carbon-neutral capacity.
In addition, future research could also explore the relationship between carbon neutrality and economic development. We can further study the interaction mechanism between the carbon-neutral capacity of the construction industry and economic development and explore how to improve the carbon-neutral capacity of the construction industry while under economic development, so as to achieve a win–win situation between the economy and the environment.
In short, future research can be carried out in the aspects of sample expansion, index improvement, technological innovation, dynamic evaluation and economic development, so as to further deepen the research on the evaluation of the carbon-neutral capacity of the regional construction industry, provide more scientific and accurate decision-making basis for the government, enterprises and all sectors of society, promote the development of the construction industry in the direction of carbon neutrality and achieve the goal of sustainable development.

Author Contributions

Conceptualization, Z.S. and L.W.; methodology, H.M.; software, Y.Z.; validation, Z.S., L.W. and Y.Z.; formal analysis, Y.Z.; investigation, Z.S.; resources, Z.S.; data curation, H.M.; writing—original draft preparation, Z.S.; writing—review and editing, H.M.; visualization, L.W.; supervision, Y.Z.; project administration, Z.S.; funding acquisition, Z.S. All authors have read and agreed to the published version of the manuscript.

Funding

The authors appreciate the financial support from Research Project of Zhejiang Provincial Department of Education (Grant Number: 2023QN154).

Data Availability Statement

The data used in this study are available upon reasonable request from the corresponding author.

Conflicts of Interest

The authors declare no conflicts of interest.

References

  1. Huang, L.; Deng, S.; Zhou, Z.; Zou, C.; Li, X. Construction of evaluation index system of regional red cultural tourism resources based on G1-entropy weight method. J. Ningde Norm. Univ. 2021, 139, 42–50. [Google Scholar]
  2. Wang, Y.; Chardonnet, J.-R.; Merienne, F. Enhanced cognitive workload evaluation in 3D immersive environments with TOPSIS model. Int. J. Hum.-Comput. Stud. 2021, 147, 102572. [Google Scholar] [CrossRef]
  3. Li, G.; Chi, G.; Cheng, Y. Evaluation model of human all-round Development based on entropy weight TOPSIS. J. Syst. Eng. 2011, 26, 400–407. (In Chinese) [Google Scholar]
  4. Fai, L.K.; Lam, W.S.; Lam, W.H. Financial Network Analysis on the Performance of Companies Using Integrated Entropy–DEMATEL–TOPSIS Model. Entropy 2022, 24, 1056. [Google Scholar] [CrossRef]
  5. Rahman, A.; Fitri, Z.; Zulkifli, Z.; Ula, M.; Suhendra, B. Analysis of the Teacher’s Role in Evaluation of Student Learning Performance Using the TOPSIS Model (Case Study of Smk Negeri 1 Lhokseumawe). J. Inform. Telecommun. Eng. 2022, 5, 452–462. [Google Scholar] [CrossRef]
  6. Aikhuele, D.; Turan, F. An Integrated Fuzzy Dephi and Interval-Valued Intuitionistic Fuzzy M-Topsis Model for Design Concept Selection. Pak. J. Stat. Oper. Res. 2017, 13, 425–438. [Google Scholar] [CrossRef]
  7. Raihan, A. The contribution of economic development, renewable energy, technical advancements, and forestry to Uruguay’s objective of becoming carbon neutral by 2030. Carbon Res. 2023, 2, 20. [Google Scholar] [CrossRef]
  8. Lam, W.H.; Lam, W.S.; Liew, K.F.; Lee, P.F. Decision Analysis on the Financial Performance of Companies Using Integrated Entropy-Fuzzy TOPSIS Model. Mathematics 2023, 11, 397. [Google Scholar] [CrossRef]
  9. Forouzandeh, S.; Rostami, M.; Berahmand, K. A Hybrid Method for Recommendation Systems based on Tourism with an Evolutionary Algorithm and Topsis Model. Fuzzy Inf. Eng. 2022, 14, 26–50. [Google Scholar] [CrossRef]
  10. Bai, Y. Forest management based on the TOPSIS model. Highlights Sci. Eng. Technol. 2023, 44, 279–286. [Google Scholar] [CrossRef]
  11. Ali, J.; Bashir, Z.; Rashid, T. On distance measure and TOPSIS model for probabilistic interval-valued hesitant fuzzy sets: Application to healthcare facilities in public hospitals. Grey Syst. Theory Appl. 2021, 12, 197–229. [Google Scholar] [CrossRef]
  12. Mandal, T.; Saha, S.; Das, J.; Sarkar, A. Groundwater depletion susceptibility zonation using TOPSIS model in Bhagirathi river basin, India. Model. Earth Syst. Environ. 2021, 8, 1711–1731. [Google Scholar] [CrossRef]
  13. Banihashemi, S.A.; Khalilzadeh, M. Evaluating Efficiency in Construction Projects with the TOPSIS Model and NDEA Method Considering Environmental Effects and Undesirable Data. Iran. J. Sci. Technol. Trans. Civ. Eng. 2021, 46, 1589–1605. [Google Scholar] [CrossRef]
  14. Ortíz-Barrios, M.; Petrillo, A.; De Felice, F.; Jaramillo-Rueda, N.; Jiménez-Delgado, G.; Borrero-López, L. A Dispatching-Fuzzy AHP-TOPSIS Model for Scheduling Flexible Job-Shop Systems in Industry 4.0 Context. Appl. Sci. 2021, 11, 5107. [Google Scholar] [CrossRef]
  15. Forouzandeh, S.; Berahmand, K.; Nasiri, E.; Rostami, M. A Hotel Recommender System for Tourists Using the Artificial Bee Colony Algorithm and Fuzzy TOPSIS Model: A Case Study of TripAdvisor. Int. J. Inf. Technol. Decis. Mak. 2020, 20, 399–429. [Google Scholar] [CrossRef]
  16. Pazhuhan, M.; Shiri, N. Regional tourism axes identification using GIS and TOPSIS model (Case study: Hormozgan Province, Iran). J. Tour. Anal. Revista de Análisis Turístico 2020, 27, 119–141. [Google Scholar] [CrossRef]
  17. Oz, N.E.; Mete, S.; Serin, F.; Gul, M. Risk assessment for clearing and grading process of a natural gas pipeline project: An extended TOPSIS model with Pythagorean fuzzy sets for prioritizing hazards. Hum. Ecol. Risk Assess. Int. J. 2018, 25, 1615–1632. [Google Scholar] [CrossRef]
  18. Yurdakul, M.; İç, Y.T. Comparison of Fuzzy and Crisp Versions of an AHP and TOPSIS Model for Nontraditional Manufacturing Process Ranking Decision. J. Adv. Manuf. Syst. 2019, 18, 167–192. [Google Scholar] [CrossRef]
  19. Najafabadi, R.M.; Ramesht, M.H.; Ghazi, I.; Khajedin, S.J.; Seif, A.; Nohegar, A.; Mahdavi, A. Identification of natural hazards and classification of urban areas by TOPSIS model (case study: Bandar Abbas city, Iran). Geomat. Nat. Hazards Risk 2016, 7, 85–100. [Google Scholar] [CrossRef]
  20. Sofuoğlu, M.A. A Fuzzy Behavioral TOPSIS Model in Manufacturing Environment. Adv. Eng. Forum 2019, 31, 70–80. [Google Scholar] [CrossRef]
  21. Mukherjee, A.B.; Krishna, A.P.; Patel, N. Application of Remote Sensing Technology, GIS and AHP-TOPSIS Model to Quantify Urban Landscape Vulnerability to Land Use Transformation; Springer: Singapore, 2018. [Google Scholar]
  22. Huovila, A.; Siikavirta, H.; Rozado, C.A.; Rökman, J.; Tuominen, P.; Paiho, S.; Hedman, Å; Ylén, P. Carbon-neutral cities: Critical review of theory and practice. J. Clean. Prod. 2022, 341, 130912. [Google Scholar] [CrossRef]
  23. Wen, L.; Zhang, J.; Song, Q. A scenario analysis of Chinese carbon neutral based on STIRPAT and system dynamics model. Environ. Sci. Pollut. Res. 2022, 29, 55105–55130. [Google Scholar] [CrossRef] [PubMed]
  24. Chen, Z.; Dayananda, B.; Fu, B.; Li, Z.; Jia, Z.; Hu, Y.; Cao, J.; Liu, Y.; Xie, L.; Chen, Y.; et al. Research on the Potential of Forestry’s Carbon-Neutral Contribution in China from 2021 to 2060. Sustainability 2022, 14, 5444. [Google Scholar] [CrossRef]
  25. Mallapaty, S. How China could be carbon neutral by mid-century. Nature 2020, 586, 482–483. [Google Scholar] [CrossRef] [PubMed]
  26. Rosa, L.; Sanchez, D.L.; Mazzotti, M. Assessment of carbon dioxide removal potential via BECCS in a carbon-neutral Europe. Energy Environ. Sci. 2021, 14, 3086–3097. [Google Scholar] [CrossRef]
  27. Maurya, P.K.; Mondal, S.; Kumar, V.; Singh, S.P. Roadmap to sustainable carbon-neutral energy and environment: Can we cross the barrier of biomass productivity? Environ. Sci. Pollut. Res. Int. 2021, 28, 49327–49342. [Google Scholar] [CrossRef] [PubMed]
  28. Algarvio, H. The Role of Local Citizen Energy Communities in the Road to Carbon-Neutral Power Systems: Outcomes from a Case Study in Portugal. Smart Cities 2021, 4, 840–863. [Google Scholar] [CrossRef]
  29. Causone, F.; Tatti, A.; Alongi, A. From Nearly Zero Energy to Carbon-Neutral: Case Study of a Hospitality Building. Appl. Sci. 2021, 11, 10148. [Google Scholar] [CrossRef]
  30. Nieuwenhuijsen, M.J. Urban and transport planning pathways to carbon neutral, liveable and healthy cities; A review of the current evidence. Environ. Int. 2020, 140, 105661. [Google Scholar] [CrossRef]
  31. Vaka, M.; Walvekar, R.; Rasheed, A.K.; Khalid, M. A review on Malaysia’s solar energy pathway towards carbon-neutral Malaysia beyond COVID-19 pandemic. J. Clean. Prod. 2020, 273, 122834. [Google Scholar] [CrossRef] [PubMed]
  32. Ravetz, J.; Neuvonen, A.; Mäntysalo, R. The new normative: Synergistic scenario planning for carbon-neutral cities and regions. Reg. Stud. 2020, 55, 150–163. [Google Scholar] [CrossRef]
  33. Bedulli, C.; Lavery, P.S.; Harvey, M.; Duarte, C.M.; Serrano, O. Contribution of Seagrass Blue Carbon Toward Carbon Neutral Policies in a Touristic and Environmentally-Friendly Island. Front. Mar. Sci. 2020, 7, 1. [Google Scholar] [CrossRef]
  34. Mandova, H.; Patrizio, P.; Leduc, S.; Kjärstad, J.; Wang, C.; Wetterlund, E.; Kraxner, F.; Gale, W. Achieving carbon-neutral iron and steelmaking in Europe through the deployment of bioenergy with carbon capture and storage. J. Clean. Prod. 2019, 218, 118–129. [Google Scholar] [CrossRef]
  35. Balany, F.; Muttil, N.; Muthukumaran, S.; Wong, M.S.; Ng, A.W.M. Studying the Effect of Blue-Green Infrastructure on Microclimate and Human Thermal Comfort in Melbourne’s Central Business District. Sustainability 2022, 14, 9057. [Google Scholar] [CrossRef]
  36. Aksulu, I.; Wang, R. Contribution of Integrated Green District Heating to the Sustainable Cities: A Case Study of Ferrara, Italy. In Proceedings of the 2012 Second International Conference on Electric Technology and Civil Engineering, Washington, DC, USA, 18–20 May 2012; pp. 716–719. [Google Scholar]
Figure 1. Frame diagram of carbon neutrality capacity evaluation.
Buildings 14 02363 g001
Figure 2. Composition system of the index layer of entropy weight.
Buildings 14 02363 g002
Figure 3. Pie chart of indicator data and final score results of each leading county.
Buildings 14 02363 g003
Figure 4. Abar distribution of the mean values of the weighted data matrix for evaluation indicators.
Buildings 14 02363 g004
Table 1. Details of dimension level indicators in the comprehensive evaluation model.
Criterion LayerSerial NumberIndex Level
Thriving businesses1High-standard occupancy ratio
2Construction of scientific and technological progress contribution rate
3Level of construction mechanisation
4Ratio of the processing output value of building materials’ products to total construction output value
5Leisure construction business income
6Labour productivity of the construction industry
7Construction industry land construction rate
8Modern characteristic construction site demonstration area
Liveable life9Green coverage rate of the residential area
10Proportion of counties and districts that treat construction waste
11Proportion of counties and districts that reuse construction waste
12Comprehensive utilisation rate of human and animal manure
13Penetration rate of harmless toilets in the community
Architectural style features14Coverage rate of comprehensive cultural service centres in counties and districts
15Proportion of county-level and above characteristic buildings
16Proportion of construction management personnel with bachelor’s degree or above
17County and district expenditure on energy conservation and emission reduction automation facilities
18Proportion of households that have been assessed for energy conservation after the residential area has been placed into use
Effective governance19Proportion of collective economic strong areas/counties
20County carbon neutrality planning and management coverage
21Proportion of counties with carbon neutrality management service projects
22County grid social governance coverage
Energy conservation and emission reduction23County indoor air monitoring results up to standard rate
24Discharge rate of cooling and heating systems in county and district reaches the standard
25Engel coefficient of county residents
26Degree of standardisation of basic carbon neutrality services at the county level
Intelligent construction27Proportion of intelligent construction sites in counties and districts
28Proportion of precast assembly rate in county construction
29Proportion of construction site adopting intelligent management during construction
30Proportion of construction sites adopting intelligent technology in property management
Table 2. Index data after pretreatment.
Pioneer CountyProportion of Collective Economic Strong Areas/CountiesLeisure Construction Business IncomeCounty Carbon Neutrality Planning and Management CoverageCounty and District Expenditure on Energy Conservation and Emission Reduction Automation FacilitiesProportion of Households That Have Been Assessed for Energy Conservation after the Residential Area Has Been Put into UsePenetration Rate of Harmless Toilets in the CommunityProportion of Counties and Districts That Reuse Construction WasteConstruction of Scientific and Technological Progress Contribution RateProportion of Precast Assembly Rate in County Construction
Jiaojiang District, Taizhou0.640.350.790.710.310.741.010.680.73
Huangyan District, Taizhou0.510.530.900.670.270.680.850.150.21
Road Bridge District Taizhou0.450.510.910.800.210.820.750.300.92
Tiantai County, Taizhou0.900.760.980.380.120.800.720.820.22
Wenling City, Taizhou0.580.190.610.510.250.150.760.620.26
Lucheng District, Wenzhou0.520.350.880.460.271.010.430.710.23
Longwan District, Wenzhou0.620.050.810.170.990.980.580.801.00
Cangnan County, Wenzhou0.700.580.880.420.150.820.510.720.61
Taishun County, Wenzhou0.430.020.510.450.280.810.211.010.92
Longgang City, Wenzhou0.950.2600.620.240.740.050.620.68
Nanhu District, Jiaxing0.990.510.830.000.250.020.000.590.94
Xiuzhou District, Jiaxing0.520.620.870.910.270.870.510.420.23
Jiashan County, Jiaxing0.551.000.461.000.020.700.170.060.00
Pinghu City, Jiaxing0.510.521.020.820.160.870.570.000.36
Haining City, Jiaxing0.020.440.610.570.390.840.720.810.81
Table 3. Details of difference coefficients and weight coefficients of each index layer.
Index LevelDiversity FactorWeight Coefficient
Proportion of collective economic strong areas/counties0.02040.3022
Leisure construction business income0.00460.0696
County carbon neutrality planning and management coverage0.00100.0171
County and district expenditure on energy conservation and emission reduction automation facilities0.00900.1182
Proportion of households that have been assessed for energy conservation after the residential area has been put into use0.01160.1755
Penetration rate of harmless toilets in the community0.00320.0458
County–area comparison of the recycling of construction waste0.00320.0437
Construction of scientific and technological progress contribution rate0.00430.0650
Proportion of precast assembly rate in county construction0.01080.1610
Table 4. Data matrix weighted by evaluation indicators.
Pioneer CountyProportion of Collective Economic Strong Areas/CountiesLeisure Construction Business IncomeCounty Carbon Neutrality Planning and Management CoverageCounty and District Expenditure on Energy Conservation and Emission Reduction Automation Facilities
Jiaojiang District, Taizhou0.10500.01700.05220.0309
Huangyan District, Taizhou0.08310.02470.05930.0278
Road Bridge District, Taizhou0.07320.02280.05960.0345
Tiantai County, Taizhou0.14480.03520.06440.0165
Wenling City, Taizhou0.09100.00910.03920.0222
Lucheng District, Wenzhou0.08460.01630.05680.0196
Longwan District, Wenzhou0.10230.00180.05270.0067
Cangnan County, Wenzhou0.11340.02710.05790.0175
Taishun County, Wenzhou0.07020.00020.03310.0202
Longgang City, Wenzhou0.15280.01240.00040.0276
Nanhu District, Jiaxing0.16050.02330.05480.0003
Xiuzhou District, Jiaxing0.08580.02850.05790.0398
Jiashan County, Jiaxing0.08990.04640.03120.0433
Pinghu City, Jiaxing0.08020.02440.06520.0348
Haining City, Jiaxing0.00000.02070.03920.0248
Pioneer CountyProportion of Households That Have Been Assessed for Energy Conservation after the Residential Area Has Been Put into UsePenetration Rate of Harmless Toilets in the CommunityCounty–Area Comparison of the Recycling of Construction WasteConstruction of Scientific and Technological Progress Contribution RateProportion of Precast Assembly Rate in County Construction
Jiaojiang District, Taizhou0.05250.08830.01750.47550.2235
Huangyan District, Taizhou0.04920.07820.01440.11200.0602
Road Bridge District, Taizhou0.03480.09770.01240.22040.2742
Tiantai County, Taizhou0.02270.94380.01240.54890.0636
Wenling City, Taizhou0.04520.01850.01330.44220.0751
Lucheng District, Wenzhou0.04870.11830.00720.48270.0662
Longwan District, Wenzhou0.17520.11670.01030.55220.0301
Cangnan County, Wenzhou0.02810.09760.00870.47890.1873
Taishun County, Wenzhou0.04730.09780.00360.69030.2855
Longgang City, Wenzhou0.04380.08820.00050.44120.2024
Nanhu District, Jiaxing0.04370.00000.00000.40010.2814
Xiuzhou District, Jiaxing0.04920.10510.00850.28250.0721
Jiashan County, Jiaxing0.00000.08350.00220.04380.0000
Pinghu City, Jiaxing0.02870.10370.00940.00000.1049
Haining City, Jiaxing0.06920.10020.01230.55210.2448
Table 5. Distance from the antecedent zone to the positive and negative ideal solutions.
Pioneer CountyDistance to the Positive Ideal SolutionDistance to the Negative Ideal Solution
Jiaojiang District, Taizhou0.2510.402
Huangyan District, Taizhou0.4020.275
Road Bridge District, Taizhou0.2880.432
Tiantai County, Taizhou0.3920.367
Wenling City, Taizhou0.4100.248
Lucheng District, Wenzhou0.3820.322
Longwan District, Wenzhou0.1220.559
Cangnan County, Wenzhou0.2890.392
Taishun County, Wenzhou0.2770.447
Longgang City, Wenzhou0.2810.421
Nanhu District, Jiaxing0.3120.488
Xiuzhou District, Jiaxing0.3810.317
Jiashan County, Jiaxing0.5120.240
Pinghu City, Jiaxing0.3810.317
Haining City, Jiaxing0.3420.391
Table 6. Details of the carbon neutrality capacity evaluation index results of each leading county.
Pioneer CountyScore
Jiaojiang District, Taizhou0.798
Huangyan District, Taizhou0.620
Cangnan County, Wenzhou0.615
Lucheng District, Wenzhou0.602
Nanhu District, Jiaxing0.600
Longwan District, Wenzhou0.595
Jiashan County, Jiaxing0.564
Road Bridge District Taizhou0.522
Taishun County, Wenzhou0.472
Tiantai County, Taizhou0.462
Xiuzhou District, Jiaxing0.449
Wenling City, Taizhou0.443
Longgang City, Wenzhou0.396
Haining City, Jiaxing0.371
Pinghu City, Jiaxing0.321
Disclaimer/Publisher’s Note: The statements, opinions and data contained in all publications are solely those of the individual author(s) and contributor(s) and not of MDPI and/or the editor(s). MDPI and/or the editor(s) disclaim responsibility for any injury to people or property resulting from any ideas, methods, instructions or products referred to in the content.

