Article

Experimental Study on Improving the Performance of Cement Mortar with Self-Synthesized Viscosity-Reducing Polycarboxylic Acid Superplasticizer

Key Laboratory of Urban Security and Disaster Engineering of Ministry of Education, Beijing Key Laboratory of Earthquake Engineering and Structural Retrofit, Faculty of Architecture, Civil and Transportation Engineering, Beijing University of Technology, Beijing 100124, China
*
Author to whom correspondence should be addressed.
Buildings 2024, 14(8), 2418; https://doi.org/10.3390/buildings14082418
Submission received: 23 May 2024 / Revised: 8 July 2024 / Accepted: 3 August 2024 / Published: 5 August 2024
(This article belongs to the Section Building Materials, and Repair & Renovation)

Abstract

:
In this study, a viscosity-reducing polycarboxylic acid superplasticizer (VRPCE) was synthesized using methylallyl polyoxyethylene ether (HPEG), acrylic acid (AA), and maltodextrin maleic acid monoester (MDMA) as the main raw materials. The influences of the VRPCE on the microscopic properties of cement paste were studied by gel permeation chromatography (GPC), total organic carbon test (TOC), zeta potential, laser particle size analysis, XRD, MIP, TG, and SEM. Finally, the effects of the VRPCE on the macroscopic properties of cement mortar were evaluated through flow time, slump flow, compressive strength, shrinkage, and creep. The results showed that the VRPCE can improve the hydration degree of the cement, optimize the pore structure, increase the porosity, improve the fluidity, compressive strength, and creep, and decrease the shrinkage resistance of the cement mortar.

1. Introduction

In recent years, high-strength concrete has been widely used in infrastructure construction [1,2,3]. However, a large number of cementitious materials in the concrete resulted in high viscosity and poor fluidity of the fresh concrete. This problem made pumping construction of the high-strength concrete difficult, leading to frequent engineering accidents [4,5,6,7,8].
Polycarboxylic acid superplasticizer (PCE) has become an indispensable additive for the preparation of high durability concrete due to high water reducing rate and low shrinkage [9]. The main raw materials of PCE mainly include two parts. One part id anionic monomers with a double bond, such as acrylic acid, mercaptoacetic acid, etc. The other part is branched macromonomers with a double bond, including ester macromonomers and ether macromonomers [10,11]. On the one hand, PCE can effectively improve the pore structure and density of the concrete. On the other hand, it was able to reduce the slump loss of the concrete to a certain extent [12,13]. However, PCE also had a significant negative impact on the viscosity of high-strength concrete. If the amount of the PCE was increased to reduce the viscosity, the construction costs was certain to increase, and the fresh concrete showed bleeding and segregation as well [14,15,16,17]. Some studies have proven that this problem can be solved by combining the PCE with viscosity-reducing components. As an important component of the concrete, PCE exhibited promising designability in molecular structure. Thus, a PCE with low viscosity can be obtained by adjusting the material compositions, side chain structure, and functional groups [18,19,20,21].
The different components of the material have a crucial impact on the viscosity-reducing performance of the water-reducing agents. Zhang et al. [22] studied the effect of different PCEs on the viscosity of low water/binder ratio cementitious materials using the V-funnel flow time. The experimental results showed that the viscosity-reducing performance of the superplasticizer (SP) prepared by copolymerization of acrylic acid and polyethylene glycol monoallyl ether was 10% higher than that of the other two types of SPs in terms of the flow time and apparent viscosity of the cementitious material. Zhang et al. [23] studied the effects of dispersion media and SPs of fresh cement paste (FCP). The results revealed that the anionic SPs had the strongest adsorption capacity, the largest degree of dispersion, and the best effect on the rheological properties of the FCPs. Peng [24] synthesized a series of PCEs with almost the same polymerization degree and different molar ratios of methacrylic acid (MAA) and methyl methacrylate (MPEOM). When the molar ratio of the two materials above was 3.6:1, the PCE had better performance in improving the dispersion ability of the cement particles and reducing the apparent viscosity of cement suspension. He et al. [25] used self-synthesized PCE copolymers with different carboxyl densities to study the effect on the rheological behavior of the cement paste. The results elucidated that the high carboxyl density could promote the dispersion ability of the PCE. When the molar ratio of acrylic acid (AA) to methylallyl polyoxyethylene ether (HPEG) was 6.0, the initial fluidity (300 mm) and 1 h fluidity (350 mm) of the cement paste were both the highest.
The influence of side chain structure on the viscosity-reducing performance of a PCE is as follows. Plank [26] introduced the synthesis and performance of a new type of methacrylate-based PCE, which used polyethylene glycol side chains as hydroxyl end chains to replace the traditional methoxy end chains. The results showed that the ratio of the addition amount of the PCE to the adsorption amount was 48–67%. Huang et al. [27] used dimethylaminoethyl methacrylate as a monomer and initiator to obtain a hyperbranched structure through one-pot synthesis. Compared with traditional comb-shaped polycarboxylic acid-based water-reducing agents, the hyperbranched structure reduced the viscosity of the pore solution, slowed down the shear thickening behavior of the cement paste, and reduced the viscosity by 30%. Florent et al. [28] studied the fluidity as an independent variable of the adsorption function in sulfuric acid solutions containing a large amount of comb-shaped water-reducing agents under the condition of incomplete adsorption and synthesized polymers with different side chain lengths, grafting ratios, and anionic functions (carboxylates, dicarboxylates, and phosphates). The changes in anion function did not improve the fluidization efficiency and each PCE had approximately the same fluidization efficiency. Based on the innovative design of molecular structure, Qian [29] synthesized a new type of viscosity-reducing polycarboxylic acid superplasticizer (VRPCE) using maleic anhydride (MA), sodium methacrylate sulfonate (SMAS), H2O2, NaOH, and vitamin C. As the amount of the PCE increased from 0.6% to 1.2%, the viscosity decreased by 40%.
The effect of functional group modification on the viscosity-reducing performance of water-reducing agents is as follows. Janowska-Renkas [30] studied the effects of the chemical structures of four new generation high performance water-reducing agents with acrylic acid (SP-A, SP-B) and maleic acid (SP-C, SP-D) on the water-reducing efficiency in the cement paste. The analysis of the plastic viscosity values illustrated that SP-C and SP-D had better performance, compared to SP-A and SP-B, and SP-D (after 10 and 60 min) produced a plastic viscosity that was twice that of SP-A. Du [31] introduced a small amount of 2-capped1-phosphate ester containing olefin functional groups into the PCE molecules through free radical reaction based on the synthesis of ordinary PCE. After 40 min, the V-shaped funnel flow time and L-shaped box flow time of this new type of PCE were 20 min and 10 min shorter than those of the conventional PCE, indicating that the introduction of binary ester monomers with hydrophobic functional groups can achieve the goal of reducing the viscosity of the concrete. Chen [32] used methyl acrylate (MA), ethyl acrylate (EA), and butyl acrylate (BA) to produce three different types of PCEs, named PCE-M, PCE-E, and PCE-B, respectively. When the PCE dosage was 1% of the cement, the zeta potential stability values of PCE-M, PCE-E, and PCE-B were −3.28 mV, −2.90 mV, and −2.72 mV, respectively. This can be attributed to the shortest chain length of MA, which made the PCE be easier to disperse and react with the cement. Yang [33] used a special monomer, dimethylaminoethyl methacrylate (DMAMEA), to construct a hyperbranched structure to generate branched chains during the polymerization process. When the water/cement ratio was 0.20, the hyperbranched PCEs had stronger adsorption and dispersion driving forces than comb-shaped PCEs. Based on molecular design principles, Li [34] synthesized a high performance water-reducing agent using methyl methacrylate polyethylene glycol ester monomer (MPEGnMA) and methacrylic acid (MAA) as the main raw materials through free radical copolymerization. At a dosage of 1.0%, the 72 h shrinkage rate of concrete was reduced by 20.6%.
The existing research on VRPCEs mainly focuses on the issues of poor fluidity and difficult pumping of high-strength concrete. However, there is a lack of comprehensive research on the impact of various properties of the cement, including fluidity, strength, shrinkage, creep, and so on. In addition, the interaction mechanism of VRPCEs and cement-based materials are still not very clear. ON the basis of this, a new VRPCE was synthesized innovatively by using methylallyl polyoxyethylene ether (HPEG), acrylic acid (AA), and maltodextrin maleic acid monoester (MDMA) as raw materials in this study. The microscopic interaction mechanism between superplasticizer molecule and cement particles was studied by GPC, TOC, zeta potential, and laser particle size, and the influence of the VRPCE on the micro properties of cement were analyzed by XRD, MIP, TG, and SEM. Finally, the effects of this self-synthesized VRPCE on the properties of cement mortar were analyzed through experiments of flow time, slump flow, compressive strength, shrinkage, and creep.

2. Experiment

2.1. Materials and Sample Preparation

2.1.1. Cement

According to “Admixtures for Concrete” (ISO 19596: 2017) [35], the standard cement P•I 42.5 was adopted, produced by Liaoning Fushun Cement Co., Ltd. (Fushun, China), with a 28 d compressive strength of 52.1 MPa. Table 1 lists the chemical composition of the cement.

2.1.2. Self-Synthesized VRPCE

The raw materials for preparing the VRPCE included: methylallyl polyoxyethylene ether (HPEG) with a molecular weight of 3000, acrylic acid (AA), phosphoric acid functional monomers (PFMs), maltodextrin (MD), maleic anhydride (MA), ammonium persulfate (APS), L-ascorbic acid (VC), and 3-mercaptopropionic acid (MPA), all of which were industrial grade. The mixing water was deionized water.
The preparation method was as follows. The MD and MA in a molar ratio of 1:1 were added to DMF, stirred, and reacted for 20 h at 80 °C to prepare maltodextrin maleic acid monoester (MDMA). Using a low-temperature aqueous solution free radical polymerization method, a portion of acrylic acid (AA) and water were added first to a four-port flask containing HPEG and MDMA, stirred at a constant temperature of 30 °C until complete dissolution; then, the APS was added. After that, the remaining AA, PFM, VC, MPA, and water were mixed evenly, uniformly injected into the flask through an injection pump within 3 h, and stirred at a constant temperature of 30 °C for several hours. Finally, the water was added to dilute, and stirred uniformly to prepare the VRPCE with a solid content of 40%. Based on the patent protection application for this composite, the proportions of only part of the components of three types of the VRPCE are shown in Table 2.

2.1.3. Cement Paste

According to Table 3, the cement, water, and VRPCEs were stirred evenly. Subsequently, the fresh cement paste was poured into the mold, and cured in the laboratory with a constant temperature of 20 ± 3 °C and a relative humidity greater than 50%. After 24 h, the samples were demolded, and placed in a standard concrete curing box with a constant temperature of 20 ± 2 °C and a relative humidity of ≥98% for 28 d before tests. For the XRD and TG tests, the samples were ground in a ball mill for 30 min, and the powder was sieved using a square hole sieve of 0.056 mm. Finally, the sieved powder was taken for the tests. For the MIP test, the sample size was 10 mm × 10 mm × 10 mm. For the SEM test, the sample size was 0.5 mm × 0.5 mm × 0.5 mm.

2.1.4. Cement Mortar

The mix proportions of the cement mortar samples are displayed in Table 4. The preparation method was the same as the method for preparing the cement paste. The content of the VRPCE was the mass fraction of the cement. For the compressive strength test, the specimen size was 150 mm × 150 mm × 150 mm. For the shrinkage and creep tests, the specimen size was 25 mm × 25 mm × 80 mm.

2.2. Methods

2.2.1. GPC

The molecular weight and distribution of the synthesized VRPCEs were determined by PL-GPC50 gel permeation chromatography. The control temperature was 25 °C, the mobile phase was NaNO3 aqueous solution of 0.1 mol/L, the flow rate was 1.0 mL/min, the injection volume was 20 µL, and the stationary phase was gel-like porous filler.

2.2.2. TOC

The synthesized VRPCEs solutions with a concentration of 2 g/L, 4 g/L, 6 g/L, 8 g/L, and 10 g/L and a volume of 1 L were mixed with 50 g of the cement, fully stirred with a magnetic mixer for 5 min, and then stood for 1 h. The upper liquid was placed in a centrifuge tube with a centrifugal time of 15 min and a rotational speed of 5000 r/min. After the centrifugation process, the supernatant was taken and filtered by a microporous filter membrane with a pore diameter of 0.45 μm until clear and transparent, as the tested sample. The TOC analyzer (TOC-L CPN type) was selected to test the concentration of the VRPCE solution with a standing time of 5 min and 2 h, and the adsorption amount of the VRPCE onto cement was calculated based on the concentration difference before and after the centrifugation. The calculation is expressed by Equation (1):
Q = c 0 c 1 v m
where Q represents the adsorption amount of the VRPCE (mg/g); c0 represents the initial concentration of the VRPCE (mg/L); c1 represents the adsorption concentration of the VRPCE after standing time (mg/L); v represents the total volume of the solution (L); m represents the mass of the added cement (g).

2.2.3. Zeta Potential

The zeta potential of the surface of the cement particles containing the VRPCE was measured using a Malvern Zetasizer Nano ZS90 zeta potentiometer produced by Malvern Panalytical, Malvern, UK. The cement and the VRPCE were mixed based on a liquid/solid ratio of 800 with a magnetic mixer for 5–10 min to evenly disperse the cement. The concentrations of the VRPCEs were 2 g/L, 4 g/L, 6 g/L, 8 g/L, and 10 g/L, respectively. After a standing time of 5 min, the supernatant was taken and injected into a U-shaped electrophoresis tank. The zeta potential on the surface of the cement particles was measured by applying positive and negative voltages.

2.2.4. Cement Particle Size

Referring to the document “Particle size analysis—Laser diffraction methods” (ISO 13320: 2020) [36], the liquid/solid ratio was 9, and the concentrations of the VRPCEs were 2 g/L, 4 g/L, 6 g/L, 8 g/L, and 10 g/L, respectively. The cement was stirred with a mixer for 5–10 min to evenly disperse. A Malvern Mastersizer 2000 laser particle size analyzer produced by Malvern Panalytical, Malvern, UK was selected to determine the particle size distribution characteristics of the solid particles in the cement suspension within the VRPCEs.

2.2.5. XRD

X-ray diffraction testing was conducted using a 7000X type XRD produced by Shimadzu, Kyoto, Japan to analyze the compositions of C0, C1, C2, and C3 cement samples. The instrument used a Cu target with the stability of the tube voltage and current of ±0.005%. During the test, the maximum output power of the X-ray tube was set as 3 kW, and the minimum step angle was controlled as 0.0002° (2θ).

2.2.6. MIP

The porosity and pore distribution of C0, C1, C2, and C3 cement paste samples were determined using the mercury intrusion porosimeter model AutoPore IV 9500 produced by Micromeritics, New York, NY, USA, with a pressure range of 0.2–6000 lbs, and a pore diameter measurement range of 3–400,000 nm.

2.2.7. TG

A TGA Q5000 IR thermogravimetric analyzer produced by TA Instruments, New Castle, DE, USA, was used to test C0, C1, C2, and C3 cement paste samples to determine the content of calcium hydroxide (CH). The temperature range and temperature increase rate were 10–1000 °C and 10 °C/min.

2.2.8. SEM

A FEI QUANTA 250 field emission environmental scanning electron microscope produced by FEI, Hillsboro, OR, USA, was used to analyze the microscopic morphology of C0, C1, C2, and C3 cement paste samples. The resolution of the SEM mode was 3.5 nm and 130 eV.

2.2.9. Fluidity

The document “Admixtures for Concrete” (ISO 19596: 2017) [35] was referred to for testing the flow time and slump of the cement mortar samples with a standing time of 0 and 2 h. The raw materials were mixed according to the mix ratio in Table 4 (slow speed: 120 s, stop: 15 s, fast speed: 120 s). The mortar was poured into a truncated cone bucket with an upper bottom diameter of 150 mm, a lower bottom diameter of 22 mm, and a height of 140 mm. Then, the lid on the bucket bottom was opened, immediately counting the time. The time when the mortar had completely flowed out was regarded as the flow time. In addition, the mixed mortar was poured into a truncated cone barrel with an inner diameter of 70 mm at the upper opening, 100 mm at the lower opening, and a height of 60 mm. A spatula was utilized to scrape to keep the material flat, and the truncated cone barrel was lifted vertically. When the flow time was 30 s, a ruler was used to measure the value of the maximum diameter of the mortar after spreading as the slump flow.

2.2.10. Compressive Strength

The compressive strength test of the cement mortar was conducted in accordance with the document “Cement—Test methods—Determination of strength” (ISO 679: 2009) [37]. The 28 d compressive strength of the cement mortar was tested using a computer-based fully automatic cement bending and compression testing machine with a loading rate of 0.1 mm/min.

2.2.11. Shrinkage

The temperature of the shrinkage strain test of the cement mortar samples was controlled at 20 ± 3 °C. The relative humidity was 60 ± 5%, and the shrinkage test gauge distance was 80 mm. The shrinkage strain of the mortar samples over time was recorded by a dial gauge with an accuracy of 0.001 mm. The test started at the time after the completion of curing (the 29th day) with a test period of 90 d. The shrinkage strain rate of the mortar was calculated by Equation (2):
ε s t = L a L t L 0
where εst represents the shrinkage value of the mortar sample tested from the initial time to day t; La represents the initial reading of the dial indicator (mm); Lt represents the reading of the dial indicator when the test period was t days (mm); L0 represents the measurement gauge distance of the sample (m).

2.2.12. Creep

The temperature of the creep test of the mortar samples was 20 ± 3 °C and the relative humidity was 60 ± 5%. The deformation amount of the tested samples over time under external load was measured by a dial gauge with an accuracy of 0.001 mm. The time after the completion of curing (the 29th day) was taken as the starting time point on the first day with the test period of 90 d. Equation (3) was used to obtain the creep strain:
ε c t = Δ L t Δ L 0 L b ε s t
where εct represents the creep strain when loaded to day t (mm/m); ∆Lt represents the total deformation after the loading time was t days (mm); ∆L0 represents the initial deformation value (mm); Lb represents the measurement gauge distance (m); εst represents the shrinkage value of the same age period (mm/m). Based on the obtained creep strain, the calculation of the creep degree was obtained by Equation (4):
C t = ε c t F s
where Ct represents the creep degree of the mortar when loaded for t days (1/MPa); Fs represents the creep stress (MPa). In this paper, the creep degree was used to evaluate the creep performance of the cement mortar samples.

3. Results

3.1. Molecular Weight and Molecular Weight Distribution

Figure 1 shows the GPC analysis results of the VRPCE. The peak positions of the three types of the VRPCE were centrally distributed at 7.49 min. The two peak positions that appeared at about 12 min were interference peaks and almost no polyether peaks can be observed. This phenomenon indicated that there was almost no residual of HPEG in the reaction, meaning the polymerization was sufficient. Table 5 demonstrates the molecular weight and molecular weight distribution of the three VRPCEs. It can be seen that the average molecular weights (Mn) of the three VRPCE were distributed around 35,000 and the weight-average molecular weights (Mw) were distributed around 78,000. The polymer dispersion index (PDI = Mw/Mn) was in the range of 2.0–2.2.

3.2. Adsorption

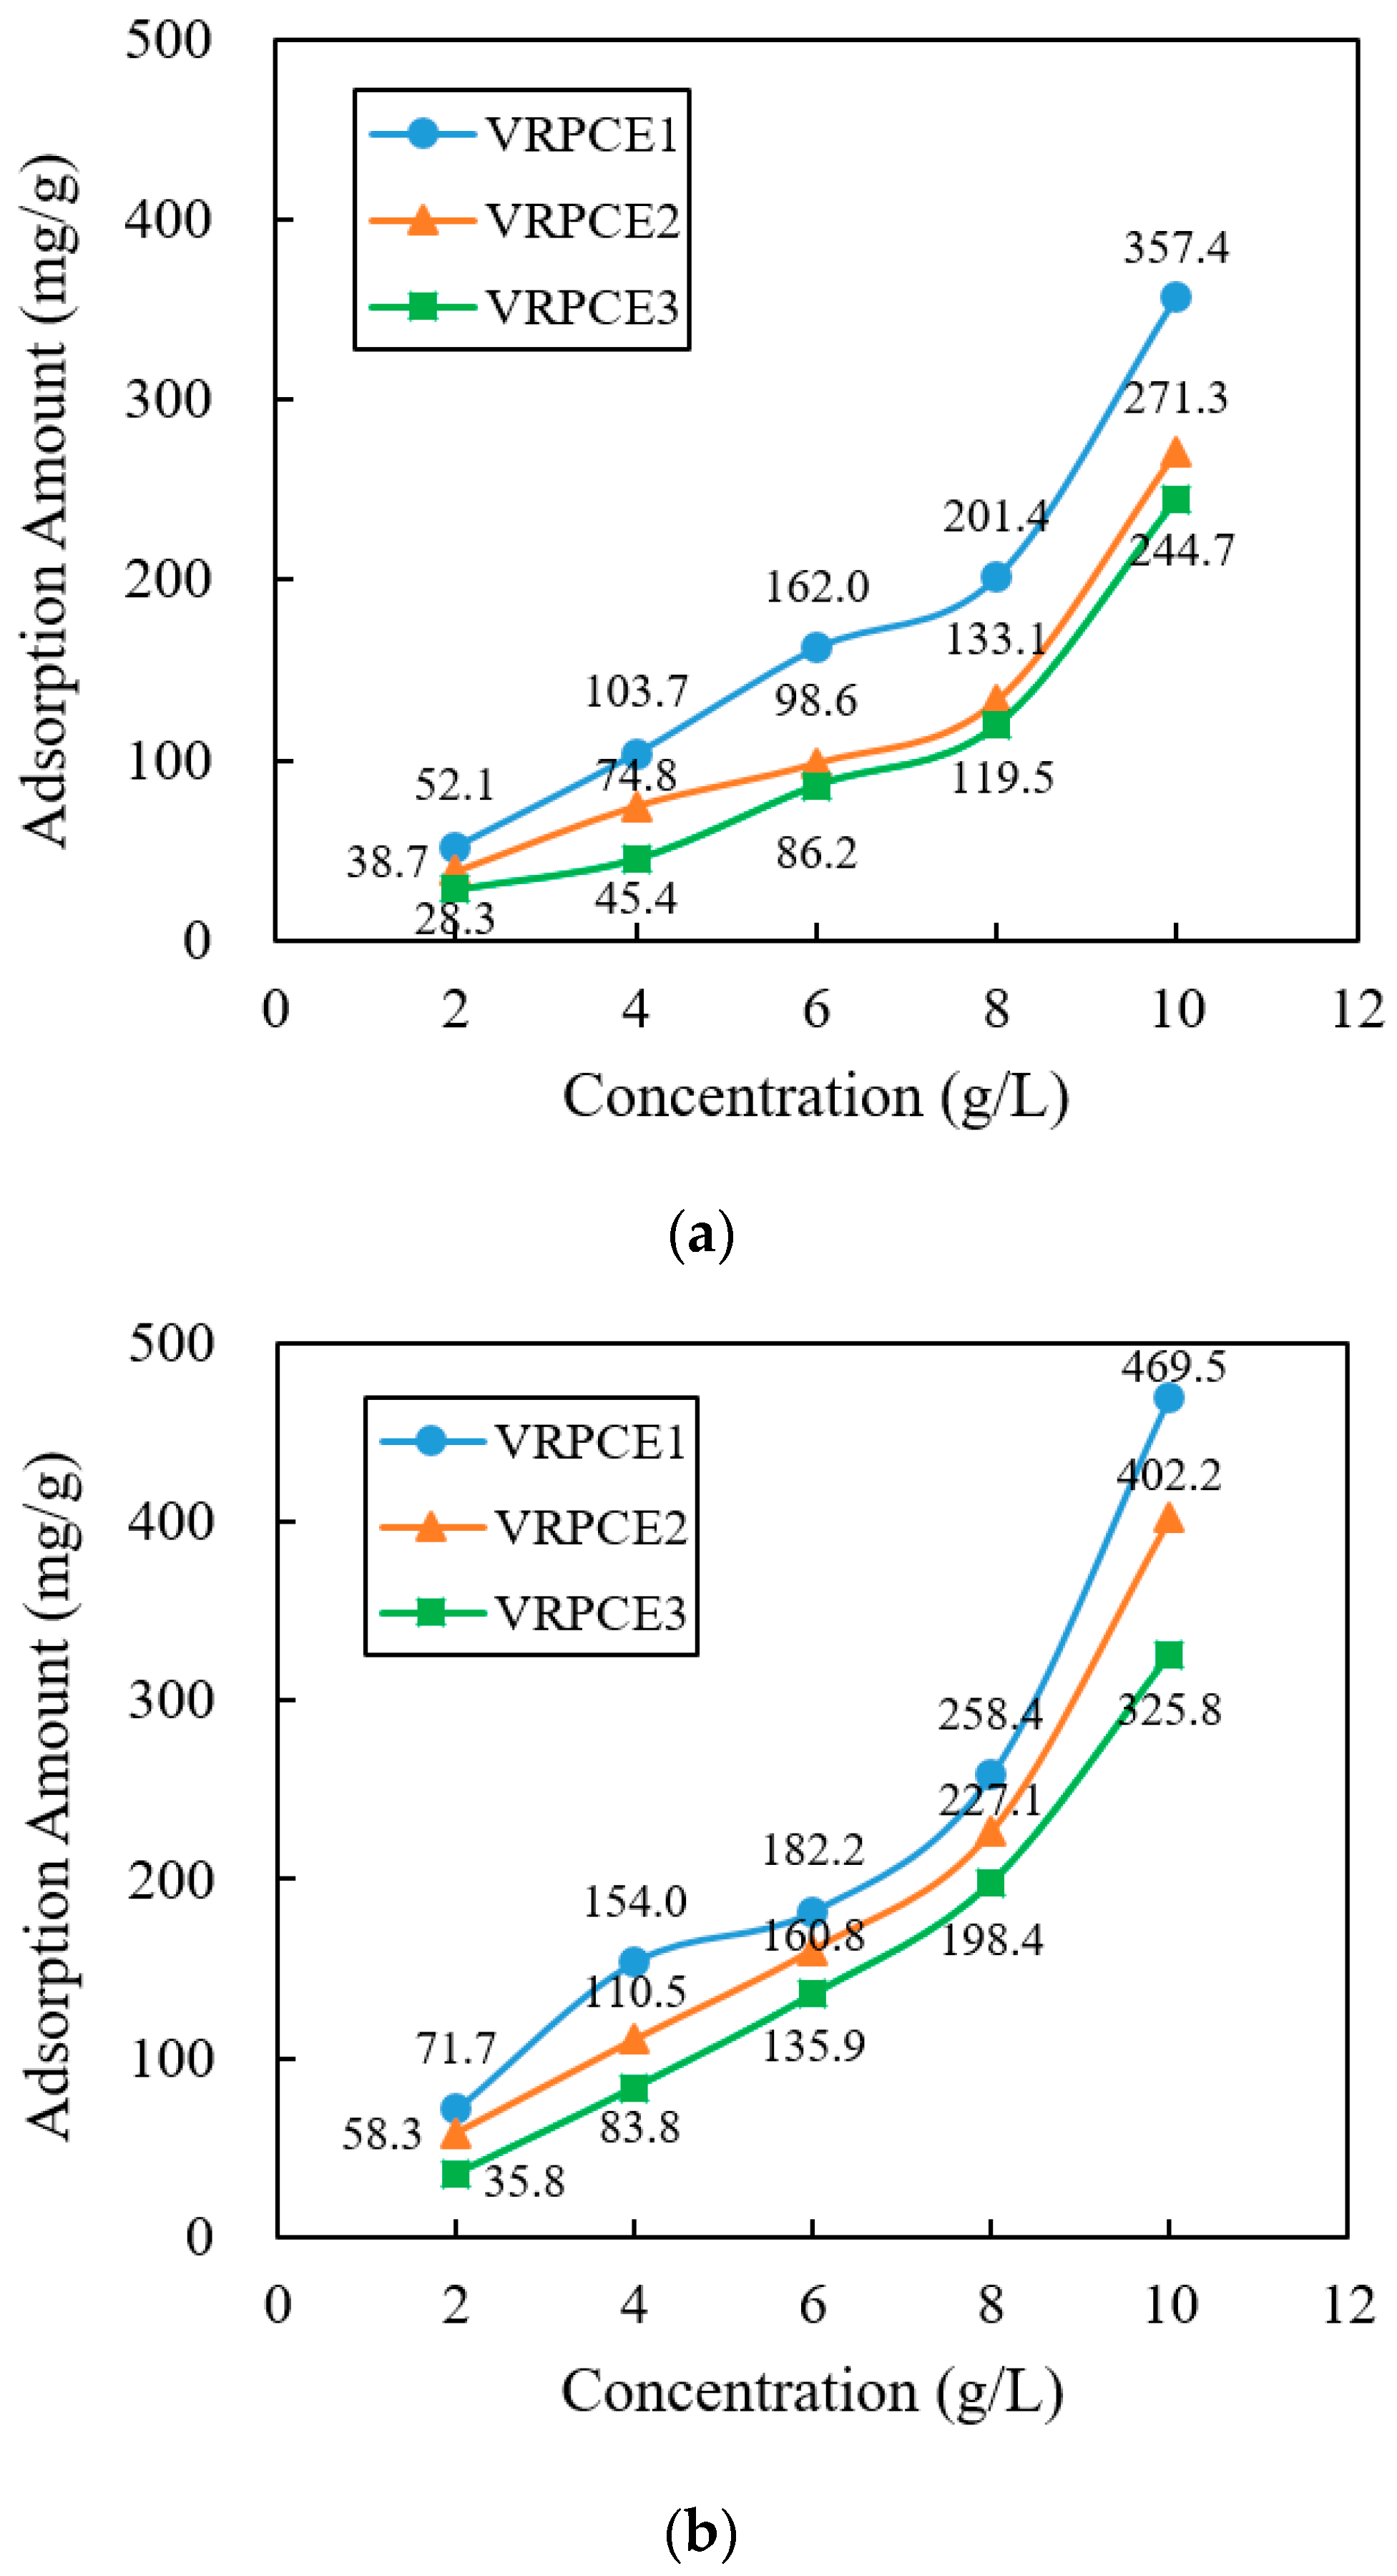
The adsorption capacities of the three VRPCEs onto the surface of the cement particles for 5 min and 2 h are shown in Figure 2. From Figure 2a, when the adsorption time was 5 min, the adsorption amount of the VRPCE1, VRPCE2, and VRPCE3 onto the cement particles increased rapidly with the increase in concentration. When the concentration of the VRPCEs was 2 g/L, the adsorption amounts were 52.1 mg/g, 38.7 mg/g, and 28.3 mg/g, respectively. When the concentration of the VRPCEs was 10 g/L, the adsorption amounts were 357.4 mg/g, 271.3 mg/g, and 244.7 mg/g. Hence, when the concentration of the VRPCEs increased by five times, the adsorption capacity of the VRPCE1, VRPCE2, and VRPCE3 onto cement particles increased by 5.86, 6.01, and 7.64 times, respectively.
From Figure 2b, when the adsorption time was 2 h, the adsorption amount of the VRPCE1, VRPCE2, and VRPCE3 onto cement particles increased rapidly with the increase in concentration. When the concentration of the VRPCEs was 2 g/L, the adsorption amounts were 71.7 mg/g, 58.3 mg/g, and 35.8 mg/g. When the concentration of the VRPCEs was 10 g/L, the adsorption amounts were 469.5 mg/g, 402.2 mg/g, and 325.8 mg/g. When the concentration of the VRPCEs increased by five times, the adsorption capacity of the VRPCEs on cement particles increased by 5.55, 5.90, and 8.10 times, respectively.
Based on Figure 2a,b, the adsorption capacity of the VRPCEs in 2 h increased, compared to that in 5 min. When the concentration of the VRPCEs was 2 g/L, the adsorption capacity of the VRPCEs increased by 37.6%, 50.6%, and 26.5%. When the concentration of the VRPCEs was 10 g/L, the adsorption capacity of the VRPCEs increased by 31.3%, 48.2%, and 33.1%. This indicated that the VRPCEs continued to adsorb onto the surface of the cement particles over time.

3.3. Dispersion

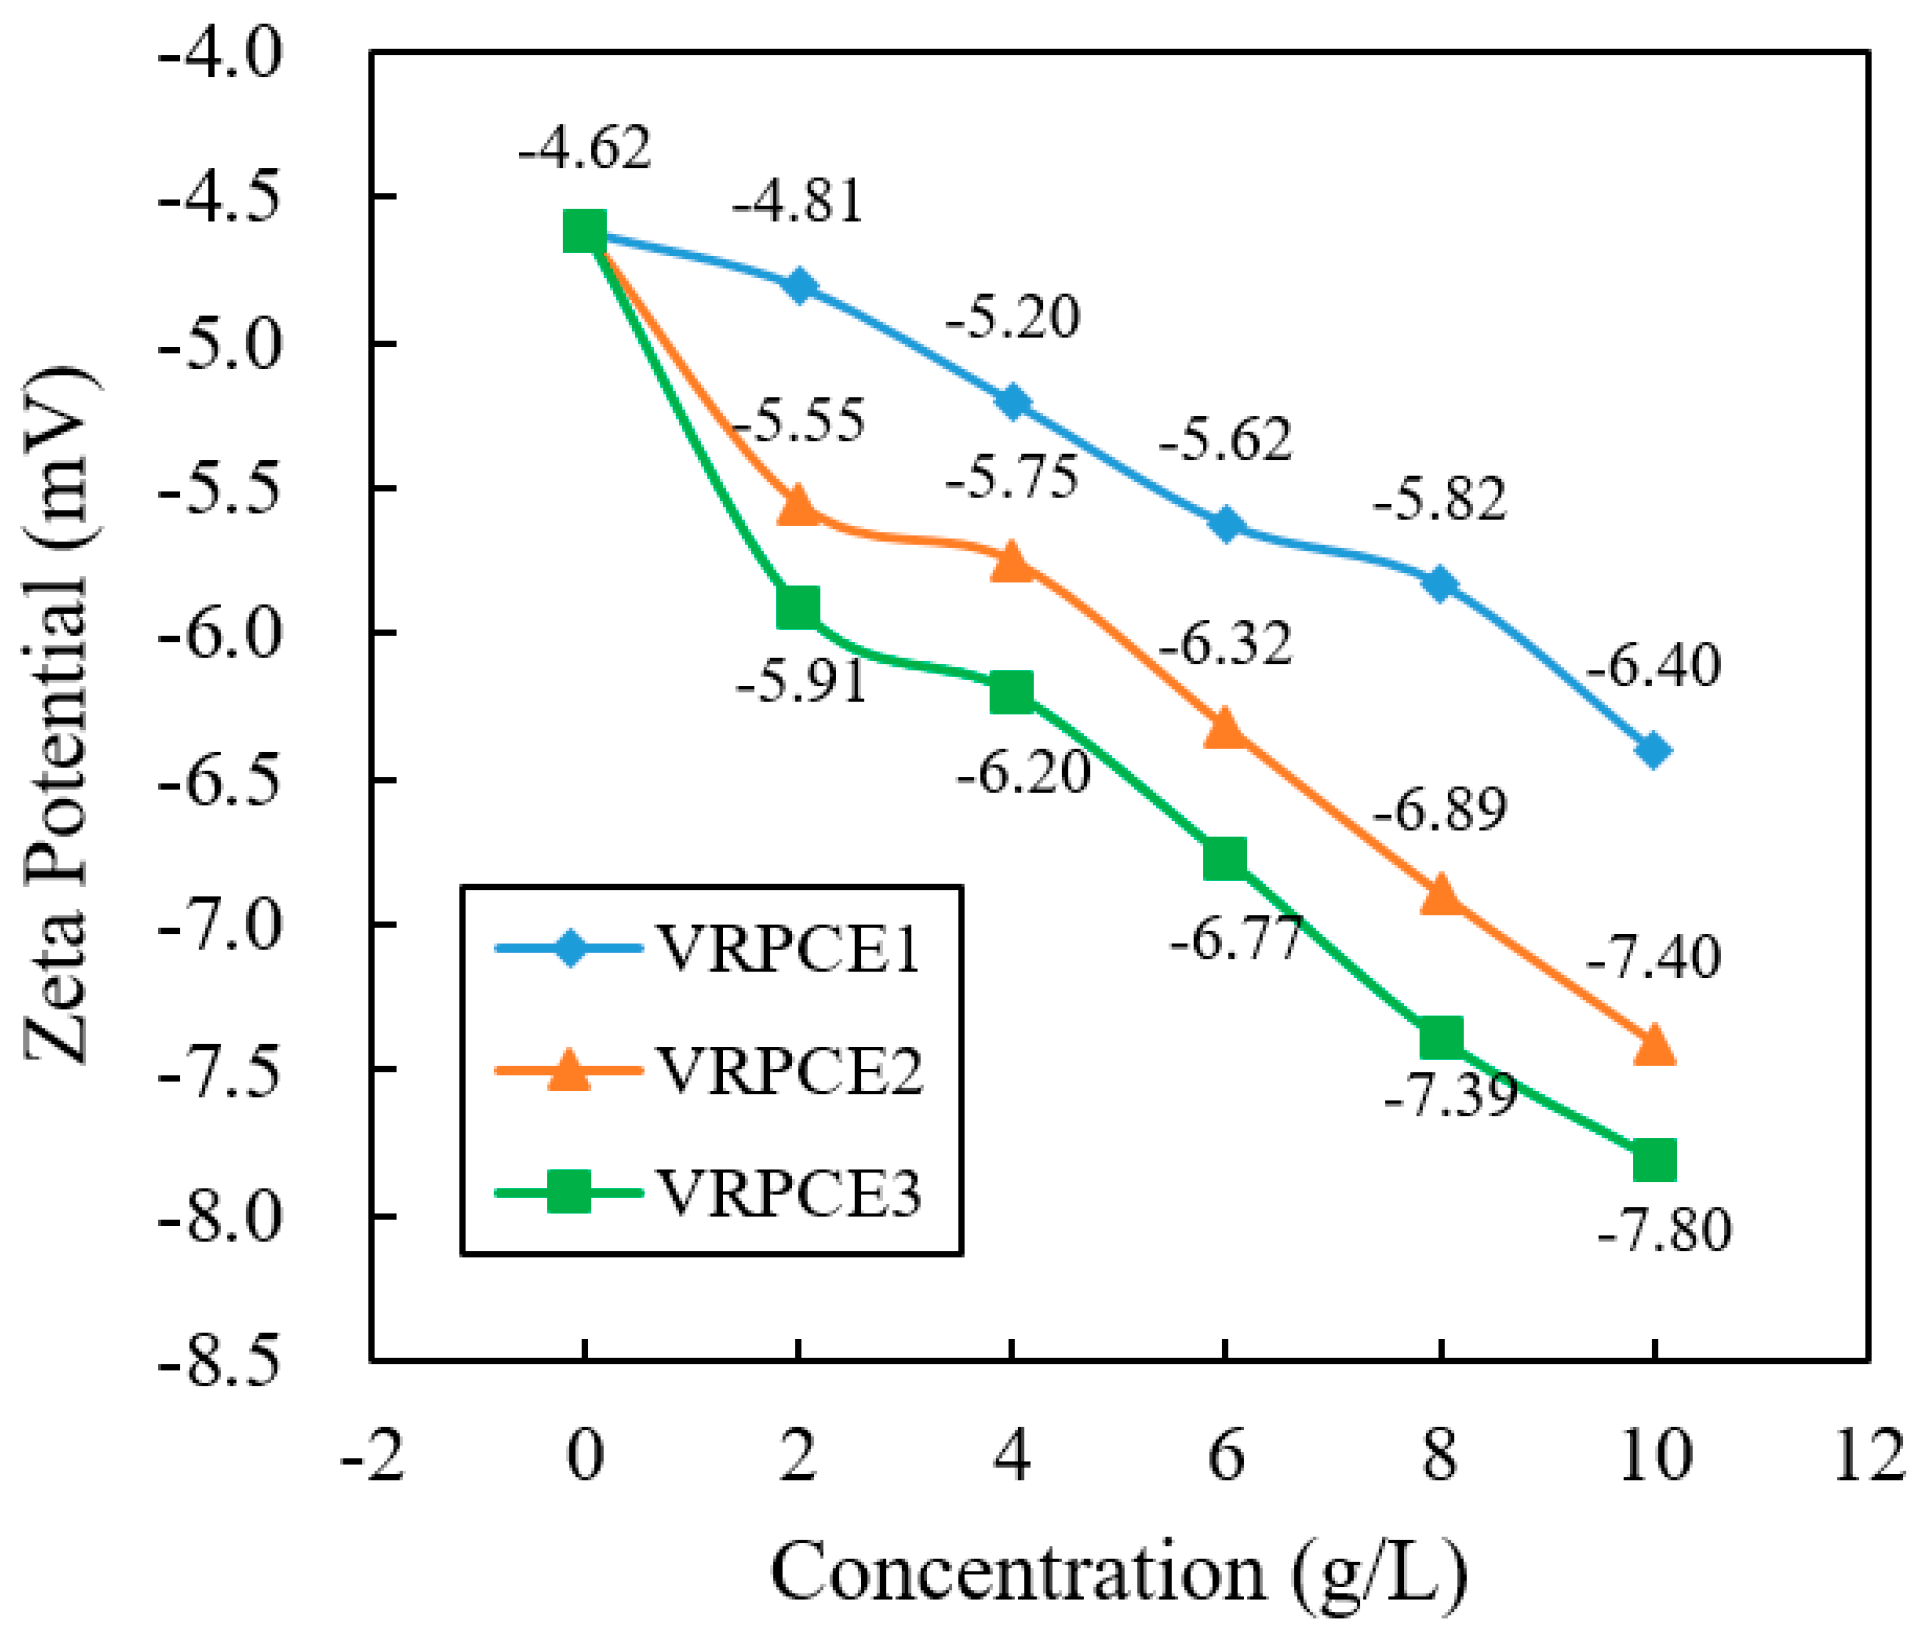
Electrostatic repulsion is considered to be one of the important reasons for cement particles to maintain a dispersed state, and has an crucial impact on the rheology of fresh cement paste [38]. The zeta potential of the cement in the VRPCE solutions is shown in Figure 3. It can be recognized that the zeta potential of the cement particles in pure water was −4.62 mV. The absolute zeta potential values of the cement particles within the VRPCEs increased with the increasing of the concentration. When the concentration of VRPCEs was 10 g/L, the absolute zeta potential values of the cement particles within the VRPCEs increased by 33.1%, 33.3%, and 32.0% compared to that when the concentration of the VRPCEs was 2 g/L. This was mainly because the VRPCEs, as the anionic surfactant, increased the negative charge on the surface of the cement particles as the adsorption amount increased [39]. With the same concentration of the VRPCEs, when concentration was 2 g/L, compared with the cement particles containing VRPCE1, the absolute zeta potential of the cement particles containing VRPCE2 and VRPCE3 increased by 15.4% and 22.9%. When the concentration of the VRPCEs was 10 g/L, compared with the cement particles containing VRPCE1, the absolute zeta potential of the cement particles containing VRPCE2 and VRPCE3 increased by 15.6% and 21.9%.

3.4. Particle Size

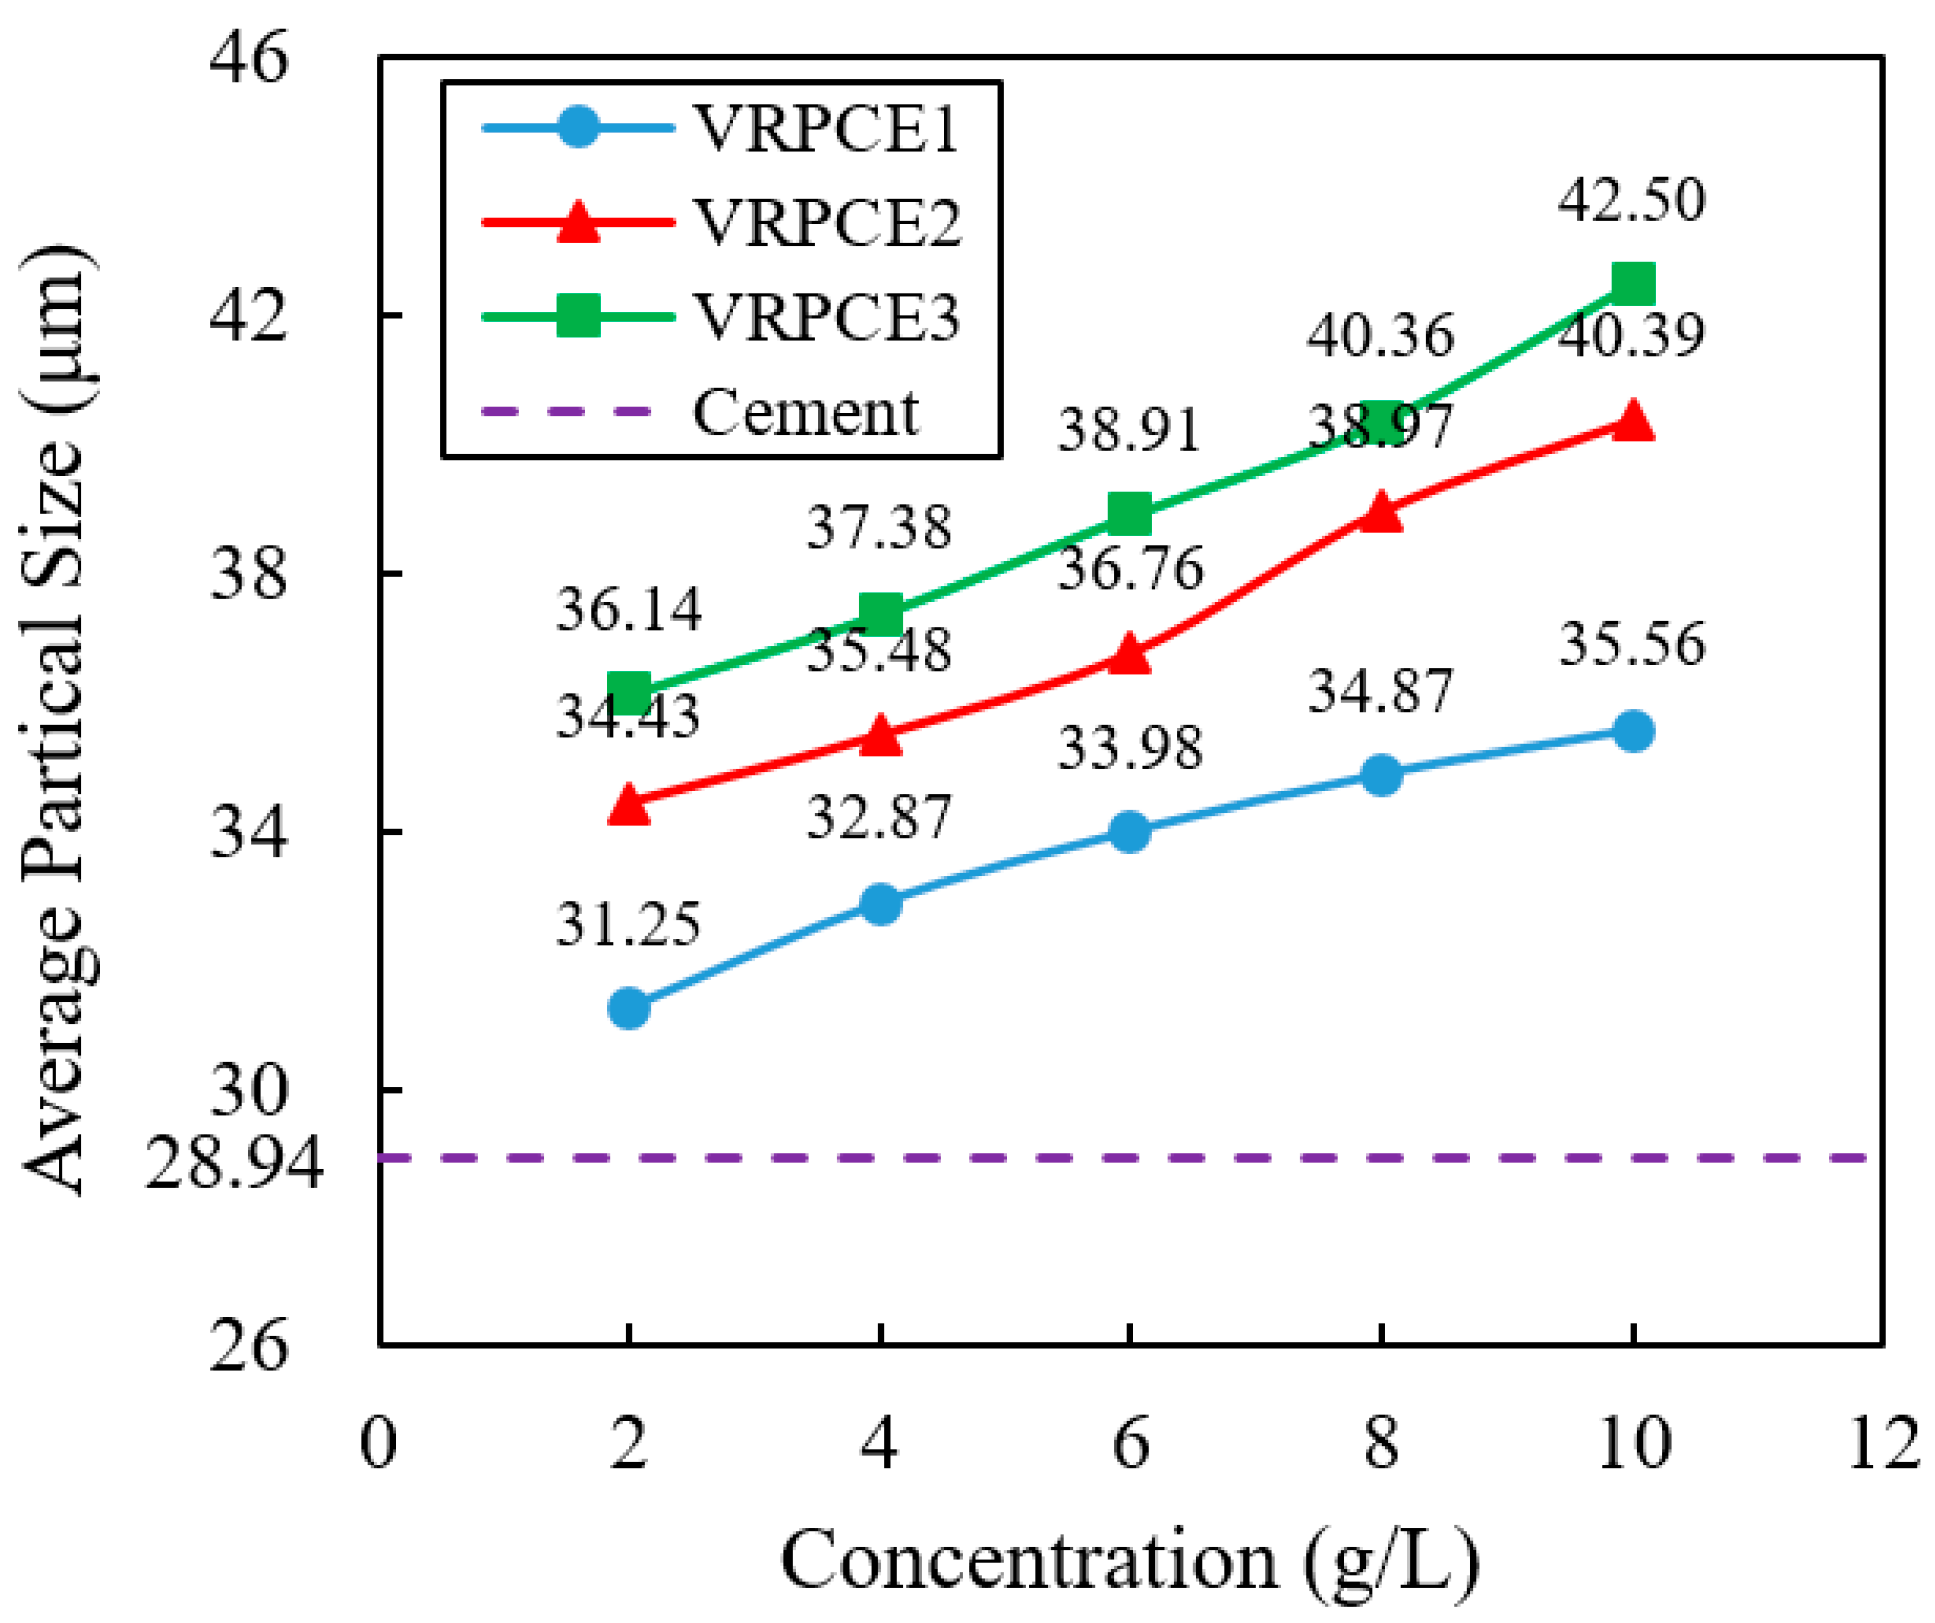
The complex compositions of the cement particles made the surface charge of the particles uneven, and the cement particles easily agglomerated to form flocculation structures with different sizes [40]. The particle size of the cement can be used as an important indicator to evaluate whether the particles are in a dispersed or agglomerated state. The laser particle sizes of the cement particles in VRPCE solutions are shown in Figure 4. The average particle size of the cement particles in pure water was 28.94 μm. With the increase in the concentration of the VRPCEs, the average particle size of the cement presented an increasing trend. Compared with the cement particles without the VRPCEs, when the concentration of the VRPCEs was 2 g/L, the particle size of the cement increased by 7.98%, 18.97%, and 24.88%. When the concentration of the VRPCEs was 10 g/L, the particle size of the cement increased by 22.87%, 39.56%, and 46.86%.

3.5. Compositions

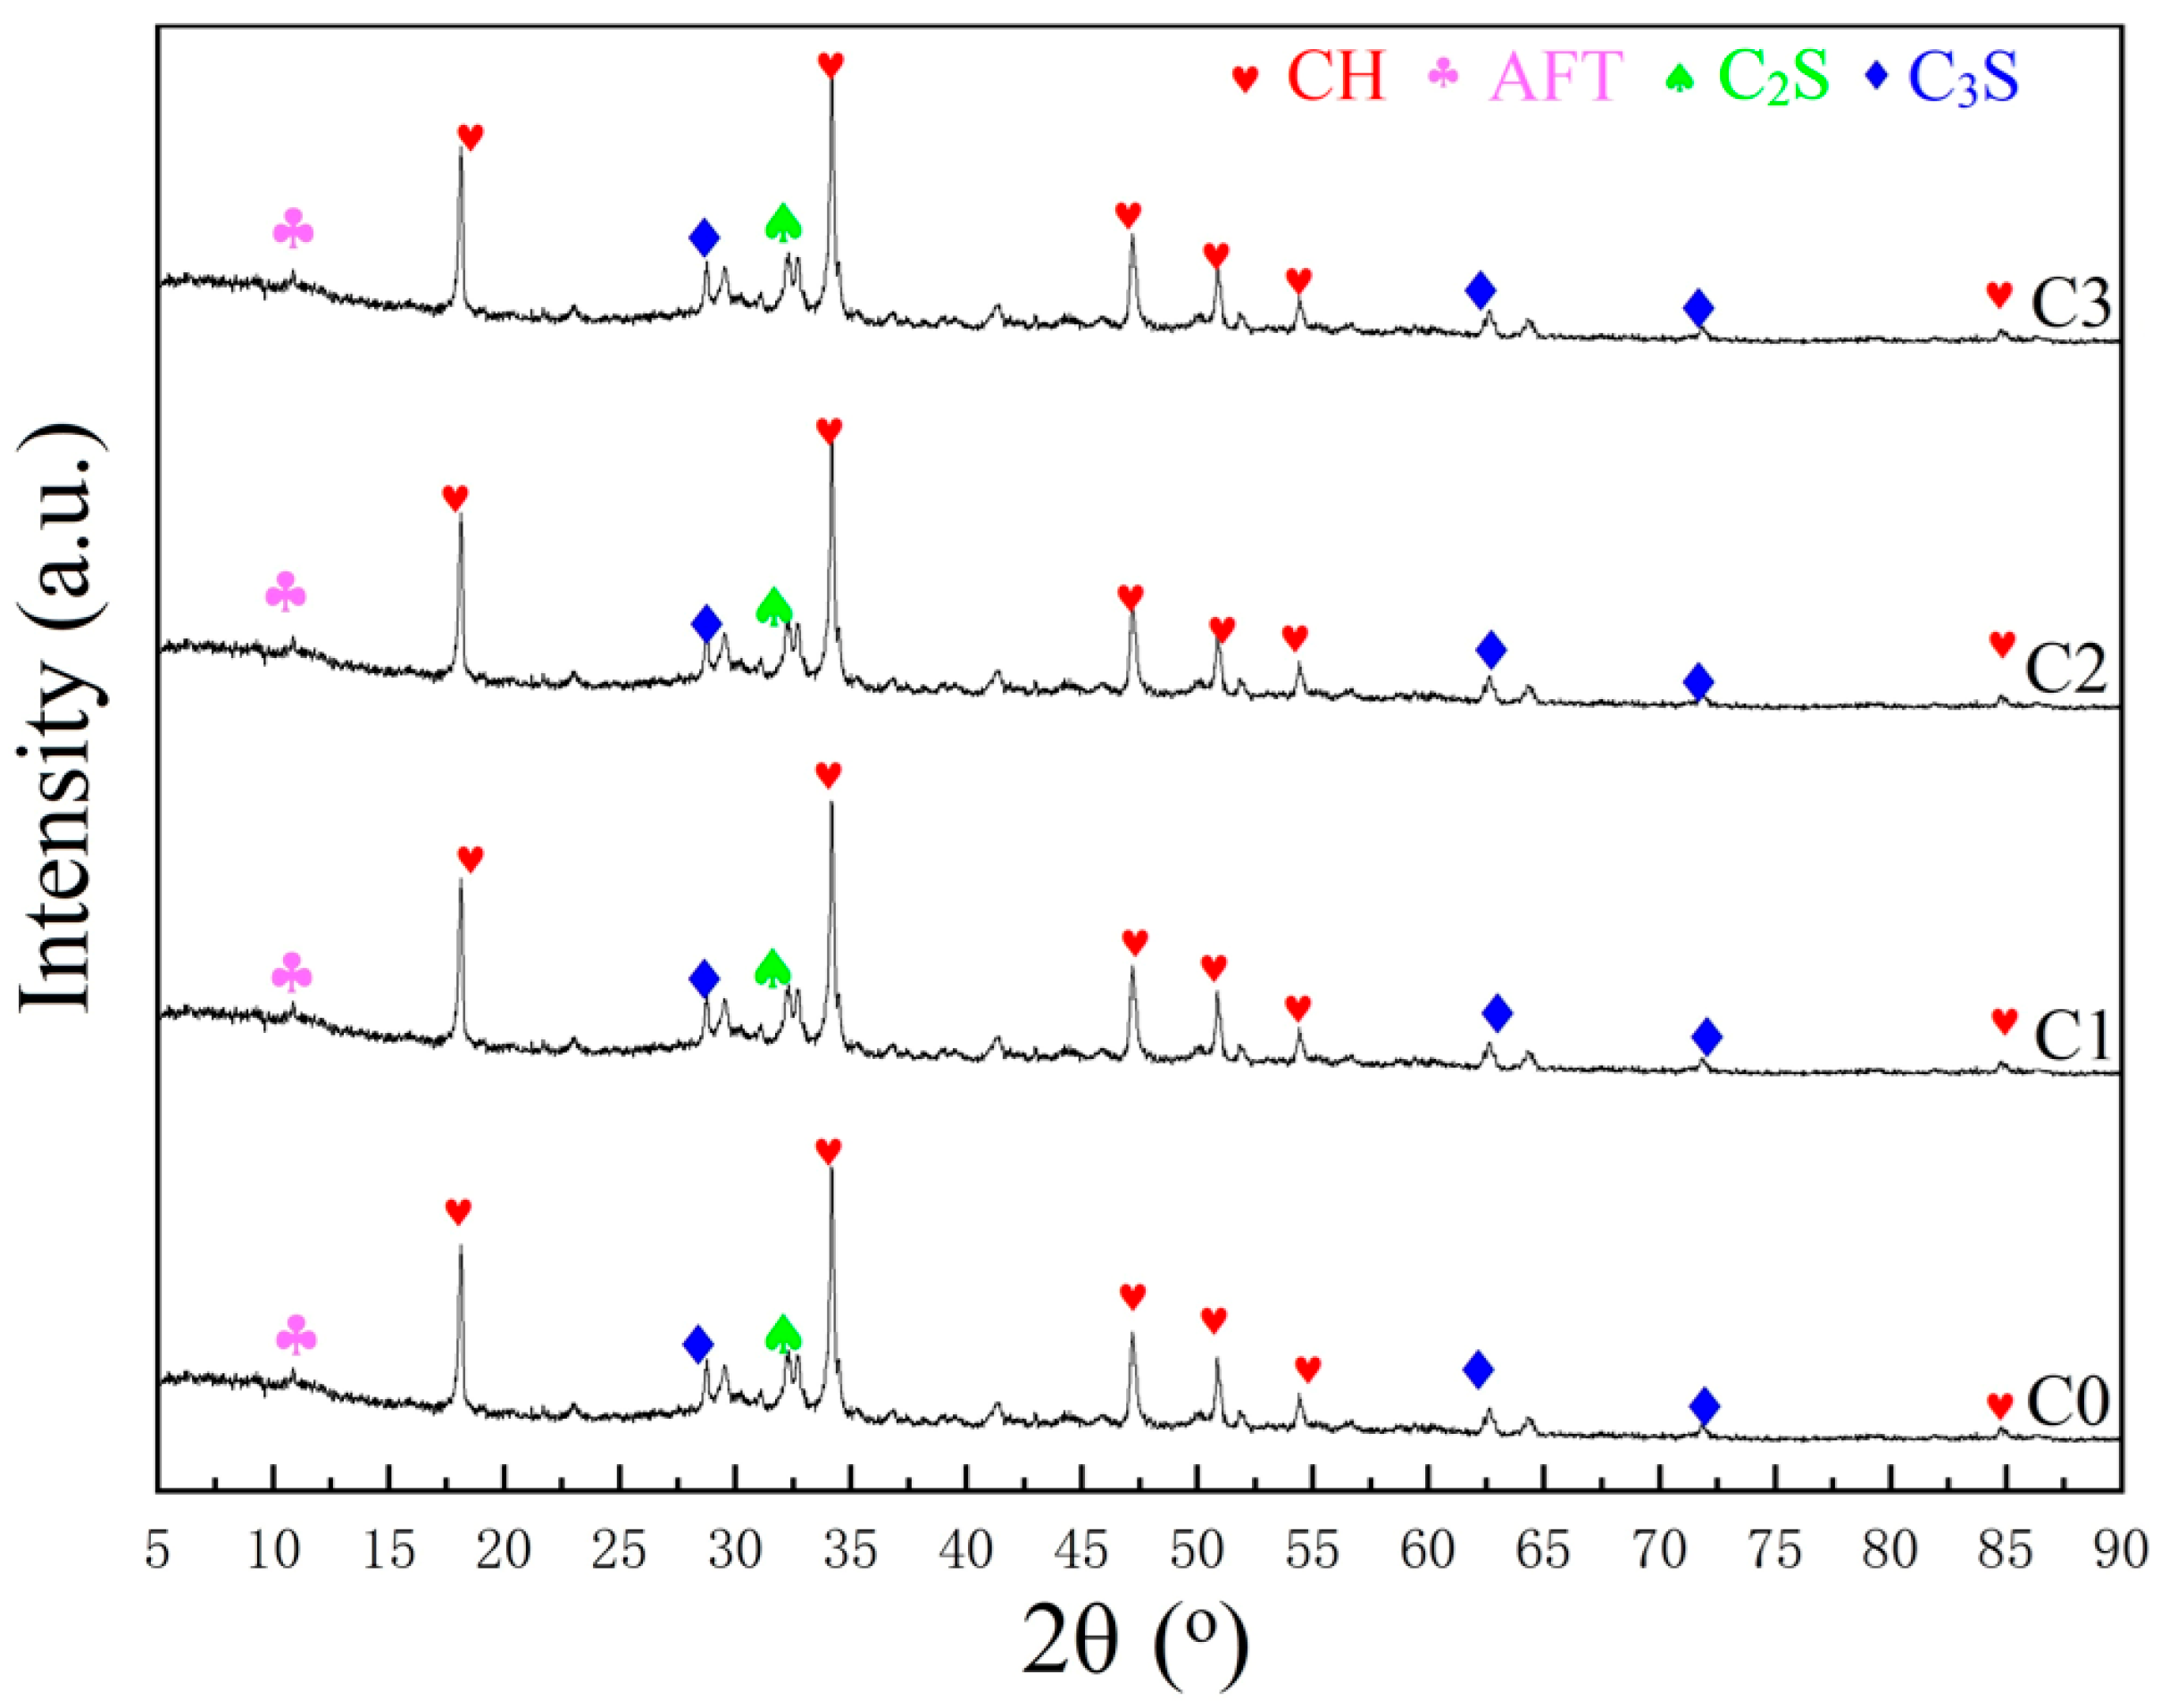
The main hydration products of C0, C1, C2, and C3 explored according to the principle of XRD analysis [41] are shown in Figure 5. The overall morphology of the XRD patterns of the four groups of the samples was similar, which indicated that the composition of the crystalline phase in the hydration products of the four groups of the cement samples was the same, mainly including calcium hydroxide (CH), as well as a small amount of ettringite (AFt), and unhydrated particles (UCs). The unhydrated particles were mainly tricalcium silicate (C3S) and dicalcium silicate (C2S). It was worth noted that the hydration product should contain a large amount of C-S-H gel, which was not shown in the XRD pattern because it mainly existed in the amorphous form.

3.6. Pores

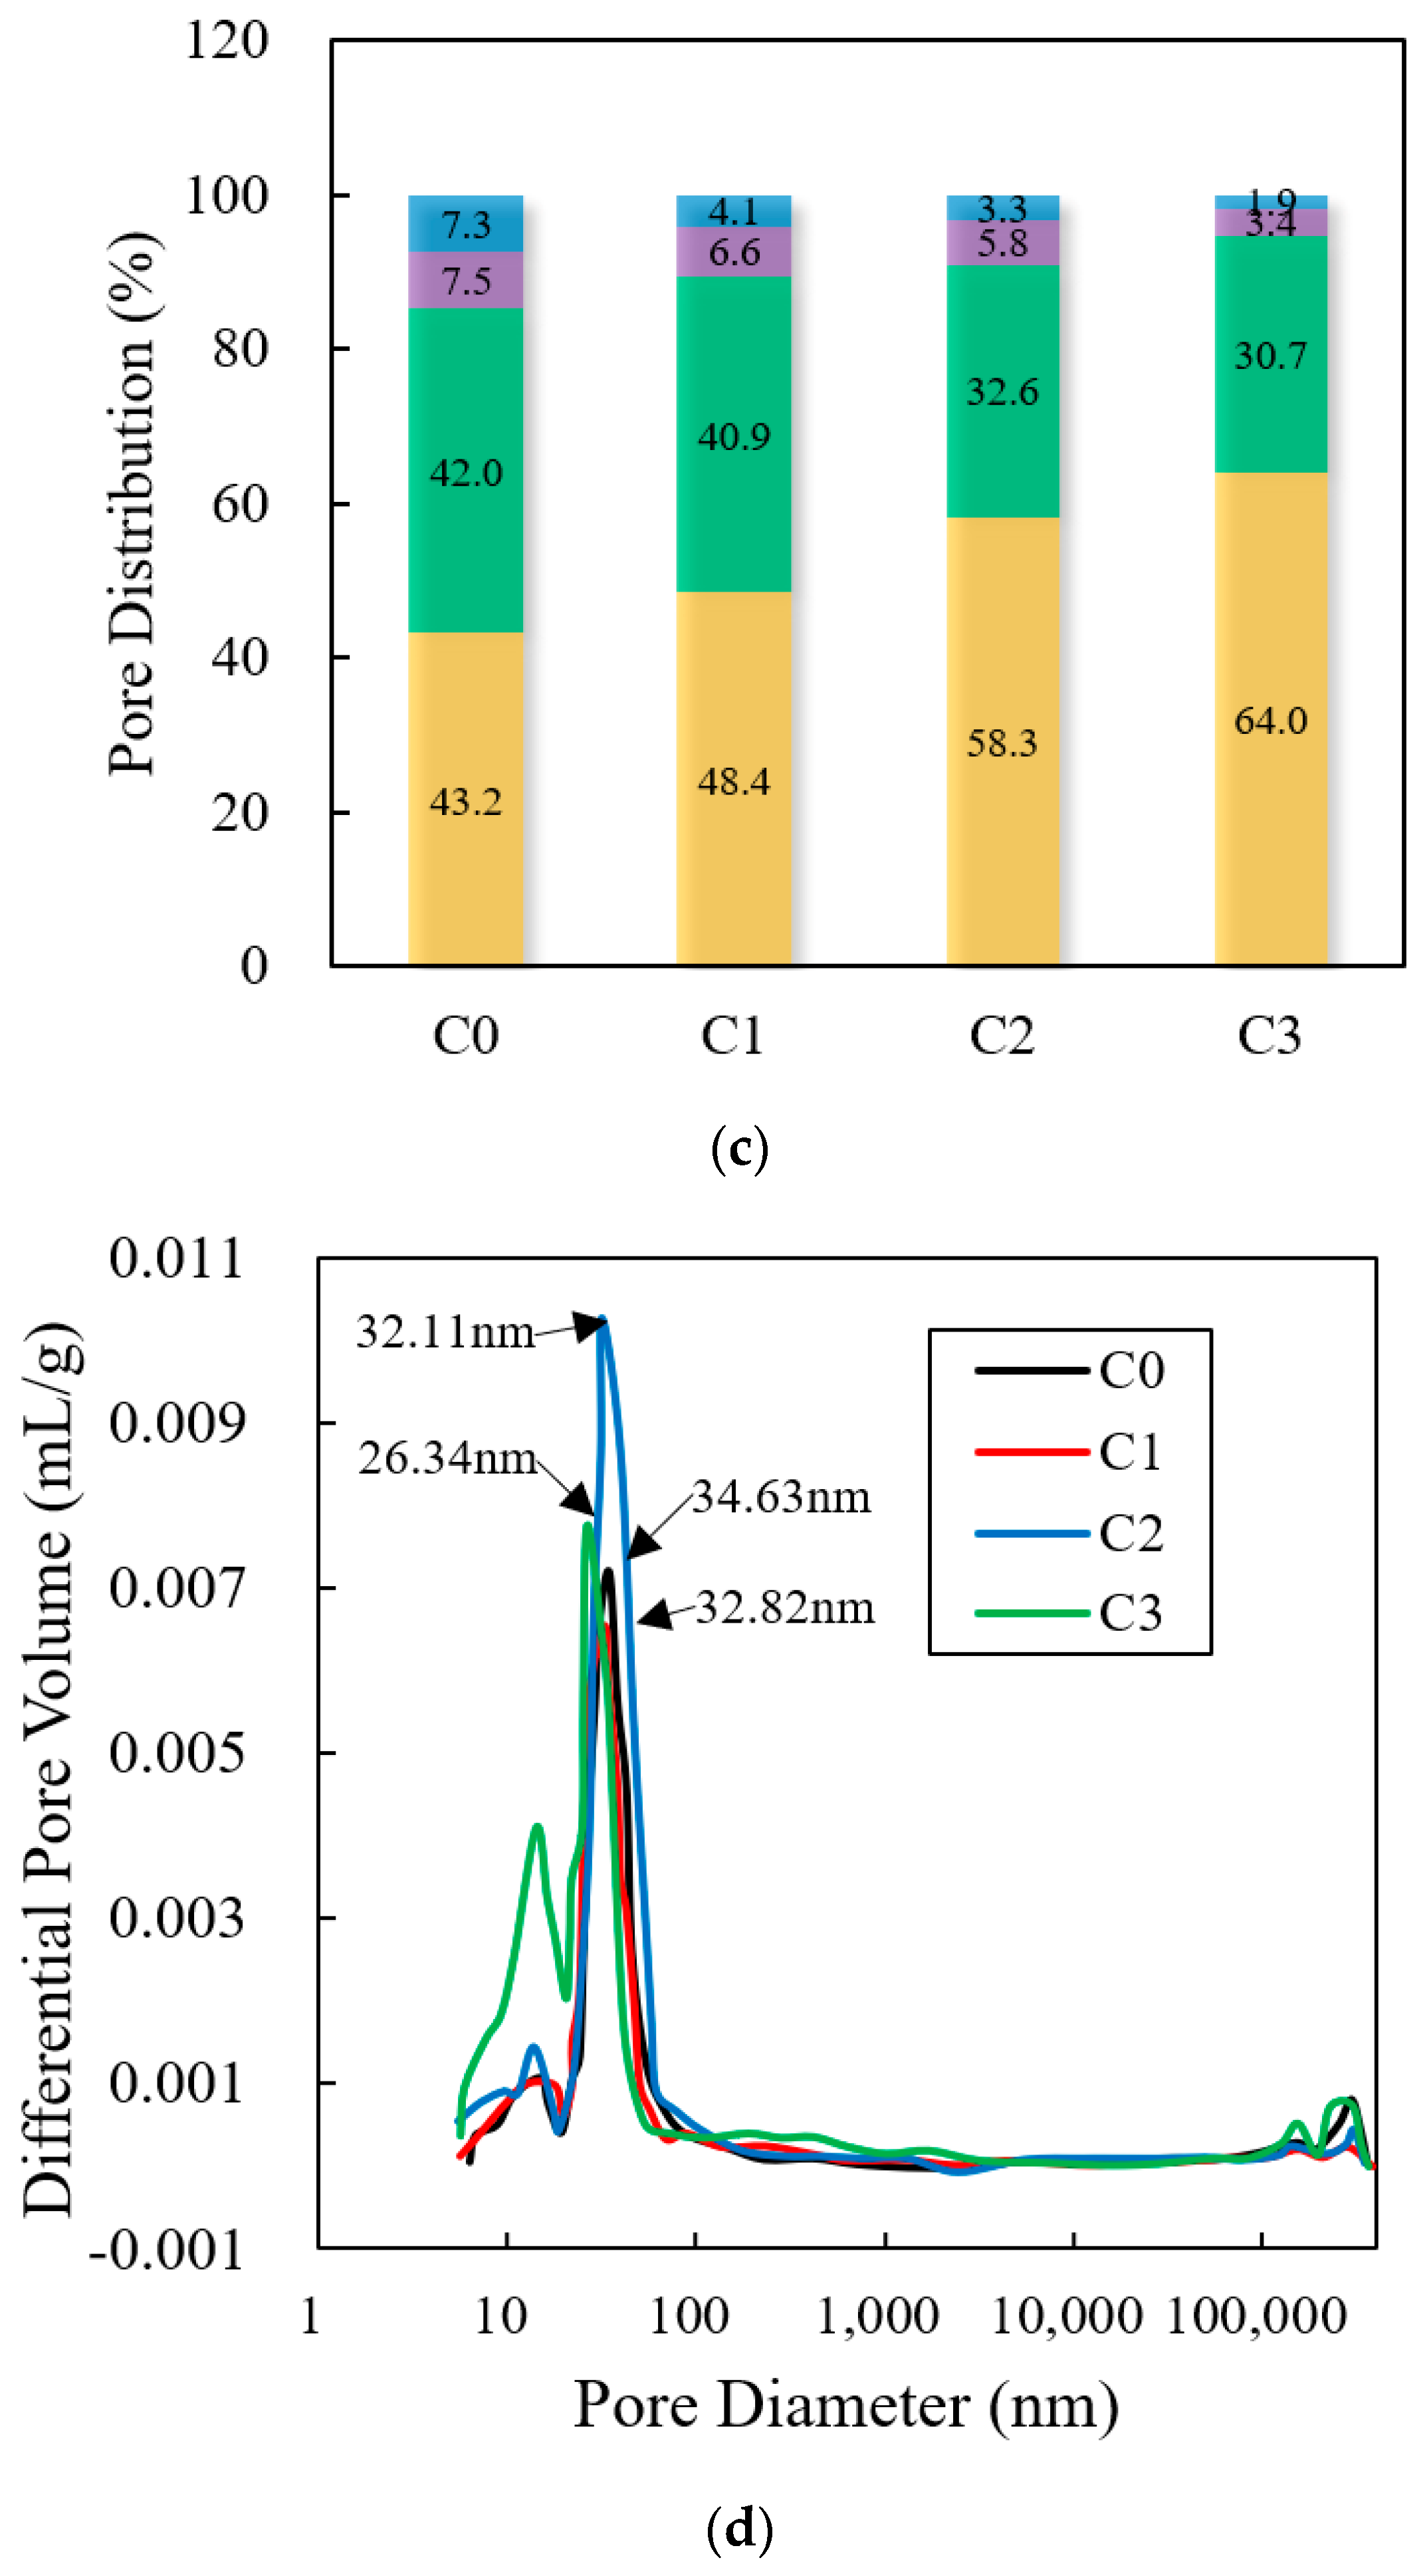
The pore structures of C0, C1, C2, and C3 were detected through the MIP test with the results shown in Figure 6. Figure 6a shows the cumulative pore volume distribution curves. The pores can be divided into large pores (>1000 nm), capillary pores (100 nm < pore size < 1000 nm), transitional pores (10 nm < pore size < 100 nm), and gel pores (<10 nm) [42]. It can be seen that the cement pastes in each group were mainly gel pores (yellow area) and transitional pores (green area), as well as a small number of capillary pores (purple area) and large pores (blue area). From Figure 6b, it can be seen that the porosity of C0, C1, C2, and C3 gradually increased, increasing by 0.03%, 30.0%, and 56.9% compared to C0, respectively. From Figure 6c, it can be seen that the proportion of gel pores (yellow area) in the four groups gradually increased. Compared with C0, C1, C2, and C3 increased by 12.0%, 35.0%, and 48.1%. The proportion of transitional pores (green area), capillary pores (purple area), and large pores (blue area) gradually decreased. Compared to C0, the proportion of transitional pores in C1, C2, and C3 decreased by 2.6%, 22.4%, and 26.9%. The proportion of capillary pores in C1, C2, and C3 decreased by 12.0%, 22.7%, and 54.7%, respectively. The proportion of large pores in C1, C2, and C3 decreased by 43.8%, 54.8%, and 74.0%, respectively. From Figure 6d, it can be seen that the most probable apertures of C0, C1, C2, and C3 were 34.63 nm, 32.82 nm, 32.11 nm, and 26.34 nm. Compared with C0, the most probable apertures of C1, C2, and C3 decreased by 5.2%, 7.3%, and 23.9%, respectively.

3.7. TG

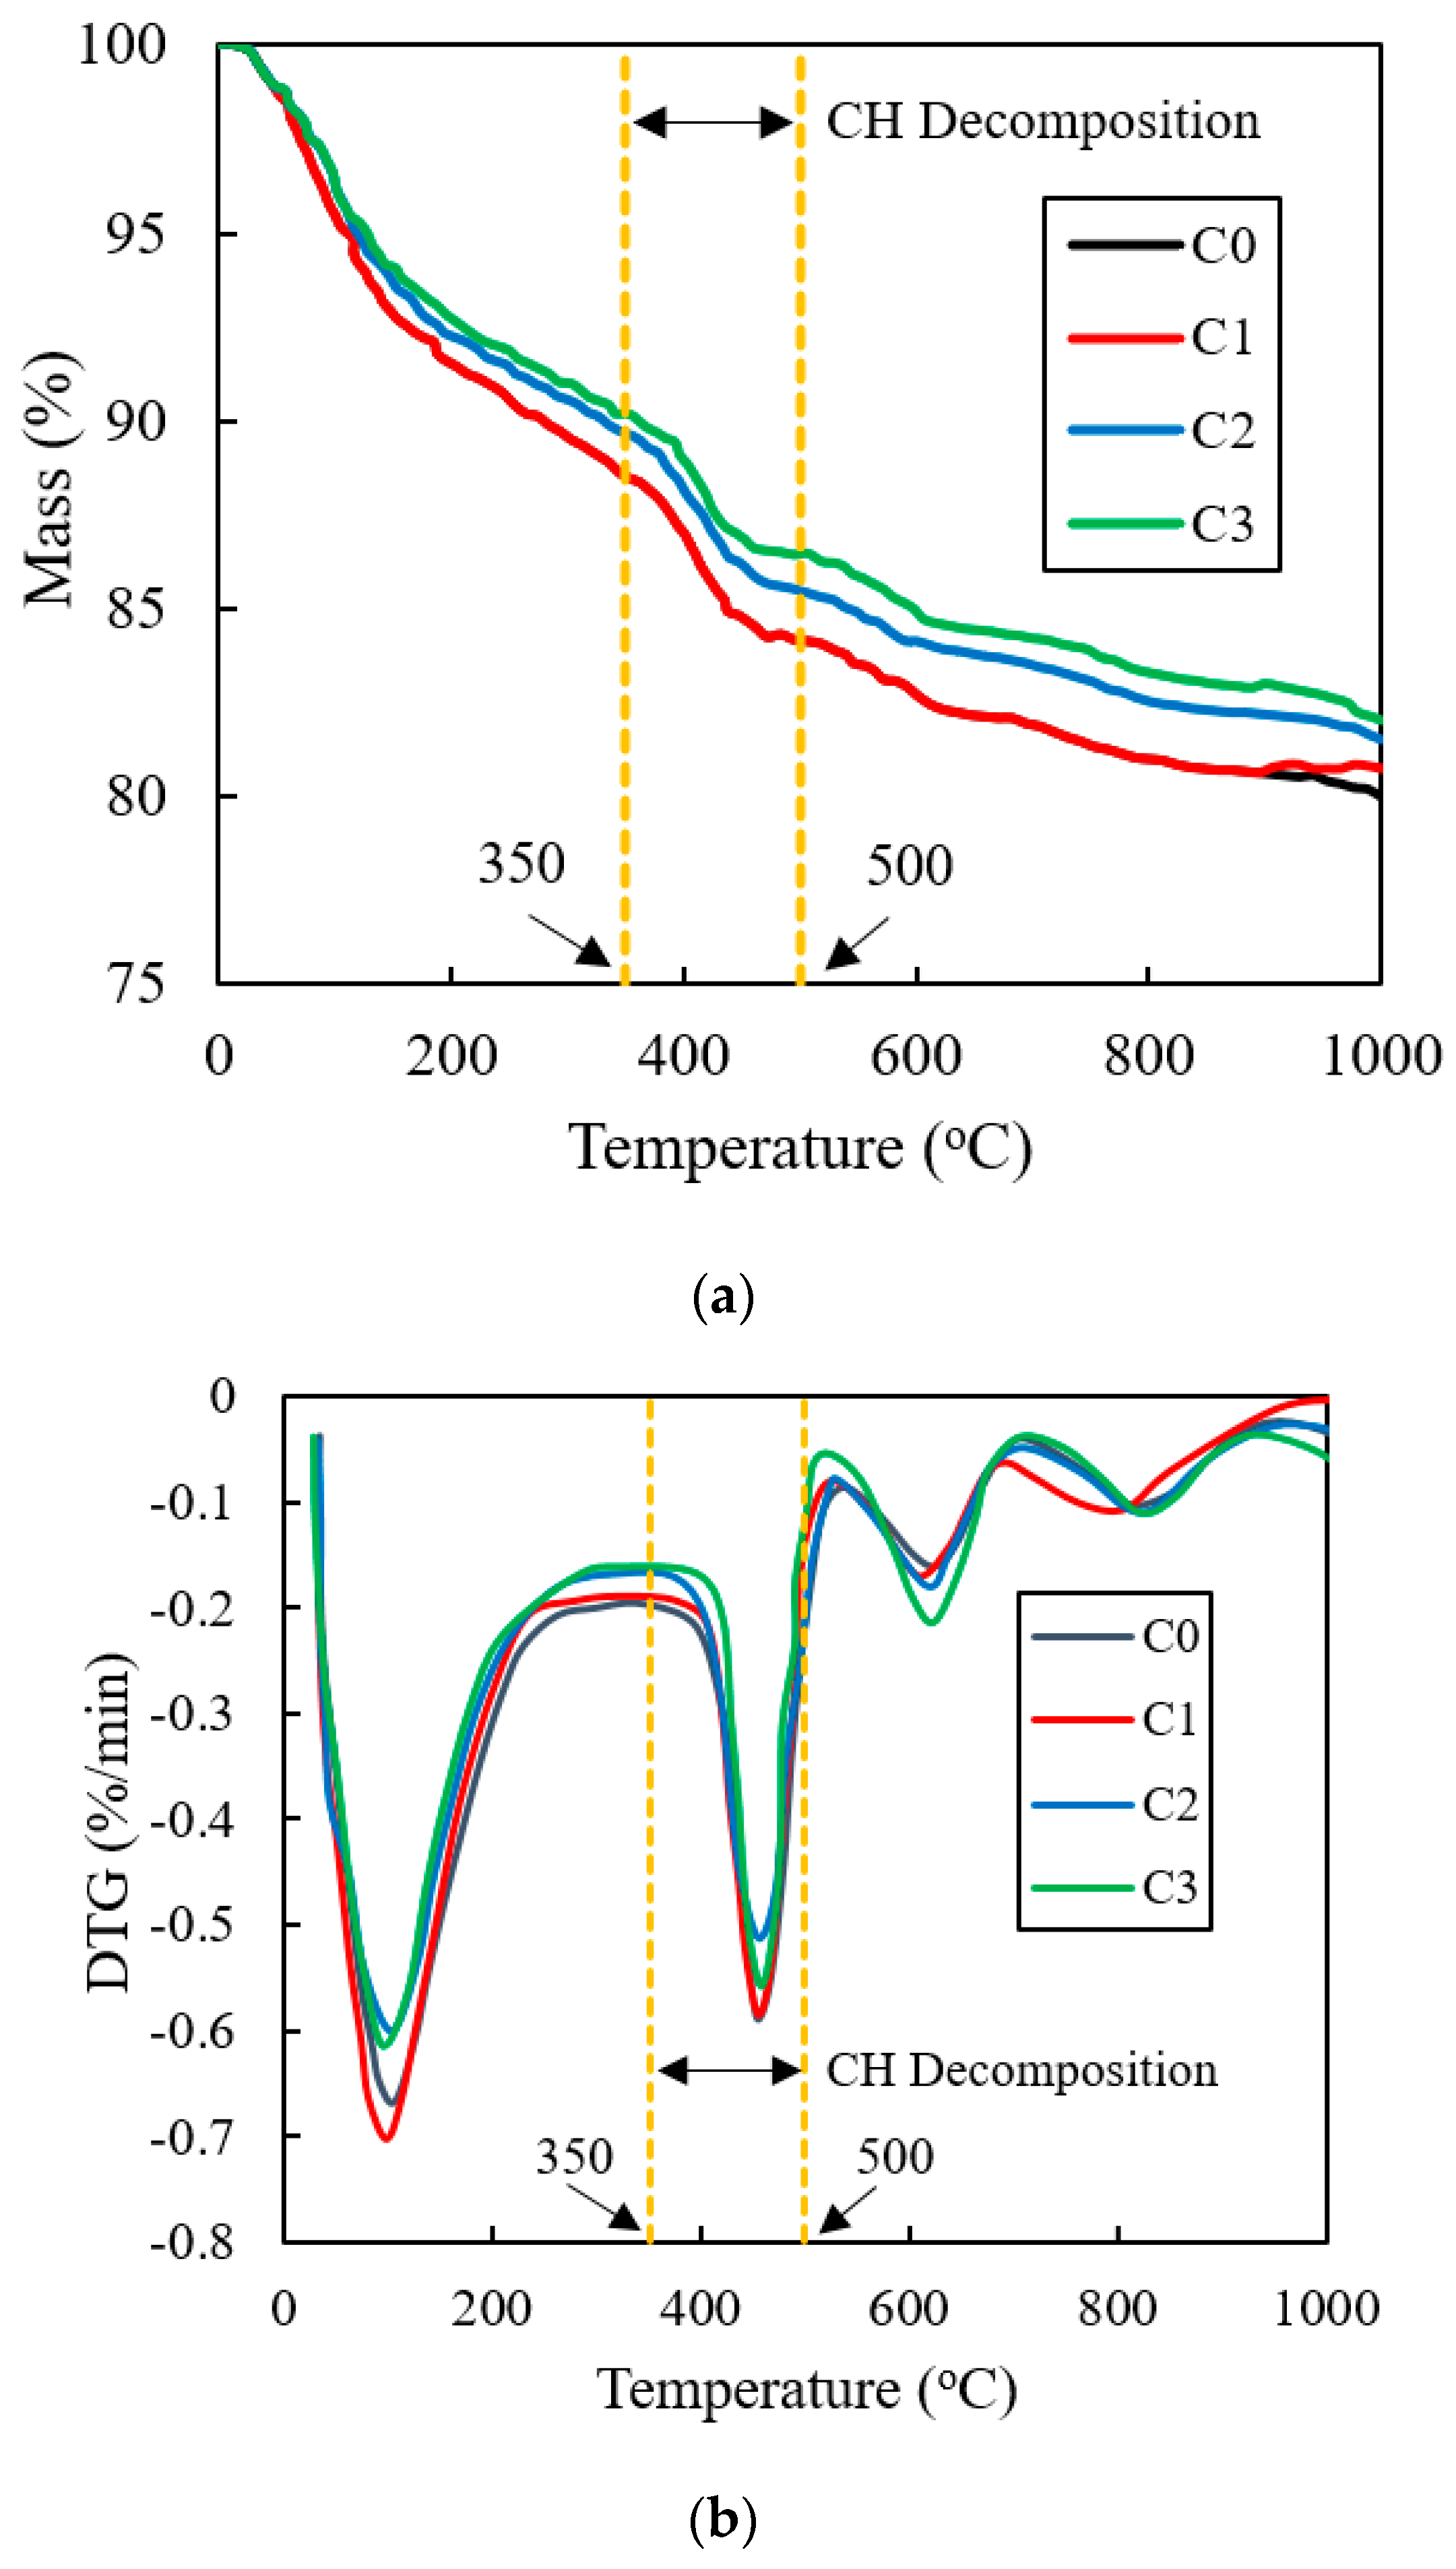
The TG test results of C0, C1, C2, and C3 are exhibited in Figure 7. From Figure 7a, it can be seen that when the temperature increased, the mass of each group of the samples presented a downward trend which was significantly enhanced between 350–500 °C, corresponding to the obvious peaks and valleys and inflection points shown in Figure 7b. This temperature range was the stage where the CH underwent thermal decomposition [43]. According to Figure 7a, the mass loss values of the four groups of samples C0, C1, C2, and C3 at this stage were 3.35%, 4.12%, 4.59%, and 5.21%. Compared with C0, the mass loss values of C1, C2, and C3 increased by 23.0%, 37.0%, and 55.5%.

3.8. SEM

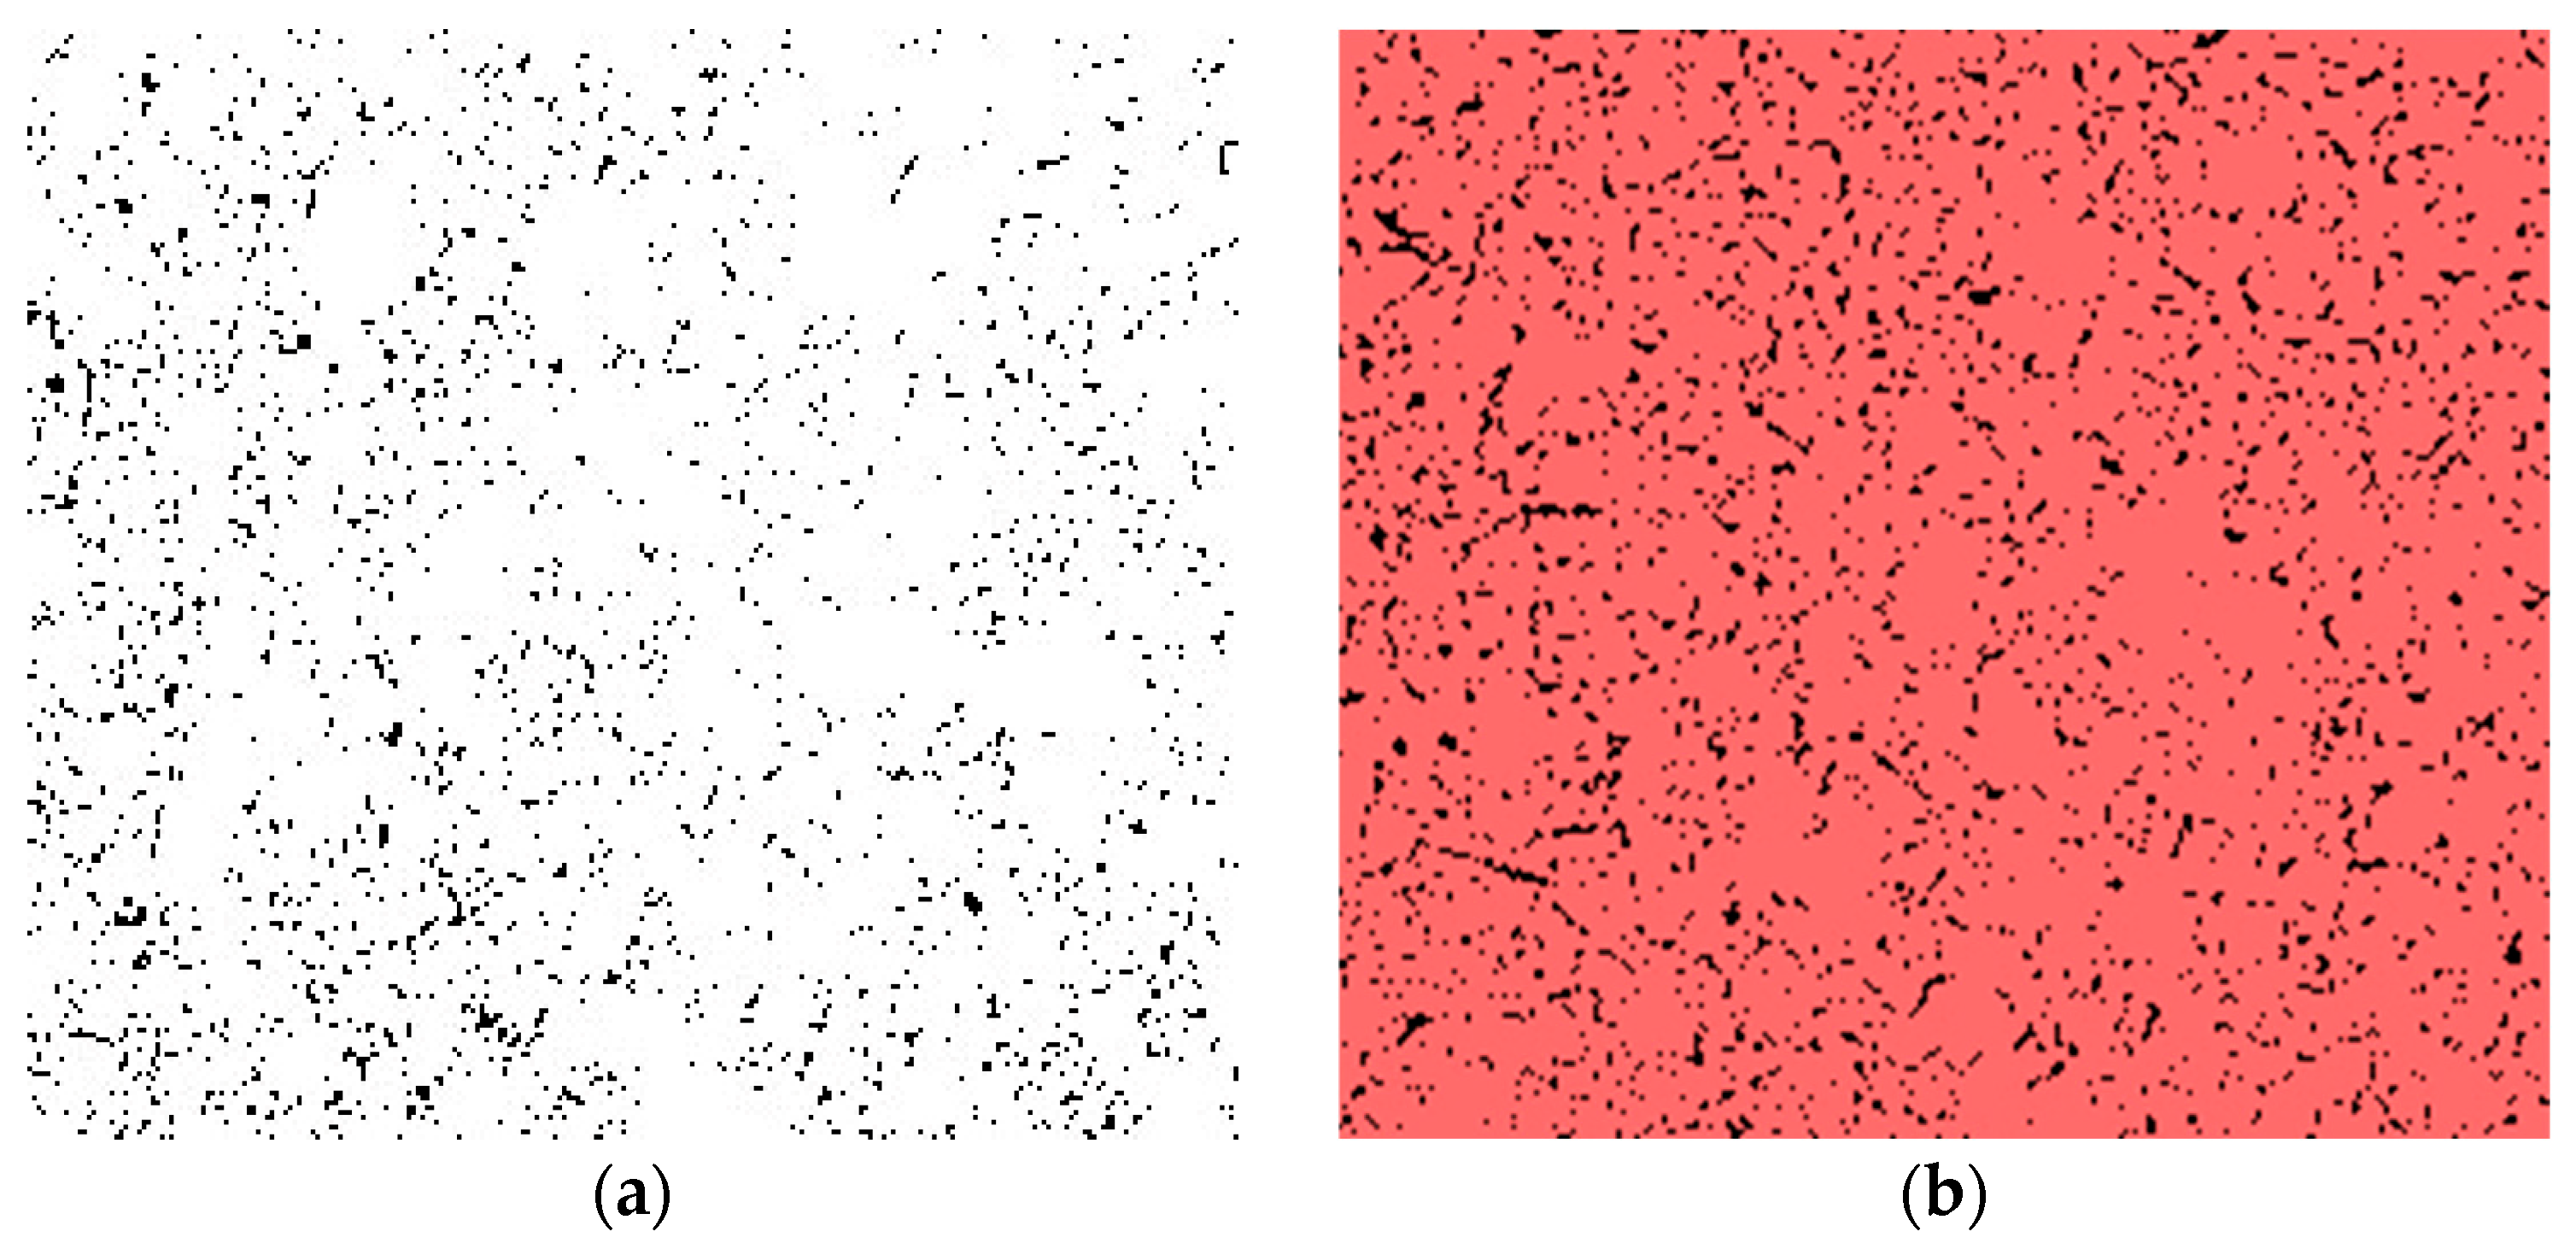
Figure 8 shows the SEM results of C0, C1, C2, and C3. Then, the binary processing method was utilized to obtain the distribution of pores from the SEM images by setting the pixel threshold upper limit of pores as 90 [44], shown in Figure 9. In the images, the black areas represented the pores in the cement paste. By statistics, the proportion of black areas to the whole image can be regarded as the porosity of the material. The calculated results are shown in Table 6. It can be seen that when VRPCE1, VRPCE2, and VRPCE3 were added to the cement paste, the porosity on the surface of the cement samples gradually increased, which was consistent with the MIP results.

3.9. Fluidity

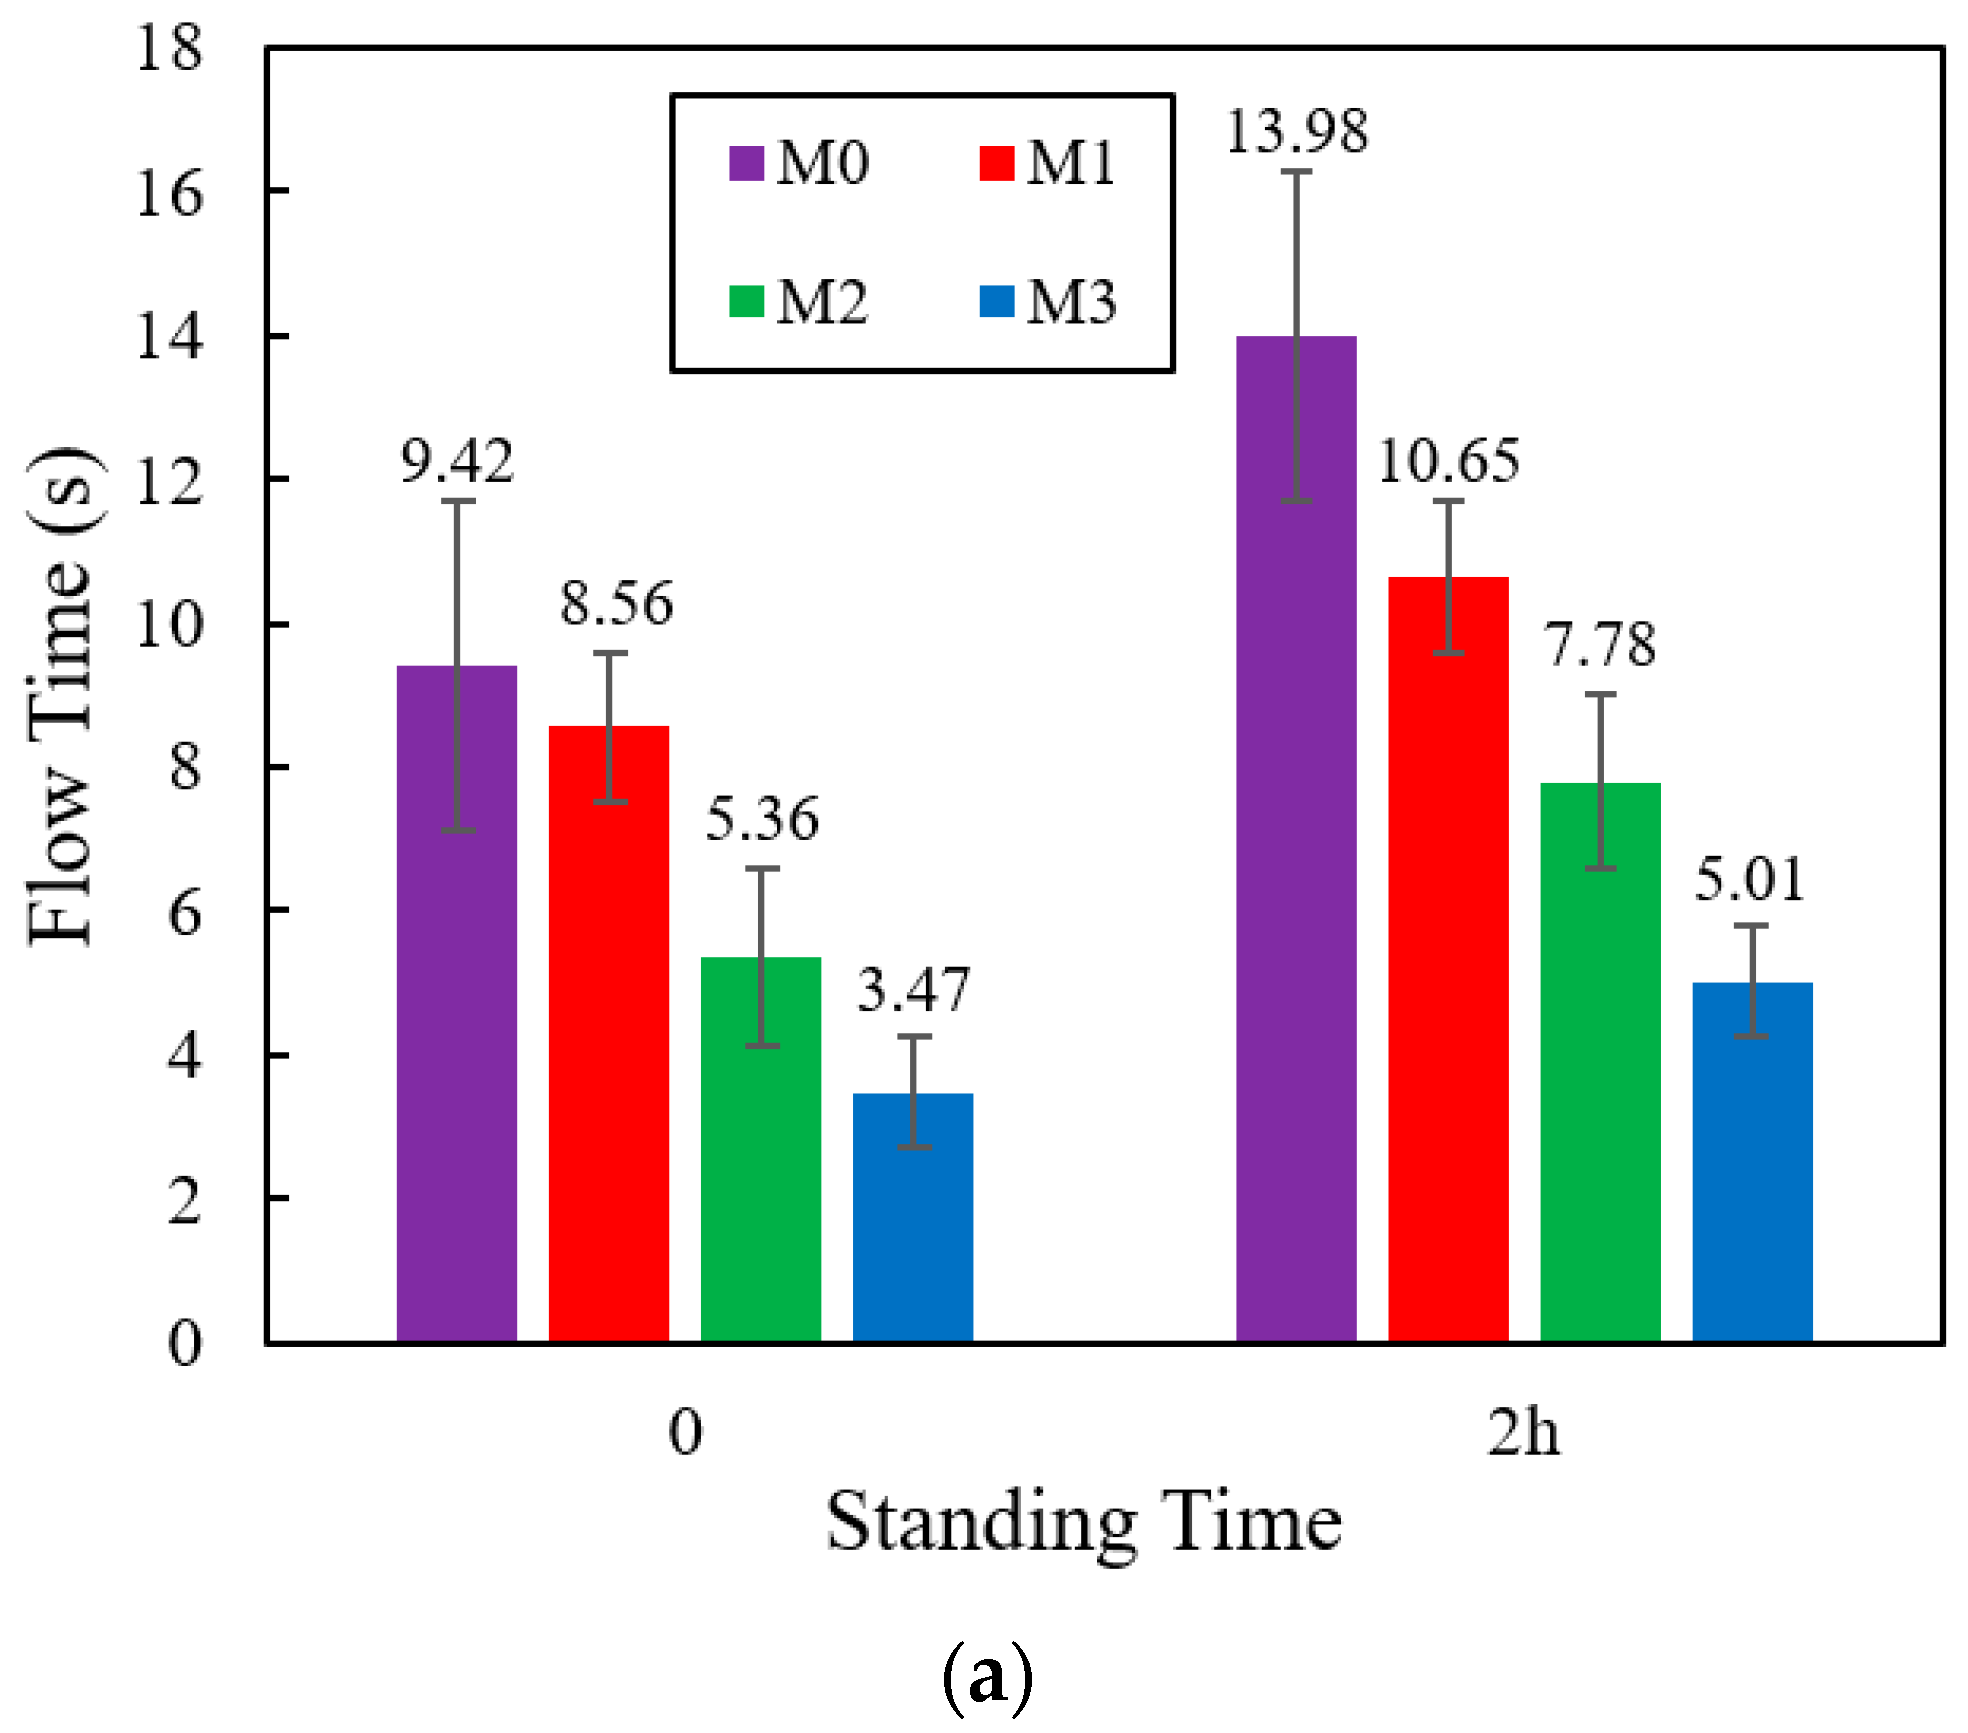
The flow time and slump flow of M0, M1, M2, M3 are shown in Figure 10 with standing times of 0 and 2 h. From Figure 10a, it can be seen that when the VRPCEs were mixed with the cement mortar, the flow time of the samples gradually decreased. When the standing time was 0, the flow time of M1, M2, and M3 decreased by 9.1%, 43.1%, and 63.2% compared to M0. When the standing time was 2 h, the flow time of M1, M2, and M3 decreased by 23.8%, 44.3%, and 64.2% compared to M0. In Figure 10b, it can be seen that when the standing time was 0, the slump flow of M1, M2, and M3 increased by 2.4%, 7.1%, and 11.5%, compared to M0. When the standing time was 2 h, the slump flow of M1, M2, and M3 increased by 2.8%, 6.0%, and 11.7%, compared to M0.

3.10. Compressive Strength

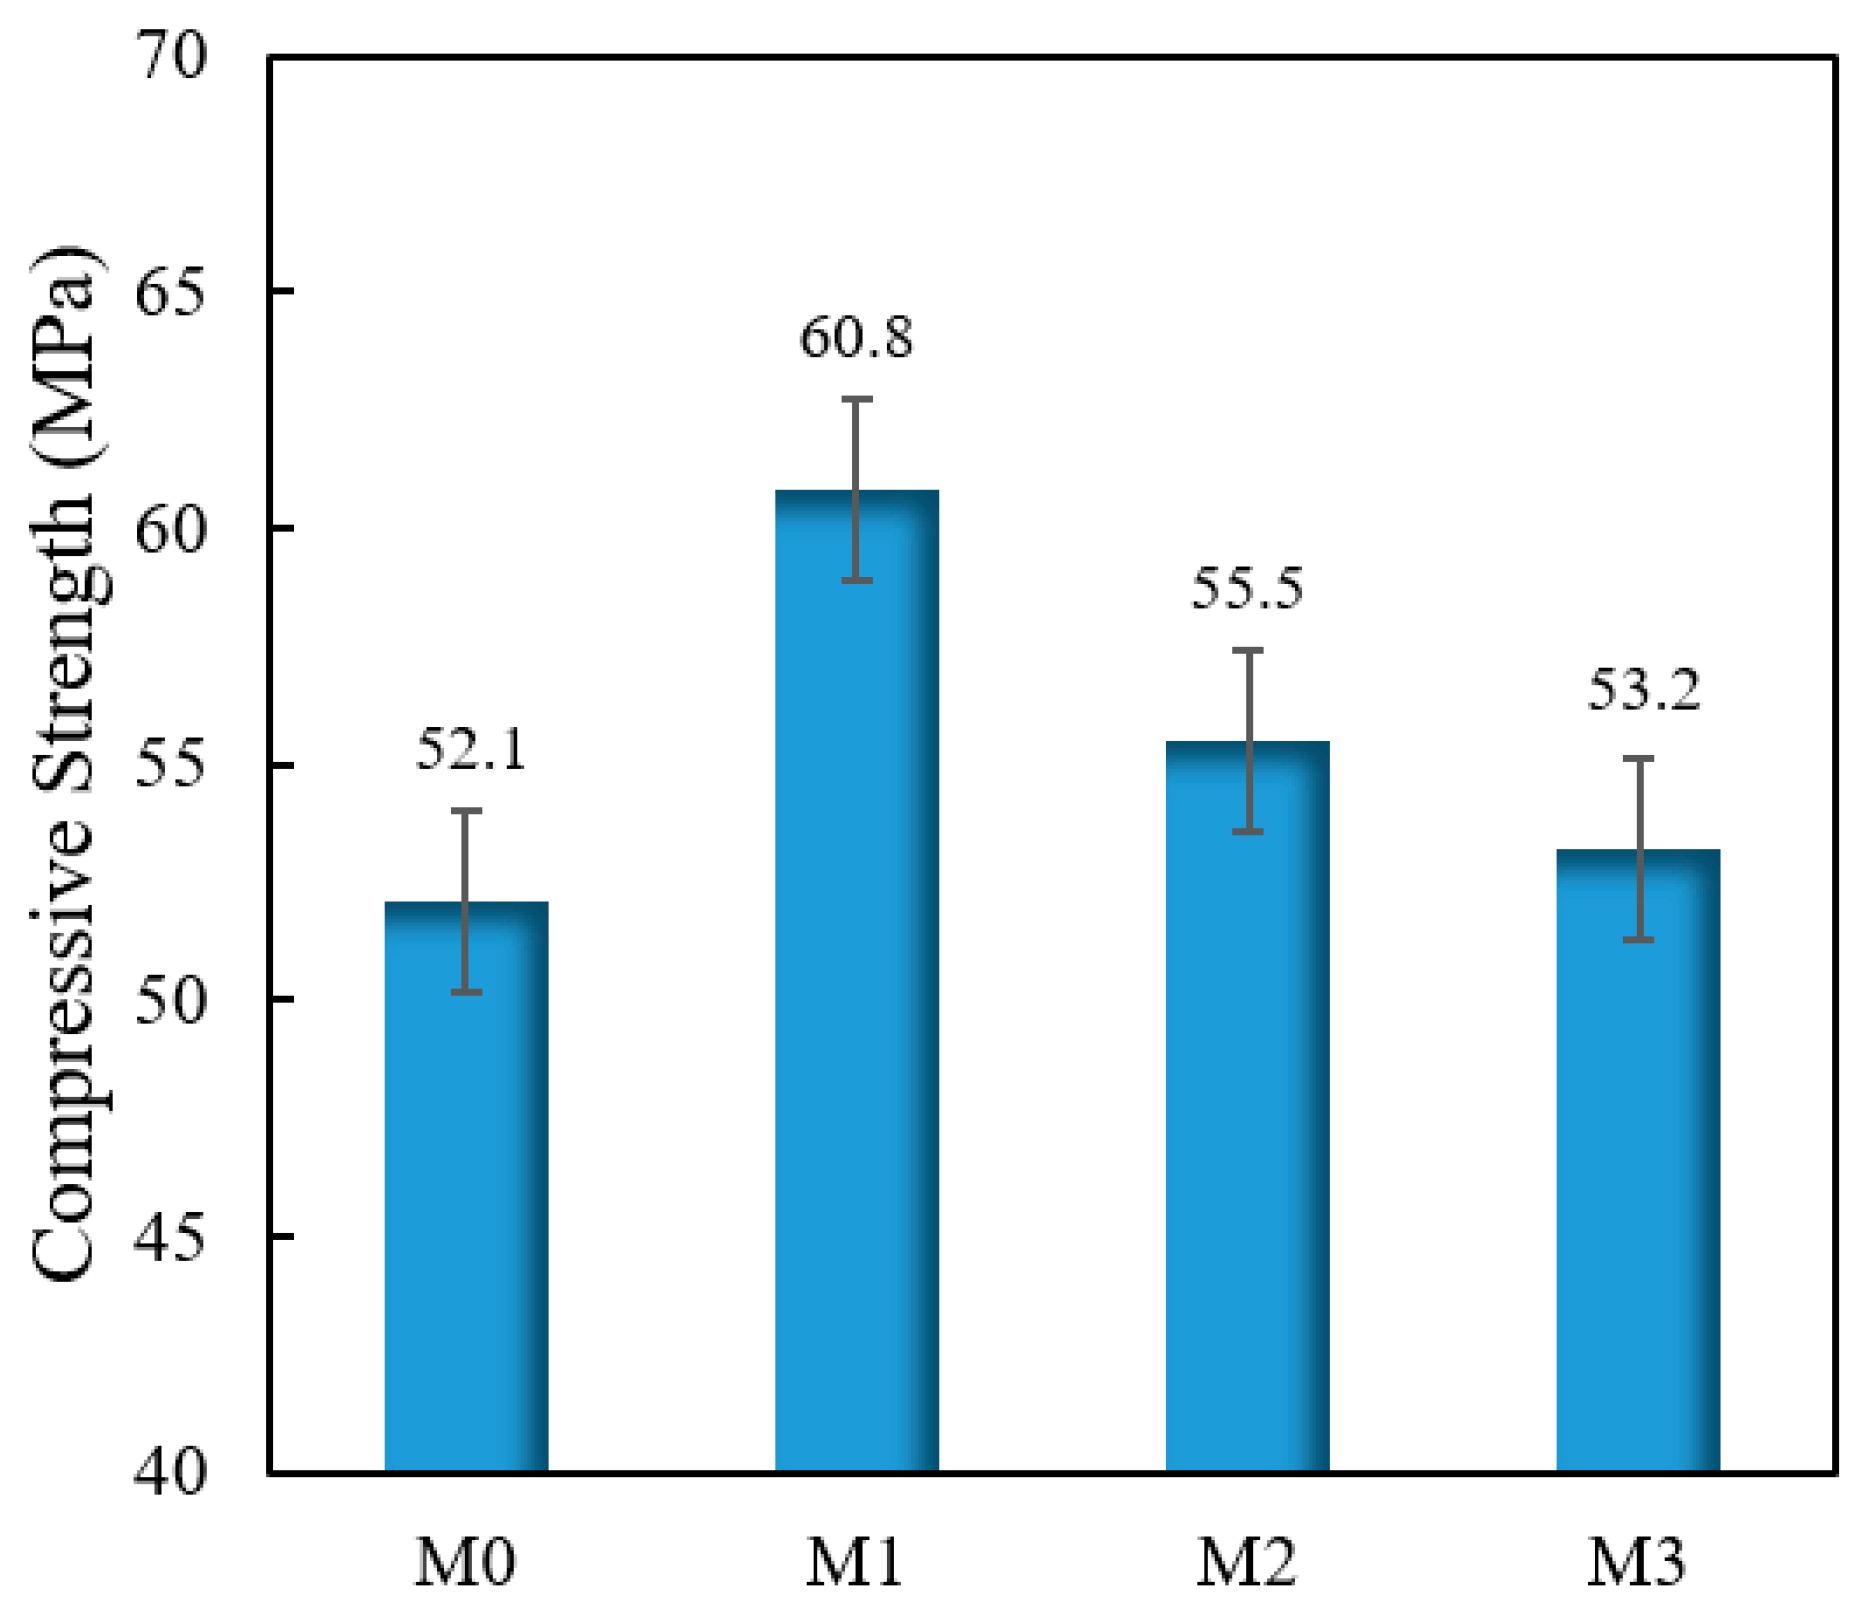
The compressive strength of the cement mortar cured for 28 d under standard conditions is depicted in Figure 11. When the VRPCEs were mixed with the cement mortar, the compressive strengths of the samples increased. Compared with M0, the compressive strength of M1, M2, and M3 increased by 16.7%, 6.5%, and 2.1%, respectively.

3.11. Shrinkage

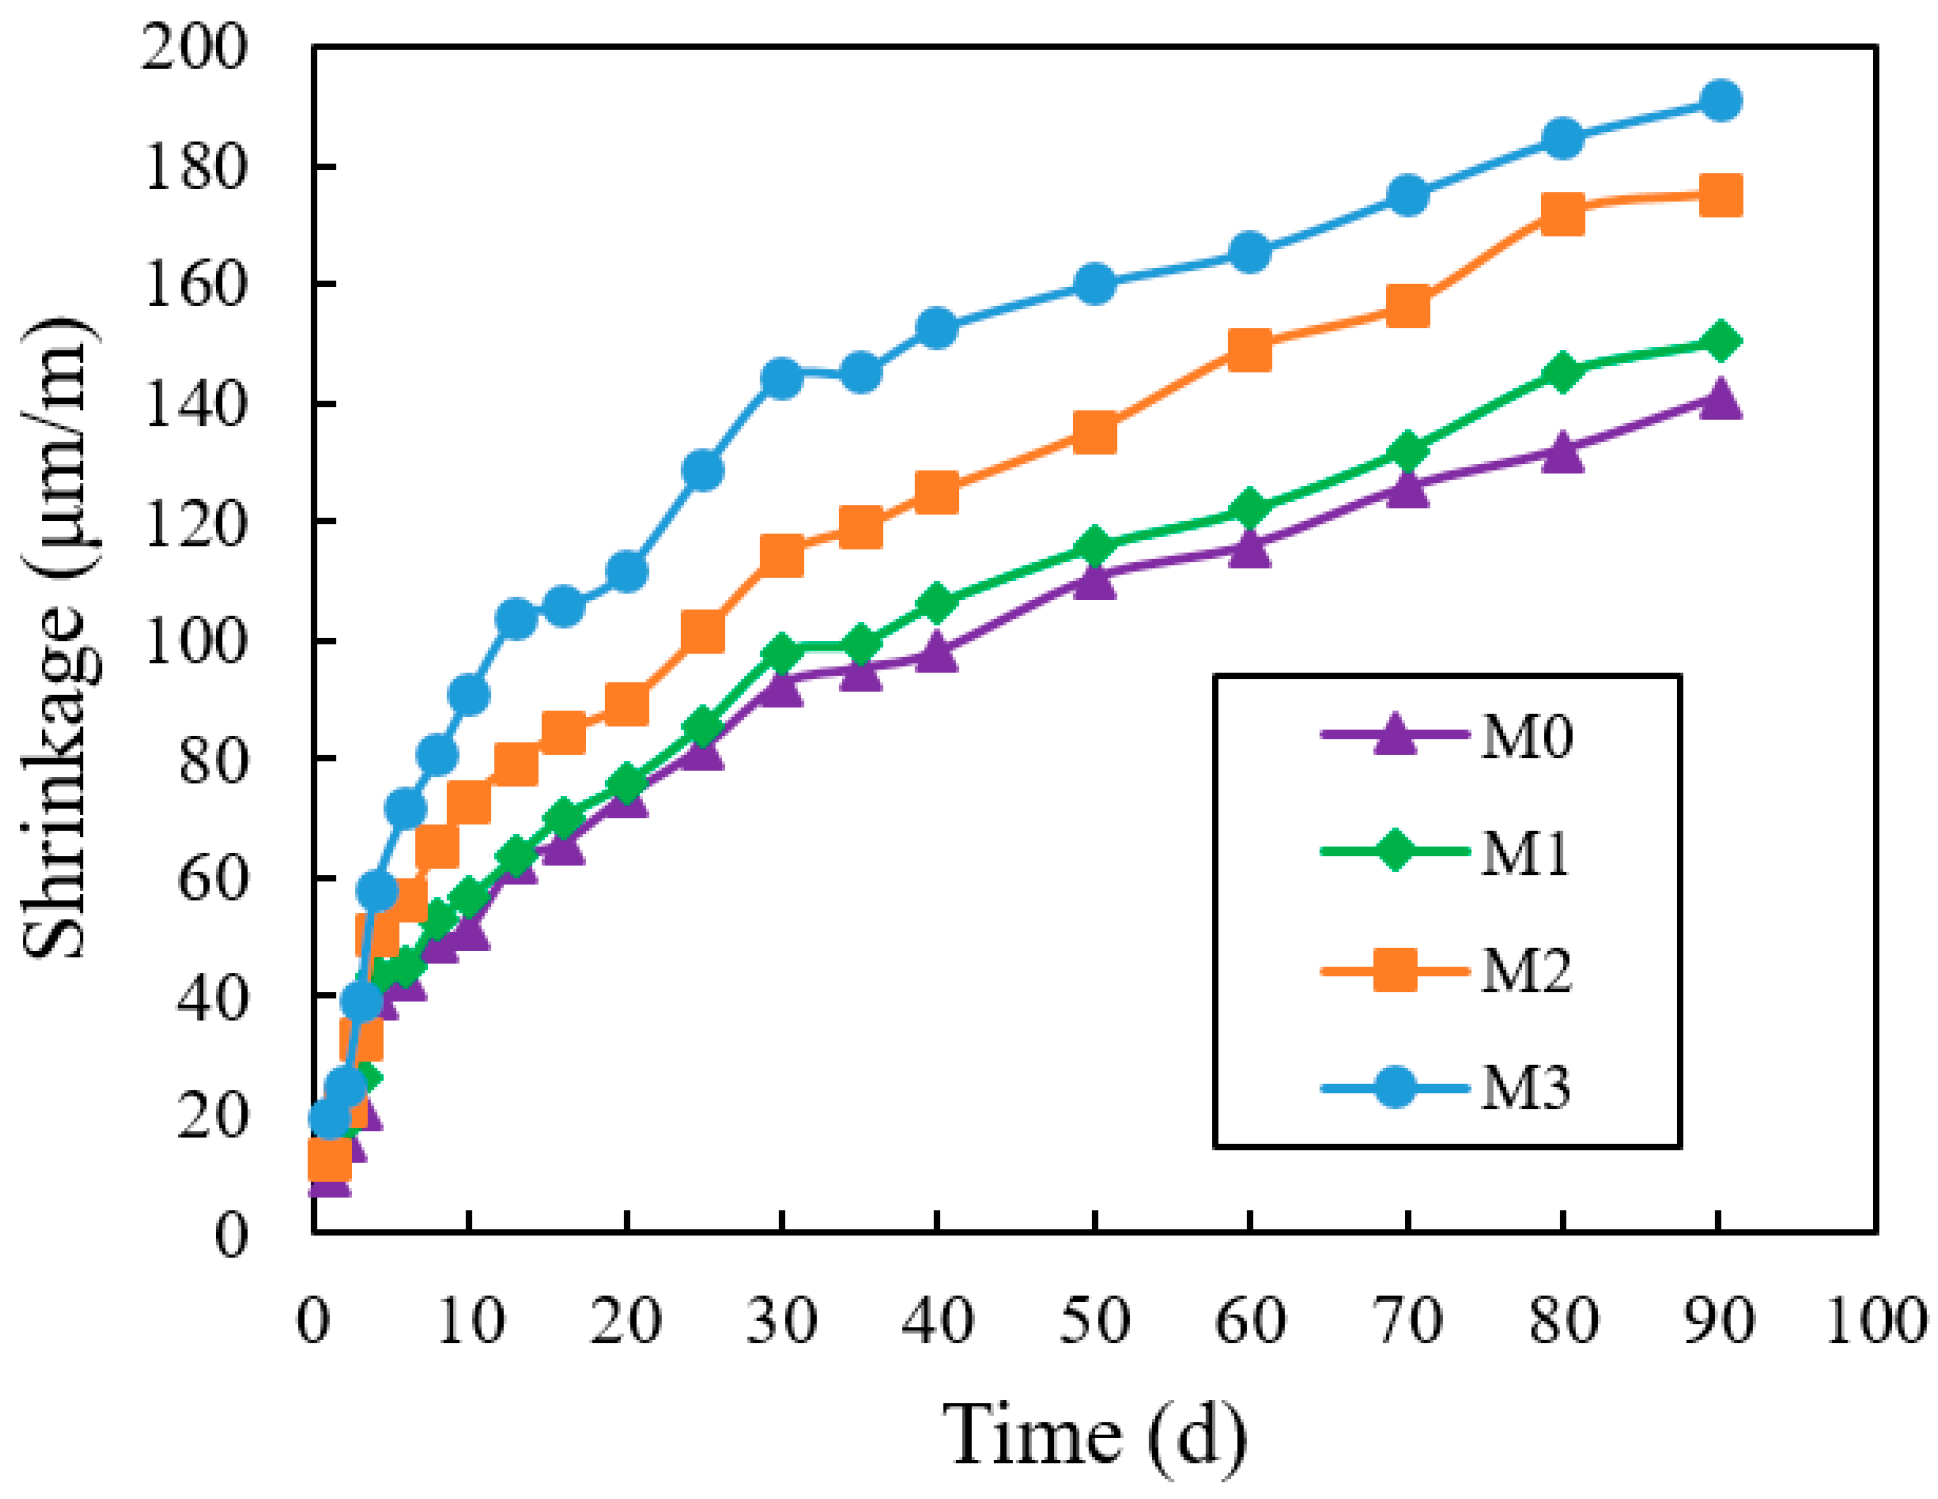
The change process of the shrinkage rate of the cement mortar over time within 90 d is shown in Figure 12. It can be seen that the shrinkage of the four groups of cement mortar samples gradually increased. Taking the 90 d shrinkage value as an example, compared to M0, the shrinkage of M1, M2, and M3 increased by 6.6%, 24.2%, and 35.4%.

3.12. Creep

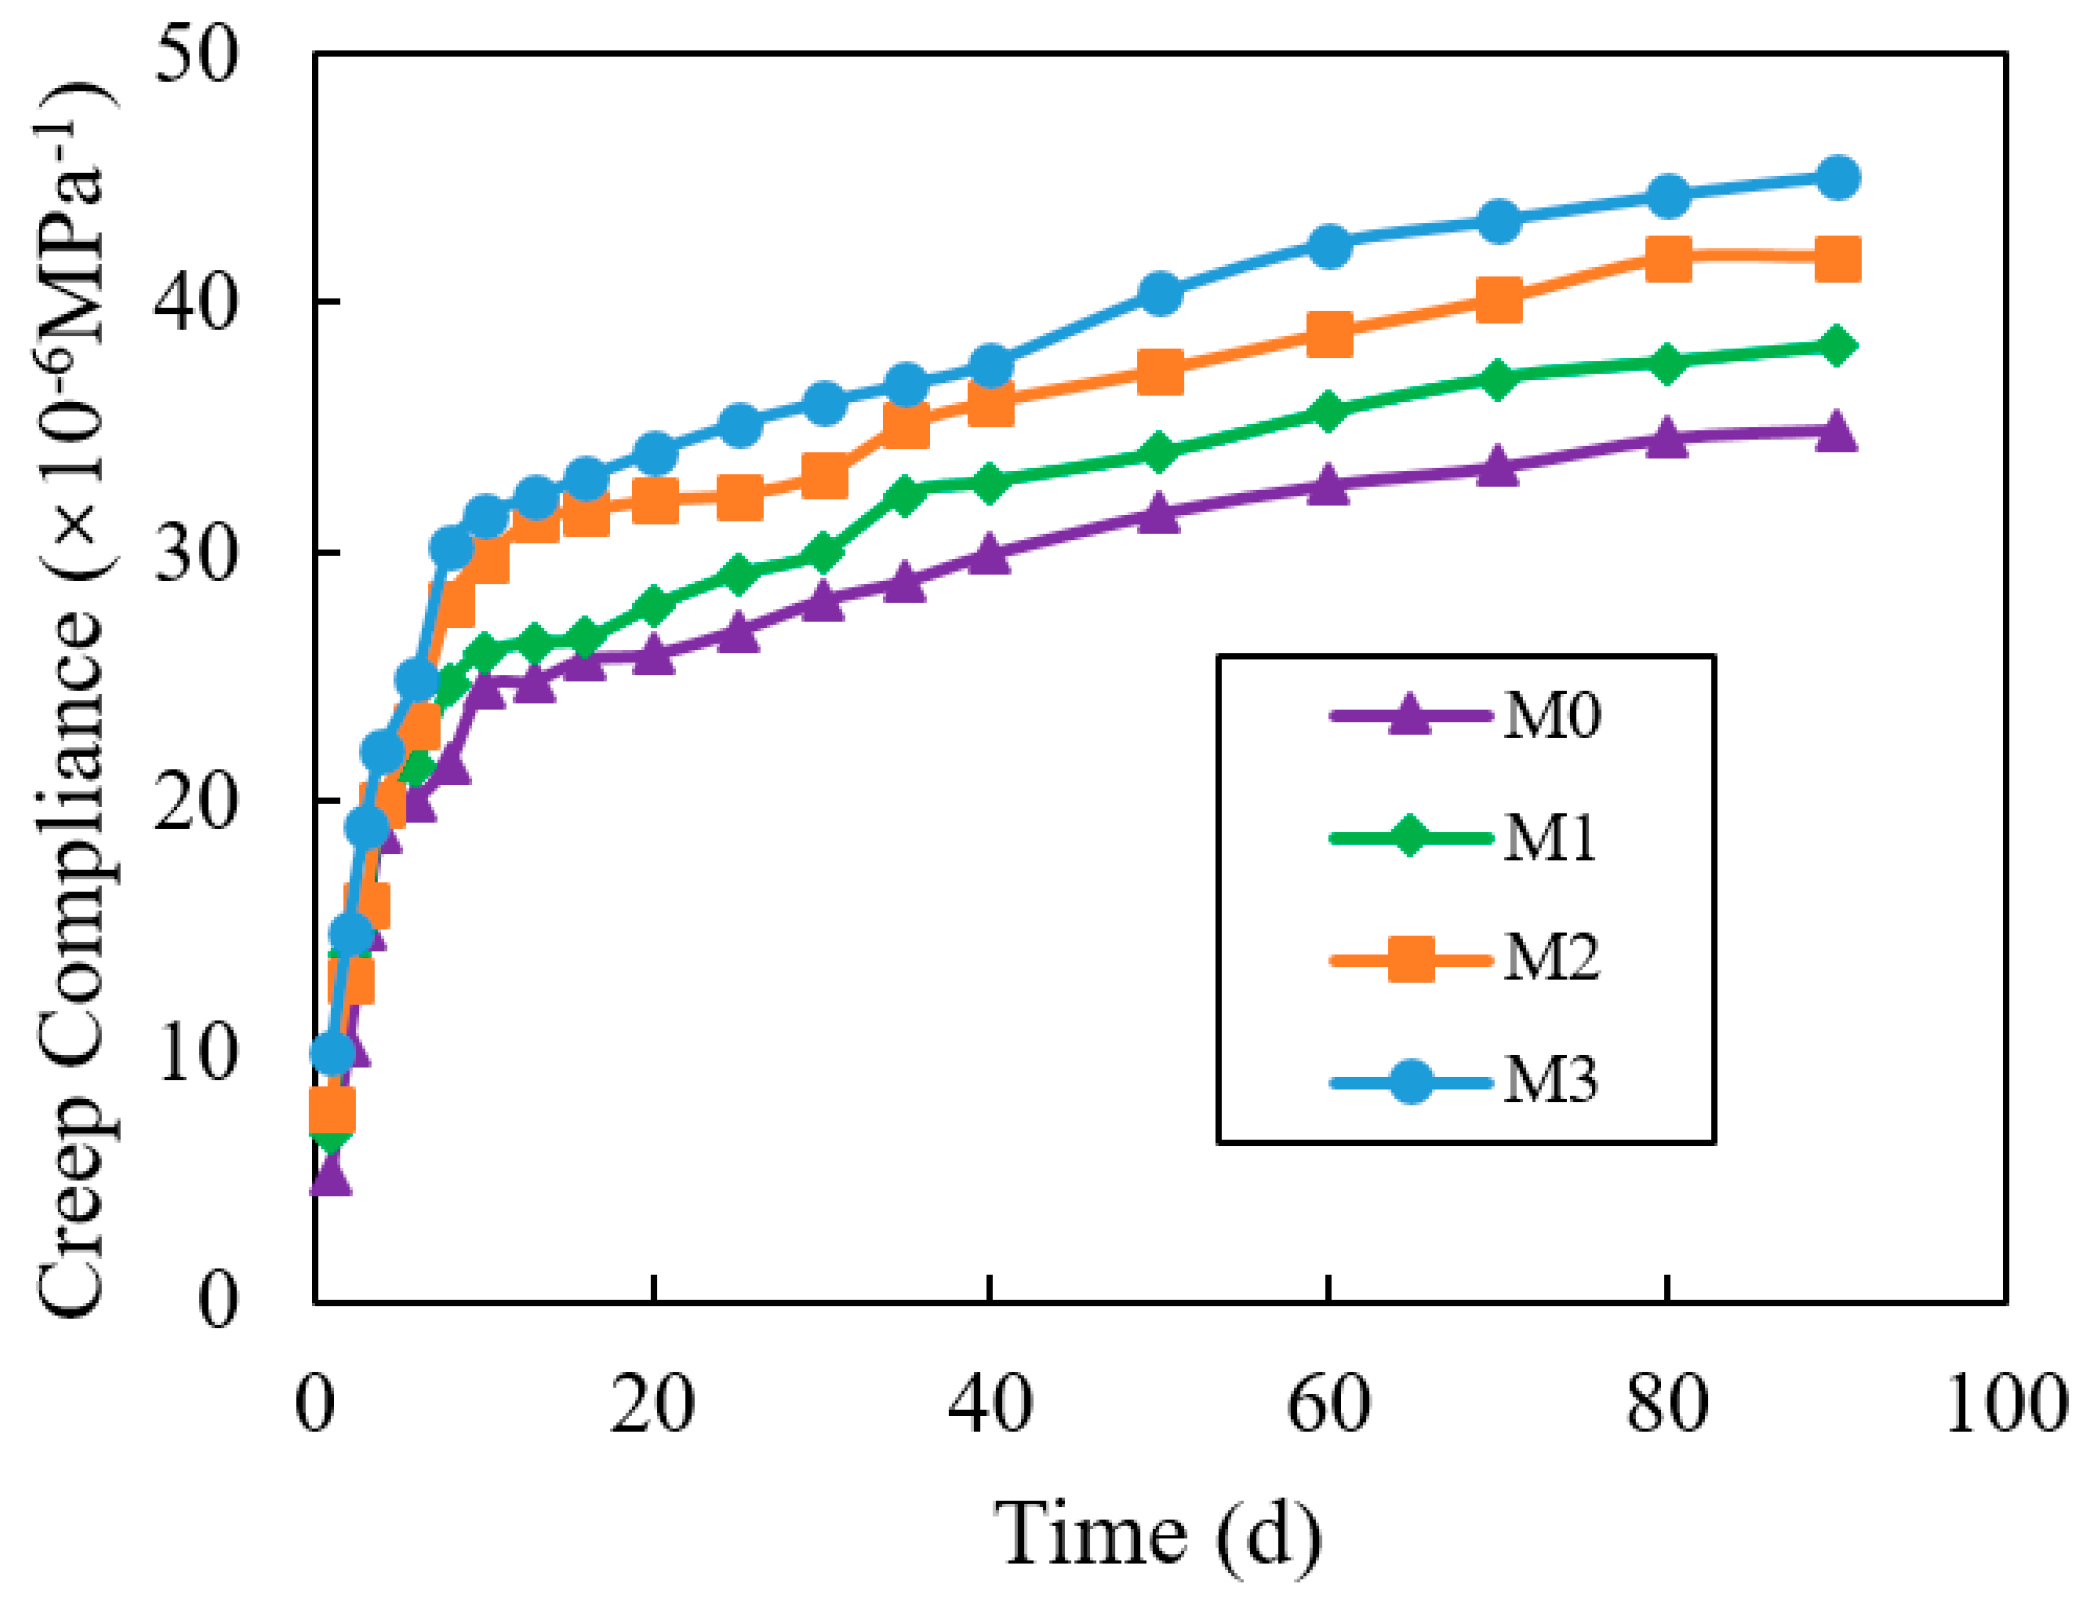
The variation process of the creep of the cement mortar over time within 90 d is shown in Figure 13. It can be seen that the creep degree of the four groups of the cement mortar samples gradually decreased. Taking the 90 d creep degree as an example, compared to M0, the creep degrees of M1, M2, and M3 decreased by 7.1%, 15.2%, and 22.5%.

4. Discussion

4.1. Molecular Weight and Molecular Weight Distribution

The number-average molecular weight and weight-average molecular weight of the three VRPCEs continuously declined, and the polymer dispersion index was in a narrow range of 2.0–2.2. It indicated that the molecular weights of the three VRPCEs were relatively large and the molecular weight distribution was relatively uniform [45].

4.2. Adsorption

As the concentration of the VRPCEs increased, the adsorption capacity values displayed a relationship, which was VRPCE1 > VRPCE2 > VRPCE3. This was mainly because the amount of heterologous charges that can be adsorbed at the adsorption sites on the surface of the cement particles was the same, and the relationship between the amount of the heterologous charges COO carried by each VRPCE molecule was VRPCE1 < VRPCE2 < VRPCE3. Therefore, the number of molecules adsorbed onto the surface of the cement particles conformed to the rule: VRPCE1 > VRPCE2 > VRPCE3. Moreover, the GPC results showed that the Mw of the VRPCEs did not differ significantly. Therefore, the adsorption amount also exhibited the rule of VRPCE1 > VRPCE2 > VRPCE3.

4.3. Dispersion

The absolute value relationship of zeta potential of the cement particles was VRPCE3 > VRPCE2 > VRPCE1. The higher the absolute value of zeta potential, the greater the electrostatic repulsive force between cement particles, and the greater the ability to disperse the cement particles and to release more free water [46]. Due to the same amount of heterologous charges that can be adsorbed onto the surface of cement particles for the VRPCEs, and the existing relationship between the amount of heterologous charges COO carried by each VRPCE molecule and the rule VRPCE1 < VRPCE2 < VRPCE3, the absolute value relationship of zeta potential of the cement particles at the same concentration of the VRPCEs was VRPCE3 > VRPCE2 > VRPCE1.

4.4. Particle Size

Based on the particle size test, the effect of VRPCE on increasing the particle size of the cement was VRPCE3 > VRPCE2 > VRPCE1.

4.5. Compositions

From XRD, it can be seen that the types of hydration products of cement did not change after the addition of the water-reducing agent, and there was no significant difference in the diffraction peak intensity of various hydration products. This indicated that the addition of VRPCEs did not change the hydration products of the cement.

4.6. Pores

The VRPCEs gradually increased the porosity of the cement, gradually increased the proportion of gel pores, reduced the proportion of transitional pores, capillary pores, and large pores, and gradually reduced the most probable apertures of the cement. It can be inferred that: (1) The ability of VRPCE1, VRPCE2, and VRPCE3 to improve the pore structure of cement gradually increased; (2) The air entrainment capabilities of VRPCE1, VRPCE2, and VRPCE3 gradually increased; (3) As the particle size of cement increased, the hydration degree of the cement decreased.

4.7. TG

As an important by-product of the cement hydration to produce gel, CH can reflect the increase in gel production. Therefore, the VRPCEs can improve the hydration degree of the cement, and VRPCE3 had the best effect.

4.8. SEM

The binary processing method was used to obtain the pore distribution of the cement paste with the VRPCEs and the porosity values were basically consistent with the MIP results. However, obtaining the pore distribution of materials through binary processing had limitations as the nanopores cannot be identified completely. Therefore, the obtained porosity was not absolutely consistent with the porosity obtained from the MIP test.

4.9. Fluidity

The VRPCEs can reduce the viscosity of the mortar and improve the fluidity of the mortar, and VRPCE3 had the best effect. The reasons were, on the one hand, the particle size of the cement mixed with the VRPCEs increased, resulting in the hydration film thicker, which enhanced lubricating effect of the cement. On the other hand, the cement particles within the VRPCEs had higher zeta potential, stronger repulsive force, and larger spacing between cement particles. Therefore, the fluidity of the cement mortar was promoted.

4.10. Compressive Strength

The degree of increase in compressive strength of the samples gradually decreased. The reason was that the VRPCEs improved the hydration degree of the cement, but the porosity of the mortar also gradually increased.

4.11. Shrinkage

The VRPCEs can increase the shrinkage of the cement mortar, and the effect of VRPCE3 was the most obvious. The reason was that the VRPCE increased the porosity and the amount of the gel of the mortar. Due to limited time, this article only tested the shrinkage performance of cement mortar after adding water reducer for 90 days, and did not test the long-term shrinkage performance of the cement mortar.

4.12. Creep

The VRPCEs can effectively reduce the creep degree of the cement mortar, and VRPCE3 had the best effect. The reason was that the VRPCEs increased the porosity of the cement mortar, weakened the transmission strength, and expanded the transmission time of the water in the mortar. Therefore, the gel flow and slip in cement mortar was easier [47]. Similarly, due to limited time, this article only tested the creep performance of cement mortar after adding water reducer for 90 days, and did not test the long-term creep performance of the cement mortar.

5. Conclusions

The conclusions are as follows:
  • Reducing the content of HPEG and increasing the content of AA can reduce the number average molecular weight and weight average molecular weight of the VRPCE from 46,162 to 34,053, and 82,186 to 71,985. Moreover, the content variation of HPEG and AA had a small impact on the polymer dispersibility index which was in the range of 2.0–2.2;
  • When the concentration of the VRPCEs increased by five times, the adsorption capacity of the VRPCE1, VRPCE2, and VRPCE3 onto cement particles increased by 5.86, 6.01, and 7.64 times, respectively. Therefore, the effect on increasing the adsorption amount of cement particles was VRPCE1 > VRPCE2 > VRPCE3. When the concentration of VRPCEs was 10 g/L, the absolute zeta potential values of the cement particles within the VRPCEs increased by 33.1%, 33.3%, and 32.0% compared to that when the concentration of the VRPCEs was 2 g/L. When the concentration of the VRPCEs was 10 g/L, the particle size of the cement increased by 22.87%, 39.56%, and 46.86%. Hence, the effect of increasing the absolute value of zeta potential on the surface of cement particles and the particle size of cement particles were VRPCE1 < VRPCE2 < VRPCE3;
  • The porosity of C0, C1, C2, and C3 gradually increased, increasing by 0.03%, 30.0%, and 56.9%, compared to C0. The mass loss values of C1, C2, and C3 increased by 23.0%, 37.0%, and 55.5%, compared with C0. Therefore, the effect of improving the hydration degree of cement, increasing the porosity, and optimizing the pore structure was VRPCE1 < VRPCE2 < VRPCE3;
  • When the standing time was 2 h, the flow time of M1, M2, and M3 decreased by 23.8%, 44.3%, and 64.2%, compared to M0. The compressive strength of M1, M2, and M3 increased by 16.7%, 6.5%, and 2.1%, compared with M0. The shrinkage of M1, M2, and M3 increased by 6.6%, 24.2%, 35.4%. compared to M0. The creep degrees of M1, M2, and M3 decreased by 7.1%, 15.2%, and 22.5%, compared to M0. Hence, the impact on increasing the fluidity and shrinkage of cement mortar, reducing compressive strength and creep, was VRPCE1 < VRPCE2 < VRPCE3.

Author Contributions

Z.W.: Methodology, Writing—review and editing, Funding acquisition. Y.S.: Writing—original draft, Investigation; Y.L.: Funding acquisition, Supervision. Y.T.: Investigation. All authors have read and agreed to the published version of the manuscript.

Funding

This research was funded by National Natural Science Foundation of China—China National Railway Group Co., Ltd. Railway Basic Research Joint Fund Project (U2368207); Natural Science Foundation of Beijing, China (24JL003); National Natural Science Foundation of China (52108188); Opening Project of State Key Laboratory of Green Building Materials (2022GBM10); Open Research Fund of Key Laboratory of Engineering Materials of Ministry of Water Resources, China Institute of Water Resources and Hydropower Research (EMF202407); General project of science and technology plan of Beijing Municipal Commission of Education (KM202110005018).

Data Availability Statement

Some or all of the data, models, or code that support the findings are available upon reasonable request.

Conflicts of Interest

The authors declare no conflict of interest.

References

  1. Yi, N.H.; Kim, J.H.J.; Han, T.S.; Cho, Y.G.; Lee, J.H. Blast-resistant characteristics of ultra-high strength concrete and reactive powder concrete. Constr. Build. Mater. 2012, 28, 694–707. [Google Scholar] [CrossRef]
  2. Riedel, W.; Noldgen, M.; Strassburger, E.; Thoma, K.; Fehling, E. Local damage to Ultra High Performance Concrete structures caused by an impact of aircraft engine missiles. Nucl. Eng. Des. 2010, 240, 2633–2642. [Google Scholar] [CrossRef]
  3. Wang, C.; Yang, C.H.; Liu, F.; Wan, C.J.; Pu, X.C. Preparation of Ultra-High Performance Concrete with common technology and materials. Cem. Concr. Compos. 2012, 34, 538–544. [Google Scholar] [CrossRef]
  4. Emdadi, A.; Mehdipour, I.; Libre, N.A.; Shekarchi, M. Optimized workability and mechanical properties of FRCM by using fiber factor approach: Theoretical and experimental study. Mater. Struct. 2015, 48, 1149–1161. [Google Scholar] [CrossRef]
  5. Mardani-Aghabaglou, A.; Tuyan, M.; Yilmaz, G.; Arioz, O.; Ramyar, K. Effect of different types of superplasticizer on fresh, rheological and strength properties of self-consolidating concrete. Constr. Build. Mater. 2013, 47, 1020–1025. [Google Scholar] [CrossRef]
  6. Shi, C.J.; Wu, Z.M.; Xiao, J.F.; Wang, D.H.; Huang, Z.Y.; Fang, Z. A review on ultra high performance concrete: Part I. Raw materials and mixture design. Constr. Build. Mater. 2015, 101, 741–751. [Google Scholar] [CrossRef]
  7. Li, J.Y.; Yao, Y. A study on creep and drying shrinkage of high performance concrete. Cem. Concr. Res. 2001, 31, 1203–1206. [Google Scholar] [CrossRef]
  8. Sobuz, H.R.; Visintin, P.; Ali, M.S.M.; Singh, M.; Griffith, M.C.; Sheikh, A.H. Manufacturing ultra-high performance concrete utilising conventional materials and production methods. Constr. Build. Mater. 2016, 111, 251–261. [Google Scholar] [CrossRef]
  9. Wen, X.D.; Feng, L.; Hu, D.Y.; Wang, K.; Zhenya, Z.Y. Effect of side-chain length in polycarboxylic superplasticizer on the early-age performance of cement-based materials. Constr. Build. Mater. 2019, 211, 26–32. [Google Scholar] [CrossRef]
  10. Yamada, K.; Takahashi, T.; Hanehara, S.; Matsuhisa, M. Effects of the chemical structure on the properties of polycarboxylate-type superplasticizer. Cem. Concr. Res. 2000, 30, 197–207. [Google Scholar] [CrossRef]
  11. Zingg, A.; Winnefeld, F.; Holzer, L.; Pakusch, J.; Becker, S.; Figi, R.; Gauckler, L. Interaction of polycarboxylate-based superplasticizers with cements containing different C(3)A amounts. Cem. Concr. Compos. 2009, 31, 153–162. [Google Scholar] [CrossRef]
  12. Tan, H.B.; Gu, B.Q.; Guo, Y.L.; Ma, B.G.; Huang, J.; Ren, J.; Zou, F.B.; Guo, Y.F. Improvement in compatibility of polycarboxylate superplasticizer with poor-quality aggregate containing montmorillonite by incorporating polymeric ferric sulfate. Constr. Build. Mater. 2018, 162, 566–575. [Google Scholar] [CrossRef]
  13. Atarashi, D.; Yamada, K.; Itoh, A.; Miyauchi, M.; Sakai, E. Interaction between Montmorillonite and Chemical Admixture. J. Adv. Concr. Technol. 2015, 13, 325–331. [Google Scholar] [CrossRef]
  14. Liu, J.Z.; Wang, K.J.; Zhang, Q.Q.; Han, F.Y.; Sha, J.F.; Liu, J.P. Influence of superplasticizer dosage on the viscosity of cement paste with low water-binder ratio. Constr. Build. Mater. 2017, 149, 359–366. [Google Scholar] [CrossRef]
  15. Plank, J.; Sachsenhauser, B. Experimental determination of the effective anionic charge density of polycarboxylate superplasticizers in cement pore solution. Cem. Concr. Res. 2009, 39, 1–5. [Google Scholar] [CrossRef]
  16. Alonso, M.M.; Puertas, F. Adsorption of PCE and PNS superplasticisers on cubic and orthorhombic C(3)A. Effect of sulfate. Constr. Build. Mater. 2015, 78, 324–332. [Google Scholar] [CrossRef]
  17. Karihaloo, B.L.; Ghanbari, A. Mix proportioning of self-compacting high- and ultra-high-performance concretes with and without steel fibres. Mag. Concr. Res. 2012, 64, 1089–1100. [Google Scholar] [CrossRef]
  18. Poe, G.D.; Jarrett, W.L.; Scales, C.W.; McCormick, C.L. Enhanced coil expansion and intrapolymer complex formation of linear poly(methacrylic acid) containing poly(ethylene glycol) grafts. Macromolecules 2004, 37, 2603–2612. [Google Scholar] [CrossRef]
  19. Alonso, M.M.; Palacios, M.; Puertas, F. Compatibility between polycarboxylate-based admixtures and blended-cement pastes. Cem. Concr. Compos. 2013, 35, 151–162. [Google Scholar] [CrossRef]
  20. Perez-Nicolas, M.; Duran, A.; Navarro-Blasco, I.; Fernandez, J.M.; Sirera, R.; Alvarez, J.I. Study on the effectiveness of PNS and LS superplasticizers in air lime-based mortars. Cem. Concr. Res. 2016, 82, 11–22. [Google Scholar] [CrossRef]
  21. Lei, L.; Plank, J. Synthesis and Properties of a Vinyl Ether-Based Polycarboxylate Superplasticizer for Concrete Possessing Clay Tolerance. Ind. Eng. Chem. Res. 2014, 53, 1048–1055. [Google Scholar] [CrossRef]
  22. Zhang, Q.Q.; Liu, J.Z.; Liu, J.P.; Han, F.Y.; Lin, W. Effect of Superplasticizers on Apparent Viscosity of Cement-Based Material with a Low Water-Binder Ratio. J. Mater. Civ. Eng. 2016, 28, 1–7. [Google Scholar] [CrossRef]
  23. Zhang, Y.R.; Luo, X.; Kong, X.M.; Wang, F.Z.; Gao, L. Rheological properties and microstructure of fresh cement pastes with varied dispersion media and superplasticizers. Powder Technol. 2018, 330, 219–227. [Google Scholar] [CrossRef]
  24. Peng, X.Y.; Yi, C.H.; Deng, Y.H.; Qiu, X.Q. Synthesis and Evaluation of Polycarboxylate-Type Superplasticizers with Different Carboxylic Contents Used in a Cement System. Int. J. Polym. Mater. 2011, 60, 923–938. [Google Scholar] [CrossRef]
  25. He, Y.; Zhang, X.; Kong, Y.N.; Wang, X.F.; Shui, L.L.; Wang, H.R. Influence of Polycarboxylate Superplasticizer on Rheological Behavior in Cement Paste. J. Wuhan Univ. Technol.-Mater. Sci. Ed. 2018, 33, 932–937. [Google Scholar] [CrossRef]
  26. Plank, J.; Pollmann, K.; Zouaoui, N.; Andres, P.R.; Schaefer, C. Synthesis and performance of methacrylic ester based polycarboxylate superplasticizers possessing hydroxy terminated poly(ethylene glycol) side chains. Cem. Concr. Res. 2008, 38, 1210–1216. [Google Scholar] [CrossRef]
  27. Huang, Z.; Yang, Y.; Ran, Q.P.; Liu, J.P. Preparing hyperbranched polycarboxylate superplasticizers possessing excellent viscosity-reducing performance through in situ redox initialized polymerization method. Cem. Concr. Compos. 2018, 93, 323–330. [Google Scholar] [CrossRef]
  28. Dalas, F.; Pourchet, S.; Nonat, A.; Rinaldi, D.; Sabio, S.; Mosquet, M. Fluidizing efficiency of comb-like superplasticizers: The effect of the anionic function, the side chain length and the grafting degree. Cem. Concr. Res. 2015, 71, 115–123. [Google Scholar] [CrossRef]
  29. Qian, S.S.; Yao, Y.; Wang, Z.M.; Cui, S.P.; Liu, X.; Jiang, H.D.; Guo, Z.L.; Lai, G.H.; Xu, Q.; Guan, J.N. Synthesis, characterization and working mechanism of a novel polycarboxylate superplasticizer for concrete possessing reduced viscosity. Constr. Build. Mater. 2018, 169, 452–461. [Google Scholar] [CrossRef]
  30. Janowska-Renkas, E. The effect of superplasticizers’ chemical structure on their efficiency in cement pastes. Constr. Build. Mater. 2013, 38, 1204–1210. [Google Scholar] [CrossRef]
  31. Du, K.L.; Hou, H.H.; Liu, Z.Y.; Li, X.H.; Wen, Q.R. Preparation and Properties of Anti-mud and Viscosity-Reducing polycarboxylate superplasticizer. In Proceedings of the 5th International Conference on Advances in Energy, Environment and Chemical Engineering (AEECE), Shanghai, China, 16–18 August 2019; pp. 1–5. [Google Scholar]
  32. Chen, Y.; Chen, Y.; Liu, Y.; Tao, J.; Liu, R.; Li, Z.; Liu, F.; Li, M. Effect of the Alkyl Density of Acrylic Acid Ester on the Viscosity-Reducing Effect of Polycarboxylate Superplasticizer. Molecules 2023, 28, 7293. [Google Scholar] [CrossRef]
  33. Chen, J.; Yang, C.; He, Y.; Wang, F.; Zeng, C. Effects and Mechanism of Hyperbranched Phosphate Polycarboxylate Superplasticizers on Reducing Viscosity of Cement Paste. Materials 2024, 17, 1896. [Google Scholar] [CrossRef] [PubMed]
  34. Li, W.; Qian, C.; Zheng, C.; Jiang, H.; Yu, Z.; Wu, Z.; Zhou, Z. Synthesis and Performance of Polycarboxylate Superplasticizer with Viscosity-Reducing and Low-Shrinkage Properties for Fair-Faced Concrete. Materials 2024, 17, 2685. [Google Scholar] [CrossRef]
  35. ISO 19596: 2017; Admixtures for Concrete. International Standardization Organization: Geneva, Switzerland, 2017.
  36. ISO 13320: 2020; Particle Size Analysis—Laser Diffraction Methods. International Standardization Organization: Geneva, Switzerland, 2020.
  37. ISO 679: 2009; Cement—Test Methods—Determination of Strength. International Standardization Organization: Geneva, Switzerland, 2009.
  38. Plank, J.; Hirsch, C. Impact of zeta potential of early cement hydration phases on superplasticizer adsorption. Cem. Concr. Res. 2007, 37, 537–542. [Google Scholar] [CrossRef]
  39. Hou, D.S.; Jia, Y.T.; Yu, J.; Wang, P.G.; Liu, Q.F. Transport Properties of Sulfate and Chloride Ions Confined between Calcium Silicate Hydrate Surfaces: A Molecular Dynamics Study. J. Phys. Chem. C 2018, 122, 28021–28032. [Google Scholar] [CrossRef]
  40. Yamada, K.; Ogawa, S.; Hanehara, S. Controlling of the adsorption and dispersing force of polycarboxylate-type superplasticizer by sulfate ion concentration in aqueous phase. Cem. Concr. Res. 2001, 31, 375–383. [Google Scholar] [CrossRef]
  41. Soin, A.V.; Catalan, L.J.J.; Kinrade, S.D. A combined QXRD/TG method to quantify the phase composition of hydrated portland cements (vol 48, pg 17, 2013). Cem. Concr. Res. 2013, 50, 88. [Google Scholar] [CrossRef]
  42. Jin, S.S.; Zhang, J.X.; Han, S. Fractal analysis of relation between strength and pore structure of hardened mortar. Constr. Build. Mater. 2017, 135, 1–7. [Google Scholar] [CrossRef]
  43. Silva, F.G.S.; Fiuza, R.A.; da Silva, J.S.; de Brito, C.; Andrade, H.M.C.; Goncalves, J.P. Consumption of calcium hydroxide and formation of C-S-H in cement pastes. J. Therm. Anal. Calorim. 2014, 116, 287–293. [Google Scholar] [CrossRef]
  44. Lyu, K.; She, W.; Miao, C.; Chang, H.; Gu, Y. Quantitative characterization of pore morphology in hardened cement paste via SEM-BSE image analysis. Constr. Build. Mater. 2019, 202, 589–602. [Google Scholar] [CrossRef]
  45. Ma, Y.H.; Jiao, D.W.; Sha, S.N.; Zhou, B.B.; Liu, Y.; Shi, C.J. Effect of anchoring groups of polycarboxylate ether superplasticizer on the adsorption and dispersion of cement paste containing montmorillonite. Cem. Concr. Compos. 2022, 134, 104737. [Google Scholar] [CrossRef]
  46. Walkley, B.; Geddes, D.A.; Matsuda, T.; Provis, J.L. Reversible Adsorption of Polycarboxylates on Silica Fume in High pH, High Ionic Strength Environments for Control of Concrete Fluidity. Langmuir 2022, 38, 1662–1671. [Google Scholar] [CrossRef] [PubMed]
  47. Benboudjema, F.; Meftah, F.; Torrenti, J.M. Interaction between drying, shrinkage, creep and cracking phenomena in concrete. Eng. Struct. 2005, 27, 239–250. [Google Scholar] [CrossRef]
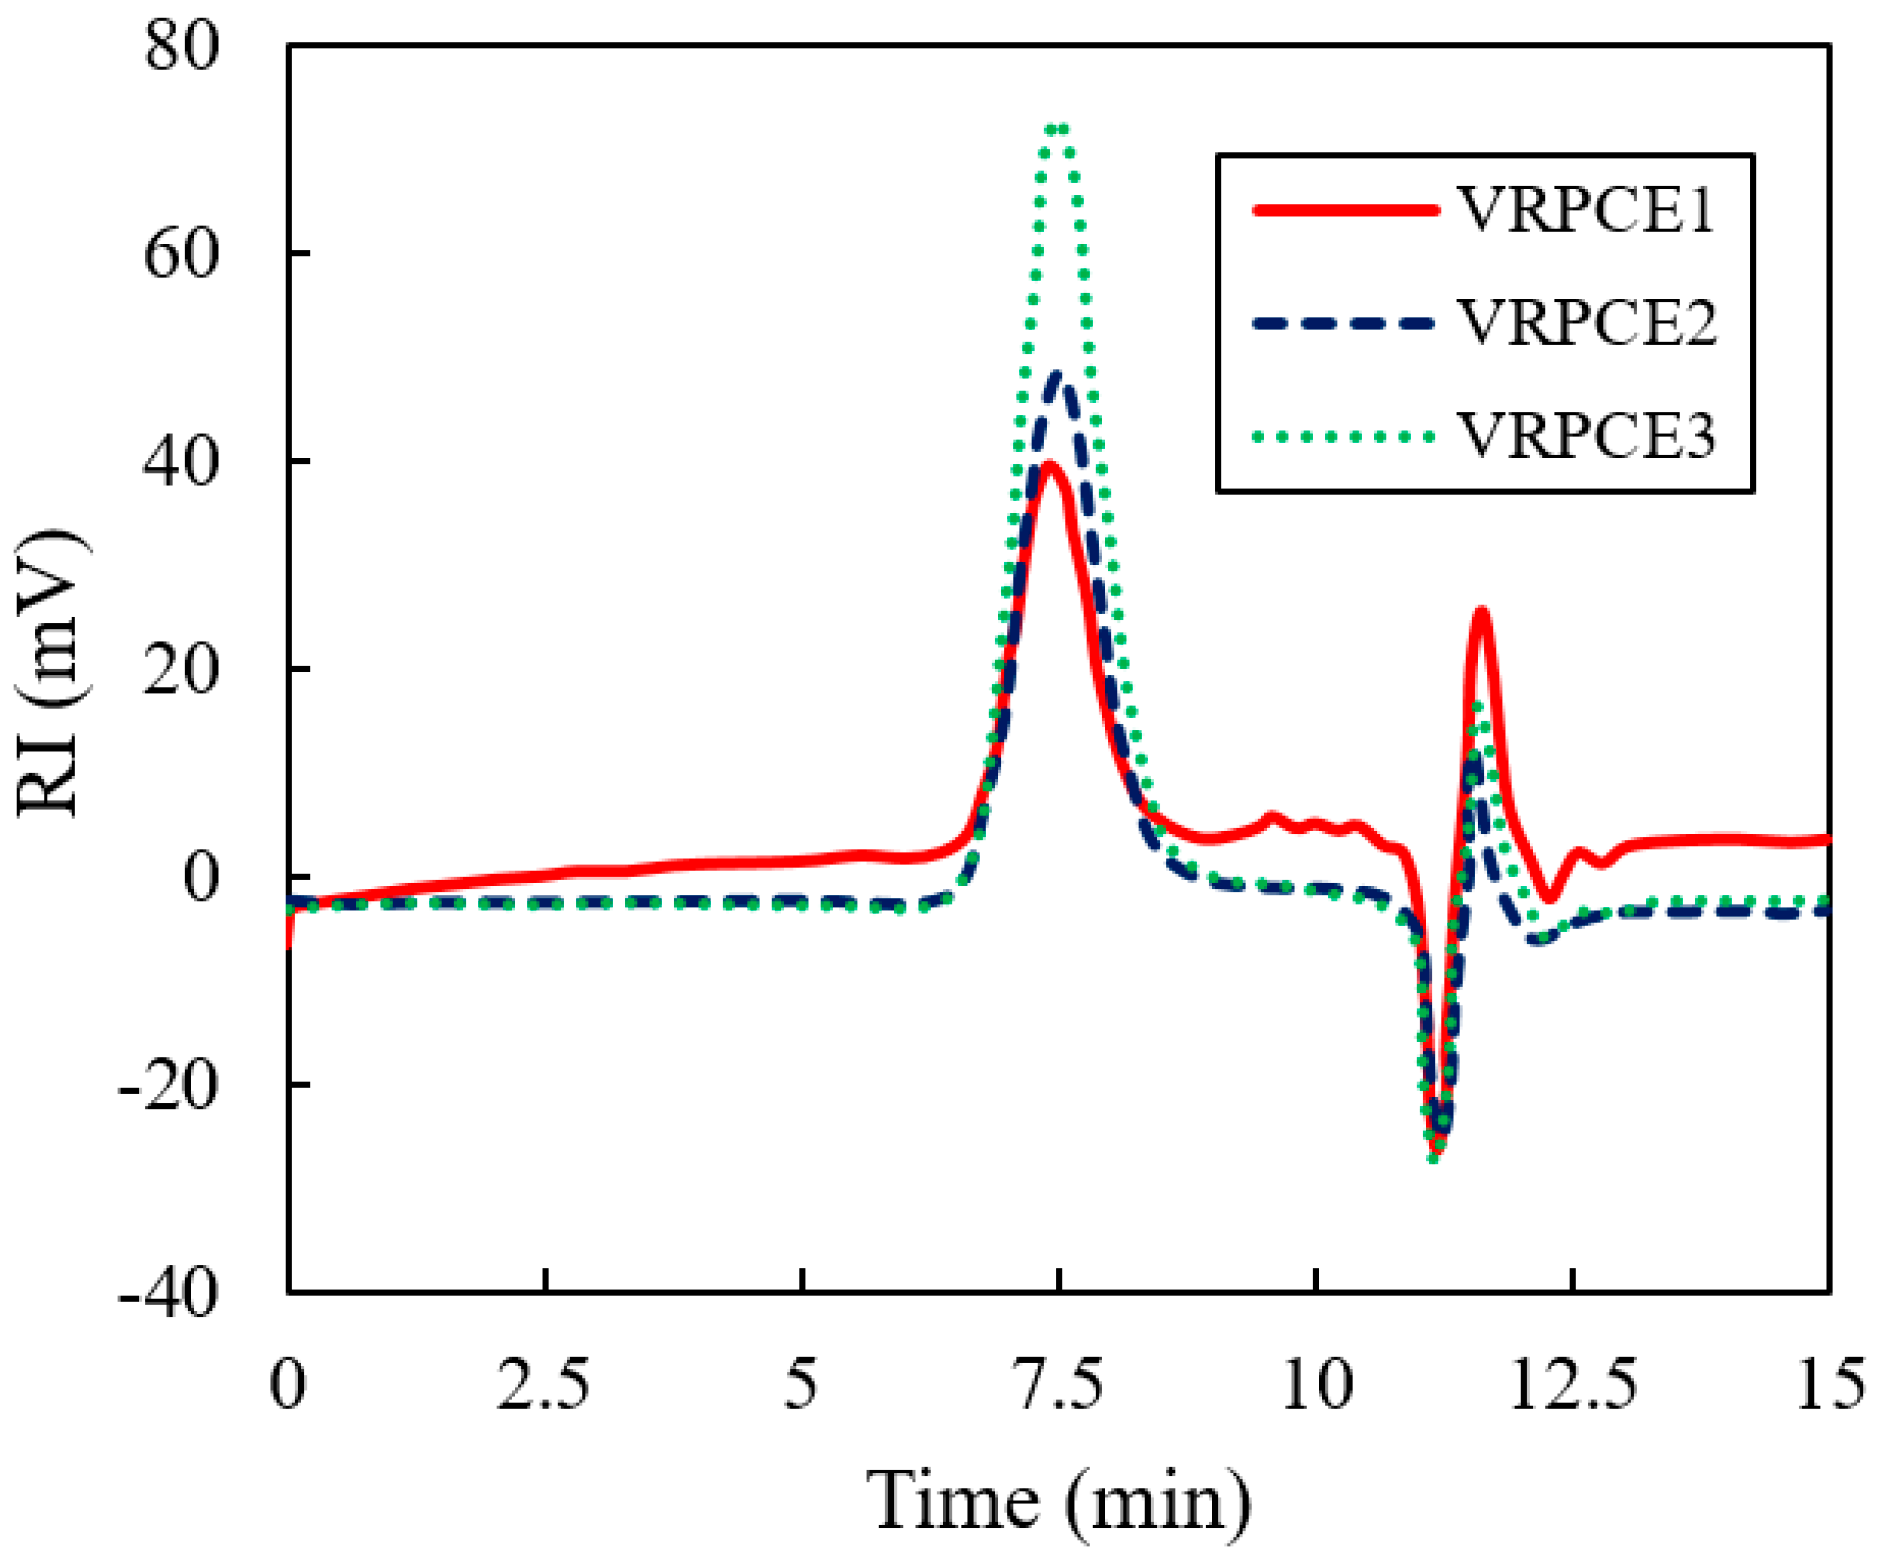
Figure 1. The GPC of VRPCEs.
Buildings 14 02418 g001
Figure 2. The adsorption capacity of cement particles in VRPCE solutions: (a) 5 min; (b) 2 h.
Buildings 14 02418 g002
Figure 3. The surface zeta potential of cement particles in VRPCE solutions.
Buildings 14 02418 g003
Figure 4. The average particle size of cement in VRPCE solutions.
Buildings 14 02418 g004
Figure 5. The XRD pattern of cement paste within VRPCEs.
Buildings 14 02418 g005
Figure 6. The pore characteristics of cement paste within VRPCEs: (a) Cumulative pore volume; (b) Porosity; (c) Pore size distribution; (d) Differential pore volume.
Buildings 14 02418 g006aBuildings 14 02418 g006b
Figure 7. The TG test results of cement paste within VRPCEs: (a) Mass loss; (b) Mass loss rate.
Buildings 14 02418 g007
Figure 8. The micromorphology of cement paste within VRPCEs: (a) C0; (b) C1; (c) C2; (d) C3.
Buildings 14 02418 g008
Figure 9. The pore distribution of cement paste within VRPCEs by binary processing: (a) C0; (b) C1; (c) C2; (d) C3.
Buildings 14 02418 g009aBuildings 14 02418 g009b
Figure 10. The fluidity of cement mortar within VRPCEs: (a) Flow time; (b) Slump flow.
Buildings 14 02418 g010aBuildings 14 02418 g010b
Figure 11. The 28 d compressive strength of cement mortar with VRPCEs.
Buildings 14 02418 g011
Figure 12. The shrinkage rate of cement mortar with VRPCEs.
Buildings 14 02418 g012
Figure 13. The creep degree of cement mortar with VRPCEs.
Buildings 14 02418 g013
Table 1. The chemical composition of cement.
CompositionSiO2Al2O3Fe2O3CaOMgOSO3K2ONa2OLOI
wt.%21.924.463.4364.551.980.340.650.462.21
Table 2. The proportions of some components of VRPCEs (wt. %).
TypeHPEG3000AAPFMMDMA
VRPCE187913
VRPCE2811513
VRPCE3791713
Table 3. The mix proportions of cement pastes.
CodeVRPCE TypeWater/CementVRPCE Content (%)
C0-0.250
C1VRPCE10.250.3
C2VRPCE20.250.3
C3VRPCE30.250.3
Table 4. The mix proportions of cement mortars.
CodeVRPCE TypeWater/CementCement/SandVRPCE Content (%)
M0-0.250.50
M1VRPCE10.250.50.3
M2VRPCE20.250.50.3
M3VRPCE30.250.50.3
Table 5. The molecular weight and molecular weight distribution of VRPCEs.
CodeMnMwPDI
VRPCE140,16282,1862.05
VRPCE237,51080,5982.15
VRPCE334,05371,9852.11
Table 6. The porosity of cement paste with VRPCEs by binary processing method.
CodeC0C1C2C3
Porosity (%)7.027.049.1211.01
Disclaimer/Publisher’s Note: The statements, opinions and data contained in all publications are solely those of the individual author(s) and contributor(s) and not of MDPI and/or the editor(s). MDPI and/or the editor(s) disclaim responsibility for any injury to people or property resulting from any ideas, methods, instructions or products referred to in the content.