Article

Analysis of Mechanical Properties of Four-Section Composite Columns of Pinus sylvestris var. Mongolia of Ancient Wooden Architecture under Axial Compression Load

School of Urban Construction, Wuhan University of Science and Technology, Wuhan 430065, China
*
Authors to whom correspondence should be addressed.
Buildings 2024, 14(8), 2438; https://doi.org/10.3390/buildings14082438 (registering DOI)
Submission received: 6 July 2024 / Revised: 23 July 2024 / Accepted: 5 August 2024 / Published: 7 August 2024
(This article belongs to the Special Issue Advances and Applications in Timber Structures)

Abstract

:
In order to study the influence of the cross-sectional area of hidden dovetail mortise (cross-sectional area of the projecting part after dovetail installation is completed) and length of tenon joint dimensions (axial length with dovetail installation completed) on the axial compressive behavior of four-section composite columns, the length of tenon joint dimensions was set to 30 mm, 60 mm, and 90 mm, and the cross-sectional area of hidden dovetail mortise was set to 360 mm2, 562 mm2 and 810 mm2 as experimental variables. Some column models were designed and fabricated accordingly. Axial compression tests were conducted to observe failure modes, load–displacement curves, stress–strain curves, load–strain curves, ultimate bearing capacity, and stiffness of the timber column. The results of the study show that the influence of dark drum mortise and tenon cross-section size and tenon length on the axial compressive mechanical properties of four-section jointed wood columns should not be ignored; the load-carrying capacity of the wood columns decreases with the increase in tenon cross-section size and decreases with the decrease in tenon length; the stability decreases with the increase in tenon cross-section size; and the deformability of specimens of the tenon length group as a whole is obviously superior to the tenon cross-section area group. The increase in ultimate load-carrying capacity of the columns was 7–11.9% when the concealed cross-sectional area of the hidden dovetail mortise was reduced in the range of 30.5–55.5%. When the length of the tenon joint dimensions was reduced from 90 mm to 60 mm, its ultimate bearing capacity decreased by 9%; when it was reduced from 60 mm to 30 mm, its ultimate bearing capacity was almost unchanged, which indicated that after the length of tenon joint dimensions was lower than 60 mm, the influence on the ultimate bearing capacity of the column was more negligible. It is recommended that the length of tenon joint dimensions of 60 mm should be taken as the design standard value of the ultimate bearing capacity for the four-sectioned composite columns of the Pinus sylvestris var. Mongolia (PSVM).

1. Introduction

Ancient wooden architecture is widely used throughout China due to its excellent mechanical and material properties. Due to its natural and low-carbon nature, wood is one of the future popular materials for civil engineering [1]. The unique mechanical properties of wood enable it to meet the requirements of modern structures in terms of seismic resistance, light weight, and large spans. Wood columns, as extremely important components of wooden structures, play a role in supporting the upper structure of wooden buildings and transmitting forces within the structure [2,3]. In addition to the complete wooden column, the wooden column can also be spliced into a column as a load-bearing member through different combinations, such as forming a glued wood column by bonding many wood laminates with structural adhesives, modifying the wooden column with a rigid sheath splice joint, and connecting the sections of the column through mortise and tenon joints [4,5,6]. The four-section combined column is a unique type of ancient wooden structure where small pieces are connected and assembled into larger pieces through a mortise and tenon structure. As shown in Figure 1, the Ningbo Baoguo Temple Hall is an important example of this structure [7]. The building in the centre of the four small columns and embedded in the outside of the four auxiliary petals of small materials forms the eight petals of the Guarang column. The centre of the four small columns bears the load and is embedded in the outside of the four decorative petals. Overall, the structure has eight pieces in four columns. It has undergone several repairs due to long-term corrosion [8]. Segmental columns, due to their unique structural configuration, are connected to the superstructure (e.g., beams, slabs, etc.) by mortise and tenon joints, which are designed to ensure a solid bond between the columns and the other components in order to support the stability and load-bearing capacity of the overall building structure. The four-section composite column of Pinus sylvestris var. mongolica (PSVM) is widely used in ancient wooden buildings, mainly due to its excellent mechanical properties. The wood of PSVM has high bending and compressive strength, and its texture is straight and tough, which makes the four-section composite column composed of it perform well when bearing loads. PSVM is widely used in construction because of its moderate density and strength, its ability to provide good durability under the right conditions, and its ease of processing and handling, making it suitable for making use in various shapes and sizes [9]. In addition, the design of the four-section composite column also fully considers the mechanical properties of wood. Through reasonable splicing methods, it not only enhances the overall stability of the column but also effectively disperses stress concentration, thereby improving the load-bearing capacity and seismic performance of the entire building. Although there have been some studies on the mechanical properties of the four-section composite column of PSVM, there is still a lack of in-depth discussion on its specific mechanical characteristics and laws under axial compressive load. Axial compressive load is a common stress state in the practical use of wooden columns in ancient buildings, which has a crucial impact on the stability and load-bearing capacity of wooden columns [10,11,12]. Therefore, research on the mechanical properties and failure mechanisms of four-section composite wooden columns is of great significance for the protection and repair of ancient wooden architectural structures.
Currently, domestic and international scholars have conducted numerous studies on the mechanical properties of wooden columns and established design formulas for the ultimate limit state of composite columns [13,14,15,16,17,18]. Malhotra et al. [19] described the development of reliability-based design formulas for the ultimate limit state of mechanically connected composite wooden columns, predicting and analyzing their mechanical properties. Song et al. [20] conducted material performance tests and biaxial eccentric compression tests on wooden columns. Theiler et al. [21] proposed a bearing capacity analysis model considering the strain of wooden columns and studied the degradation performance of wood and repair methods for damaged wooden columns. Li et al. [22] conducted axial compression tests on four wooden columns with different damages and proposed a degradation model that can accurately predict the compressive strength of locally damaged wooden columns. Zhou et al. [23] conducted composite reinforcement on wooden columns, analyzed the mechanical properties of wooden columns with different reinforcement sections, and established a calculation model for the axial compressive bearing capacity of composite reinforced wooden columns. Wei et al. [24] studied the mechanical properties of orthogonal laminated wooden columns and laminated veneer lumber columns and established a stress–strain model for wooden columns. Research on the mechanical properties of log wooden columns and glued laminated wood columns under axial pressure is relatively mature, providing theoretical premises and experimental methods for the study of the mechanical properties of four-section composite wooden columns under axial pressure. Four-section composite wooden columns are commonly used in ancient wooden architectural structures, and the use of concealed mortise and tenon joints and wedges has typical historical and cultural characteristics, which are quite different from the force transmission mechanisms of modern wooden structures.
In order to reveal the force transmission mechanism and failure mechanism of the four-section composite wooden column, the classic four-section composite wooden column in the ancient wooden building structure system was selected as the object. Considering the influence of concealed mortise and tenon joints and the use of wedges, a series of axial pressure performance tests were carried out on the four-section composite wooden column. The test failure phenomena, load–longitudinal displacement curve, stress–strain curve, load–strain curve, bearing capacity, and stiffness changes were analyzed in detail, aiming to provide a theoretical basis and experimental basis for the design of this kind of ancient wooden building structure.

2. Test Design

2.1. Materials

The column body and mortise-and-tenon connectors of the four-section composite column were made of PSVM wood [25], which has high compressive and tensile strengths, medium density and moderate hardness, which gives it good workability and strength in the production of building structures. It has good corrosion resistance under dry conditions and is able to resist fungi and insects to some extent, and their elastic engineering constants are shown in Table 1. The moisture content and density of the wood are 10.3% and 0.46 g/cm3, respectively.

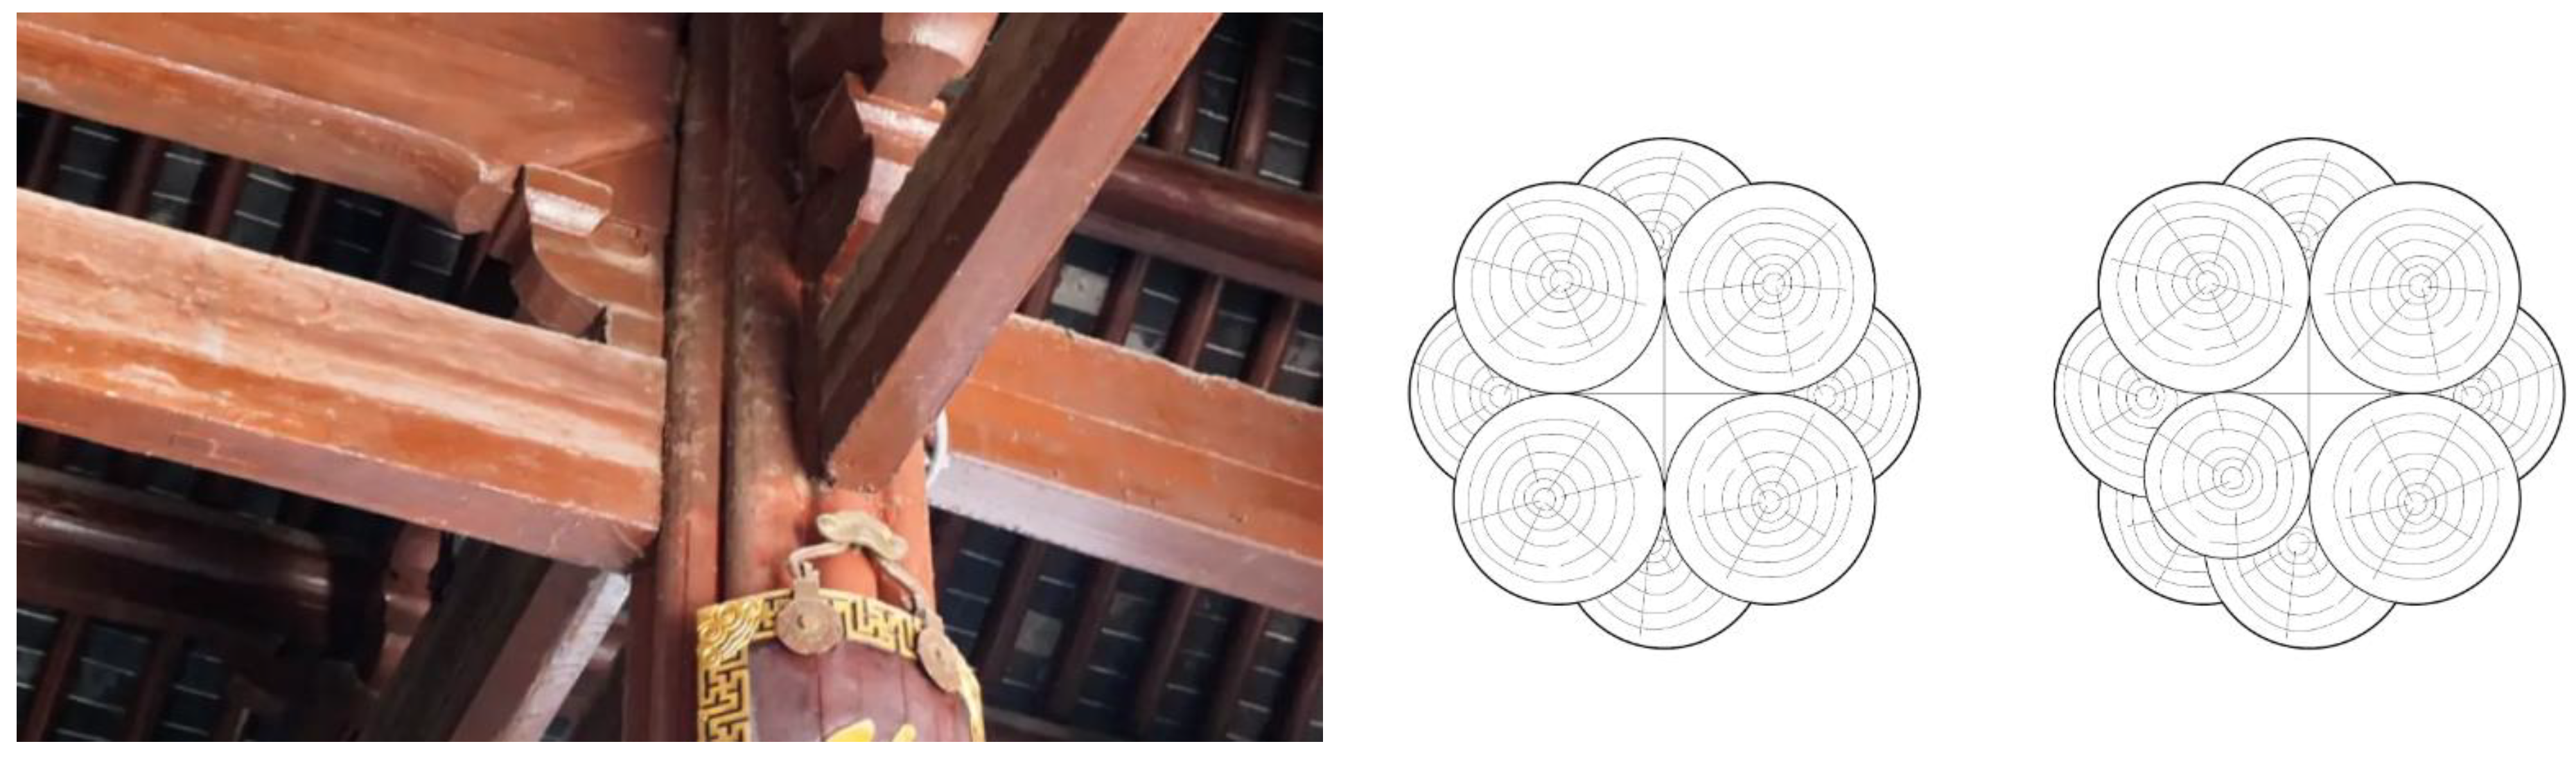
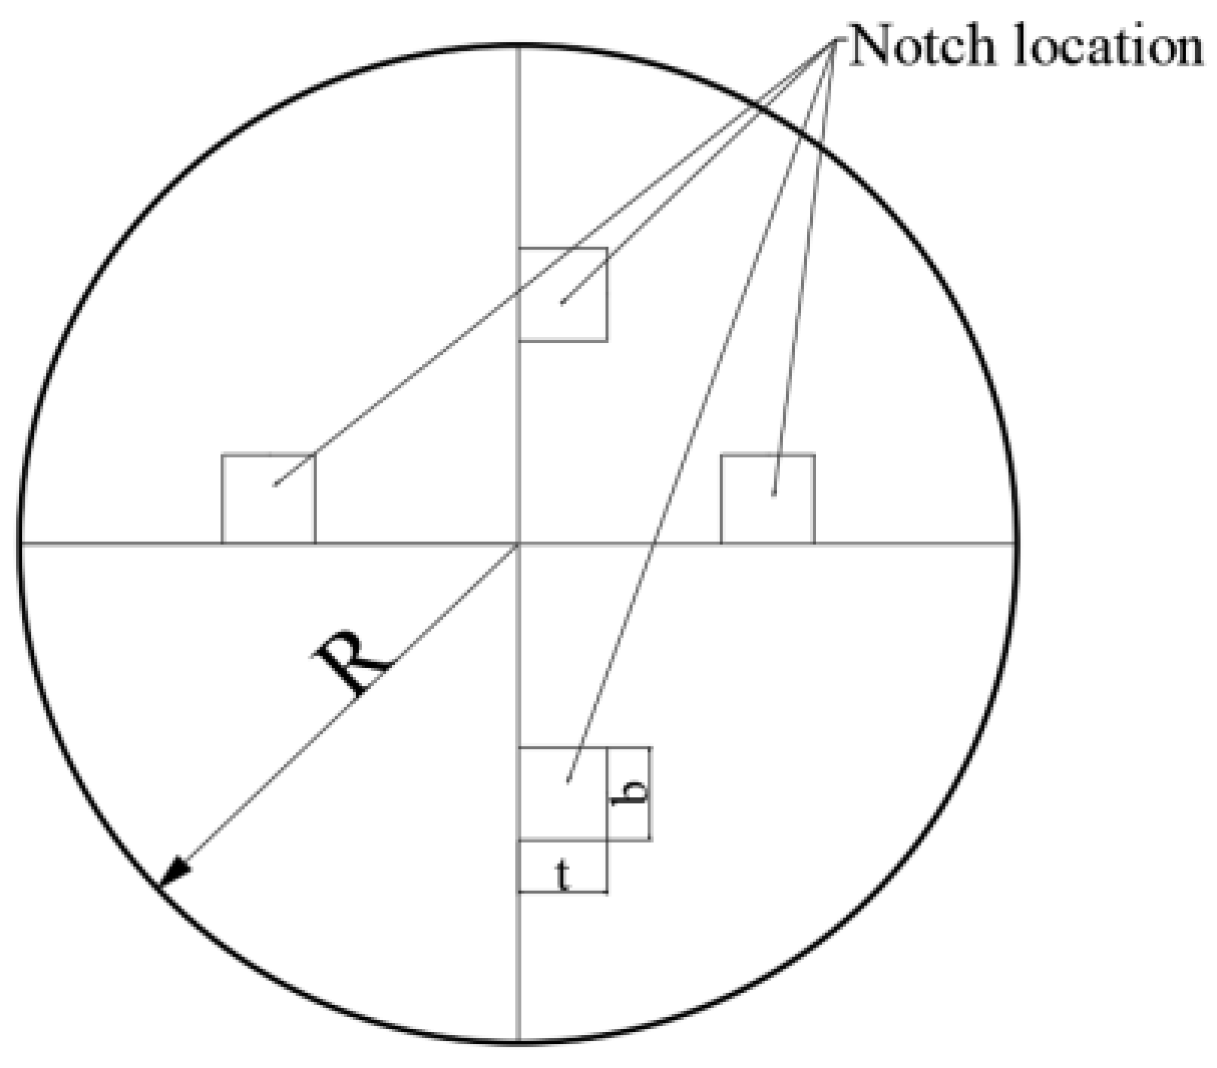
2.2. Specimen Preparation

The four-section composite column was a method of constructing wooden columns in ancient architecture, where the column was not a single piece of raw wood but rather a structure made up of multiple pieces of wood connected by mortise and tenon joints. The concealed drum tenon was a tenon component inserted into a concealed drum mortise used to connect different structures. A full or half-hidden tenon, where the tenon head is not exposed, was called a concealed tenon. The wedge was a wooden block used to secure the concealed drum mortise and fit into the concealed drum mortise hole.
In order to study the impact of the cross-sectional dimensions of the concealed mortise and the size of the wedge on the mechanical properties of a four-section composite column under axial compression, this experiment designed five groups of test specimens. The dimensions of the corresponding components were determined with reference to the “Construction Methodology” for the four-section composite column mortise and the “Standard for design of timber structures” [26]. The dimensions of the test specimens were all 360 mm in length and 90 mm in circular cross-sectional radius. Tenon lengths and mortise areas are set with reference to the ranges specified in the Construction Method Style and historical ancient timber building practices. The specific dimensions of the concealed mortise and the wedge are shown in Table 2.
The specimen was composed of four smaller pieces of wood that were fitted together to match the dimensions of each tenon and mortise. The concealed tenon was inserted into the concealed mortise and moved up to the slot, followed by the insertion of a wedge to secure the concealed tenon. Then, the column was assembled. Figure 2 is a schematic diagram of the internal structure of a single piece of wood in the specimen. After all the above-mentioned test pieces were processed, the assembly of the test pieces was completed in the order of installing concealed mortise and tenon, wedging, and jointing the columns.

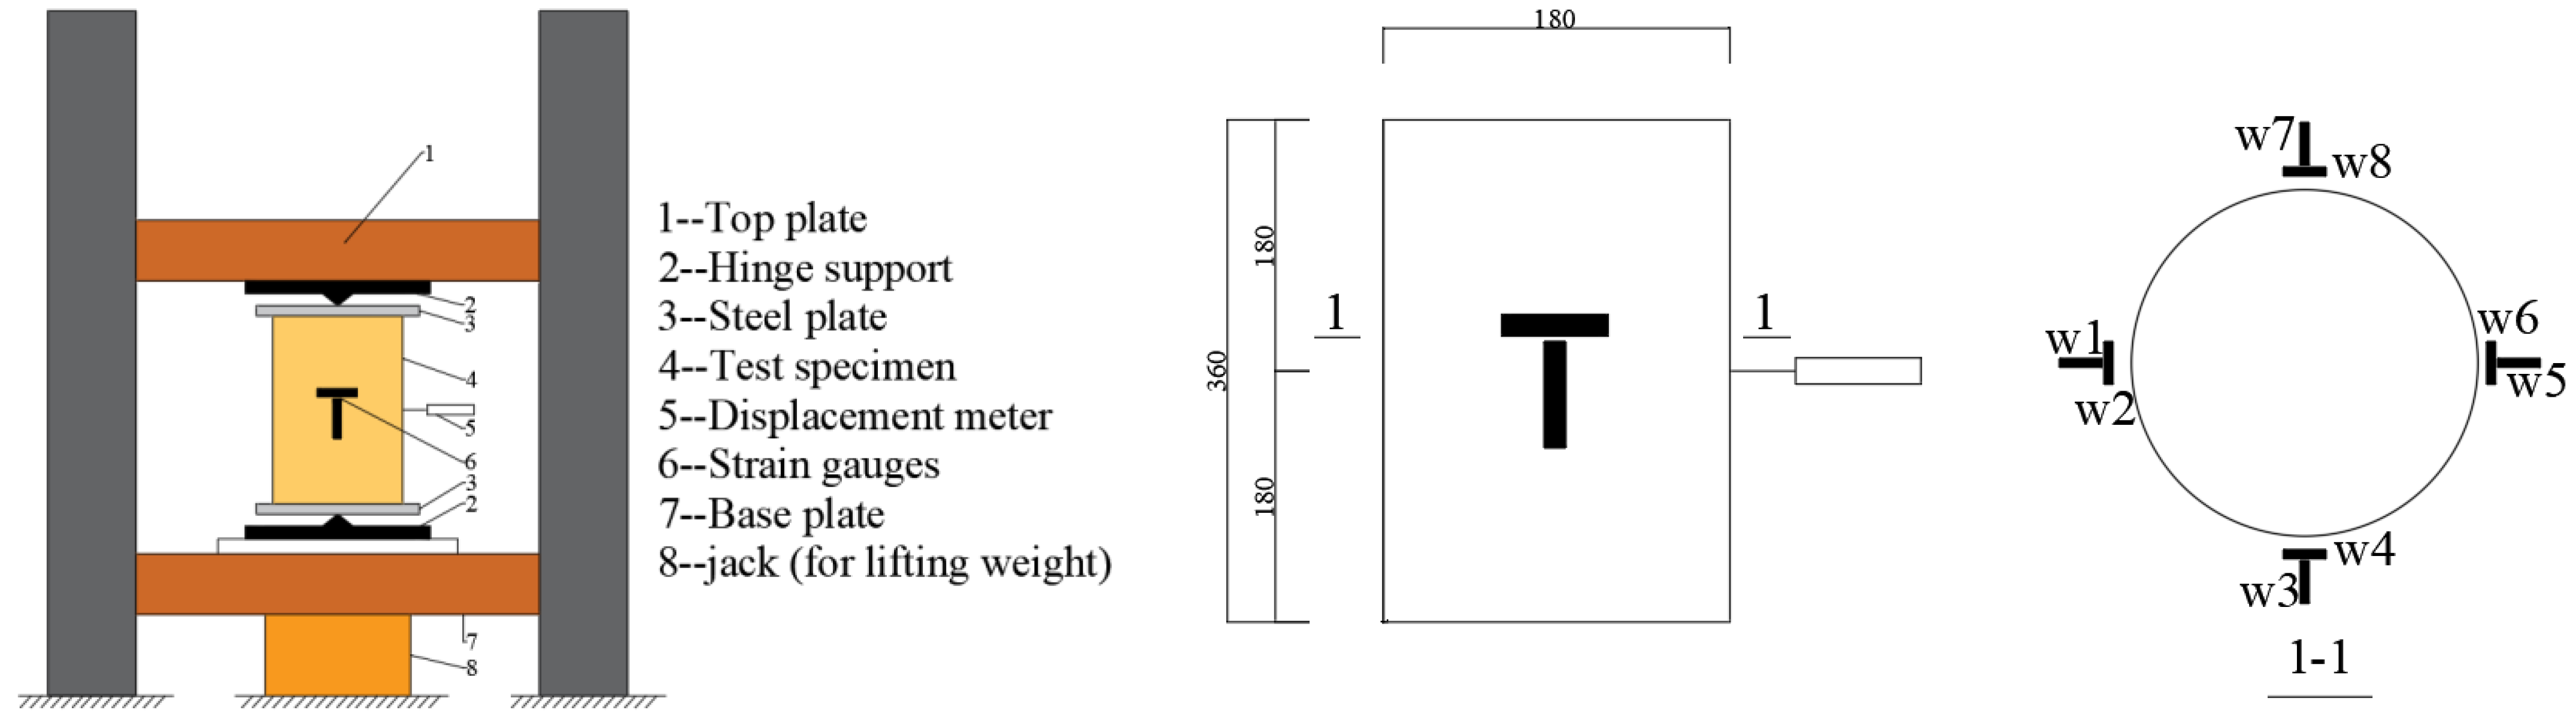
2.3. Testing Procedures

The loading device used for the axial pressure test was an electro-hydraulic servo universal machine. The top of the specimen was connected to a ball joint through a loading plate, and the bottom was supported on a reaction base. The entire loading process can be viewed as one end being hinged and the other end being fixed.
In this experiment, resistance strain gauges were used to measure the lateral and longitudinal strains in the four-section composite column. One set of longitudinal and lateral strain gauges was placed at the centre of each side of the column. One lateral strain gauge was placed at a distance of 50 mm from the top of the column on the side where the wedge was installed for a total of 10 gauges. Electronic displacement meters were used to measure the lateral displacement in the column of the test specimen. One displacement meter was placed in the column on one of the adjacent surfaces of the test specimen, for a total of two meters. Figure 3 is a schematic diagram of the test setup.
Before formal loading, the universal machine and the loading specimen were geometrically and physically aligned to ensure that the pressure application position of the universal machine was aligned with the axial pressure position of the specimen. Referring to the “Standard for Test Methods of Timber Structures” [27], the specimen is preloaded before formal loading. The test loading method and rate are selected according to the provisions of the “Standard for Test Methods of Timber Structures” [27]. Displacement loading was used for formal loading, with a loading speed of 1 mm/min. Uniform loading is applied throughout the process. When the bearing capacity of the specimen decreased to 80% of the ultimate bearing capacity, it was considered to be damaged and the test was terminated. During the formal loading of the specimen, the longitudinal and transverse strain values in the column were read at intervals of 10 s, and the load–axial displacement curve, stress–strain curve, and load–strain curve were drawn.

3. Analysis of Test Results

3.1. Experimental Phenomena
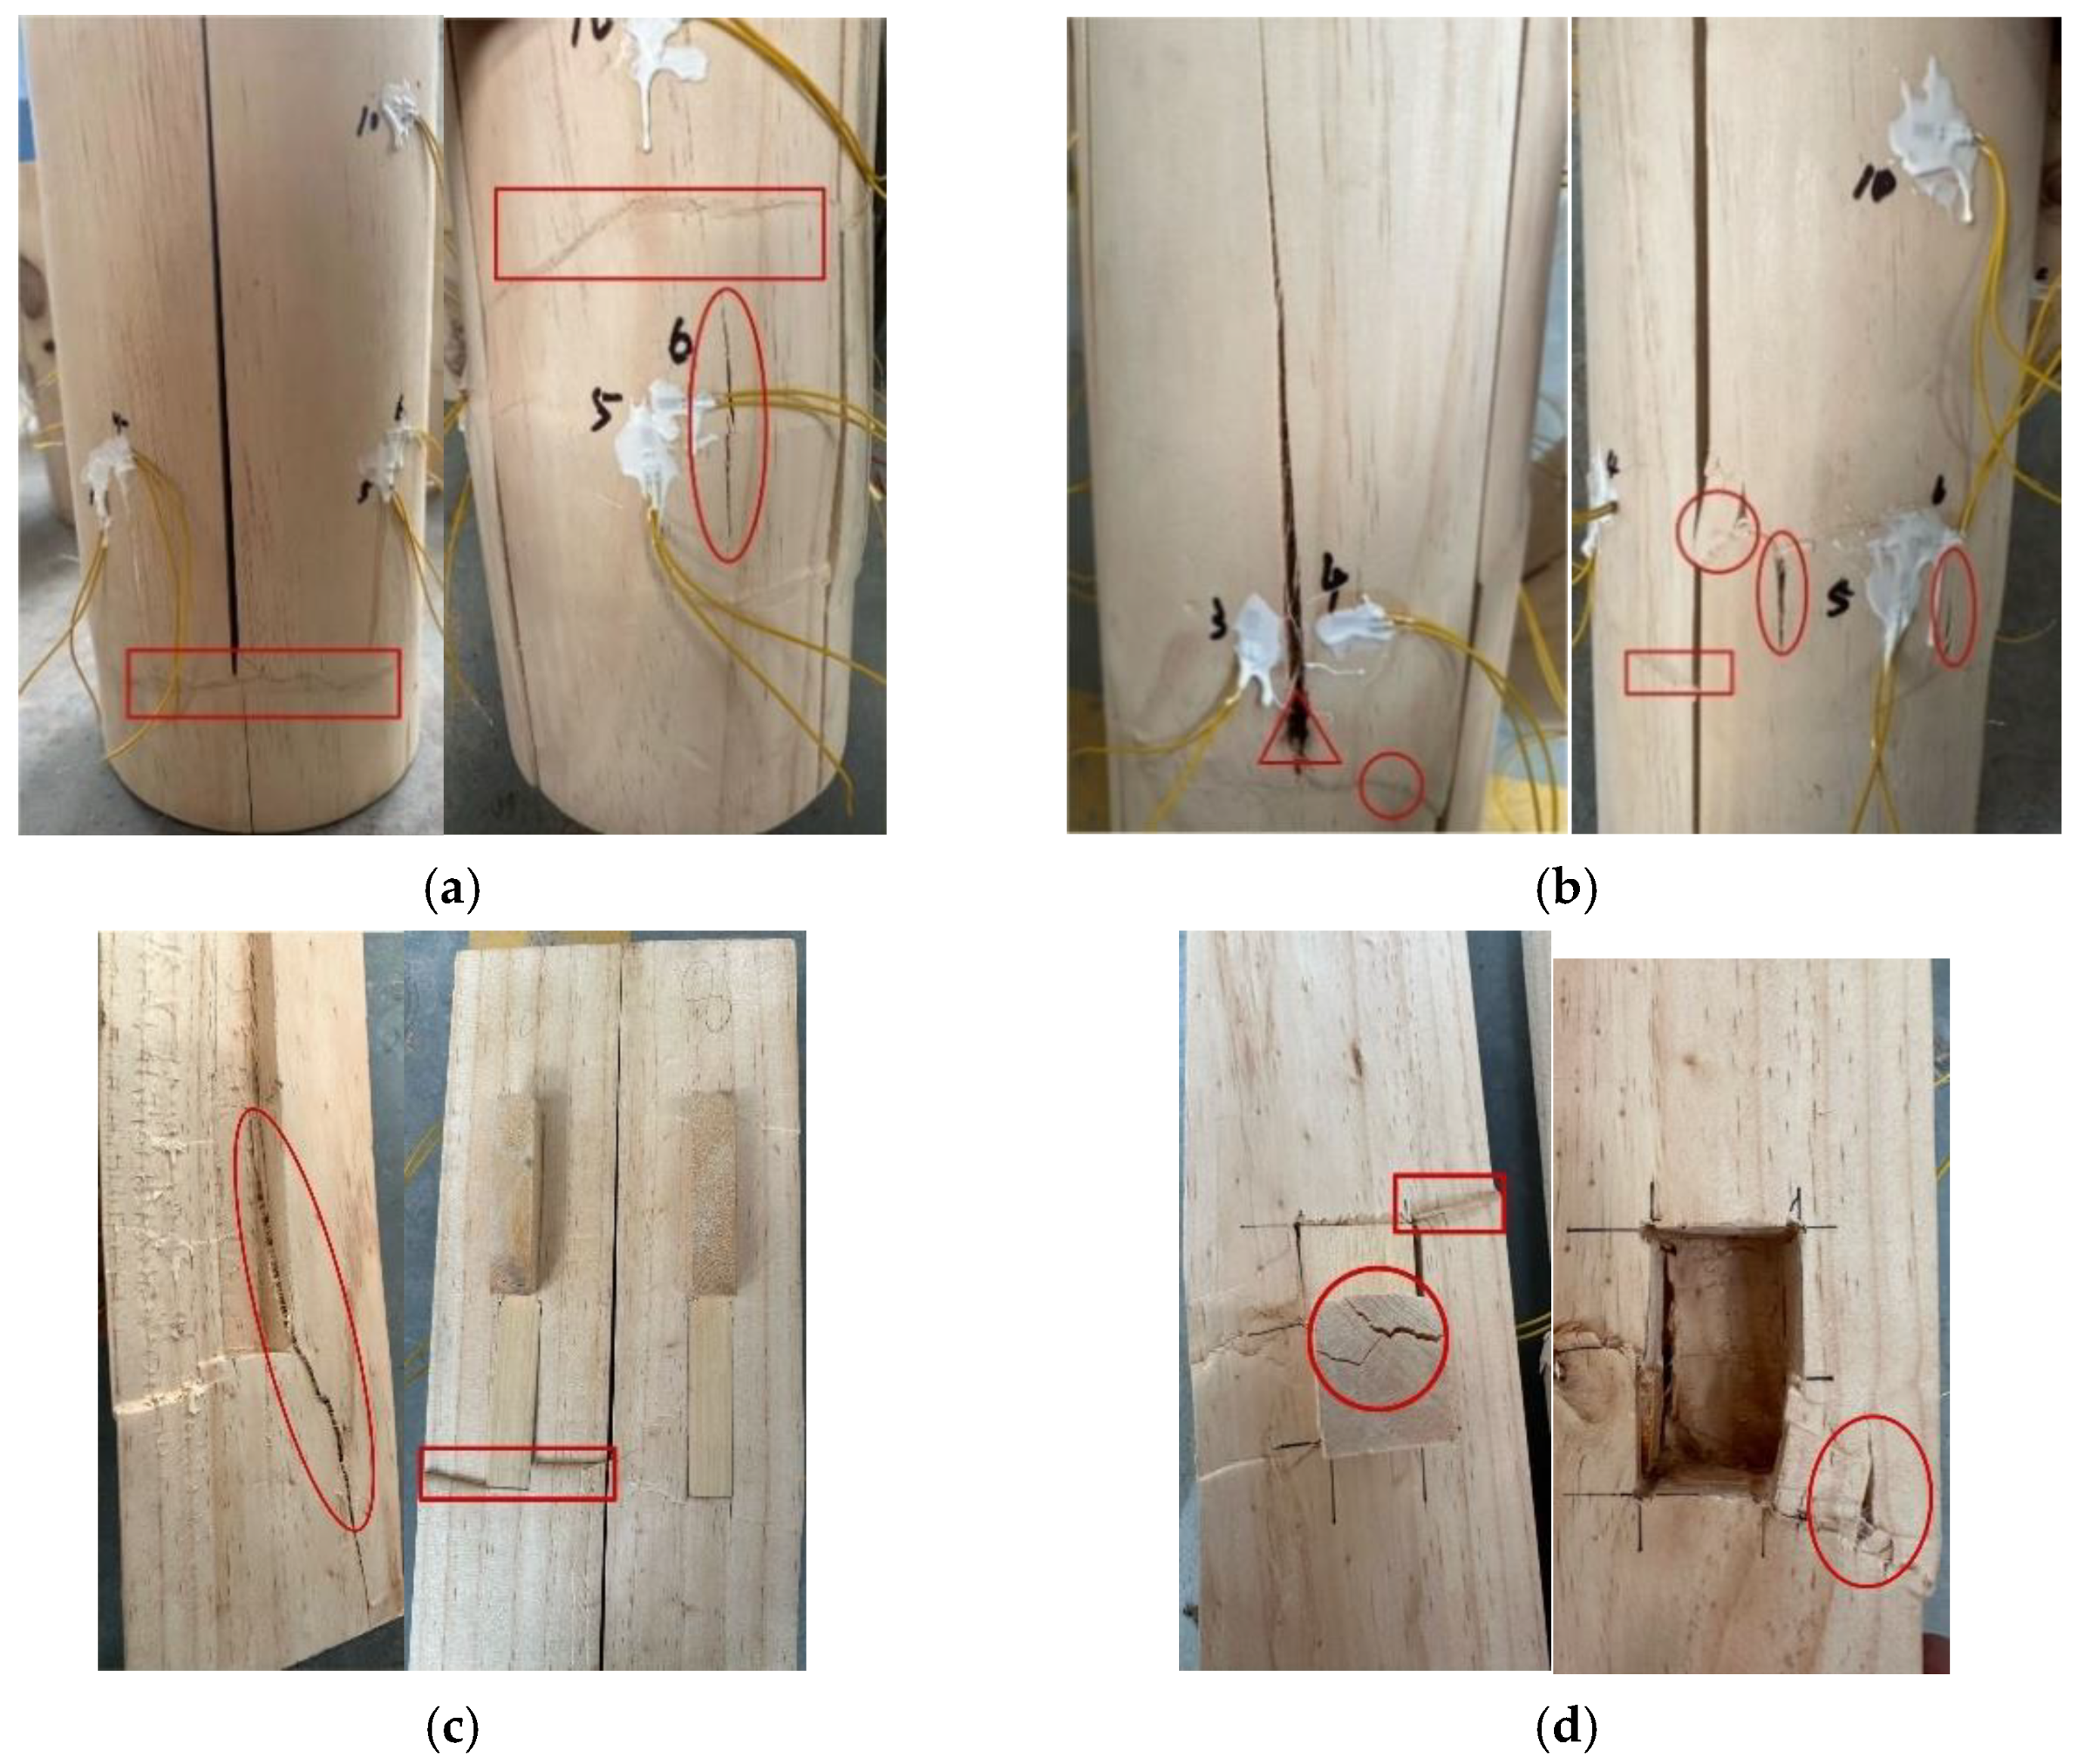
At the beginning of the specimen loading, there was no obvious experimental phenomenon. As the test load gradually increased, the longitudinal and transverse deformations of the specimen continuously increased, and longitudinal cracks and transverse wrinkles appeared on the surface of the specimen. When the test load was loaded to about 60% of the ultimate bearing capacity, the specimen began to produce a wood fiber extrusion sound. When the load reached its peak, the sound produced by the specimen was very obvious and uninterrupted, and the longitudinal cracks on the surface of the specimen continued to extend. As the bearing capacity of the specimen decreased, the transverse deformation and longitudinal cracks in the concealed bulge area became more obvious, and the middle part of the column showed outward bulging with large transverse displacement. The knots experienced significant dislocation and outward bulging, and cracks appeared around the knots, while the surrounding wood was crushed and damaged.

3.2. Failure Modes

The failure modes of the test specimens in all groups mainly manifest as four types: lateral crushing failure (represented by rectangles), longitudinal cracking failure (represented by ellipses), diagonal shear failure (represented by circles), and local shear failure at the knots (represented by triangles), as shown in Figure 4. Longitudinal and lateral cracks and wrinkles on the surface of the wooden column are concentrated in the middle of the column, with more wood crushing occurring at the lower part of the column. For the specimens with a longer mortise, lateral wrinkles appear around the mortise tenon, and obvious longitudinal cracks appear inside the mortise, with the cracks being longer and almost penetrating the entire mortise, as shown in Figure 4c; this is because a large length of tenon length leads to a large vacancy inside the wooden post, and a large hazardous damaged area in the middle of the wooden post, and when a crack appears in the hazardous cross-section, the crack will develop rapidly in the hazardous area along the axial direction and ultimately form a crack through the mortise hole. For the specimens with a shorter mortise, the mortise tenon experiences greater compressive stress, resulting in obvious cracks accompanied by multiple lateral wrinkles around the mortise and crushing failure occurring at the mortise, with no obvious cracks. As shown in Figure 4d, this is due to the small length of the tenon length, the core stress area being small, and the tensile and compressive stresses being mainly concentrated in the mortise and tenon joints, causing cracks around the tenon and mortise holes. Under the action of the test load, the wooden column undergoes vertical compression and lateral deformation. The mortise in the column limits the lateral deformation inside the column, causing the longitudinal cracks to first appear in the middle of the outer surface of the column, gradually developing towards the inside of the column. As the test load increases, the tensile stress on the mortise continuously increases, and the longitudinal cracks on the surface of the column develop along the grain direction of the column, extending to the mortise area, eventually penetrating the middle of the column and developing to the lateral wrinkles at the upper and lower parts of the column. Diagonal cracks are concentrated near the knots. As the vertical load continues to increase, stress concentration occurs near the knots, resulting in local shear failure. The crack width further increases and the length continues to extend. Under the action of shear stresses in all directions, diagonal cracks and longitudinal cracks are produced.

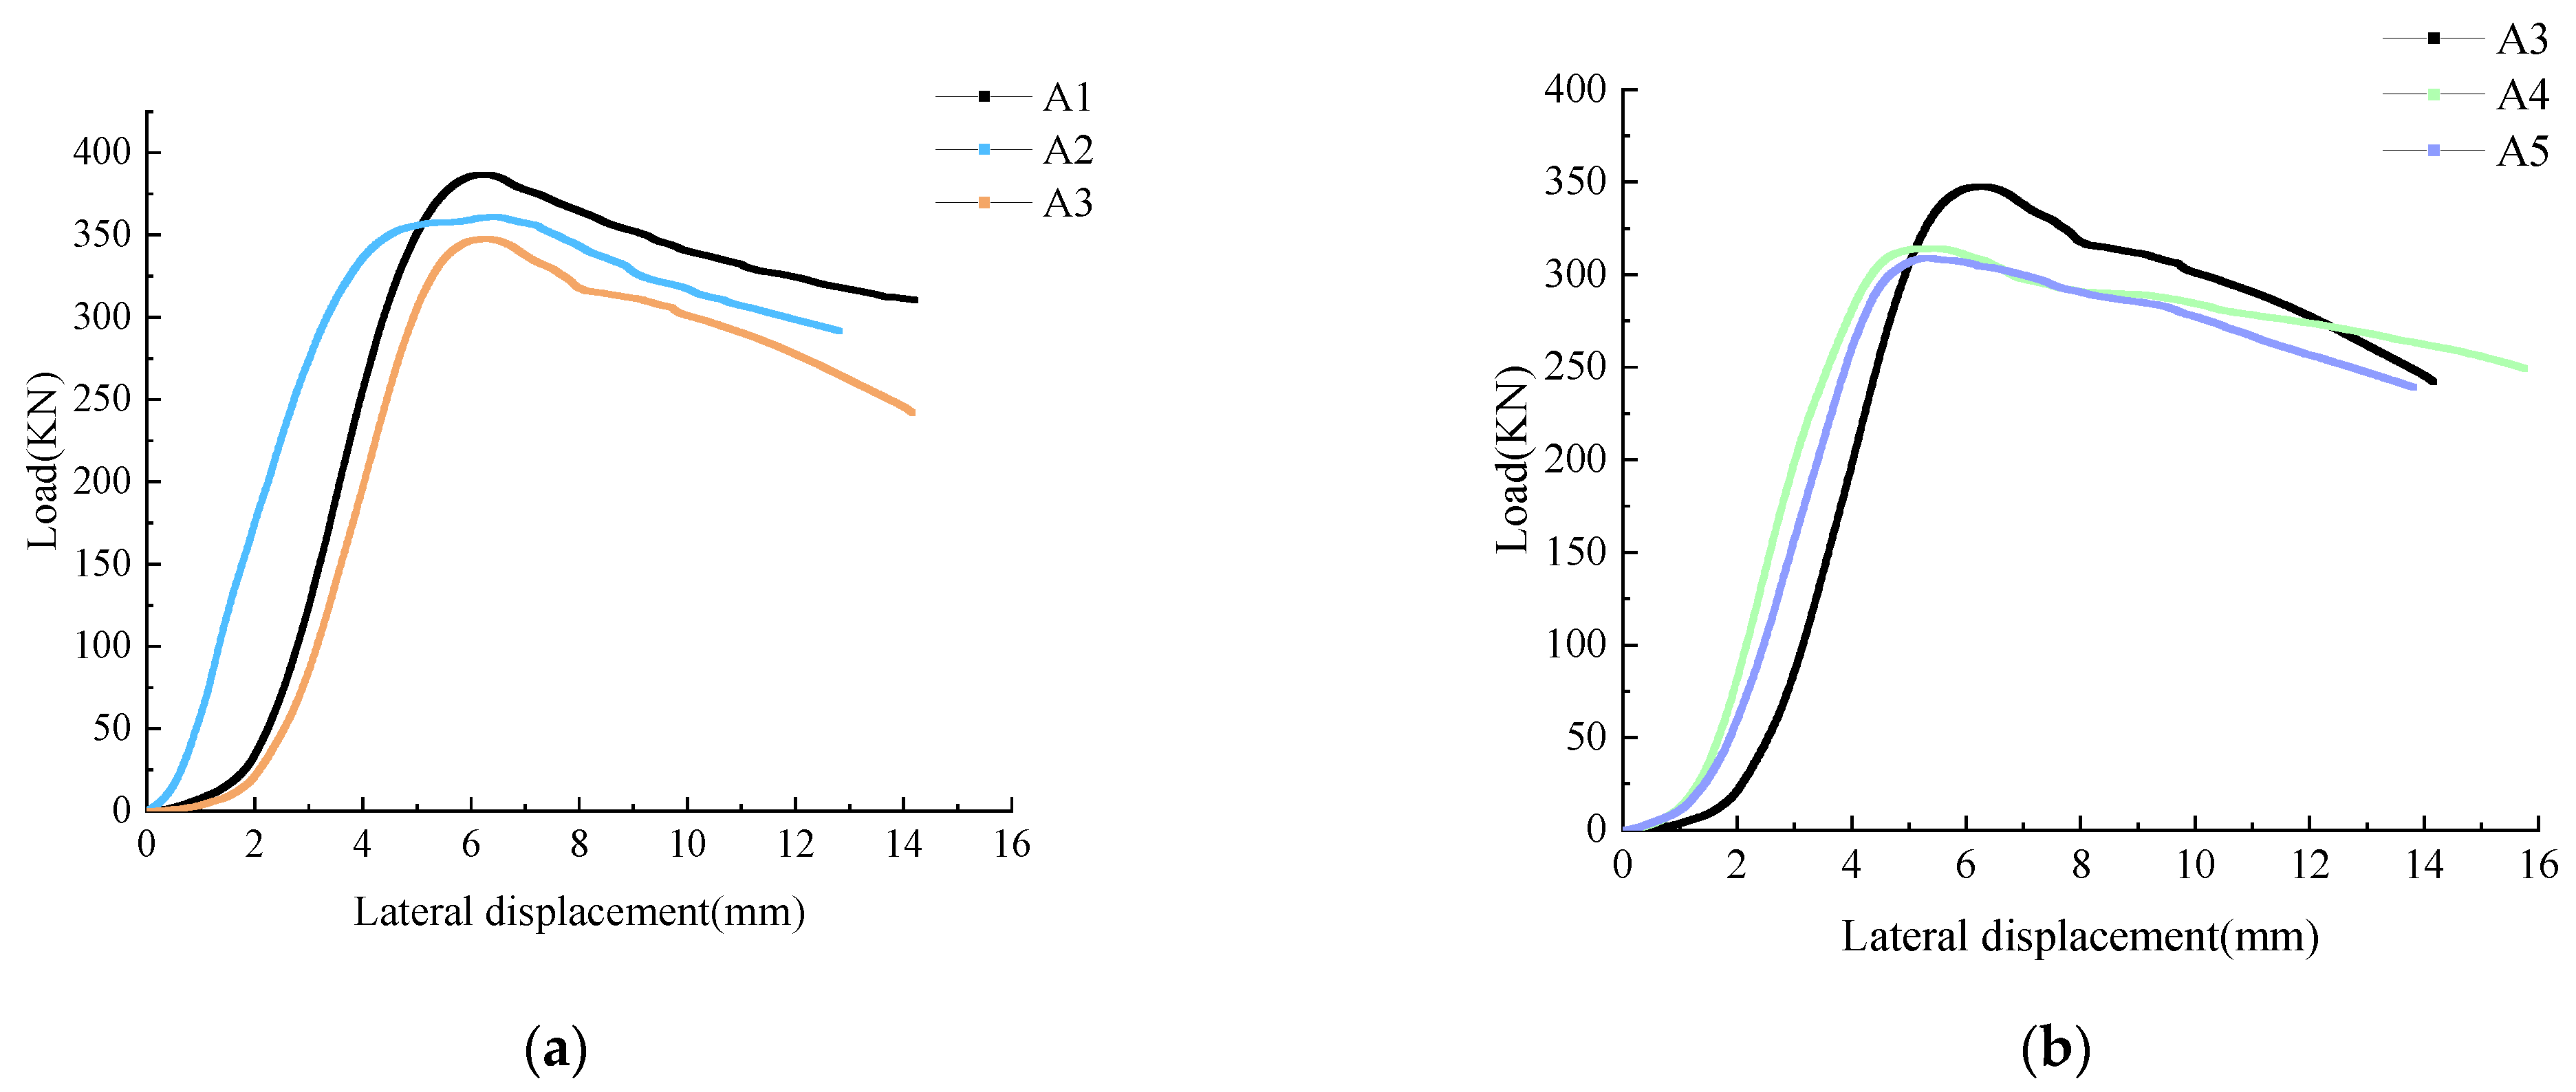
3.3. Load–Displacement Behavior

The load–displacement curves of the test specimens in each group are shown in Figure 5, and the trends of the curves are basically consistent. The test specimens undergo three stages under axial pressure: elastic stage, elastic–plastic stage, and plastic stage. In the elastic stage, due to the influence of material properties and initial defects, the relationship between axial displacement and load of the wooden column shows a strong nonlinear relationship, followed by a linear relationship. The test specimens are in the elastic stage from the beginning of loading to the proportional limit load, which is defined in this article as 70% of the ultimate load; the second stage is the elastic–plastic stage, i.e., the load of the test specimens increases from the proportional limit load to the ultimate load. The curve has a small nonlinear stage before reaching the peak load, which is due to the wood fibers on the compression side of the test specimens reaching the yield stress. The load of the test specimens slowly increases between the proportional limit load and the ultimate load, and the displacement development is relatively slow in this stage; the third stage is the plastic stage, where the load of the test specimens increases from the ultimate load to the failure of the test specimens. After the load reaches the ultimate load, as the axial displacement continues to increase, the bearing capacity of the test specimens shows a significant downward trend, which is due to local compression buckling, shear failure, and cracking phenomena in the central region of the wooden column. The compressed wood fibers are crushed, and the tensile wood fibers break. From the curves, it can be seen that the change in tenon cross-sectional area has a greater effect on the ultimate load capacity of the wooden columns, the performance of the wooden columns with large tenon cross-sectional area is optimal, and the reduction in tenon length makes the ultimate load capacity of the wooden columns decrease. In the mortise cross-sectional area group, the A2 specimen has the smallest axial damage displacement, and its deformation capacity is poorer than that of the remaining two groups, and the A1 specimen has the best deformation capacity and load-bearing capacity; in the mortise length group, the A3 specimen has the best load-bearing capacity, and the A3 specimen has the best deformation capacity. Overall, the deformation capacity of the tenon length group is better than that of the tenon area group, while the load-bearing capacity is insufficient. The peak load and failure displacement of each test specimen are shown in Table 3, and the axial stiffness and ductility coefficient of the test specimens are shown in Table 4 which will be further analyzed in Section 4.

3.4. Stress–Strain Behavior

Assuming that the tensile strain and compressive strain of the specimen are positive and negative, respectively, when the load reaches the ultimate bearing capacity of the specimen, some strain gauges stop working, and the load–strain curve given is a rising curve. The load–strain curves of each specimen are shown in Figure 6. From the curve, it can be seen that the changing trend of axial strain and transverse strain during the axial compression process of each group of specimens is basically the same, with obvious plastic deformation. At the beginning of loading, the load–strain curve is basically a straight line, indicating that the specimen was in the elastic stage. As the load continues to increase, the curve shows a nonlinear growth, which is due to the uneven distribution of micro-defects such as knots in the specimen. The specimen enters the plastic working stage, and the internal mortise and tenon structure constrains the lateral deformation of the specimen, while obvious local compressive buckling failure occurs. After reaching the peak load, the axial strain increases rapidly, and the dangerous section reaches the ultimate strain, resulting in the destruction of the specimen.
In the group of tenon lengths, the variation in tenon length has a significant impact on the tensile and compressive strain. Comparing the same conditions in Figure 6b, the maximum compressive strain at the measuring point of the wooden column increases with the increase in tenon length. This is due to the increase in tenon length, which leads to an increase in the compression zone of the wooden column. The strain in the compression zone reaches the ultimate compressive strain of the wood, causing the specimen to fail. In addition, the increase in tenon length increases the cross-sectional area of the wooden column in the non-mortise area, strengthening the lateral constraint effect of the fibers and thereby reducing the lateral deformation of the wooden column.

4. Quantitative Analysis

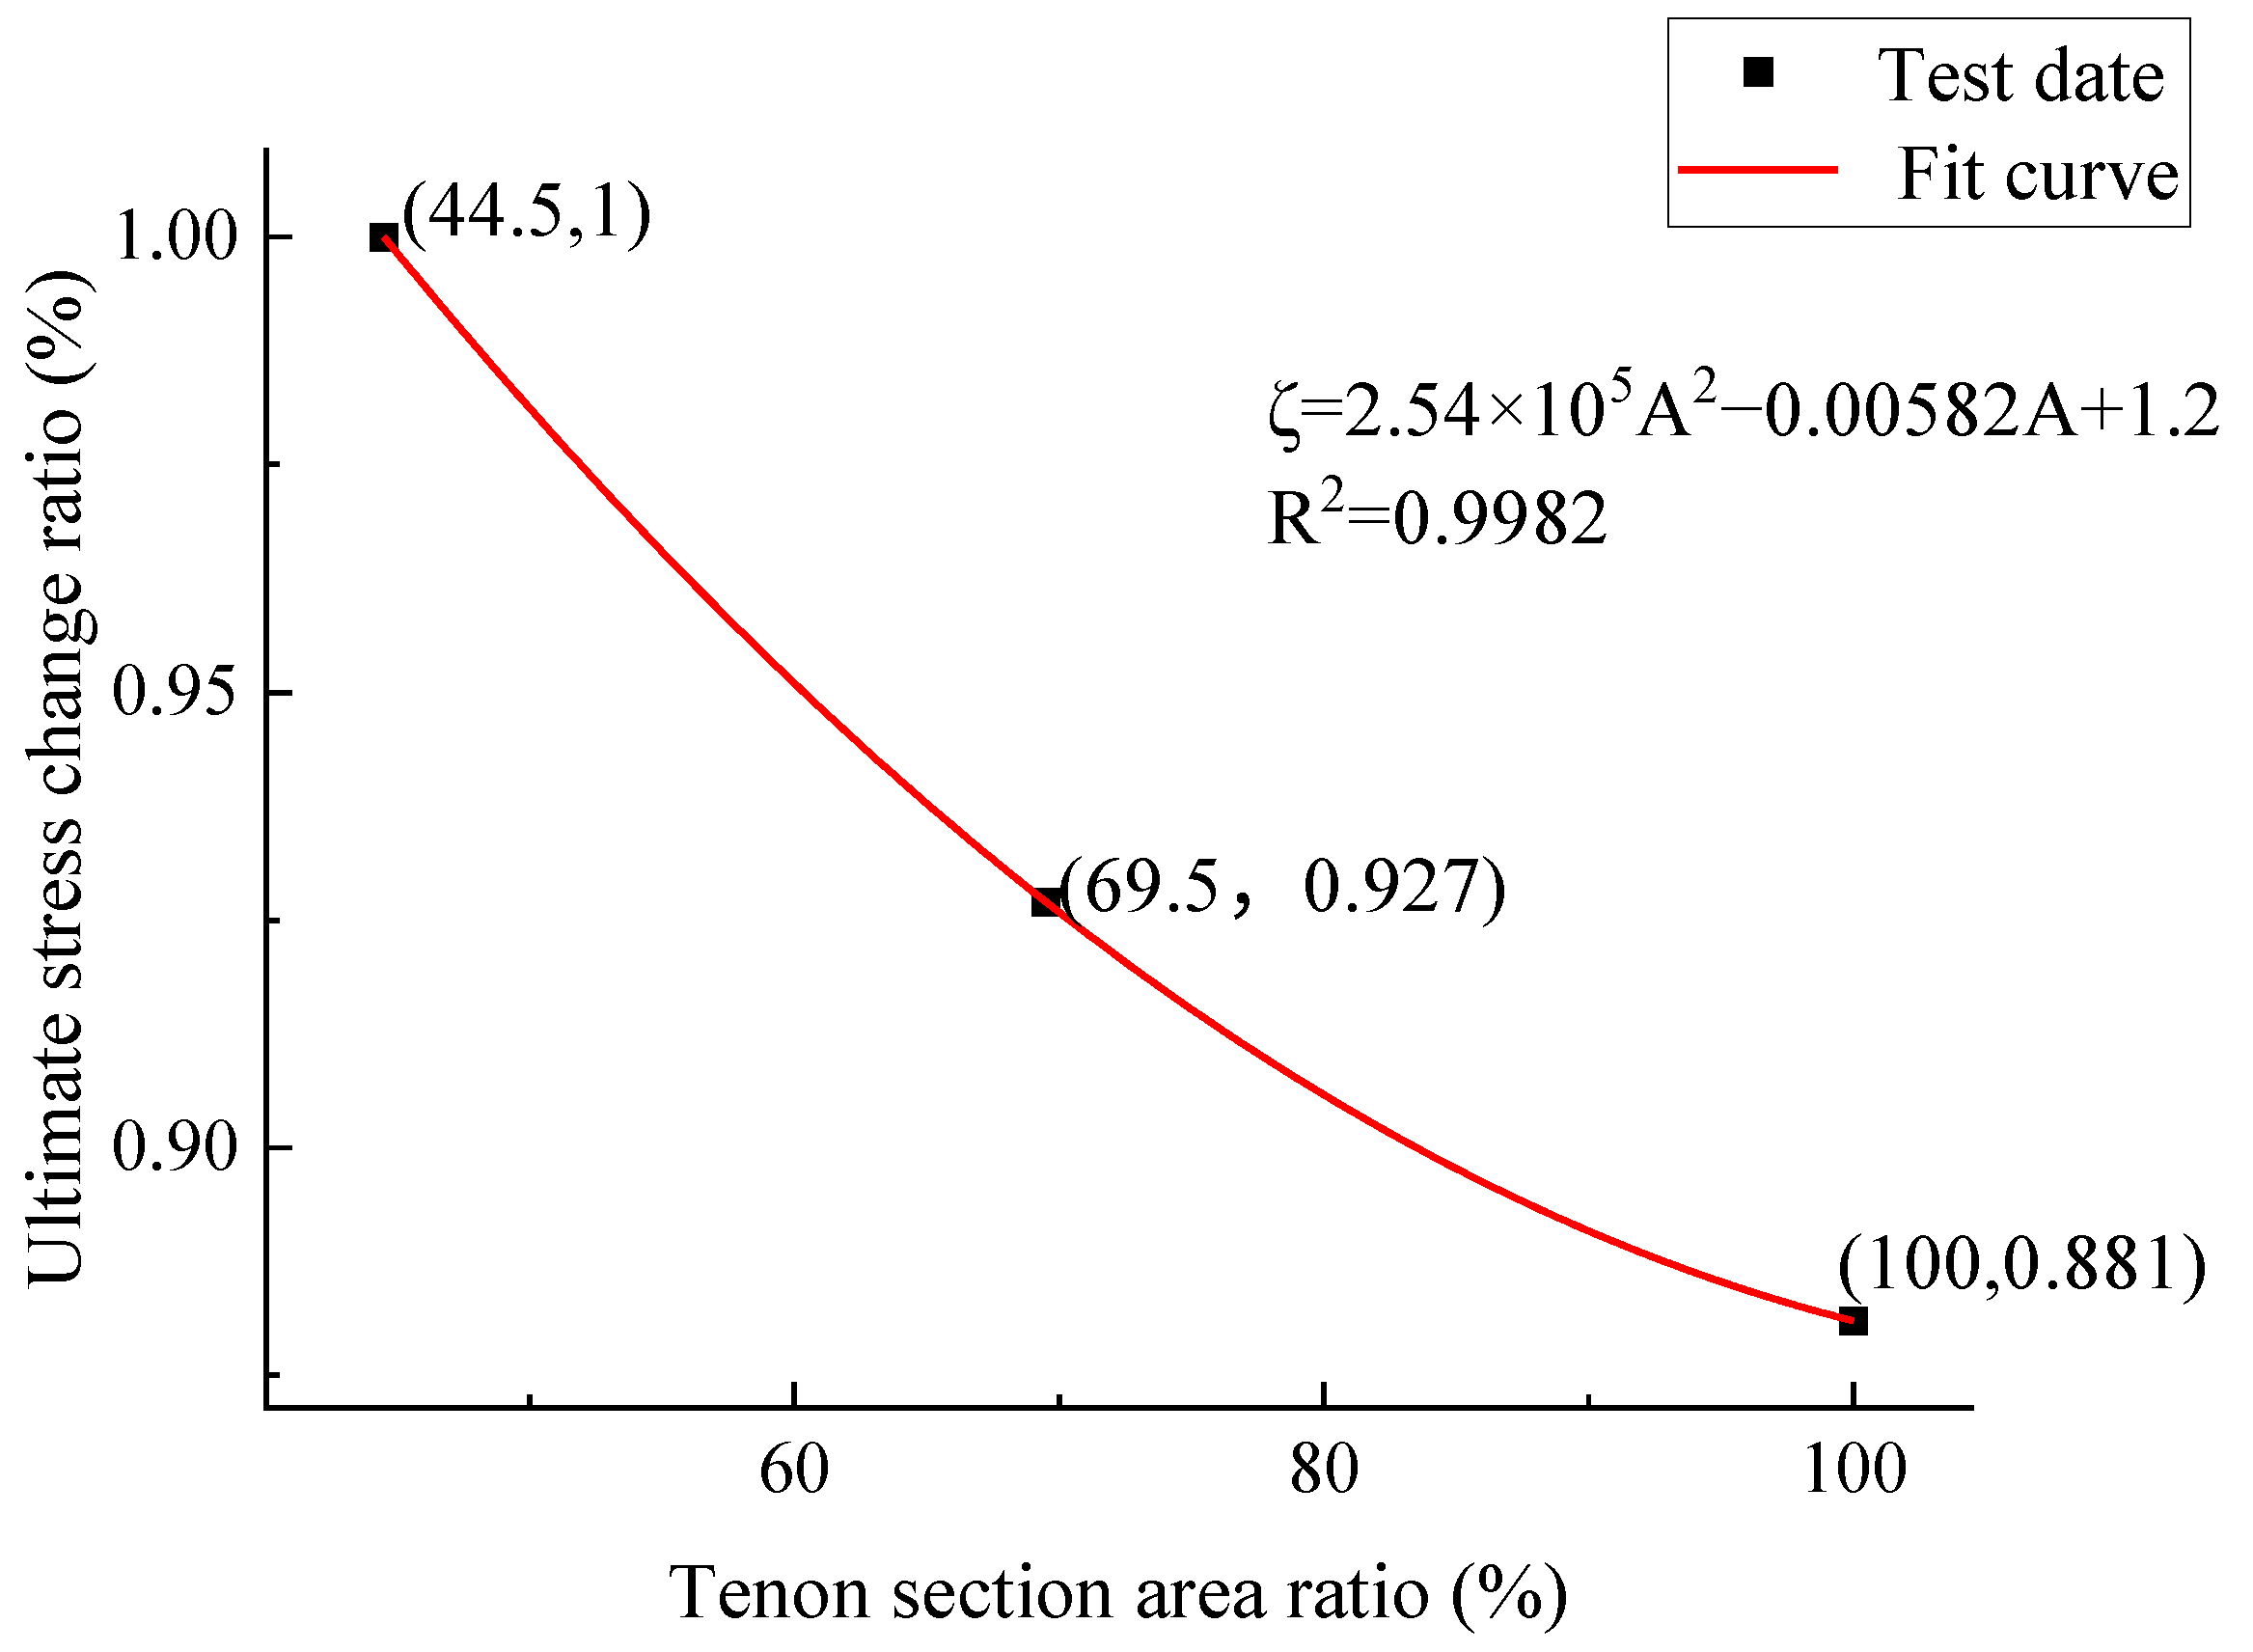
4.1. Ultimate Bearing Capacity

To minimize the interference of initial defects in the wooden columns with the bearing capacity results, the ultimate stress σu is used to normalize the bearing capacity results of the test specimens. The ultimate stress σu is calculated using the formula σu = Pu/A, where Pu is the average peak load of the specimen and A is the original cross-sectional area of the column. The impact of the cross-sectional area of the tenon on the bearing capacity of the four-section composite column is quantified using the change ratio of ultimate stress (ζ). The change ratio of ultimate stress (ζ) is the ratio of the ultimate stress of the four-section composite column to that of specimen A3. The ultimate bearing capacity data for each specimen can be found in Table 4.
From Table 3 and Table 4, it can be seen that the change in the cross-sectional area of the concealed tenon has a significant impact on the load-bearing capacity of the wooden column. As the cross-sectional area of the concealed tenon decreases, the ultimate bearing capacity of the specimen increases, with an increase of 7.3% to 11.9%. Compared with specimen A3, specimen A1 has a 55.5% reduction in the cross-sectional area of the concealed tenon, and the ultimate bearing capacity of the specimen increases by 11.9%. Compared to specimen A3, specimen A2 had a 30.5% reduction in the cross-sectional area of the mortise, resulting in a 7% increase in the ultimate bearing capacity. Compared to specimen A3, specimen A4 had a 30 mm reduction in the length of the mortise, resulting in a 9% decrease in the bearing capacity. Compared to specimen A4, specimen A5 had a 30 mm reduction in the length of the mortise, with no significant change in the ultimate bearing capacity. This indicates that the length of the mortise has an impact on the ultimate bearing capacity of the specimen within a certain range, with the ultimate bearing capacity increasing as the length of the mortise increases. Specimen A1 showed the best load-carrying capacity among all the specimens, which may be due to the fact that specimen A1 had the smallest tongue and groove cross-sectional area, which made the cross-sectional area of the hazardous damage section the largest, and the tensile stress required for the fracture of the wood fibers in the vicinity of the hazardous damage section was greater. Figure 7 shows the relationship curve between the change ratio of ultimate stress and the ratio of mortise area for the group with varying mortise cross-sectional area. The curve indicates that the change ratio of ultimate strain for the four-section composite column decreases quadratically with the increase in the ratio of mortise area. As shown in Equation (1), the attenuation pattern of the bearing capacity of the specimens in this experiment with the ratio of mortise area can be expressed as:
ζ = 2.54 × 10 5 A 2 0.00582 A + 1.2
where ζ is the limit strain change ratio, and A is the ratio of the cross-sectional area of the tenon.
The change in tenon length has a minor impact on the ultimate stress of the specimens, and the ultimate stress of the specimens in the tenon length group is relatively similar. This may be because the change in tenon length does not alter the critical section of the wooden column, but only changes the lateral stiffness of the specimens. Similar results were obtained by Cheng [28], where the change in tenon length did not have a significant effect on the load-carrying capacity of the timber post.

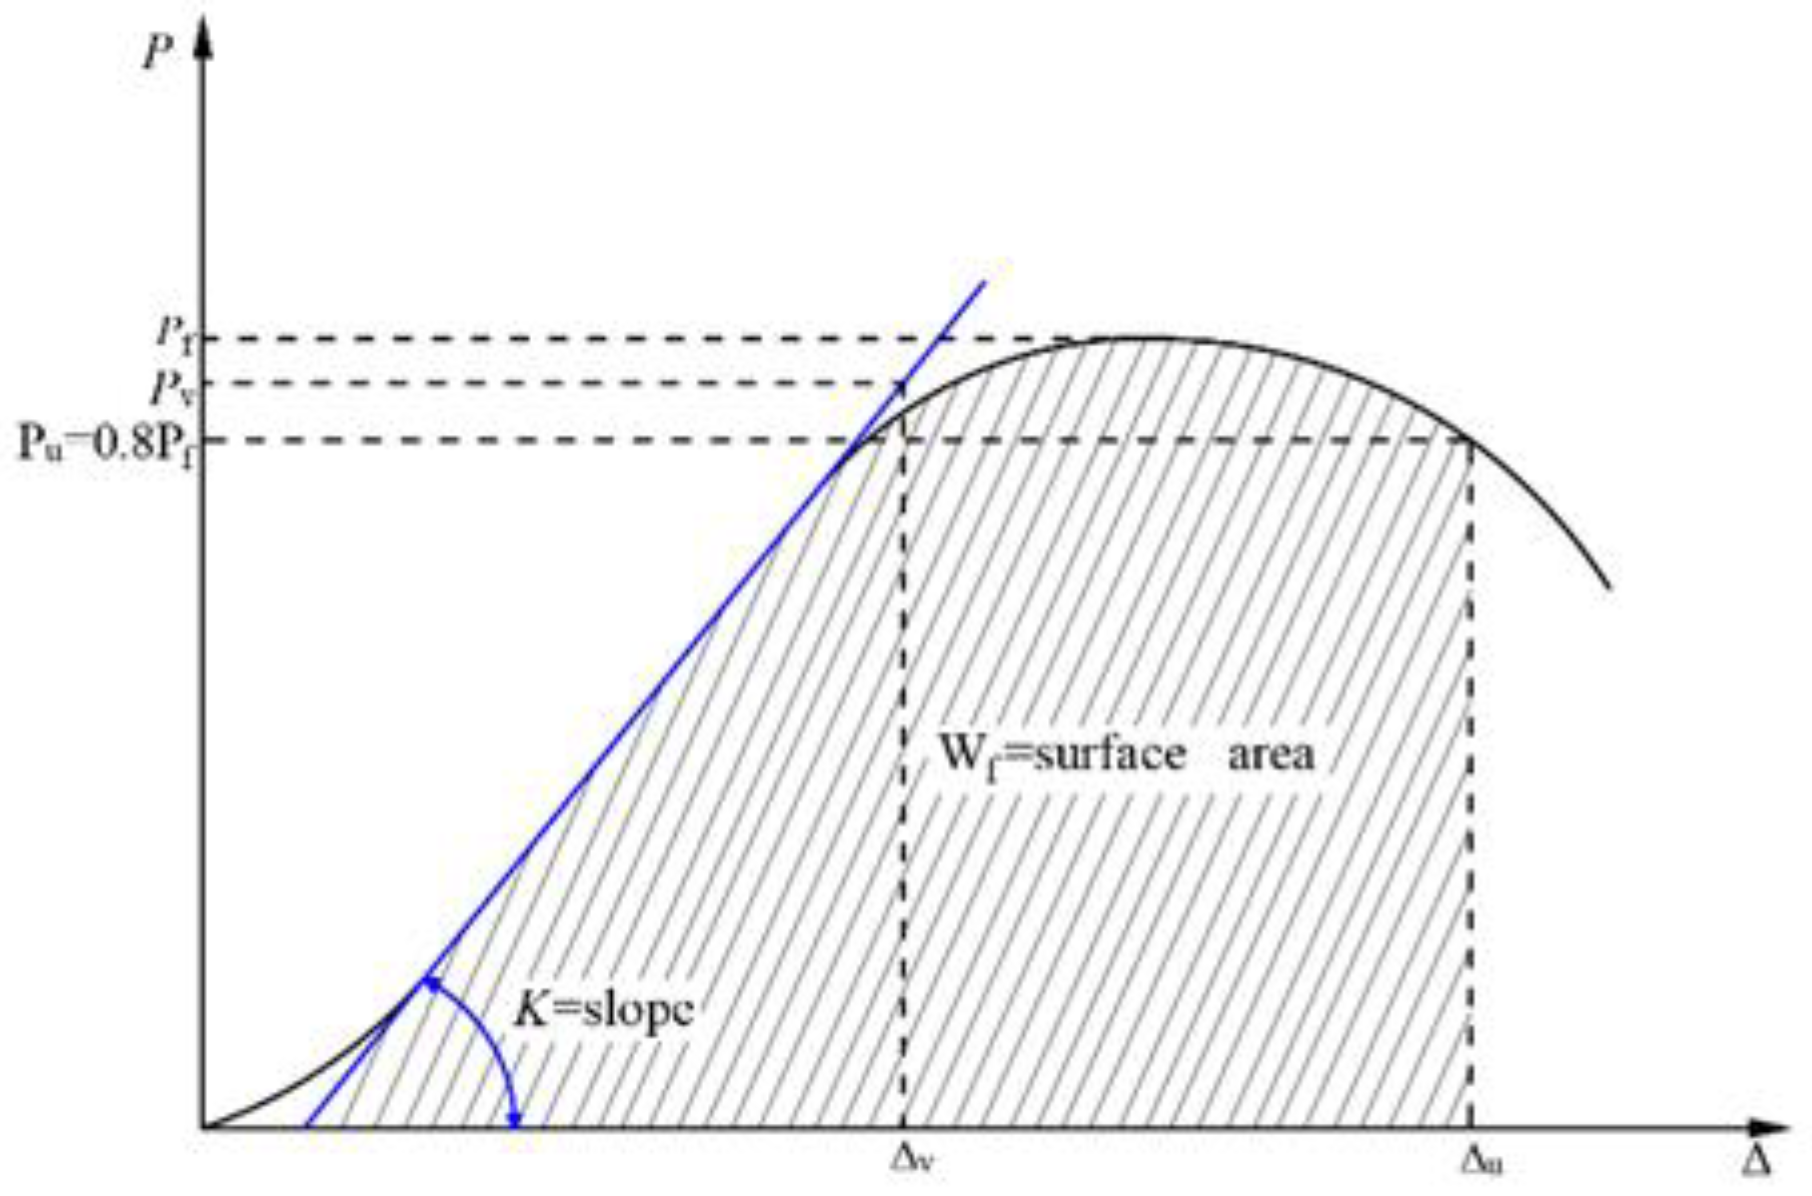
4.2. Stiffness and Stability Coefficient

To compare the axial stiffness of the test specimens during the elastic phase, the initial nonlinear phase of the load–displacement curve is ignored to avoid its influence [29]. The initial axial stiffness K of the specimens is represented by the slope of the load–displacement curve from 20% to 40% of the peak load. The initial axial stiffness data of each specimen is shown in Table 5.
From Table 4, it can be seen that the increase in the mortise cross-sectional area caused the axial stiffness of the wooden columns to first increase and then decrease with the decrease in the mortise length, with an overall decreasing trend, and the axial stiffness of the specimens in the mortise cross-sectional area group was significantly larger than that of the mortise length group. This may be due to the fact that the tenon lengths of the specimens in the tenon cross-sectional area group are all larger than those in the tenon length group, and the core region of the wood column is larger, which has better overall stability and thus exhibits greater stiffness. The specimens with larger knots in the column exhibited lower stiffness, resulting in an increase in the CoV value of the axial stiffness of the specimens.
For the four-section spliced wooden column, the mortise-and-tenon connection creates gaps inside the column, which changes the slenderness ratio of the column. The change in slenderness ratio leads to a change in the stability coefficient of the column, which in turn affects the bearing capacity of the column (NφA0fc; this formula is used to calculate the bearing capacity of axial compression members during stability verification). The slenderness ratio of the specimen can be expressed as [26]:
λ = l 0 i
where l0 (=kl; k is the length calculation coefficient, the hinge connection k at both ends of the specimen is taken as 1.0 and l is the actual length of the specimen) is the calculated length of the specimen, and i is the radius of gyration of the complete specimen section.
The slenderness ratio of a specimen with a notch in the same cross-section can be expressed as:
λ p = l 0 i p
where ip is the radius of gyration of the four-segment combined column cross-section, i p = I p / A p . Ip represents the sectional moment of inertia of the four-section composite column, and Ap represents the net sectional area of the four-section composite column.
Figure 8 is a schematic diagram of the cross-section of a four-section composite wooden column. According to the calculation principle of sectional moment of inertia, the moment of inertia of the wooden column section can be calculated as:
I p = π D 4 64 2 b t 3 + b 3 t 3 R 2 b t 2 + R t b 2
The net cross-section of the wooden column can be obtained from Equation (5):
A n = π R 2 4 b t
According to the specification [26], the stability coefficient of the wooden column is defined as:
φ = 1 + λ 2 f c k b c π 2 E k 1 , λ λ c a c π 2 E k λ 2 f c k                                 , λ > λ c
The wood used in this experiment is all scotch pine wood. According to the specifications [14], the relevant coefficients are taken as αc = 0.95, bc = 1.43, cc = 5.28, β = 1.0, Ek/fck = 300, where λ c = c c β E k / f c k = 91.45 . The slenderness ratio of the test piece is less than 91.45, and the stability coefficient of the test piece can be calculated using the first calculation formula in Equation (6). The stability coefficient and related parameter calculation results of the test piece are shown in Table 5. From the table, it can be seen that when the length of the tenon is the same, the change in the cross-sectional area of the tenon has a small impact on the stability coefficient of the test piece, and the overall trend is decreasing. This indicates that when the length and slenderness ratio of the wooden column is small, the change in tenon dimensions does not have a large impact on the overall stability of the wooden column, and thus the specimens are all strength-damaged. At the same time, the tenon cross-sectional area of specimens 3, 4 and 5 did not change, and the length of the tenon did not lead to a change in the cross-sectional area of the specimen, so the calculation of the length and slenderness ratio and stability coefficient of specimen 3 were analyzed.

4.3. Ductility

Displacement ductility is an important indicator for measuring the elastic–plastic deformation capacity of a component or structure. To measure the elastic–plastic deformation capacity of a wooden column, the displacement ductility factor (μ) is used for quantification, calculated according to the following formula:
μ = Δ u Δ v
where Δu and Δv represent the displacements corresponding to the failure load and yield load, respectively. In this paper, the equivalent elastic–plastic energy method (EEEP) [30] is used to calculate the ductility index of the wooden column, and the displacement when the load decreases to 80% of the ultimate load is taken as the failure displacement Δu. The yield displacement is obtained by Equations (8) and (9):
Δ v = P v K
P v = K Δ u Δ u 2 2 w K
where Pv is the yield load of the specimen, K is the initial axial stiffness, and w is the energy lost before failure (the area enclosed by the load–displacement curve before failure), as shown in Figure 9. The relevant calculation coefficients for each specimen are shown in Table 5.
As shown in Figure 10, the ductility index of each specimen is greater than 4. This is because compressed wood is a material with good ductility, and wood columns with lower bearing capacities exhibit better ductility [31,32]. The ductility coefficient of the specimens increases with the decrease in the tenon length. When the tenon length is less than 60 mm, the ductility coefficient increases sharply. When the tenon length decreases from 90 mm to 60 mm and 30 mm, the ductility coefficients of the wood columns increase by 35.4% and 23.77%, respectively, indicating that the decrease in the tenon length is very effective in improving the deformation capacity of the wood columns. The wood column with a tenon length of 60 mm has the best ductility performance, followed by the 30 mm wood column, and the worst is the wood column with a tenon length of 90 mm. At the same time, the ductility coefficients of the wood columns in the tenon cross-sectional area group are all smaller than those in the tenon length group, indicating that the tenon length has a more significant impact on the deformation capacity of the wood columns. In the restoration of some historical buildings and in antique architecture, this component combines moderate load-bearing capacity with excellent deformation capacity and can be used to restore original structural features while effectively coping with deformation caused by earthquakes or other loads.

5. Conclusions

(1)
When the length of the wooden column remains constant, changes in the cross-sectional size of the concealed mortise and the length of the wedge do not alter the failure mode of the specimen. The specimen mainly undergoes three working stages during axial compression: the elastic stage, the elastic–plastic stage, and the plastic stage.
(2)
The tenon cross-sectional area has a significant effect on the load-carrying capacity, stiffness and ductility coefficients of the specimen and a relatively small effect on the stability coefficient. The ultimate load-carrying capacity decreases with increasing tenon cross-sectional area of the specimen and the ductility decreases with increasing tenon cross-sectional area. The ultimate load-carrying capacity of the specimens decreased by 7.3–11.9% for tenon cross-sectional area ratios of 44.5–100% compared to the specimens with the largest tenon cross-sectional areas. The axial stiffness of the specimen increases and then decreases with the increase in tenon cross-sectional area, which corresponds to the change rule of ductility. Stability coefficient with the increase in tenon cross-sectional area overall tendency to decrease.
(3)
In addition, the length of the tenon also has an effect on the load-carrying capacity, stiffness and ductility of the specimen. The size of the tenon length has a more obvious effect on the ultimate load capacity of the specimen within a certain range. When the tenon length is reduced from 60 mm to 30 mm, the ultimate load capacity of the specimen does not change significantly, and 60 mm can be taken as the design standard value of the ultimate load capacity of the four-section joint column. At the same time, the ductility of the specimen is best when the tenon length is 60 mm, increasing the length of the tenon can effectively improve the load-bearing capacity and deformation capacity of the laminated timber columns.
(4)
The current study was limited to sample data with a small sample size, which may affect the generalizability and statistical significance of the findings. Future studies try to increase the sample size and diversify the sources to verify the generalizability and reliability of the findings. Studies on ancient wood buildings should consider more carefully the effects of environmental conditions on material properties, such as humidity changes and long-term exposure conditions. It is hoped that the sample data in Table 4 will continue to be increased in the future, and the relevant mechanical property parameters of this component will continue to be supplemented, so as to provide the experimental basis for the establishment of the subsequent strength model and the constitutive relationship, which can provide a more scientific and reliable technical support for the protection and restoration of ancient buildings.

Author Contributions

Y.Q.: Data curation, Formal analysis, Writing—original draft, Visualization, Investigation. S.P. and Y.S.: Conceptualization, Funding acquisition, Writing—review and editing, Supervision. All authors have read and agreed to the published version of the manuscript.

Funding

This research is funded by ‘Natural Science Foundation of Hubei Province of China (CN)’—‘China’ (Grant No. 2022CFB662), ‘Hubei Construction Science and Technology Plan Project of China (CN)’—‘China’ (Grant No. 202144) and their support is gratefully acknowledged.

Informed Consent Statement

The authors declare that they have no known competing financial interests or personal relationships that could have appeared to influence the work reported in this paper.

Data Availability Statement

Some or all data, models, or code that support the findings of this study are available from the corresponding author upon reasonable request.

Conflicts of Interest

The authors declare no conflicts of interest.

References

  1. King, W.S.; Richard, Y.J.Y.; Alex, Y.Y.N. Joint characteristics of traditional Chinese wooden frames. Eng. Struct. 1996, 18, 635–644. [Google Scholar] [CrossRef]
  2. Zhao, H.T.; Zhang, F.L.; Xue, J.Y.; Xie, Q.; Zhang, X.; Ma, H. Research review on structural performance of ancient timber structure. J. Build. Struct. 2012, 33, 1–10. [Google Scholar]
  3. Siha, A.; Zhou, C. Experimental study and numerical analysis of composite strengthened timber columns under lateral cyclic loading. J. Build. Eng. 2023, 67, 106077. [Google Scholar] [CrossRef]
  4. Pang, S.J.; Oh, J.K.; Hong, J.P.; Lee, S.J.; Lee, J.J. Stochastic model for predicting the bending strength of glued-laminated timber based on the knot area ratio and localized MOE in lamina. J. Wood Sci. 2018, 64, 126–137. [Google Scholar] [CrossRef]
  5. Li, H.; Qiu, H.X.; Lu, Y. An analytical model for the loading capacity of splice-retrofitted slender timber columns. Eng. Struct. 2020, 225, 111274. [Google Scholar] [CrossRef]
  6. Li, Z.; He, M.; Tao, D.; Li, M. Experimental buckling performance of scrimber composite columns under axial compression. Compos. Part B Eng. 2016, 86, 203–213. [Google Scholar] [CrossRef]
  7. Han, Y.; Chun, Q.; Xu, X.; Teng, Q.; Dong, Y.; Lin, Y. Wind effects on Chinese traditional timber buildings in complex terrain: The case of Baoguo Temple. J. Build. Eng. 2022, 59, 105088. [Google Scholar] [CrossRef]
  8. Chu, Y.P.; Shi Bixin Gong, Y.D. Experimental study on compressive behavior of intermediate slender timber columns with local damage and the retrofitting techniques for the damaged columns. Structures 2022, 46, 1709–1725. [Google Scholar] [CrossRef]
  9. Qin, G.Z.; Li, M.; Fang, S.Y.; Deng, T.; Huang, C.; Mao, F.; Zhao, Y.; Xu, N. Study of a grid-based regional localization method for damage sources during three-point bending tests of wood. Constr. Build. Mater. 2024, 419, 135348. [Google Scholar] [CrossRef]
  10. Thamboo, J.; Navaratnam, S.; Poologanathan, K.; Corradi, M. Experimental investigation of timber samples under triaxial compression conditions. J. Build. Eng. 2022, 104891. [Google Scholar] [CrossRef]
  11. Kia, L.; Valipour, H.R.; Ghanbari-Ghazijahani, T. Experimental and numerical investigation of concentric axial loading on bar-reinforced composite timber columns at a large scale. Structures 2024, 60, 105920. [Google Scholar] [CrossRef]
  12. Shi, F.; Wang, L.B.; Du, H.; Zhao, M.; Li, H.; Wang, F.; Wang, S. Axial Compression Behavior of FRP Confined Laminated Timber Columns under Cyclic Loadings. Buildings 2022, 12, 1841. [Google Scholar] [CrossRef]
  13. Zhang, L.; Liu, C.; Zhou, T. Experimental study on mechanical properties of column foot of ancient timber structures—Take the drum-shaped plinth as an example. Structures 2022, 40, 1002–1013. [Google Scholar] [CrossRef]
  14. Xu, F.Y.; Zhang, Z.; Meng, X.M.; Wu, X.; Gao, Y. Axial compressive performance of cruciform timber-encased steel composite columns: Experimental investigation and buckling analysis through 3D laser scanning. Thin-Walled Struct. 2024, 201, 111968. [Google Scholar] [CrossRef]
  15. Wang, Y.; Huang, Q.Z.; Dong, H.; Wang, Z.Q.; Shu, B.Q.; Gong, M. Mechanical behavior of cross-laminated timber-bamboo short columns with different layup configurations under axial compression. Constr. Build. Mater. 2024, 421, 135695. [Google Scholar] [CrossRef]
  16. Dubois, F.; Dopeux, J.; Pop, O.; Metrope, M. Long-term creep behavior of timber columns: Experimental and numerical protocols. Eng. Struct. 2023, 275, 115283. [Google Scholar] [CrossRef]
  17. Navaratnam, S.; Thamboo, J.; Poologanathan, K.; Roy, K.; Gatheeshgar, P. Finite element modelling of timber infilled steel tubular short columns under axial compression. Structures 2021, 30, 910–924. [Google Scholar] [CrossRef]
  18. Zheng, Y.B.; Zhou, C.D. Axial compressive properties of intermediately slender circular ancient timber columns reinforced with high-performance bamboo-based composites. Structures 2024, 65, 106720. [Google Scholar] [CrossRef]
  19. Malhotra AS, K.; Sukumar, A.P. Reliability-based design of mechanically connected built-up wood columns. Can. J. Civ. Eng. 1991, 18, 171–179. [Google Scholar] [CrossRef]
  20. Song, X.B.; Frank, L. Laterally braced wood beam-columns subjected to biaxial eccentric loading. Comput. Struct. 2009, 87, 1058–1066. [Google Scholar] [CrossRef]
  21. Theiler, M.; Frangi, A.; Steiger, R. Strain-based calculation model for centrically and eccentrically loaded timber columns. Eng. Struct. 2013, 56, 1103–1116. [Google Scholar] [CrossRef]
  22. Li, S.Y.; Xu, Q.F. Compressive behavior of damaged timber columns: Experimental tests, degradation model, and repair method. Eng. Struct. 2023, 293, 116579. [Google Scholar] [CrossRef]
  23. A, S.H.; Zhou, C.D.; Yang, L.G. Experimental investigation on axial compression behavior of timber columns strengthened with composite reinforcement method. China Civ. Eng. J. 2021, 54, 1–9. [Google Scholar]
  24. Wei, P.; Wang, B.J.; Li, H.; Wang, L.; Peng, S.; Zhang, L. A comparative study of compression behaviors of cross-laminated timber and glued-laminated timber columns. Constr. Build. Mater. 2019, 222, 86–95. [Google Scholar] [CrossRef]
  25. Xie, Q.F.; Zhang, B.Z.; Zhang, L.P.; Miao, Z. Study on mechanical performance test and degradation model of naturally cracked timber columns. J. Build. Struct. 2022, 43, 210–222. [Google Scholar]
  26. GB 50005-2017; Standard for Design of Timber Structures. Ministry of Housing and Urban-Rural Development: Beijing, China, 2017.
  27. GB/T 50329-2012; Standard for Test Methods of Timber Structures. Ministry of Housing and Urban-Rural Development: Beijing, China, 2012.
  28. Cheng, X.W.; Yu, H.R.; Shi, M.Y.; Sun, X.L.; Lu, W.D. Axial compression test of glulam columns based on traditional splicing method. J. Nanjing Tech Univ. 2022, 44, 654–663. [Google Scholar]
  29. Kia, L.; Valipour, H.R. Composite timber-steel encased columns subjected to concentric loading. Eng. Struct. 2021, 232, 111825. [Google Scholar] [CrossRef]
  30. André, J.; Massimo, F. General notes on ductility in timber structures. Eng. Struct. 2011, 33, 2987–2997. [Google Scholar]
  31. Xu, F.Y.; Xuan, S.Q.; Li, W.; Meng, X.; Gao, Y. Compressive performance of steel-timber composite L-shaped columns under concentric loading. J. Build. Eng. 2022, 48, 103967. [Google Scholar] [CrossRef]
  32. Karampour, H.; Bourges, M.; Gilbert, B.P.; Bismire, A.; Bailleres, H.; Guan, H. Compressive behaviour of novel timber-filled steel tubular (TFST) columns. Constr. Build. Mater. 2020, 238, 117734. [Google Scholar] [CrossRef]
Figure 1. Collocated columns in ancient buildings.
Buildings 14 02438 g001
Figure 2. Internal construction of typical specimens.
Buildings 14 02438 g002
Figure 3. Test setup.
Buildings 14 02438 g003
Figure 4. Failure mode of specimens. (a,b) Cracks on the surface of the specimens and (c,d) cracks within the specimens.
Buildings 14 02438 g004
Figure 5. Load–longitudinal displacement curves. (a) Load-displacement curve for the mortise cross-sectional area group and (b) Load-displacement curve for the tenon length group.
Buildings 14 02438 g005
Figure 6. Load–strain curves. (a) Load-strain curve of tenon cross-sectional area group and (b) Load strain curve of tenon length group.
Buildings 14 02438 g006
Figure 7. Relation curve of the tenon section area group and tenon section area ratio.
Buildings 14 02438 g007
Figure 8. Schematic cross-section of a four-section composite wooden column.
Buildings 14 02438 g008
Figure 9. Schematic diagram for determining ductility index by equivalent elastic–plastic energy method (EEEP).
Buildings 14 02438 g009
Figure 10. Ductility coefficients of specimens.
Buildings 14 02438 g010
Table 1. Elastic engineering constants of PSVM.
EL/
MPa
ER/
MPa
ET/
MPa
ΜLRΜLTΜRTGLR/
MPa
GLT/
MPa
GRT/
MPa
10562.4563.4796.50.30.350.51706.4706.4191.8
Note: L. parallel to the grain direction; R. transverse to the grain direction; T. transverse to the chord direction; LR. radial section; LT. tangential section; RT. transverse section; E. elastic modulus; M. Poisson’s ratio; G. shear elasticity.
Table 2. Specimen size design.
Specimens No.Length of Upper and Lower Surfaces/mmLength of the Lower Base/mmThickness
/mm
Length of Tenon Joint/mm
A1a16202090
b16202090
c16202090
A2a20252590
b20252590
c20252590
A3a24303090
b24303090
c24303090
A4a24303060
b24303060
c24303060
A5a24303030
b24303030
c24303030
Table 3. Axial pressure test results.
Specimens No.L/mmΔu/mmPu/kNFailure Mode
A1-a/b/c36013.74388.85Strength failure
A2-a/b/c36012.82372.9Strength failure
A3-a/b/c36012.17347.5Strength failure
A4-a/b/c36015.05316.1Strength failure
A5-a/b/c36012.35310.8Strength failure
Note: Δu is the axial displacement corresponding to the load of the test piece falling to 80% of the ultimate load; Pu is the average ultimate bearing capacity of the test specimen.
Table 4. Characteristic parameters of axial compression of four-section composite columns.
Spcimen No.Ultimate Compressive Stress σcu/MpaUltimate Strain εcu/10−6Proportional Limit Stress σce/MpaProportional Limit Strain εce/10−6Failure Stress σcf/MpaFailure Strain εcf/10−6Initial Axial Stiffness K/(KN/mm)Variation Coefficient of Initial Axial Stiffness CoV/%
A1-a16.08182511.261202.7812.863815.56107.638.84
A1-b15.031586.9410.521082.2212.13815.56121.98
A1-c15.02158711.021084.5412.553815.55112.87
A2-a15.431836.3910.8981.3912.343560.56101.923.87
A2-b14.411101.9410.01560.8311.523255139.88
A2-c14.551454.2210.4812.0111.663335.2129.56
A3-a12.801738.338.961087.7810.242921.3997.5316.86
A3-b15.021732.5010.521289.7212.323815.56123.93
A3-c13.881735.429.581188.6811.563541.26112.86
A4-a13.191556.119.23841.1110.554180.28130.5724.31
A4-b12.11396.118.47981.399.684376.3992.23
A4-c12.51486.528.88912.089.854256.21118.54
A5-a11.441272.788.08869.179.153840.8392.264.28
A5-b13.451480.289.421076.6710.763431.6798.02
A5-c13.021345.209.12956.4210.223654.7595.55
Table 5. Stabilization coefficients and related parameters.
Spciemens No.Ip/106 mm4Ap/mm2ip/mmλpφ
A150.416623846.945.987.8290.985
A249.884122946.946.6257.7210.986
A349.234921846.947.4727.5830.965
Disclaimer/Publisher’s Note: The statements, opinions and data contained in all publications are solely those of the individual author(s) and contributor(s) and not of MDPI and/or the editor(s). MDPI and/or the editor(s) disclaim responsibility for any injury to people or property resulting from any ideas, methods, instructions or products referred to in the content.

