Article

Model Design and Application for Excavation Face Stability in Upward Shield Tunneling

by
Xiao Wang
1,2,3,
Yijie Li
1,2,3,
Gang Wei
1,2,3,4,*,
Xinjiang Wei
1,2,3,
Zihai Yan
5,6,
Jiajia Yan
5,6 and
Baojian Li
3,5
1
Department of Civil Engineering, Hangzhou City University, Hangzhou 310015, China
2
Key Laboratory of Safe Construction and Intelligent Maintenance for Urban Shield Tunnels of Zhejiang Province, Hangzhou 310015, China
3
Zhejiang Engineering Research Center of Intelligent Urban Infrastructure, Hangzhou 310015, China
4
College of Civil Engineering and Architecture, Zhejiang University, Hangzhou 310058, China
5
Power China Huadong Engineering Corporation, Hangzhou 311122, China
6
Power China Smart Rail Transit Engineering Research Center, Hangzhou 311122, China
*
Author to whom correspondence should be addressed.
Buildings 2024, 14(8), 2514; https://doi.org/10.3390/buildings14082514
Submission received: 13 June 2024 / Revised: 23 July 2024 / Accepted: 13 August 2024 / Published: 15 August 2024
(This article belongs to the Section Building Energy, Physics, Environment, and Systems)

Abstract

:
The emerging upward shield method (USM) for constructing vertical shafts has been used in various projects, including the Midosuji utility tunnel in Japan. A scaled-down model testing system, featuring a geometric similarity ratio of 1:30, was developed specifically for studying the USM. This system incorporates sand inflow control, propulsion control, data acquisition, and water level control. It facilitates detailed observation and recording of parameters such as vertical displacement of surface soil layers, support force at the excavation face, and earth pressure within the model box. Consequently, it enables investigation into the excavation face instability process, modes, and the formation and evolution of the soil arch zone above the excavation face during upward shield tunneling. Additionally, through the application of particle image velocimetry (PIV) technology and GeoPIV-RG software v1.1, quantitative analysis of soil displacement fields during excavation face instability is conducted, capturing microscopic displacements and deformations of soil planes. This approach more accurately elucidates the accuracy of understanding the dynamic response of soil. Pre-test research using the model testing system explores the variation patterns of excavation face load displacement, vertical earth pressure within the failure zone, surface displacement, and internal soil displacement during the instability process. Analysis reveals that excavation face load variation typically progresses through three stages: rapid growth, slow growth, and descent. Moreover, vertical earth pressure shifts upward in tandem with excavation face displacement, while overall surface displacement initially shows slight settlement followed by accelerated uplift.

1. Introduction

The swift advancement of urbanization intensifies the strain on urban surface space, thereby emphasizing the growing potential of underground space development. Rational utilization of urban underground space can effectively alleviate urban traffic pressure and significantly reduce surface traffic congestion. The development of urban underground space is also one of the crucial layouts for urban sustainable development. Vertical shafts, as key channels connecting underground and surface spaces, have a continuously growing construction demand as urban underground space development progresses.
The cut-and-cover method is mostly used in the traditional vertical shaft construction process, which has certain limitations. For instance, in urban central areas or regions with strict environmental protection requirements, the cut-and-cover method may generate noise, vibration, and dust, causing adverse effects on the surrounding environment. Additionally, it can disrupt surrounding traffic, impacting the life quality of residents. As a relatively innovative construction technique for vertical shafts, the upward shield method (USM) exhibits significant advantages. The USM involves using upward shield tunneling machines to excavate upwards from existing horizontal tunnels to the ground to form vertical shafts. This method has been widely applied in various projects [1,2,3,4,5]. It generates minimal noise and vibration during construction activities, resulting in minimal disturbance to the urban environment. Moreover, it boasts fast construction speed, high efficiency, and short ground operation time. During the Bandai–Hannan sewer tunnel construction process, adopting the USM shortened the construction period of vertical shafts by one-third and reduced ground operation time by one-sixth [3].
Similar methods to the USM include the vertical tunneling method (VTM) [6,7,8]. The differences between USM and VTM, as well as the advantages of USM over VTM, are shown in Table 1 [8]. Regarding the application of VTM in drainage tunnel construction, Wang et al. [6,7] investigated the influence of VTM on tunnel structures at different construction stages. Through on-site monitoring and numerical simulation analysis of various engineering cases, they investigated joint deformation and displacement, segmental stress distribution, and bolt internal forces during the vertical tunneling process. Wang et al. [8] detailed the construction process of VTM through a case study of the hydraulic tunnel in Beihai and proposed a back analysis principle of the average frictional coefficient and discussed the variation in the jacking force and its influencing factors. These studies provide theoretical foundations and practical guidance for research and application related to VTM.
Currently, there is relatively limited research on the USM. Researchers [1,2,3,4,5] have analyzed the construction techniques, application cases, and advantages of the USM. However, they have not delved deeply into the theoretical aspects related to the USM. Lu et al. [10] focused on studying the special sections of horizontal shield tunnels corresponding to the construction area of the USM. They derived theoretical formulas for calculating the internal forces of special segments using the uniform stiffness ring method and conducted numerical simulation analysis of axial forces and bending moments for these special segments using Midas GTS NX software.
In shield tunnel construction, it is essential to ensure effective control of the support pressure at the excavation face. Earth pressure balance (EPB) shield machines achieve this by precisely regulating the soil pressure within the chamber, while slurry shield machines adjust the slurry pressure to achieve the same effect. For EPB shield machines, increasing the rate of soil removal decreases the chamber’s soil pressure, whereas decreasing the rate increases it. For slurry shield machines, increasing the slurry discharge rate or reducing the air pressure lowers the slurry pressure, while decreasing the discharge rate or increasing the air pressure raises it. In shield tunnel excavation, the support pressure on the excavation face is crucial for balancing the soil and water pressure. Failure to promptly adjust the support pressure can result in sudden increases or decreases in the soil pressure ahead of the excavation face, leading to the face retreating or advancing too quickly (rapid advancement can cause insufficient soil removal, leading to excessive soil compression). This phenomenon is referred to as active or passive instability of the excavation face. Such instability can result in ground settlement or uplift, negatively impacting nearby structures. Currently, there is extensive research on the stability of horizontal shield tunnel excavation faces. Research methods include model tests [11,12,13,14,15,16], numerical simulation [17,18,19,20,21], and theoretical analysis [22,23,24,25,26,27,28].
Mair and Taylor [11] investigated the stability of excavation faces in horizontal shield tunnels in clay. The study revealed significant differences in the failure modes of excavation faces between tunnels in cohesive soil and those in sandy soil, attributed to the presence of cohesive forces in clayey soil. In sandy soil layers, the excavation face failure shape resembles a chimney, while in clay layers, it exhibits a funnel shape. Wong et al. [29] investigated the passive failure mechanism of excavation faces in sandy soil tunnels through centrifuge model tests and three-dimensional finite element analysis. They proposed a funnel-shaped failure mechanism, and the observed longitudinal and transverse deformations in the experiments could be described by Gaussian distributions. Kirsch [12] studied the stability of excavation faces in horizontal shield tunnels in dry sand. They combined particle image velocity (PIV) technology to identify the active destabilization mechanism of excavation faces and the variations in excavation face support forces in dry sand. Chen et al. [13] conducted model experiments on the stability of excavation faces in sand for horizontal shield tunneling under different burial depth ratios. They examined arching evolution by defining the vertical stress concentration ratio and horizontal stress concentration ratio, identifying two stages of the arching evolution process: local collapse and global collapse. Wang et al. [18] utilized the three-dimensional discrete element method to analyze the excavation face stability of earth pressure balance (EPB) shield tunnels in dry sand. They discovered that considering the dynamic excavation process is crucial for assessing tunnel face stability. Ma et al. [21] employed a three-dimensional finite element method (FEM) model to analyze the minimization of excavation face support pressure’s impact on alternating soft and hard layers during shield tunnel construction. They determined a critical support force range of 1.06 to 1.43 times the lateral earth pressure at the tunnel crown. Lee et al. [22] explored the impact of seepage forces on tunnel face stability through upper-bound solutions and numerical analysis. They identified the minimum support pressure needed for tunnels when considering seepage forces and confirmed the consistency between theoretical calculations and model test outcomes. Mi and Xiang [28] introduced a novel limit equilibrium model, which was developed by extending the analytical solution of three-dimensional pore water pressure distribution and incorporating physical model experiments. This model provided enhanced precision in predicting the ultimate support pressure required for tunnel face stability under seepage conditions in saturated sandy soils. It can be concluded from the abovementioned literature that the diversity of geological formations results in distinct modes of failure and instability at excavation faces. Moreover, current research predominantly emphasizes the active instability of excavation faces, with limited attention given to passive instability.
In conclusion, while there is extensive research on the stability of excavation faces in horizontal shield tunneling, there has been a notable lack of attention given to the stability of excavation faces in the USM. Horizontal shield tunnels, with their horizontal excavation direction, tend to cause less disturbance to the overlying strata, making it relatively easier to control surface settlement. In contrast, the USM, due to its upward excavation process, can cause significant disturbance to the overlying strata, potentially leading to substantial surface settlement. Furthermore, in the event of excavation face instability, the consequences in the USM are typically more severe compared to horizontal shield tunneling. Therefore, research on excavation face stability in upward shield tunneling is particularly important.
Through the independent development and design of a model test system for the USM, scaled-down model tests on active and passive instability of excavation faces in dry sandy and soft clay formations can be conducted. Equipped with propulsion control and water level control systems, this test system can accurately replicate the dynamic processes of active or passive instability of excavation faces under different soil conditions. It can provide theoretical support for exploring the relationship between excavation face loads and displacements, the variation in earth pressure, and the evolution characteristics of surface displacements, thereby laying an experimental foundation for practical engineering applications.

2. Design of the Model Test Apparatus for Face Stability in the USM

2.1. Design Approach to the Model Test Apparatus

The primary objective of designing this experimental model system is to delve deeply into the face instability mechanism in the USM. Throughout the experimental process, it is essential to systematically measure various data, including surface soil displacement, support force, and earth pressure at the excavation face, and internal earth pressure and pore water pressure ahead of the excavation face. By analyzing these data, insights into how instability in the excavation face of the USM impacts the stress and deformation of surrounding soil, as well as the variation patterns of support pressure at the excavation face, can be obtained. Additionally, it allows for a comprehensive investigation of the formation and variation patterns of the soil arch zone during the instability process. Additionally, capturing high-definition images of the excavation face instability process with a camera allows for a more vivid and intuitive analysis of the soil displacement patterns above the excavation face. Furthermore, the model experimental system can simulate different scenarios such as varying cover thicknesses, soil conditions, and excavation face instability modes, and consider factors like seepage and different hydraulic heads, thereby facilitating in-depth research on excavation face instability modes under various conditions.
In the design and fabrication of the model test apparatus, emphasis was placed on considering the primary influencing factors while simplifying or overlooking secondary ones. Using the Midosuji utility tunnel project as a reference [5], the model underwent simplification based on a geometric similarity ratio of 1:30 (see Table 2) to ensure experimental cost-effectiveness and feasibility. The simplification is as follows:
(1) The actual horizontal tunnel, typically cylindrical, is simplified in the experiment to a 1/4 cylinder measuring 1 m in length, with an outer diameter of 0.169 m and an inner diameter of 0.159 m (see Figure 1), and is fabricated using organic glass materials.
(2) The upward shield tunnel was streamlined to a semicircular configuration, constructed from organic glass materials, with an outer diameter of 0.11 m and an inner diameter of 0.1 m. The model of the upward shield excavation face was reduced to a semicylindrical shape, crafted from high-hardness, corrosion-resistant stainless-steel material, with a diameter of 0.1 m (see Figure 1).
(3) Actual excavation of the USM progresses from within the horizontal tunnel upwards. A displacement control method can be employed, i.e., either uniform-speed retraction or advancement of the excavation face over a certain distance can mimic the active and passive instabilities of the excavation face, respectively.
(4) Although soil variability is prevalent in actual conditions, this model adopts the assumption of a homogeneous soil profile to facilitate analysis.

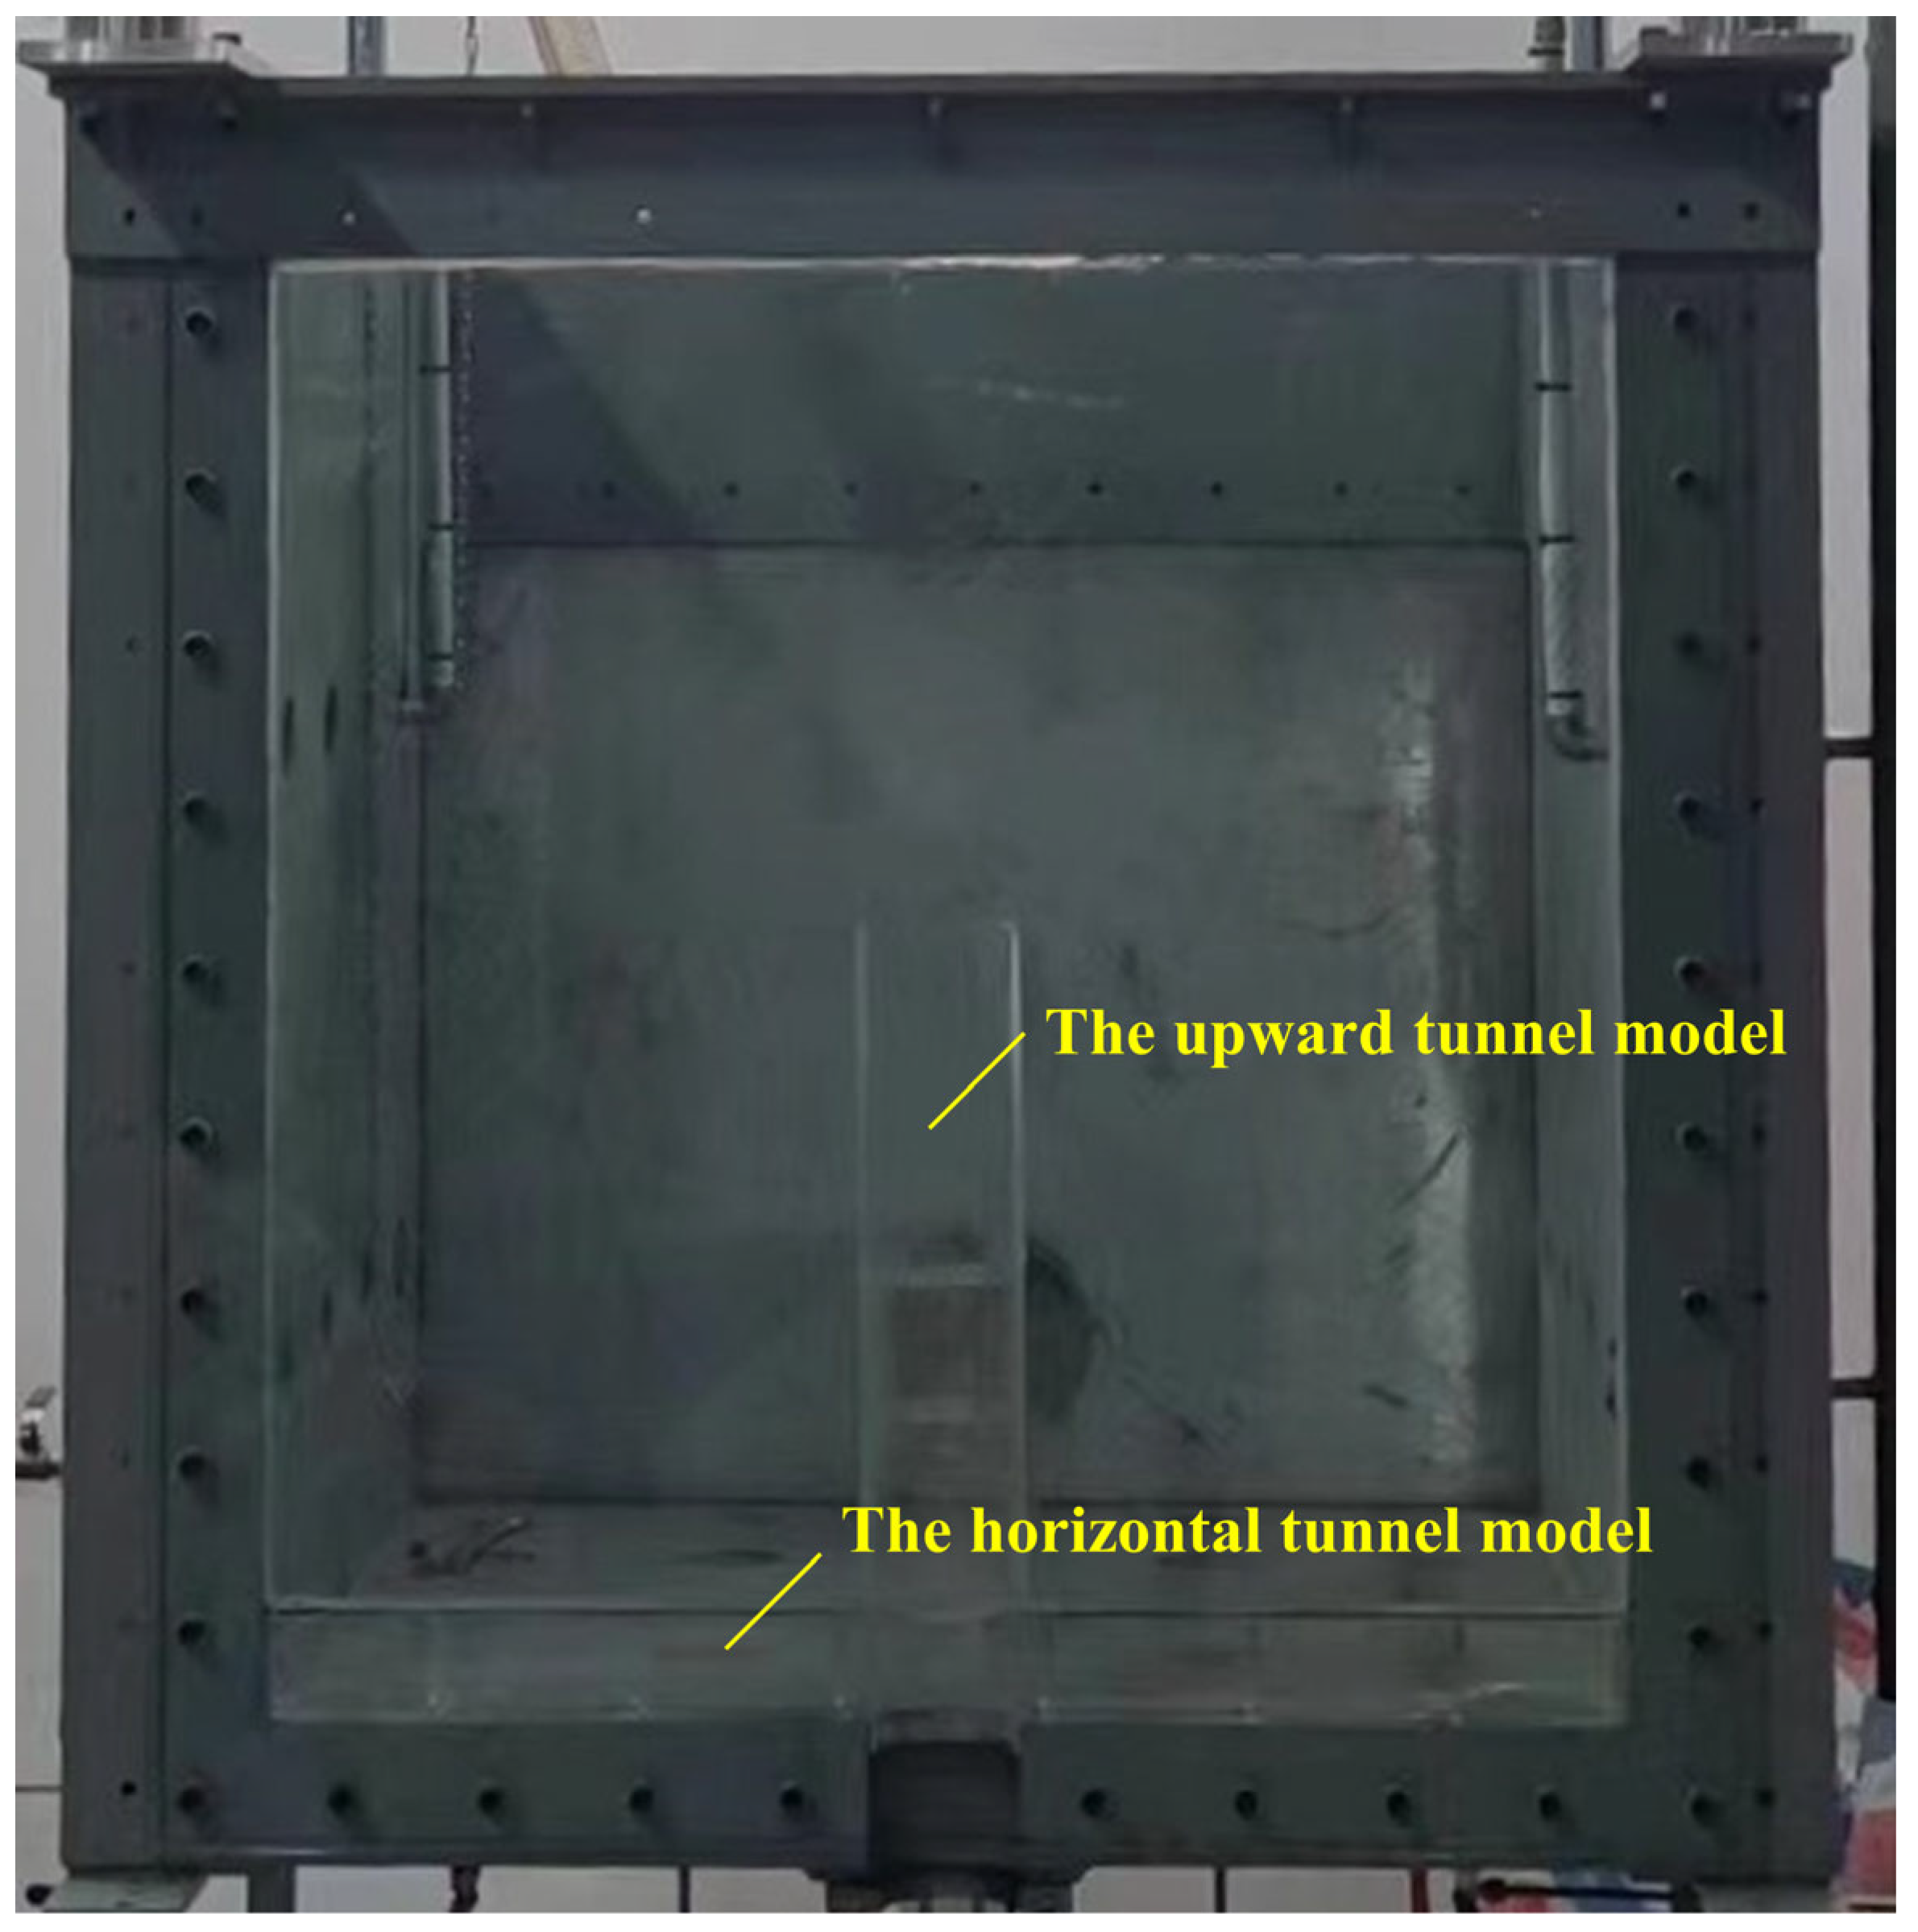
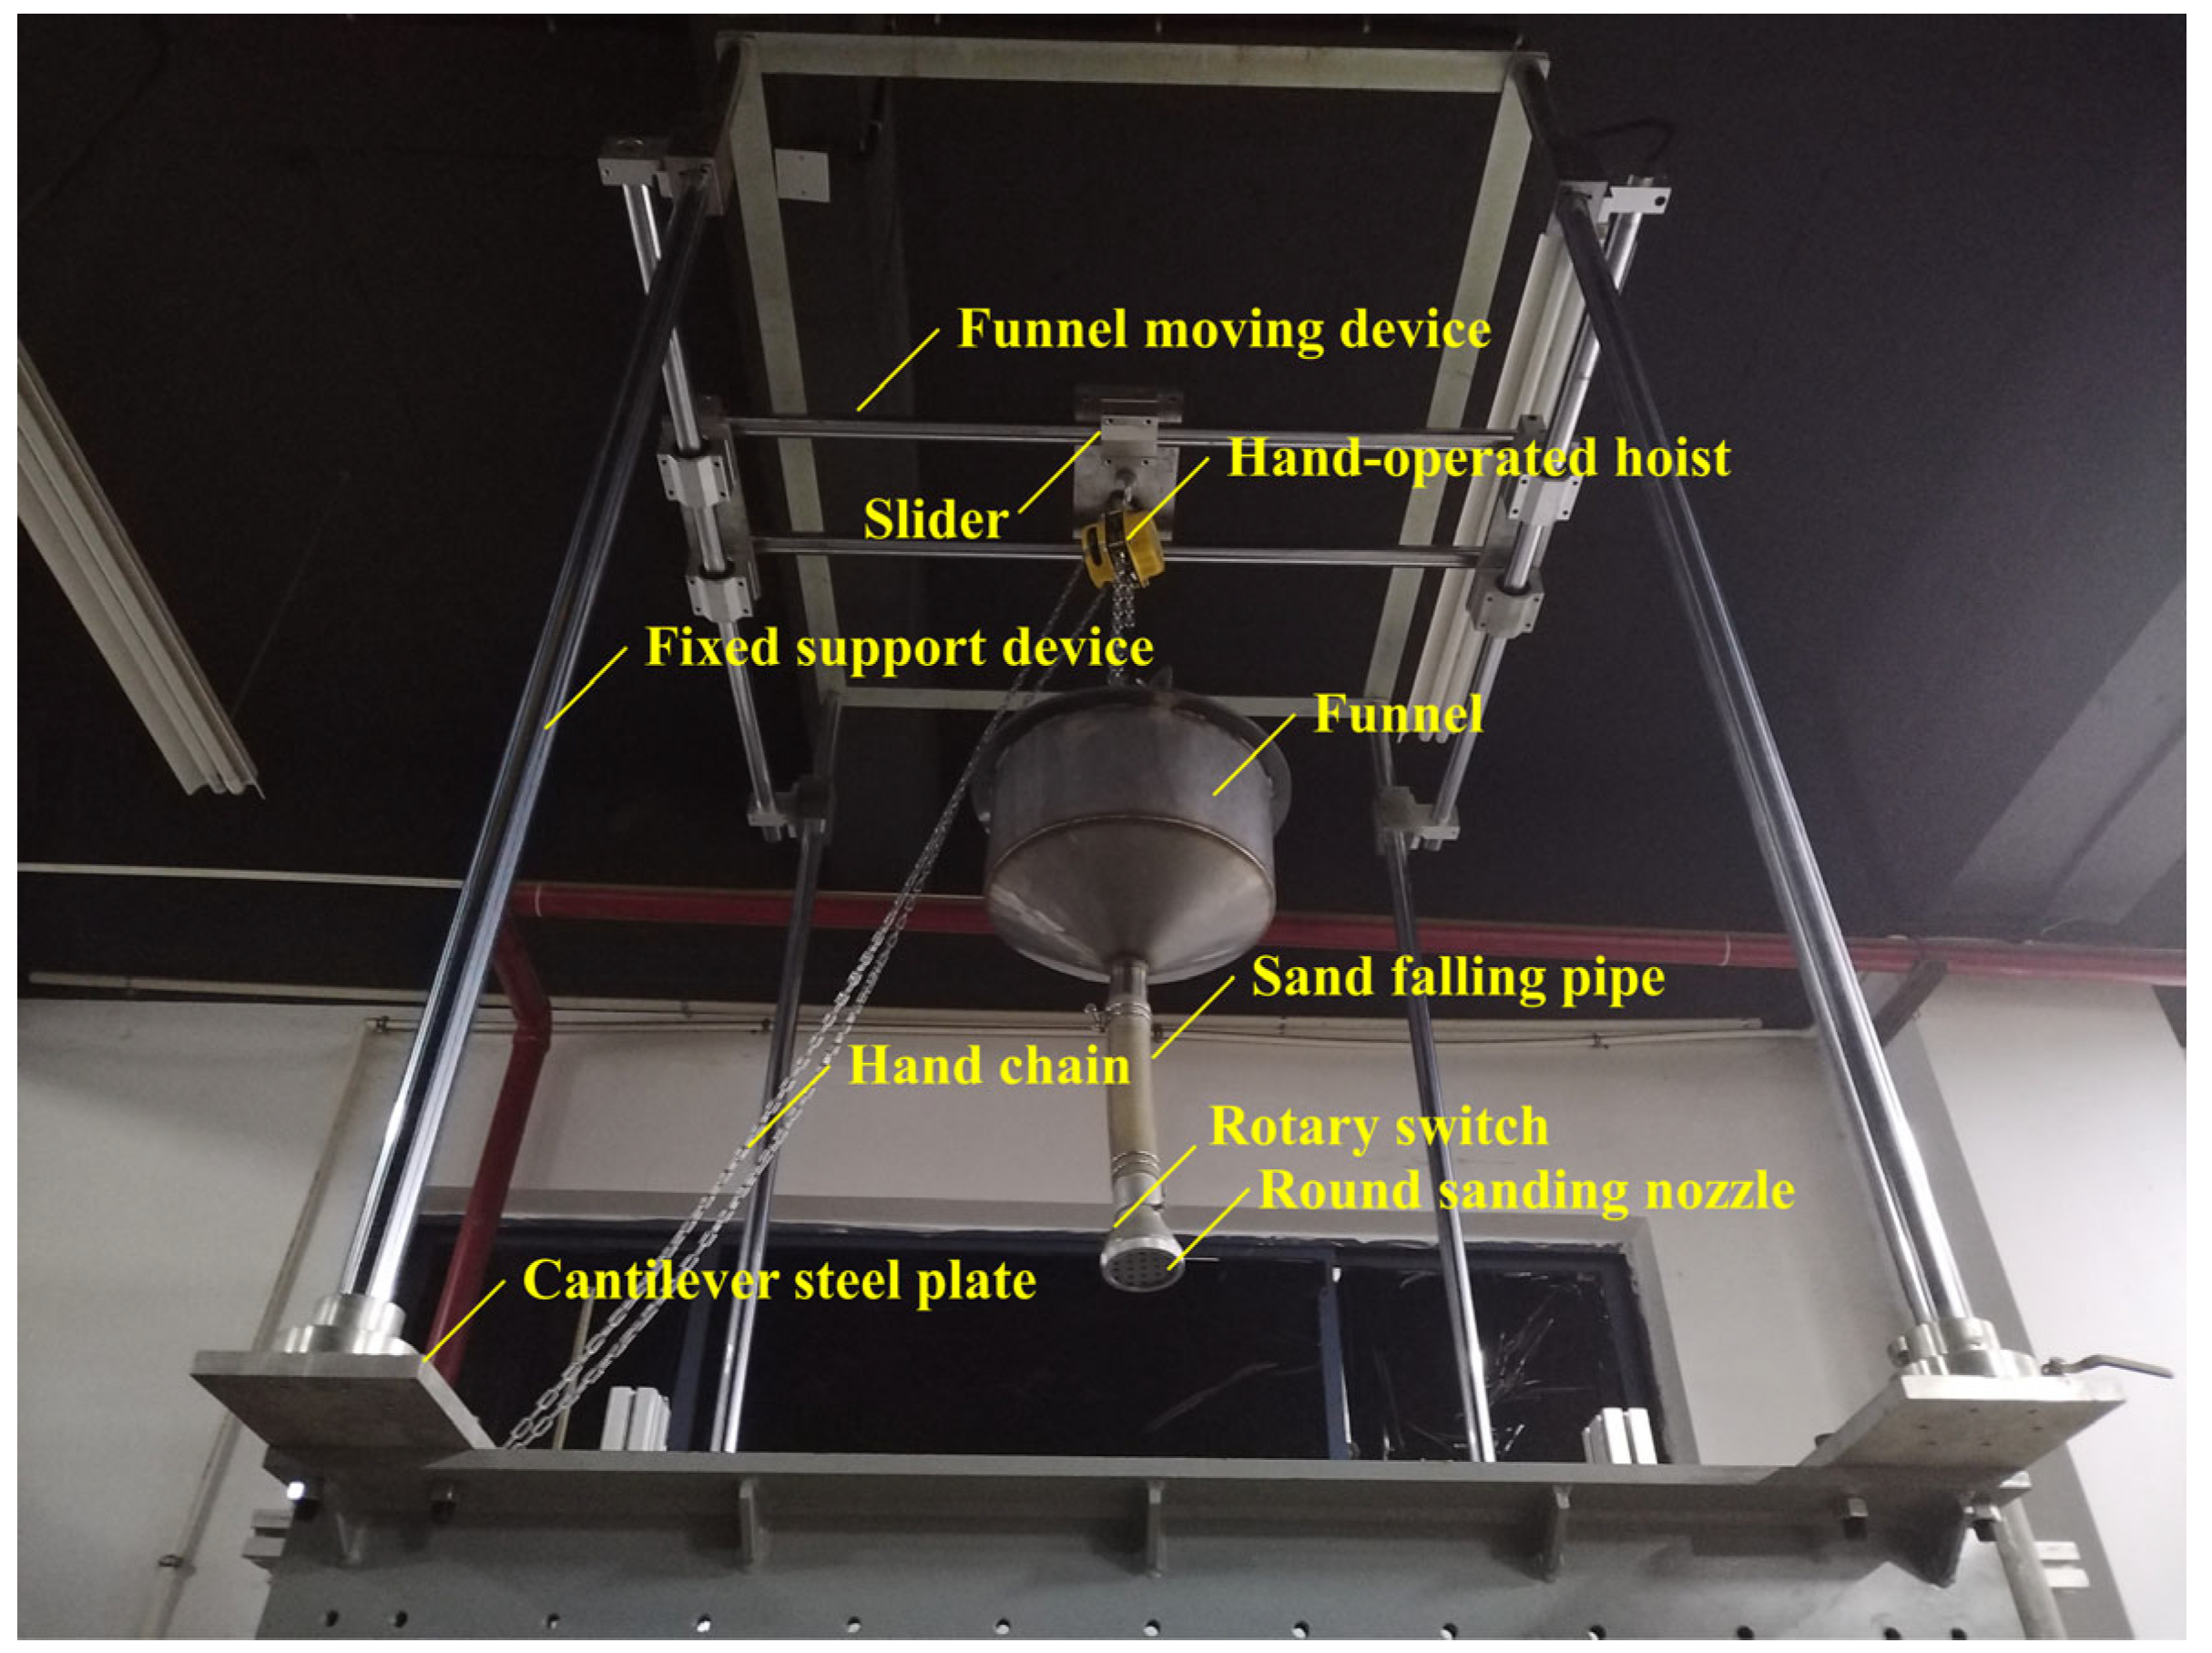
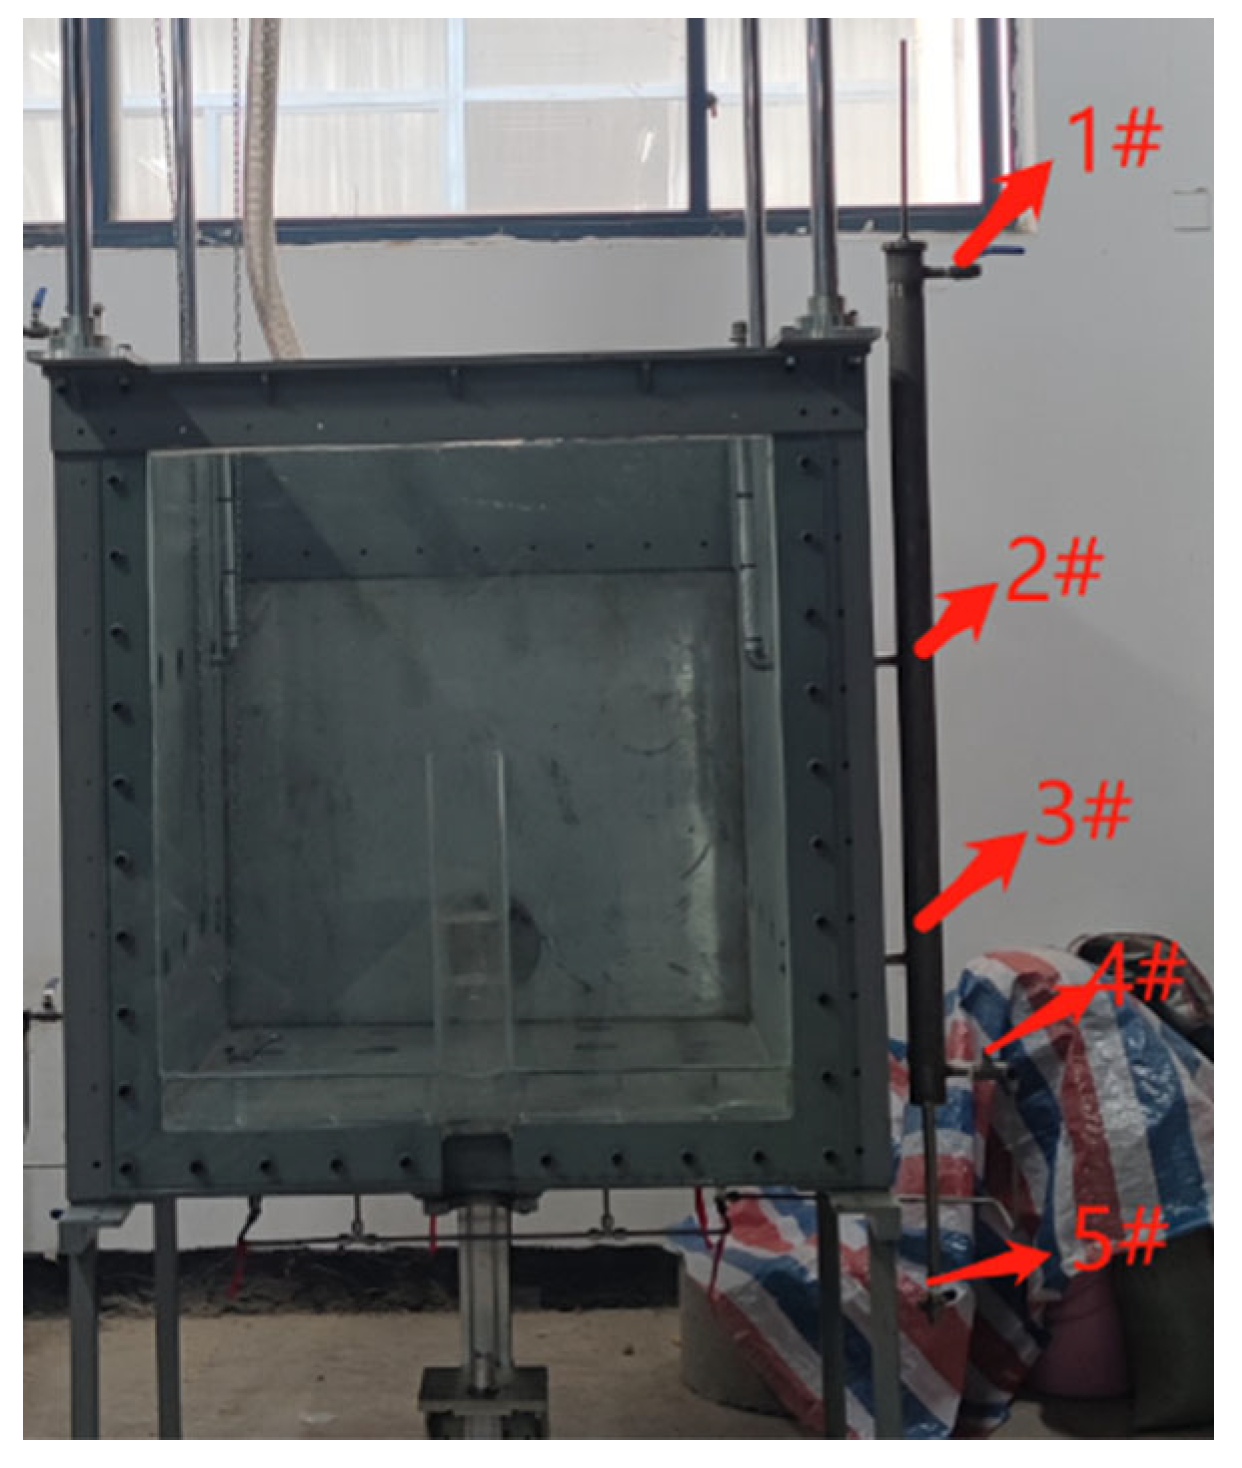
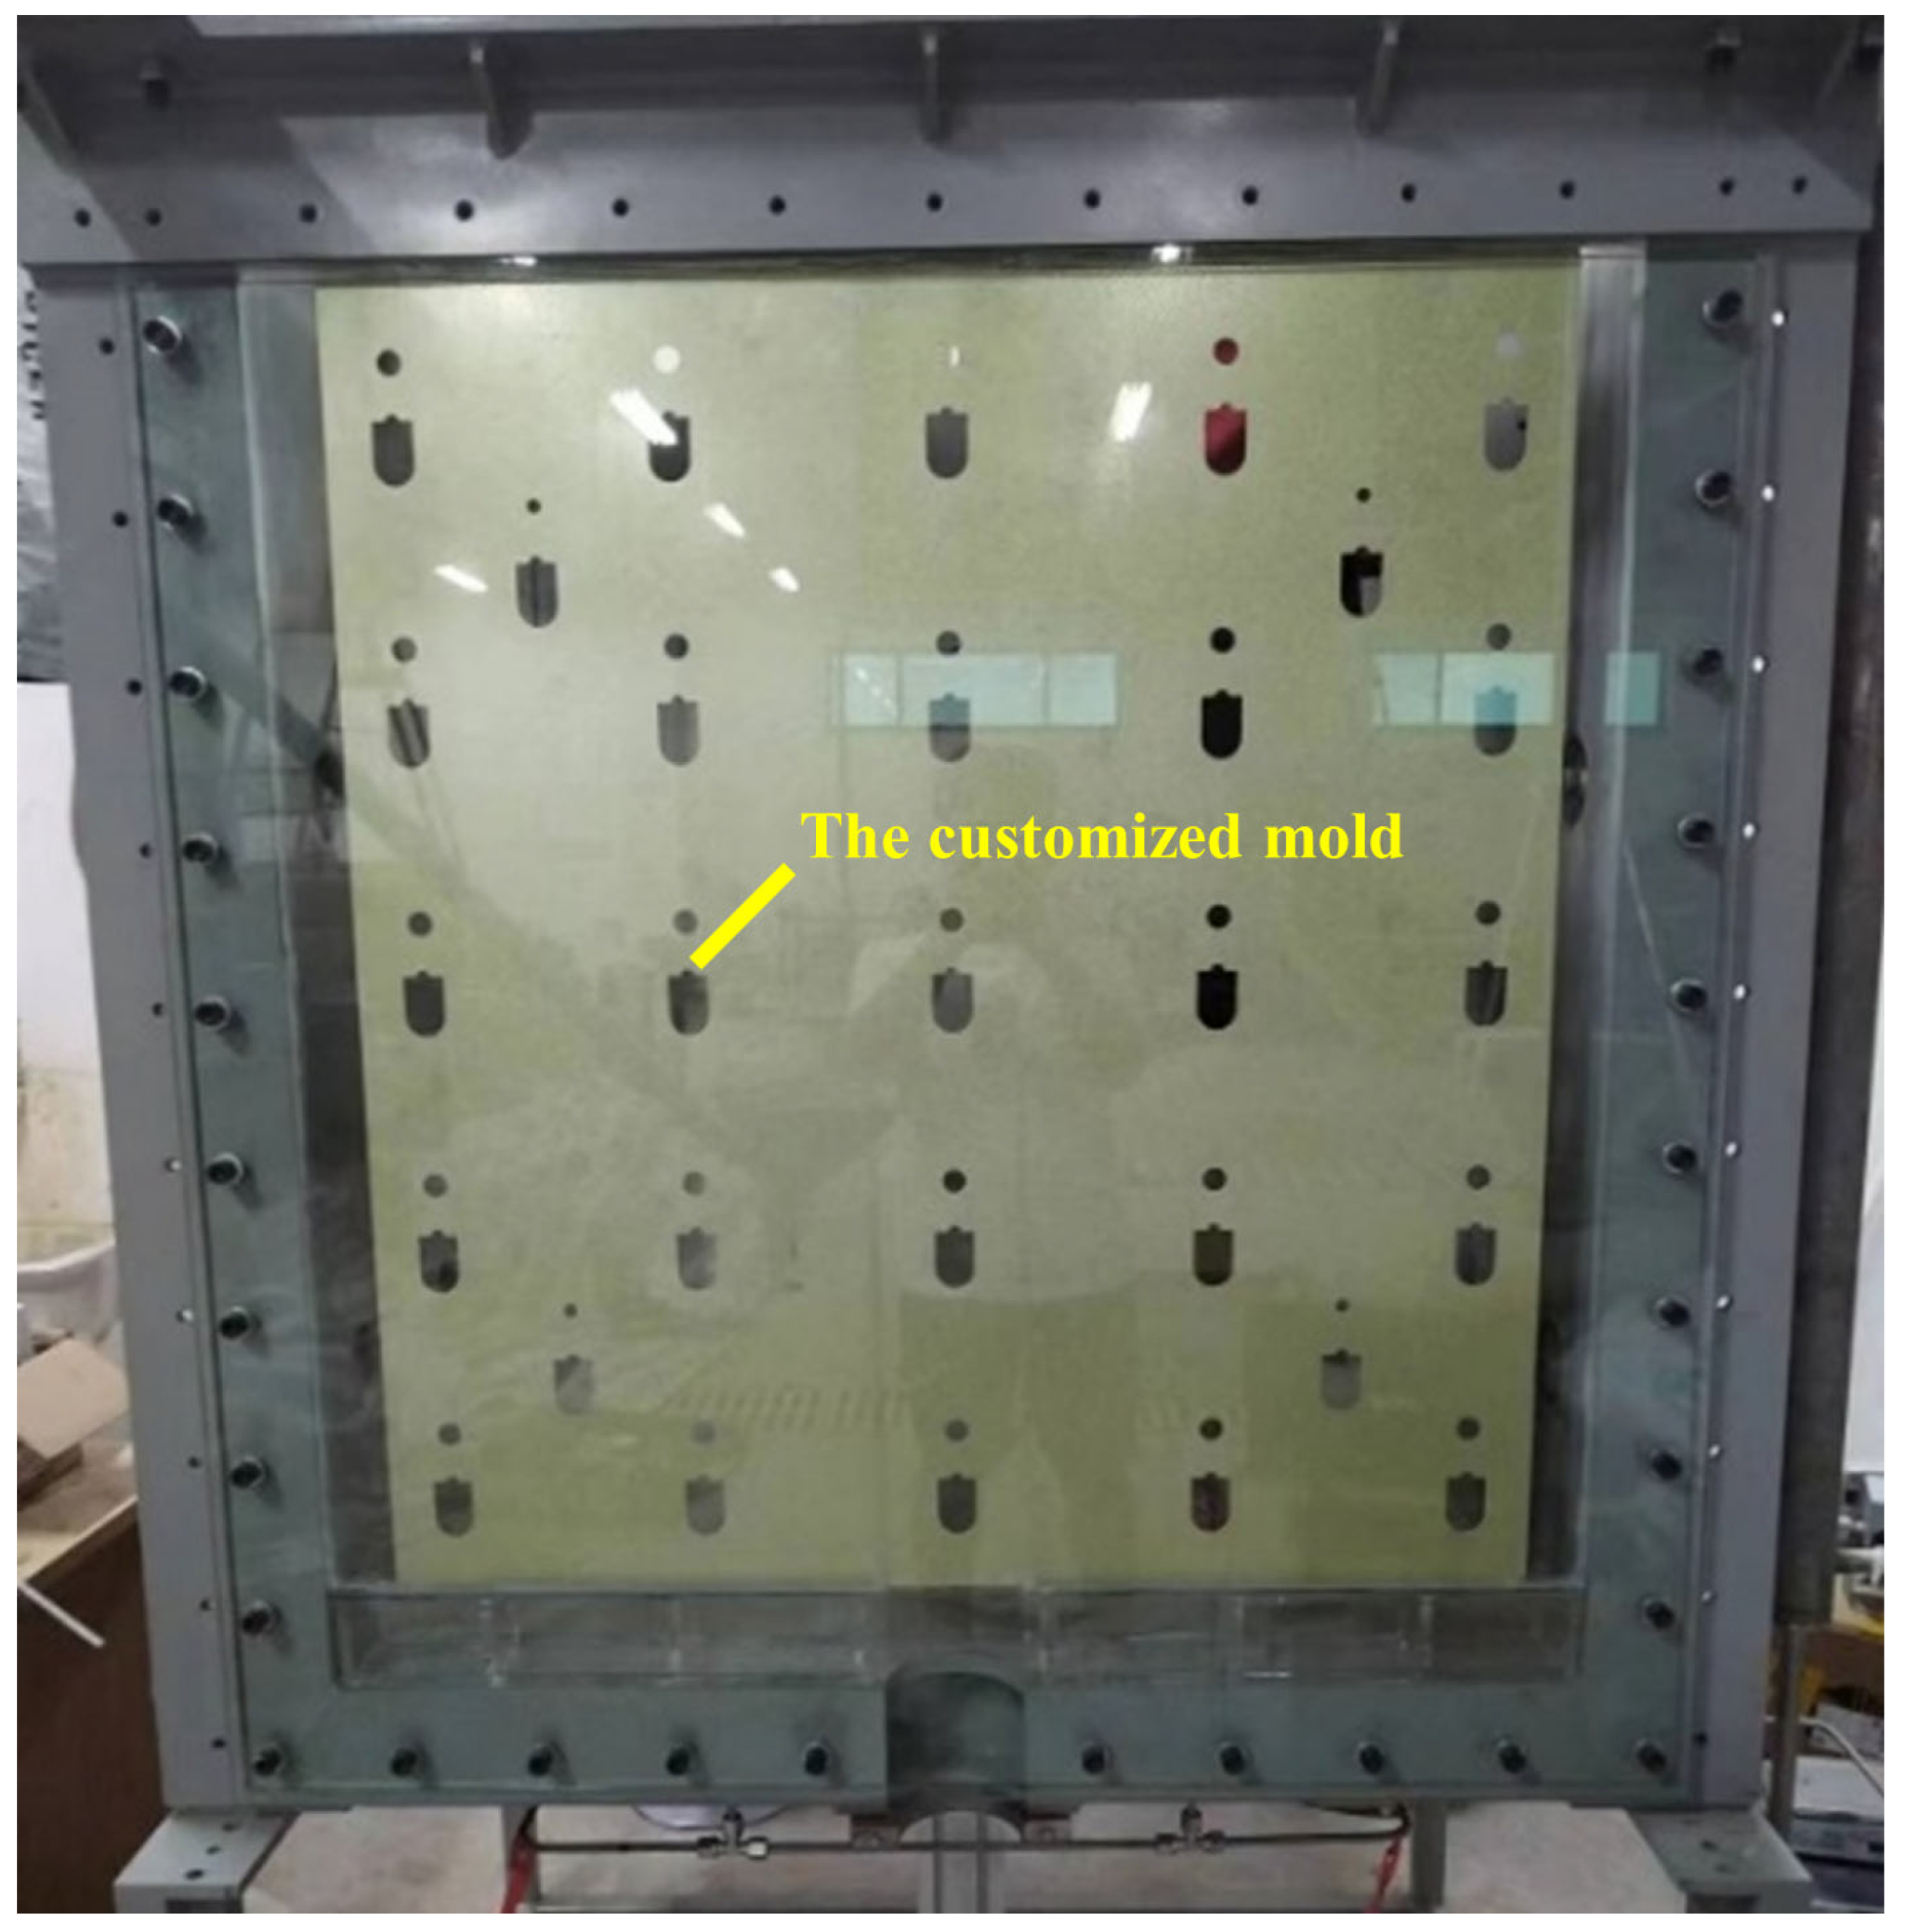
2.2. Configuration of the Model Test Apparatus

The primary configuration of the model test apparatus includes the tunnel structural system, the sand fall control system, the propulsion control system, the data acquisition system, and the water level control system. These components collaborate to facilitate the entire experimental process.
(1) Tunnel Structural System
The tunnel structural system comprises the model box, support frames, horizontal tunnel, and upward tunnel. The model box, measuring 1 m × 1 m × 1.25 m, features a tempered glass observation surface on one side, while the other three sides and the bottom are constructed from steel plates. The tunnel structural system comprises the model box, the support frames, the horizontal tunnel, and the upward tunnel. The model box measures 1 m × 1 m × 1.25 m, with one side composed of tempered glass for observation, while the other three sides and the bottom are constructed from steel plates, and the top is open. Pre-drilled porous holes on the bottom and sides facilitate the water level control system. Bolt holes at the model box’s top corners allow for connection to the sand fall control system. The support frames elevate the model box to ensure ample space below the upward tunnel for accommodating the propulsion control system. The horizontal tunnel is segmented into seven sections using organic glass dividers, with the central section designated as the open segment. A circular opening with a diameter of 0.112 m, slightly larger than the outer diameter of the upward tunnel, which is 0.11 m, is pre-cut at the open segment. Placed snugly against the edge of the model box’s bottom, the horizontal tunnel is affixed and sealed with glass glue to eliminate any gaps. The upward tunnel is then inserted into the opening of the horizontal tunnel model, securely adhering to the observation glass. Any seams at the interface between the upward and horizontal tunnel models are carefully sealed with glass glue.
(2) Sand Fall Control System
During the dry sand experiment, the sand rain method is employed to prepare the soil sample. The sand fall control system comprises two main components: the sand conveyor (Figure 2) and the sand fall device (Figure 3). The sand conveyor is responsible for conveying dry sand to the funnel above the mode box. Positioned at the top of the model box, the sand fall device consists of the fixed support device, the funnel moving device, the funnel, the sand falling pipe, the rotary switch, and the round sanding nozzle. Furthermore, the sand flow from the circular sand nozzle can be controlled via the rotary switch. Pre-drilled holes above the model box facilitate the secure attachment of the sand fall control system to the model box using bolts. This connection integrates the cantilever steel plate with the model box and attaches the fixed support device to the cantilever steel plate. A hand-operated hoist controls the horizontal movement of the funnel via a slider, while the height of the funnel is adjusted by pulling the hand chain clockwise or counterclockwise. The sand falling pipe and sanding nozzle can be replaced according to the requirements of the experiment. A round sanding nozzle is used in Figure 3.
(3) Propulsion Control System
The propulsion control system (depicted in Figure 4) comprises the upward shield model, the linkage device, the motor, and the servo control module (see Figure 5). Several earth pressure sensors and osmometers are embedded in the excavation face of the upward shield model (see Figure 6). Moreover, the axial force sensor is placed below the upward shield model. The wire of the axial force sensor extends downward along with the linkage device, emerging from the joint between the linkage device and the motor. Sensor wires in the excavation face traverse through holes pre-drilled on the bottom sides of the upward shield model and pass through the partition within the upward tunnel, ensuring the integrity of the sensor wires during propulsion. The servo control module consists of an operating console and a control box, facilitating motor control via touchscreen operation to regulate the forward and backward movement of the excavation face. It supports multiple operation modes, enabling manual control through hand rotation or automatic uniform motion by pre-setting endpoints and time intervals. Moreover, it accommodates triangular displacement signals and sinusoidal displacement signals.
(4) Data Acquisition System
The data acquisition system encompasses various components, including sensors, an image acquisition setup, and data acquisition instruments. In addition to the sensors in the excavation face and the axial force sensor, multiple uniaxial and triaxial earth pressure sensors (see Figure 7) are installed in the soil to monitor stress changes during the excavation face instability process.
Additionally, fifteen displacement sensors are arranged on the soil surface to track ground uplift and settlement throughout the excavation face instability phase. These sensors are affixed using a displacement sensor frame, as shown in Figure 8, and their placement is illustrated in Figure 9. The central column of the displacement sensors is aligned with the center of the excavation face.
The data acquisition system consists of three 24-point data loggers and one 16-point data logger, all DH3818Y models. These four loggers transmit data to a computer via a switch, with a sampling frequency of 1 Hz. The image acquisition setup included a Sony camera, a tripod, lighting equipment, a remote shutter timer, and a receiver for the timer, as shown in Figure 10. During the excavation face instability process, photos were taken every 2 s. After the experiment concluded, GeoPIV-RG software was employed to analyze the soil displacement field using PIV technology.
(5) Water Level Control System
The water level control system, as illustrated in Figure 11, comprises five switches: Switch 1 for water supply connection, responsible for linking to the water source; Switches 2, 3, and 4 for water inflow, along with Switch 5 for water outflow, collectively regulating the eight water inlet ports at the bottom of the model box to precisely control the water level inside.

3. Application of the Model Test for Excavation Face Stability in the USM

A model test of passive instability of excavation faces under dry sand conditions at C/D = 6 was conducted to illustrate the application of the mode test apparatus (where C represents the depth of the soil above the vertical tunnel and D represents the inner diameter of the upward tunnel; in this experiment, C = 0.6 m, D = 0.1 m).

3.1. Materials and Methods

3.1.1. Soil Parameters

Prior to the experiment, it was essential to determine the basic geological parameters of the dry sand (see Table 3).

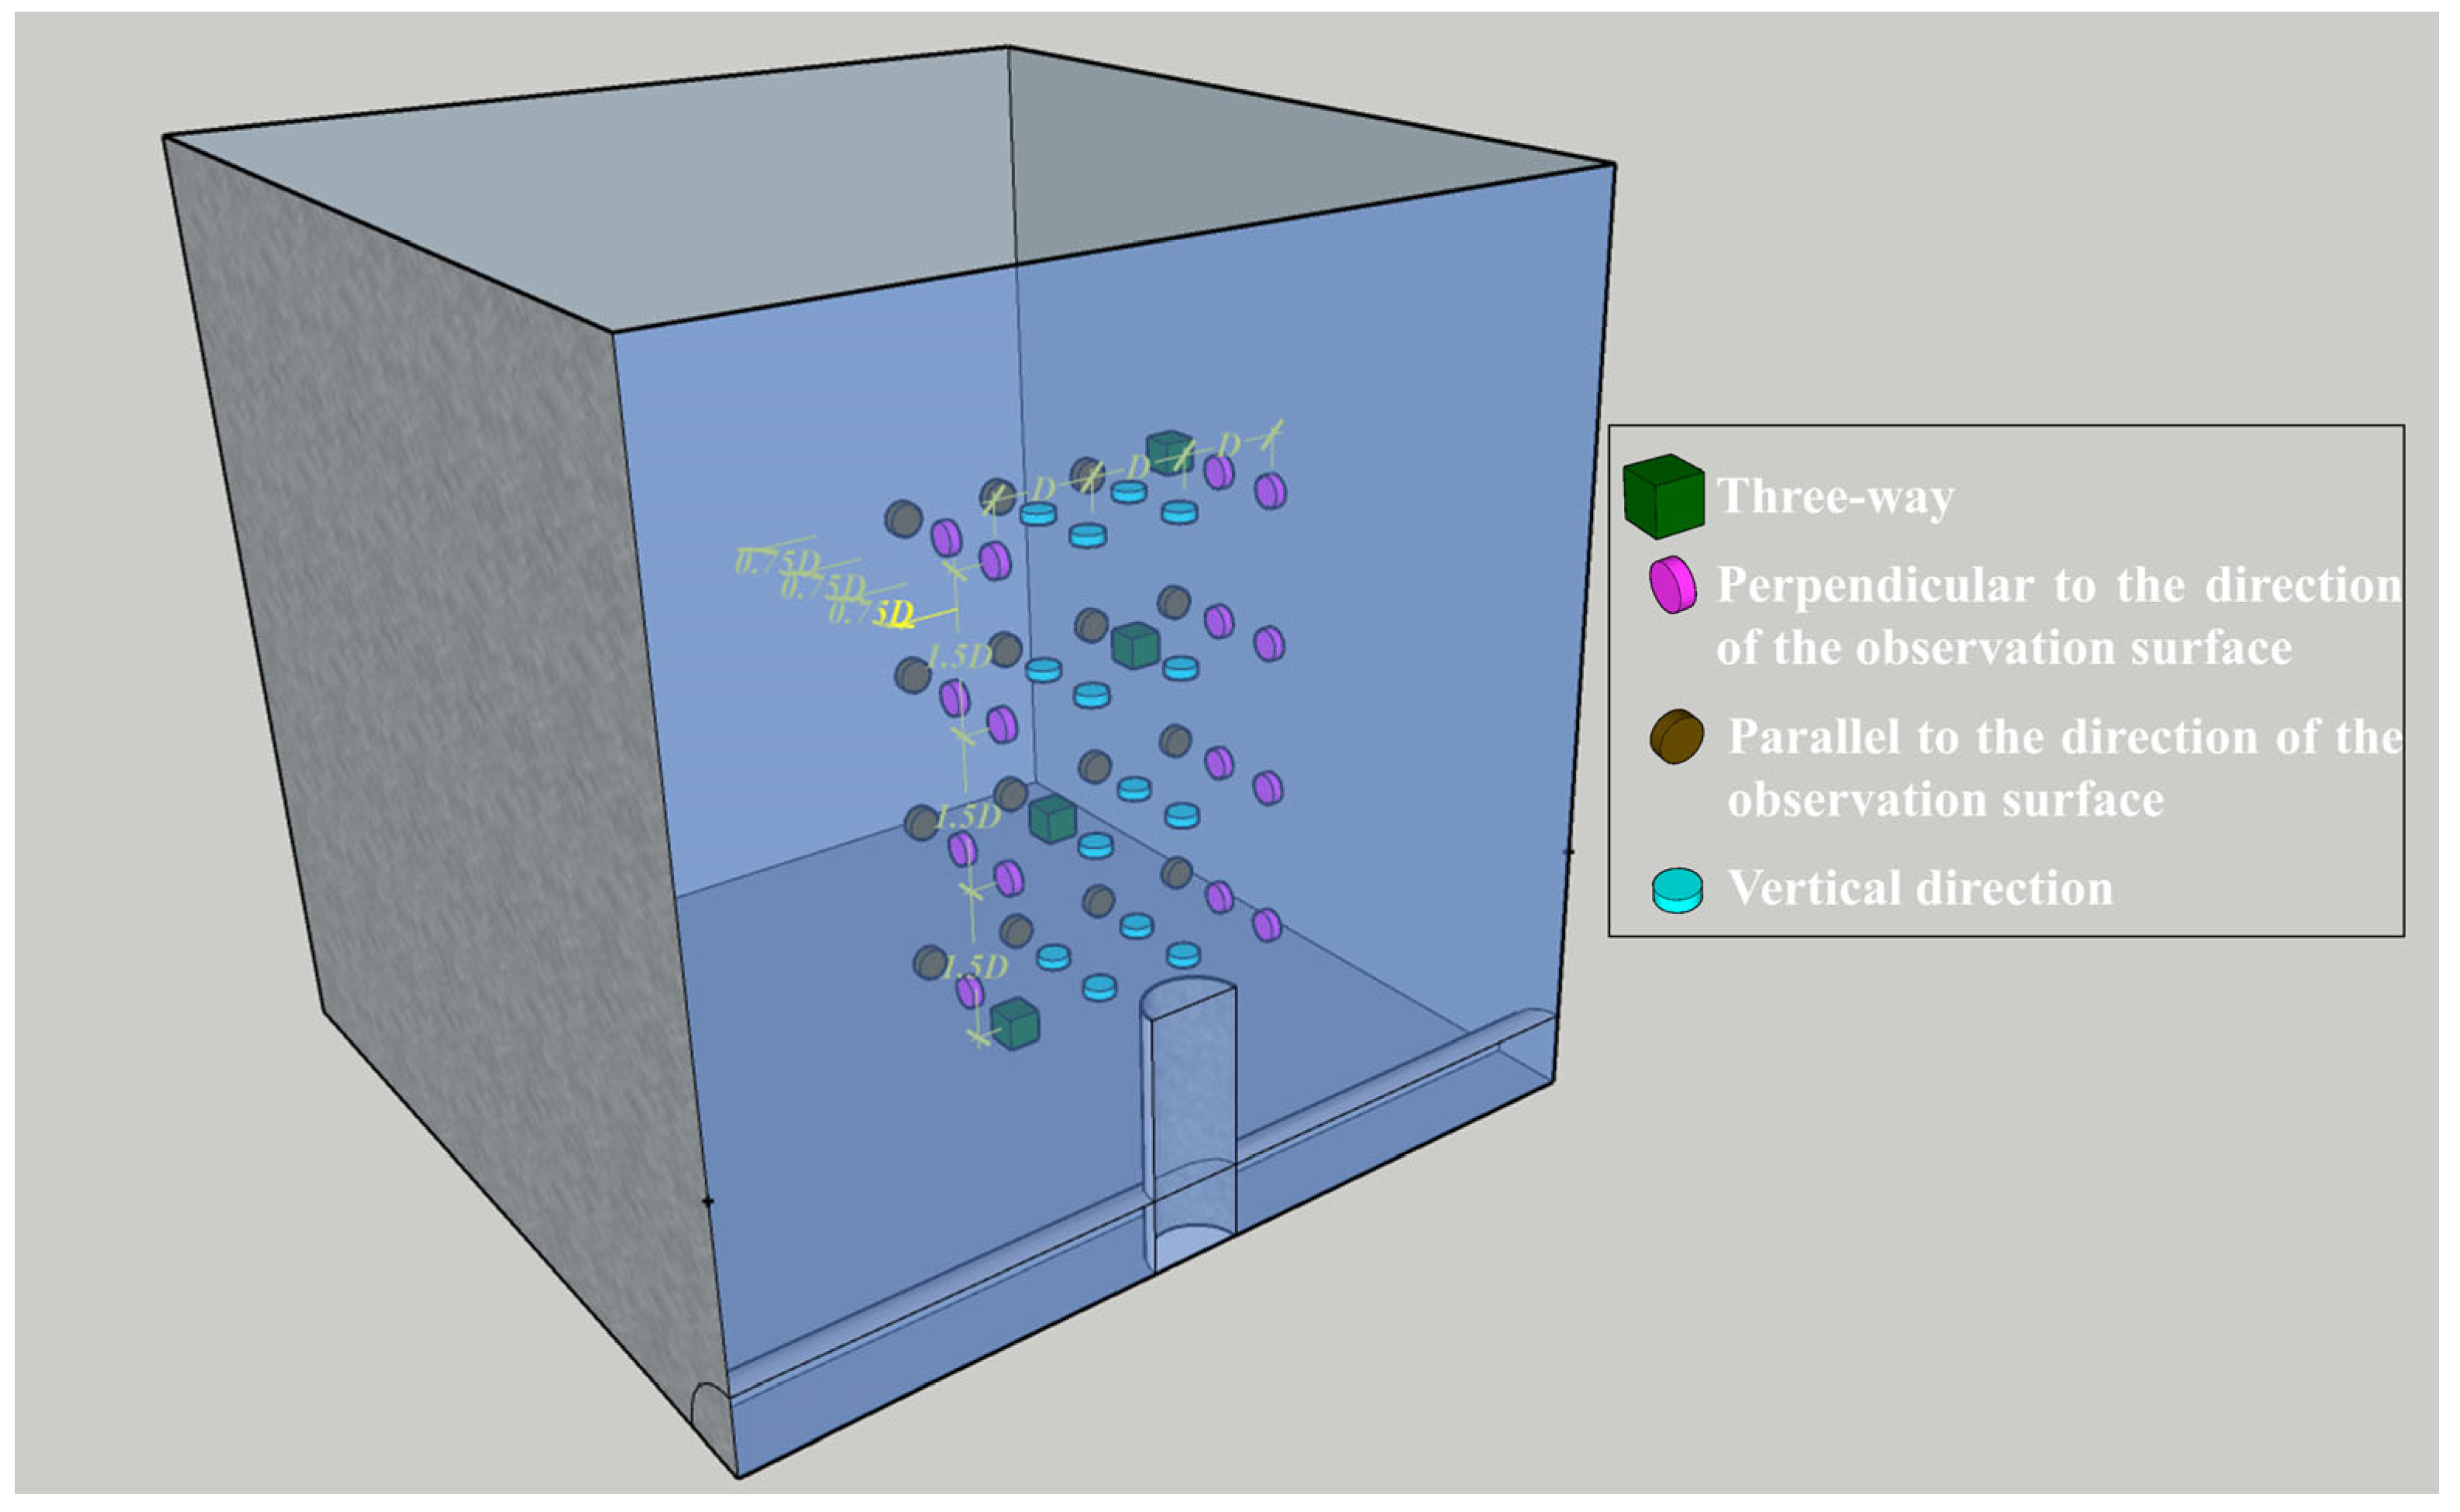
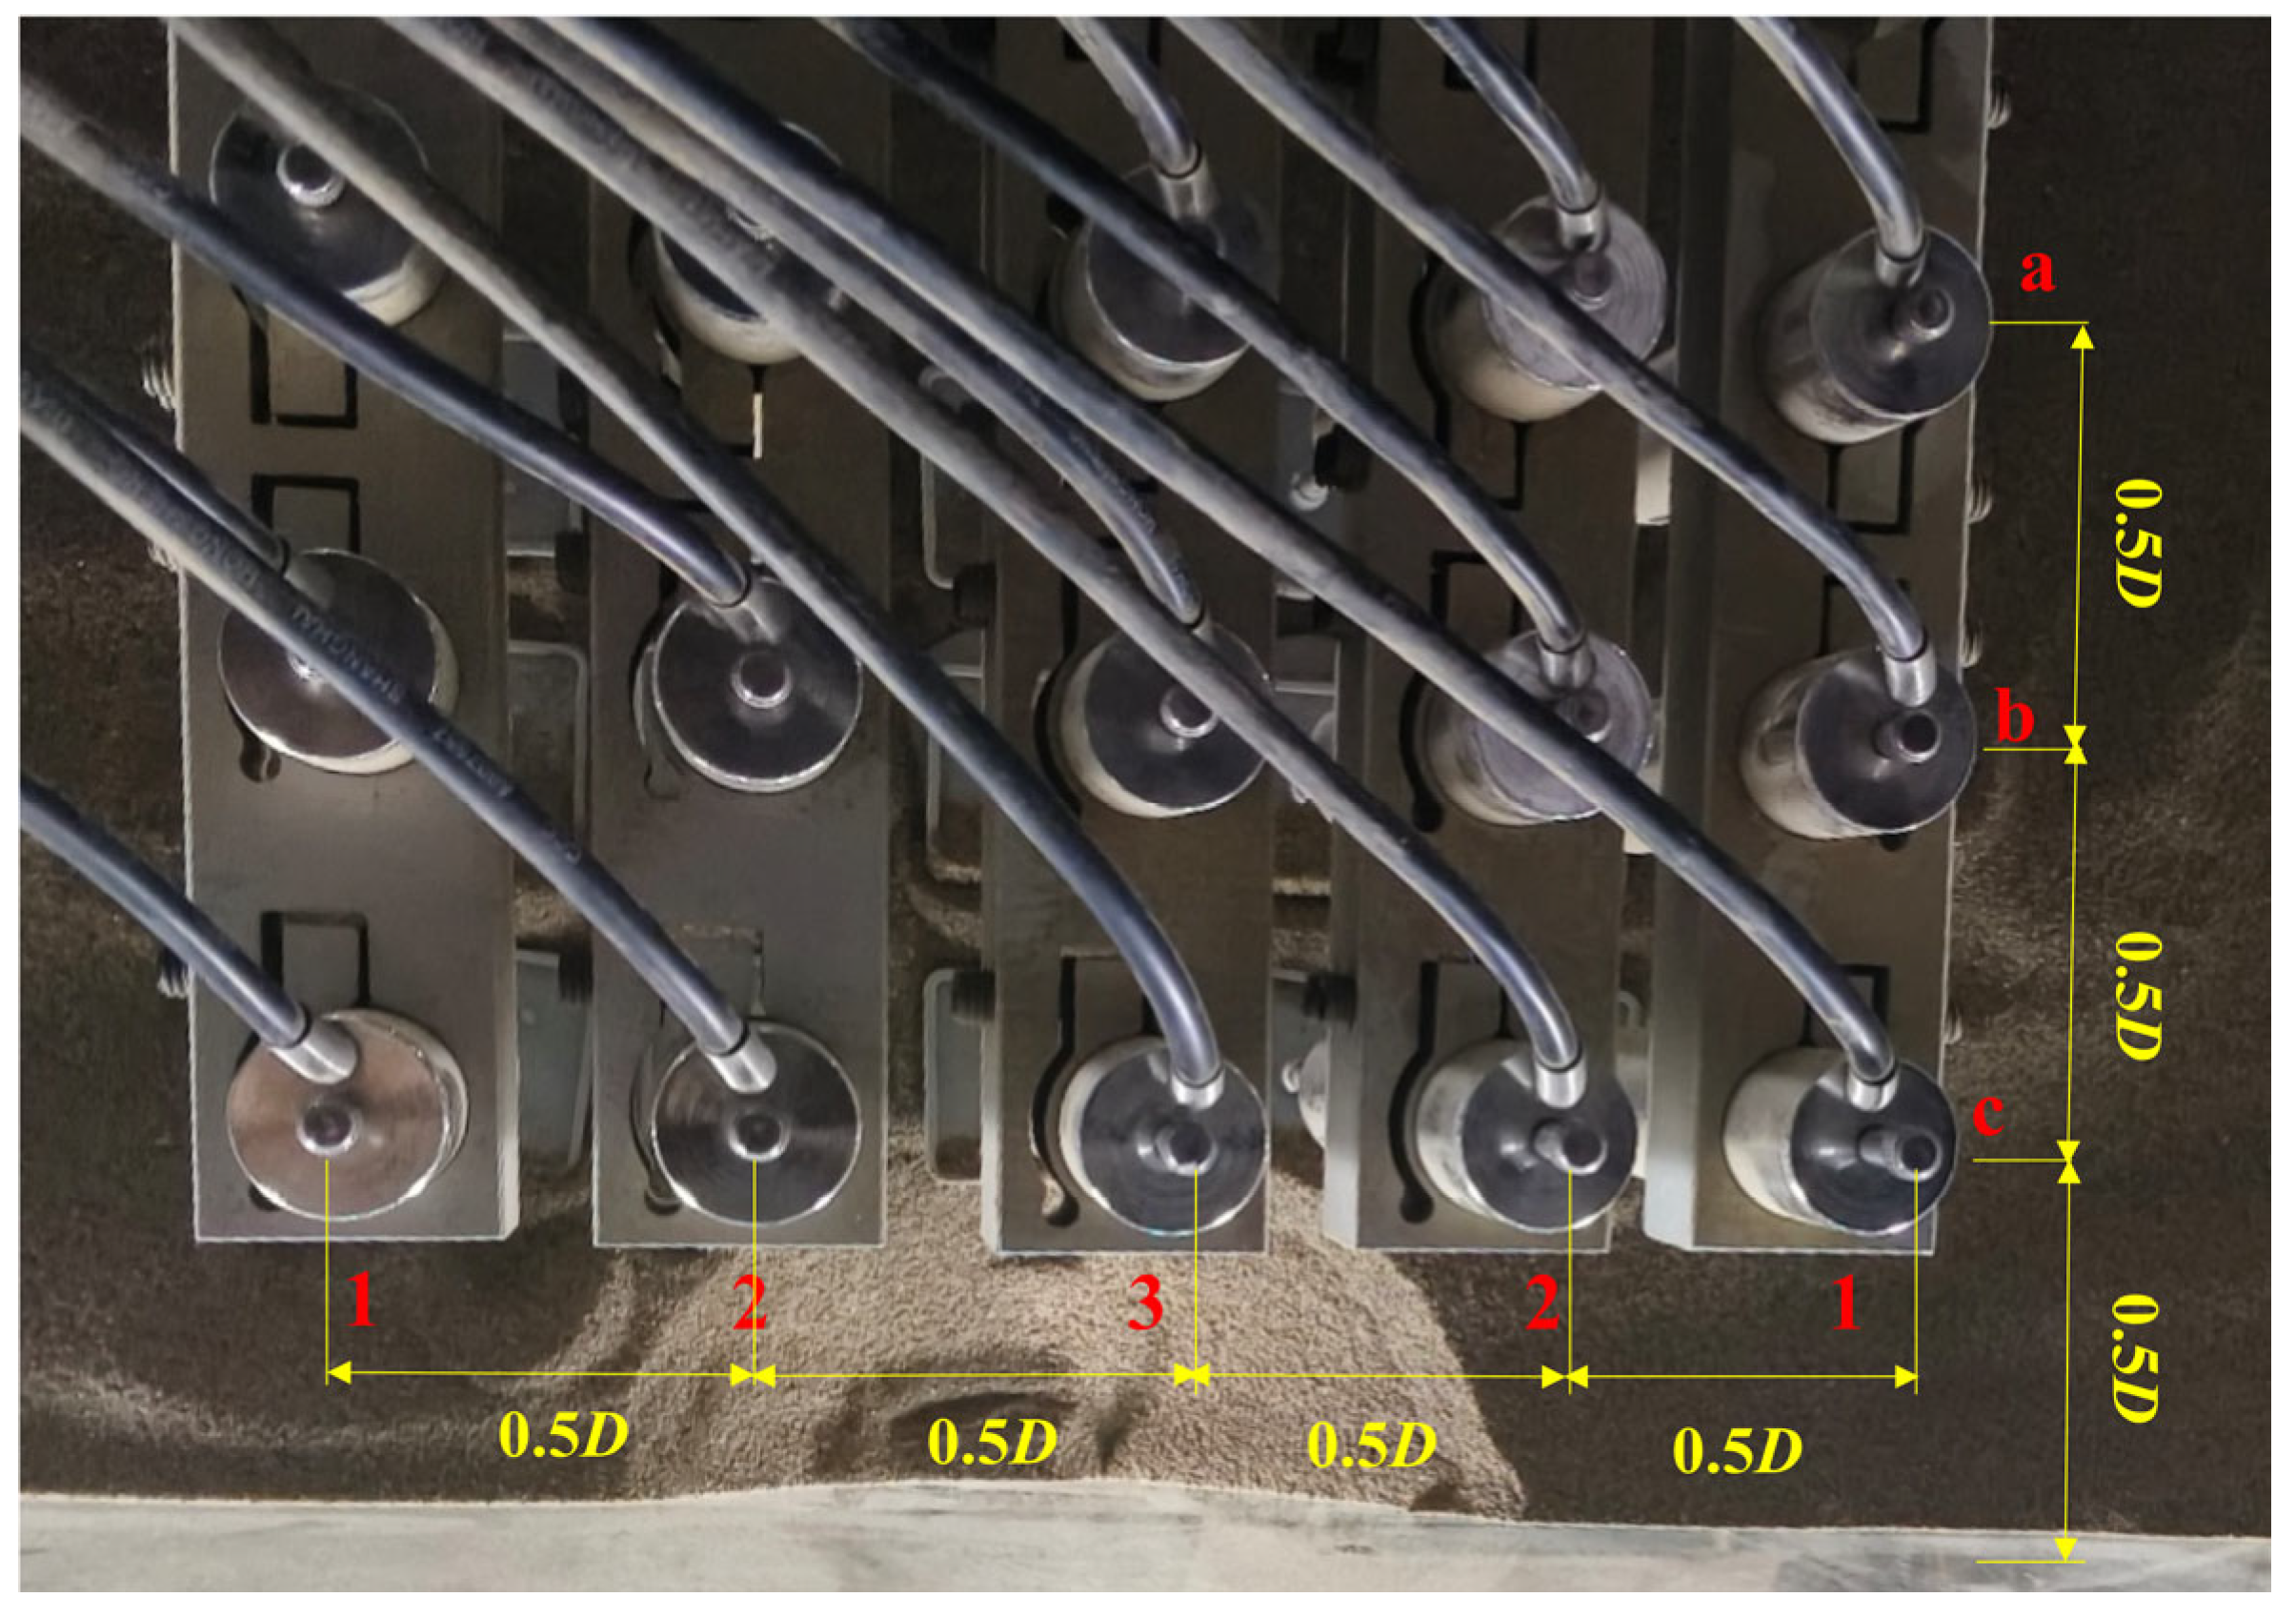
3.1.2. Preparing for PIV

PIV captures images of particles in the flow field and analyzes the images taken at different times to determine particle velocities. This technique is employed to quantify the displacement field of the soil before and after the instability of the excavation face. In this experiment, GeoPIV-RG software (www.geopivrg.com (accessed on 12 August 2024)) was specifically utilized to analyze the images, enabling the derivation of soil displacement fields for cross-referencing with changes in soil stress.
In the PIV application process, a certain number of control points are required to quantify the displacement of soil particles accurately. As shown in Figure 12, for this experiment, control points with a diameter of 18 mm were pre-arranged using a customized mold. After affixing the control points, a circle of white paint was sprayed around them to enhance contrast. Due to potential manufacturing errors in the mold and possible human errors during affixation, laser-printed dots with a diameter of 6 mm were first printed on white paper, as illustrated in Figure 13. These printed dots, referred to as reference points, were then closely adhered to the inner wall of the observation surface. The initial calibration was performed using the reference points to eliminate poor-quality reference points, followed by the calibration of control points using the remaining high-quality reference points. This procedure aimed to ensure the precise coordinates of the control points, thereby obtaining a more accurate displacement field.
Note that due to the upward tunnel model would obstruct the mold when affixing control points, the upward tunnel model should be fixed to the glass-made observation surface after the aforementioned procedures, while the horizontal tunnel model can be fixed to the glass-made observation surface beforehand. Once the upward tunnel model is fixed, allow for it to rest for 24 h until the glass glue solidifies.

3.1.3. Support Force Noise Removal

Referring to the face stability model test of the horizontal shield tunnel, the displacement of the excavation face was set to 60 mm upwards or downwards at a speed of 1 mm/min (see Table 4).
In this experiment, the support force of the excavation face was measured by axial force sensors, but it is evident that the readings of the axial force sensors do not correspond to the support force directly. When there is no sand in the model box, the upward shield model is jacked out of the upward tunnel model, and the axial force sensor is reset to zero. Assuming that the linkage device and the entire apparatus are vertical, the axial force sensor will only experience the pressure due to the gravity of the upward shield model and the supporting force from the lower linkage device. Resetting to zero at this stage aims to eliminate the self-weight of the upward shield model. When the excavation face moves, the reading of the axial force sensor represents the resultant force of the support force and the frictional force. Therefore, it is necessary to calibrate the frictional force between the excavation face and the upward tunnel.
During calibration, the axial force sensors were zeroed when the excavation face was fully extended out of the upward tunnel model, and then the top of the excavation face was lowered to align with the top of the upward tunnel, followed by a 12 h static rest period. Subsequently, the excavation face was moved upwards or downwards at a speed of 1 mm/min for 60 mm. During this period, the reading of the axial force sensors represents the frictional force, which is subtracted from the subsequent readings of the axial force sensors in the experiment to eliminate the noise caused by the frictional force.

3.1.4. Sand Rain Method Calibration

The sand rain method can approximate the natural accumulation and deposition process of sand particles, and the obtained soil mechanics characteristics are relatively similar to those of natural foundations. In this experiment, achieving the required relative compaction is necessary, and factors such as the drop height, the horizontal movement speed, and the aperture all affect the density of the prepared soil. Among them, the aperture does not change under the condition of not altering the sand nozzle. By employing the method of controlling variables, maintaining a certain horizontal movement speed can establish the relationship between drop height and relative compaction. Thus, the drop distance required for the experiment can be set during the testing process.
The specific procedure for obtaining density under a certain test condition is as follows:
  • Prepare nine calibration boxes and weigh them.
  • Place the calibration boxes evenly in different positions within the model box.
  • Maintain the same horizontal movement speed and conduct sand-making using the sand rain method at a specific drop height.
  • After completing the sand-making process, carefully remove the calibration boxes and weigh them to reduce disturbance.
  • Calculate the density and take the average. Then, based on the previously measured maximum dry density and minimum dry density, the relative compaction is calculated.
When using the sand rain method for sand preparation, it is important to maintain a consistent path for the sanding nozzle, as this can also impact soil density. Furthermore, employing automated equipment to control horizontal movement speeds ensures more accurate soil preparation.
In this experiment, the drop height is set to be 0.8 m, and the relative compaction of soil is 0.497 ± 0.050 (95% CI). This means that the relative error in the prepared soil samples was controlled within 10%, implying that the initial soil pressure error was also controlled within 10%.

3.1.5. Tests Procedure

Using dry sand as an example, the experimental procedure can be outlined in three stages: preparation, execution, and post-processing (see Figure 14).
The experimental preparation phase includes the determination of soil parameters, calibration of various sensors (earth pressure sensors, displacement sensors, and axial force sensor), calibration of the sand rain method, and preparations for PIV.
The specific operational procedures of the experimental execution phase are as follows:
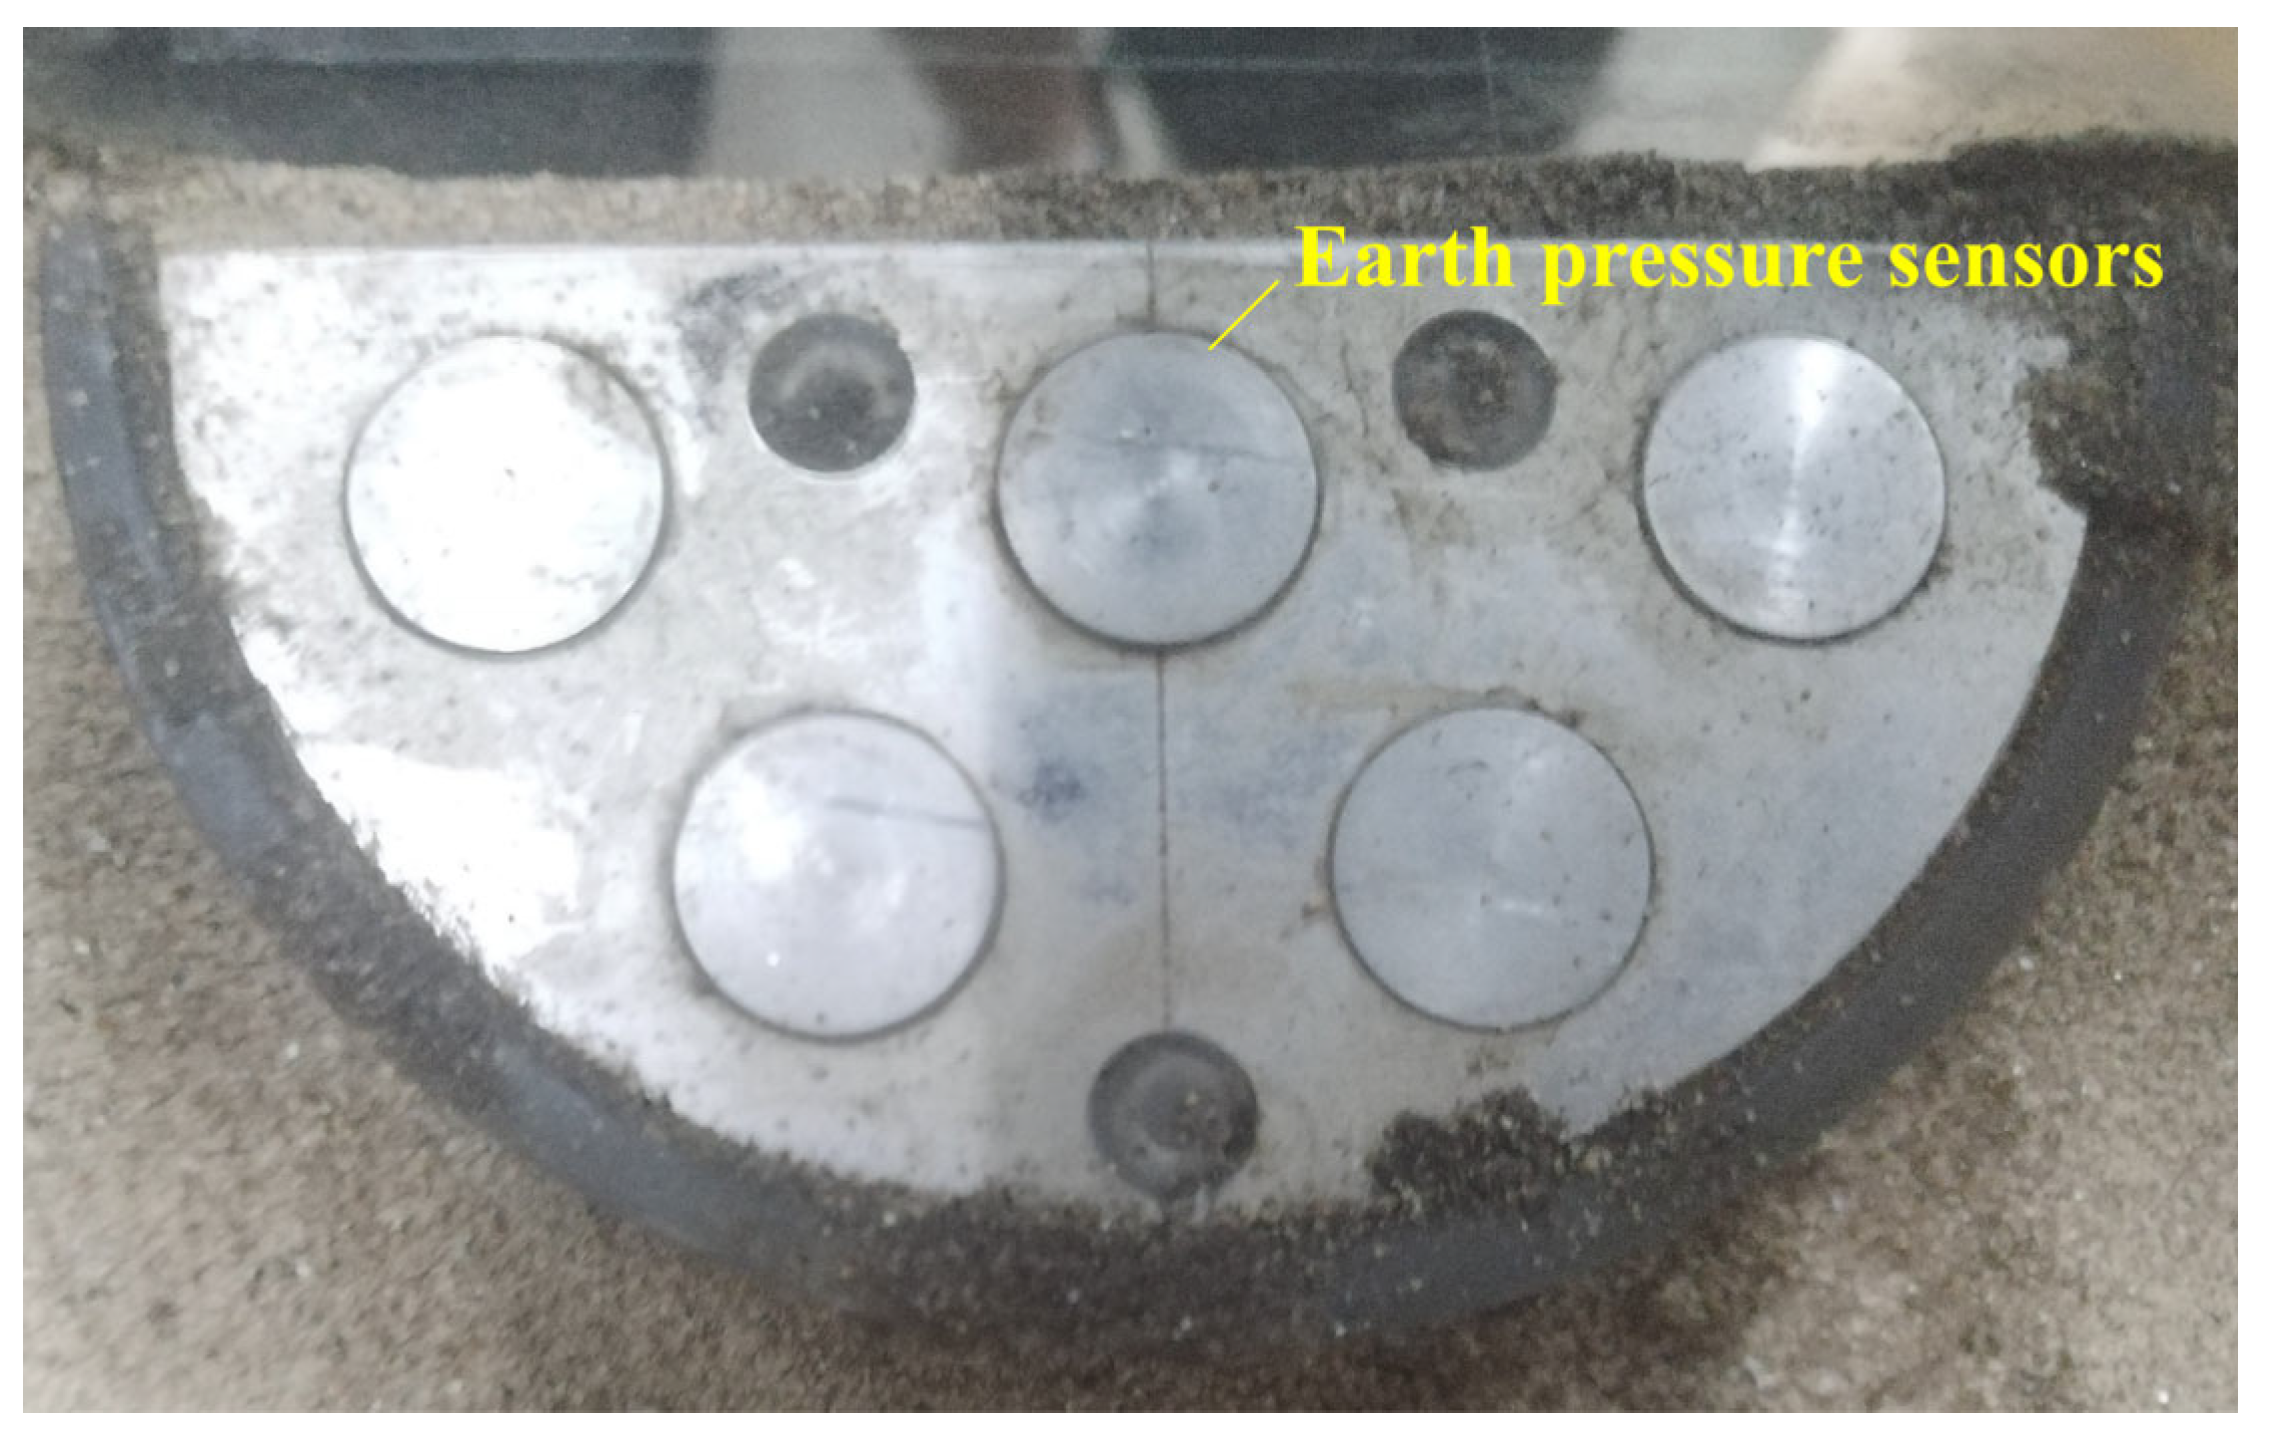
  • The data acquisition system is connected to the computer to ensure that the initial readings of the axial force sensor and earth pressure sensors in the excavation face are zeroed.
  • Use the sand conveyor to transport dry sand to the funnel, keeping the rotary switch in the closed position during this process.
  • The height of the round sanding nozzle is adjusted to 0.8 m above the soil surface. Then, the rotary switch is opened to allow for the sand in the funnel to fall evenly into the model box.
  • Repeat steps (2) and (3) until the soil height in the model box is suitable for placing the earth pressure sensors within the soil, then zero the corresponding layer’s earth pressure sensors and embed them in the predetermined positions.
  • Repeat steps (2) to (4) until all earth pressure sensors and overlying soil layers are in place. Then the displacement sensors are placed in position on the soil surface.
  • The image acquisition device is placed in position and adjusted to ensure its function.
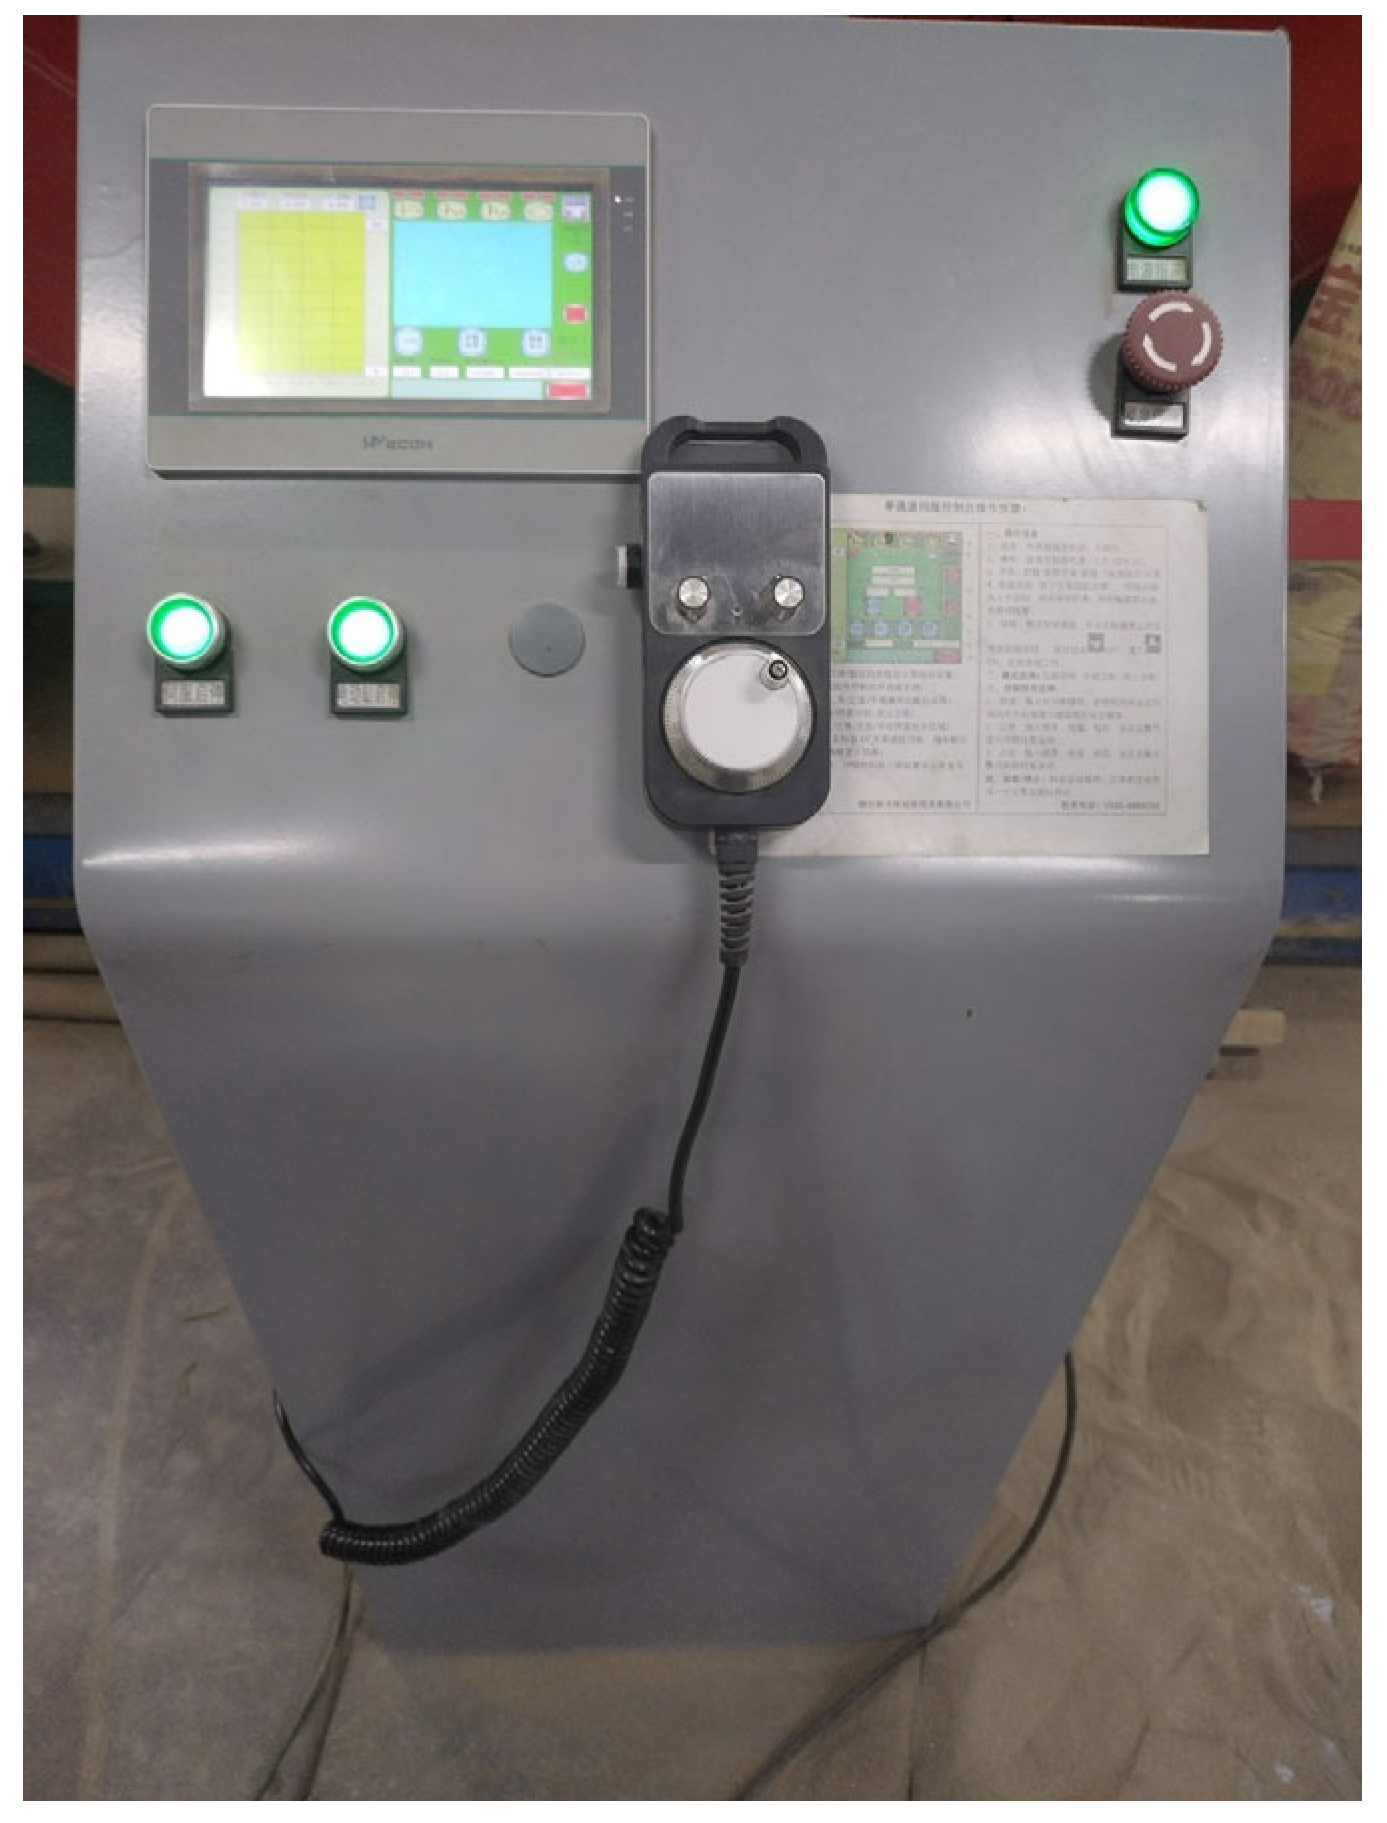
  • The propulsion control system is applied to raise or back the excavation face by 60 mm at a velocity of 1 mm/min.
The post-processing phase includes the following steps:
  • Data from the sensors are saved and recorded by the data acquisition instrument, and the photos taken by the camera are transferred to the computer.
  • The soil from the model box is removed, and the displacement sensor frame and the earth pressure sensors embedded in the soil are retrieved.
  • All collected data are processed and analyzed.
A noteworthy point is that calibrating earth pressure sensors using sand identical to the experimental conditions provides more accurate results compared to using liquids (water or oil). To prevent sand from entering gaps between the upward shield tunnel model and the upward shield model, adhesive felt strips on the upper shield model are effective in preventing the ingress of sand particles that cause uncontrollable friction.

3.2. Results and Discussion

All sensors connected to data acquisition instruments had the highest measurement accuracy of 1 με. The highest measurement accuracy of uniaxial earth pressure sensors was 0.116 ± 0.008 kPa (95% CI), and for triaxial earth pressure sensors, it was 0.112 ± 0.006 kPa (95% CI). For earth pressure, the relative error was controlled within 4%. The displacement sensors had the highest measurement accuracy of 0.00803 ± 0.00011 mm with a 95% CI. The axial force sensor had the highest measurement accuracy of 2.72 N.

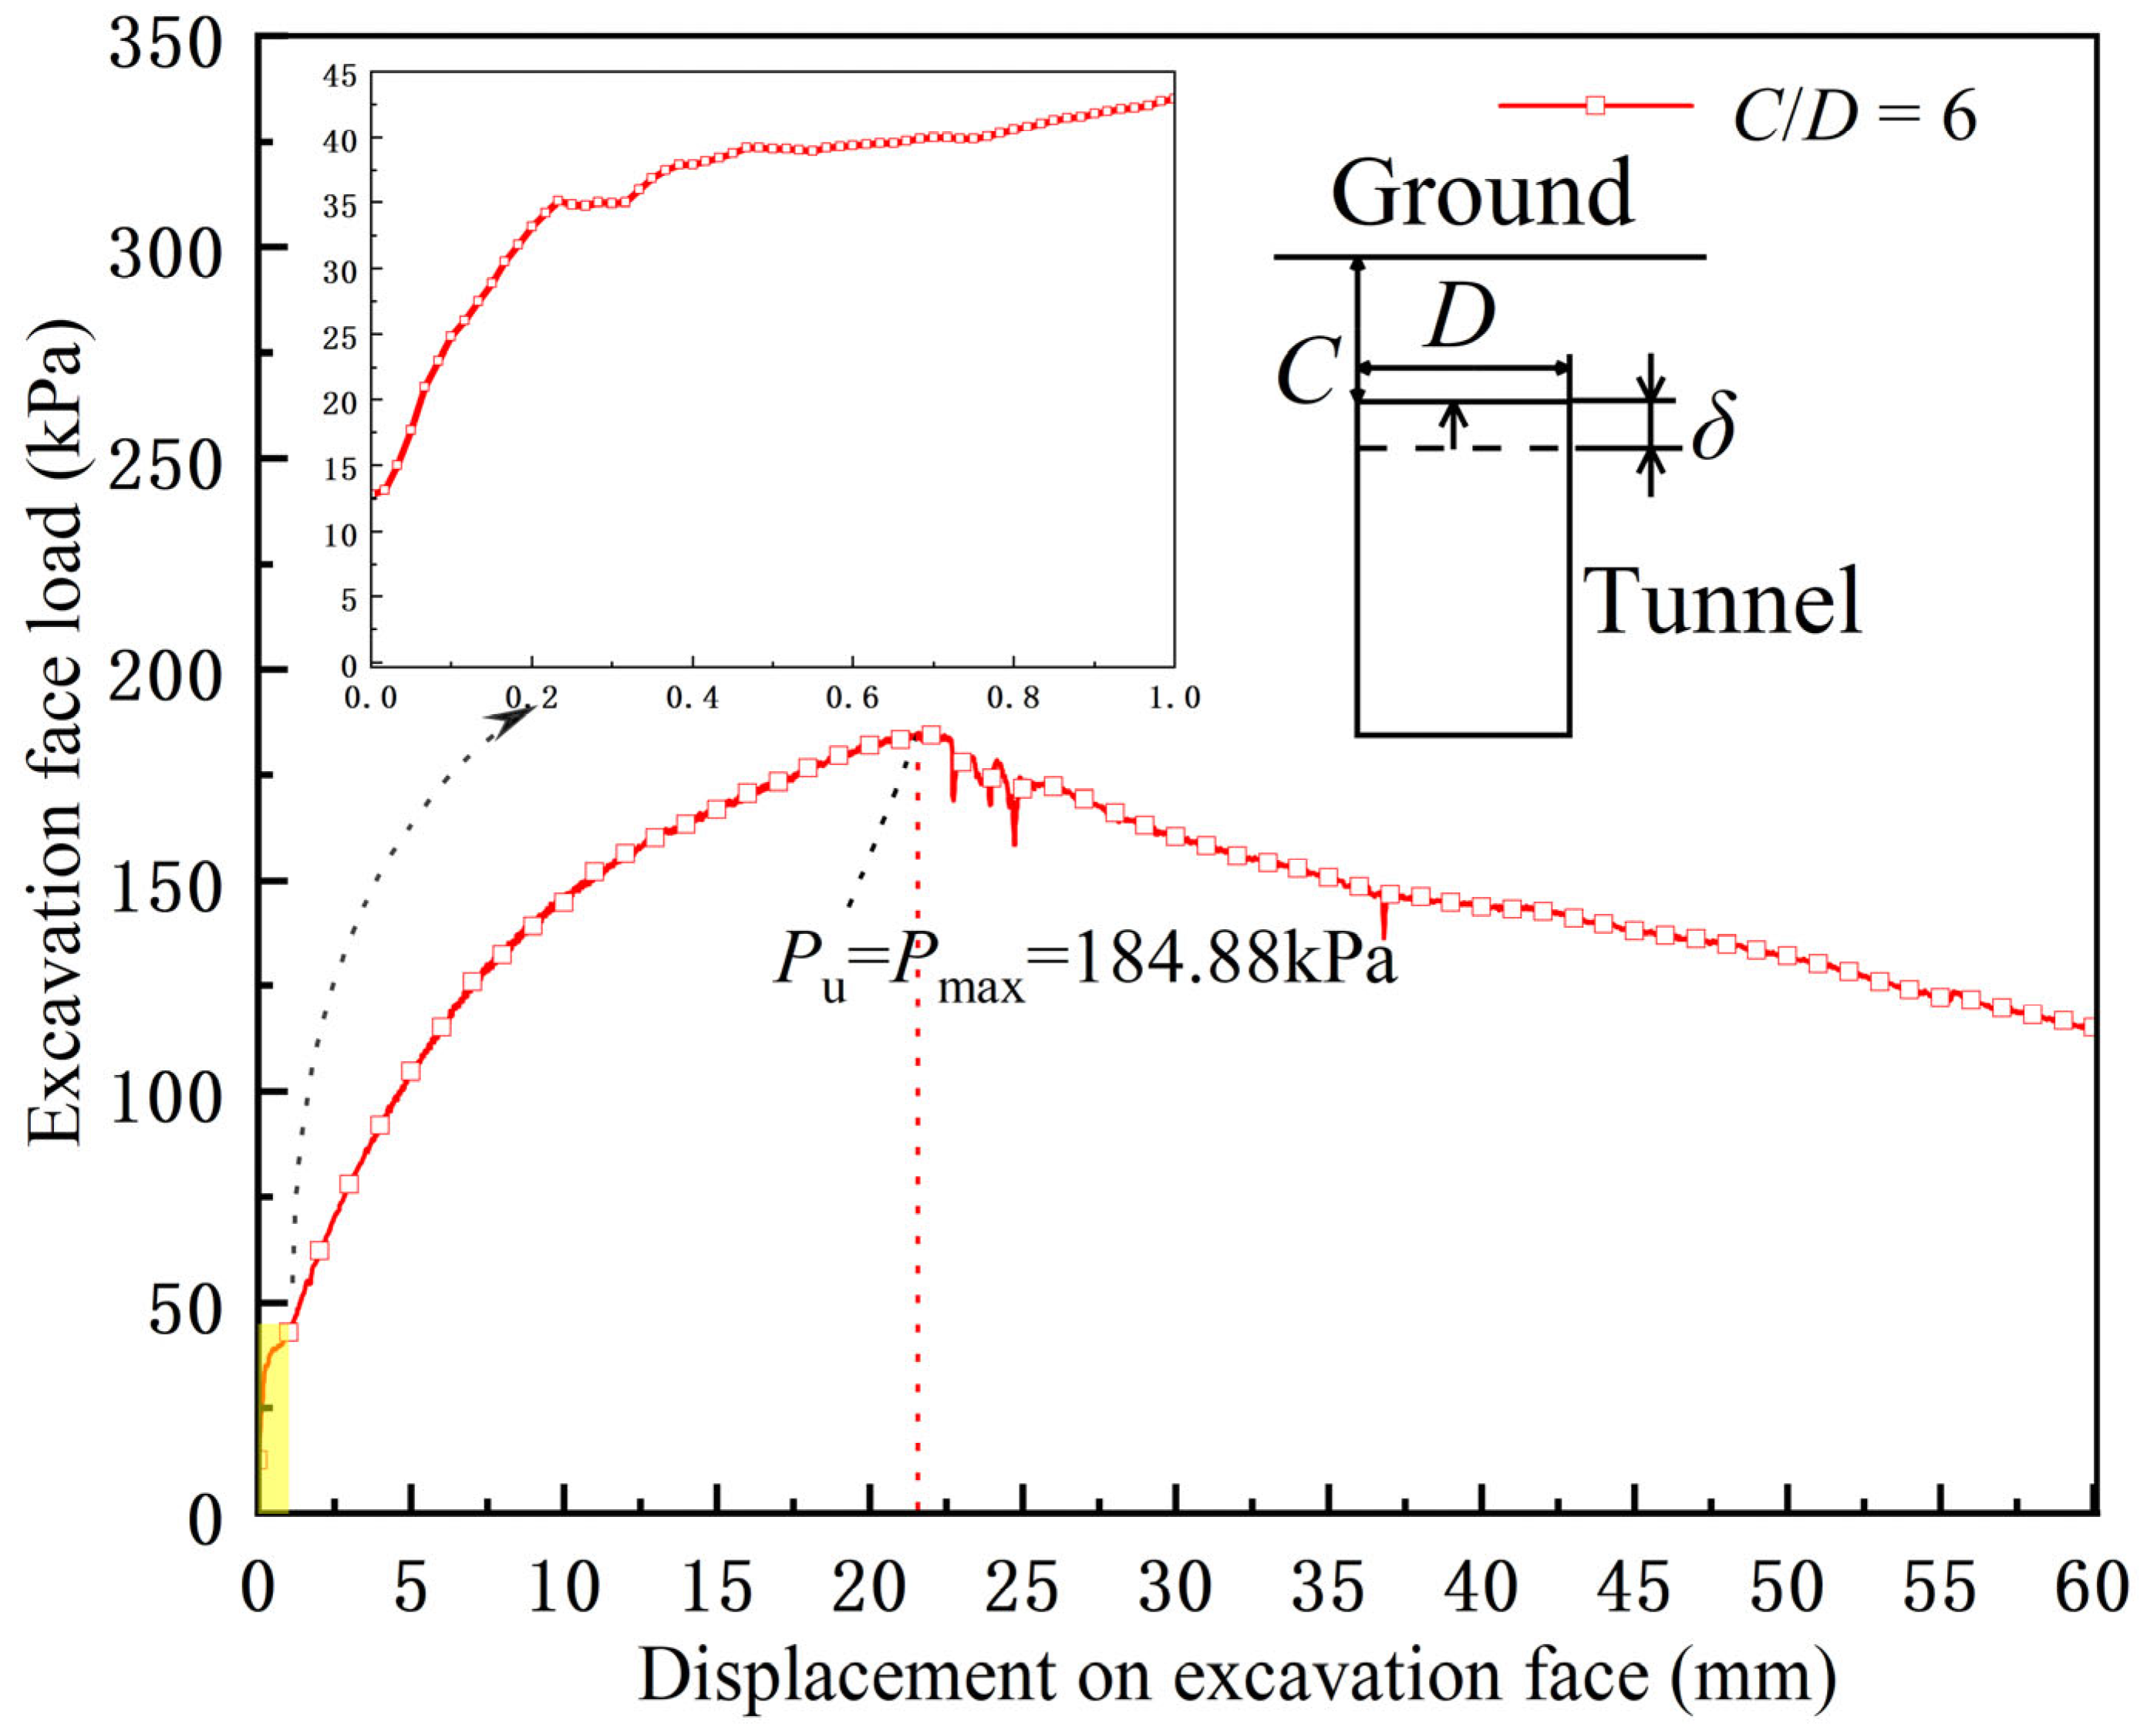
3.2.1. Load–Displacement Variation in Excavation Face

Utilizing the aforementioned apparatus, experiments were conducted, and the experimental data were analyzed. The excavation load was determined by the ratio of the supporting force to the excavation area. After removing the noise from the supporting force, the load–displacement curve of the excavation face was obtained (see Figure 15).
As shown in Figure 15, it can be observed that the excavation face load initially increases with the displacement of the excavation face and then decreases after reaching the ultimate support force Pu. The excavation face load–displacement curve can be divided into three stages:
  • Rapid Growth Stage: The excavation load increases rapidly with displacement from 0 to 5 mm, and the excavation face load–displacement curve is nearly linear. During this stage, most of the soil undergoes elastic deformation, while some local soil enters the plastic deformation state, gradually mobilizing soil shear strength and the soil arching effect.
  • Slow Growth Stage: When the excavation displacement is within the range of 5 mm to 21.55 mm, the excavation face load–displacement curve becomes nonlinear, with the growth in the excavation load slowing down continuously until it reaches a peak value of 184.88 kPa. During this stage, the extent of the soil in the plastic deformation state above the excavation face further expands, and the soil shear strength and soil arching effect continue to play a dominant role in the change of excavation face load.
  • Descending Stage: From 21.55 mm to 60 mm, the excavation load continues to decrease, and the excavation face load–displacement curve is nearly linear. The soil shear strength and soil arching effect are almost fully mobilized at the peak excavation face load, with the residual soil arching effect taking place. In this stage, the reduction in the thickness of the overburden above the excavation face plays a dominant role in the change in excavation face load.
During the rapid growth phase, the excavation load increases rapidly with displacement. Therefore, in practical engineering, if excavation face instability, it is crucial to promptly reduce the support pressure to control the instability and minimize its impact on the surface.

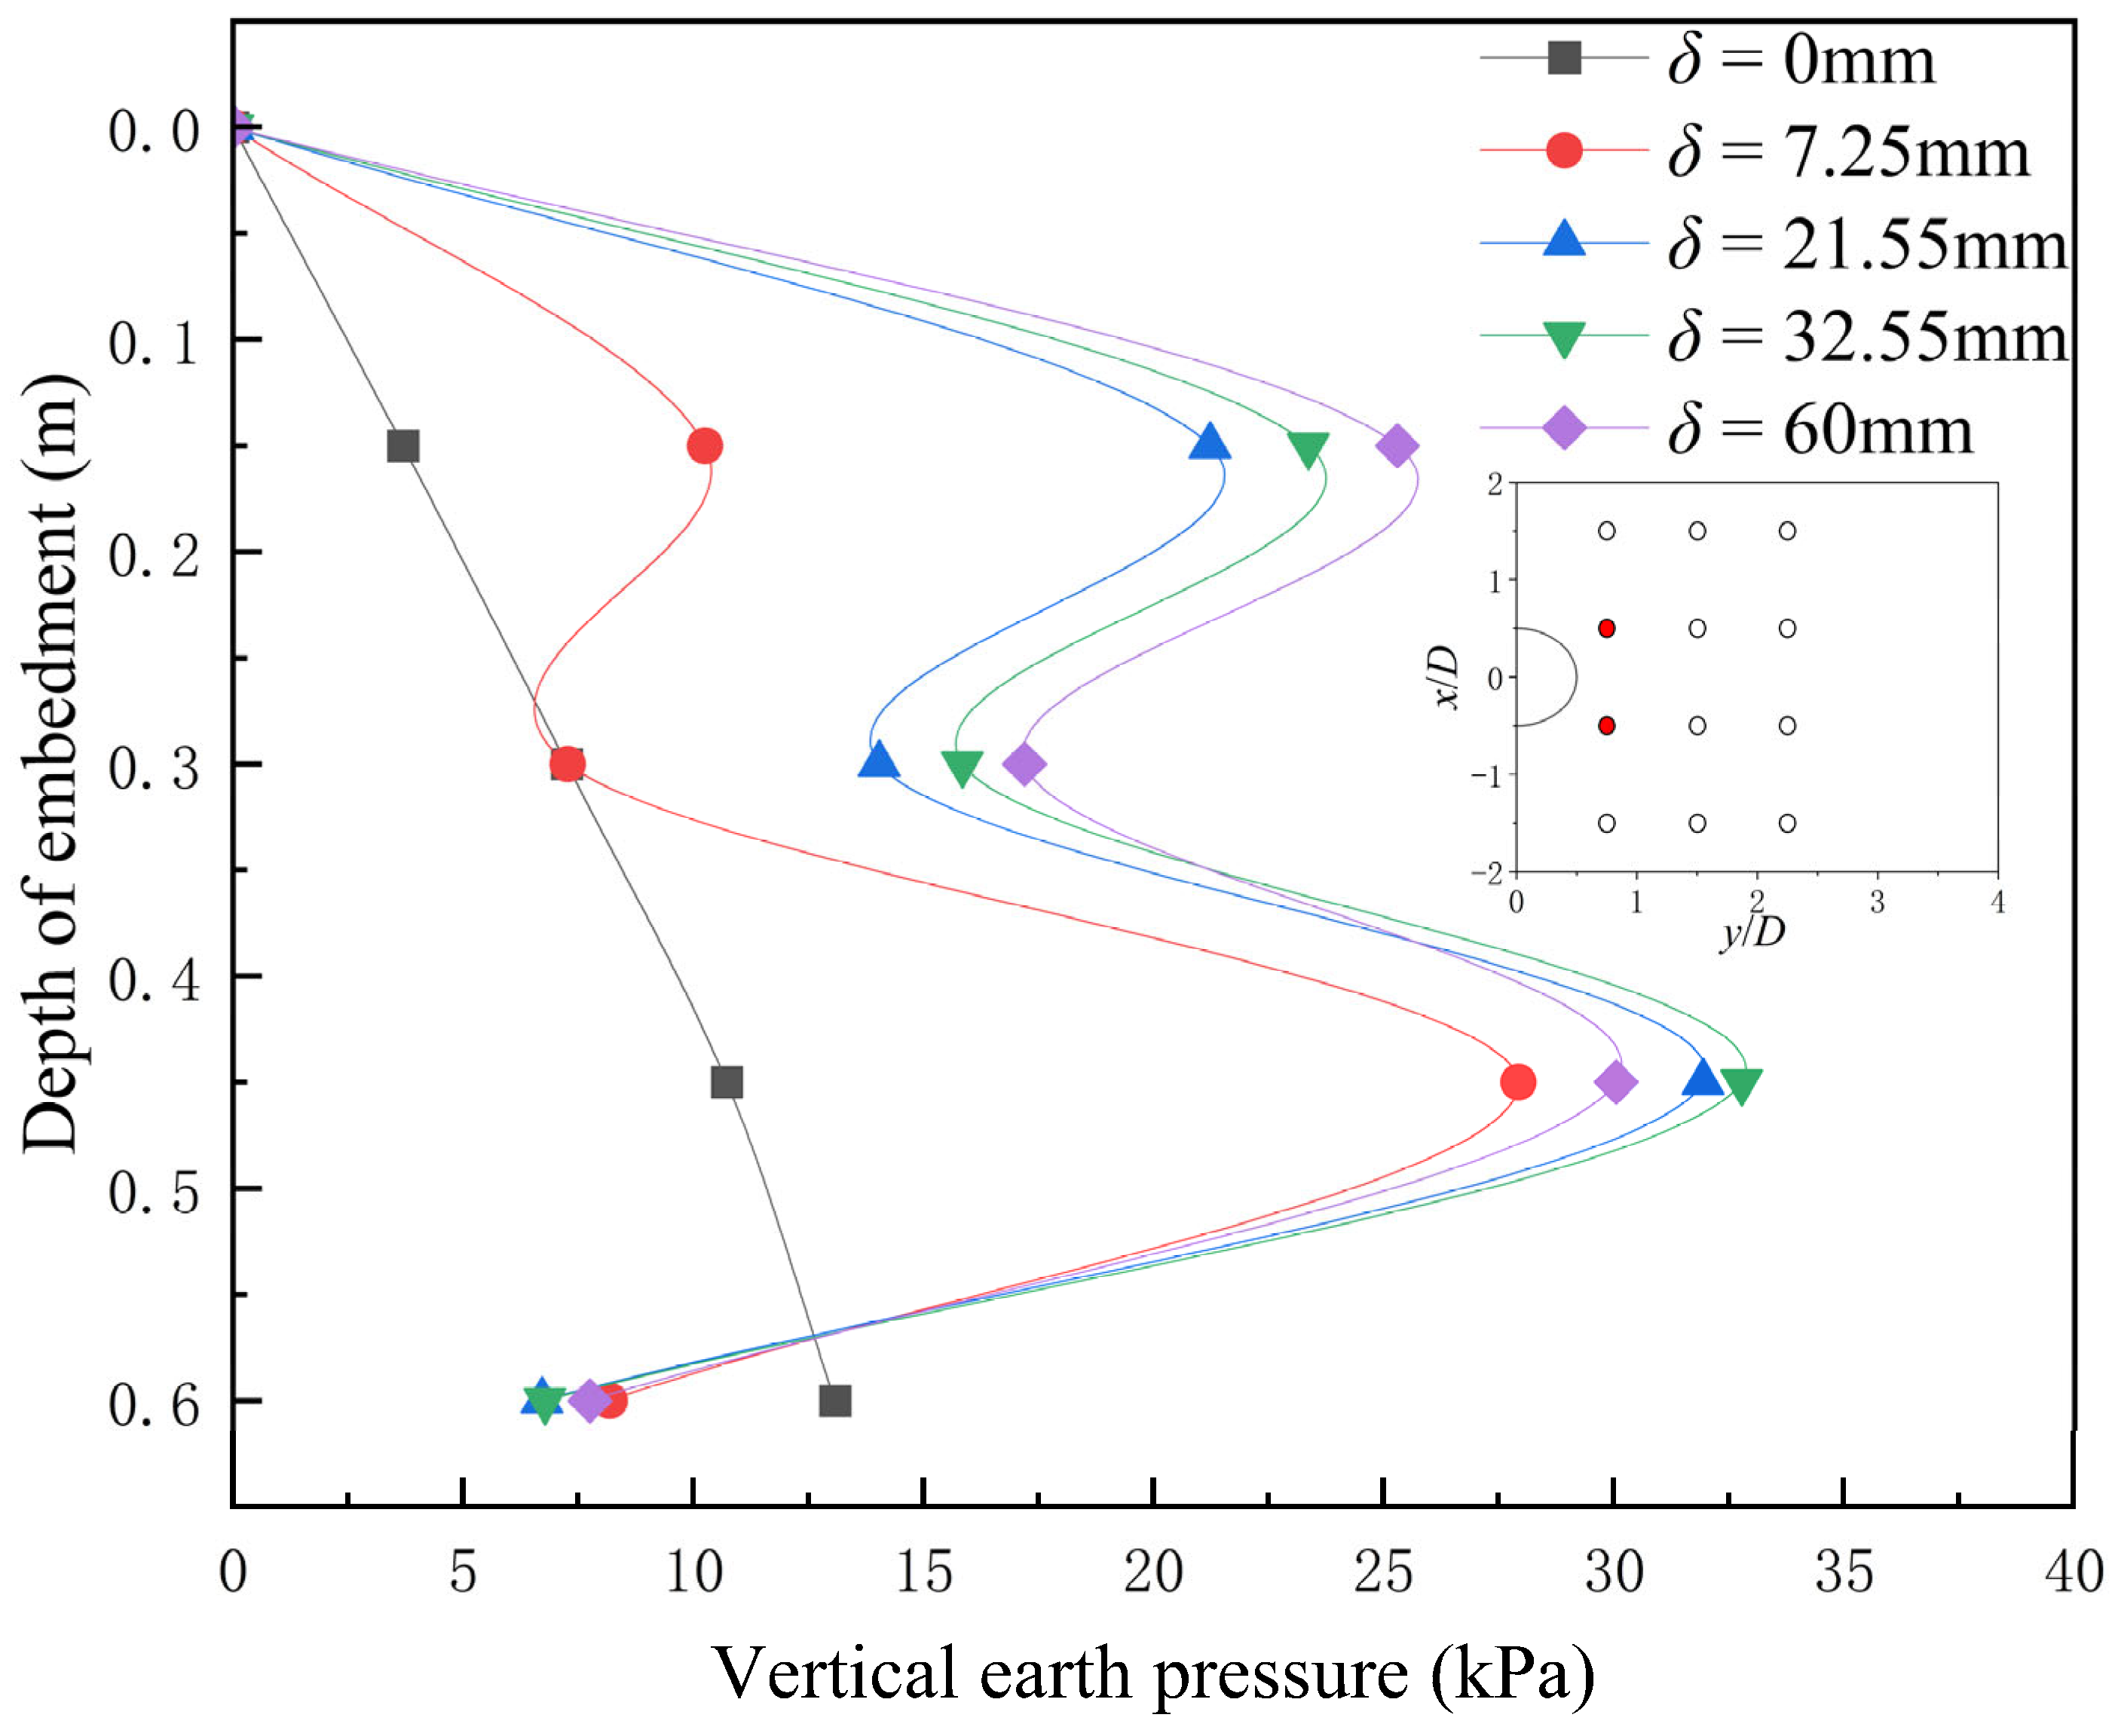
3.2.2. Analysis of the Vertical Earth Pressure Variation

Figure 16 presents the changes in vertical earth pressure at different depths in response to the displacement of the excavation face. The purpose of this figure is to visually demonstrate the development of the soil arching effect, reflected by changes in earth pressure, as the excavation face displacement increases (or as time progresses). As shown in the figure, with the increase in excavation face displacement, the trends of vertical earth pressure changes vary at different depths. At a depth of 60 cm, the vertical earth pressure decreases initially and then increases. Conversely, at a depth of 45 cm, the vertical earth pressure increases first and then decreases. At depths of 30 cm and 15 cm, the vertical earth pressure continuously increases.
As the excavation face moves upward, the deformation zone of the soil develops upward, and the cross-sectional area of the deformation zone at the bottom is smaller than that within a certain range above. In this experiment, the soil pressure gauges are placed outside the half cylinder area above the upward tunnel model. Therefore, the soil pressure gauge at a depth of 0.6 m is outside the deformation zone (and nearby), while the gauges at depths of 0.45 m, 0.3 m, and 0.15 m are within the deformation zone.
According to the soil arching effect, as the soil in the moving zone shifts upward, the mobilization of shear strength (or frictional resistance) causes the soil on both sides to hinder the upward movement of the soil in the failure zone, exerting a downward force on the soil in the deformation zone. This results in an increase in vertical soil pressure within the deformation zone and a decrease in vertical soil pressure near the deformation zone. Consequently, the vertical soil pressure decreases at a depth of 0.6 m, while it increases at depths of 0.45 m, 0.3 m, and 0.15 m.
As the excavation face continues to move upward, the shear stress between the deformation zone and the adjacent soil exceeds the shear strength, causing part of the deformation zone to transition to a failure zone. The shear strength transitions to residual shear strength (lacking the previous interlocking force and with reduced friction due to micro-cracks between the soil and adjacent soil). Therefore, the vertical soil pressure at a depth of 0.45 m first increases and then decreases, while at a depth of 0.6 m, the vertical soil pressure first decreases and then increases. Additionally, the simultaneous development of the deformation zone and failure zone slows the rate of change in vertical soil pressure at the same depth.
Understanding the changes in vertical earth pressure at different depths is crucial for formulating effective excavation strategies and implementing robust safety measures. This information not only reveals the dynamic response of the soil during excavation but also provides a scientific basis for optimizing support design and preventing excavation face instability.

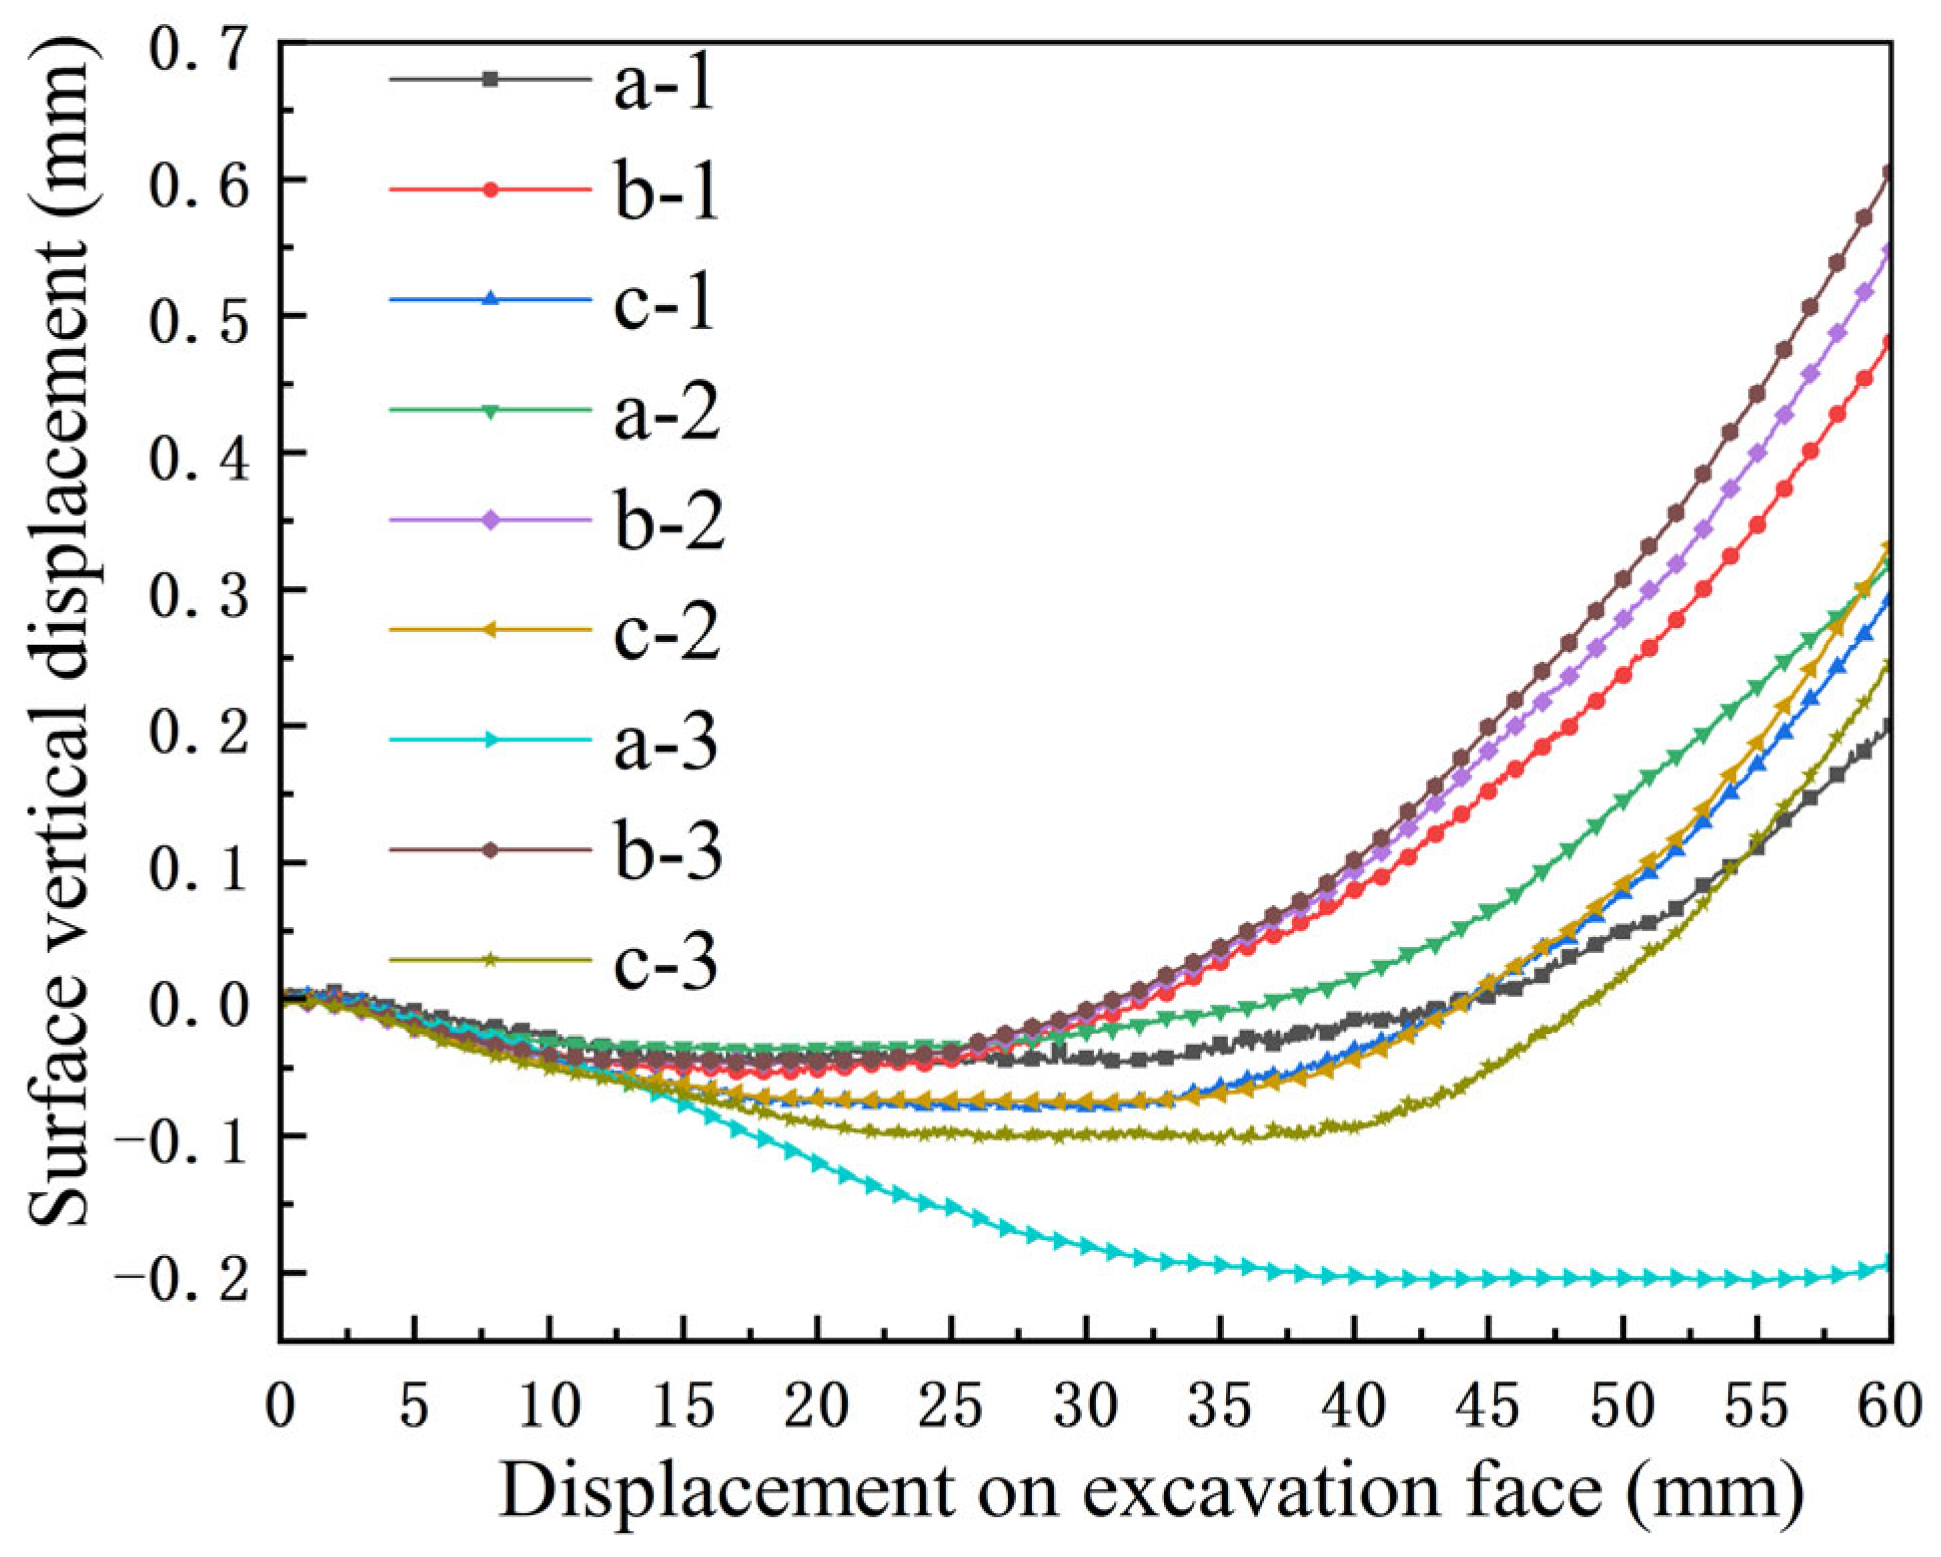
3.2.3. Analysis of the Ground Displacement Variation

Figure 17 depicts the curve of ground displacement changes during the face instability process of the USM, with the layout of displacement sensors shown in Figure 9. Notably, the displacement data from symmetrical positions have been averaged, with ground uplift considered positive. As the excavation face ascends, the ground displacement initially experiences a minor settlement before transitioning into an accelerated uplift trend. Thus, in construction processes, if passive instability occurs at the excavation face, it is crucial to promptly control the instability to minimize variations in ground displacement.

3.2.4. Analysis of the Variation in Soil Internal Displacement on the Observation Surface

During image processing with GeoPIV-RG software, correlation coefficient thresholding was used to filter output data and manually remove redundant data, further reducing errors inherent to the PIV technique. Additionally, “performing object space calibration” within the software eliminated visual errors during the process of taking pictures. GeoPIV-RG software accuracy is sufficient, with research indicating a standard error of 16 μm (0.08%) for pure horizontal displacement [38].
In Figure 18, the soil displacement field obtained through PIV analysis at the ultimate support force is depicted. It reveals that the cylindrical part of the soil above the excavation face within the diameter of the excavation face moves in the Y-axis direction, whereas the soil outside the diameter of the excavation face moves obliquely outward, with the angle between the soil displacement direction and the vertical axis increasing as the distance from the excavation face increases.

4. Conclusions

A model test apparatus for studying the excavation face stability in the USM was designed and developed. This apparatus comprises systems for tunnel structure, sand fall control, propulsion control, data acquisition, and water level control, enabling scaled model experiments to be conducted under both active and passive instability conditions in dry sand and soft clay strata. As an illustrative example, an experimental study was conducted on passive instability of upward excavation faces in dry sand with C/D = 6 to illustrate the application of the model test apparatus, yielding the following key findings:
  • The variation in tunnel face load generally exhibits three stages, rapid growth, slow growth, and decline, with a maximum support force recorded at 184.88 kPa.
  • The patterns of vertical soil pressure changes in failure zones at different depths vary significantly. As the excavation face displacement increases, the vertical soil pressure in the lower part gradually transfers to the upper part.
  • Throughout the ascent of the excavation face, surface displacement demonstrates an initial minor settlement followed by accelerated uplift.
  • The cylindrical part of the soil above the excavation face within the diameter of the excavation face moves in the Y-axis direction, whereas the soil outside the diameter of the excavation face moves obliquely outward. The angle between the soil movement direction and the vertical increases with distance from the excavation face.
The model test apparatus in this study enables the comprehensive monitoring of multidimensional data during the excavation face instability process in the USM, thereby facilitating the study of the face stability analysis in the USM. The model test equipment will be further applied in future studies, with particular emphasis on investigating the mechanisms of active and passive instability of the excavation face in the USM at various burial depths.
Future investigations can further delve into the impacts of variables such as overburden height, seepage, sand relative compaction, and excavation face movement speed on the instability characteristics and soil arching effect in the USM. Furthermore, machine learning (ML), artificial intelligence (AI), and artificial neural network (ANN) algorithms have been widely implemented in civil engineering [39]. These algorithms can be suitably applied and trained using experimental or site-specific data. This approach will allow for the estimation of excavation face loads and the evolution of soil arching effects based on these factors, thereby leading to the development of more effective support strategies and measures for managing post-instability conditions.

Author Contributions

Conceptualization, X.W. (Xiao Wang) and G.W.; Data curation, X.W. (Xiao Wang) and Y.L.; Formal analysis, X.W. (Xiao Wang) and Y.L.; Funding acquisition, X.W. (Xiao Wang), G.W., X.W. (Xinjiang Wei) and B.L.; Investigation, B.L.; Methodology, Y.L.; Project administration, Z.Y. and J.Y.; Resources, X.W. (Xiao Wang) and G.W.; Supervision, G.W. and X.W. (Xinjiang Wei); Visualization, X.W. (Xiao Wang) and Y.L.; Writing—original draft, X.W. (Xiao Wang) and Y.L.; Writing—review and editing, G.W., X.W. (Xinjiang Wei), Z.Y. and J.Y. All authors have read and agreed to the published version of the manuscript.

Funding

This research was funded by the National Natural Science Foundation of China (Grant No. 52308421), the Natural Science Foundation of Zhejiang Province (Grant No. LHZ23E080001), and the open fund project of Zhejiang Engineering Research Center of Intelligent Urban Infrastructure (Grant No. IUI2022-YB-03).

Data Availability Statement

The original contributions presented in this study are included in the article, further inquiries can be directed to the corresponding author.

Conflicts of Interest

Authors Zihai Yan, Jiajia Yan and Baojian Li were employed by the company Power China Huadong Engineering Corporation. The remaining authors declare that the research was conducted in the absence of any commercial or financial relationships that could be construed as a potential conflict of interest.

References

  1. Konoha, Y.; Yamamoto, Y. Turning simple ideas into reality: Development and application of upward shield tunneling method for the sewer construction project along bandai-hannan line. Civ. Eng. 2003, 53–57. [Google Scholar]
  2. Ito, K.; Sakae, T.; Hara, S.; Ito, H.; Hashimoto, H. Development of upward shield method. Tunn. Undergr. Space Technol. 2004, 19, 488–489. [Google Scholar]
  3. Kondo, F.; Sakamoto, H.; Takaishi, T.; Mukai, T. Construction of three vertical shafts using upward shield machine–the bandai–hannan sewer tunnel construction works. Tunn. Undergr. Space Technol. 2004, 19, 491. [Google Scholar] [CrossRef]
  4. Himuro, A. Upward shield tunneling from deep underground stormwater storage pipes in the central areas. In Proceedings of the WEFTEC 2007, San Diego, CA, USA, 13–17 October 2007; Water Environment Federation: Alexandria, VA, USA, 2007; pp. 9312–9320. [Google Scholar]
  5. Hiromi, I.; Toshio, K. Excavating shafts from the bottom-construction of the branching shafts of the midosuji common duct by the upward shield tunneling method. In Challenges and Changes Tunnelling Activities in Japan 2014; Japan Tunnelling Association: Tokyo, Japan, 2014; p. 27. [Google Scholar]
  6. Wang, L.; Wang, Z.; Li, L.; Wang, J. Construction behavior simulation of a hydraulic tunnel during standpipe lifting. Tunn. Undergr. Space Technol. 2011, 26, 674–685. [Google Scholar] [CrossRef]
  7. Wang, L.; Sun, L.; Wang, Z.; Zhang, J. Field monitoring of a subsea shield tunnel during standpipe lifting. Tunn. Undergr. Space Technol. 2015, 45, 52–62. [Google Scholar] [CrossRef]
  8. Wang, X.; Behbahani, S.S.; Iseley, T.; Azimi, M.; Wei, X.; Wei, G.; Shi, Y. Vertical tunneling in china—A case study of a hydraulic tunnel in beihai. Tunn. Undergr. Space Technol. 2021, 107, 103650. [Google Scholar] [CrossRef]
  9. Zhou, W. Shield Tunnel Construction Technology and Application; China Architecture & Building Press: Beijing, China, 2004. [Google Scholar]
  10. Lu, L.; Wei, X.; Wang, X.; Yan, Z.; Cheng, Z.; Hu, H. Mechanical behavior of the special segment structure during upward shield tunnel construction. Math. Probl. Eng. 2022, 2022, 8587689. [Google Scholar] [CrossRef]
  11. Mair, R.J.; Taylor, R.N. Bored tunnelling in the urban environments. In Proceedings of the Fourteenth International Conference on Soil Mechanics and Foundation Engineering, Hamburg, Germany, 6–12 September 1997; National Academy of Sciences: Washington, DC, USA, 1999; Volume 4. [Google Scholar]
  12. Kirsch, A. Experimental investigation of the face stability of shallow tunnels in sand. Acta Geotech. 2010, 5, 43–62. [Google Scholar] [CrossRef]
  13. Chen, R.; Li, J.; Kong, L.; Tang, L. Experimental study on face instability of shield tunnel in sand. Tunn. Undergr. Space Technol. 2013, 33, 12–21. [Google Scholar] [CrossRef]
  14. Liu, W.; Zhao, Y.; Shi, P.; Li, J.; Gan, P. Face stability analysis of shield-driven tunnels shallowly buried in dry sand using 1-g large-scale model tests. Acta Geotech. 2018, 13, 693–705. [Google Scholar] [CrossRef]
  15. Di, Q.; Li, P.; Zhang, M.; Cui, X. Influence of relative density on deformation and failure characteristics induced by tunnel face instability in sandy cobble strata. Eng. Fail. Anal. 2022, 141, 106641. [Google Scholar] [CrossRef]
  16. Ma, S.; Duan, Z.; Huang, Z.; Liu, Y.; Shao, Y. Study on the stability of shield tunnel face in clay and clay-gravel stratum through large-scale physical model tests with transparent soil. Tunn. Undergr. Space Technol. 2022, 119, 104199. [Google Scholar] [CrossRef]
  17. Lee, I.-M.; Nam, S.-W. The study of seepage forces acting on the tunnel lining and tunnel face in shallow tunnels. Tunn. Undergr. Space Technol. 2001, 16, 31–40. [Google Scholar] [CrossRef]
  18. Wang, J.; He, C.; Xu, G. Face stability analysis of EPB shield tunnels in dry granular soils considering dynamic excavation process. J. Geotech. Geoenviron. Eng. 2019, 145, 04019092. [Google Scholar] [CrossRef]
  19. Xue, F.; Zhang, M. Excavation face stability of shield tunneling closely under existing tunnels: Particle flow simulation. Iran. J. Sci. Technol. Trans. Civ. Eng. 2020, 44, 497–506. [Google Scholar] [CrossRef]
  20. Yin, X.; Chen, R.; Meng, F. Influence of seepage and tunnel face opening on face support pressure of EPB shield. Comput. Geotech. 2021, 135, 104198. [Google Scholar] [CrossRef]
  21. Ma, S.; Li, J.; Li, Z. Critical support pressure of shield tunnel face in soft-hard mixed strata. Transp. Geotech. 2022, 37, 100853. [Google Scholar] [CrossRef]
  22. Lee, I.-M.; Nam, S.-W.; Ahn, J.-H. Effect of seepage forces on tunnel face stability. Can. Geotech. J. 2003, 40, 342–350. [Google Scholar] [CrossRef]
  23. Lu, X.; Wang, H.; Huang, M. Upper bound solution for the face stability of shield tunnel below the water table. Math. Probl. Eng. 2014, 2014, 727964. [Google Scholar] [CrossRef]
  24. Zhang, C.; Han, K.; Zhang, D. Face stability analysis of shallow circular tunnels in cohesive–frictional soils. Tunn. Undergr. Space Technol. 2015, 50, 345–357. [Google Scholar] [CrossRef]
  25. Chen, R.; Yin, X.; Tang, L.; Chen, Y. Centrifugal model tests on face failure of earth pressure balance shield induced by steady state seepage in saturated sandy silt ground. Tunn. Undergr. Space Technol. 2018, 81, 315–325. [Google Scholar] [CrossRef]
  26. Li, P.; Chen, K.; Wang, F.; Li, Z. An upper-bound analytical model of blow-out for a shallow tunnel in sand considering the partial failure within the face. Tunn. Undergr. Space Technol. 2019, 91, 102989. [Google Scholar] [CrossRef]
  27. Liu, X.; Wang, F.; Fang, H.; Yuan, D. Dual-failure-mechanism model for face stability analysis of shield tunneling in sands. Tunn. Undergr. Space Technol. 2019, 85, 196–208. [Google Scholar] [CrossRef]
  28. Mi, B.; Xiang, Y. Analysis of the limit support pressure of a shallow shield tunnel in sandy soil considering the influence of seepage. Symmetry 2020, 12, 1023. [Google Scholar] [CrossRef]
  29. Wong, K.S.; Ng, C.W.W.; Chen, Y.M.; Bian, X.C. Centrifuge and numerical investigation of passive failure of tunnel face in sand. Tunn. Undergr. Space Technol. 2012, 28, 297–303. [Google Scholar] [CrossRef]
  30. Chen, R.; Li, J.; Chen, Y.; Kong, L. Large-scale tests on face stability of shield tunnelling in dry cohesionless soil. Chin. J. Geotech. Eng. 2011, 33, 117–122. (In Chinese) [Google Scholar]
  31. LÜ, X.; Zeng, S.; Wang, Y.; Ma, S.; Huang, M. Physical model tests on stability of shield tunnel face in saturated gravel stratum. Chin. J. Geotech. Eng. 2019, 41, 129–132. (In Chinese) [Google Scholar]
  32. Ma, S.; Wei, R.; Shao, Y.; Huang, Z.; Duan, Z. 3D visual model tests on stability of tunnel excavation surface based on transparent soil. Chin. J. Geotech. Eng. 2021, 43, 1798–1806. [Google Scholar] [CrossRef]
  33. Mi, B. Study on Limit Failure Mode and Support Pressure of Tunnel Face of Underwater Shallow Shield Tunnel; Beijing Jiaotong University: Beijing, China, 2022. (In Chinese) [Google Scholar]
  34. Niu, H.; Weng, X.; Yu, H.; Hu, J. Centrifugal test study on instability mode of shield tunnel excavation facein silty sand stratum under seepage. China Civ. Eng. J. 2020, 53, 99–104. [Google Scholar] [CrossRef]
  35. Yan, B. Numerical Simulation and Centrifugal Test Study on Stability of Shield Tunnel Excavation Surface under Seepage Conditions; Chang’an University: Xi’an, China, 2021. [Google Scholar]
  36. Berthoz, N.; Branque, D.; Subrin, D.; Wong, H.; Humbert, E. Face failure in homogeneous and stratified soft ground: Theoretical and experimental approaches on 1g EPBS reduced scale model. Tunn. Undergr. Space Technol. 2012, 30, 25–37. [Google Scholar] [CrossRef]
  37. Lü, X.; Zeng, S.; Zhao, Y.; Huang, M.; Ma, S.; Zhang, Z. Physical model tests and discrete element simulation of shield tunnel face stability in anisotropic granular media. Acta Geotech. 2020, 15, 3017–3026. [Google Scholar] [CrossRef]
  38. Idinger, G.; Aklik, P.; Wu, W.; Borja, R.I. Centrifuge model test on the face stability of shallow tunnel. Acta Geotech. 2011, 6, 105–117. [Google Scholar] [CrossRef]
  39. Gaur, H.; Khidhir, B.; Manchiryal, R.K. Solution of structural mechanic’s problems by machine learning. Int. J. Hydromechatron. 2022, 5, 22–43. [Google Scholar] [CrossRef]
Figure 1. Upward tunnel and horizontal tunnel models.
Buildings 14 02514 g001
Figure 2. Sand conveyor.
Buildings 14 02514 g002
Figure 3. Sand fall device.
Buildings 14 02514 g003
Figure 4. Propulsion control system.
Buildings 14 02514 g004
Figure 5. Servo control module.
Buildings 14 02514 g005
Figure 6. Excavation face.
Buildings 14 02514 g006
Figure 7. Layout of earth pressure sensors in soil.
Buildings 14 02514 g007
Figure 8. Displacement sensor frame.
Buildings 14 02514 g008
Figure 9. Placement of displacement sensors.
Buildings 14 02514 g009
Figure 10. Image acquisition setup.
Buildings 14 02514 g010
Figure 11. Water level control system.
Buildings 14 02514 g011
Figure 12. Affixing the control points.
Buildings 14 02514 g012
Figure 13. Calibration of control points using the reference points.
Buildings 14 02514 g013
Figure 14. Experimental flowchart.
Buildings 14 02514 g014
Figure 15. Load–displacement curve of the excavation face.
Buildings 14 02514 g015
Figure 16. Vertical earth pressure variation.
Buildings 14 02514 g016
Figure 17. The curve of ground displacement variation.
Buildings 14 02514 g017
Figure 18. Soil displacement field at the ultimate support force.
Buildings 14 02514 g018
Table 1. Similarities and differences between the VTM and the USM [8]. Reproduced with permission from [8], Elsvier, 2024.
MethodsVTMUSM
SimilaritiesThe jacking direction is from the lining of the underground constructed horizontal tunnel to the ground or subsea surface.
Some structures, such as special segments [3] or ceiling segments, need to be installed during the construction of the horizontal tunnel.
Work on the soil surface is simple. Most of the on-road work can be avoided in the USM. Likewise, large-scale machines and equipment used for on-water operations are not needed in the VTM.
The work time on the road and total construction time is short in both methods. The construction period of the USM can be shortened to one-third and the surface operations time by one-sixth compared with traditional construction methods such as the cut-and-cover method [1,3,5]. One outlet standpipe about 8~12 m in depth can be constructed in around two days by applying the VTM [9].
Difference (1):
Advancement way.
Jacking upward is processed through soil displacement.Advance upward through soil removal.
Difference (2):
The special structures treatment.
The ceiling segments in the VTM are lifted with the standpipes during the construction process.A special segment is easily cuttable by the upward shield machine.
Difference (3):
Application situations.
The VTM is mainly applied in hydraulic tunnel projects to build water inlet or outlet drainage, its application range is narrower compared to the USM, but it can be promoted to use in congested city areas in the future.The USM is always used in congested city areas, and it can be applied to multiple projects [2].
Difference (4):
Different sizes and depths of shafts.
The shafts are mainly square in shape. Moreover, the size is 1.9 m × 1.9 m (square) and ranges from 0.9 m to 1.4 m (round), smaller than that of the USM. The depth is mainly between 8 and 12 m, much shallower than the depth of shafts in the USM [9].Shafts are all round in shape. The irregularity of the cross-section is under study [2]. The diameters range from 2 to 4 m, and the depth can reach 50 m [2].
Difference (5):
Different geological conditions.
The VTM is often limited to being applied in saturated soft soil layers.The USM can be applied to various types of geotechnical materials.
Difference (6):
Grouting or not.
Soil weakening measures instead of grouting are used in the VTM.Grouting is applied to reduce the friction force between the soil and the tunnel surface.
Difference (7):
Different ways of reusing machines.
The jacking platform and jacks can be reused by easily moving them from the position of one shaft to another shaft.The tunnel boring machine should be relocated to the working pit before reusing it.
Table 2. Comparative analysis of model and prototype dimensions (unit: m).
The Horizontal TunnelThe Upward TunnelThe Upward Shield Excavation Face
Outer
Diameter
Inner
Diameter
Outer
Diameter
Inner
Diameter
Diameter
Prototype5.074.773.333
Model0.1690.1590.110.10.1
Table 3. The basic geological parameters of the dry sand.
TypeDry Sand
Density ρ1.51 g/cm3
Moisture content ω0.35%
Grain density Gs2.6623
Min dry density ρmin1.429
Max dry density ρmax1.772 g/cm3
Average particle size d50481 μm
Coefficient of uniformity Cu (d60/d10)1.943098
Coefficient of curvature Cc ( d 30 2 d 60 × d 10 )1.059796
Frictional angle φ29°
Cohesion c0 kPa
Table 4. The key parameters of the model tests for excavation face stability in the horizontal tunnel.
Ref.SoilBackward Distance of the Excavation Face (mm)Backward Speed of the
Excavation Face
(Non-Uniform Unit)
Backward Speed of the Excavation Face (The Unified Unit is mm/min)Tunnel
Diameter (mm)
Backward
Distance of the Excavation Face/Tunnel
Diameter
Chen et al. [30]Dry sand60Each stage retreated by 0.1 mm, with intervals between stages exceeding 40 min but not exceeding 2 h.0.0008~0.002510000.06
LÜ et al. [31]Gravel150.0025 mm/min0.00251500.1
Ma et al. [32]Transparent soil200.05 mm/min0.051200.17
Mi [33]Clay sand600.1 mm/s 63000.2
Niu et al. [34]Sand + clay (various ratios)15s < 5 mm, v = 0.1 mm/min;
5 mm < s < 10 mm, v = 0.2 mm/min;
10 mm < s < 15 mm, v = 0.4 mm/min;
0.1–0.41000.15
Yan [35]Sandy silty10s < 2 mm, v = 0.l mm/min;
2 mm < s< 6 mm, v = 0.2 mm/min;
6 mm < s< 10 mm, v = 0.4 mm/min
0.1–0.41000.1
Kirsch [12]Dry sand25--1000.25
Liu et al. [14]Dry sand300.02 mm/s~0.08 mm/s1.2–4.86000.05
Chen et al. [25]Sandy silt10s < 6 mm, v = 0.2 mm/min;
6 mm < s < 10 mm,
v = 0.4 mm/min;
0.2–0.41000.1
Berthoz et al. [36]Houston S28 sand50--5500.09
Lü et al. [37]Rice grain30.05 mm/min 0.051500.02
Note: The excavation face displacement is denoted as “s”, and the excavation face moving speed is denoted as “v”.
Disclaimer/Publisher’s Note: The statements, opinions and data contained in all publications are solely those of the individual author(s) and contributor(s) and not of MDPI and/or the editor(s). MDPI and/or the editor(s) disclaim responsibility for any injury to people or property resulting from any ideas, methods, instructions or products referred to in the content.

