Article

Experimental Investigation and Analysis of Bond–Slip Behavior between Geopolymer Concrete and Steel Tube with Varying Structural Measures

1
School of Civil Engineering and Architecture, Zhengzhou University of Economics and Business, Zhengzhou 450007, China
2
School of Civil Engineering, Chongqing Jiaotong University, Chongqing 400074, China
3
School of Architecture and Civil Engineering, Zhongyuan University of Technology, Zhengzhou 450007, China
4
Ruyang County Gongxin Logistics Management, Luoyang 471200, China
*
Author to whom correspondence should be addressed.
Buildings 2024, 14(8), 2516; https://doi.org/10.3390/buildings14082516
Submission received: 4 July 2024 / Revised: 9 August 2024 / Accepted: 12 August 2024 / Published: 15 August 2024
(This article belongs to the Section Building Energy, Physics, Environment, and Systems)

Abstract

:
In this study, push-out tests were conducted on 20 specimens to explore the bond–slip performance of geopolymer concrete-filled steel tubes. The investigation focused on the effects of various design parameters such as length–diameter ratio, diameter–thickness ratio, concrete strength, and internal structural measures of the steel tube on the bond–slip performance. Analysis of the test phenomena, load–slip curves, and strain distribution curves of each specimen revealed insights into the shear strength calculation methods for welded stud structure and ring rib structure specimens. The results indicated a slight buckling deformation at the loading end of the steel tube in the structural specimen, while no significant deformation was observed in the non-structural specimen. The strain distribution along the height direction of the steel tube exhibited a triangular pattern, with the strain increasing gradually. Improvements in the interfacial bonding performance were noted with reductions in length–diameter ratio and diameter–thickness ratio of the steel tube, as well as increases in concrete strength. When the steel tube wall thickness t increases from 3.5 mm to 4.5 mm, the peak load of GC30-1 increases from 382.13 kN to 419.59 kN, an increase of 9.81%. After improving the concrete strength of GC30-1 and GC30-3 specimens, the peak load increases from 382.13 kN and 274.54 kN to 436.46 kN and 306.12 kN, respectively, an increase of 14.2% and 11.5%. Furthermore, the welding structure of the steel tube significantly enhanced the shear bearing capacity of the interface. The ratio of load calculation value to test value fell within the range of 0.917 to 1.098, indicating good agreement between the calculated and experimental values. These research results can provide reference for engineering applications of geopolymer concrete.

1. Introduction

Geopolymers are often created through the reaction of aluminosilicate materials (such as fly ash and metakaolin) with alkaline solutions at room temperature [1]. They exhibit rapid setting, high heat resistance, and resistance to acid and alkali corrosion, along with excellent performance. The manufacturing process is straightforward, with minimal CO2 emissions, making the materials environmentally friendly [2,3]. The combination of steel tube and concrete offers advantages such as high load carrying capacity, rigidity, improved seismic and fire resistance, and economic benefits, drawing increasing attention [4,5]. However, the natural bond strength between steel and concrete is low, leading to potential slip under external loads, which can reduce surface interaction forces and affect component load capacity [6].
The tight bond between steel tube and concrete is very important for the performance of structural joints, which is directly related to the load-bearing capacity of concrete-filled steel tubular members and the mechanical performance of joints. Research on the interface bonding performance of steel tube and concrete holds significant importance [6,7]. Multiple studies show that different factors, such as cross-section shapes, concrete fill, curing conditions, and internal structural forms, influence the bonding performance at the interface of concrete-filled steel tubes [8,9,10,11]. Song et al. [12] studied the bond behavior between steel tube and concrete in concrete-filled steel tubes (CFSTs). It was found that the bond strength of stainless steel CFST columns was lower than that of carbon steel, and the bond strength decreased significantly with the increase of section size and concrete age. Push-out tests were conducted by Campione [13] on 40 concrete-filled steel tubular short columns to investigate their bonding properties. The findings indicate that the push-out load is influenced by the section shape, section size, and bonding interface type. Push-out tests were conducted on 20 circular concrete-filled steel tube specimens to investigate the impact of concrete shrinkage and steel tube diameter on bond stress by Roeder et al. [14]. The findings indicate that concrete shrinkage, influenced by concrete properties, steel tube diameter, and inner wall conditions, significantly decreases bond stress. With 36 steel tube foam lightweight aggregate concrete as the test object, the influence of steel tube section shape, concrete type, age, and other parameters on the bonding performance of steel tube concrete were studied by Hunaiti [15]. It was found that the larger the diameter of the steel tube, the larger the diameter–thickness ratio, and the worse the bonding performance. A large number of studies have shown that the bond strength of the circular section is obviously better than that of the square section, and the bond strength gradually decreases with the passage of time. The bond strength varies with the cross-sectional shape of the steel tube. Specifically, when the cross-sectional shape of the steel tube is close to a circle, the bond strength tends to rise [13,16,17,18,19]. To investigate the impact of incorporating shear connectors on the bonding behavior of the steel–concrete interface and its operational attributes, researchers have conducted experiments on specimens incorporating structural enhancements like welded studs, longitudinal stiffeners, and circumferential stiffeners on steel [9,18,19,20,21,22,23]. Adding shear connectors significantly enhances the bonding strength of specimens. However, most of the current research on concrete-filled steel tubes focuses on ordinary silicate concrete, and there are few studies on the interfacial bonding properties of geopolymer concrete-filled steel tubular columns. In order to promote the application of steel tube geopolymer concrete in practical engineering, it is necessary to carry out detailed research on steel tube geopolymer concrete.
In this study, 20 specimens were designed, and the design parameters include the length–diameter ratio, the wall thickness of the steel tube, the strength of the core concrete, and various structural measures. These parameters are investigated to understand the interfacial bonding properties of geopolymer concrete-filled steel tube columns. Understanding the bonding mechanism between the steel tube and geopolymer concrete, as well as the load-bearing capacity of geopolymer concrete-filled steel tubes, holds significant importance.

2. Test Details

2.1. Material Properties

The steel tube and ring rib structure are made of Q235 steel. The longitudinal bars of studs and reinforcement cages are made of φ8 HRB400 thread steel, and the stirrups are made of φ6 HRB400 plain round steel. The mechanical properties of steel are prepared and tested with reference to the Chinese code [24,25]. The properties of the steel material are displayed in Table 1. The components of the geopolymer concrete include metakaolin, fly ash, coarse aggregate, fine aggregate, water, water-reducing agent, and industrial white sugar, as outlined in Table 2. Metakaolin is 1250 mesh, fly ash is grade I, coarse aggregate comprises continuous graded gravel ranging from 5 to 20 mm, and fine aggregate is natural river sand with a fineness modulus of 2.3 passing through a 2.36 mm sieve. The water reducer utilizes a highly efficient polycarboxylate superplasticizer with a 30% water reduction efficiency. Industrial white sugar is added to delay the setting time of the concrete [3]. The compressive strength standard values of the 28 d cube test block are 32.5 MPa and 53.7 MPa, respectively. The yield strength of HRB400 rebar is 459 MPa and the elongation is 14%.

2.2. Experimental Design

In this study, 20 geopolymer concrete-filled steel tube push-out specimens were prepared to investigate the impact of factors such as steel tube length–diameter ratio, steel tube wall thickness, core concrete strength, various structural measures, and other parameters on the bond–slip behavior. These structural measures of the 350 mm height specimens include no additional structure, welded studs, welded ring ribs, and integrated steel bar cages, as illustrated in Figure 1, where the green lines represent the outer outline of the steel tube, the black lines represent the top and the bottom outline of the specimens, and the yellow color represents the inner structural measures.
The steel tubes have lengths of 350 mm and 650 mm with wall thicknesses of 3.5 mm and 4.5 mm. The stud is 60 mm long, the ring rib is 4 mm thick and 60 mm wide, and the ring is joined to the inner wall of the steel tube through spot welding. Depending on the specimen’s height, three or six layers of welding methods are used. The steel cage is constructed inside the core concrete without touching the steel tube. The core concrete strength grades are C30 and C50, as specified in Table 3. A 50 mm space is maintained at the top of the specimen during the concrete pouring, acting as the free end, while the lower concrete lines up with the steel tube as the loading end.

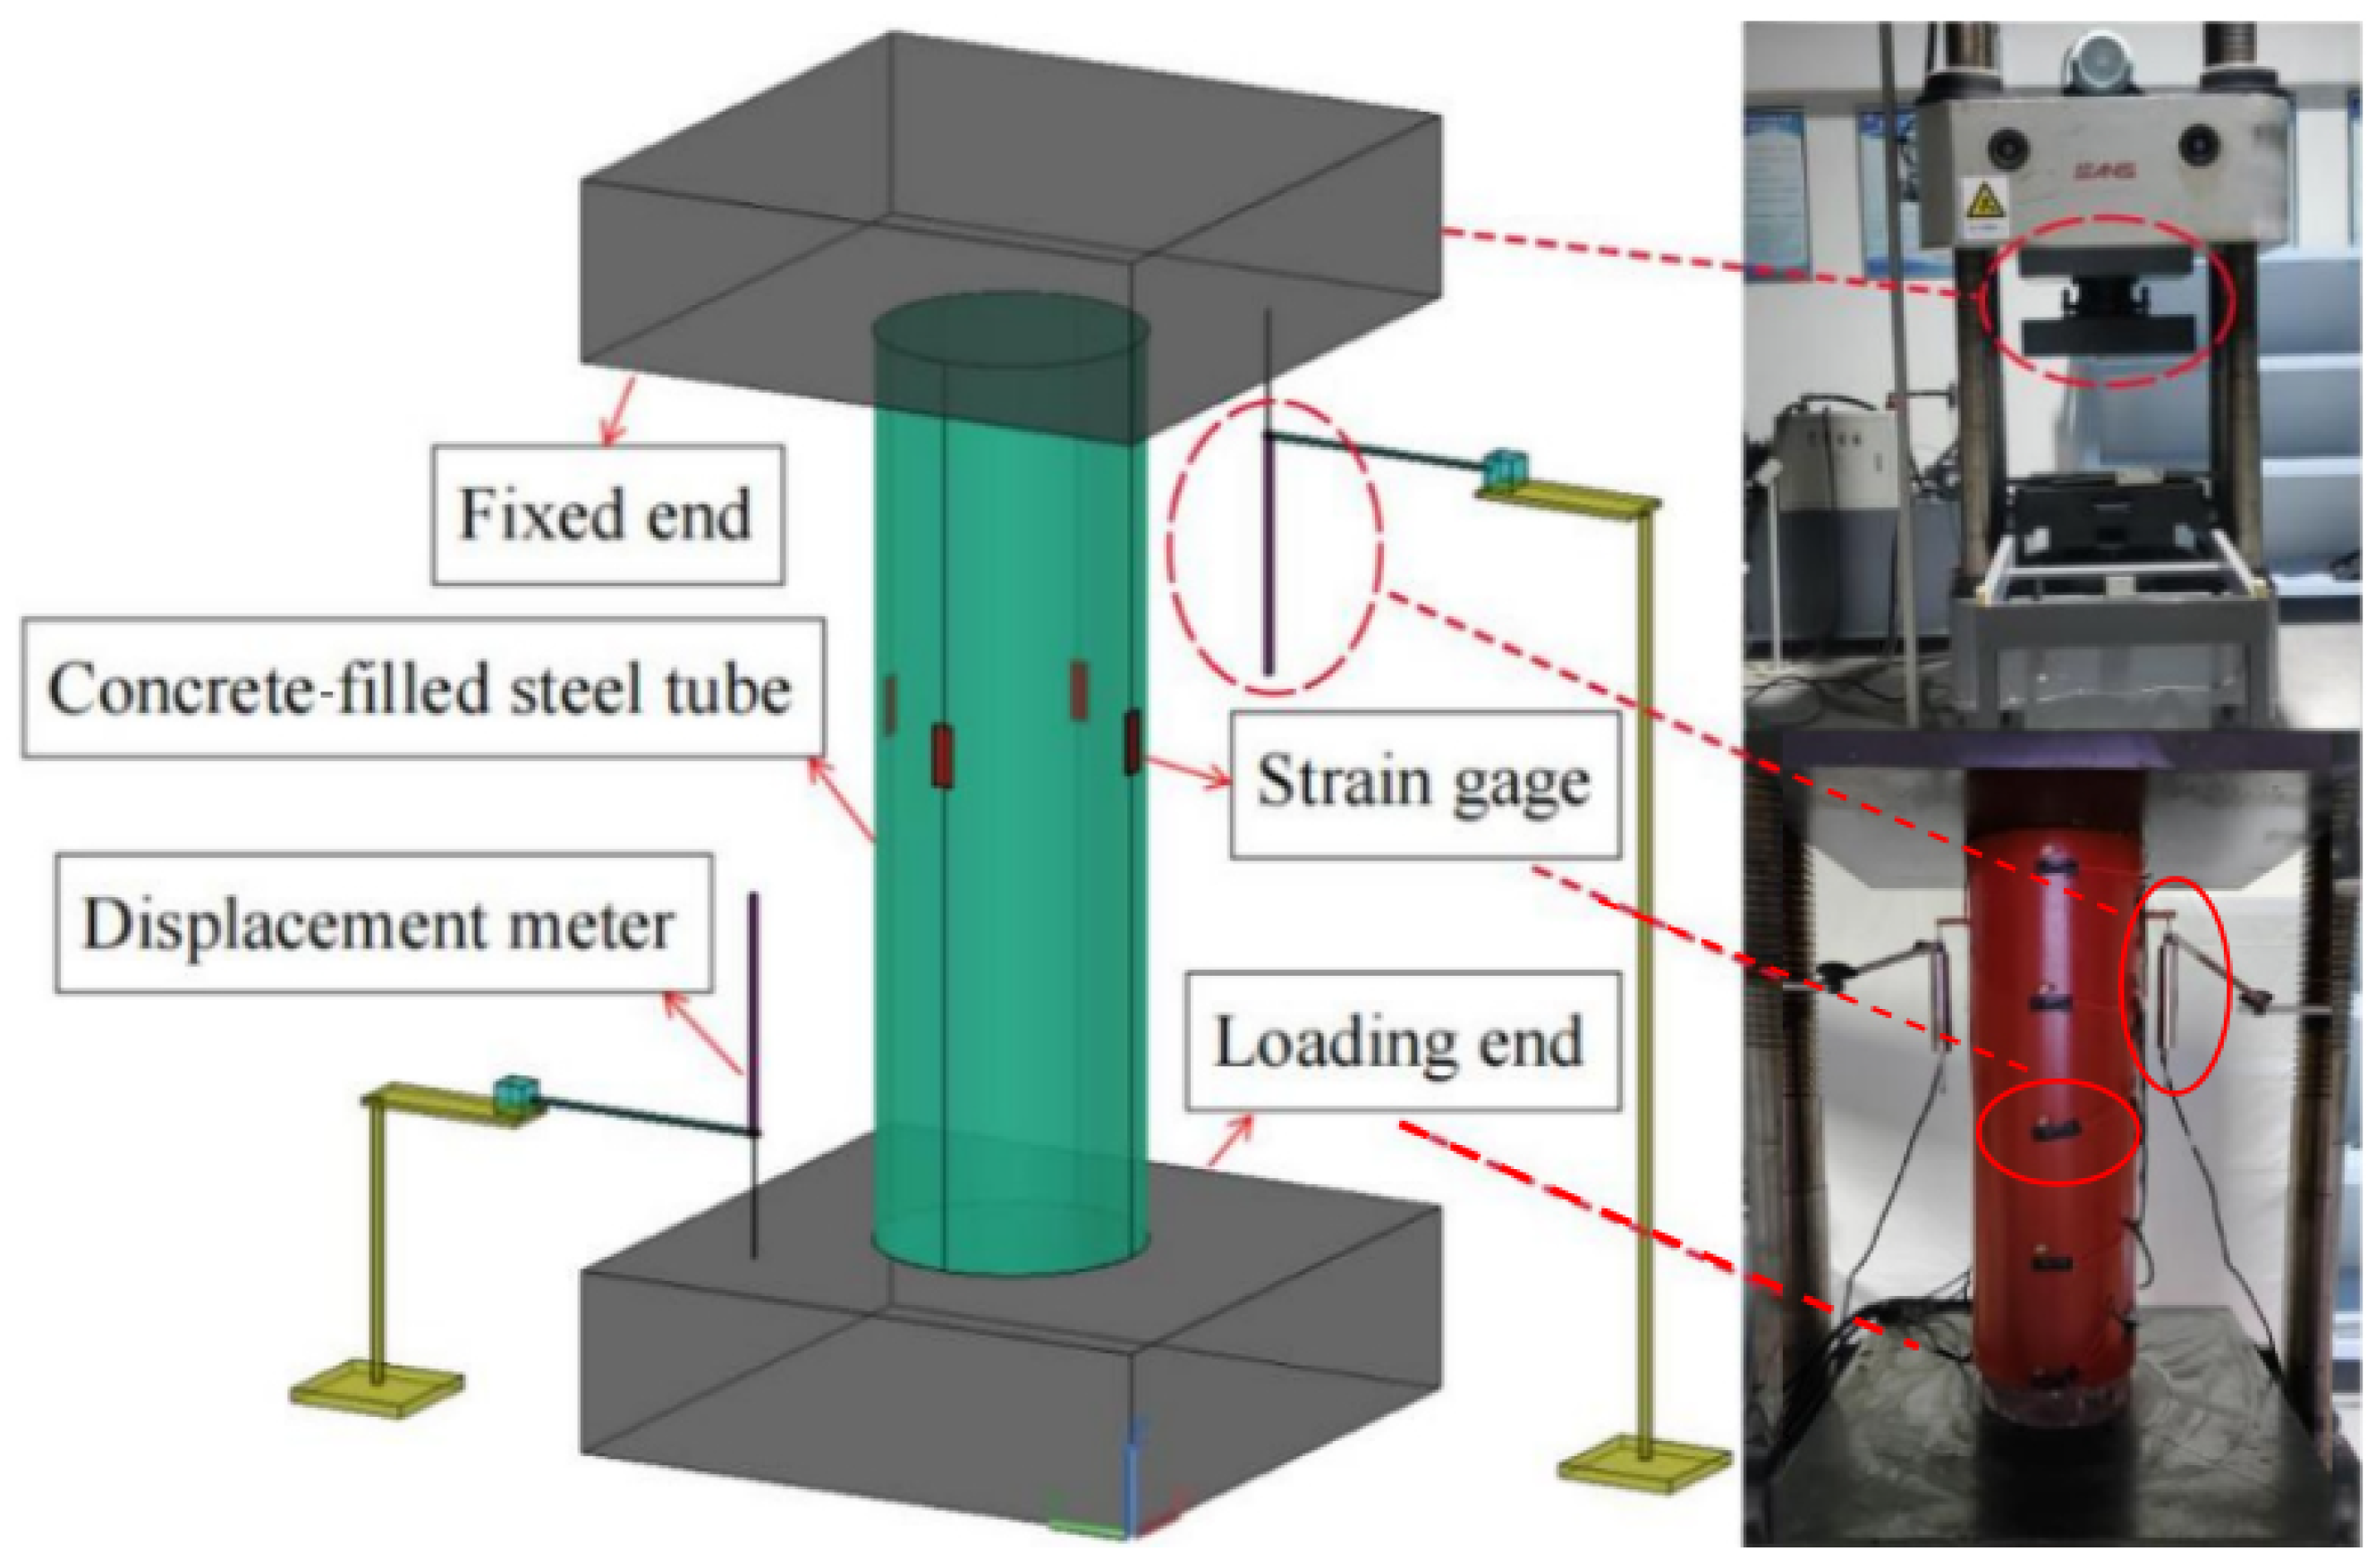
2.3. Measuring Point Arrangement and Loading Scheme

The bond–slip push-out test of geopolymer concrete-filled steel tube specimens was conducted using a 5000 kN electro-hydraulic servo universal testing machine for loading, as illustrated in Figure 2. The specimen was located in the middle of the loading testing machine. The top of the specimen was fixed and could not move. The bottom of the specimen was the loading end. Prior to formal loading, pre-loading was performed with a 10 kN load applied to the specimen for one minute to ensure proper contact with the loading equipment. Following confirmation of correct data acquisition, the specimens were completely unloaded, and the formal loading test commenced under displacement-controlled continuous loading at a rate of 0.4 mm/min. The test was halted and deemed complete when the slip amount of the specimen reached 40 mm.
The position and configuration of strain gauges are divided into two categories based on specimen height: (1) For 350 mm specimens, 6 strain gauges were placed—three at 25 mm from the loading end, the middle, and 25 mm from the fixed end, with the other three rotated 90° clockwise along the steel tube. (2) For 650 mm specimens, 10 strain gauges were used. The positions are, respectively, 25 mm away from the loading end, 175 mm away from the loading end, at the middle position of the specimen, 25 mm away from the fixed end, and 175 mm away from the fixed end. And then, the steel pipe is rotated 90° clockwise and another 5 strain gauges are attached. Strain data were gathered using the static strain test system (DH3816N).

3. Test Results and Analysis
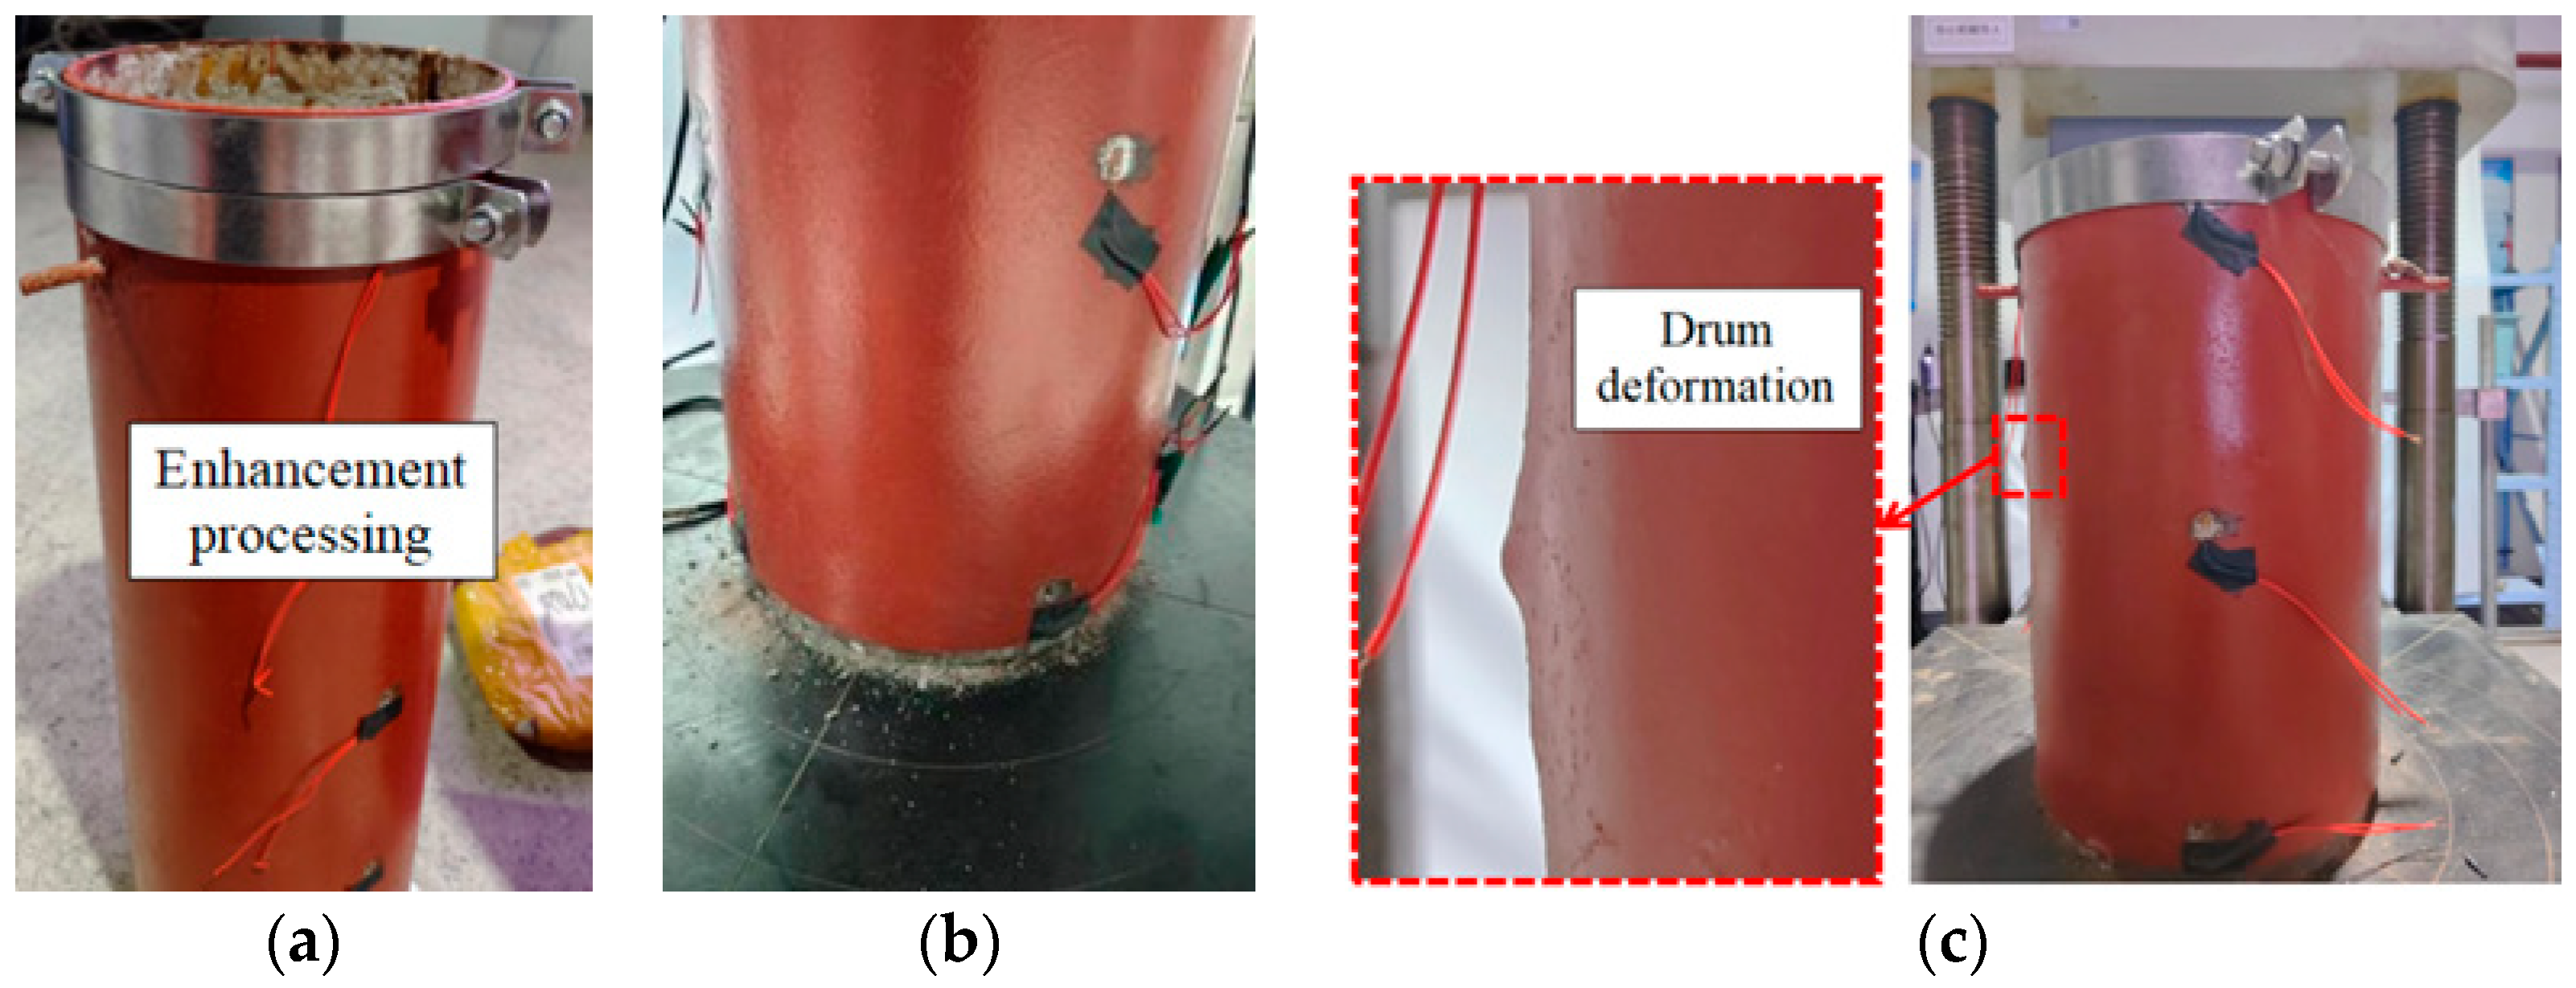
3.1. Test Phenomena

Test phenomena are shown in Figure 3. A continuous jingling sound is observed within the specimen without structure. The sound intensity increases with the load until reaching its peak load, after which it gradually decreases. A specimen with a welded stud structure produces louder sounds than one without any structure. Upon reaching peak load, a distinct ‘bang’ sound is generated due to shear failure of the stud structure, followed by a continuous decrease in load. The test observation of the welded ring rib structure specimen resembles that of the welded stud structure specimen, but the sound intensity prior to peak load is higher and denser. The behavior of the welded stud structure specimen is akin to that of a welded stud structure specimen. Notably, due to the slender wall thickness of the steel tube in this evaluation, local buckling is prone to occur in specimens with welded structures at the reserved gap of the steel tube. The GC50-H1 specimen experiences local buckling, indicating the efficacy of welding structures in preventing concrete slip. To mitigate such occurrences, the fixation at the end position is reinforced. Subsequent to testing, visible concrete debris is found under the loading end of each specimen. The welded ring rib structure specimen exhibits the most concrete drop, while the specimens without any structural measures have the least drop. At the position of the welded stud, noticeable buckling of the steel tube is observed.

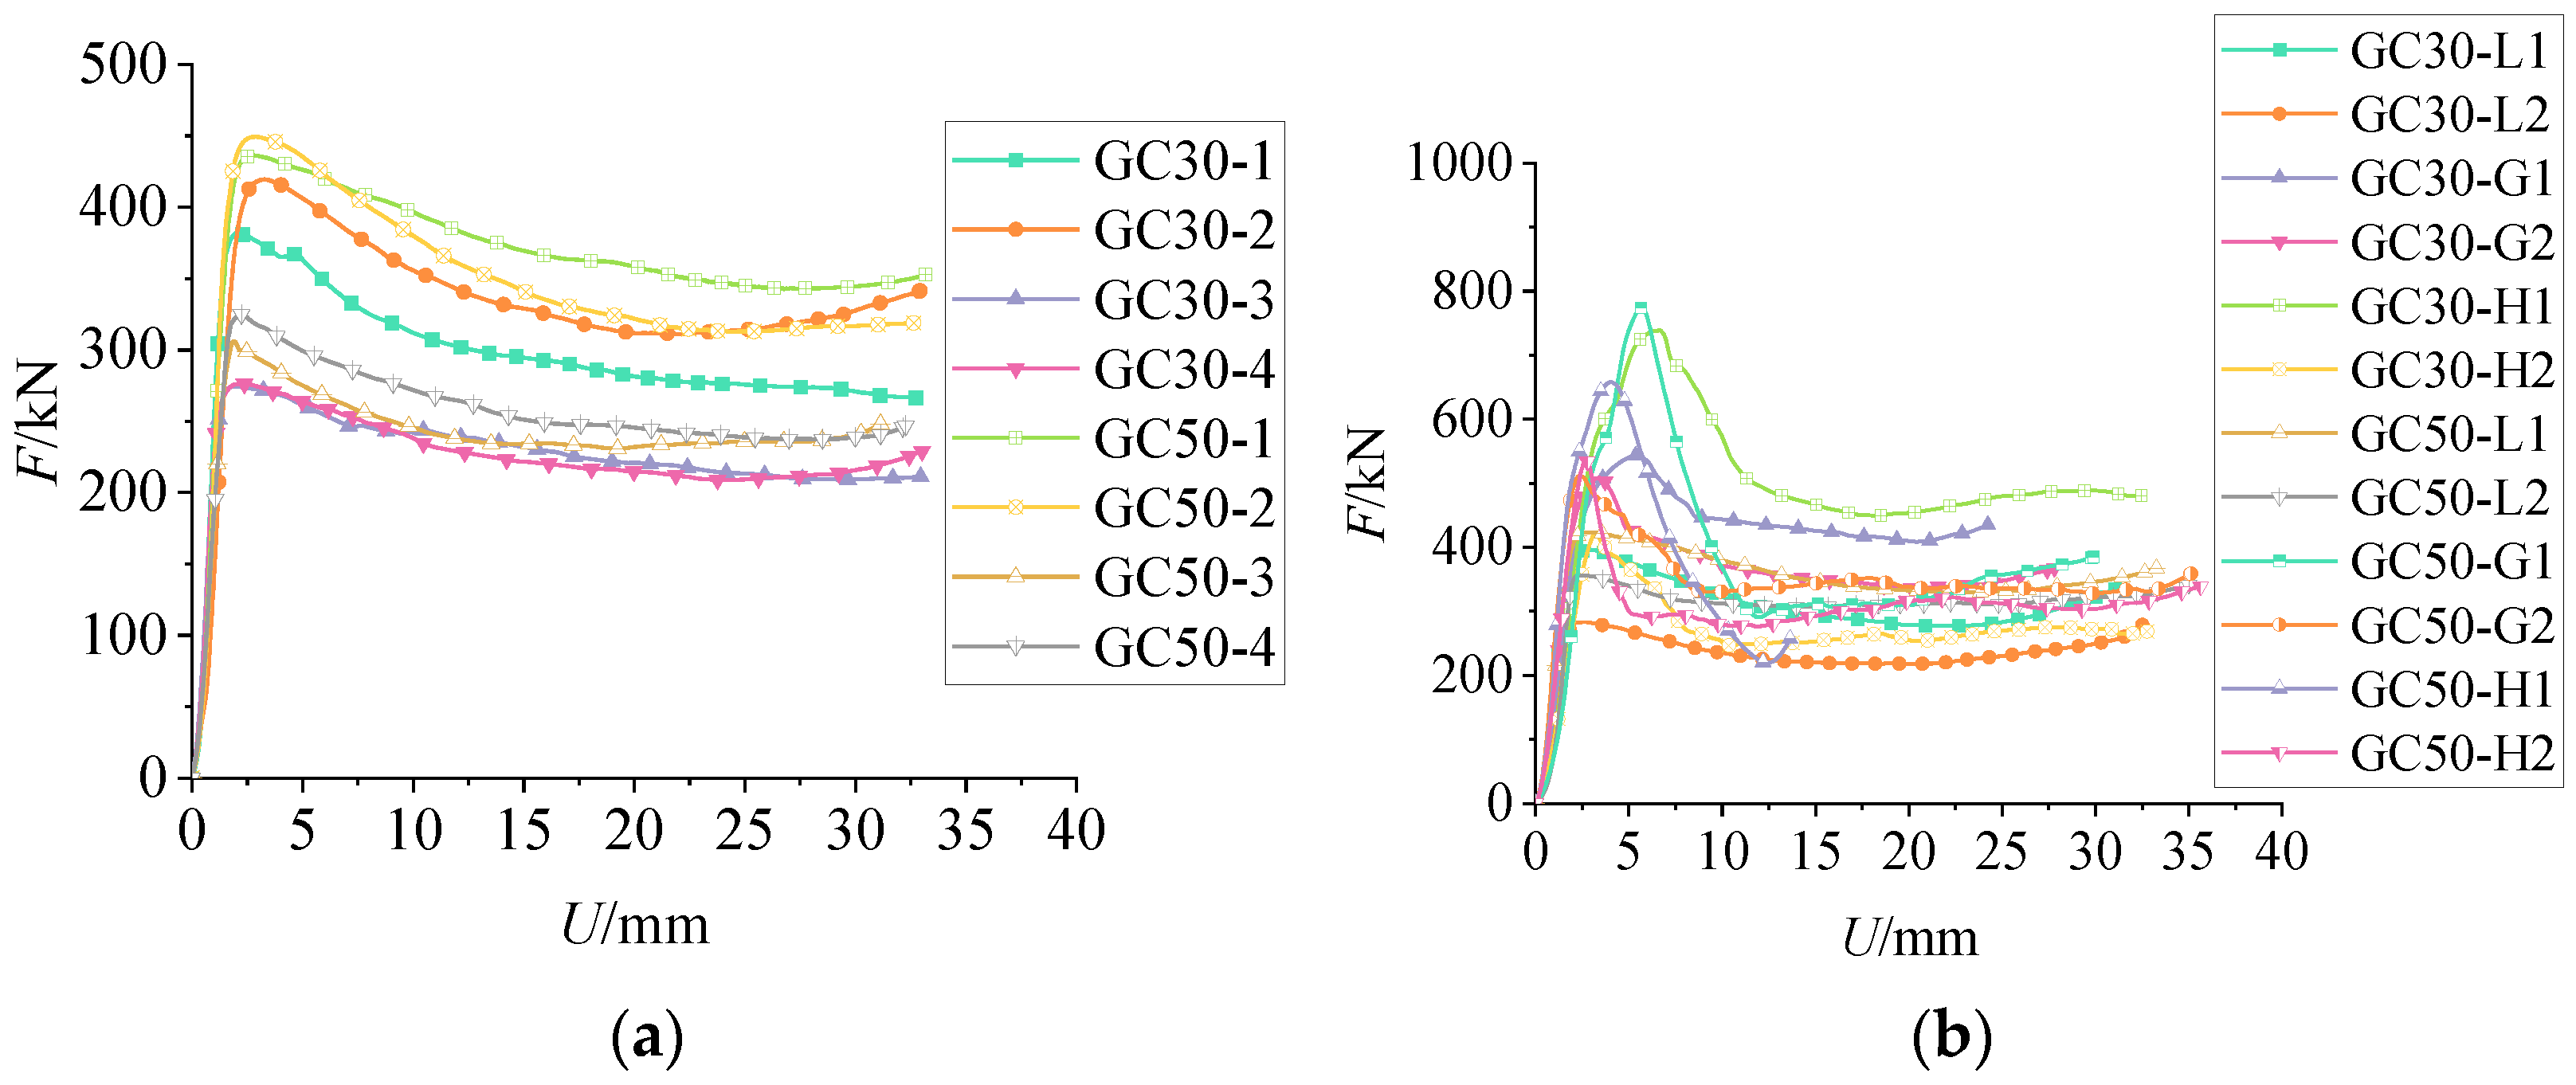
3.2. Load–Slip Curves

The stress experienced by each specimen during loading can be directly observed through the load–slip curves, aiding in the analysis of bonding mechanisms at different stages of the push-out process. Figure 4 illustrates the load–slip curves for each specimen, where the vertical axis F represents the load in kN, and the horizontal axis s represents the slip in mm.
It is evident from Figure 4 and Table 3 that the following are true:
(1) Specimens with small diameter–thickness ratio and large length–diameter ratio exhibit an increase in the hoop coefficient as the wall thickness of the steel tube increases [26,27]. This refinement significantly augments the lateral confinement exerted by the steel tube on the geopolymer concrete. As a result, there is a notable escalation in both the mechanical interlock and the frictional forces at the interface, thereby enhancing the specimens’ interfacial adhesion. The empirical data reveal that an increment in the steel tube’s wall thickness from 3.5 mm to 4.5 mm induces a substantial enhancement in the peak bond failure load for specimens with a length–diameter ratio of 2.74. In the case of the GC30-1 specimen, which possesses a concrete strength grade of C30, the peak load has been observed to rise from 382.13 kN to 419.59 kN, reflecting a commendable 9.81% improvement.
(2) Strengthening the core concrete substantially amplifies the peak and residual slip loads of the specimen. Additionally, it imparts a modest elevation to the gradient of the ascending curve segment. Upon fortifying the concrete strength in specimens GC30-1 and GC30-3, the peak load witnessed a commendable ascent from 382.13 kN to 436.46 kN and from 274.54 kN to 306.12 kN, respectively, signifying an increase of 14.2% and 11.5%. The trajectory of each specimen’s curve illustrates that augmenting the core concrete strength markedly augments the residual slip load. This enhancement is predominantly ascribed to the enhanced density of the concrete, which in turn elevates the friction coefficient at the core concrete interface. As a result, the frictional interaction between the concrete and the steel tube is intensified, underscoring that reinforcing the core concrete can significantly bolster the interfacial bonding force between the core concrete and the steel tube.
(3) The construction measures can significantly enhance the peak load and residual slip load of the specimen. However, there will be multiple slopes in the rising section of the curve. For instance, in the case of specimen GC30-G1, the peak load is 261.24 kN higher than that of the non-structural specimen, with an increase range of 68.4%. Nonetheless, it will decrease the slope of the initial rising section of the curve, leading to multiple slopes. This phenomenon occurs because the steel bolt structure, when subjected to push-out load, experiences shear force from the core concrete along the push-out direction and tension from the outer steel tube in the opposite direction. As the push-out load persists, some of the steel bolt structures are destroyed due to the limit state, causing the curve’s slope to decrease initially and then rise toward the end of the rising section. Ultimately, once all the steel bolt structures have succumbed to failure, the specimen begins its descent from the peak load. Even in the aftermath of the steel bolt structure’s collapse, a remnant structure persists at the welded junction, which serves to augment the friction between the exterior steel tube and the core concrete. The implementation of an embedded reinforcement cage as a construction strategy can significantly reinforce the cohesiveness of the core concrete. However, its influence on the specimen’s interfacial bonding force is rather negligible. This suggests that while the reinforcement cage bolsters the overall structural integrity, it does not substantially alter the bond between the core concrete and the steel tube at the Interface.

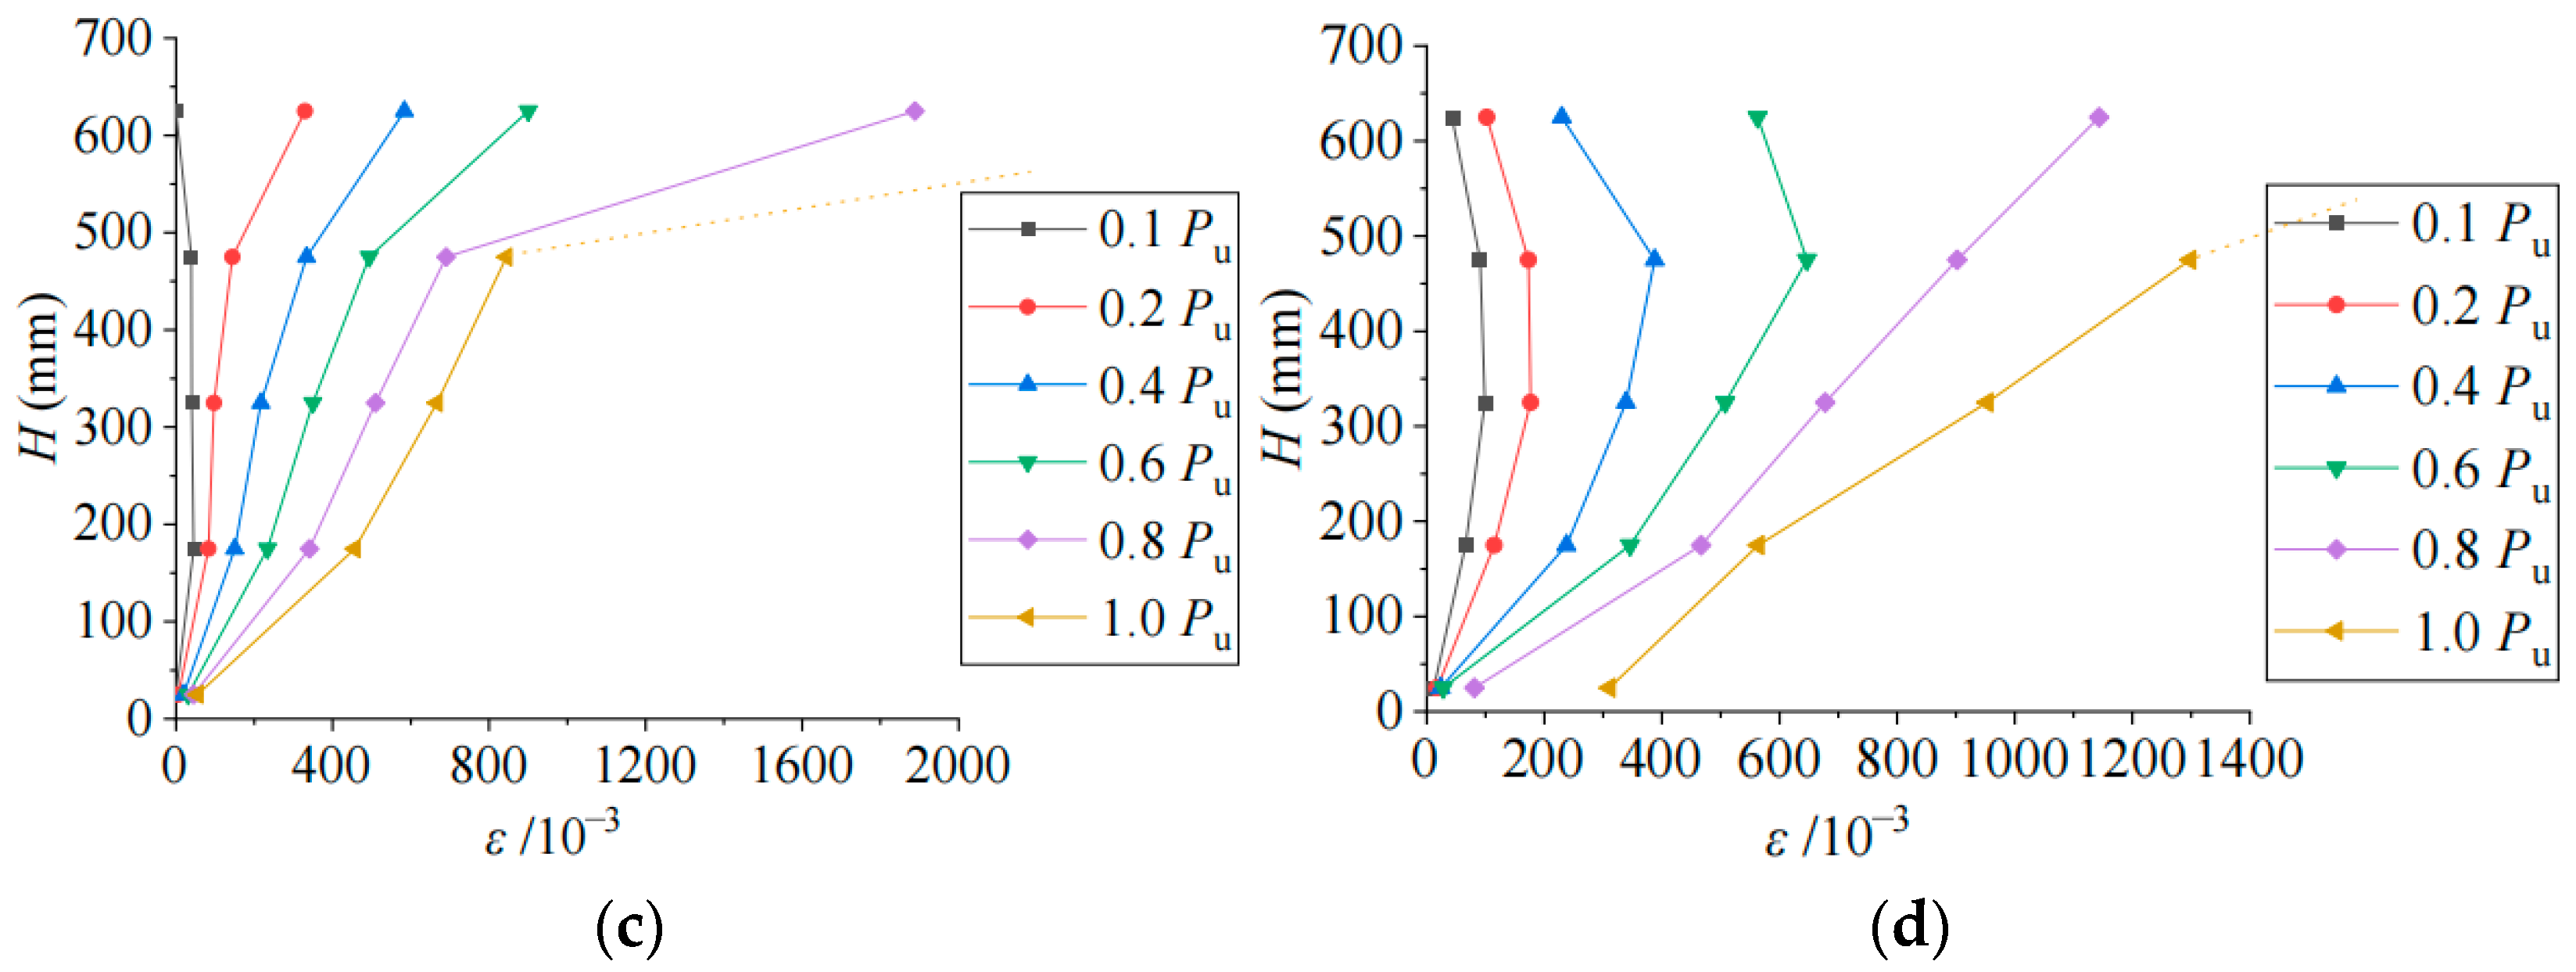
3.3. Load–Strain Curves

The load–strain curve directly indicates how the surface strain of the steel tube changes during the loading of each specimen. Analyzing the load and surface strain variations helps in understanding the bonding mechanism at each stage. In this study, structural specimens under the C30 strength grade are examined to illustrate the load–strain distribution curve, as depicted in Figure 5. The vertical axis (H) represents the specimen’s height at the strain gauge position in millimeters, while the horizontal axis indicates the longitudinal strain.
It can be seen from Figure 5 that the following are true:
(1) Specimens lacking structural measures exhibit a load–strain curve pattern of initial increase followed by decrease. The strain growth rate is higher at the midpoint compared to the free end, due to core concrete force transmission primarily through bond stress. As the load increases, the force of the core concrete on the steel tube also increases gradually, leading to strain elevation at both the midpoint and the free end. Nevertheless, the bond stress at the interface between the steel tube and the core concrete does not reach a level sufficient to induce yield failure at the free end of the unencumbered steel tube. As a result, the strain variation observed at the free end is considerably less pronounced than that at the specimen’s midpoint. This indicates that the stress distribution along the length of the specimen is not uniform, with the midpoint experiencing greater deformation under load.
(2) Welded studs and ring-stiffened specimens display an inverted triangle trend in the load–strain curve. Significant strain increase occurs at the structural position in the specimen’s middle and free end with load escalation, but the rate at the free end surpasses that at the midpoint. This phenomenon can be attributed to the heightened shear forces within the concrete at the juncture of the welded construction measure under conditions of increased load. This leads to a progressive escalation in tensile forces exerted on the outer steel tube at the site of the measure. Thus, strain amplification arises until structural measures fail, causing slip between core concrete and steel tube, and eventual interface bonding failure. The addition of structural measures at the free end extensively enhances shear capacity, with load-bearing predominantly through the free end empty steel tube until comprehensive core concrete slippage and interface bond failure in the specimen.

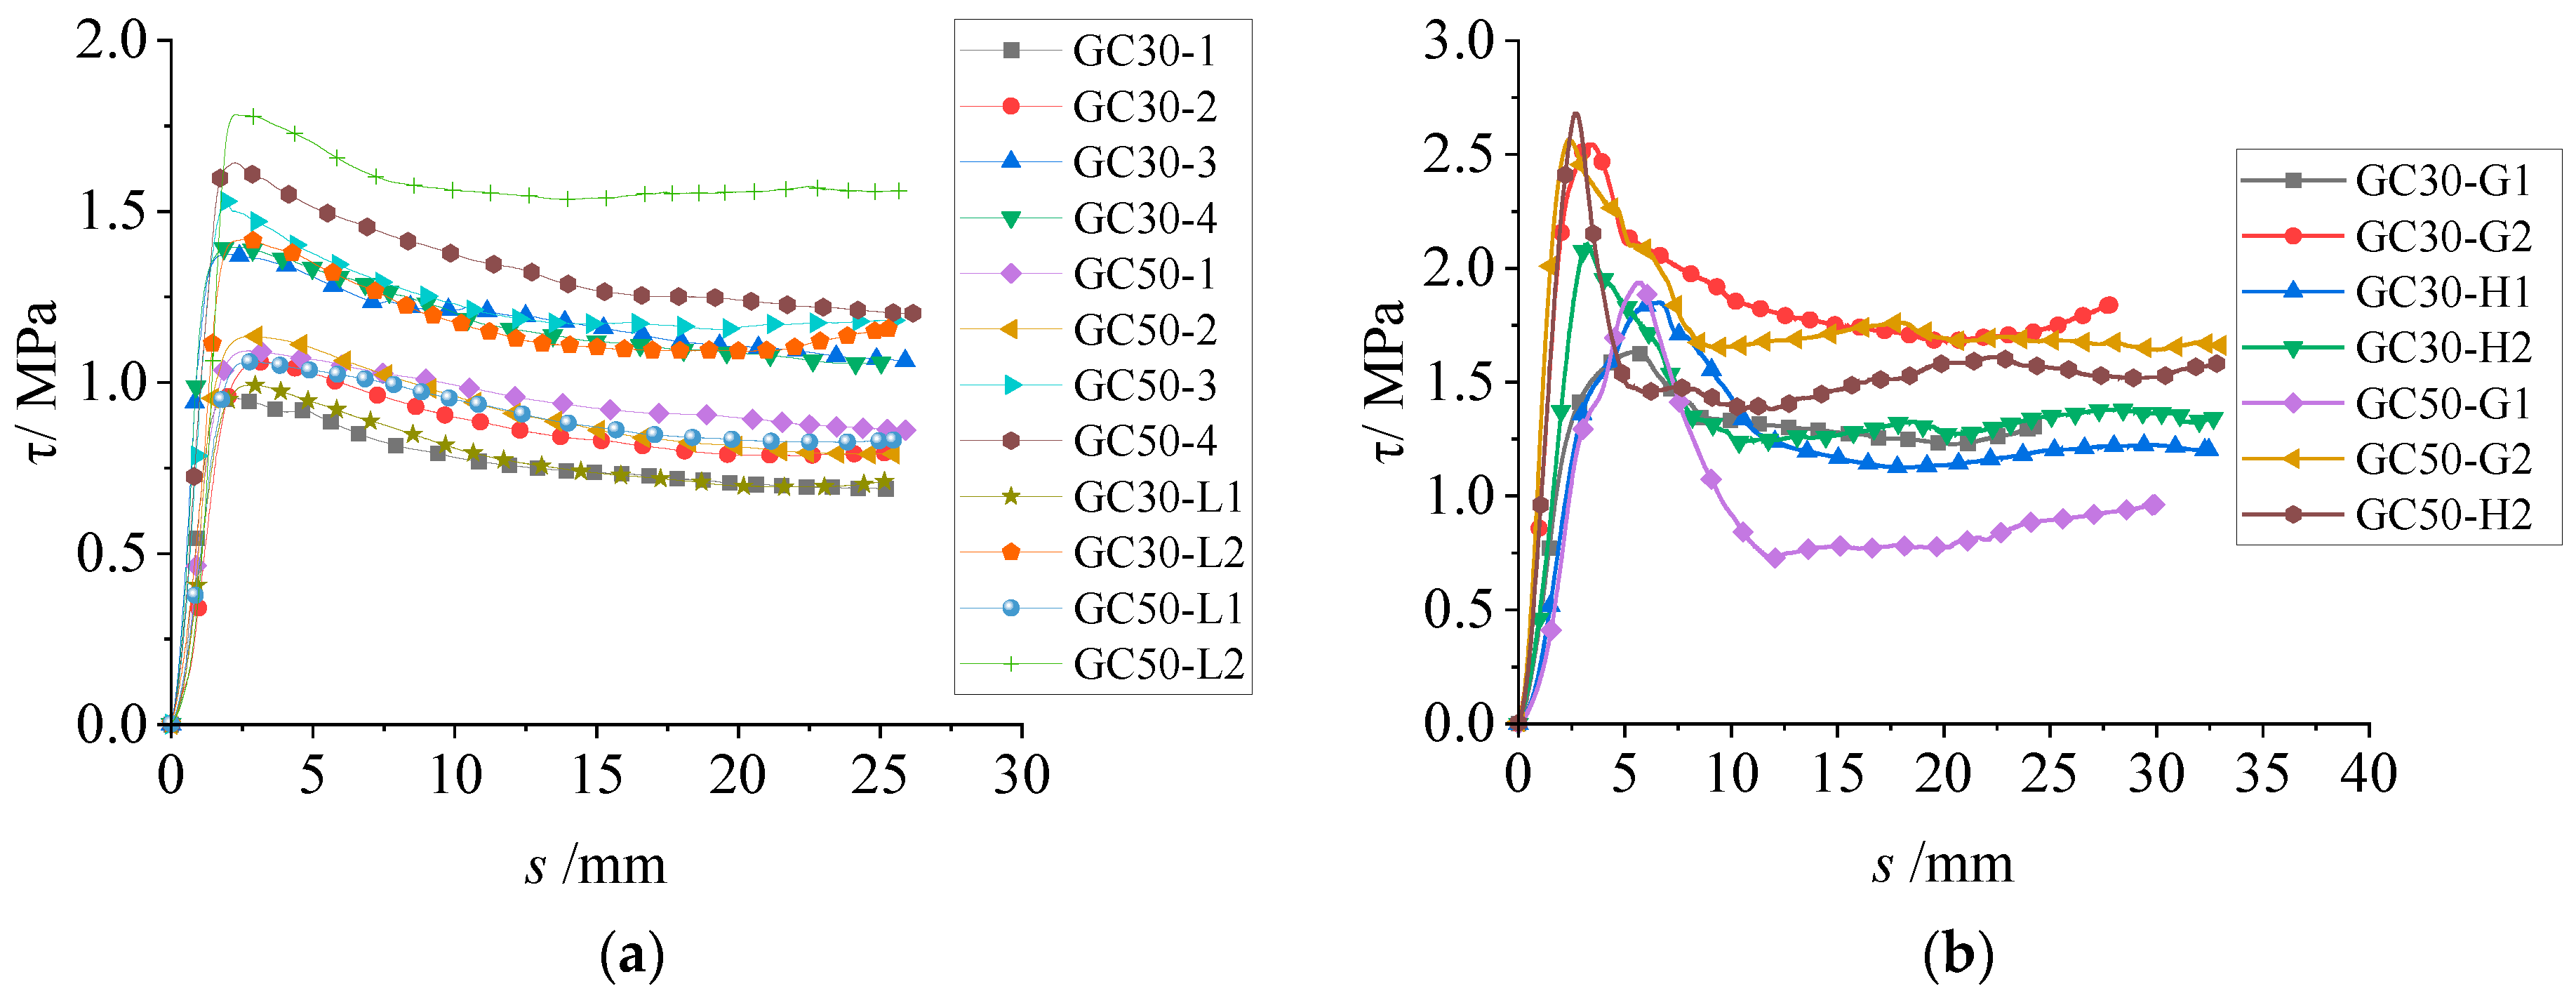
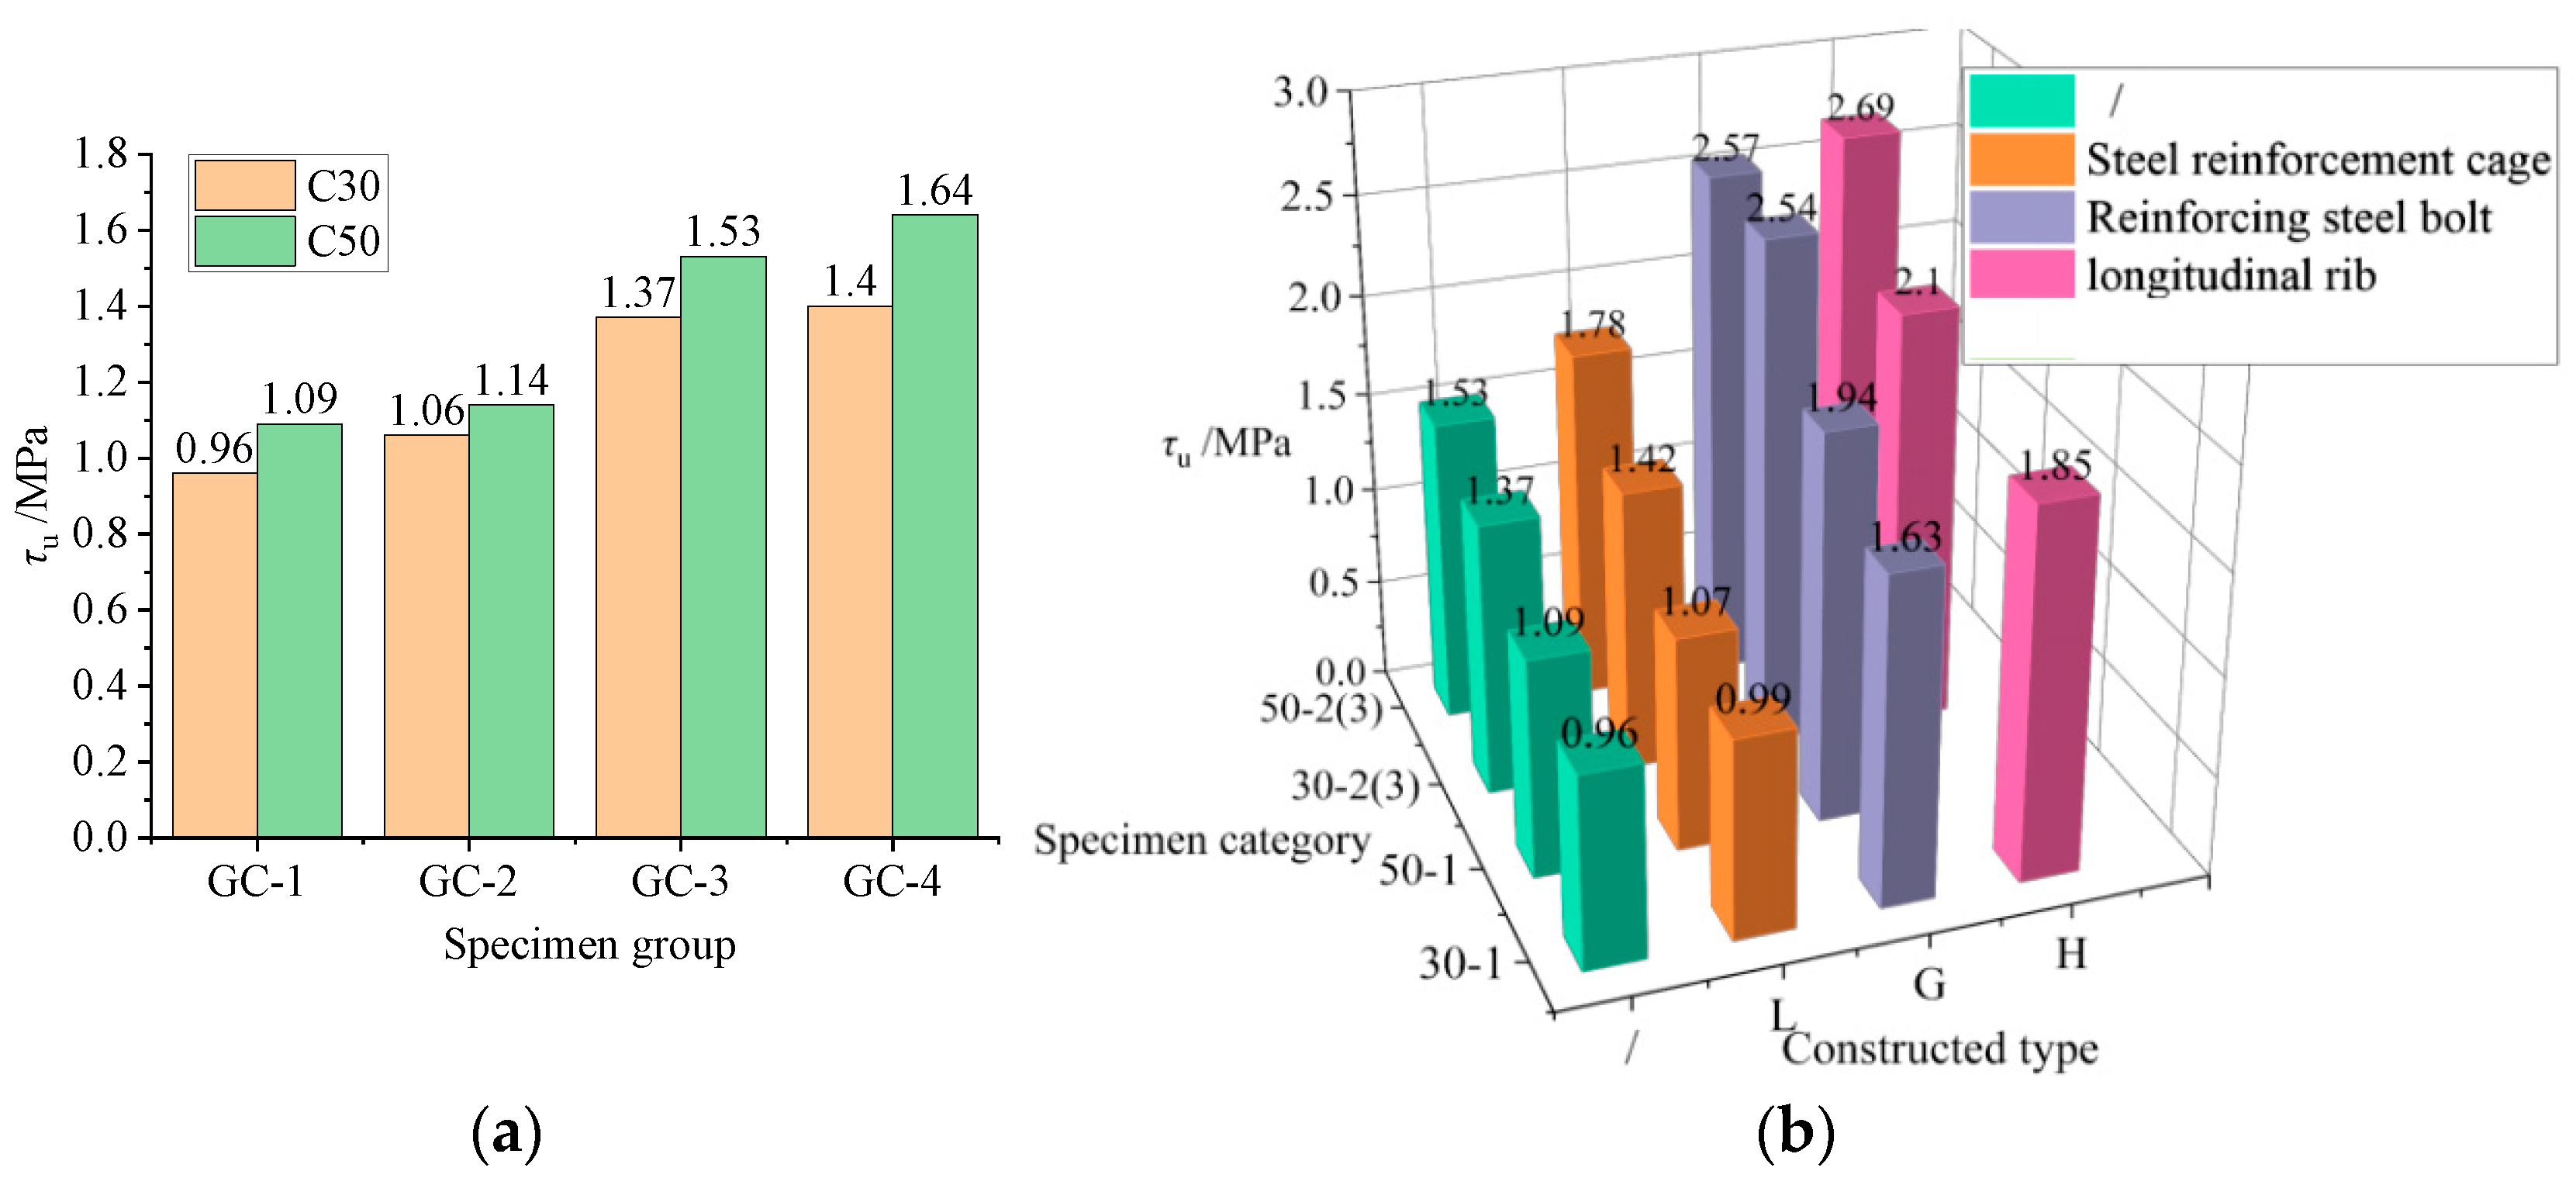
3.4. Bond Strength–Slip Curve

The interfacial bonding performance of geopolymer concrete-filled steel tubes can be measured by bonding strength. To simplify the analysis of the bonding performance and minimize computational complexity, this study hypothesizes that the bonding stress is uniformly distributed across the interface between the steel tube and geopolymer concrete. The bond strength between steel tube and geopolymer concrete along the interface can be defined as follows [23]:
τ = P A
In the equation, P is the push-out load and A is the effective bonding area between the inner wall of the steel tube and the geopolymer concrete. Curves of the concrete-filled steel tube specimen are shown in Figure 6.
In order to more effectively compare the impact of various parameters on the shear bond strength of the specimen interface, the specimens are segregated into two categories with and without structure for generating a histogram, as illustrated in Figure 7.
It can be seen from Figure 7 that the following are true:
(1) Adjusting parameters such as the length–diameter ratio, diameter–thickness ratio, and concrete strength, along with the integration of diverse internal structural enhancements, can elicit a spectrum of effects on the bond strength of the specimens. For specimens without structural enhancements, enhancing the concrete strength significantly enhances the average bond strength of the specimens. Upon upgrading the concrete strength from C30 to C50 in specimens GC-1, GC-2, GC-3, and GC-4, the bond strength rises by 13.5%, 7.5%, 11.7%, and 17.1%, respectively, showcasing substantial enhancements and signifying a positive correlation between concrete strength enhancement and the average bond strength. The specimens’ bond strength surges by 42.7%, 32.1%, 40.4%, and 43.9%, respectively, when reducing the aspect ratio of the GC-1 and GC-2 groups to 2.74 and the GC-3 and GC-4 groups to 1.37, emphasizing that diminishing the aspect ratio significantly boosts the bond strength of the specimens. Upon increasing the wall thickness from 3.5 mm to 4.5 mm, each group’s specimens experience a bond strength increase of 10.4%, 4.6%, 2.2%, and 7.2%, respectively. Although the reduction in the diameter–thickness ratio in this experiment led to only marginal improvements in the bond strength of each specimen due to the narrow reduction span, it can be Interpreted that reducing the diameter–thickness ratio enhances the specimens’ bond strength. The primary factor is the diminished diameter–thickness ratio of the specimen, amplifying the lateral restraint effect of the outer steel tube on the core concrete.
(2) The inclusion of welding studs and ring ribs leads to a significant enhancement in the bond strength of the specimens. This enhancement is predominantly credited to the welding construction techniques that bolster the shear resistance of the specimens, consequently elevating the peak load capacity of each specimen. Despite the unchanged bond area between the core concrete and the steel tube, the calculated bond strength is elevated. Introducing reinforcement cage construction measures to specimens with a length–diameter ratio of 2.74 resulted in a 3.1% and 1.9% increase in the bond strength of two strength specimens, respectively, with negligible impact. Conversely, applying the reinforcement cage structure to the specimen with a length–diameter ratio of 1.37 resulted in a notable 3.6% and 16.3% increase in bond strength, surpassing the improvement seen in specimens with a length–diameter ratio of 2.74. This significant enhancement is due to the steel cage structure integration in the core concrete, which enhances the overall integrity of the core concrete. During the curing stage, the core concrete tends to move closer to the steel cage, causing reduced concrete shrinkage and influencing the bonding performance of the steel tube geopolymer concrete. Specimens with larger aspect ratios tend to exhibit a marginally higher degree of concrete shrinkage, which in turn leads to a more significant adverse effect on the bond’s performance. However, when the beneficial influence of the steel cage structure is taken into account, specimens with smaller aspect ratios actually witness a more pronounced enhancement in bond strength.

4. Bond–Slip Constitutive Relation

At present, there is no corresponding standard for the geopolymer concrete-filled steel tube. The study provides a theoretical basis for the application of geopolymer concrete-filled steel tube in engineering.

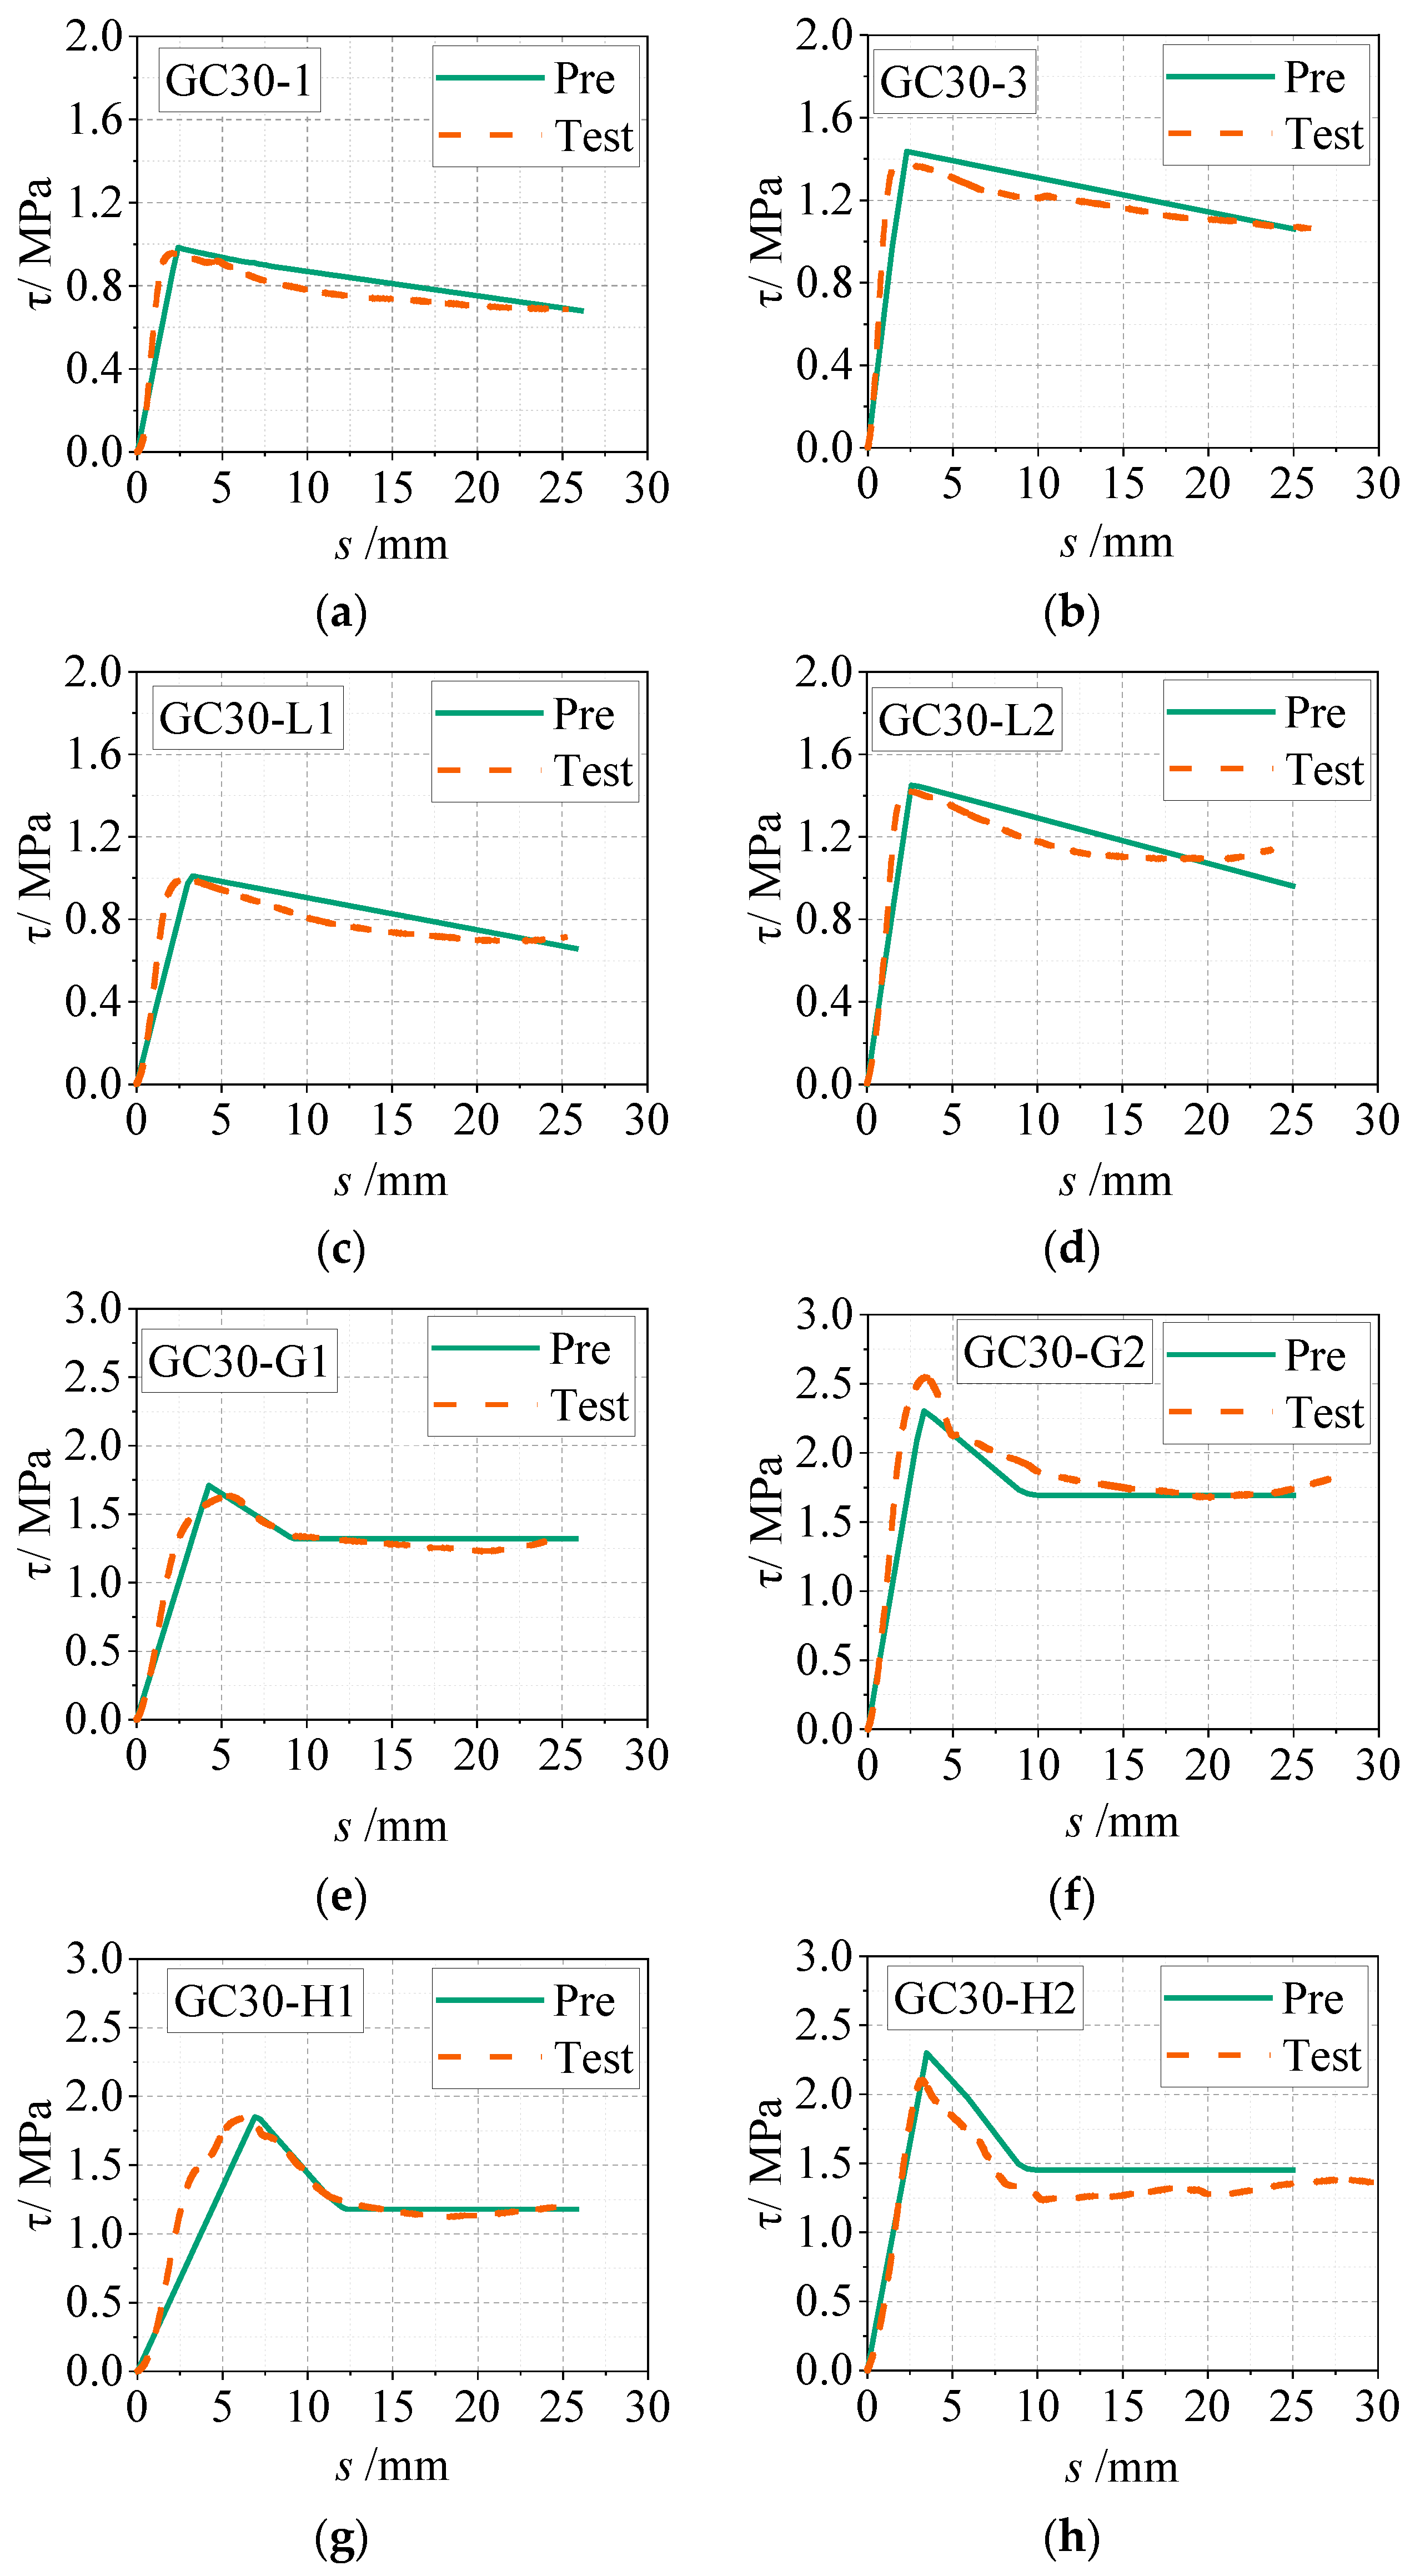
4.1. Establishment of Bond–Slip Constitutive Relation

The development of the constitutive relation equation not only advances the exploration of the bonding mechanism between steel tube and geopolymer concrete but also offers essential parameters for finite element software simulations [6,28]. In this study, the bond–slip constitutive relationship equations concerning steel tube and geopolymer concrete are separately revised for structures with and without reinforcement.
From Figure 6, it is apparent that the behavior of samples lacking welding structures and those with embedded reinforcement cage structures conforms to a two-stage pattern, culminating in the development of a two-stage bond–slip constitutive relationship:
τ 1 = τ u , c 1 s 1 / s u , c 1 τ u , c 1 τ u , c 1 τ r 1 s 1 s u , c 1 / s r 1 s u , c 1 0 < s 1 s u , c 1 s u , c 1 < s 1 s r 1 .
In the equation, τ 1 represents the adhesive force between the test sample lacking weld structure and the sample with an embedded steel cage arrangement. s 1 denotes the core concrete movement corresponding to it. τ r 1 signifies the remaining bond strength, with the least residual slip segment value being considered in this study. τ u , c 1 stands for the related movement. τ u , c 1 and s u , c 1 are the computed values for maximum bond strength and corresponding displacement, respectively. Through regression analysis, the formula is articulated as follows:
τ u , c 1 = 1.978 + 0.008 f cu 0.336 L D 0.005 D t
s u , c 1 = 5.406 + 0.06 f cu + 0.204 L D 0.061 D t .
Similarly, from Figure 6, it can be seen that the τ 2 curve trend of welded studs and ring rib structural measures can be roughly divided into three stages, and a three-stage bond–slip constitutive relationship can be established as follows:
τ 2 = τ u , c 2 s 2 / s u , c 2 τ u , c 2 τ u , c 2 τ r 2 s 2 s u , c 2 / s r 2 s u , c 2 α τ u , c 2 0 < s 2 s u , c 2 s u , c 2 < s 2 s r , c 2 s 2 s r , c 2 .
In the equation, τ 2 is the bond strength between the welding stud and the ring rib structure specimen. τ u 2 is the ultimate bond strength. s u 2 is the corresponding displacement. s 2 is the corresponding core concrete displacement. τ r 2 is the residual bond strength, and the minimum value of the residual slip section is taken in this article. s r 2 is the corresponding displacement. τ u , c 2 and s u , c 2 are the calculated values of peak bond strength and corresponding displacement, respectively. Among them, s u , c 2 = τ u , c 2 · s u 2 / τ u 2 , s r , c 2 = τ u , c 2 τ r , c 2 · s r 2 s u 2 / τ u 2 τ r 2 + s u , c 2 .
Nevertheless, the bond strength τ u , c 2 in Equation (5) cannot be calculated directly by a simple fitting formula, as it is dependent on the shear yield value of such structures or the occurrence of shear or crushing failure in the core concrete. Based on existing research, the specimens of steel stud structures and ring rib structures can be individually evaluated.

4.2. Calculation of Shear Bearing Capacity of Shear Structural Measures

4.2.1. Structural Specimens with Steel Studs

In reference [29], Equations (6) and (7) delineate the shear failure of studs and the shear failure or crushing of concrete, respectively. The shear bearing capacity of an individual stud shear member is specified, and the lesser value is selected.
N v c = 1.19 A s f std E c E s 0.2 f cu f std 0.1
N v c = 0.43 η A s E c f c
The design value for axial compressive strength of concrete (MPa) is denoted by f cd . The design value for ultimate tensile strength (MPa) of the steel bolt is denoted by f std . η represents the reduction coefficient of group stud effect. In the case of 6 < L d d < 13 for C30 to C40 concrete, η = 0.021 L d d + 0.73 (where L d is the longitudinal spacing of studs, d is the diameter of studs, and the unit is mm). For C45 and C50 concrete, η = 0.0161 L d d + 0.8 . For C55 and C60 concrete, η = 0.0131 L d d + 0.84 . When L d / d 13 , without considering the group stud effect, the value is taken as 1.0.
In addition to evaluating the shear strength of steel studs and enhancing the shear strength of the bonding interface, one must also take into account the welding defect coefficient λ 1 of steel studs and the inner wall of the steel tube when calculating the bearing capacity of steel tube geopolymer concrete reinforced stud specimens. The establishment of the defect coefficient primarily addresses the imperfections at the weld location resulting from the absence of a proper welding process during specimen manufacturing, leading to the presence of some steel studs at the weld location experiencing shear force and undergoing shear failure, which impacts the shear resistance of steel studs. This leads to the derivation of the following formula:
N v c = 0.43 λ 1 η A s E c f c .
In the equation, N v c represents the shear carrying capacity of the steel stud structure in the steel tube geopolymer concrete specimen. η represents the coefficient for reducing the group nail effect, which is not taken into account in this study, and is assumed to be 1.0. λ 1 denotes the coefficient for welding defects between the steel stud and the inner wall of the steel tube. A value of 0.55 is adopted through regression fitting in this study.

4.2.2. Structural Specimens with Steel Studs

Similarly to the calculation method of the shear bearing capacity of the welded steel stud structure specimen above, for the welded ring rib structure of the steel tube geopolymer concrete specimen, the shear bearing capacity is mainly composed of the ring rib structure or the concrete shear failure. However, there are few studies on the shear capacity of the welded ring rib structure in the steel tube. Zhang et al. [28] believed that if the thickness of the ring rib is thin and the projection area is large, the ring rib structure may yield first. Therefore, it is suggested that the smaller value of the core concrete bearing strength P S and the shear yield strength P H of the ring rib structure should be taken into account in the calculation. The calculation formulas are as follows:
P S = α c A c A d σ b
P H = ϕ t d σ y 3
P = min P S , P H .
In the equation, P H is the yield value of the shear bearing capacity of the geopolymer concrete-filled steel tube specimen with a circumferential ribbed plate. ϕ is the circumference calculated by the inner diameter of the steel tube. t d is the thickness of the ring rib structure, and σ y is the yield strength of the ring rib structure. It is recommended that the value of the circular steel tube α c is 1.3, and the value of the circular steel tube α c is 1.4.
The influence of welding defects on the specimen is not considered in the above research. However, the ring rib structure and the inner wall of the steel tube are welded by spot welding in this test, which belongs to the case of welding defects. Therefore, the ring rib will yield first, and the welding defects will be corrected by the coefficient. The revised formula is as shown in Equation (12):
P H = λ 2 ϕ t H σ H 3 .
In the equation, λ 2 is the reduction factor of welding defects, which is 0.44 in this paper. t H is the thickness of the ring rib structure. σ H is the yield strength of the ring rib structure. Since specimen GC50-1 is a failure specimen, it is not analyzed in this article.
According to the calculation results of Formulas (8) and (12), the P u , c of welded studs and ring rib specimens can be obtained, respectively, and then the τ u , c can be obtained according to Formula (1). The calculation results are shown in Table 4, and the predicted curves are consistent with the test curve shown in Figure 8.
In the future, experimental research can be carried out under the conditions of large wall thickness and good welding performance, and the calculated value should be improved.
It can be seen from Table 4 and Figure 8 that the following is true:
(1) The average, standard deviation, and coefficient of variation of the ratio between calculated and test bond strength results are 0.982, 0.050, and 0.051, respectively. The calculated values align well with the test data, with ratios falling between 0.917 and 1.098. The peak load in specimens with additional welding measures is influenced by welding quality, but the error is within ±10%. These findings corroborate the precision of the shear bearing capacity calculation formula for the welded ring rib and steel stud construction detailed in this article.
(2) The curves obtained from the test and the calculation analysis have the same development trend, the results are consistent with each other, and the calculated curve is more idealized than the test curve. Compared with the test curve, part of the simulated curve has a smaller slope in the ascending section, which is mainly related to the slight deviation from the test value obtained by the fitting analysis. The simulated interface bonding force is uniformly distributed, and the wall thickness of the steel pipe is uniform. In fact, the inner surface of the steel tube may have different wall thickness along the height direction. Moreover, the wedge effect caused by cutting results in an uneven distribution of chemical bonding force and mechanical biting force increases, which leads to a larger slope in the ascending section of the curve during the test.

5. Conclusions

(1) The interfacial bond strength of geopolymer concrete-filled steel tubes resembles that of conventional concrete-filled steel tubes, comprising chemical bonding, mechanical interlocking, and frictional resistance. Enhancing the specimen’s aspect ratio, decreasing the diameter–thickness ratio of the steel tube, enhancing concrete strength, and incorporating welding structures can boost the interfacial bond performance of the specimen.
(2) Welding structures can significantly enhance the load transfer efficiency between the core concrete and steel tube, with the ring rib structure exhibiting optimal effectiveness. Minor buckling deformation occurs at the loading end and welding structure of the outer steel tube, while non-structural specimens show no evident deformation. Steel tube strain increases along the height direction, displaying a triangular strain distribution.
(3) The methodology for calculating shear strength of specimens with welded studs and ring rib structures is provided, along with the bond–slip constitutive relationship of geopolymer concrete-filled steel tubes under various parameters. The calculated results align well with the experimental outcomes, with a ratio between 0.917 and 1.098.
(4) It is suggested to employ a two-stage constitutive relationship, consisting of a rising section and steady descending section, for the bond–slip interface of specimens lacking welding structures. For interfaces with welded steel studs and ring ribs, a three-stage constitutive relationship comprising rising, falling, and stationary sections is recommended. The predicted curve closely matches the measured load–slip curve, with a peak load error below 10%.
(5) In this study, the steel tube features a slender wall thickness, classifying it within the realm of thin-walled steel tubes, and is subject to imperfections in the welding process. Consequently, subsequent analyses aimed at enhancing the bond–slip performance at the concrete-filled steel tube interface will be pivotal. These analyses will extend to the examination of concrete-filled steel tube specimens with thicker walls, thereby imposing more stringent demands on the welding techniques employed. This progression underscores the necessity for advanced welding methodologies to meet the elevated standards required for thicker-walled applications.

Author Contributions

Conceptualization, F.Y.; methodology, D.L. and L.L.; investigation, D.L. and L.L.; data curation, C.W.; writing—original draft preparation, D.L. and L.L.; writing—review and editing, H.S. and G.L. All authors have read and agreed to the published version of the manuscript.

Funding

Fei Yang acknowledges the supports from the Discipline Young Master Tutor Program of Zhongyuan University of Technology under grant number (No. SD202425).

Data Availability Statement

The data used to support the findings of this study are included within the article.

Conflicts of Interest

Author Guanru Lv was employed by the company Ruyang County Gongxin Logistics Management. The remaining authors declare that the research was conducted in the absence of any commercial or financial relationships that could be construed as a potential conflict of interest.

References

  1. Pacheco-Torgal, F.; Castro-Gomes, J.; Jalali, S. Alkali-activated binders: A review: Part 1. Historical background, terminology, reaction mechanisms and hydration products. J. Constr. Build. Mater. 2008, 22, 1305–1314. [Google Scholar] [CrossRef]
  2. Kaliyavaradhan, S.K.; Ling, T.C. Potential of CO2 sequestration through construction and demolition (C&D) waste-An overview. J. CO2 Util. 2017, 20, 234–242. [Google Scholar] [CrossRef]
  3. Xuan, D.; Zhan, B.; Poon, C.S.; Zheng, W. Carbon dioxide sequestration of concrete slurry waste and its valorisation in construction products. J. Constr. Build. Mater. 2016, 113, 664–672. [Google Scholar] [CrossRef]
  4. Han, L. Concrete Filled Steel Tube Structure—Theory and Practice; Science Press: Beijing, China, 2016. [Google Scholar]
  5. Han, L.-H.; Li, W.; Bjorhovde, R. Developments and advanced applications of concrete-filled steel tubular (CFST) structures: Members. J. Constr. Steel Res. 2014, 100, 211–228. [Google Scholar] [CrossRef]
  6. Chen, L.; Dai, J.; Jin, Q.; Chen, L.; Liu, X. Refining bond-slip constitutive relationship between checkered steel tube and concrete. J. Constr. Build. Mater. 2015, 79, 153–164. [Google Scholar] [CrossRef]
  7. Robinson, M.J.; Melby, I.H. Effects of bonding in short-span rectangular concrete filled GFRP tubes. Compos. Struct. 2015, 133, 131–139. [Google Scholar] [CrossRef]
  8. Qu, X.; Chen, Z.; Nethercot, D.A.; Gardner, L.; Theofanous, M. Load-reversed push-out tests on rectangular CFST columns. J. Constr. Steel Res. 2013, 81, 35–43. [Google Scholar] [CrossRef]
  9. Kilpatrick, A.E.; Rangan, B.V. Influence of interfacial shear transfer on behavior of concrete-filled steel tubular columns. ACI Struct. J. 1999, 96, 642–648. [Google Scholar] [CrossRef]
  10. Zhao, H.; Li, J.; Wang, R.; Lam, D.; Zhang, Y. Study on interfacial bond behavior of recycled aggregate concrete filled stainless steel tubes (RAC-FSST). J. Constr. Build. Mater. 2021, 313, 125532. [Google Scholar] [CrossRef]
  11. Lyu, W.Q.; Han, L.H. Investigation on bond strength between recycled aggregate concrete (RAC) and steel tube in RAC-filled steel tubes. J. Constr. Steel Res. 2019, 155, 438–459. [Google Scholar] [CrossRef]
  12. Song, T.-Y.; Wang, C.-H.; Liu, X.-L.; Xiang, K.; Zhou, H. Post-fire bond behaviour in elliptical concrete filled steel tubes: Experiment and simulation. J. Constr. Steel Res. 2023, 201, 107725. [Google Scholar] [CrossRef]
  13. Campione, G.; Mindess, S.; Scibilia, N.; Zingone, G. Strength of hollow circular steel sections filled with fibre-reinforced concrete. Can. J. Civ. Eng. 2000, 27, 364–372. [Google Scholar] [CrossRef]
  14. Roeder, C.W.; Cameron, B.; Brown, C.B. Composite action in concrete filled tubes. J. Struct. Eng. 1999, 125, 477–484. [Google Scholar] [CrossRef]
  15. Hunaiti, Y.M. Composite action of foamed and lightweight aggregate concrete. J. Mater. Civil. Eng. 1996, 8, 111–113. [Google Scholar] [CrossRef]
  16. Yasser, H.; Minoru, W.; Kiyoshi, M. Experimental evaluation of the effect of bond on the maximum capacity of composite columns. J. Constr. Steel Res. 1992, 22, 39–55. [Google Scholar] [CrossRef]
  17. Tao, Z.; Han, L.-H.; Uy, B.; Chen, X. Post-fire bond between the steel tube and concrete in concrete-filled steel tubular columns. J. Constr. Steel Res. 2011, 67, 484–496. [Google Scholar] [CrossRef]
  18. Tao, Z.; Song, T.-Y.; Uy, B.; Han, L.-H. Bond behavior in concrete-filled steel tubes. J. Constr. Steel Res. 2016, 120, 81–93. [Google Scholar] [CrossRef]
  19. An, L.; Cederwall, K. Push-out tests on studs in high strength and normal strength concrete. J. Constr. Steel Res. 1996, 36, 15–29. [Google Scholar] [CrossRef]
  20. Shim, C.-S.; Lee, P.-G.; Yoon, T.-Y. Static behavior of large stud shear connectors. J. Eng. Struct. 2004, 26, 1853–1860. [Google Scholar] [CrossRef]
  21. Okada, J.; Yoda, T.; Lebet, J.P. A study of the grouped arrangements of stud connectors on shear strength behavior. Struct. Eng. Earthq. Eng. 2006, 23, 75–89. [Google Scholar] [CrossRef]
  22. Qiao, Q.; Zhang, W.; Qian, Z.; Cao, W.; Liu, W. Experimental study on mechanical behavior of shear connectors of square concrete filled steel tube. J. Appl. Sci. 2017, 7, 818. [Google Scholar] [CrossRef]
  23. Dong, H.; Chen, X.; Cao, W.; Zhao, Y. Bond-slip behavior of large high-strength concrete-filled circular steel tubes with different constructions. J. Constr. Steel Res. 2020, 167, 105951. [Google Scholar] [CrossRef]
  24. GB/T 2975-2018; Sampling Position and Sample Preparation for the Mechanical Properties Test of Steel and Steel Products. China Standards Press: Beijing, China, 2018.
  25. GB/T 228.1-2010; Method of Room Temperature Tensile Test of Metal Materials. China Standards Press: Beijing, China, 2010.
  26. Guan, M.; Lai, Z.; Xiao, Q.; Du, H.; Zhang, K. Bond behavior of concrete-filled steel tube columns using manufactured sand (MS-CFT). J. Eng. Struct. 2019, 187, 199–208. [Google Scholar] [CrossRef]
  27. Lv, J.; Zhou, T.; Du, Q.; Li, K.; Jin, L. Research on the bond behavior of preplaced aggregate concrete-filled steel tube columns. J. Mater. 2020, 13, 300. [Google Scholar] [CrossRef] [PubMed]
  28. Zhang, N.; Ju, T.; Qiu, R. Experimental study on the bond-slip behavior of steel tube-coal gangue concrete. Int. J. Press. Vessel. Pip. 2024, 209, 105209. [Google Scholar] [CrossRef]
  29. GB 50917-2013; Design Code of Steel-Concrete Composite Bridge. China Standards Press: Beijing, China, 2013.
Figure 1. Internal structural measures of the specimens. (a) No structure; (b) Welded stud; (c) Welding ring rib; (d) Built-in steel bar cage.
Buildings 14 02516 g001
Figure 2. Loading device.
Buildings 14 02516 g002
Figure 3. Failure mode and stiffening treatment. (a) fixed end strength; (b) scattered concrete; (c) buckling deformation treatment.
Buildings 14 02516 g003
Figure 4. Load–slip curves of each specimen. (a) specimens with no structures; (b) specimens with different structures.
Buildings 14 02516 g004
Figure 5. Strain distribution curves. (a) GC30-1; (b) GC30-L1; (c) GC30-G1; (d) GC30-H1.
Buildings 14 02516 g005aBuildings 14 02516 g005b
Figure 6. The τ s curves of the specimens. (a) specimens with no structure and built-in steel cage structure; (b) specimens with welded studs and ring rib structure.
Buildings 14 02516 g006
Figure 7. Comparison of bond strength of the specimens. (a) specimens with no structure and built-in steel cage structure; (b) specimens with welded studs and ring rib structure.
Buildings 14 02516 g007
Figure 8. Comparison of test bond–slip curve and predicted curve. (a) GC30-1; (b) GC30-3; (c) GC30-L1; (d) GC30-L2; (e) GC30-G1; (f) GC30-G2; (g) GC30-H1; (h) GC30-H2.
Buildings 14 02516 g008
Table 1. Mechanical properties of steel.
MaterialsThickness (Diameter)/mmYield Strength/MPaUltimate Strength/MPaElongation/%Elastic Modulus/MPa
Steel tube3.5294.51354.5118.672.11 × 105
Steel tube4.5300.31364.6726.132.12 × 105
Circular rib4.0367.89509.2621.642.01 × 105
Stud8.0471.55679.8619.872.04 × 105
Table 2. Mix proportion of geopolymer concrete (unit: kg/m3).
Concrete TypeFly AshMetakaoliniteWater GlassNaOHWaterSandPebbleIndustrial White SugarWater-Reducing Admixture
GC30207207181427753612502610
GC50194194226524553712522510
Table 3. Mix proportion of geopolymer concrete (unit: kg/m3).
SpecimensStrength GradeD × t × L (mm)L/DD/tPu/kNsu/mmStructural Measures
GC30-1C30219 × 650 × 3.52.9762.6382.132.03
GC30-2C30219 × 650 × 4.52.9748.7419.593.28
GC30-3C30219 × 350 × 3.51.6062.6274.542.03
GC30-4C30219 × 350 × 4.51.6062.6276.262.29
GC30-L1C30219 × 650 × 3.52.9762.6396.582.86Steel bar cage
GC30-G1C30219 × 650 × 3.52.9762.6643.373.86Stud
GC30-H1C30219 × 650 × 3.52.9762.6739.276.64Ring rib
GC30-L2C30219 × 350 × 3.51.6062.6284.242.28Steel bar cage
GC30-G2C30219 × 350 × 3.51.6062.6508.463.34Stud
GC30-H2C30219 × 350 × 3.51.6062.6420.243.19Ring rib
GC50-1C50219 × 650 × 3.52.9762.6436.461.14
GC50-2C30219 × 650 × 4.52.9748.7449.381.12
GC50-3C50219 × 350 × 3.51.6062.6306.121.60
GC50-4C30219 × 350 × 4.51.6062.6324.931.67
GC50-L1C50219 × 650 × 3.52.9762.6426.811.16Steel bar cage
GC50-G1C50219 × 650 × 3.52.9762.6773.865.67Stud
GC50-H1C50219 × 650 × 3.52.9762.6//Ring rib
GC50-L2C50219 × 350 × 3.51.6062.6356.191.71Steel bar cage
GC50-G2C50219 × 350 × 3.51.6062.6513.792.38Stud
GC50-H2C50219 × 350 × 3.51.6062.6538.242.71Ring rib
Table 4. Mix proportion of geopolymer concrete (unit: kg/m3).
SpecimensPu/kNPu,c/kNτu/MPaτu,c/MPaτu/τu,c
GC30-1382.13390.090.960.980.980
GC30-2419.59415.631.061.051.010
GC30-3274.54288.571.371.440.951
GC30-4276.26297.971.401.510.927
GC30-L1396.58420.620.991.050.943
GC30-L2284.24292.251.421.460.973
GC30-G1643.37674.951.631.710.953
GC30-H1739.27747.261.851.870.989
GC30-G2508.46464.422.542.321.095
GC30-H2420.24458.262.102.290.917
GC50-1436.46456.481.091.140.956
GC50-2449.38465.151.141.180.966
GC50-3306.12320.131.531.600.956
GC50-4324.93330.871.641.670.982
GC50-L1426.81446.751.071.120.955
GC50-L2356.19342.181.781.711.041
GC50-G1773.86829.711.942.080.933
GC50-G2513.79505.792.572.531.016
GC50-H2538.24490.222.692.451.098
Mean value 0.982
Standard deviation 0.050
Coefficient
of variation
0.051
Disclaimer/Publisher’s Note: The statements, opinions and data contained in all publications are solely those of the individual author(s) and contributor(s) and not of MDPI and/or the editor(s). MDPI and/or the editor(s) disclaim responsibility for any injury to people or property resulting from any ideas, methods, instructions or products referred to in the content.

