Article

Crack Identification Method for Prefabricated Concrete Pavement Based on Distributed Strain Monitoring

College of Civil and Transportation Engineering, Hohai University, Nanjing 210098, China
*
Author to whom correspondence should be addressed.
Buildings 2024, 14(8), 2520; https://doi.org/10.3390/buildings14082520
Submission received: 19 July 2024 / Revised: 6 August 2024 / Accepted: 13 August 2024 / Published: 15 August 2024
(This article belongs to the Special Issue Advances in Structural Health Monitoring and Damage Identification)

Abstract

:
It is meaningful to monitor and identify concrete cracks as they will seriously reduce the fatigue life of pavement. In this paper, a new method based on distributed long-gauge optic fiber sensing is proposed to implement crack identification. Firstly, the damage indicator, namely strain curve envelope area ratio (SCEAR), is proposed and calculated with the measured strain in time series when the plane goes across the pavement where the sensors are installed. Then, the indicators with different sensors are normalized by the value of the indicator from one referenced sensor where damage normally will not happen. If the crack happens within the sensing gauge of the sensor, the value of the damage indicator SCEAR from the sensor will increase. Therefore, the crack will be identified with the change of the damage indicator. The effect of the proposed method is first verified by some simulations of prefabricated pavement as the cracks can be accurately identified by the proposed method. Moreover, the influence of the aircraft, such as taxiing position, aircraft load, and aircraft type, is not obvious enough to mislead the identification results. Lastly, the static loading tests were implemented with one small-scale model of prefabricated concrete pavement in the lab. From the experimental results, the prefabricated cracks inside the pavement slab can be identified accurately with the proposed method as the parameter SCEAR is increased by about 100% at the crack position, while it is only changed by about 3% at the undamaged position.

1. Introduction

Airport prefabricated pavement with reciprocating aircraft loads, plate bottom de-airing, and aircraft type after the renewal of the load increase, and other factors such as the impact of plate cracking, resulting in flight accidents. According to the statistics of an airport for 10 years, there were 76 cases of tire blowouts, landing gear damage, engine damage, and other failures caused by pavement quality disorders. Among them, five failures, or 6.6%, were caused by crack-type disorders [1]. Although prefabricated pavement has obvious advantages in rapid repair and large-scale renewal, it also has the potential danger of slab cracking, and the incidence of crack-like disease even exceeds that of traditional pavement, so it is of great practical significance to monitor prefabricated pavement in real time to effectively identify the crack development conditions, so as to avoid flight accidents.
At present, airport pavement crack monitoring/detection methods mainly include manual inspection, image recognition, infrared imaging, geo-radar identification, and other methods. Manual inspection is a commonly used method in the Chinese civil aviation specification [2], but manual inspection has many problems such as poor accuracy, strong subjectivity, and low efficiency, etc., which can no longer adapt to the requirements of the rapid development of civil aviation airports [3]. Some scholars [4,5,6,7,8] proposed various crack recognition algorithms to realize the work of recognizing cracks in images. For example, Oliveira [9] and others use automatic threshold segmentation and connected component algorithms to realize the extraction of cracks; Shi [10] and others identify cracks based on integral channel features and random decision forests. Although such methods can improve the recognition accuracy of cracks algorithmically, they can only recognize apparent cracks based on visible light images, which are vulnerable to the interference of the external environment and cannot recognize the internal cracks of the pavement surface. Infrared thermography is also often used for crack identification in different structures. Park [11] et al. utilized infrared thermography and the phase-locking method for crack identification in welded dissimilar metal pipes. Li [12] et al., based on the finite element model of rail plate and field experiments, investigated the relationship between the detectable crack width of infrared thermography and the ambient temperature, and the crack width of not less than 0.2 mm was detected when the temperature was higher than 15 °C; when the temperature was not lower than 20 °C, cracks with width as small as 0.14 mm were able to be detected. When the temperature is higher than 15 °C, cracks with a width of not less than 0.2 mm can be detected; when the temperature is not lower than 20 °C, cracks with a width as small as 0.14 mm can be detected. However, due to the large range of airport pavement and the low resolution of infrared images, the infrared thermal imaging sensor cannot meet the requirements for the identification of small cracks on airport pavement. Geo-radar has a good effect on the disease detection of concrete structures. Ouyang [13] analyzed the early crack damage of asphalt concrete pavement layers based on the random medium model, summarized the various characteristics of the radar profile, and also compared, analyzed, and summarized the results of the field collection of the crack damage of the pavement layer. Tian [14] et al. proposed a stepping-frequency null-coupled ground-penetrating radar system based on the vector network analyzer, and the experimental results show that the system can detect narrow cracks with a depth of 50 cm. The geo-radar technology is characterized by strong penetration and high resolution in detecting larger defects, which will have a greater impact on the detection effect due to the narrow cracks and internal reinforcement of the prefabricated pavement.
In the past 10 years, distributed fiber optic monitoring technology has been applied to the crack monitoring of concrete structures in a lot of applications due to the advantages of high accuracy, good durability, and ease of automation [15,16,17,18]. At present, the distributed monitoring techniques mainly include the distributed fiber optic sensing technique based on Brillouin Optical Time Domain Analysis (BOTDA) and the long-scale pitch Fiber Bragg Grating (FBG) sensing technique. Lu [19] and others applied the BOTDA crack monitoring technology to the crack monitoring of an asphalt pavement layer; Qian [20] and others carried out a study on fatigue crack monitoring of bridge deck slabs based on BOTDA and established a fatigue crack extension model by using the strain indexes obtained from fiber-optic sensor monitoring. Shi [21] and others carried out ground crack monitoring based on BOTDR, which can recognize the change in ground crack width of 0.1 mm. Long-scale distance fiber grating sensing technology is less applied in concrete crack identification. Pang [22] proposed a long-scale distance fiber grating sensor deployment method under chain distribution, and the identification and location of diagonal cracks are realized by the change of the slope of the load–strain curve, and the analysis finds that it is completely consistent with the experimental observation results. The BOTDA can directly realize the continuous measurement of the strain, but the accuracy of the strain measurement is relatively low, generally only above 10 με, and with the increase of wiring distance, the optical loss will further increase, and the measurement accuracy will also decrease dramatically; meanwhile, the long-scale pitch FBG sensor can still realize the distributed measurement, and its accuracy can reach 1~2 με. Considering that the deformation of the structure of the airport road surface in the operation period is relatively small, in order to realize the structure of the high-precision monitoring and evaluation, this paper selects the long-scale pitch fiber grating technology as the sensing technology.
In this paper, firstly, according to the principle of fiber grating sensing, a crack identification method of prefabricated pavement based on distributed strain monitoring is proposed; secondly, a 9-plate combined finite element model of prefabricated pavement surface is established to validate the crack identification algorithm and analyze the influence of the aircraft taxi position, load size and model; finally, the feasibility of the method is verified by a small-scale model scaling test.

2. Crack Identification Method Based on Distributed Long-Gauge Optic Fiber Sensing

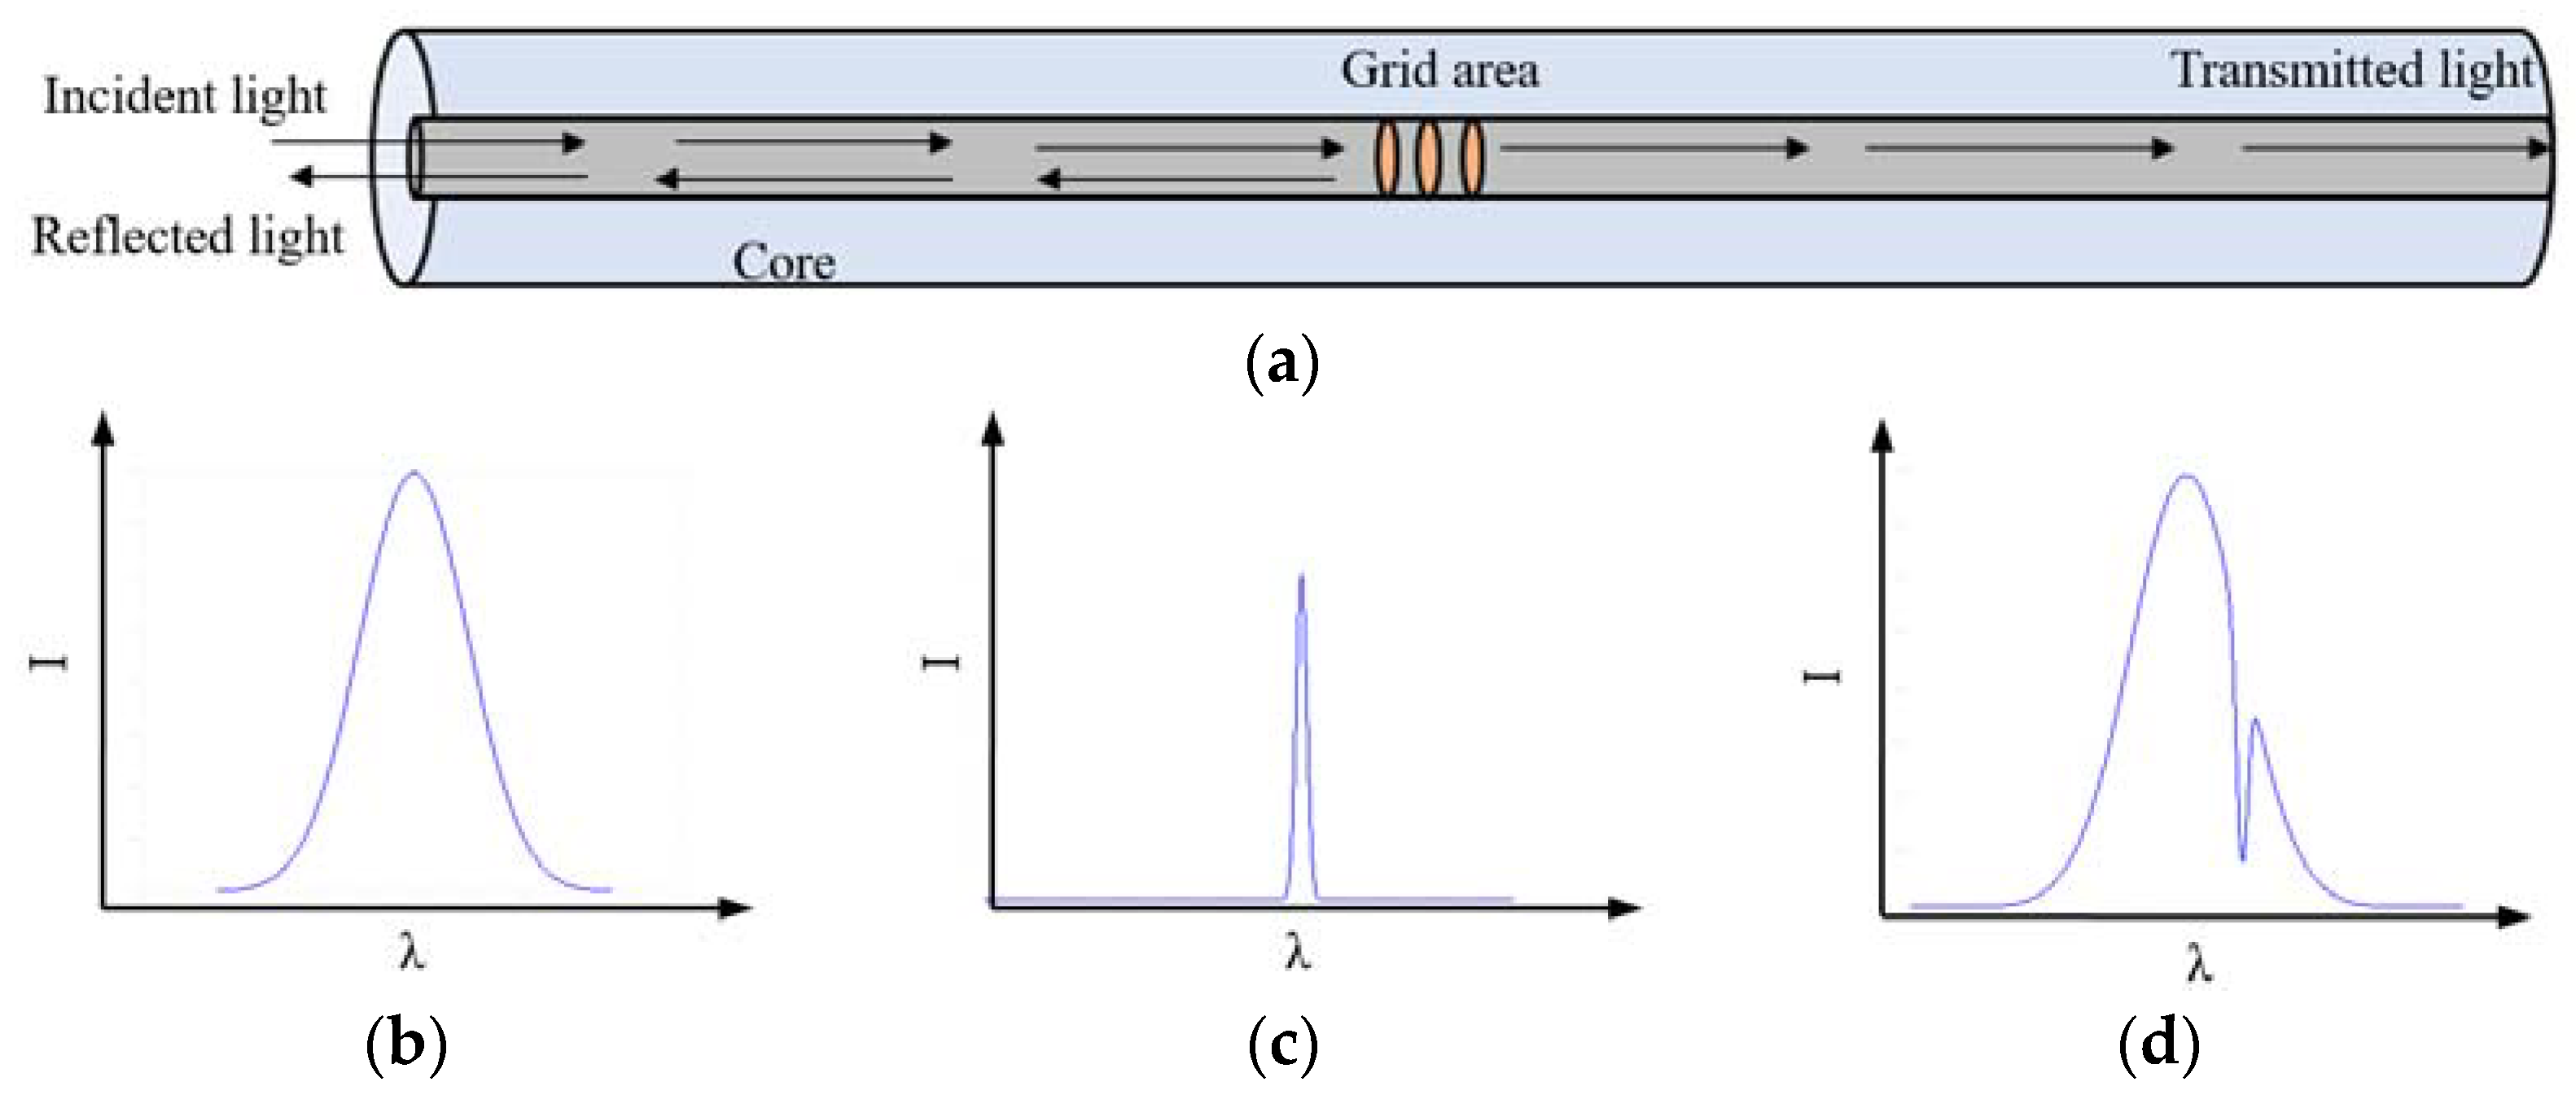
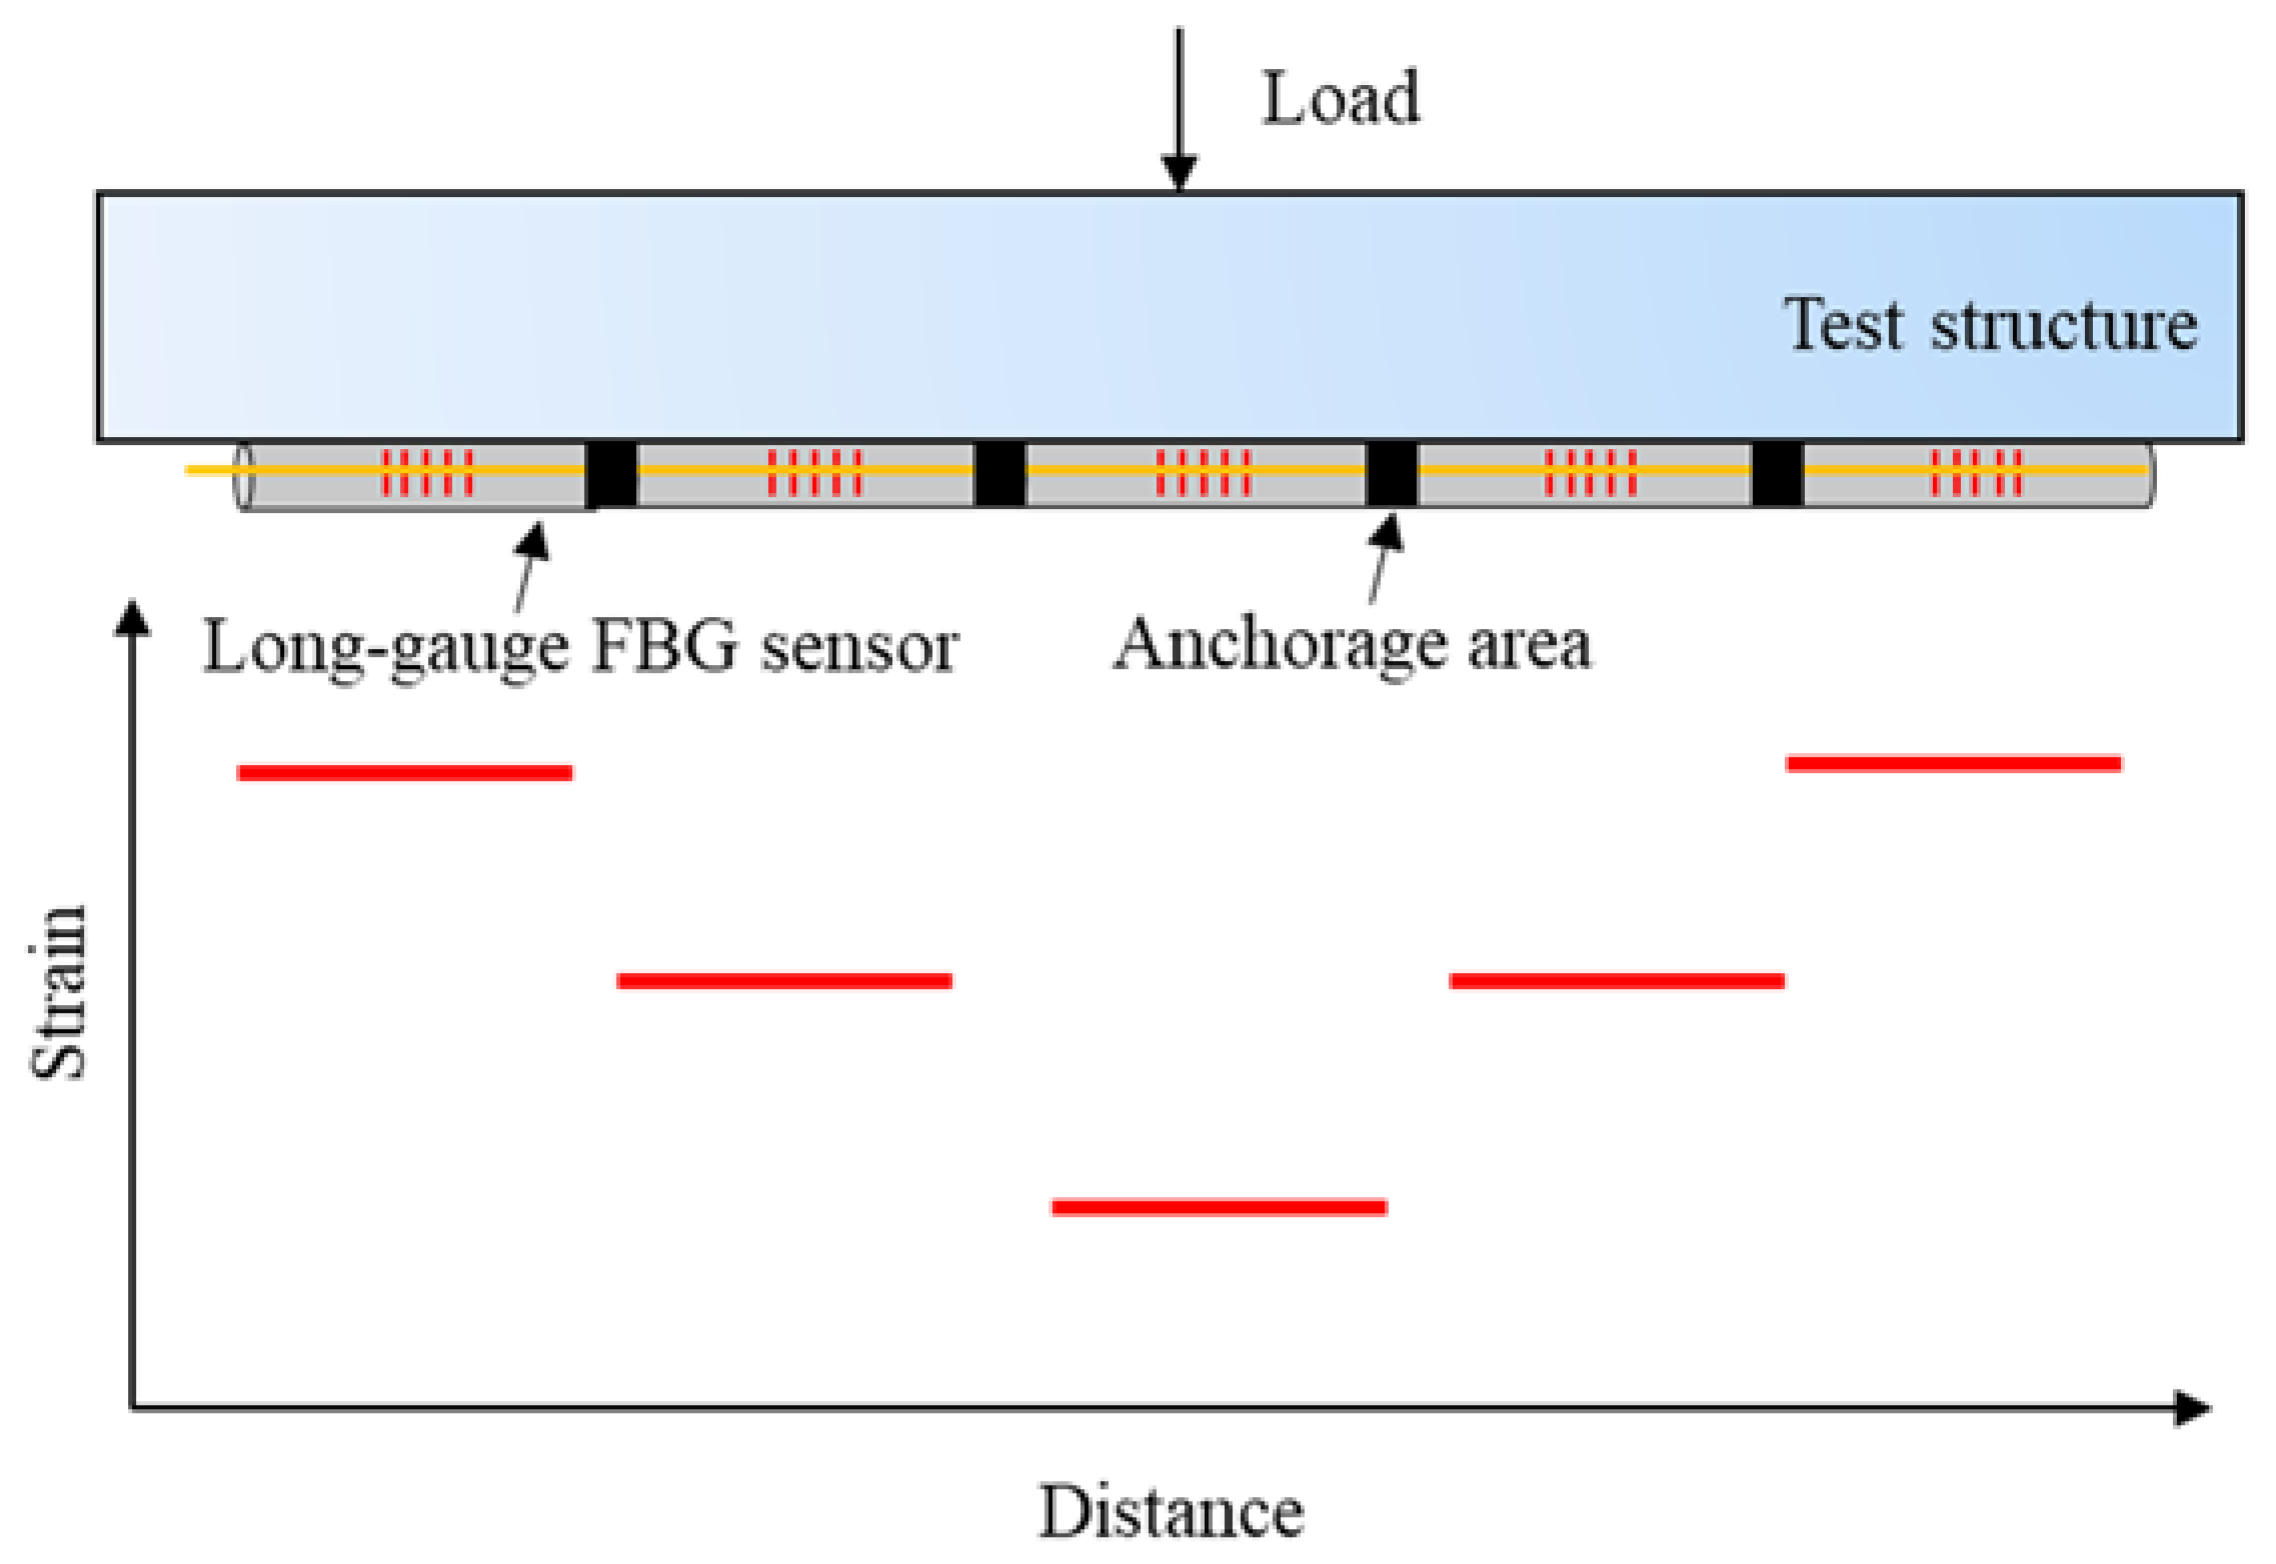
2.1. Distributed Long-Gauge Optic Fiber Sensing

FBG sensors make use of the photosensitivity of fiber optic materials to form a permanent Bragg grating by making the refractive index within the core change periodically along the core axis through methods such as UV light exposure. When the wavelength of the incident light meets the specific Bragg conditions, it will be reflected back to the original direction, while other wavelengths of light will pass through the grating area unaffected. Once the Bragg grating area is subjected to external forces or changes in ambient temperature, the wavelength of the reflected light will also change. Therefore, strain changes and temperature changes can be measured by measuring the wavelength change of the reflected light [23,24], as shown in Figure 1.
The amount of wavelength change of the reflected light can be calculated using Equation (1):
Δ λ b = ( 1 P ε ) Δ ε λ b + ( α f + ξ ) Δ T
where Δ λ b is the wavelength variation of the reflected light; P ε is the effective elastic optical coefficient of the fiber; Δ ε is the strain variation; λ b is the wavelength of the reflected light; α f is the coefficient of thermal expansion of the fiber; ξ is the thermo-optic coefficient of the fiber; and Δ T is the temperature variation. Due to the short passage time of the aircraft through the roadway surface, the ambient temperature at the site is almost unchanged, which has less influence on the measured strain results, and the effect of temperature can be ignored.
The long-gauge FBG sensor can obtain the average strain of the structure in the scale distance range, which is used as the characteristic strain of the structure in the monitoring range, which reduces the influence of the unevenness of the concrete material on the measurement, and can better reflect the actual performance of the structure. By connecting the sensors in series before and after to cover the monitoring area of the roadway panel, the distributed measurement of the structural strain in the area can be realized, which in turn can realize the identification of roadway cracks, as shown in Figure 2.

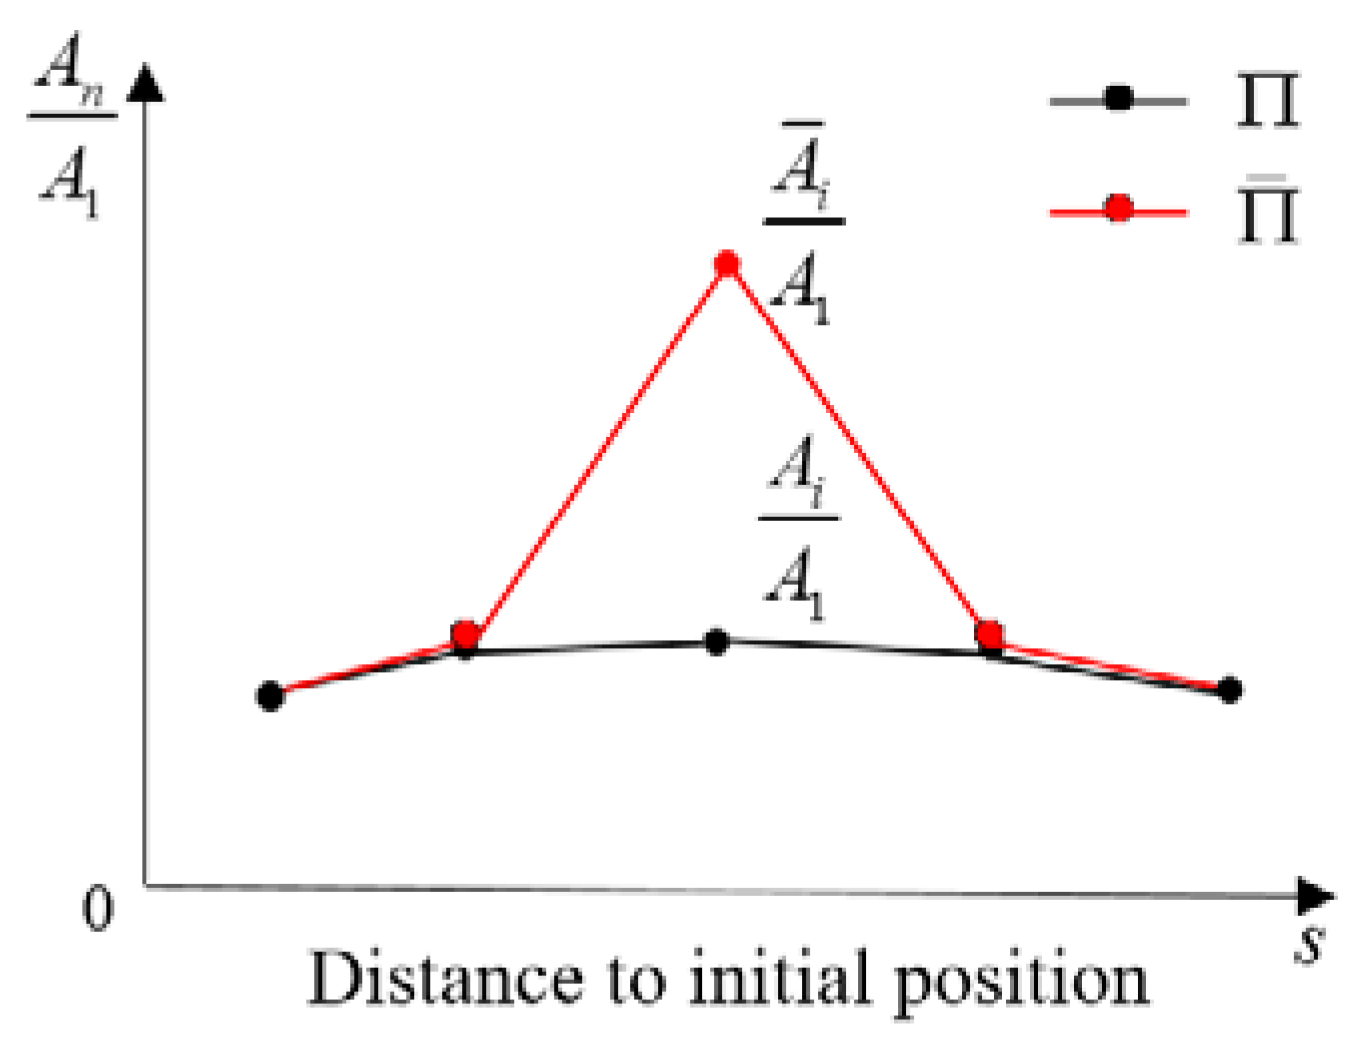
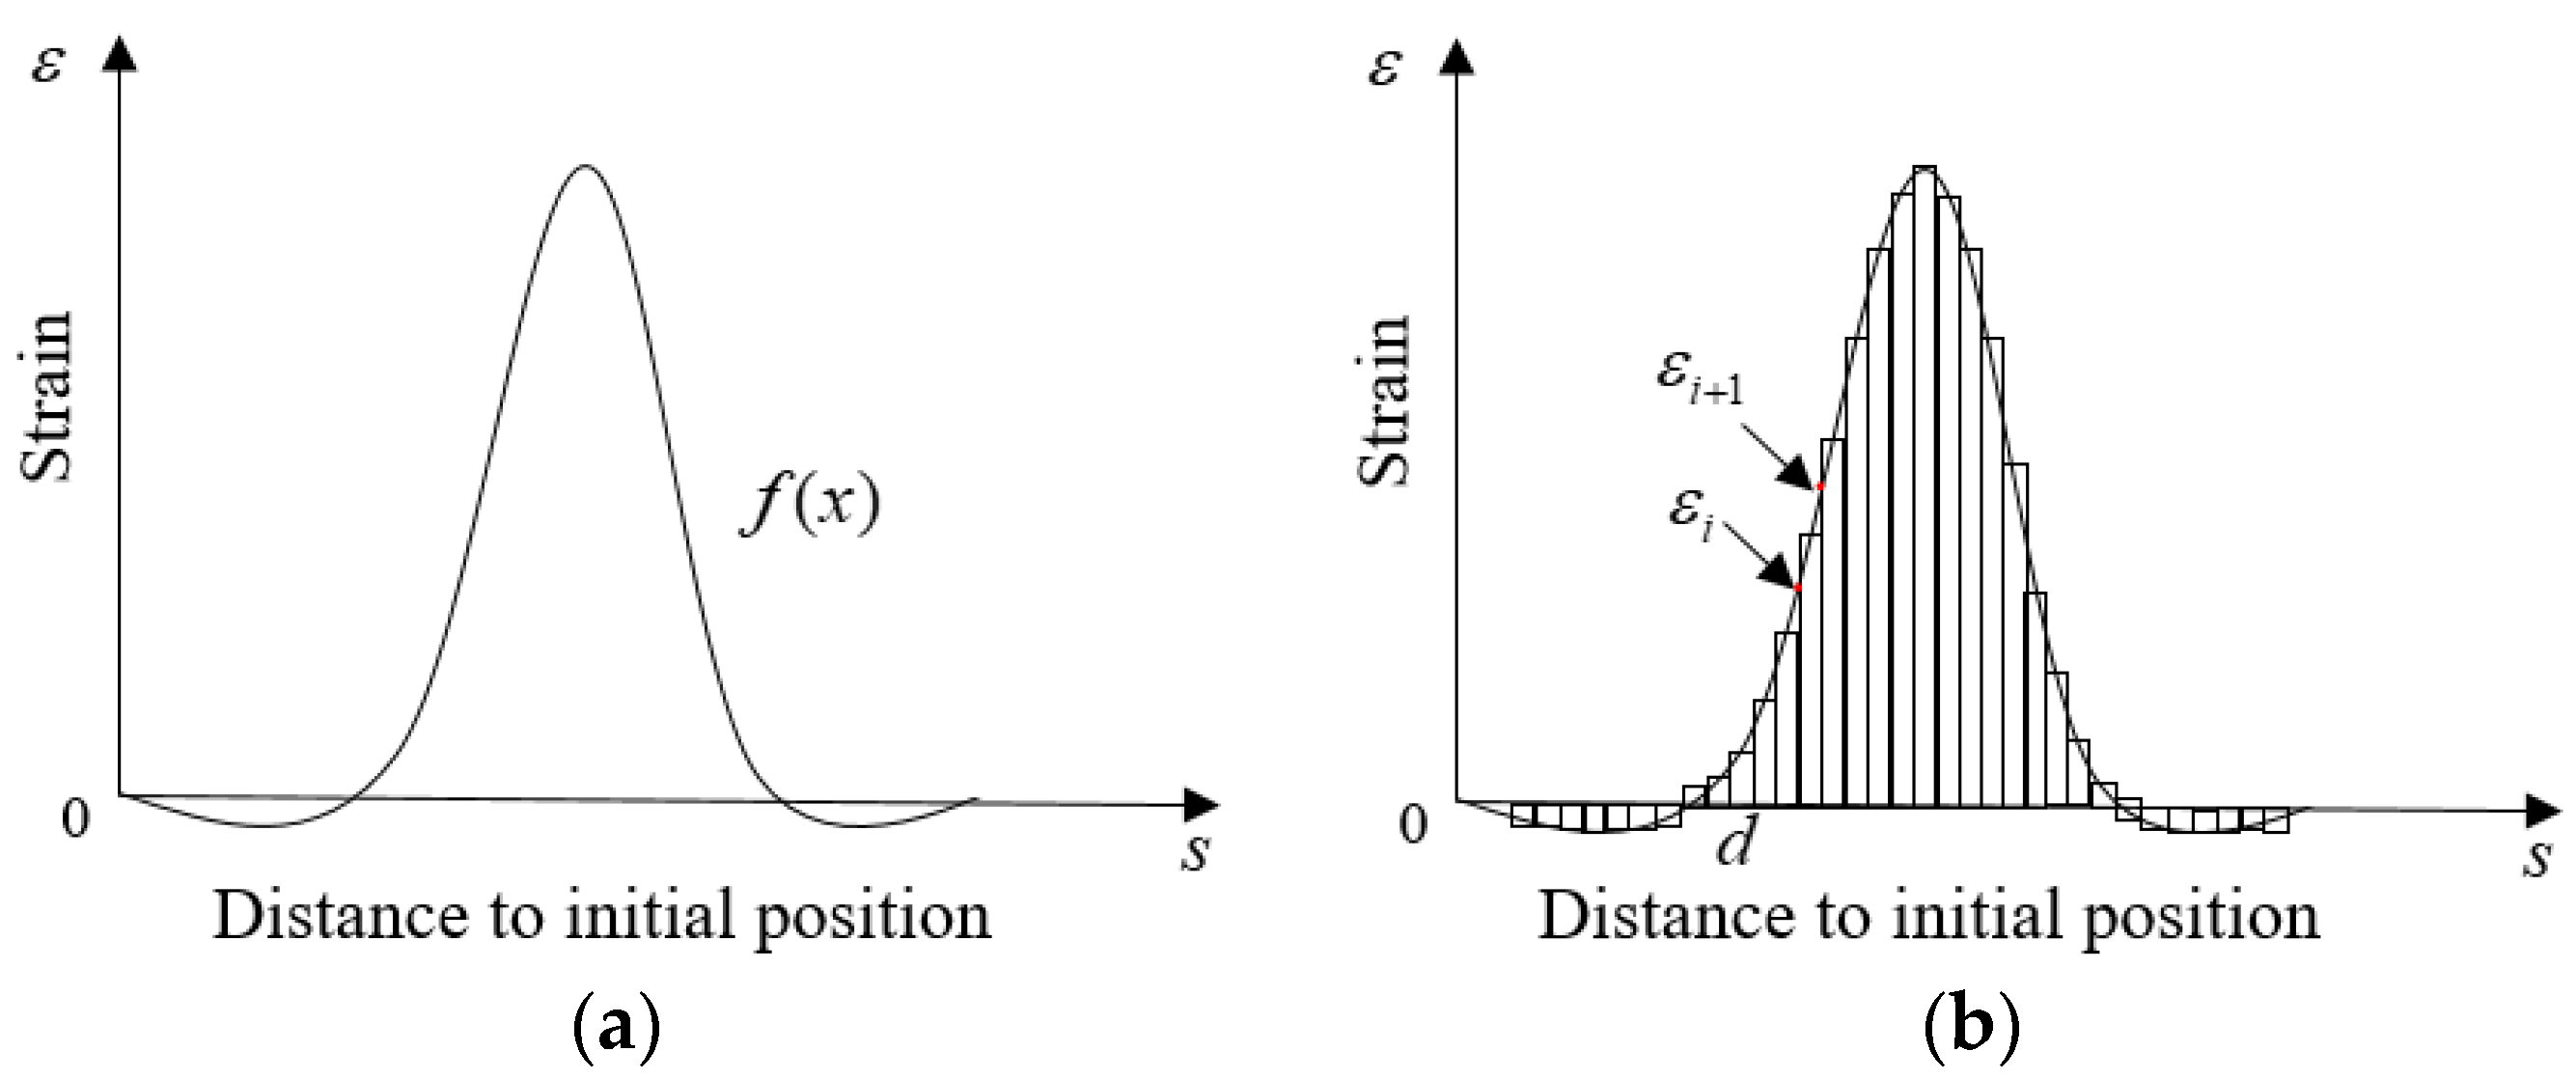
2.2. Crack Identification Method

In order to ensure the long-term monitoring needs of the sensor, without affecting the structural stress performance of the pavement and the rapid construction of the factory, the group used the slotted steel bar on the distributed fiber optic grating encapsulation to form a self-sensing bar for pavement crack monitoring. As the airplane operates on the pavement, each long-scale pitch FBG sensor produces a strain variation curve as shown in Figure 3c. The envelope area of the strain curve at each sensor location can be constructed as a series.
π = A 1 , A 2 , A 3 A i A n
The strain curve envelope area monitored at one of the intact sensor locations is used as a reference, and the series is normalized to obtain the strain curve envelope area ratio distribution. Taking the E 1 sensor as an example, the calculation formula is as follows:
The area enveloped by the strain curve of one of the sensors in the crack-free position is taken as the reference value, and the ratio of the area enveloped by the strain curves monitored by the sensors in other positions to the reference value is called the strain curve envelope area ratio (SCEAR), completing the normalization of the logarithmic series and obtaining the distribution of the strain curve envelope area ratio. The normalization analysis scales the strain curve envelope area to the same range and eliminates the differences in magnitude between features. Normalization improves the performance and stability of the results and facilitates the interpretation and visualization of the data. Taking sensor E 1 as an example, the calculation formula is as follows:
Translated with DeepL.com (free version)
Π = 1 , A 2 A 1 , A 3 A 1 A i A 1 A n A 1
When a crack occurs at the E 1 sensor location, the strain peak monitored by the sensor will increase significantly, resulting in a significantly outwardly expanding strain curve, which increases the strain curve envelope area, as shown in Figure 3d. The strain curve envelope area of the sensors adjacent to the crack location will be slightly affected, and the curve envelope area of each sensor location can be constructed as a series after the crack appears.
π ¯ = A ¯ 1 , A ¯ 2 , A ¯ 3 A ¯ i A ¯ n
The distribution of the envelope area ratio of the strain curve after cracking of the pavement panel is further expressed as
Π ¯ = 1 , A ¯ 2 A ¯ 1 , A ¯ 3 A ¯ 1 A ¯ i A ¯ 1 A ¯ n A ¯ 1
As shown in Figure 4, comparing the distribution of the envelope area ratio of the strain curve before and after the appearance of the crack, it can be found that the envelope area ratio of the strain curve at the location where the crack did not appear did not change or the change was small, and only the strain envelope area ratio at the corresponding location of the crack was changed, so the crack can be recognized on the pavement panel according to the change of the distribution of the envelope area ratio of the strain curve.
Since the strain over distance curve cannot be expressed using a specific formula, therefore the curve is divided into n rectangles as shown in Figure 5b; solving the sum of the areas of the n rectangles is approximately equal to the area of the envelope of the strain curve. Where the height of each rectangle is ε i + ε i + 1 2 , and the width is d . The specific formula is as follows.
A = f ( x ) d x = d i = 1 n ( ε i + ε i + 1 ) 2

3. Finite Element Modeling of Prefabricated Pavement

3.1. General Information of Prefabricated Pavement Model

3.1.1. Pavement Model Construction

As the prefabricated pavement calculated in the paper has not been applied in the actual project, and may not be able to meet the requirements of the indoor test, the finite element on the prefabricated pavement simulation and analysis is used, which can realize the working conditions expected to be achieved under the different influencing factors, to achieve the analysis of multiple working conditions, to reduce the test of economic losses.
The establishment of prefabricated pavement 9-plate combination finite element model, with pavement panel thickness of 0.3 m, size 2.5 m × 5 m, joint width of 8 mm, reinforcing steel using structural reinforcement, upper and lower two-layer bi-directional reinforcing, the thickness of the protective layer of 50 mm, is shown in Figure 6. The road pavement is modeled with three-dimensional solid modeling, the modulus of elasticity of concrete is taken as 36,000 MPa, Poisson’s ratio is taken as 0.15; the modulus of elasticity of steel reinforcement is taken as 200 GPa, Poisson’s ratio is taken as 0.33, which is “built-in” in the pavement panel, and the grid cell type of steel reinforcement is truss. The Winkler foundation model is used to simplify the pavement subgrade and soil base into a composite spring and define the corresponding foundation reaction coefficients, and the foundation simulation adopts the “elastic foundation” in the interaction module of Abaqus, and the modulus of reaction of the top surface of the subgrade is taken as 150 MN/m3 by specifying the foundation surface in contact with the pavement slab [25]. The joint connection between slabs is very important for the mutual load transfer of prefabricated pavement panels, and the connection between pavement panels is realized by establishing virtual surface layer [26], and the elastic modulus of the longitudinal joint connection area is taken as 100 MPa; the elastic modulus of the transverse joint connection area is taken as 50 MPa, the elastic modulus of the non-connection area is taken as 5 MPa, and the Tie connection is adopted between the virtual surface layer and the pavement panels.
Combined with domestic and international research, the use of structured mesh helps to improve the calculation accuracy, so a rectangular shape is chosen to simulate the load contact surface. The selected role model is B-737-800 for which the load parameters are as shown in Table 1, because the dynamic load of the landing aircraft is unstable, so the quasi-static load of the taxiing aircraft is used to simulate the aircraft load, and the simulation of the aircraft load is realized by constantly moving the load surface and applying the load to the No. 5 plate several times [27], as shown in Figure 7. Moreover Figure 8 shows the main landing gear form of B-737-800.

3.1.2. Crack Simulation and Location Selection

The extended finite element method (XFEM) is used to simulate cracks [28,29]. First, a 3D shell is created in the component module, and the crack size is determined according to different damage conditions, and the contact properties are created in the interaction module, with the normal behavior of hard contact and the friction coefficient of 8.9 in the tangential behavior [30], and the crack properties are edited in the special settings, with the option “Allow crack growth” and the option “Crack location”, the location of the 3D shell, which is the simulated crack location, noting that the shell location should be inside the mesh, and the location is the simulated crack location. Edit the crack properties in the special settings, check the “Allow crack growth” option, and check the “Crack location” option, the location of the 3D shell, which is the location of the simulated crack, note that the location of the shell needs to be inside the mesh, and specify the established contact properties, the mesh cell type is shell. According to the fatigue damage development law of the cracks on the panel under the airplane operation, the crack development degree is set into different levels, as shown in Table 2.
The B-737-800 model is used to apply the moving load along the longitudinal side of the plate, and the load level is taken as 0.1~1 times the tire pressure to extract the maximum strain generated at the bottom of the plate when the load is applied, as shown in Figure 9. The strain is at a maximum when the load is in the non-connected area, which is the location where cracks are likely to occur, so the crack location is selected as the middle of the two connected areas at the longitudinal joints of the pavement panel in the finite element simulation, as shown in Figure 10.

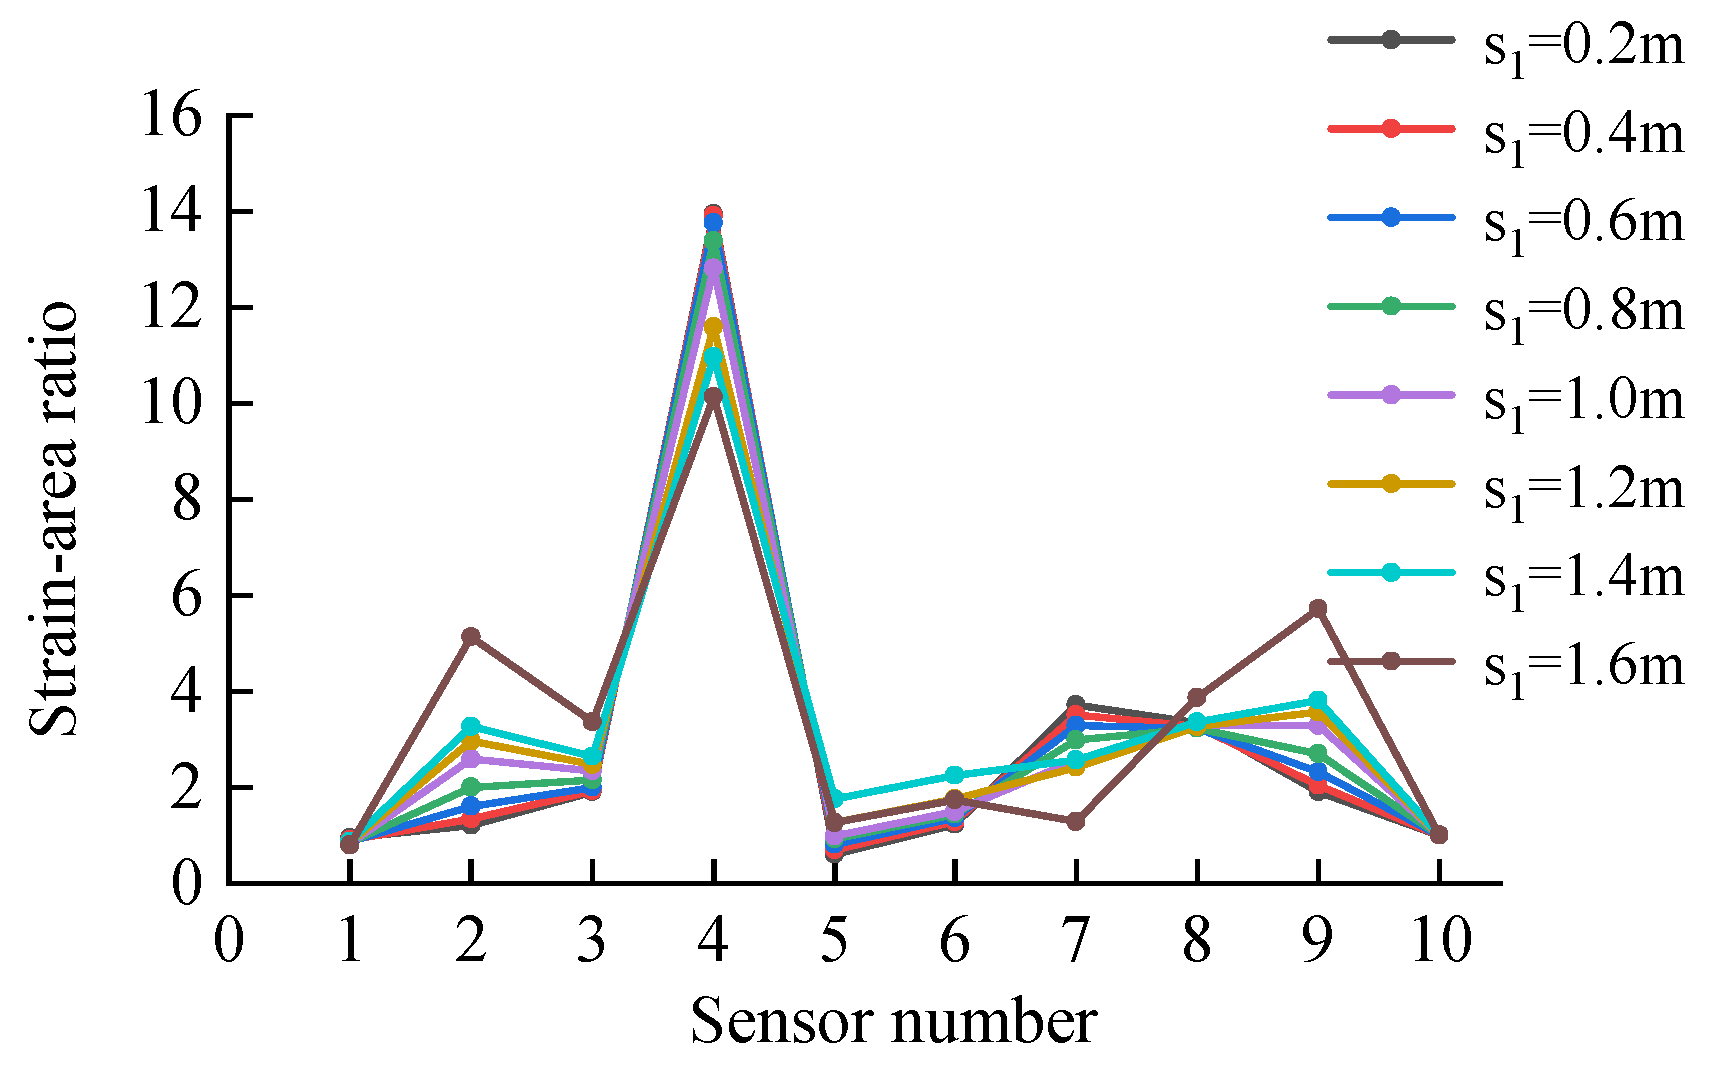
3.1.3. Sensor Position Selection and Scale Distance Optimization

The specification [30] stipulates that the location of the strain measurement point for the calculation of the stress ratio transfer coefficient is selected 150 mm from the slab edge, so in order to simultaneously monitor the strain at the slab edge and calculate the joint transfer coefficient without affecting the crack identification, the self-sensing reinforcement bar is placed at a distance of 150 mm from the edge of the slab, in which the simulation of the self-sensing reinforcement bar is the same as that of the ordinary reinforcement bar, and the value of the different marking spacing sizes can be realized by changing the length of the reinforcement bar’s mesh cell.
The cracks were set up according to the crack locations shown in Figure 9, and the length of the control crack was 1250 mm, and the height of the crack was varied from 0 mm to 300 mm, with an interval of 50 mm for each condition. The sensor scale distances were taken to be 100 mm, 200 mm, 400 mm, 600 mm, 800 mm, and 1000 mm. The corresponding sensor strain at the crack location was extracted by applying a B-737-800 model load at the crack location. As shown in Figure 11, when there is no crack, the measured strain does not change as the distance increases; controlling the height of the crack remains unchanged, the damage information of the crack is gradually submerged as the distance of the sensor increases, and as the height of the crack increases, the faster the damage information of the crack is submerged.
Figure 12 shows the absolute and relative changes in strain at different scale distances after the crack is carried out. From the figure, it can be seen that the smaller the scale distance of the sensor is, the larger the absolute and relative changes of the measured strain are. When the scale distance of the sensor is taken as 100 mm, the absolute change can reach about 500 με, and the relative change can reach 950%, which can obviously identify the crack; however, when the scale distance is taken as 1000 mm, the maximum absolute change is less than 100 με, and the relative change is about 300%, which makes it impossible to carry out the crack identification when the height of the crack is small. At the same time, in order to control the number of sensors and meet the minimum spacing requirements of fiber grating, the longitudinal seam sensor spacing is taken as 500 mm which is more suitable.
In summary, the sensor spacing is selected as 500 mm, and 10 FBG sensors are distributed on the self-sensing reinforcement, numbered as E 1 ~ E 10 . The self-sensing reinforcement is 0.15 m from the edge of the plate and 0.05 m from the bottom position of the plate, as shown in Figure 13 for the self-sensing reinforcement layout schematic.

3.2. Results of Crack Identification
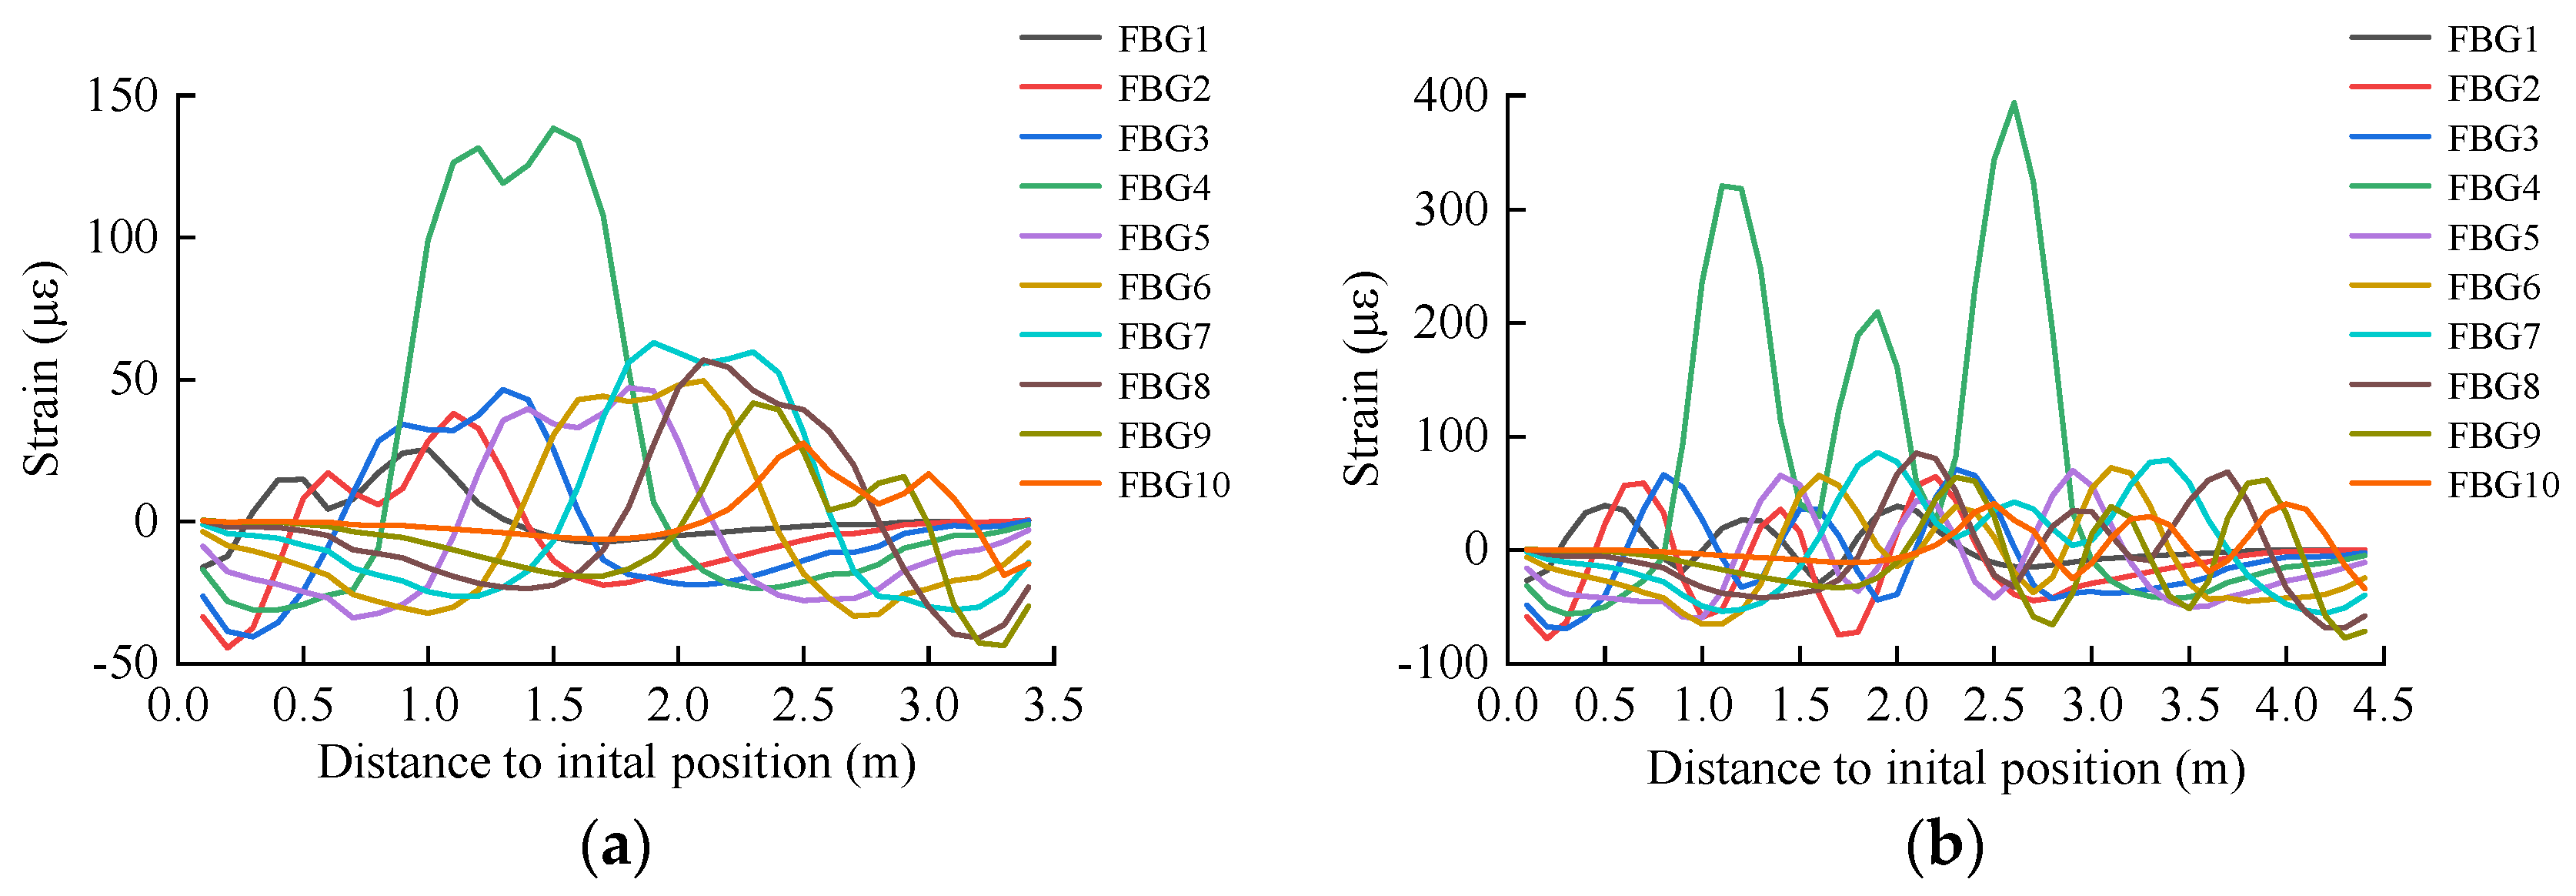
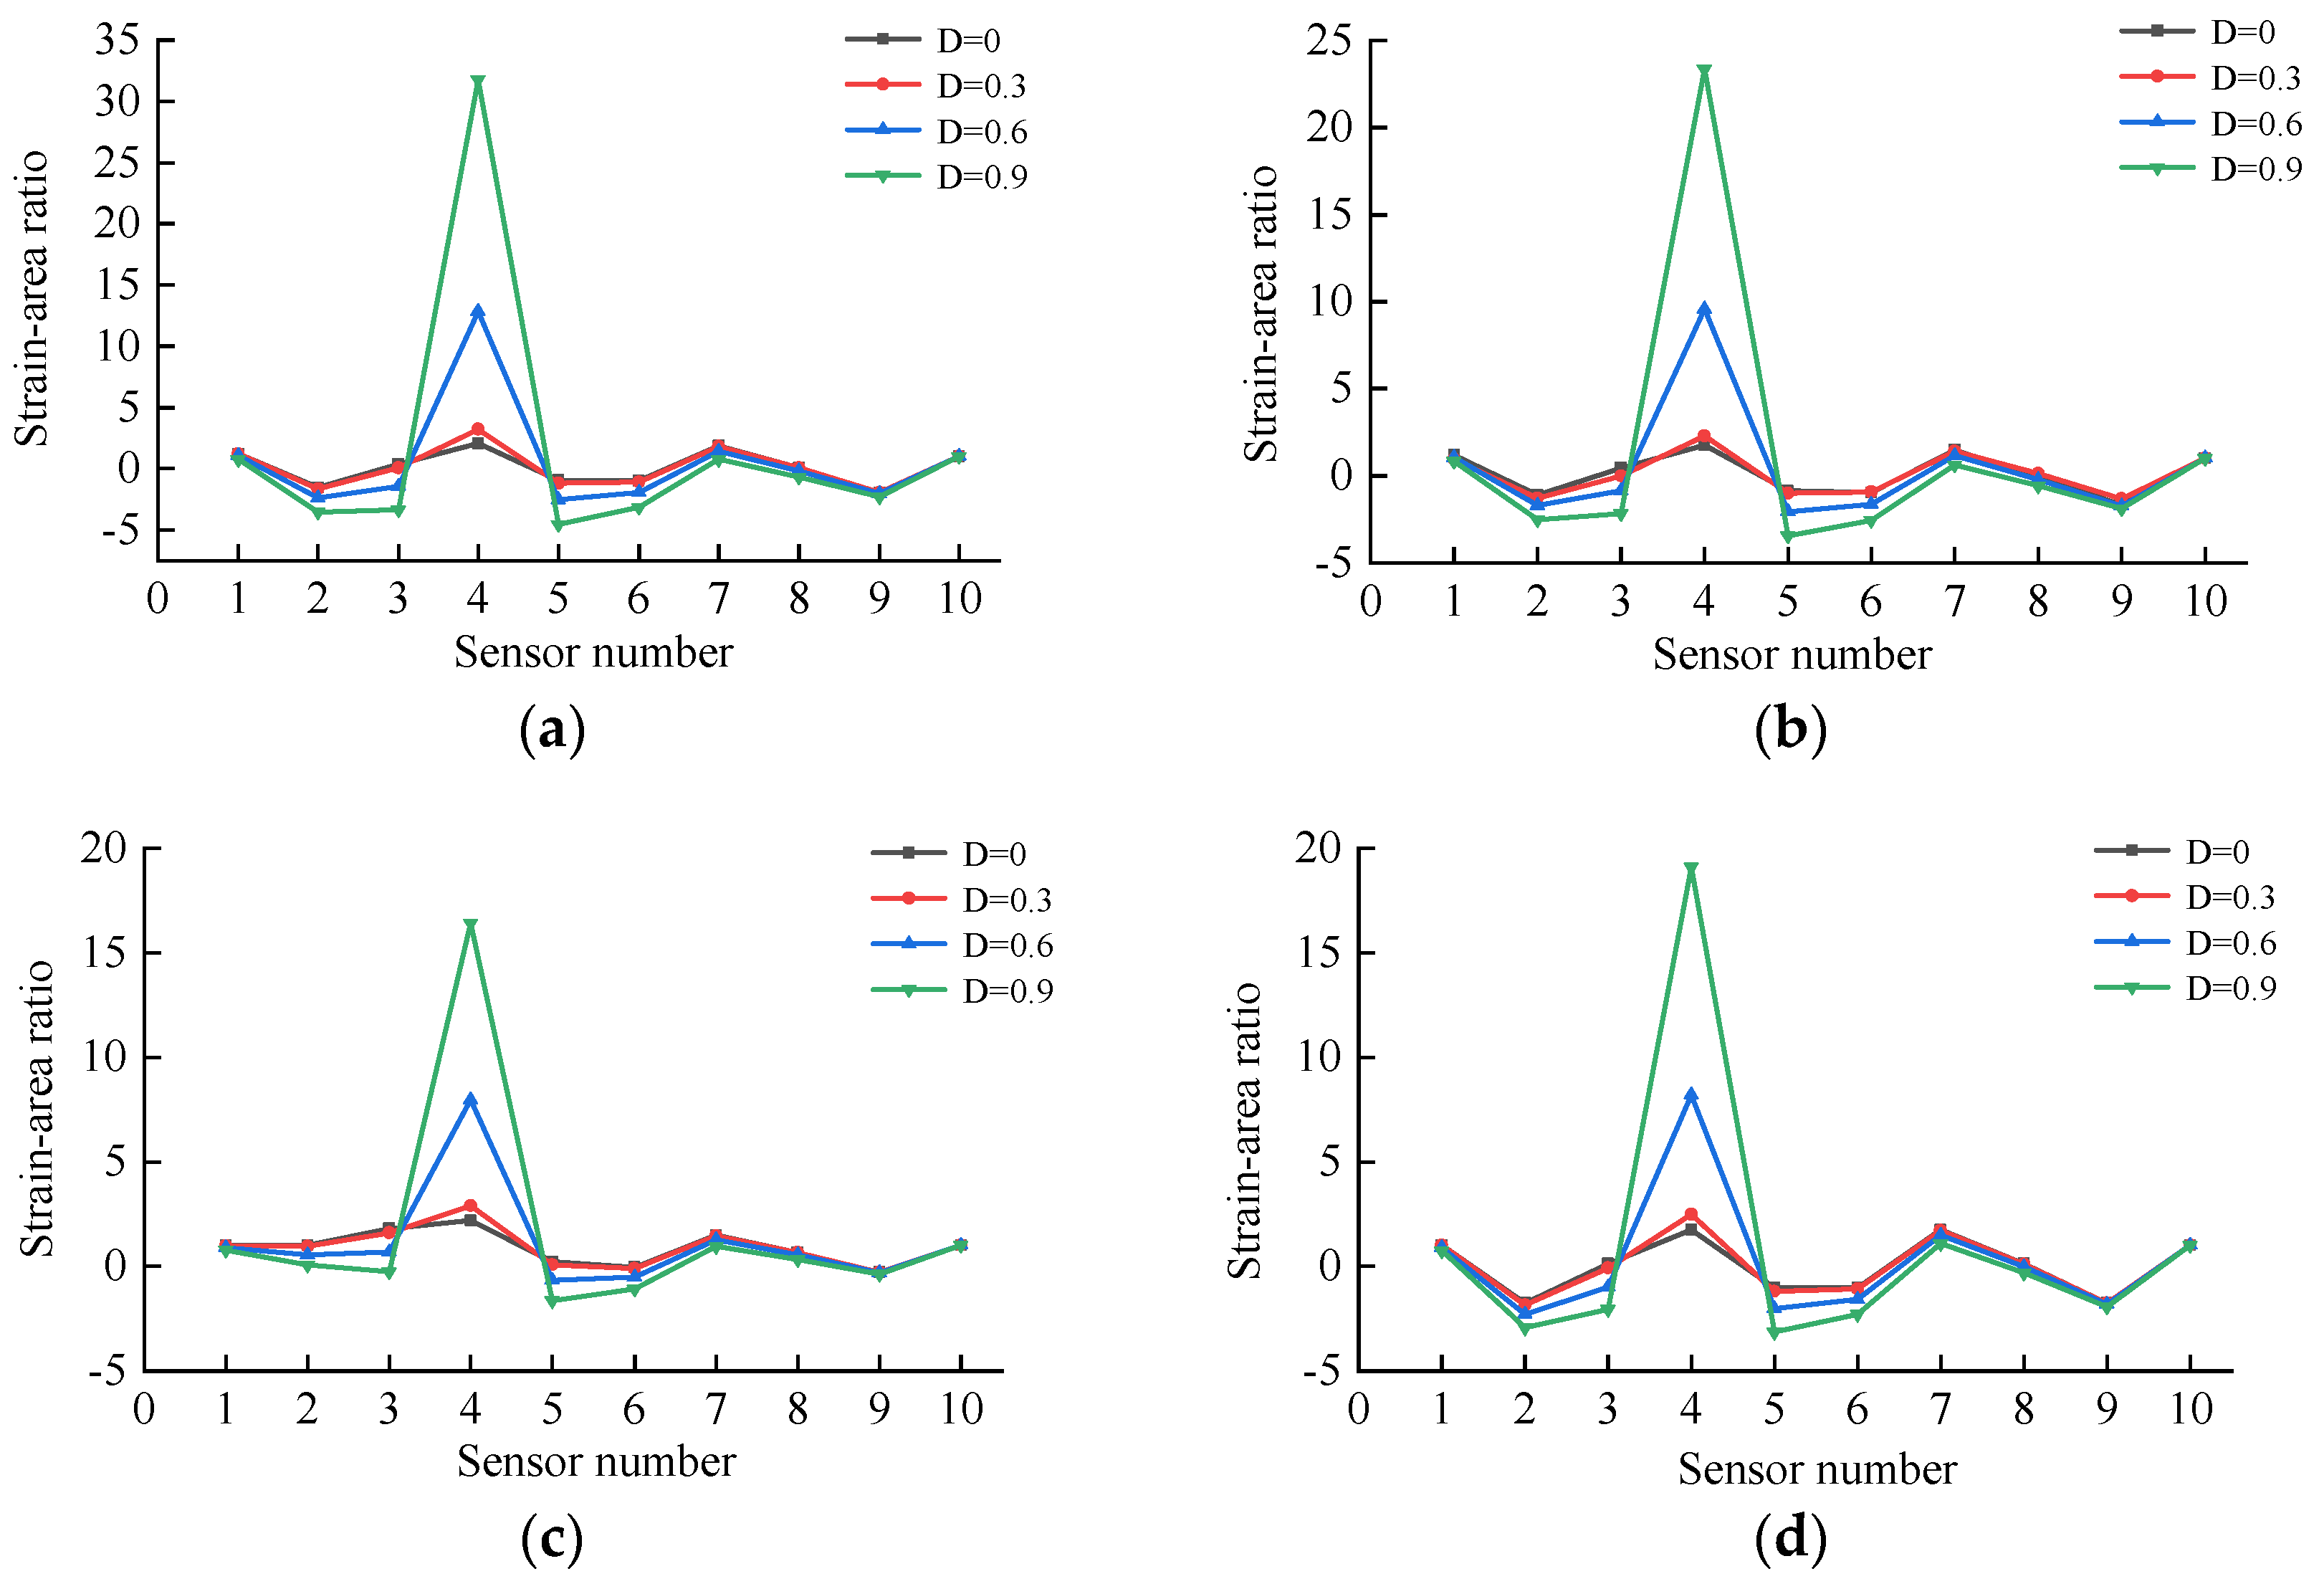
For single crack identification, the crack was set at sensor location No. 4; for multiple crack identification, the crack was set at sensor locations No. 4 and No. 6. The strain change curves for each FBG sensor location were extracted by applying the B-737-800 load.

3.2.1. Single Crack

The strain change curves of each FBG sensor under different degrees of cracking are shown in Figure 14, with the increase of the degree of cracking, the strain peak of sensor No. 4 increases, and the strain measured by other position sensors changing less. Calculate the envelope area ratio of the strain curve of each sensor position, and obtain the distribution curve as shown in Figure 15; it can be found that, with the increase of the degree of cracking, the area ratio of the No. 4 sensor position increases, and the other position sensors hardly change, so the method can be utilized for the identification of a single crack development position, but when the degree of cracking development is smaller, the identification of the method is not obvious.

3.2.2. Multiple Cracks

Figure 16 shows that as the degree of crack development increases in two different locations, the peak strains of sensors No. 4 and No. 6 increase, and the strains measured by the other location sensors change less. Calculating the envelope area ratio of the strain curve at each sensor position, the distribution curve is obtained as shown in Figure 17, which is consistent with the single crack identification results. Therefore, this method can be utilized to identify multiple cracks.

3.3. Analysis of Influencing Factors

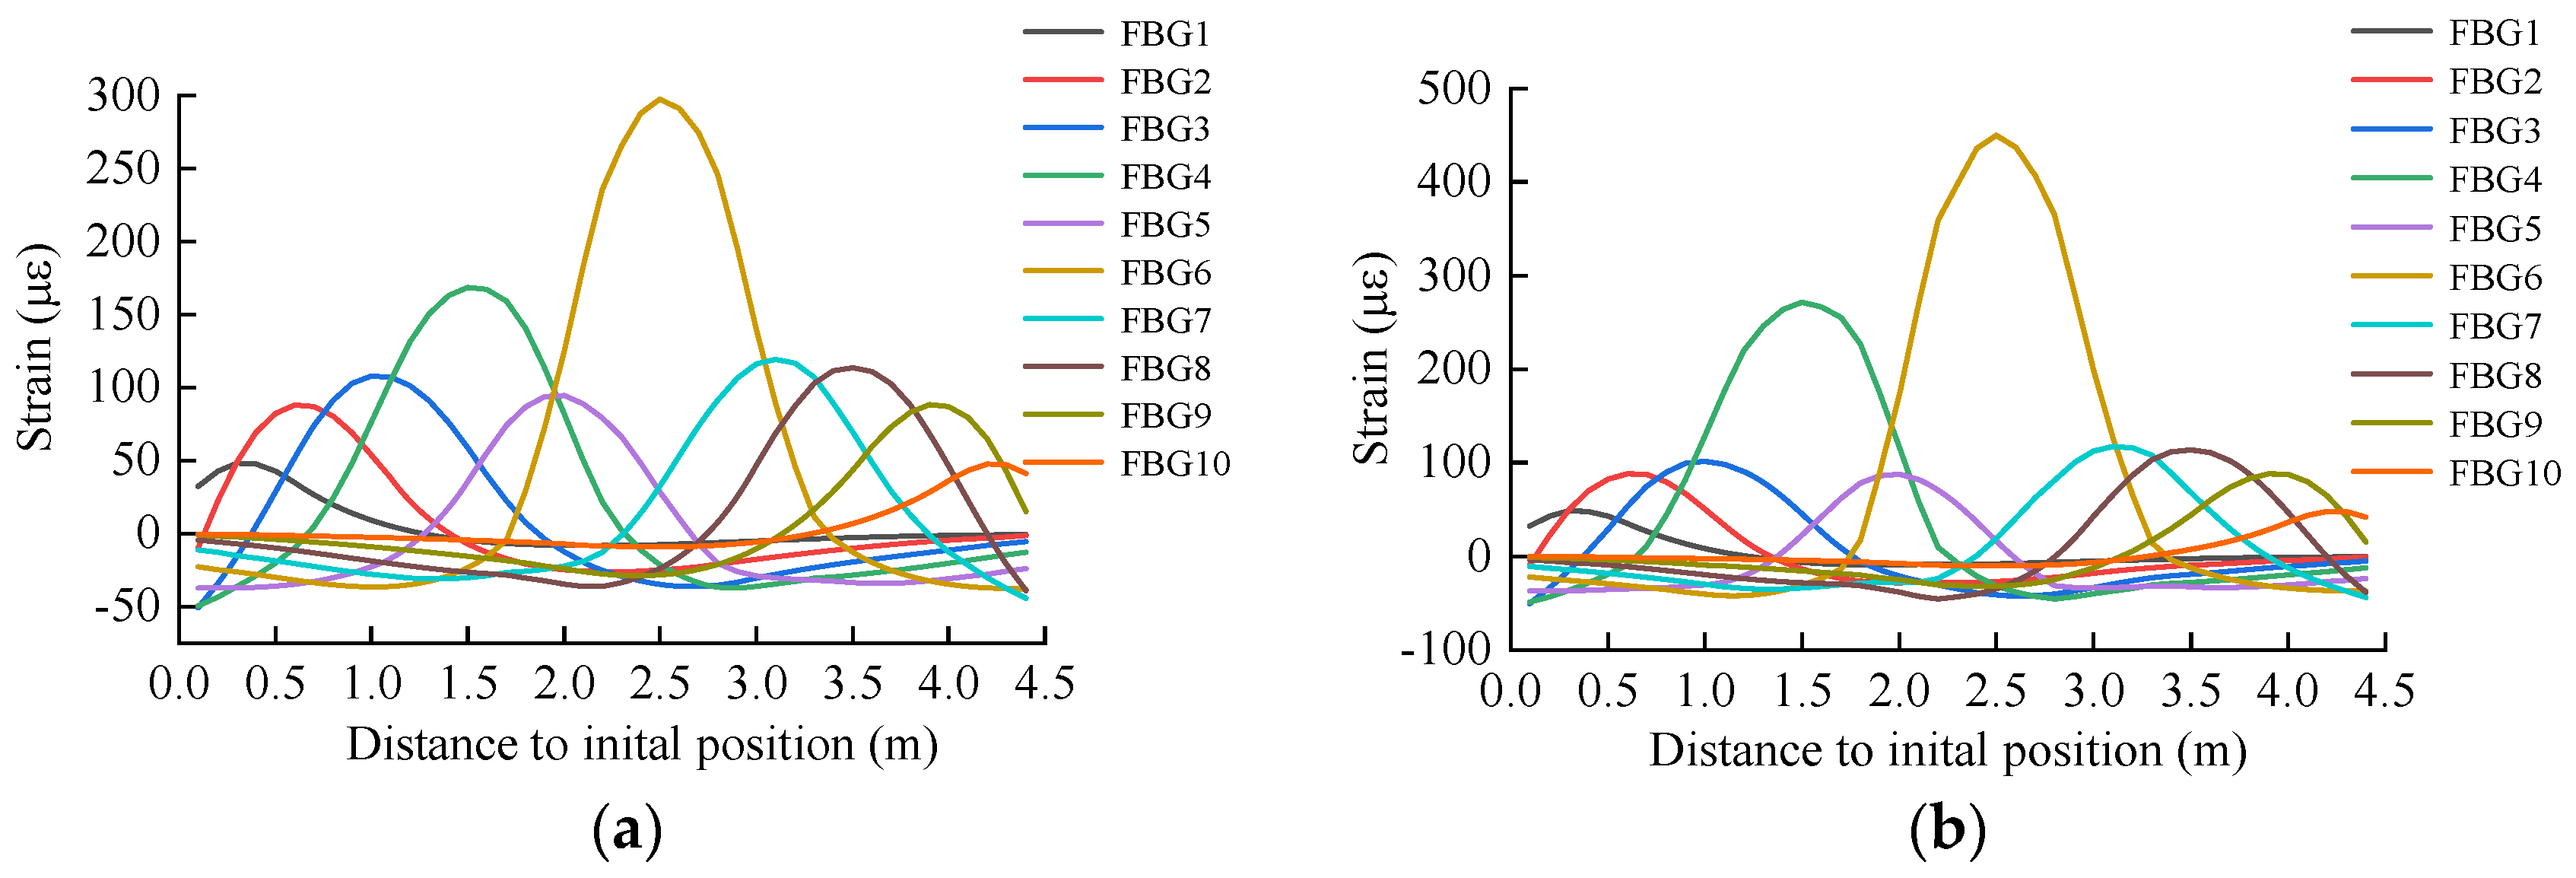
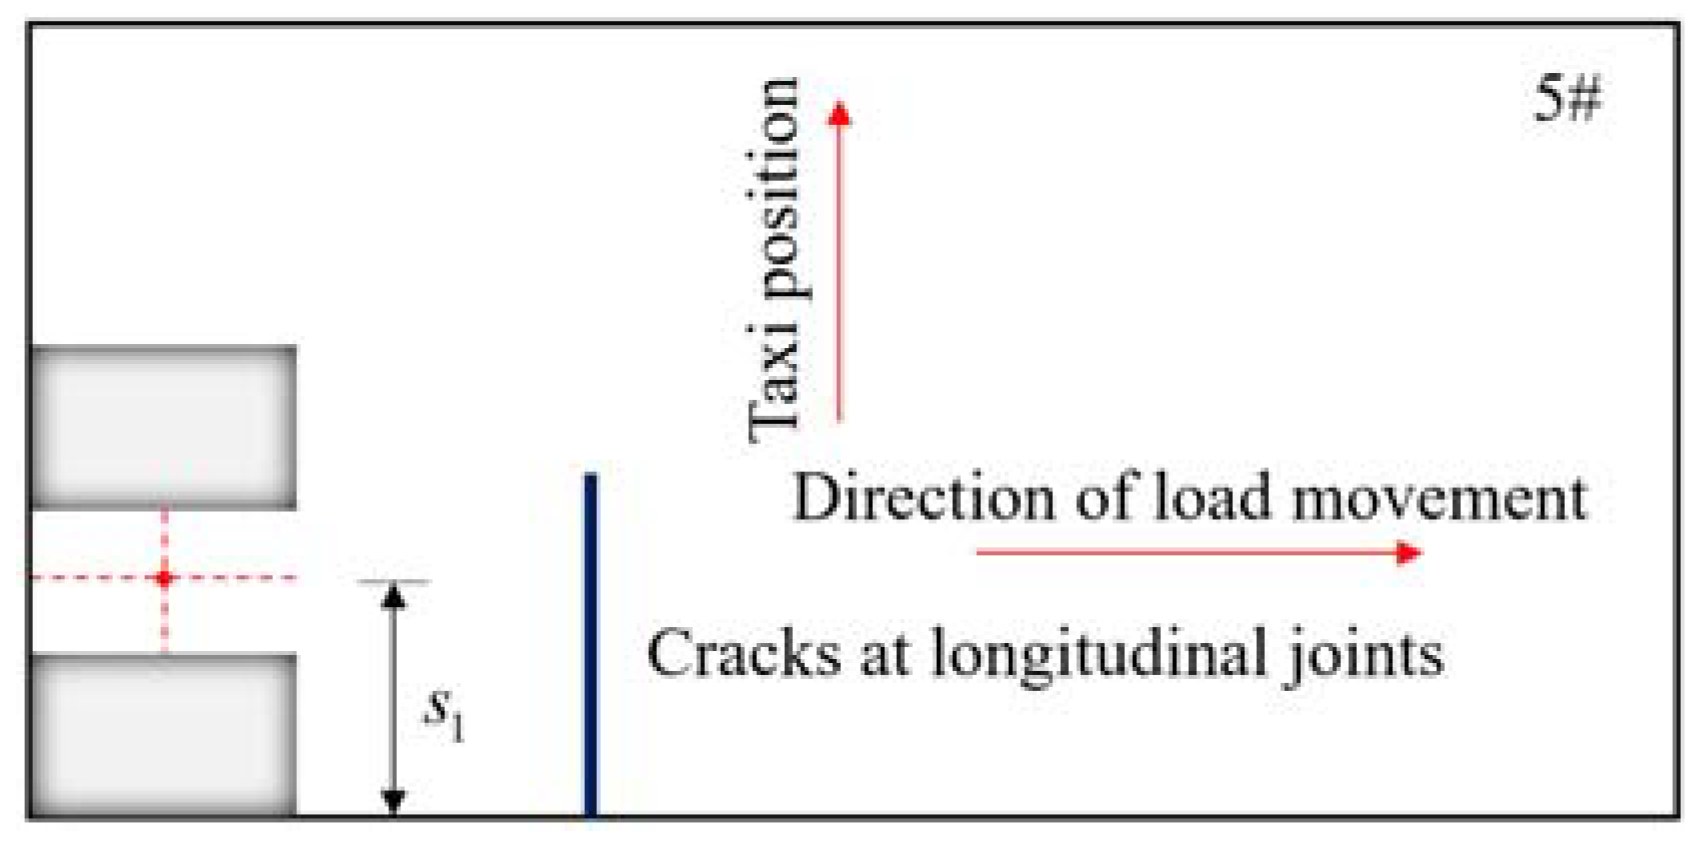
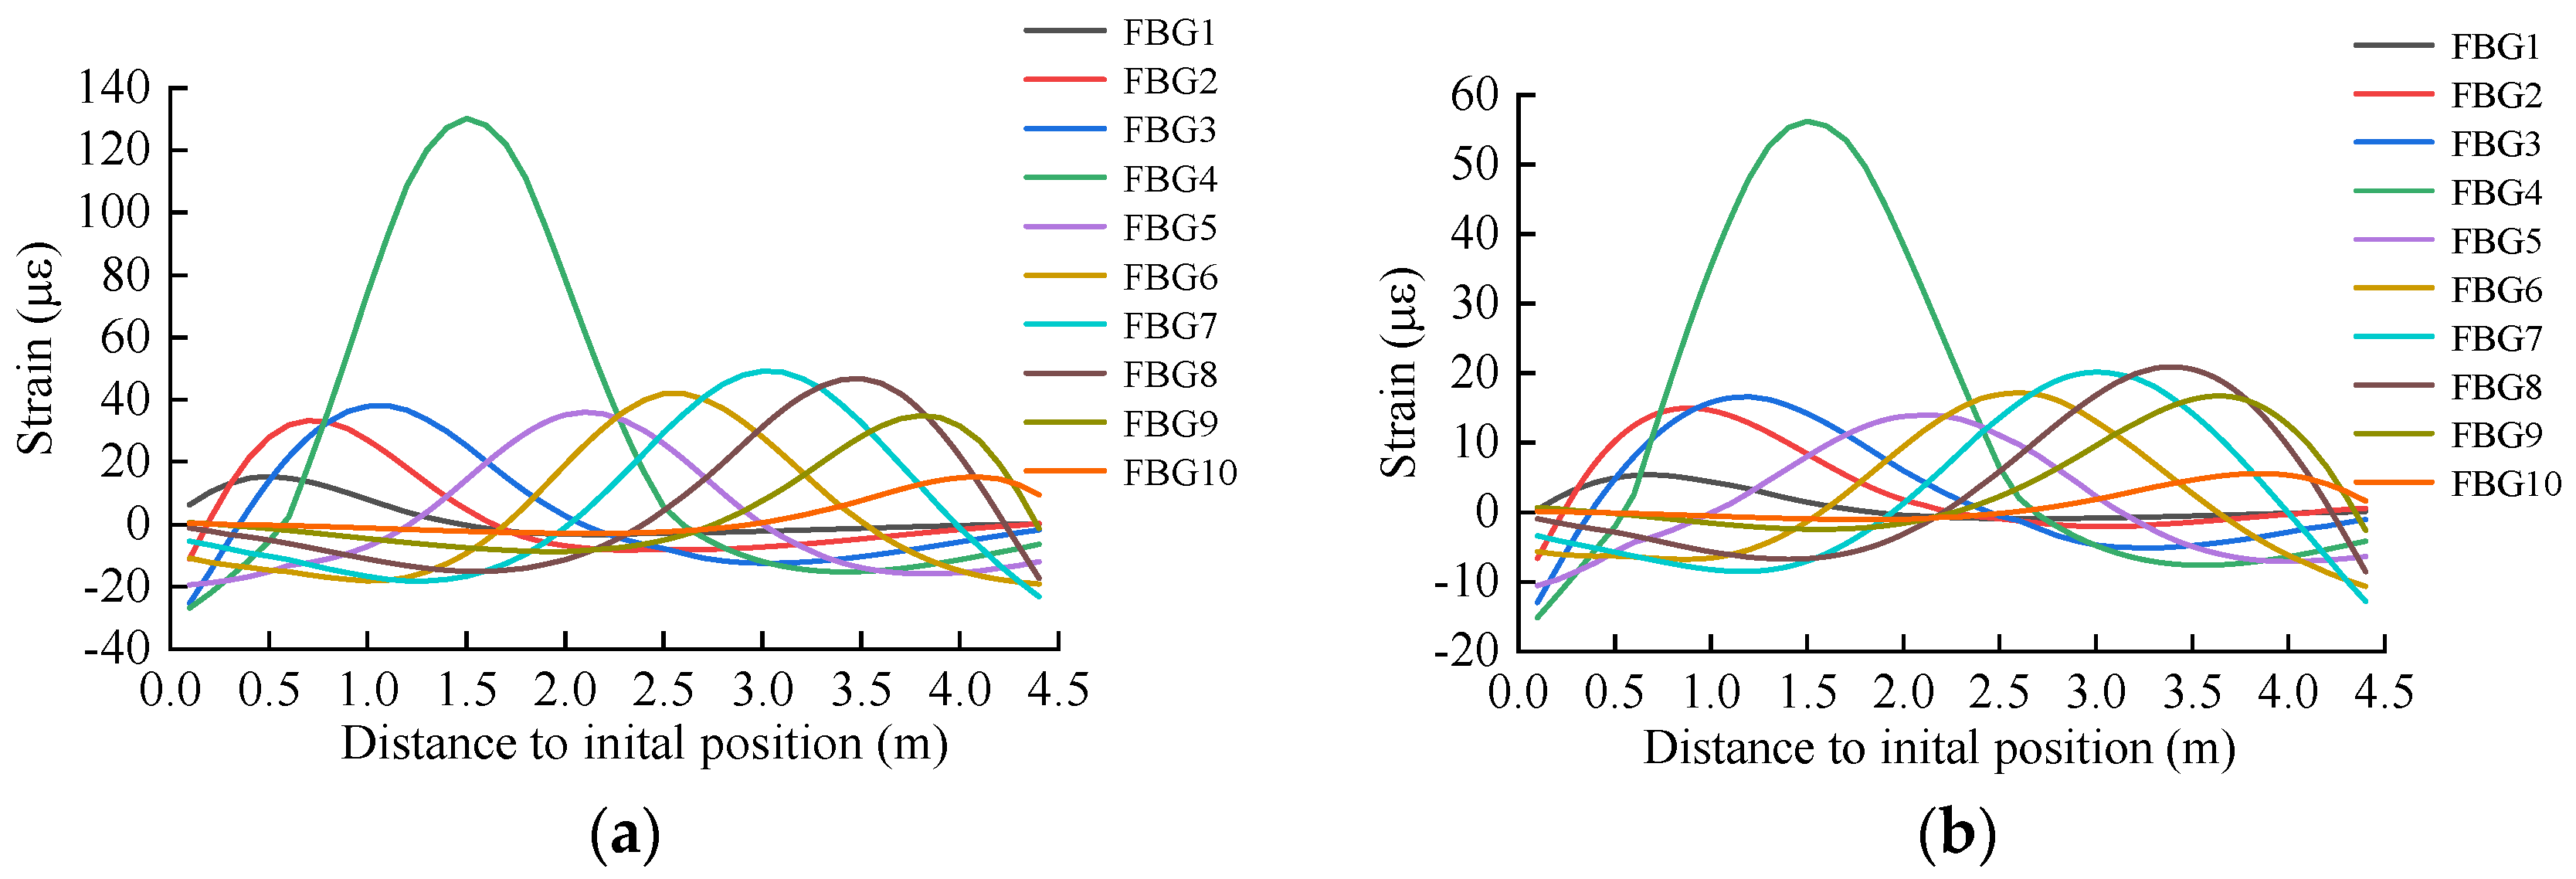
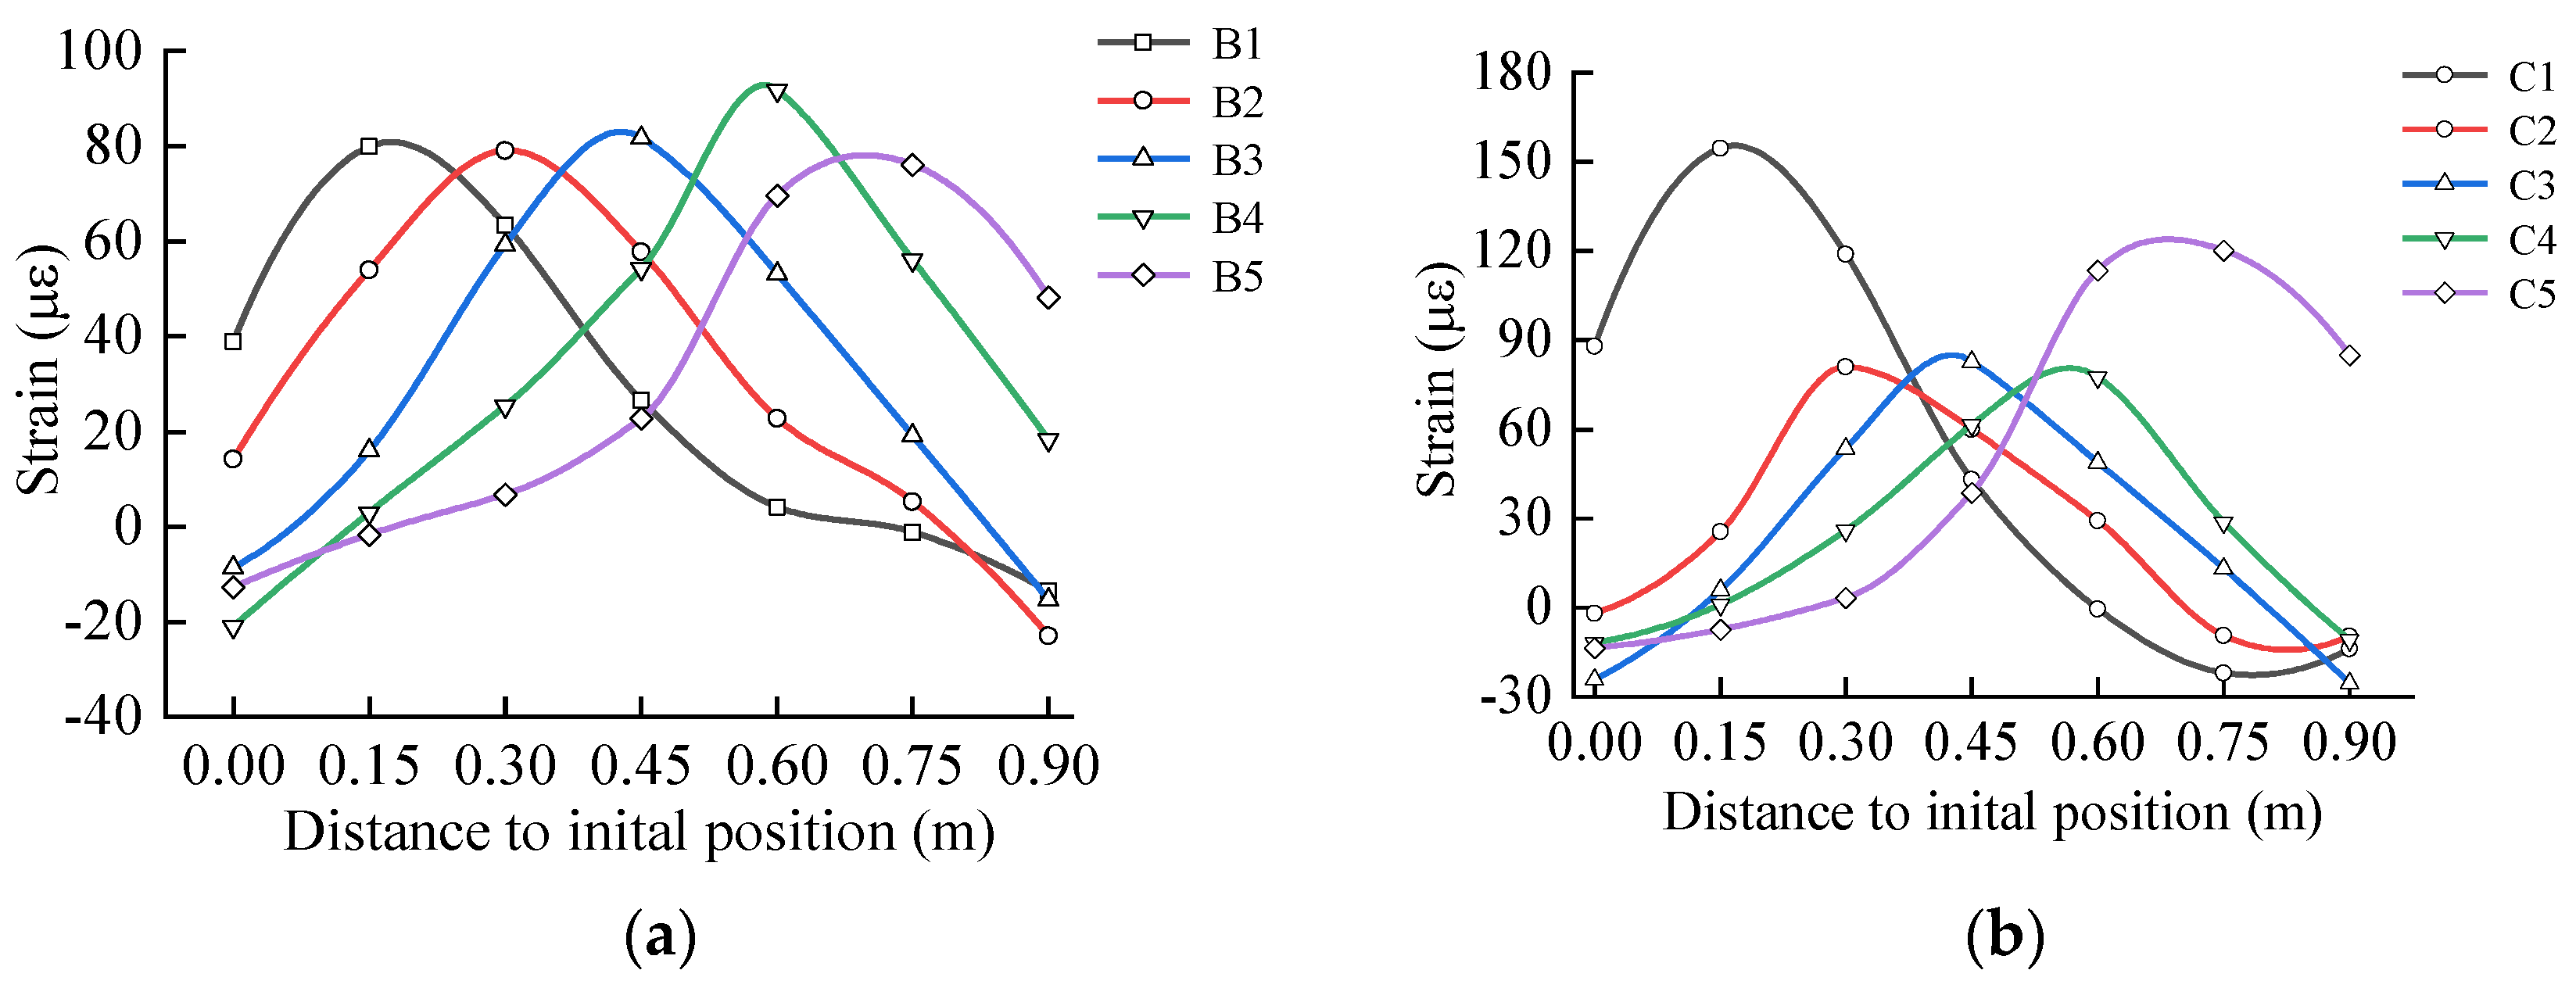
3.3.1. Aircraft Taxiing Position

Different types of airplanes are unable to identify the cracks due to the different wheel spacing of the main landing gear and the main landing gear spacing, resulting in the fact that the skidding trajectory of the airplane is not necessarily at the board edge position during the taxiing process, and the deviation of the sensor position from the loaded position makes the measured strain decrease and the strain curve characteristics not obvious, etc. Therefore, it is necessary to analyze and discuss the skidding position of the airplane. In the case of D = 0.5, the envelope area ratios of the strain curves of different sensors are calculated, respectively, at the load center distance from the longitudinal edge position of 0.2 m, 0.4 m, 0.6 m, 1.2 m, 1.4 m, and 1.6 m, to determine whether the crack identification is possible. As shown in Figure 18, a schematic diagram of the aircraft taxiing position, the distance from the load center to the longitudinal edge of the B-737-800 model is s 1 .
Figure 19 shows the strain change curves of each sensor location under the conditions of 0.6 m and 1.2 m, and it can be found that with the increase of s 1 , each strain peak decreases with the increase of the distance between the load and the sensor, and the maximum strain decreases by 60 με. Calculate the envelope area ratio of the strain curve at each sensor location, and obtain the distribution curve as shown in Figure 20; at the crack location, the envelope area ratio of the strain curve decreases with the increase, and the envelope area ratio of the strain curve at other locations almost does not change, so it can be seen that the airplane taxiing position has only small effects on the crack identification method in this paper.

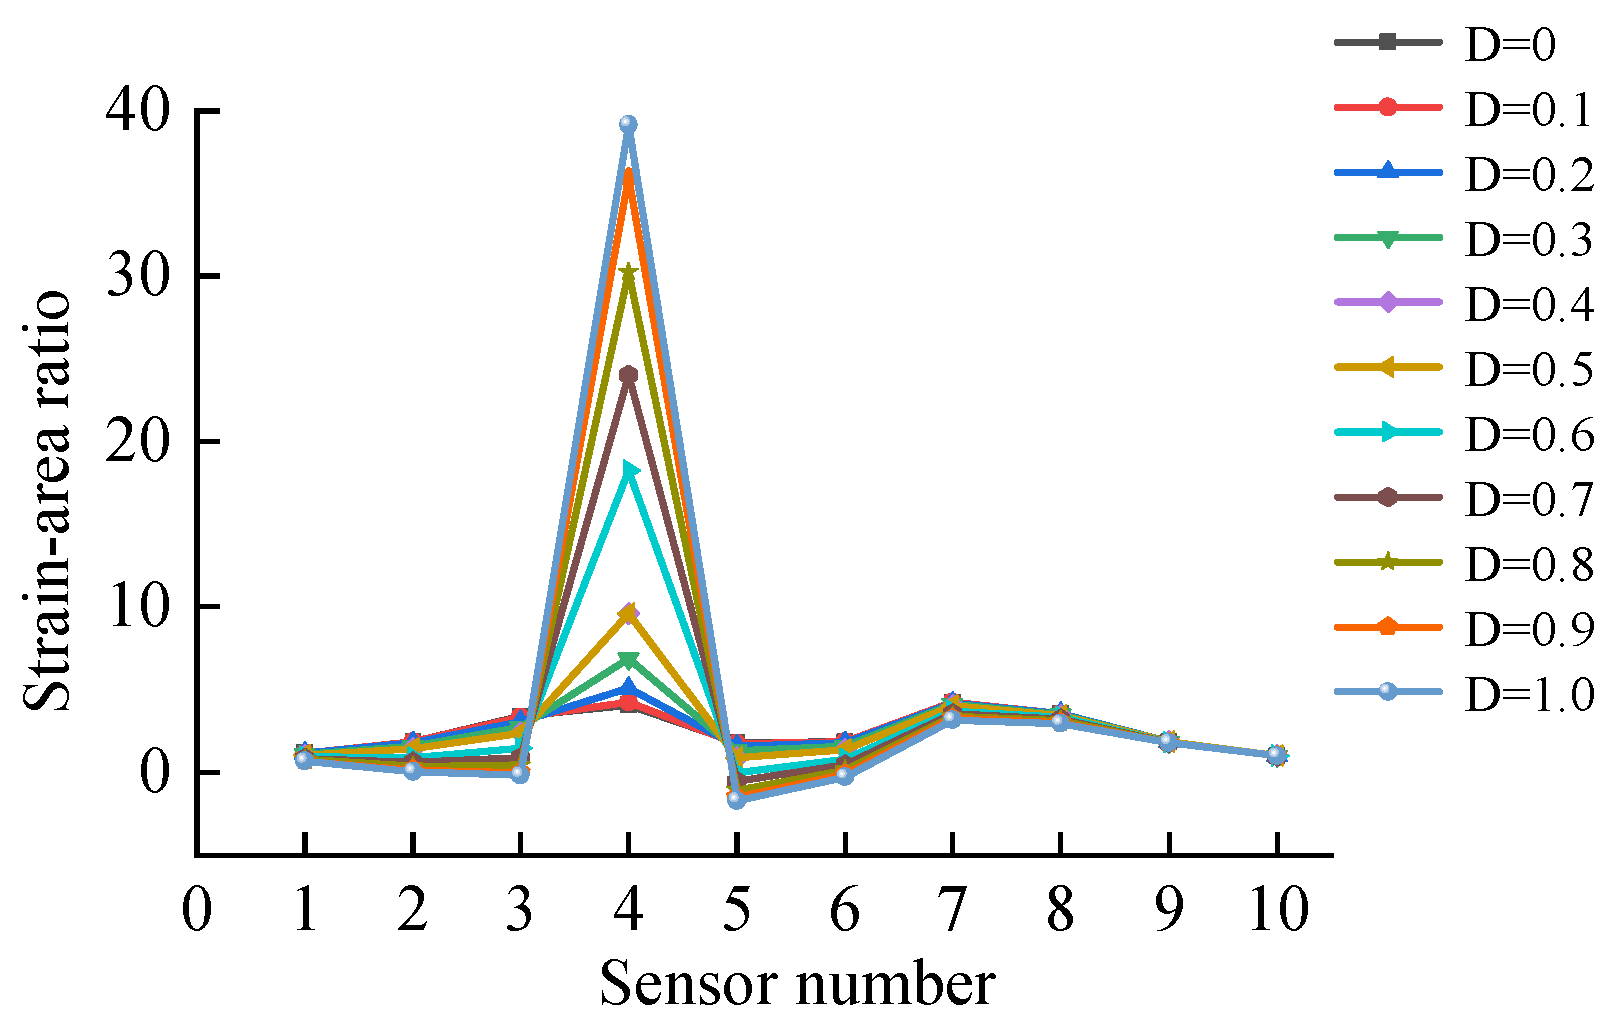
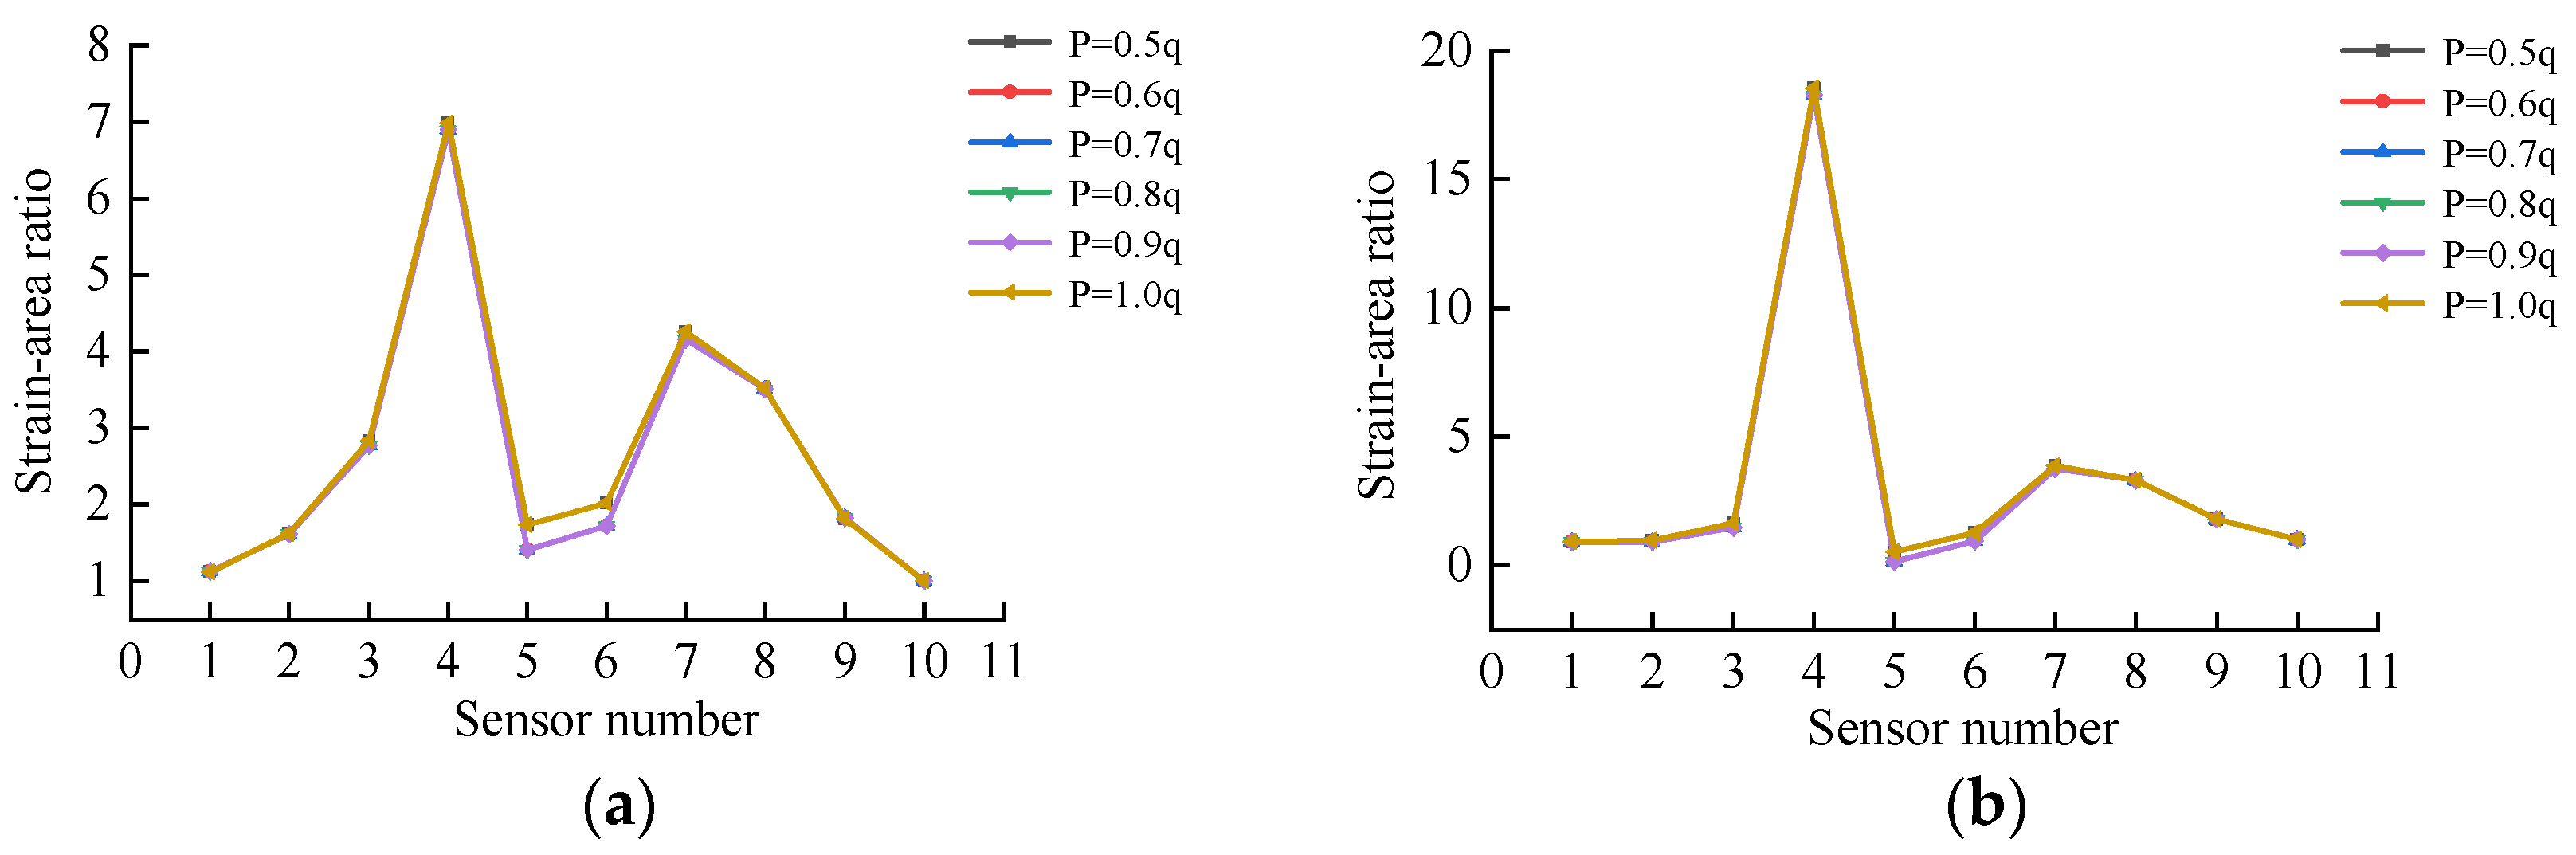
3.3.2. Aircraft Load Value

As the aircraft in the taxiing process, the load applied to the pavement depends on the aircraft weight, taxiing speed and fuel weight, etc., so the method of this paper may be affected under the action of different loads on the same model, so different load levels are taken for analysis. The empty weight of B-737-800 aircraft is about 0.5 times of the maximum taxiing weight, so the tire pressure of the aircraft is chosen to be 0.5~1.0 times of the tire pressure for analysis. As shown in Figure 21, under D = 0.3 and D = 0.6 conditions, the envelope area ratios of the strain curves at each sensor location are almost coincidental, and the identification method in this paper will not be affected by the size of the airplane load.

3.3.3. Aircraft Type

The method may not be applicable for other aircraft types, so four aircraft types, Su-30, A320, A330-300, and B-777-300ER, were selected for analysis. The parameters of the above airplane models are shown in Table 3. The location of the crack is at sensor No. 4 and the degree of crack development is taken as D = 0, 0.3, 0.6, 0.9.
Figure 22 shows the strain curves obtained from each sensor position for the A320 and B777-300ER models taxiing through the pavement with a longitudinal crack development degree of D = 0.5. It can be found that for the two-axis model, the strain curve has two peaks when passing a certain sensor position, and the three-axis model has three peaks when passing, so it is more advantageous to use the envelope area ratio of the strain curve for crack identification than the peak ratio of the strain curve. By comparing the two models of A320 and A330-300, the difference of the corresponding horizontal coordinates of the two peak points is related to the axial distance of the landing gear, and the larger the load of the airplane is, the larger the strain peak is obtained, and the more obvious the characteristics of the strain curve is.
Calculate the envelope area ratio of the strain curve at each sensor position, and get the distribution curve as shown in Figure 23. For different models, the envelope area ratio of the strain curve hardly changes at the position of no crack, and at the position of crack, the envelope area ratio of the strain curve gradually increases with the degree of development of the crack, so that for different models, the method can also recognize the crack.

4. Loading Test with Small-Scale Model of Prefabricated Concrete Pavement

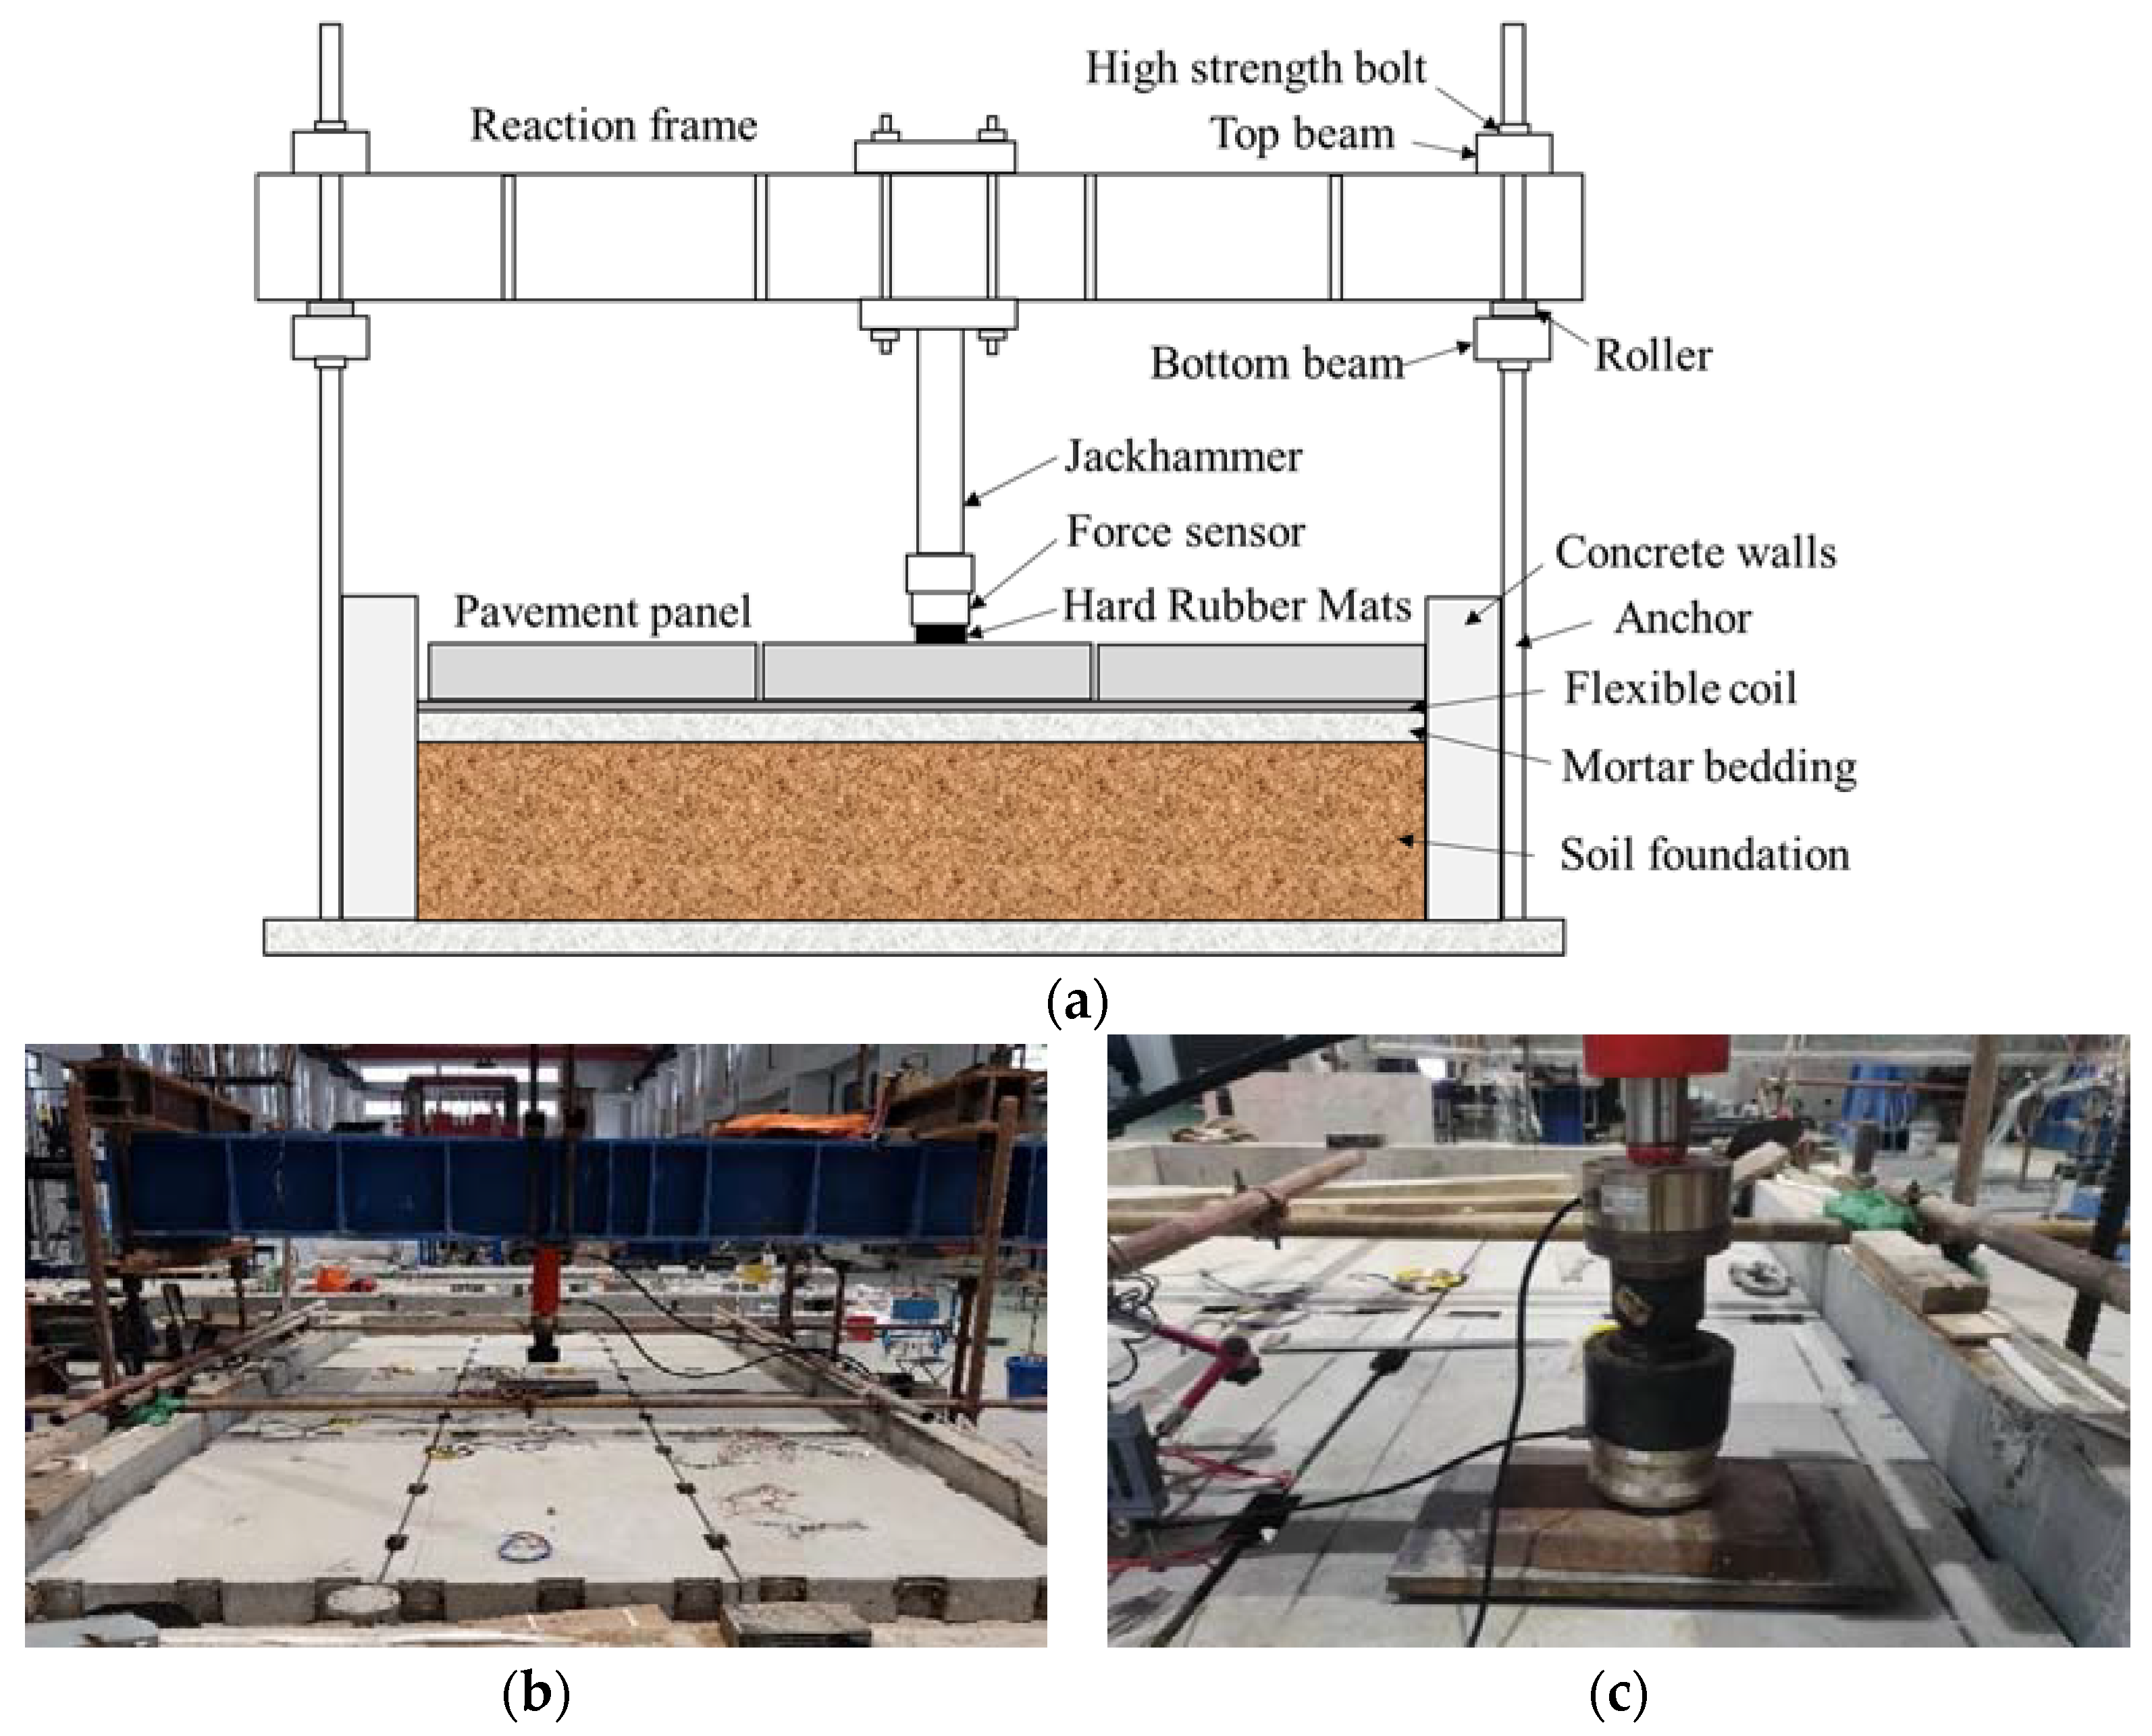
4.1. Experimental Setup

4.1.1. Test Scaling and Model Parameters

The small-scale model test takes the prefabricated pavement structure as a prototype, and under the premise of meeting the test requirements, the important components are scaled down and the non-important components are simplified. According to the magnitude analysis and similarity theory, the geometric scale similarity coefficient of 3:10 is taken as the standard to scale down the design of the pavement structure. Among them, the diameter of reinforcement bar is 8 mm, model HRB400, and the reinforcement bar adopts double-layer bi-directional arrangement with a spacing of 90 mm, and the thickness of upper and lower protective layer is 15 mm; in order to ensure that there is enough welding area, the connecting part also adopts 8 mm reinforcing bar, and the structural parameters are as shown in Table 4. B-737-800 model was chosen as the test loading model, also scale the load surface according to the ratio of 3:10. Keep the tire pressure unchanged, calculate the applied load of the small-scale model test. The specific parameters are shown in Table 5.

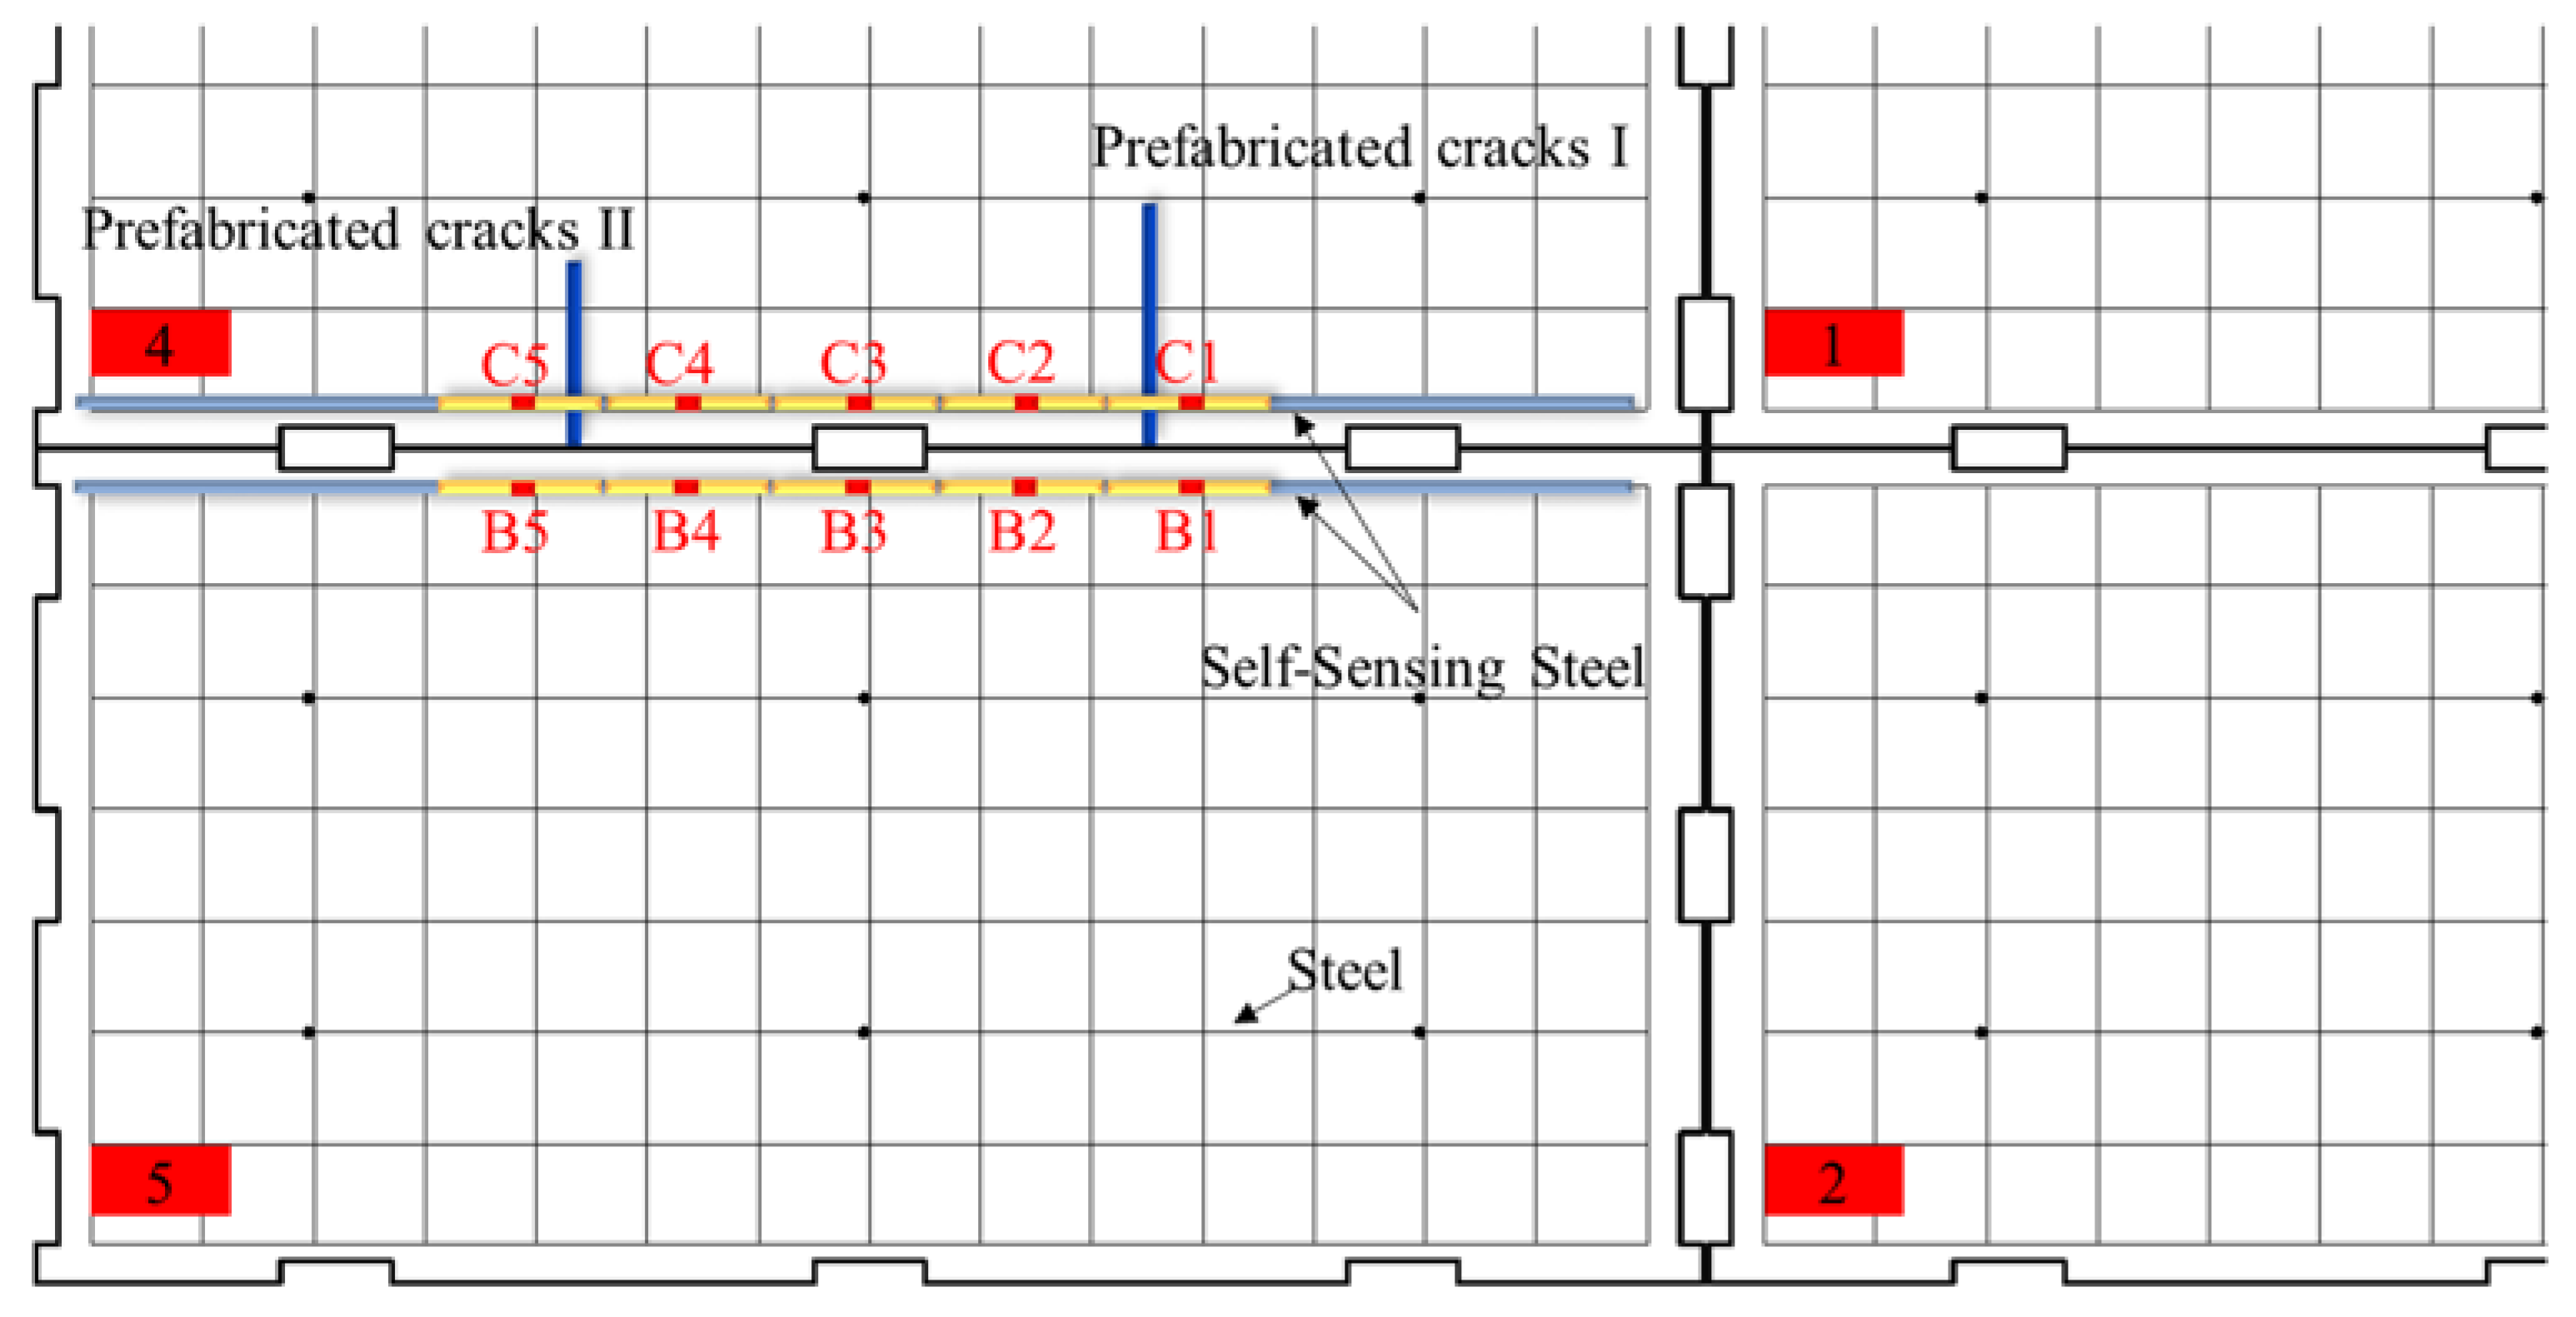
4.1.2. Monitoring System Design

It is only necessary to set the crack location within the marked distance segment of the FBG sensors and the number of sensors is not limited. Therefore, according to Figure 24 to lay the self-sensing rebar, one only needs to lay a self-sensing rebar in the position of plate No. 4. For each self-sensing rebar, set up five fiber optic sensors. The scale distance is taken as 150 mm, which is set up in the C1 sensor position of 30 cm × 10 cm of the preset crack, in the C5 sensing position of the preset crack set up 24 cm × 8 cm. The use of C1~C5 to monitor the pavement before and after cracking the strain change curve of each sensor. Due to this test preset crack, the sensor cannot be monitored to get the No. 4 plate without cracking the strain change curve of each sensor. Therefore, a self-sensing rebar is deployed at the longitudinal edge of plate No. 5, as shown in Figure 24, and the strain data obtained from B1~B5 are utilized to replace the strain data obtained from each sensor when there is no cracking in plate No. 4. The feasibility of this scheme was analyzed using finite elements; as shown in Figure 25, when no cracks were generated in each plate, the strain change curve generated by C3 when the aircraft load was taxiing at the longitudinal edge position of the No. 4 plate coincided with the strain change curve generated by B3 when the plate was taxiing at the longitudinal edge position of the No. 5 plate, and thus the test scheme could be implemented.

4.1.3. Performance Analysis of Self-Sensing Reinforcement and Strain Sensing
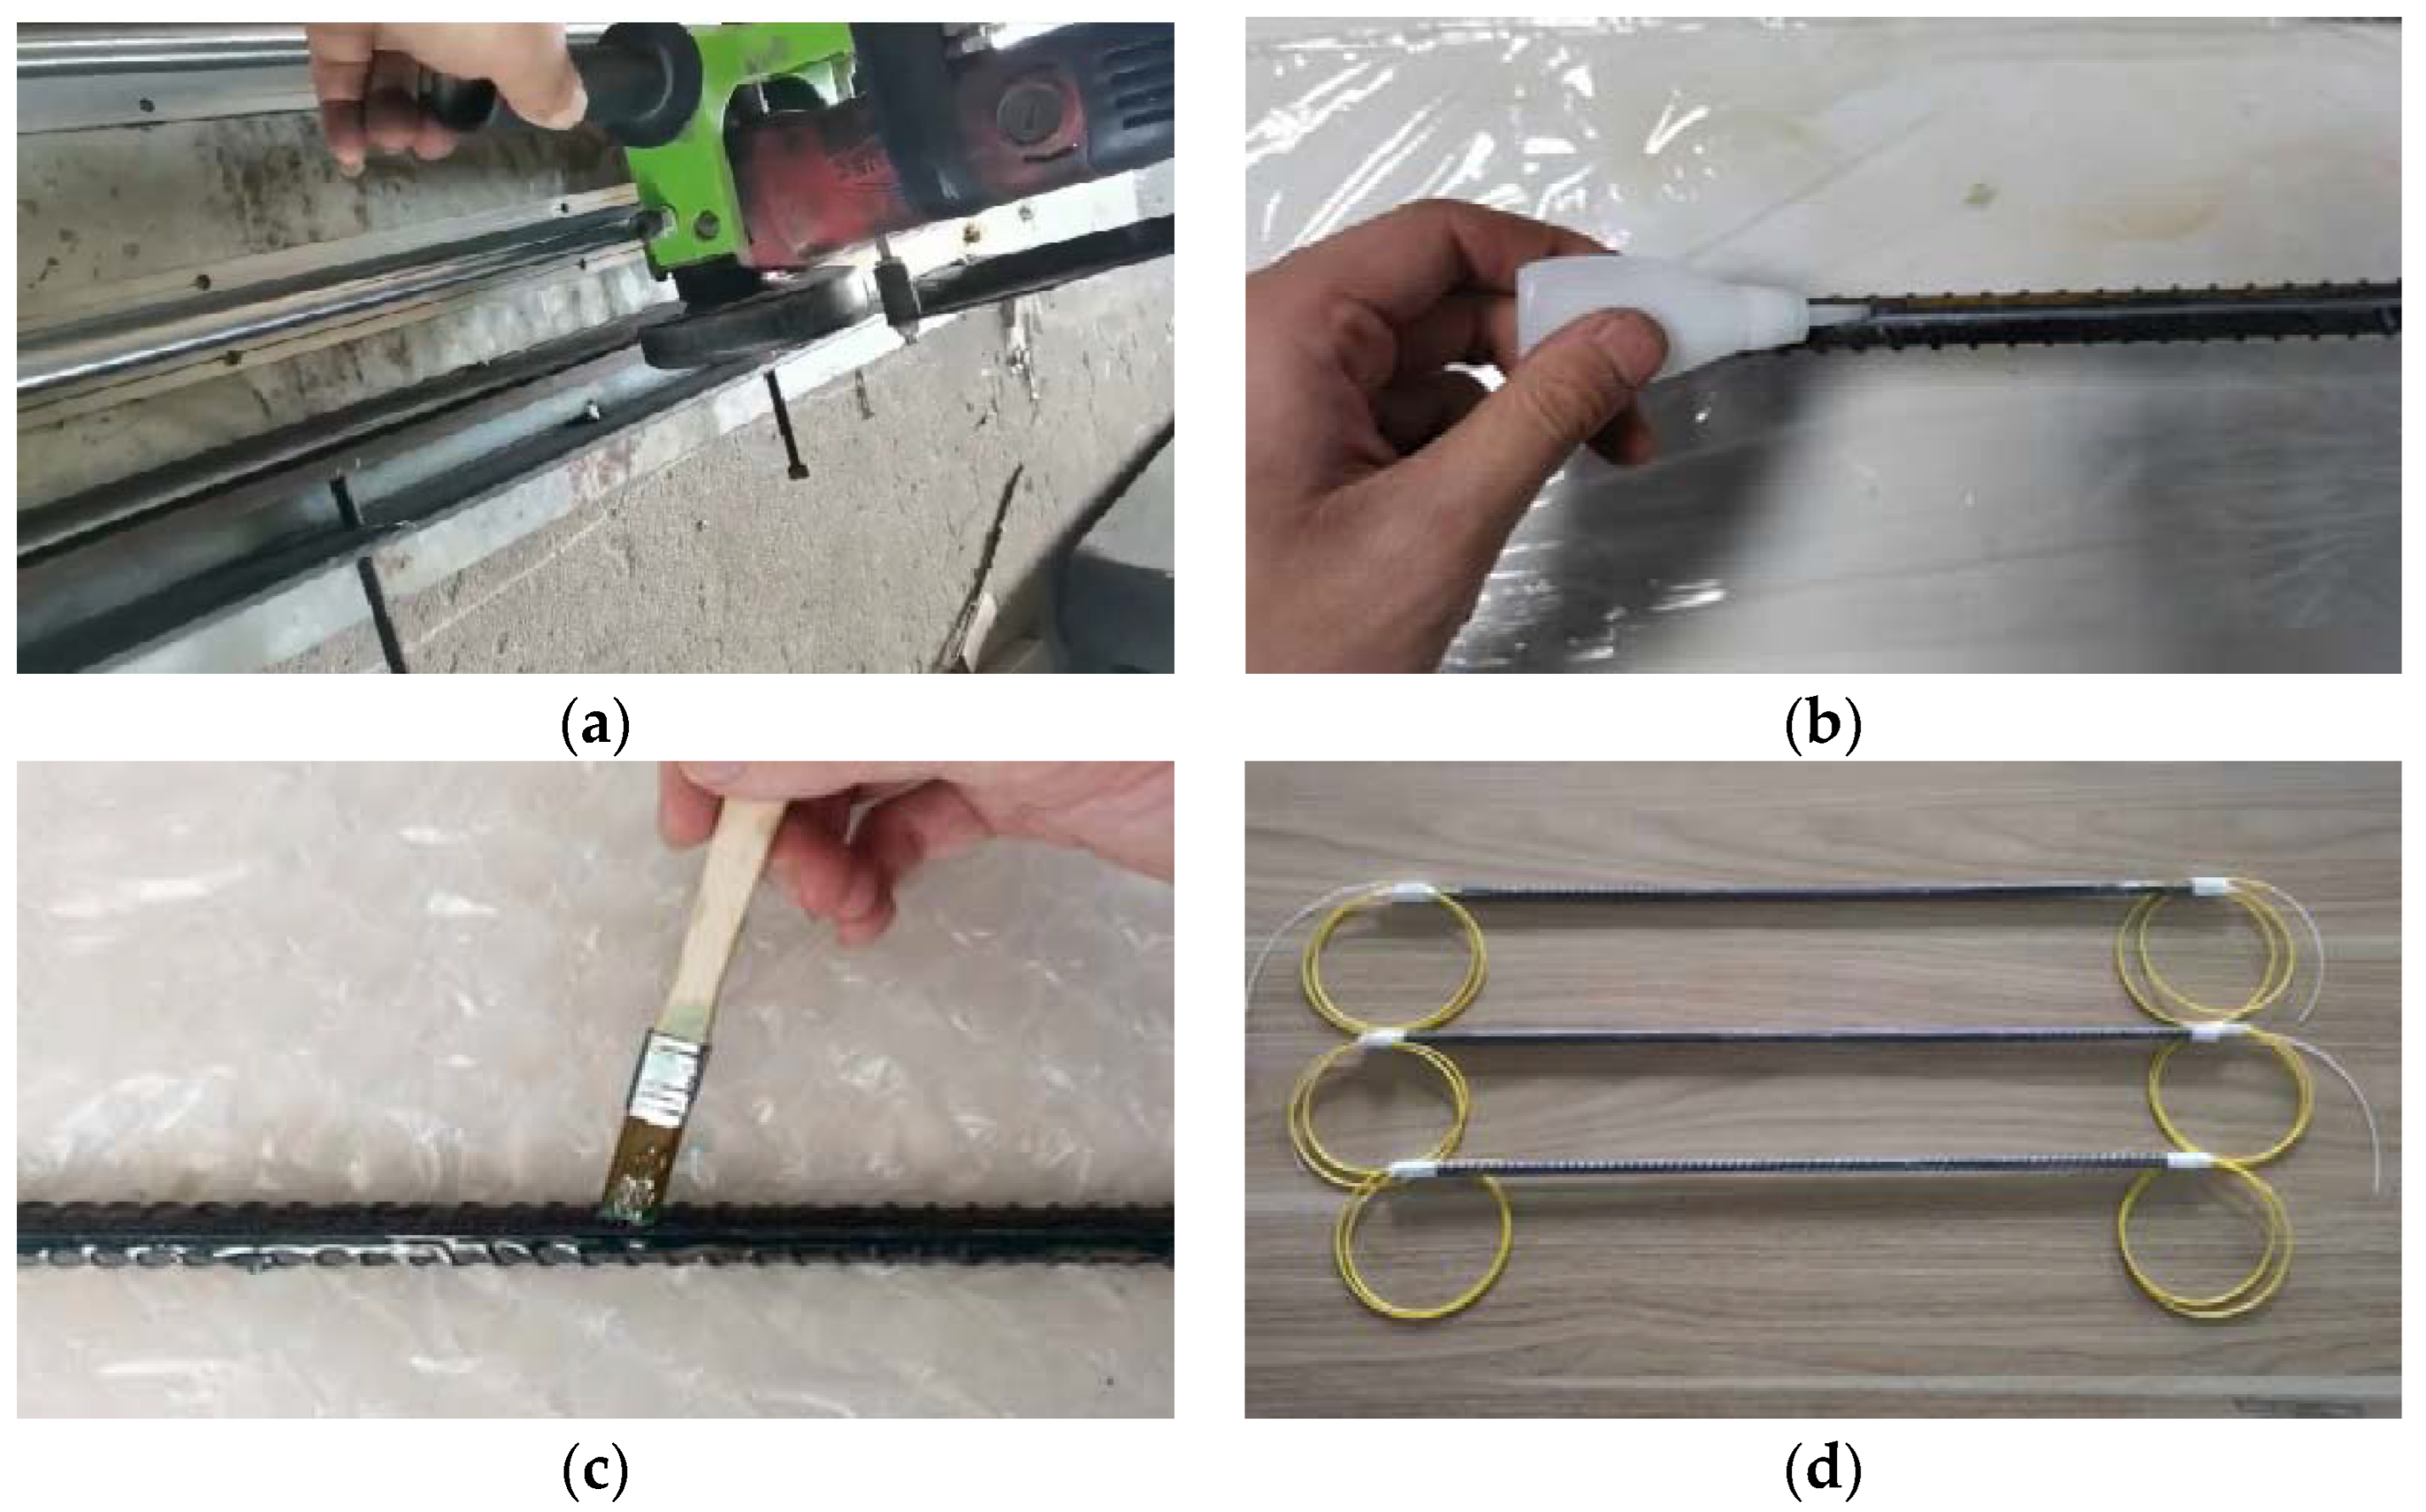
(1)
Self-sensing steel fabrication
According to the monitoring program of this paper, the marking distance of the self-sensing bar in the actual road surface is 500 mm, and the marking distance of the self-sensing bar in the small-scale model test is 150 mm, so the self-sensing bar with a marking distance of 150 mm is produced and a tensile test is carried out to investigate its strain sensing performance. The specific production process as shown in Figure 26, with a self-sensing steel bar component length of 60 cm; first of all, the steel bar tooling groove, to ensure that the groove is uniform, the width and depth of the groove is taken for the 2 mm × 2 mm, followed by the paste of bare optical fiber, the bare optical fiber is placed in the groove, threaded into the corresponding distance length of the plastic tube, the use of glue will be pasted; and finally, the epoxy resin is injected into the groove, to ensure that the groove epoxy resin filled uniformly. Following the above steps completes the self-sensing steel production.
(2)
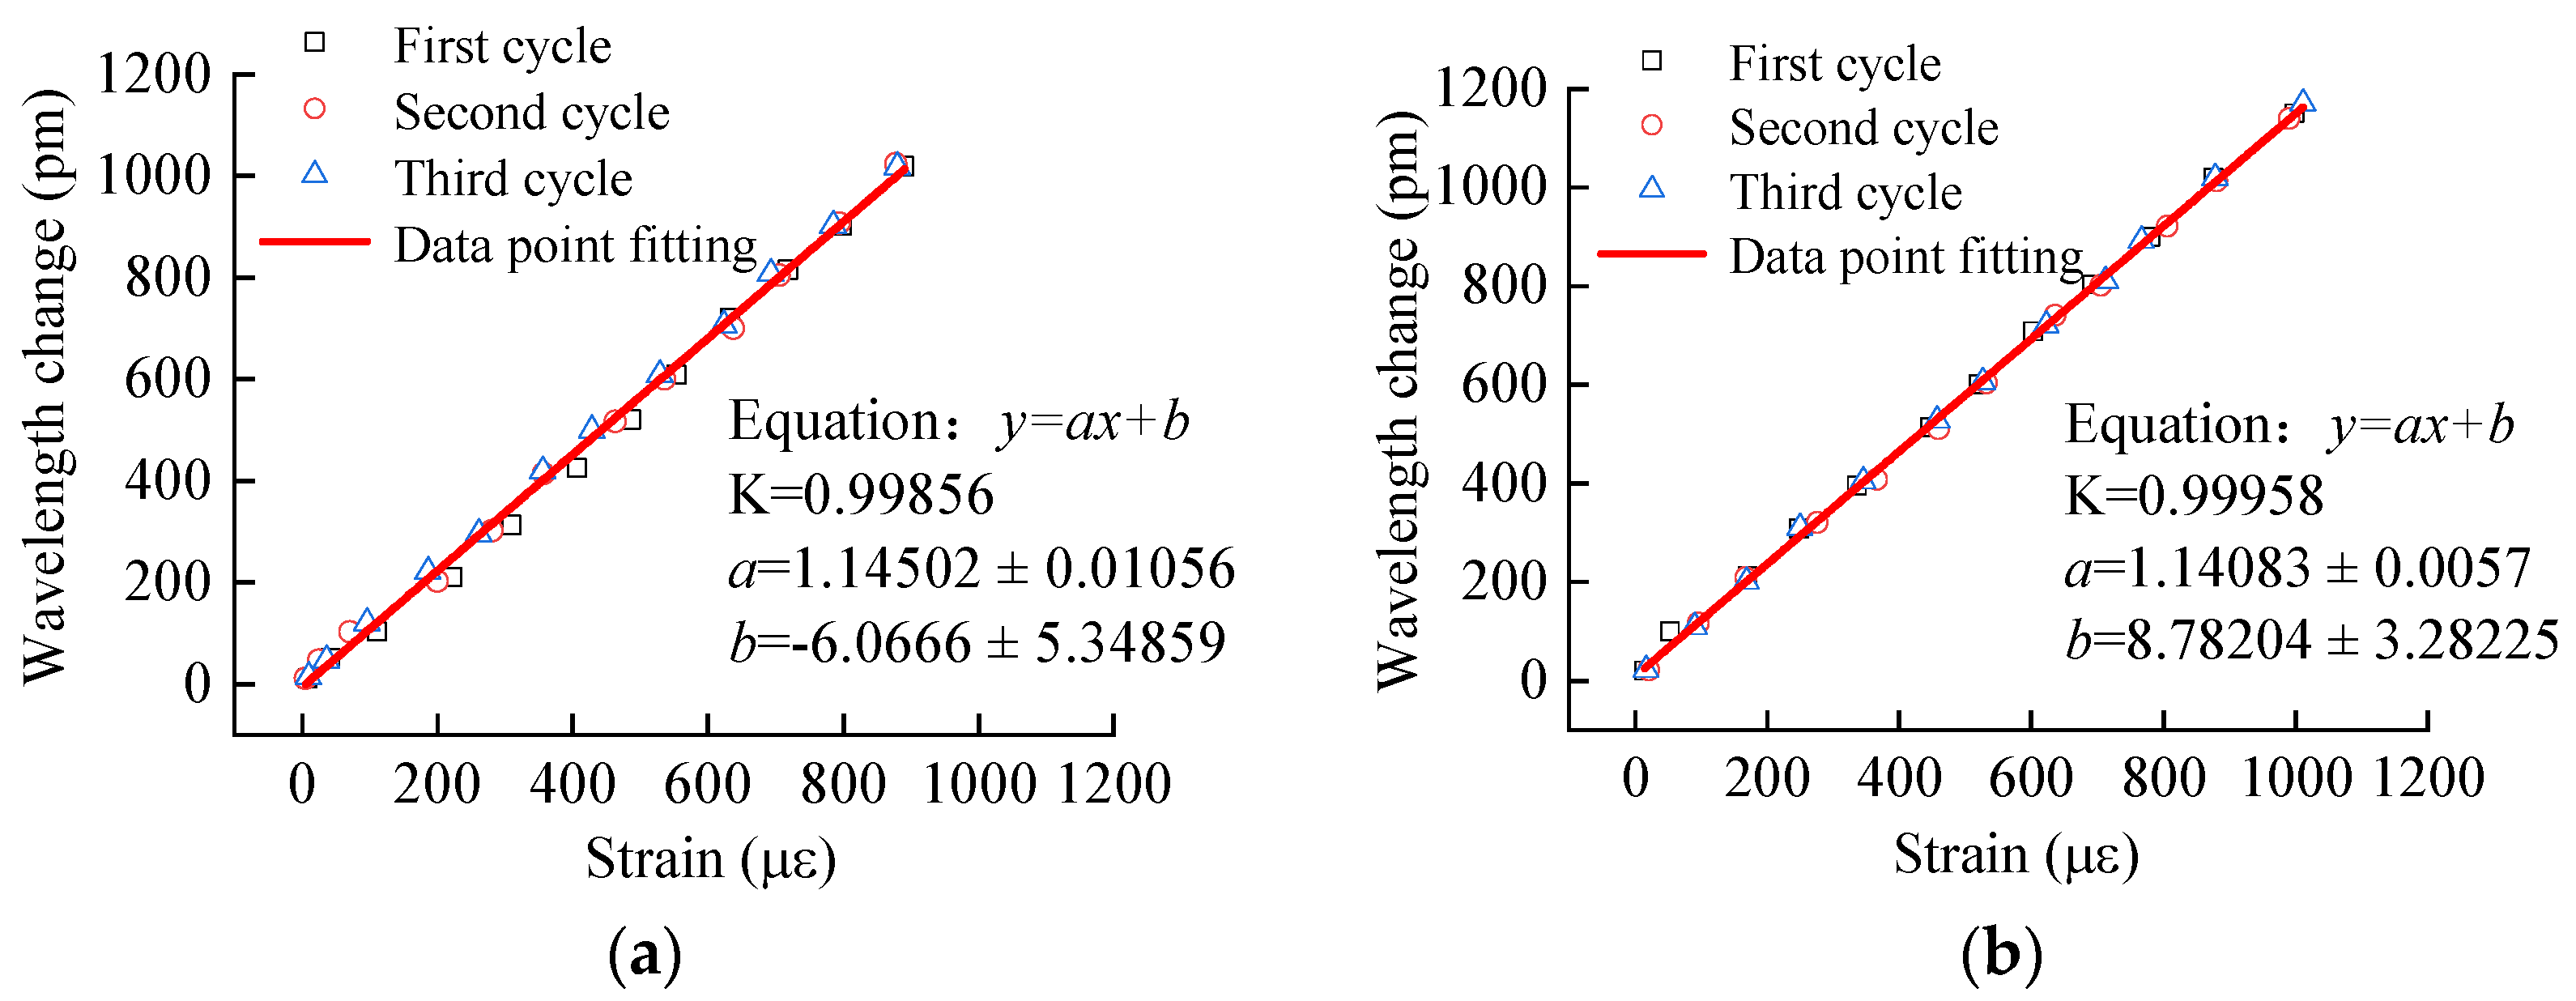
Strain sensing performance test
The strain sensing coefficient of the self-sensing rebar is very important. Using the product of the wavelength change measured by the sensor, the strain sensing coefficient can be obtained to monitor the strain; the strain sensing coefficient of the same batch of calibrated bare optical fiber can be taken as 1.2, but the fiber grating sensors encapsulated in the slotted rebar and epoxy resin may be affected, and therefore it is necessary to carry out a tensile test on the self-sensing rebar to determine its strain sensing coefficient.
The universal tensile testing machine is used to tension the self-sensing rebar, as shown in Figure 27. The steps and rate of rebar tensioning are adopted from the specification standard [31], the load control is adopted in the elastic phase, and the control load is taken as 1 kN/s. The displacement control is adopted in the yielding phase of the rebar and the reinforcing phase, and the control displacement is taken as 30 mm/min. When the concrete slab is subjected to the cracking by the aircraft loading and the external temperature and humidity, at this point in time, under the aircraft loading. Under the action of the aircraft load, the strain of the reinforcement at the cracked position of the concrete can reach about 1000 με, so the self-sensing reinforcement is loaded to 1000 με and then the test is stopped.
As shown in Figure 28, the wavelength change of the self-sensing bars is plotted against the measured strain change. It can be found that the wavelength change and the strain change show a significant linear relationship, and the linear correlation coefficient is higher than 0.99 under each working condition. As shown in Table 6, the average value of the strain sensing coefficient is 1.1425, and the coefficients of variation are 0.1580% in order, which indicates that the self-sensing rebar with a marking distance of 150 mm has a stable strain sensing performance.

4.2. Pilot Program Implementation

After completing the fabrication of the self-sensing rebar, the viability test was performed, and then the self-sensing rebar was tied in the rebar skeleton according to the sensor placement scheme in Figure 28, and the armored fiber-optic cable was led out through the rigid hose. As shown in Figure 29a, the rebar skeleton was placed in the formwork and the sensor position was calibrated to ensure that the sensor location coincided with the design position. Then pour the mixed concrete into the formwork and continuously vibrate it with the vibrator to make it dense and complete the pouring of the concrete slab, as shown in Figure 29b, and carry out the self-sensing rebar viability test after the completion of the concrete pouring to prevent the sensor from being damaged by the vibrator. When the strength of the concrete reaches 75%, the formwork can be dismantled for curing, and the curing time is 28 days.
The test schematic is shown in Figure 30a, and the vertical structure of the pavement mainly consists of soil base, mortar bedding layer, flexible coil and pavement panel. First of all, 400 mm thick soil layer, and the use of tamping machine will be tamped soil base; this is followed by cement mortar paved in the soil base of the upper part of the mortar bedding thickness of 30 mm, and the use of vibrators will be mortar bedding vibration, and complete the bedding layer leveling work; this is then laid in the upper part of the bedding layer of flexible coil to increase the pavement panel and the grass-roots level of the degree of adhesion; and finally, the pavement panel prefabricated and welded work is completed. The test loading device mainly consists of reaction frame, jacks and anchors, as shown in Figure 30b for the completion of the test device. The B-737-800 model load is applied, as shown in Figure 30c.

4.3. Crack Identification Analysis

4.3.1. Test Loading Condition

As shown in Figure 31, the load of B-737-800 model is placed at the starting position of the longitudinal edge of the No. 4 pavement panel, and the load size is taken to be 38.9 kN. The load simulation is realized by moving the counterweight frame along the direction of the panel’s long edge, and the counterweight frame is moved by 150 mm each time, which is moved for seven times, and each loading test is cycled for three times, and the strains obtained by the fiber-optic grating sensors C1~C5 are extracted. Due to the preset cracks, it is not possible to directly measure the strain change curve of each sensor when the plate is intact under the same position of the longitudinal edge of the No. 4 plate, so the load is applied to the longitudinal edge of the No. 5 plate (adjacent to the No. 4 plate), the load is applied in the same position as that of the longitudinal edge of the No. 4 plate, and the strains obtained from the fiber-optic sensors B1~B5 are extracted.

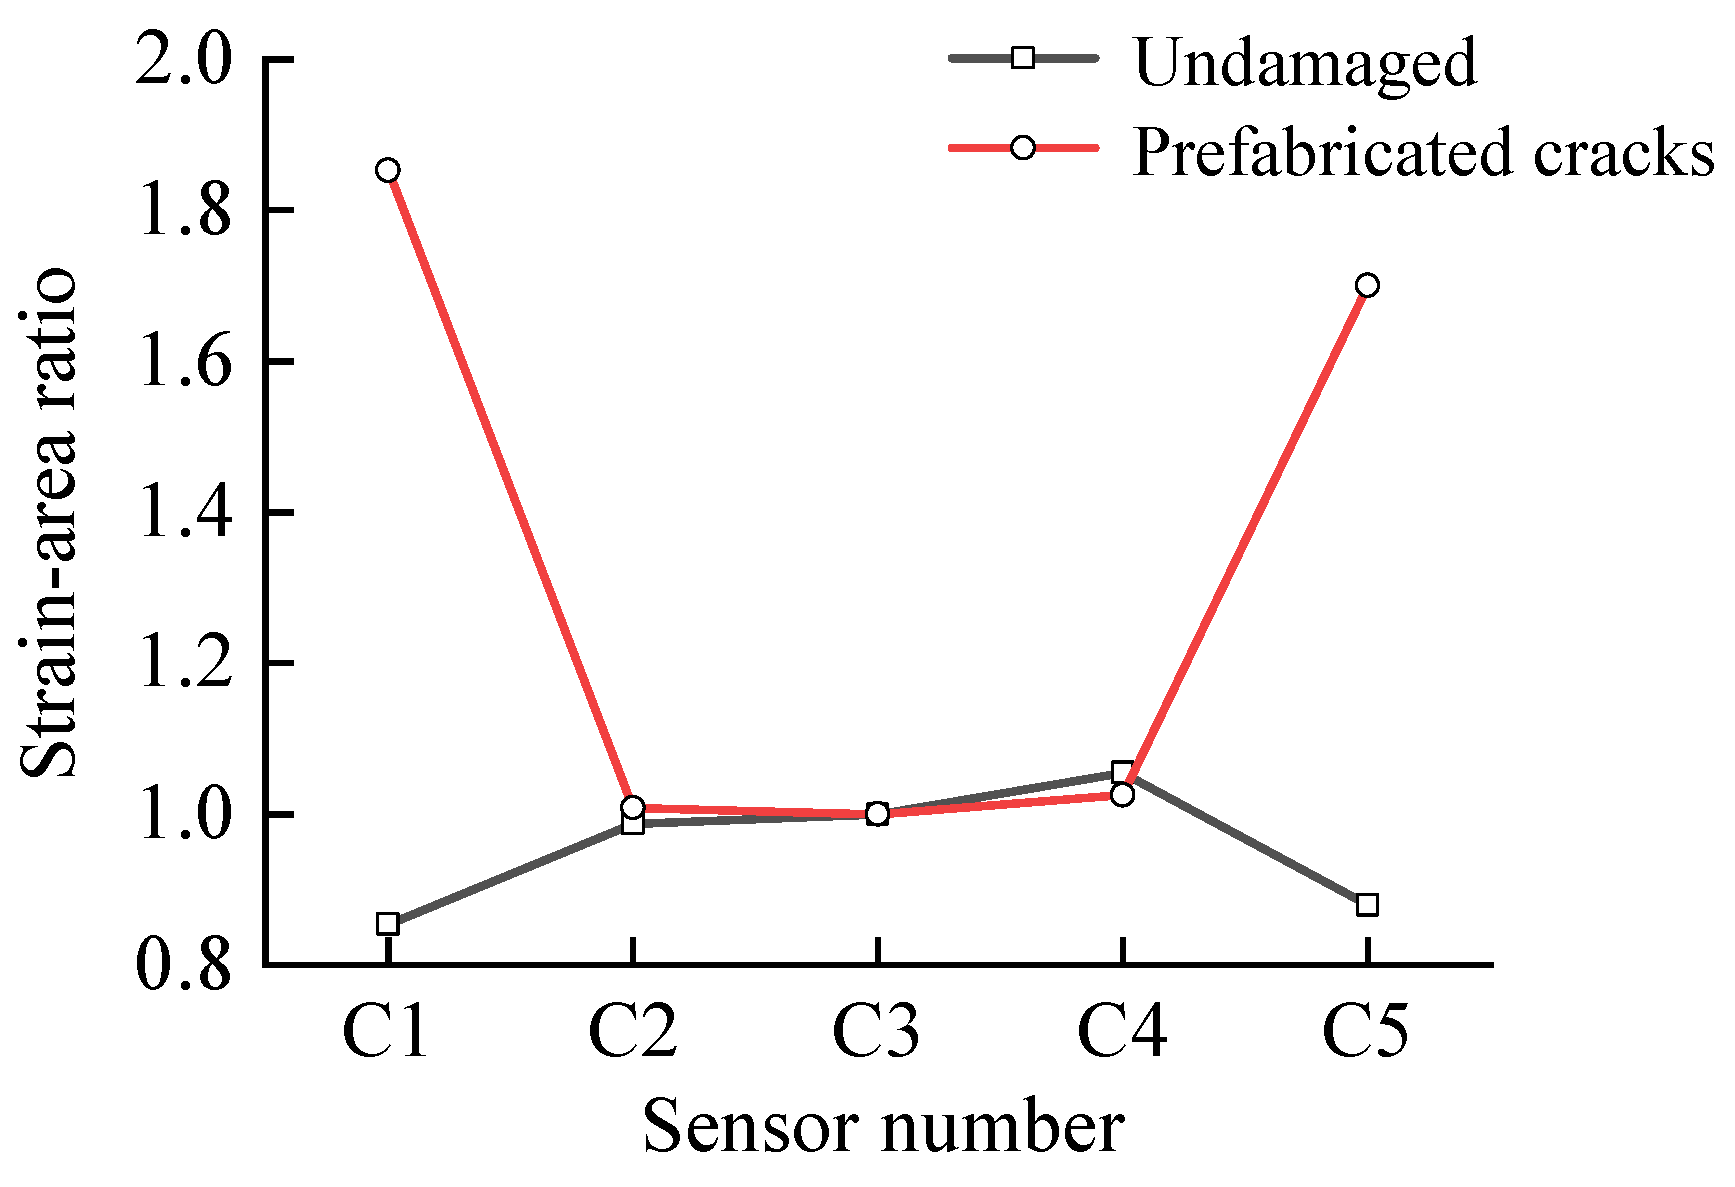
4.3.2. Analysis of Test Results

The strain change curves as the load passes through each sensor location are shown in Figure 32. The strain measured by the sensor when the load is applied to the crack location is significantly larger than the strain when the load is applied to the non-crack location. Calculate the envelope area of the strain curve at each sensor location, take the envelope area of the strain curve monitored by the B3 sensor as a reference, and normalize the series to obtain the distribution of the ratio of the envelope area of the strain curve before and after the appearance of the crack, as shown in Figure 33. The strain curve envelope area ratio increases by 116.87% at the position of preset crack I, 93.15% at the position of preset crack II, and the maximum change is only 2.8% at other positions, which indicates that the method can realize the crack identification.

5. Conclusions and Remarks

The paper proposes a method for identifying cracks in prefabricated pavement based on strain distribution monitoring and draws the following main conclusions through finite element simulations and small-scale model tests:
(1) The location of the slab prone to cracking and the optimized scale distance of the sensor are identified. The middle position of the two joints is the weak link, and the cracks can be set in this position; the distance of the fiber optic sensor can be taken as 500 mm, which can meet the needs of monitoring the cracks on the pavement panel.
(2) According to the finite element analysis results, comparing the distribution of the envelope area ratio of the strain curves before and after the cracks, the method in this paper can realize the identification of single and multiple cracks, and the larger the degree of crack development, the better the identification effect, but the specific quantitative indexes need to be further explored.
(3) The change in the taxiing position of the aircraft does not affect the identification of cracks by this method; when different models are operated under different loads, this method can also realize the identification of cracks.
(4) Analyzing the results of the small-scale model test, comparing with the uncracked condition, the envelope area ratio of the strain curve at the position of preset crack I increases by 0.998, that at the position of preset crack II increases by 0.819, and the maximum change of other positions is only 0.030, which indicates that the method can be used for the identification of cracks in prefabricated pavement.
(5) In the indoor test or in the field, sensor installation and protection are very important. Armored fiber optic cable is susceptible to damage by concrete pouring and vibration, and when the armored fiber optic cable is led out of the slab, the pipe needs to be reserved, and the pipe is easy to be clogged when the concrete is poured, resulting in the inability to receive the sensor signal.

Author Contributions

Conceptualization, Funding acquisition, Methodology, Writing—review and editing, Y.T.; Investigation, Formal analysis, Writing—original draft, B.Z.; Data curation, Formal analysis, Validation, Writing—original draft, T.Y. All authors have read and agreed to the published version of the manuscript.

Funding

This research work was funded by the National Key R&D Program of China (Grant No. 2021YFB2601200) and a grant from the Engineering Research Center of Intelligent Construction and Industrialization, CAAC (Grant No. MHJGKFKT-03).

Data Availability Statement

All data included in this study are available upon request by contact with the corresponding author.

Conflicts of Interest

No potential conflicts of interest were reported by the authors.

References

  1. Ahmed, I.; Rahman, M.H.; Seraj, S.M.; Hoque, A.M. Performance of plain concrete runway pavement. J. Perform. Constr. Facil. 1998, 12, 145–152. [Google Scholar] [CrossRef]
  2. MH/T 5024-2019; Technical Specification for the Management of Civil Airport Pavement Evaluation. Civil Aviation Press of China: Beijing, China, 2019.
  3. Li, H.F.; Nie, J.J.; Wu, Z.L.; Peng, B.; Gui, Z.C. An airport pavement crack detection algorithm based on multi-sensor information fusion. Mod. Electron. Technol. 2020, 43, 17–21, 25. [Google Scholar]
  4. Yang, S.S.; Hao, L.; LI, Y.; Fu, S.J.; He, C.H. Concrete crack identification method and program development. J. Chongqing Jiaotong Univ. 2022, 41, 105–111. [Google Scholar]
  5. Liu, N.; Song, W.D.; Zhao, Q.H. Morphology and maximum entropy image segmentation for urban pavement crack detection. J. Liaoning Univ. Eng. Technol. 2015, 34, 57–61. [Google Scholar]
  6. Qu, Z.; Lin, L.D.; Guo, Y. An improved algorithm for image crack detection based on percolation model. IEEJ Trans. Electr. Electron. Eng. 2015, 10, 214–221. [Google Scholar] [CrossRef]
  7. Wei, J.; Cao, L.F.; Zeng, Y.X.; Dong, R.Z.; Chen, S.L. Study on feature extraction of concrete structure cracks. J. Wuhan Univ. Technol. 2011, 33, 72–75. [Google Scholar]
  8. Song, H.; Wang, W.; Wang, F.; Wu, L. Pavement crack detection by ridge detection on fractional calculus and dual thresholds. Int. J. Multimed. Ubiquitous Eng. 2015, 10, 19–30. [Google Scholar] [CrossRef]
  9. Oliveira, H.J.M.; Correia, P.L.S.L. CrackIT—An image processing toolbox for crack detection and characterization. In IEEE International Conference on Image Processing; IEEE: Paris, France, 2014; pp. 102–106. [Google Scholar]
  10. Shi, Y.; Cui, L.M.; Qi, Z.Q.; Meng, F.; Chen, Z.S. Automatic Road crack detection using random structured forests. IEEE Trans. Intell. Transp. Syst. 2016, 17, 3434–3445. [Google Scholar] [CrossRef]
  11. Park, H.; Choi, M.; Park, J.; Kim, W. A study on detection of microcracks in the dissimilar metal weld through ultrasound infrared thermography. Infrared Phys. Technol. 2014, 62, 124–131. [Google Scholar] [CrossRef]
  12. Li, Z.W.; Liu, X.Z.; Lu, H.Y.; He, Y.L.; Zhou, Y.L. Surface crack detection in precasted slab track in high-speed rail via infrared thermography. Materials 2020, 13, 4837. [Google Scholar] [CrossRef] [PubMed]
  13. Ouyang, W.Z. Research on Ground-Penetrating Radar Forward Simulation of Highway Pavement Layer Crack Disease; Wuhan University of Technology: Wuhan, China, 2016. [Google Scholar]
  14. Xiao, X.; Tian, G.; Liu, D.; Robinson, M.; Gallagher, A. Developments in GPR Based NDT for ballastless track of high-speed railways. In Proceedings of the 24th International Workshop on Electromagnetic Nondestructive Evaluation, Chengdu, China, 11–14 September 2019; IOS Press: Amsterdam, The Netherlands, 2020; pp. 277–285. [Google Scholar]
  15. Xie, X.Y.; Tang, G.J.; Hong, G.; Wang, C. Deformation sensing method and application of intelligent duck bank structure. Chin. J. Undergr. Space Eng. 2017, 13, 1056–1065. [Google Scholar]
  16. Ye, Y.X.; Zhao, X.M.; Wu, G.; Xie, X.F.; Yao, J. Application of distribute dropsical fiber in the monitoring of cracks in concrete structures. J. Civ. Environ. Eng. 2018, 40, 24–29. [Google Scholar]
  17. He, Y.; Jiang, S.; Mao, J.H.; Xia, J.; Jin, W.L. Distributed fiber optic monitoring method and experimental study of structural cracks. Civ. Constr. Environ. Eng. 2012, 34, 1–6. [Google Scholar]
  18. Mao, J.H.; Cui, L.; Jin, W.L.; Xu, C.; He, Y.; Ren, X.C.; Yang, F. Experimental research on concrete crack identification and monitoring based on distributed fiber optic sensing. J. Sens. Technol. 2014, 27, 1298–1304. [Google Scholar]
  19. Lu, F.; Feng, M.Q.; Gu, X.; Yang, S. Field Experiment on Monitoring of Cracks in Highway Asphalt Overlay. In Nondestructive Characterization for Composite Materials, Aerospace Engineering, Civil Infrastructure, and Homeland Security; SPIE: Bellingham, WA, USA, 2009; Volume 7294, pp. 187–193. [Google Scholar]
  20. Qian, Z.D.; Han, G.Y.; Huang, W.; Yi, Z.C. Fatigue extension of steel bridge deck cracks based on BOTDA. J. Civ. Eng. 2009, 42, 132–136. [Google Scholar]
  21. Lu, Y.; Shi, B.; Xi, J.; Su, J.W.; Jiang, Y.H.; Li, Y.F. Field study of BOTDR-based distributed monitoring technology for ground fissures. J. Eng. Geol. 2014, 22, 8–13. [Google Scholar]
  22. Pang, X.R. Research on Monitoring of Concrete Girder Bridge Based on Macro Strain Distribution Technology of FBG Sensor; Suzhou University of Science and Technology: Suzhou, China, 2018. [Google Scholar]
  23. Wu, G.; Wu, Z.S.; Jian, Z.; Wan, H.; Tang, Y.S.; Yang, C.Q. Structural health monitoring of a steel stringer bridge with area sensing. Struct. Infrastruct. Eng. 2014, 10, 1049–1058. [Google Scholar]
  24. Li, H.N.; Ren, L. Fiber Optic Grating Sensing Technology for Structural Health Monitoring; China Construction Industry Press: Beijing, China, 2008. [Google Scholar]
  25. Zhang, Y. Rapid Inversion Study of Airport Pavement Bending and Settlement Curves Based on Winkler Foundation; Civil Aviation University of China: Tianjin, China, 2020. [Google Scholar]
  26. Liu, D. Research on Joints and Structural Optimization of Cement Concrete Pavement; Wuhan University of Technology: Wuhan, China, 2003. [Google Scholar]
  27. Guo, C.C.; Zhang, S.J.; Zhou, H.C.; Diao, Y.L.; Yan, W.H. Mechanical response analysis of airport composite pavement under moving load. J. Zhengzhou Univ. 2023, 44, 113–119. [Google Scholar]
  28. Zhang, W.H. XFEM Cracking Analysis of Cement Concrete Pavement Based on Double-K Fracture Model; Chang’an University: Xi’an, China, 2022. [Google Scholar]
  29. Peng, Y.F.; Lu, J.; Qin, J.H. Extended finite element analysis of cracking process in pressurized tunnel lining. Hydropower Gener. 2017, 43, 40–43, 122. [Google Scholar]
  30. MH/T5004-2010; Specification for the Design of Cement Concrete Pavement at Civilian Airports. Civil Aviation Press of China: Beijing, China, 2010.
  31. GB/T 228.1-2021; Tensile Test for Metallic Materials Part 1: Room Temperature Test Method. Civil Aviation Press of China: Beijing, China, 2021.
Figure 1. Sensing principle of fiber grating: (a) Fiber grating structure schematic, (b) Input Spectrum, (c) Reflectance spectrum, and (d) Output Spectrum.
Buildings 14 02520 g001
Figure 2. Schematic of long-gauge FBG sensor monitoring.
Buildings 14 02520 g002
Figure 3. Schematic diagram of crack monitoring: (a) Schematic of sensor monitoring in the absence of cracks, (b) Schematic of sensor monitoring after the presence of cracks, (c) Strain curve at each sensor position without cracks and (d) Strain curve at each sensor position after cracks are present.
Buildings 14 02520 g003
Figure 4. Distribution of envelope area ratio of strain curve before and after crack appearance.
Buildings 14 02520 g004
Figure 5. Strain curve envelope area calculation: (a) Strain curve and (b) Strain change curve area calculation.
Buildings 14 02520 g005
Figure 6. Finite element model of prefabricated pavement 9-plate combination.
Buildings 14 02520 g006
Figure 7. Mobile load simulation.
Buildings 14 02520 g007
Figure 8. B-737-800 Main Landing Gear Form.
Buildings 14 02520 g008
Figure 9. Strain curves for different load ratings (q is tire pressure).
Buildings 14 02520 g009
Figure 10. Determination of crack location.
Buildings 14 02520 g010
Figure 11. Variation of strain with scale distance for the sensor at the crack location.
Buildings 14 02520 g011
Figure 12. Variation of strain measured by the sensor at different scale distances: (a) Absolute changes and (b) Relative changes.
Buildings 14 02520 g012
Figure 13. Self-sensing rebar placement.
Buildings 14 02520 g013
Figure 14. Strain variation curves of each sensor under different degrees of cracking: (a) D = 0, (b) D = 0.3, (c) D = 0.6, and (d) D = 0.9.
Buildings 14 02520 g014
Figure 15. Envelope area ratio of strain curves of each transducer under different degrees of cracking (Single Crack).
Buildings 14 02520 g015
Figure 16. Strain variation curves of each sensor under different degrees of cracking: (a) D1 = 0.3, D2 = 0.6 and (b) D1 = 0.4, D2 = 0.8.
Buildings 14 02520 g016
Figure 17. Envelope area ratio of strain curves of each transducer under different degrees of cracking (Multiple Cracks).
Buildings 14 02520 g017
Figure 18. Schematic of airplane taxiing position.
Buildings 14 02520 g018
Figure 19. Strain variation curves of each sensor at different distances from load center to longitudinal side: (a) s1 = 0.6 m and (b) s1 = 1.2 m.
Buildings 14 02520 g019
Figure 20. Envelope area ratio of strain curves of each sensor at different distances from load center to longitudinal edge.
Buildings 14 02520 g020
Figure 21. Strain change curve of each sensor under different loads: (a) D = 0.3 and (b) D = 0.6.
Buildings 14 02520 g021
Figure 22. Strain variation curve of each sensor under different models: (a) A320 and (b) B777-300ER.
Buildings 14 02520 g022
Figure 23. Envelope area ratio of strain curve of each sensor under different models: (a) A320, (b) A330-300, (c) Su-30 and (d) B-777-300ER.
Buildings 14 02520 g023
Figure 24. Sensor deployment.
Buildings 14 02520 g024
Figure 25. Comparative analysis of strain change curves generated by C3 sensors and B3 sensors.
Buildings 14 02520 g025
Figure 26. Self-sensing steel fabrication: (a) Tooling Slotting, (b) Fiber optic paste, (c) Painting epoxy resin and (d) Self-sensing rebar.
Buildings 14 02520 g026
Figure 27. Self-sensing rebar tensile test.
Buildings 14 02520 g027
Figure 28. Wavelength variation versus strain variation for self-sensing steel bars: (a) 1# and (b) 2#.
Buildings 14 02520 g028
Figure 29. Sensor mounting and plate fabrication: (a) Placement of rebar and (b) Plate leveling.
Buildings 14 02520 g029
Figure 30. Sensor Installation and Plate Fabrication: (a) Schematic diagram of the test, (b) Test equipment, and (c) Load Simulation.
Buildings 14 02520 g030
Figure 31. Test Schematic.
Buildings 14 02520 g031
Figure 32. Strain curve: (a) Strain variation curve at longitudinal seam location in plate 5 and (b) Strain variation curve at longitudinal seam location of plate 4.
Buildings 14 02520 g032
Figure 33. Crack recognition.
Buildings 14 02520 g033
Table 1. B-737-800 Aircraft load parameters.
Maximum Take-Off Weight
(kN)
Tire Pressure (MPa)Main Landing Gear ConfigurationSingle Wheel Load (kN)Area of a Single Wheel (m2)Wheel Print Length
(m)
Wheel Printing Width
(m)
792.041.47Two axles and two wheels376.220.255930.6100.420
Table 2. Classification of crack development.
Crack length (mm)02505007501000125015001750200022502500
Crack height (mm)0306090120150180210240270300
D00.10.20.30.40.50.60.70.80.91
Table 3. Aircraft type parameters.
Aircraft TypeTire Pressure (MPa)Main Landing Gear ConfigurationSingle Wheel Load
(kN)
Wheel Length (m)Wheel Width (m)
Su-301.53Single axle, single wheel157.220.4320.298
A3201.14two axles and two wheels183.830.4840.333
A330-3001.42two axles and two wheels560.190.7560.522
B777-300ER1.50tricycle with two wheels532.120.7170.495
Table 4. Parameters of the test model.
Structural ConfigurationParametersValue (mm)
PrototypeModel
Pavement panelPlane size5000 × 25001500 × 750
High degree400120
SteelCaliber148
ConnectionCaliber208
Table 5. Parameter table for B-737-800 models.
ValueAircraft TypeTire Pressure
(MPa)
Quality
(t)
Loading
(kN)
Tire Spacing
(mm)
Tire Ground Size/mm
LengthHeight
ArchetypeB-737-8001.4775.24752.44860610420
PatternB-737-8001.473.8938.90258183126
Table 6. Results of strain sensing coefficients for self-sensing steel bars.
Gauge (mm)1#2#3#Average ValueStandard DeviationCoefficient of Variation (%)
1501.14501.14081.14171.14250.00180.1580
Disclaimer/Publisher’s Note: The statements, opinions and data contained in all publications are solely those of the individual author(s) and contributor(s) and not of MDPI and/or the editor(s). MDPI and/or the editor(s) disclaim responsibility for any injury to people or property resulting from any ideas, methods, instructions or products referred to in the content.

