Article

Critical Insights into White and Yellow Light Marks on Various Asphalt Pavements: A Comparative Analysis

1
Civil Engineering Department, Sami Shamoon College of Engineering, Jabotinsky 84, Ashdod 77245, Israel
2
Civil Engineering Department, Technion—Israel Institute of Technology, Haifa 3200003, Israel
*
Author to whom correspondence should be addressed.
Buildings 2024, 14(8), 2525; https://doi.org/10.3390/buildings14082525
Submission received: 21 June 2024 / Revised: 4 August 2024 / Accepted: 13 August 2024 / Published: 16 August 2024
(This article belongs to the Section Building Materials, and Repair & Renovation)

Abstract

:
The traffic safety problem is of crucial importance worldwide, and one way to enhance it is by using high-quality road markings. While much attention has been paid to retroreflection standards and road marking visibility, less focus has been given to the effect of asphalt mixtures. Addressing this knowledge gap is essential for achieving comprehensive improvements in road safety. The present study investigates the impact of three asphalt mixtures on the retroreflectivity of road pavement surfaces. The findings indicate that white road markings exhibit varying retroreflectivity values depending on the asphalt mixture. Among the three types tested—the “Basalt” and “Zebra” dense, coarse-graded mixtures and the “Tama” stone mastic mixture—the “Basalt” mixture was most effective in enhancing road marking prominence, showing higher initial retroreflectivity values. Additionally, no effect of the asphalt mixture was observed concerning yellow road markings; data analysis revealed a significant spread in retroreflectivity values for white and yellow road markings across different asphalt mixtures and identified a relationship between these and the AADT (annual average daily traffic). The mean values of retroreflectivity follow a fractional power pattern, as indicated by the high regression coefficient of the cross-correlation line between the calculated and measured retroreflectivity values.

1. Introduction

Road marks, a crucial part of the road signage system, significantly facilitate traffic flow and enhance safety. They ensure visibility to drivers in various driving conditions [1]. These marks are not just components of road safety infrastructure but also lifelines in lane delineation, driver guidance, and visibility enhancement, especially in challenging conditions like low-light or adverse weather scenarios [2,3,4]. Their pivotal role in reducing road accidents by enhancing visibility and offering advanced warnings of upcoming road features is widely recognized. Moreover, they are indispensable aids for emergency vehicles during critical situations [5].
Various types of road light marks influence driver visibility during night-time driving. Photoluminescent road markings, for instance, can augment visual guidance by extending visibility beyond the headlamp beams, particularly in poorly illuminated areas such as bicycle paths, contingent upon adequate night-time illumination levels [6]. Retroreflective pavement markers (RPMs) and alternative delineation devices possess differing luminance levels that impact drivers’ visual performance, with used RPMs often demonstrating comparable visibility characteristics to new ones [7]. They offer enhanced visibility during wet nights, supplementing or replacing traditional pavement markings [8]. Additionally, active luminous lane markings on highways at night have positively influenced driver recognition, decreased mental and physical loads, enhanced lane-keeping ability, and improved overall traffic safety and efficiency [9]. Furthermore, optimizing component materials in luminous coatings for asphalt pavements can significantly affect brightness, wear resistance, and durability, with ideal dosages enhancing the initial luminescence and wear resistance [10,11]. The composition of pavement marking paint plays a crucial role in improving reflectivity [10]. Highly weather-resistant hot-melting reflection-type pavement marking paint contains specific components like glass beads for improved reflectivity and durability [12]. Moreover, heat-reflection paint for asphalt pavements includes materials like titanium dioxide and hollow micro-balloons to enhance heat insulation and reduce surface humidity, ultimately improving reflectivity and adhesion to the pavement [10,13]. Understanding these factors is essential for optimizing paint reflectivity and ensuring efficient pavement marking management [14].
Past research has extensively investigated various aspects of road light marks, including their design, placement, and performance under diverse conditions [15,16]. Numerous studies have explored how different marker types, colors, and patterns impact driver behavior, safety, and interaction with pavement surfaces and traffic control devices [2,3,17]. However, the future of road safety lies in the recent advancements in road light mark systems. These innovations have led to intelligent markers capable of adapting to changing conditions and providing real-time information to drivers or traffic management centers, offering promising prospects for revolutionizing road safety [18,19].
While road light marks offer significant benefits, their installation and upkeep entail substantial expenses, and their effectiveness may diminish over time due to factors like wear and tear or environmental conditions [20,21].
Minimum standards for retroreflection from road markings have been established since 1993, with research indicating specific retroreflection coefficient requirements associated with driver satisfaction and crash frequency [22,23,24,25]. Additionally, the contrast between road markings and the pavement significantly impacts their visibility, particularly for older drivers, with minimum contrast values identified for optimal visibility [23,26].
Retroreflection degradation over time is critical, as factors like snow removal and road usage affect its rate [27,28]. For example, Obeng et al. [29] studied the degradation of the retroreflectivity of thermoplastic pavement markings in different ecoclimatic zones in Ghana. Their study focused on monitoring the retroreflectivity of pavement markings over time to establish degradation rates and develop models for effective re-marking interventions by the Ghana Highway Authority. It highlighted that initial retroreflectivity plays a crucial role in marking decay, with a high variability in retroreflectivity emphasizing the importance of quality control measures for uniform marking application.
Thanasupsin and Sukniam [30] observed that the initial retroreflectivity RL30 was low, at 180 mcd/m2/lux, but increased to 248 mcd/m2/lux after 15 days. Interestingly, a higher glass bead drop-on rate did not always result in a higher RL30. They found that a 359 g/m2 glass bead rate was sufficient for meeting the minimum retroreflectivity requirements, noting that traffic exposure, pavement marking position, and dirt coating affected retroreflectivity. The current standards for retroreflectivity levels in road paints vary across different countries. European nations, the United States, and many others provide specifications for the retroreflectivity levels of road markings [31]. In Brazil, adjustments to international standards have been made, impacting road safety and comfort, with a call to reassess the minimum retroreflectivity levels [32]. In Korea, the minimum retroreflectivity for freeway markings is set to 110 mcd/m2/lux for white and 90 mcd/m2/lux for yellow, but the observed values often fall below these standards, necessitating further studies and countermeasures for maintaining uniformity and visibility [33]. The research emphasizes the importance of maintaining adequate retroreflectivity levels in road paints to ensure road safety and effective traffic control.
Mazzoni et al. [34] extensively evaluated glass beads of different sizes, shapes, and retroreflectivity over 11 months in the field. The retroreflectivity was measured with a portable retroreflectometer at specific points after vehicle friction. Their findings revealed that the glass beads produced with recycled glass had poor shape properties, adversely affecting the retroreflectivity.
Owusu et al. [35] studied the degradation of thermoplastic pavement markings’ retroreflectivity. Several factors affecting the degradation process were identified, including traffic, pavement surface type, time, weather conditions, and initial retroreflectivity level. The following models were employed to estimate the degree of degradation: simple linear, multi-linear, exponential, and logarithmic models. The minimum retroreflectivity levels for re-striping intervention ranged from 50 to 150 mcd/m2/lux. The study showed that Malyuta’s linear model (R2 = 0.72) and Wang et al.’s linear model (R2 = 0.57 to 0.68) stood out for retroreflectivity prediction. Onyango et al. [36] demonstrated that the best paint model for white thermoplastic markings was Abboud and Bowman’s model, with an R2 value of 0.4585. In contrast, for yellow thermoplastic markings, the model by Ozelim and Turochy had the highest R2 value, at 0.5122.
The study by [37] underscores the importance of the asphalt production procedure, revealing that plant-mixed pavements exhibit higher retroreflectivity values than bituminous surface treatment (BST) pavements.
In summary, this section underscores the crucial importance and extensive research on retroreflection standards and contrast for road marking visibility. It covers factors affecting retroreflection degradation over time, the role of glass beads in retroreflectivity, and models for predicting degradation to inform restriping interventions. These findings establish a solid foundation for further research to optimize road markings for enhanced safety and visibility.
However, this state-of-the-art analysis reveals a significant knowledge gap: while substantial attention has been devoted to improving the visibility of road markings through various materials, there has been considerably less focus on the asphalt mixtures themselves. Addressing this gap is essential for advancing the field and achieving comprehensive improvements in road safety.
Recognizing this knowledge gap, the present research aims to significantly contribute by examining the retroreflection coefficient (retroreflectivity) and contrast of lane markings on two-lane intercity roads in Israel. By developing models which explicitly consider asphalt mixture types, this study seeks to provide valuable insights that could inform guidelines for optimal light mark selection and installation, thereby contributing to enhanced road safety measures [24,27].
This study’s unique strength lies in its analysis of real-world data from Israeli roads, combined with building upon past conclusions and findings from the studies discussed earlier. Through this comprehensive approach, the research addresses the advantages, disadvantages, and critical considerations holistically surrounding road light marks, aiming to enhance road safety through informed decision making.
Notably, by investigating the effects of asphalt composition on the performance of road light marks, this study aims to fill a critical gap in the existing knowledge. Understanding how different asphalt mixtures influence retroreflection and contrast can guide the selection and installation of optimal light mark solutions tailored to specific road surfaces. This targeted approach has the potential to maximize the effectiveness of road safety infrastructure while minimizing potential drawbacks, ultimately contributing to a safer and more efficient transportation system.

2. Materials and Methods

2.1. Database and Asphalt Type

This research relied on a robust database, encompassing information on road type, average annual daily traffic (AADT), asphalt type, latest maintenance activities (e.g., repaving), recent marking repaints, and retroreflection measurements of road markings and background asphalt. Retroreflection data were gathered using a RetroTek-M in July and August 2018 (the dry summer months). Other variables were sourced from the databases of the Netivey Israel Company, the entity responsible for managing intercity roads in Israel. These data points were explicitly collected for two-lane undivided and unlit rural roads.
This study covered a total segment length of 65.1 km, featuring three different types of asphalt: stone matrix asphalts (SMAs) and dense, coarse-graded (DCG) asphalts. SMA is known for its robustness and stability, relying on stone-to-stone contact for strength and a rich mortar binder for durability. This stone-to-stone contact is achieved by designing an aggregate skeleton with a high percentage of durable, coarse aggregate. The mortar consists of an asphalt binder, a mineral filler (material passing a no. 200 sieve), and a stabilizing additive, cellulose, or mineral fibers. The primary advantage of SMA is its extended lifespan. Additional benefits include reduced tire splash and spray and decreased traffic noise [38]. The DCG mixture is a well-graded, dense HMA mixture consisting of aggregates and an asphalt binder [39,40]. Three types of the studied mixtures are as follows:
33 km of “Tama” type (SMA): This section is made up of coarse aggregate (type A basalt coarse aggregate), fine aggregate (type A fine limestone/dolomite aggregate, pre-screened to ensure that it contains no less than 60% sand-sized aggregate), melamine, bitumen (PG70-10 or PG76-10), and stabilizing fibers.
10.0 km of DCG mixtures, using exclusively basalt aggregate: This section will be referred to as “Basalt”.
22.1 km of DCG mixtures with a blend of basalt and dolomite aggregates: In this section, the coarse aggregate (retained on a 4.75 mm sieve) consists of a mix of at least 60% basalt aggregate by weight and, at most, 40% dolomite aggregate. Of this segment, 14.0 km have a known maintenance history. This section will be referred to as “Zebra”.
Table 1 and Table 2 show the cumulative grain distribution curves of the three mixtures and their main properties, respectively.

2.2. Statistical Analysis

The dataset was analyzed for so-called percentiles [41,42,43,44], a statistical measure commonly used to identify the value below a specified percentage of observations. Percentile analysis plays a crucial role in understanding the distribution of a dataset and identifying significant reference points. By examining the values of different percentiles, researchers can gain insights into the centrality and dispersion of the data, detect potential outliers, and assess the normality of the distribution. This analysis forms the foundation for deeper insights and data-driven conclusions within the research context.
For instance, the 75th percentile represents the value below which 75% of the data points lie, while the remaining 25% of data exceed that value. Generally, percentiles above the 75th percentile are considered above-average values (abnormal), those between the 25th and 75th percentiles represent typical or average values (standard), and those below the 25th percentile are considered below-average values (abnormal). The 25th percentile corresponds to the first quartile (Q1), the 50th percentile is the median or second quartile (Q2), and the 75th percentile is the third quartile (Q3). The difference between the third and first quartiles, known as the interquartile range (IQR), provides a measure of the spread or dispersion of the data.
A widely accepted rule of thumb for identifying outliers in a dataset is the criterion of 1.5 times the interquartile range (IQR). According to this rule, a data point is considered an outlier if it falls by more than 1.5 times the IQR above the third quartile (Q3) or below the first quartile (Q1). In other words, any value lower than Q1 − 1.5 × IQR is classified as a low outlier, while any value higher than Q3 + 1.5 × IQR is regarded as a high outlier. The meaning of the rule is that it provides a robust method for detecting extreme values that deviate significantly from the bulk of the data distribution. The IQR, the difference between the third and first quartiles, captures the spread of the central portion of the data. By extending this range by 1.5 times on both sides, the rule establishes boundaries within which most of the data points are expected to fall, given a reasonably symmetric distribution.

3. Results

3.1. The “Zebra” Type of Asphalt Mixture

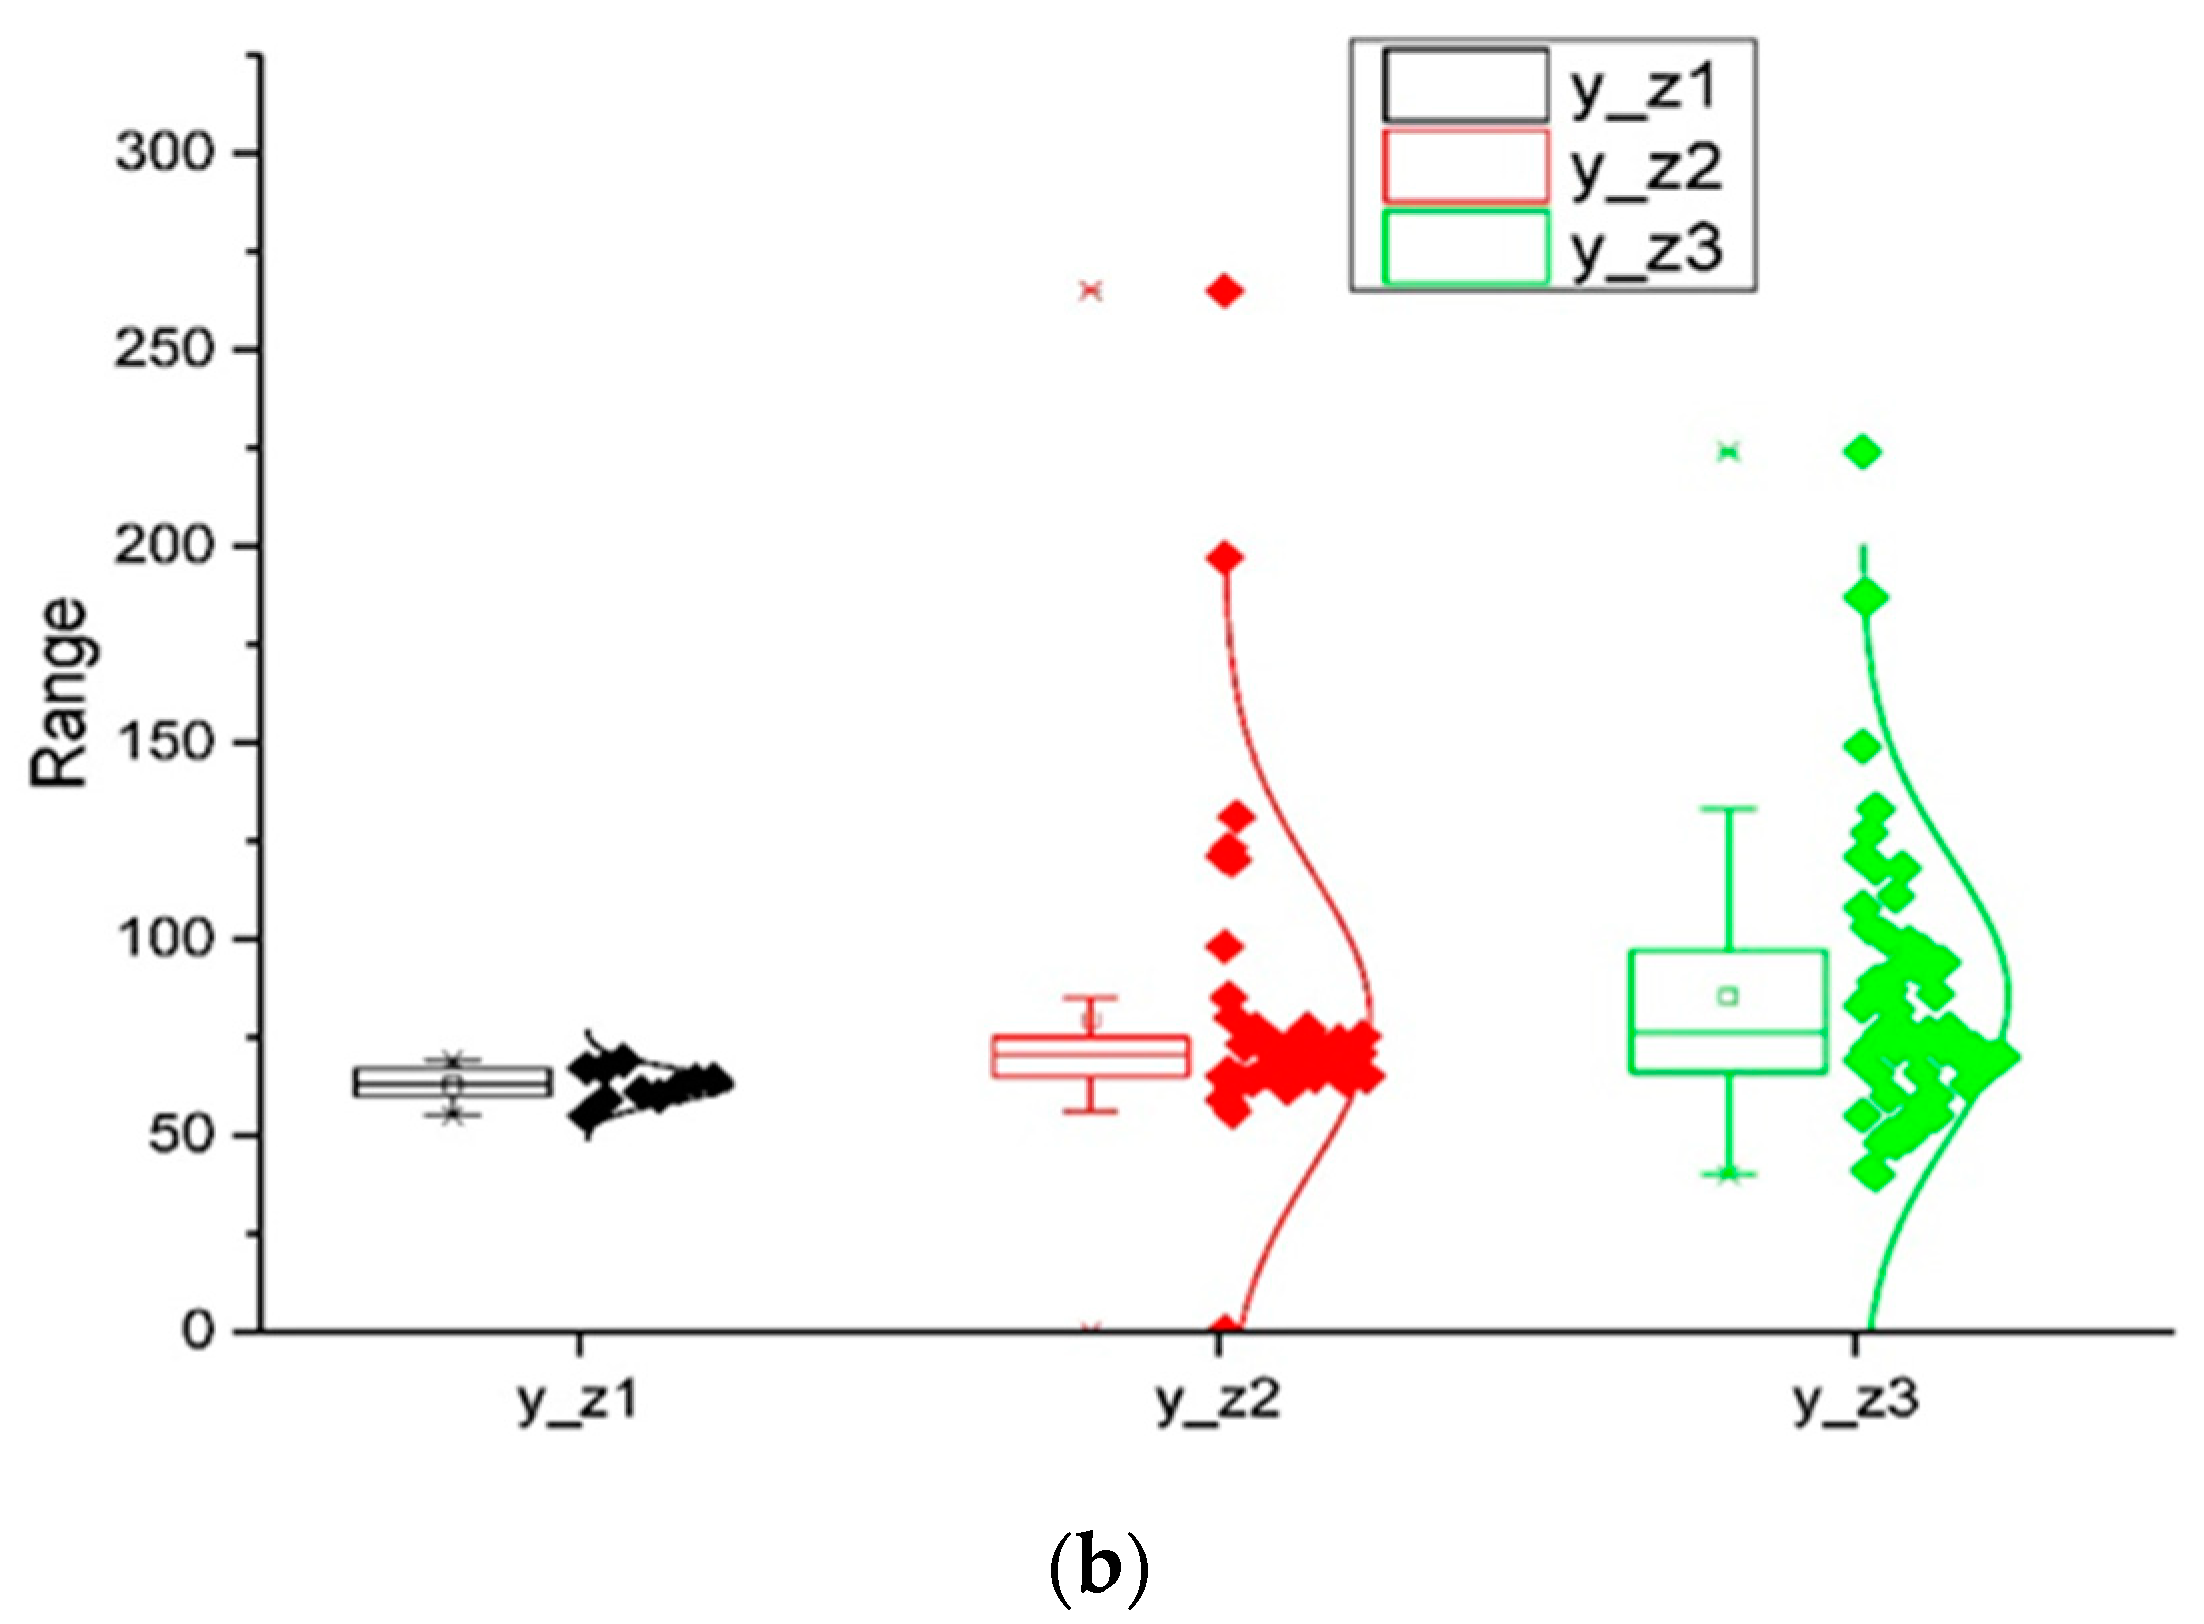
Figure 1 displays the fluctuations in the retroreflectivity values of the white lines over the initial three months following painting. The data indicate a decline in the retroreflectivity values over time (from about 200 to 100 mcd/m2/lux), aligning with the findings reported by [22,23,24,25,26,27,28,29,30,31,32,33,34,35]. Note that the mean value for all three datasets is similar to the median value, which implies the data’s normal distribution.
The alteration in the retroreflectivity values of the yellow lines contrasts with the observations made earlier for the white lines (approximately 50–100 mcd/m2/lux). It is evident that the median values for the three datasets are similar (around 60 mcd/m2/lux) and do not decrease significantly over time.

3.2. The “Basalt” Type of Asphalt Mixture

Figure 2 displays the fluctuations in the retroreflectivity values of the white lines over the first three months following the painting of the basalt asphalt mixture. The data indicate a decline in the retroreflectivity values over time (from 350 to 100 mcd/m2/lux). Note that the mean and median values for the third month here are higher than those for the first month of the Zebra mixture. The range of the data for the yellow lines here is also higher (80–120 mcd/m2/lux) than for the Zebra mixture.

3.3. The “Tama” Type of Asphalt Mixture

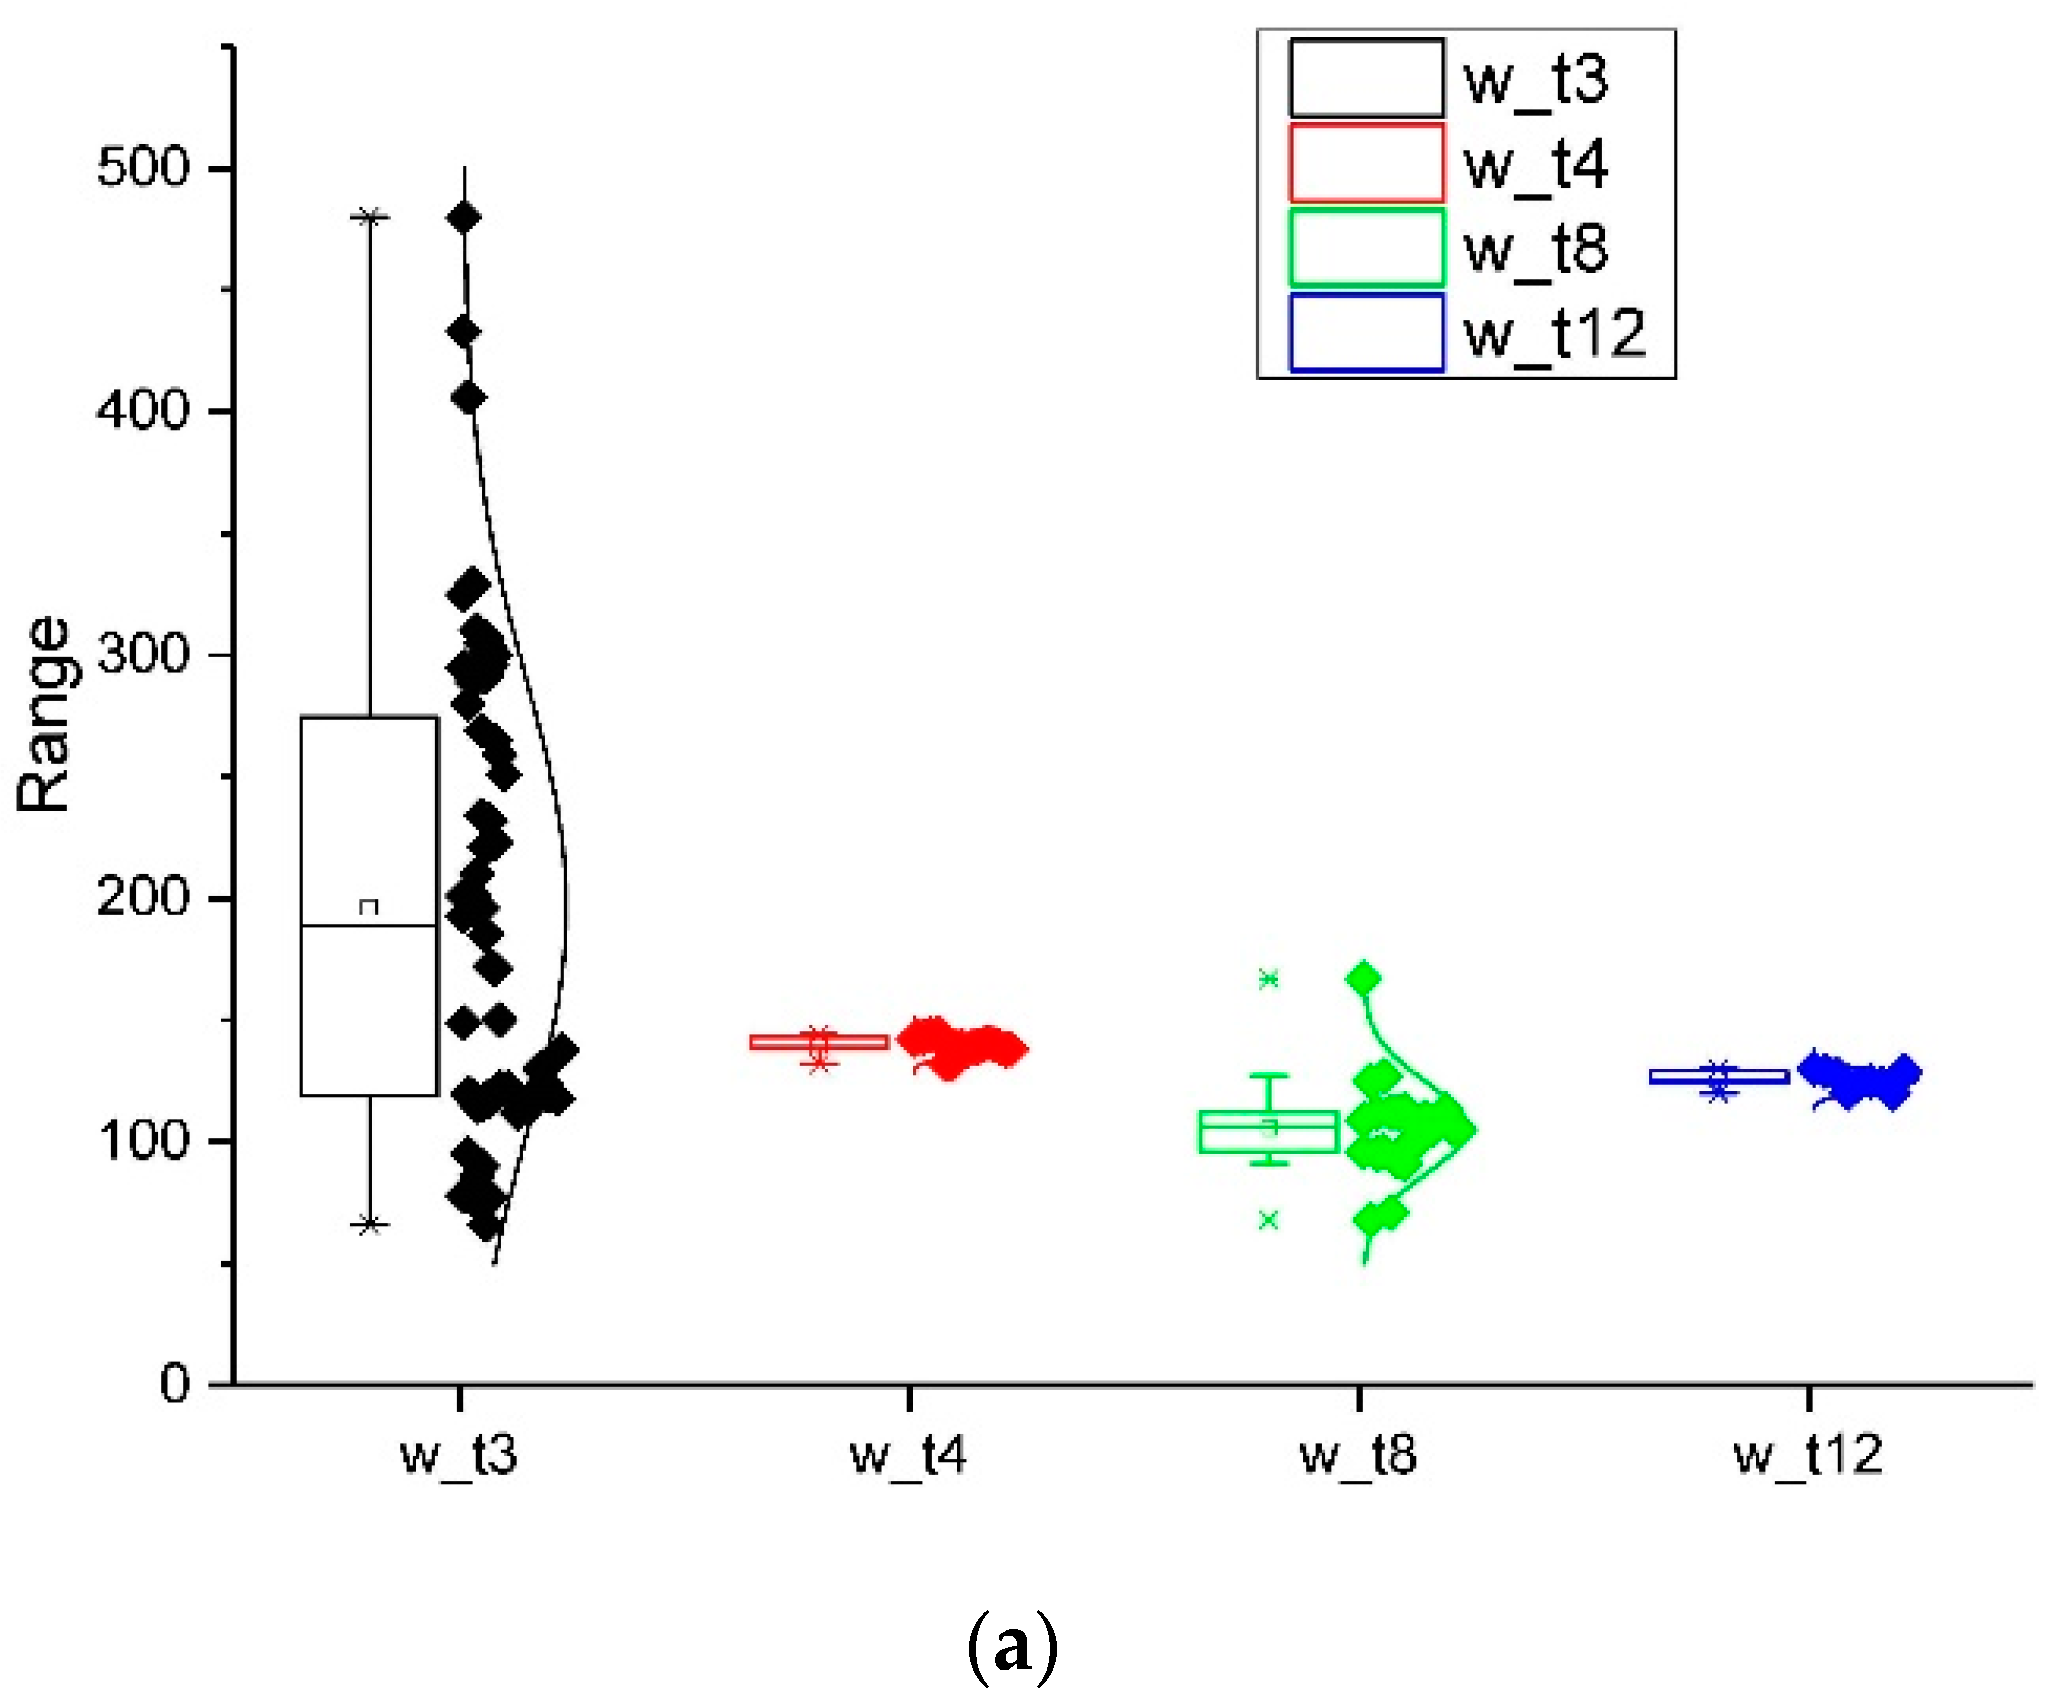
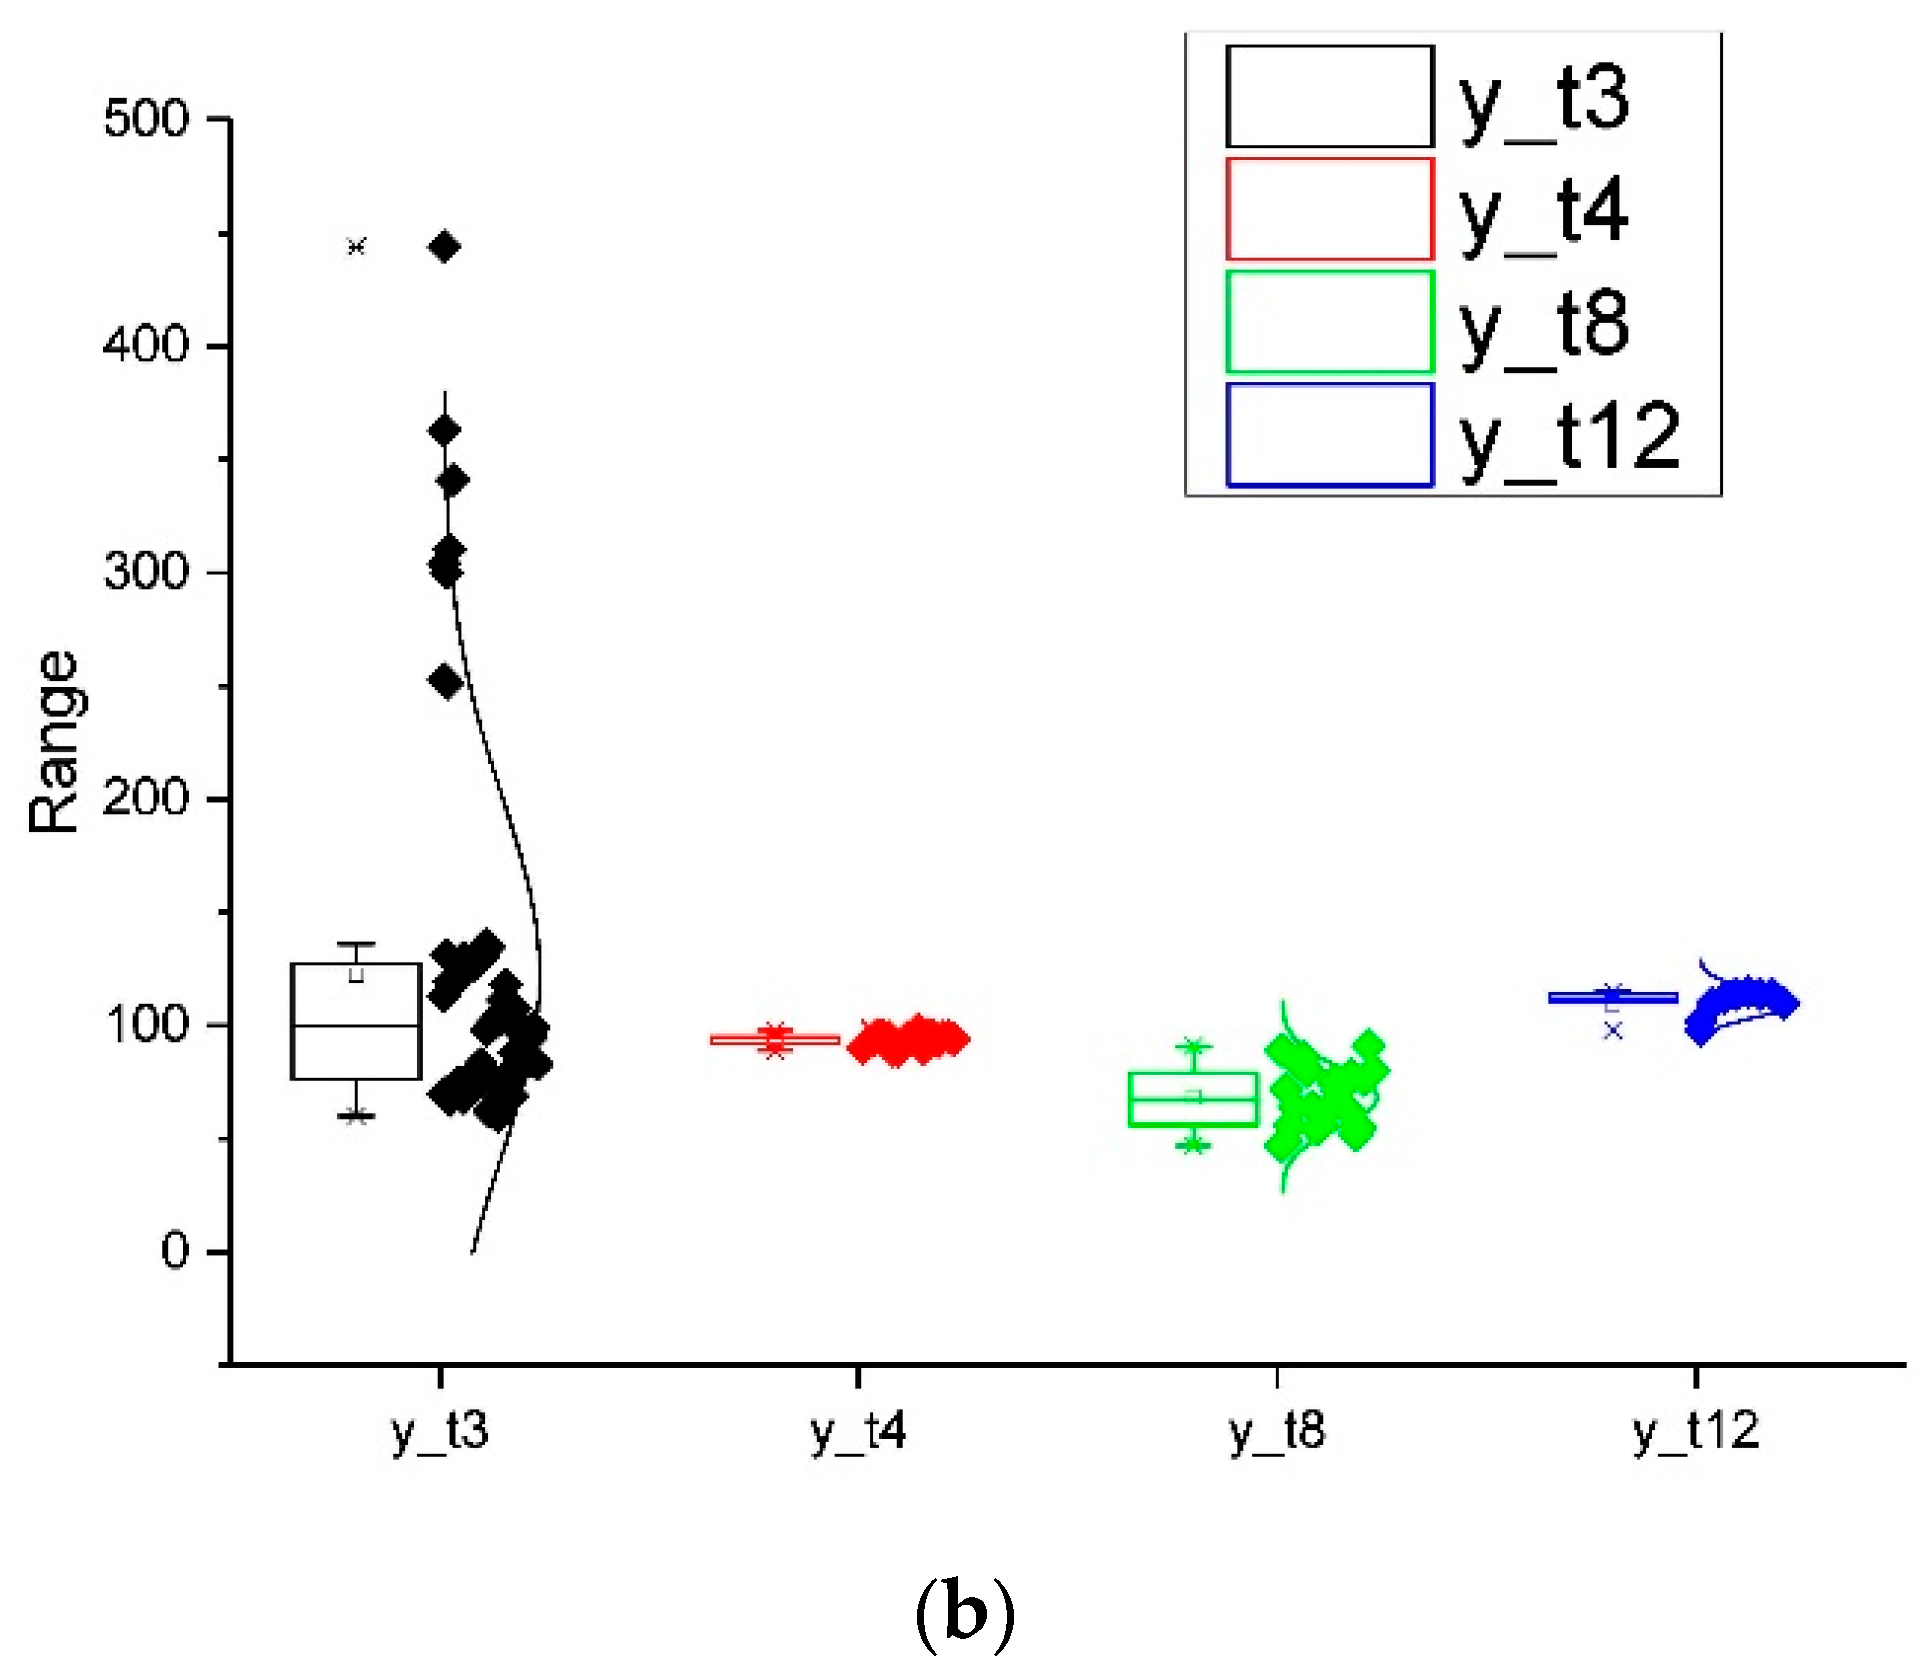
Figure 3 displays the fluctuations in the retroreflectivity values of the white lines from the 3rd to 12th month after the painting of the Tama asphalt mixture. The data indicate a decrease in the retroreflectivity values over time (from about 500 to about 150 mcd/m2/lux). Note that the mean and median values for the 4th–12th months are quite unvaried. The mean and median values for the yellow lines here are about 100 mcd/m2/lux.

3.4. Retroreflectivity Comparison of Three Types of Asphalt Pavement

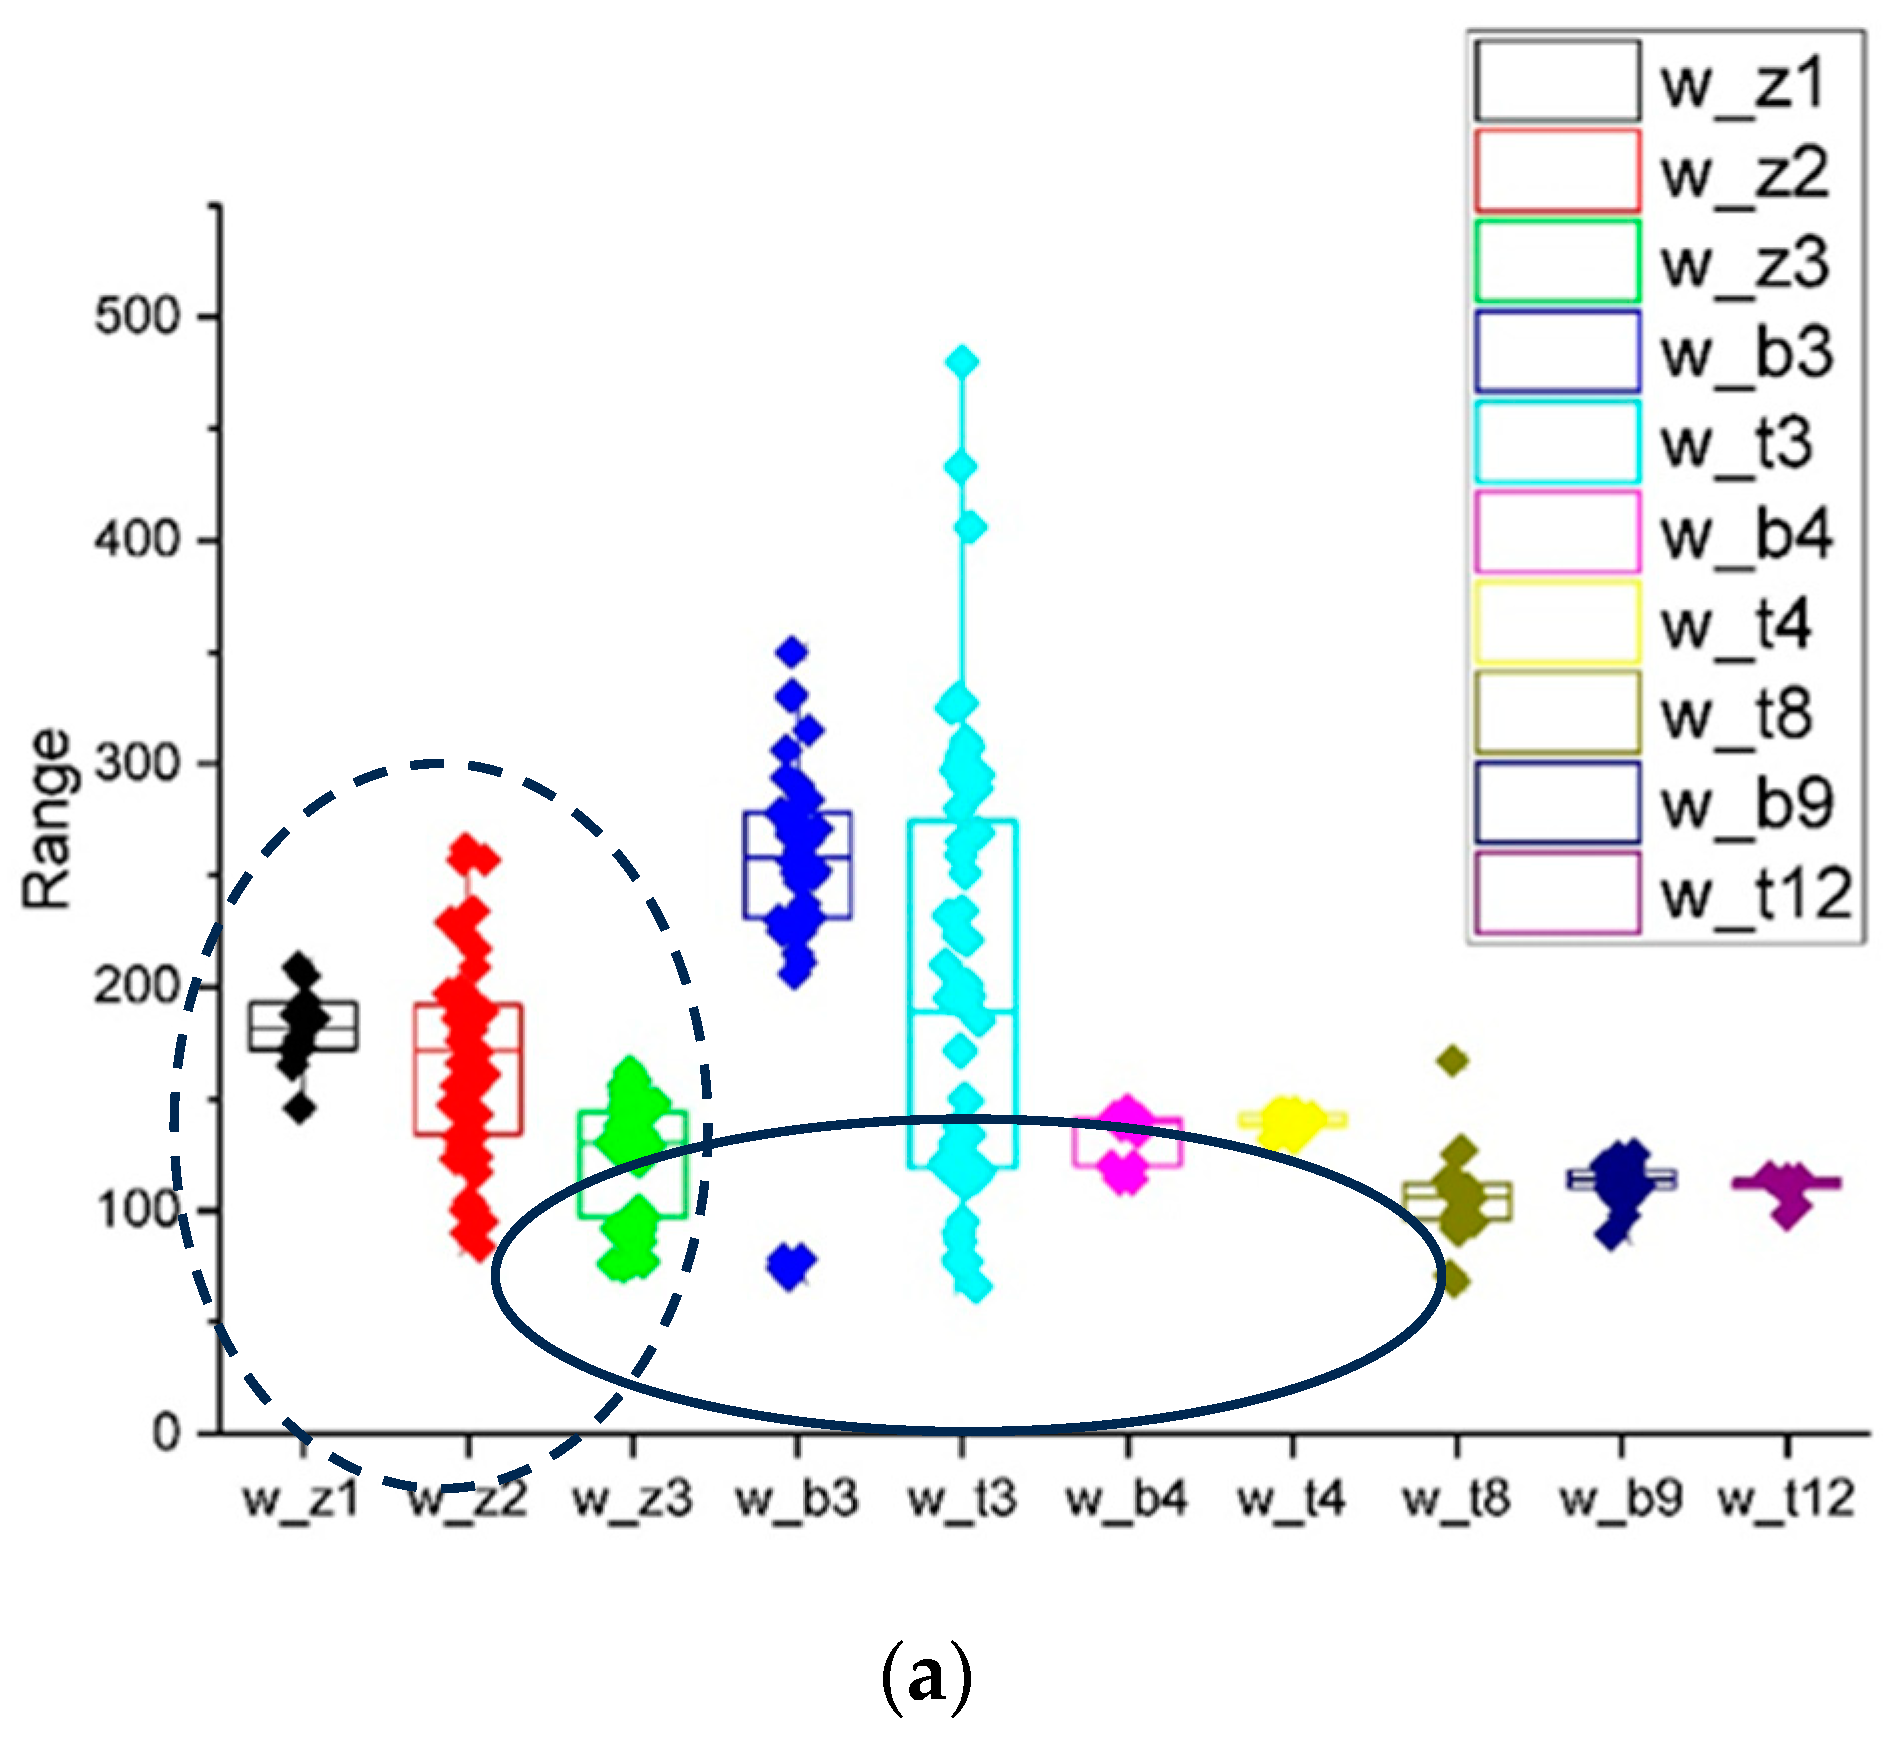
Figure 4 illustrates the shifts in the retroreflectivity values of both white and yellow lines across all the asphalt mixtures. Notably, the retroreflectivity values for the third month post painting over the Zebra paint (green) closely resemble those observed for the basalt (magenta) and Tama (yellow) pavements by the fourth month (around 125 mcd/m2/lux, dashed line). By the eighth month, these values decreased by approximately 25%, to values around 100 mcd/m2/lux, remaining stable until at least the twelfth month post painting.
Concerning the yellow lines, it is essential to highlight that the mean and median values remain consistent throughout the measurement period (ranging from 50 to 150 mcd/m2/lux) across all the types of asphalt mixtures.

3.5. Relationship between the Post-Painting Time and the Retroreflectivity Values for Three Types of Asphalt Pavement

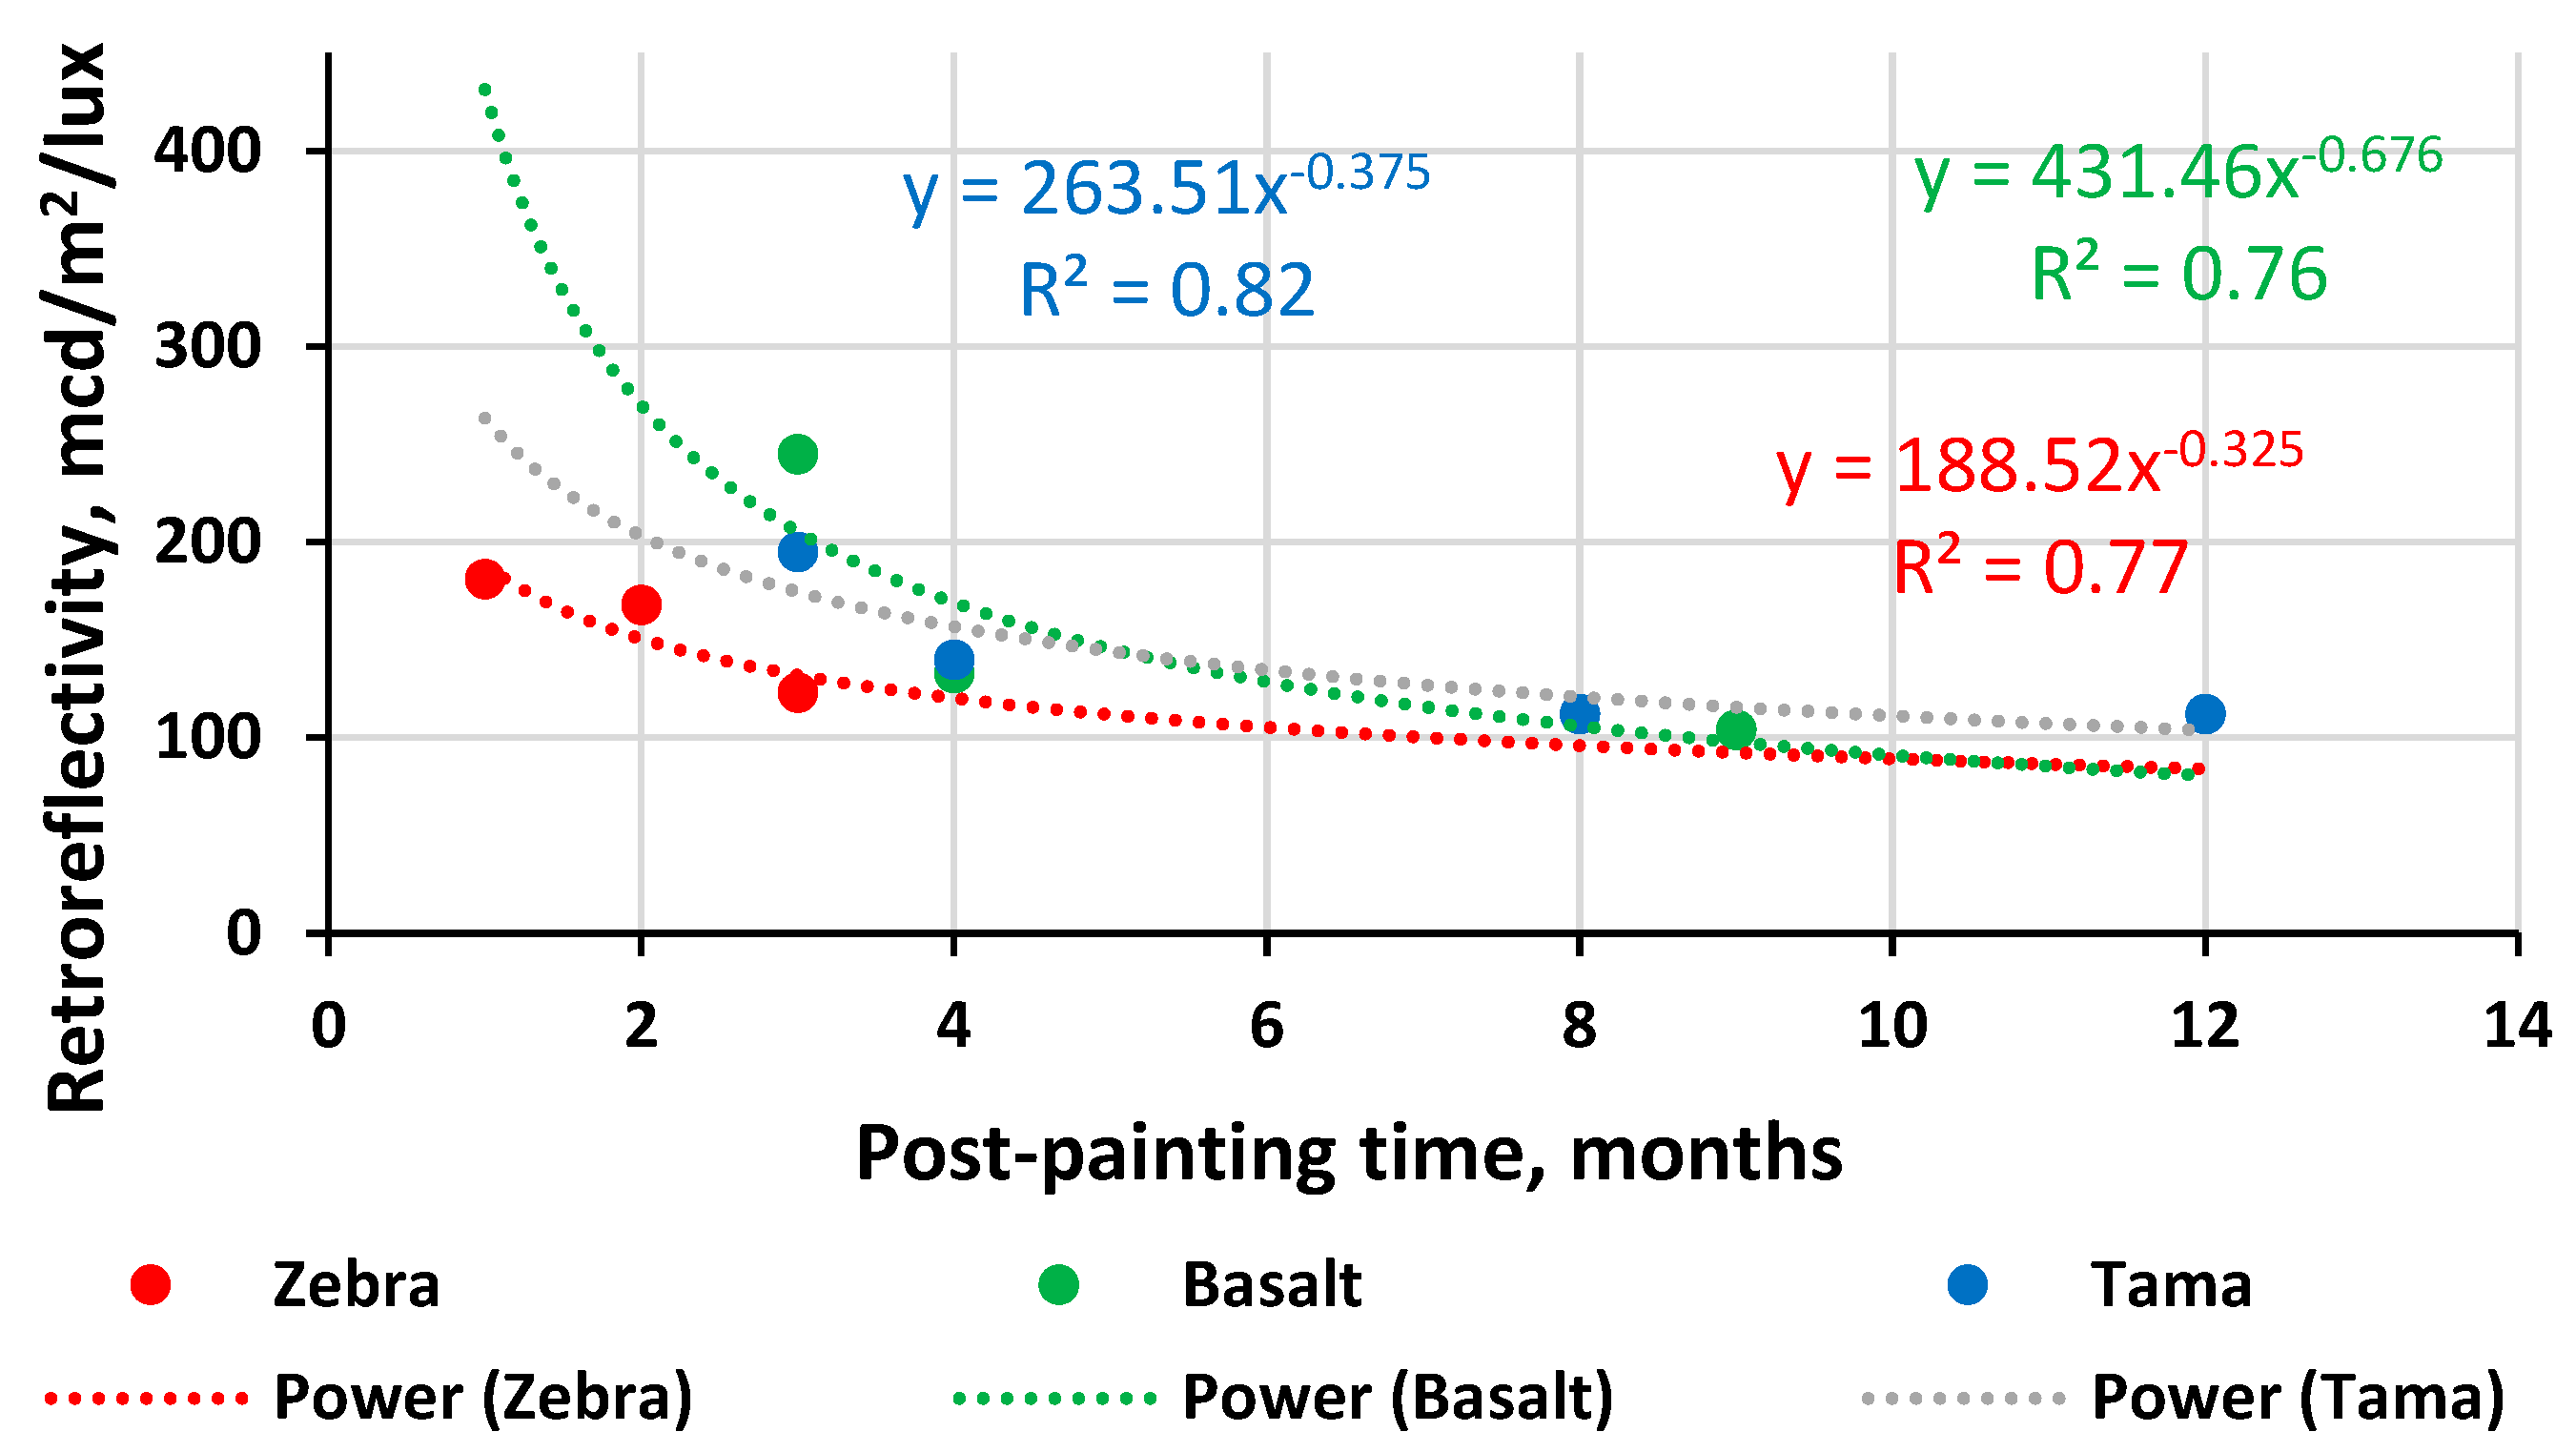
The dispersion of retroreflectivity is notably significant across several measurements. To mitigate its impact, this analysis will examine the relationships between the post-painting time and the retroreflectivity values, specifically emphasizing the mean values. Figure 5 illustrates that the general trends in the average mean value following the initial month post painting can reach approximately 430, 264, and 188 mcd/m2/lux for the basalt, Tama, and Zebra asphalt mixtures, respectively. When extrapolating the data over eight months, the disparity in the retroreflectivity values becomes negligible and remains consistent until the 12th month. Incorporating more data points would improve the accuracy of the trends, which will be addressed in future studies. Nonetheless, the observed retroreflectivity characteristics align with the well-known decreasing trend [27,28,29,30,31,32,33].

3.6. Effect of Annual Average Daily Traffic (AADT)

3.6.1. Analysis of Annual Average Daily Traffic vs. Post-Painting Time

The annual average daily traffic (AADT) is a parameter regularly used to describe the intensity of traffic on a highway [45,46]. This parameter indicates the total volume of vehicle travel on a road for an entire year, divided by 365 per day. Similarly, multiplying the AADT parameter by 30 days yields the number of vehicles traveling on the road for a month. Since retroreflectivity degradation is a cumulative phenomenon, let us define N Σ as follows [45,46]:
N Σ = i = 1 i = k N i
where   N Σ is the sum of vehicles traveling on the road for several months (from 1 to k), while   N i   is the number of vehicles traveling on the road for a month [46,47]. Note that
N i = 30 × A A D T i
Substituting Equation (2) into Equation (1) yields
N Σ = 30 i = 1 i = k A A D T i
and, after simplification,
N Σ ¯ = 30 i = 1 i = k A A D T i 30 k
where k is the number of months taken into account. Hence, N Σ ¯   , the elaborated cumulative AADT for several months, is taken into account.
N Σ ¯ = i = 1 i = k A A D T i k
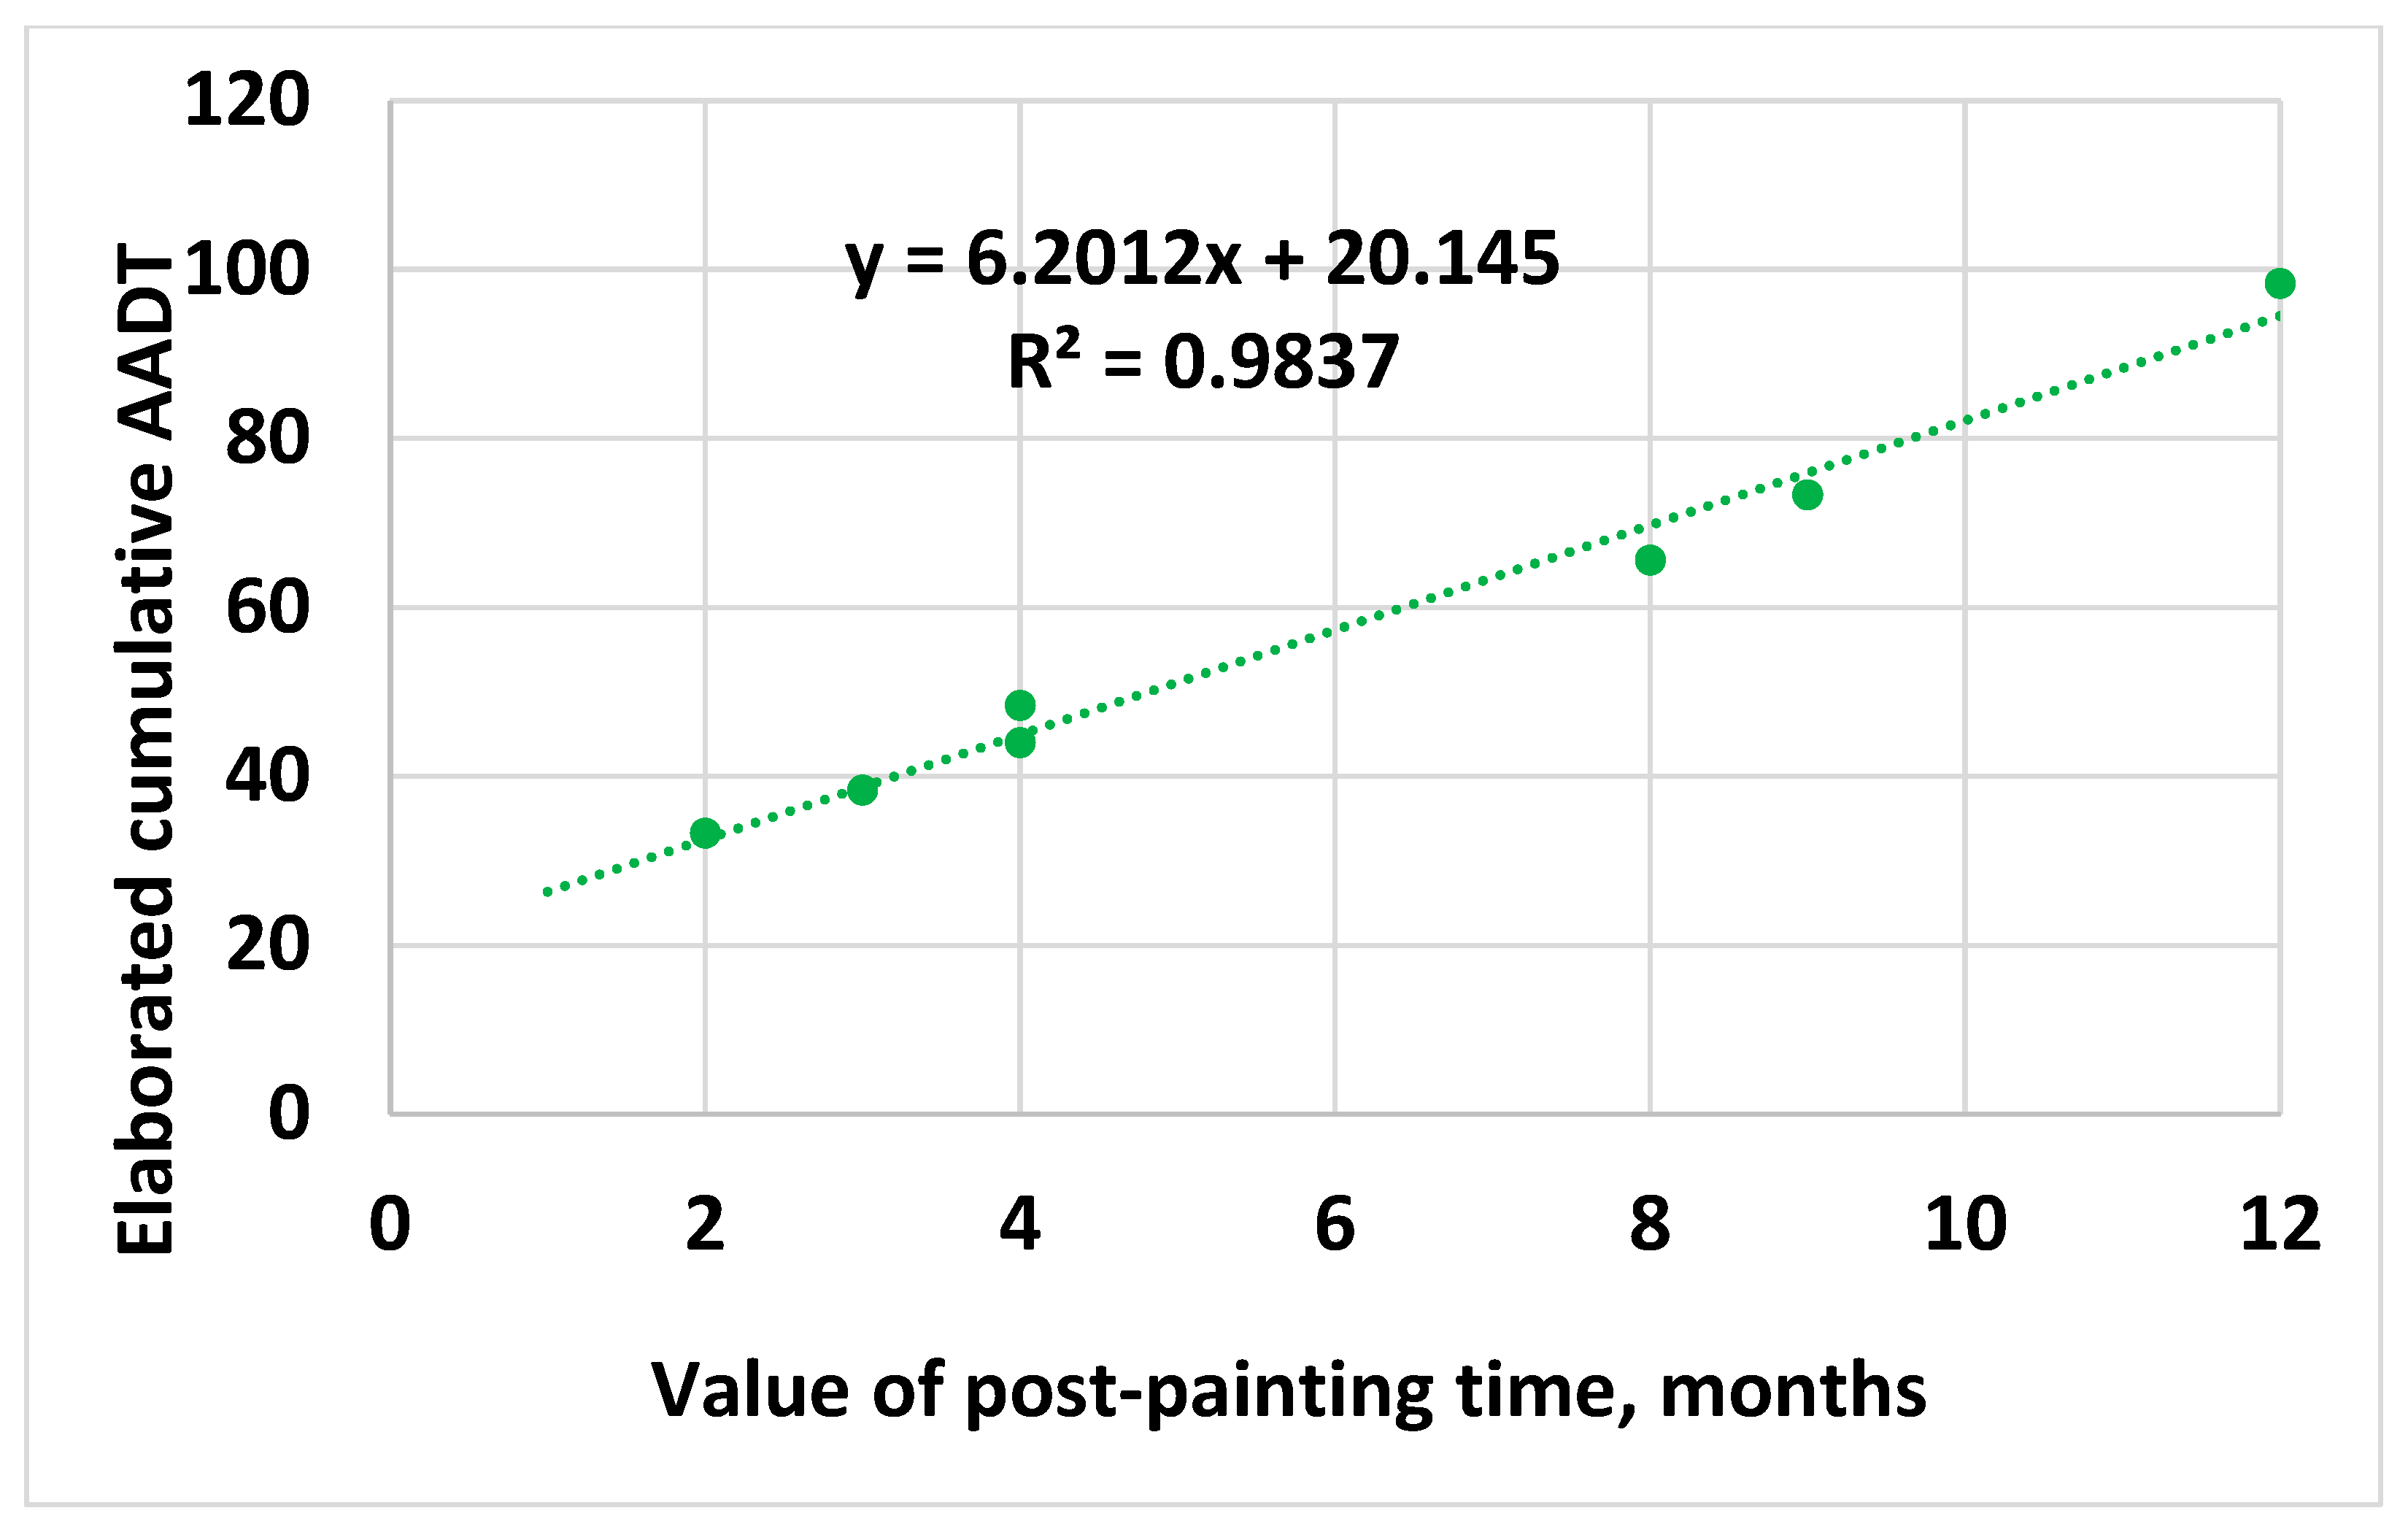
Figure 6 shows the relationships between the post-painting time (months) and the average cumulative AADT for this period. The regression coefficient between these two parameters is exceptionally high.

3.6.2. Analysis of Mean Values of Retroreflectivity vs. Post-Painting Time

The analysis of Figure 5 shows the dependences of retroreflectivity degradation with the value of post-painting time. To emphasize this dependence, we defined the elaborated value of retroreflectivity as follows:
R i ¯ = R i i
where R i ¯ is the elaborated value of retroreflectivity, and R i is the value of retroreflectivity measured i -month after painting.
Figure 7 shows the relationships between the post-painting time (months) and the elaborated value of retroreflectivity. The regression coefficient between these two parameters is high. Note that the results are for the retroreflectivity degradation of white marks.

3.6.3. Relationship between Mean Values of Retroreflectivity and Values of Average Cumulative AADT

Based on the high values of the regression coefficients, substituting the regression expression in Figure 7 into the regression in Figure 6 yields the following:
R i ¯ = 210 N Σ ¯ 2 3
Figure 8 presents the model testing results by showing the regression between the measured mean retroreflectivity values (X-axis) and those calculated using Equation (7). Note the regression coefficient of about one that validates the correctness of the suggested expression:

4. Discussion

This study investigates the impact of three asphalt mixtures on the retroreflectivity values of road pavement surfaces, focusing on road markings’ colors.
The analysis of the raw data collected in the field demonstrates a significant dispersion of the retroreflectivity values for all the measured mixtures. This phenomenon is consistent with the previous results [2,3,22,23,24,25,26,27,28,29,30,31,32,33,34,35], explaining the low regression coefficients for all the models suggested in previous studies, such as [35]. To mitigate the dispersion’s impact, the relationships between the post-painting time and the retroreflectivity values were analyzed using the mean retroreflectivity values.
The findings indicate that white road markings exhibit varying retroreflectivity values depending on the asphalt mixture. Among the three types of asphalt tested—basalt DCG, Zebra DCG, and Tama SMA—the basalt DCG proved to be the most effective in enhancing the prominence of road markings. Specifically, the initial retroreflectivity values for markings on the basalt DCG were significantly higher than those on the Zebra DCG and Tama SMA. The basalt mixture contained 100% black basalt aggregate, compared to the 60% in the Zebra mixture and the 0% in the Tama mixture (Section 2.1). The black color of the aggregate likely provides better contrast with the asphalt surface, resulting in higher retroreflectivity values in the first several months after painting. The question of why the 60% black aggregate in the Zebra mixture does not cause the same effect is still unclear and will be the subject of further study.
An interesting trend was observed regarding the degradation of retroreflectivity over time. This study revealed that the higher initial retroreflectivity values correlated with a steeper decline in retroreflectivity during the first three-to-four months post painting. For instance, the basalt mixture, which initially had the highest retroreflectivity, experienced a reduction rate of 0.676, while the Zebra mixture, with the lowest initial retroreflectivity, had a reduction rate of 0.325. After four months, the differences in the retroreflectivity values between the asphalt mixtures became minimal.
Our results demonstrate that white road markings generally reflect more light than yellow markings, consistent with previous studies [22,23,24,25,26,27,28,29,30,31,32,33,34,35,47]. Although yellow markings start with lower initial retroreflectivity values, their rate of decline in retroreflectivity over time is negligible across all three asphalt mixtures studied. This finding suggests that yellow markings maintain their retroreflective performance better than white markings in the long term.
This study mainly paid attention to the question of the effect of asphalt mixtures on the retroreflectivity values. Further investigation is required regarding the effect of the grade of bitumen used, the type of mixtures, the asphalt age, and so on.
Overall, this study underscores the importance of selecting appropriate asphalt mixtures to enhance the effectiveness of road markings. The results provide valuable insights for infrastructure planning and maintenance, emphasizing the need for the ongoing evaluation of road marking performance to ensure optimal visibility and safety.

5. Conclusions

  • This study investigates how the content of three asphalt mixtures affects the retroreflectivity of the road marks painted on the road surface.
  • The results show that the retroreflectivity values of white road markings vary depending on the asphalt mixtures under study.
  • Of the three mixtures tested—the “Basalt” and “Zebra” dense, coarse-graded mixtures, and the “Tama” stone mastic mixture—the “Basalt” mixture was the most effective in enhancing road marking visibility, with higher initial retroreflectivity values.
  • A relationship between the annual average daily traffic (AADT) and retroreflectivity mean values was identified, following a fractional power pattern, as demonstrated by the high regression coefficient of the cross-correlation line between the calculated and measured retroreflectivity values.
  • Data analysis uncovered a significant variation in the retroreflectivity values for the white and yellow road markings across the different asphalt mixtures.
  • The asphalt mixture did not appear to affect the yellow road markings.

Author Contributions

Conceptualization, W.E. and V.F.; methodology, W.E. and V.F.; software, M.A.A.; validation, M.A.A. and V.F.; formal analysis, M.A.A.; investigation, M.A.A. and V.F.; resources, W.E.; data curation, W.E. and M.A.A.; writing—original draft preparation, V.F.; writing—review and editing, W.E. and V.F.; visualization, W.E. and V.F.; supervision, W.E. and V.F.; and project administration, W.E. All authors have read and agreed to the published version of the manuscript.

Funding

V.F. acknowledges the support from the European Union’s Horizon 2020 research and innovation program under the Marie Sklodowska-Curie RISE project EffectFact, grant agreement no. 101008140.

Data Availability Statement

All data generated and analyzed during this study are included in this article.

Conflicts of Interest

The authors declare no conflicts of interest.

References

  1. Vereen, S.; Hummer, J.; Rasdorf, W. Alternative approaches for state agencies to address the proposed minimum retro-reflectivity standards. Public Work. Manag. Policy 2004, 8, 235–248. [Google Scholar] [CrossRef]
  2. Migletz, J.; Fish, J.K.; Graham, J.L. Roadway Delineation Practices Handbook; Report No. FHWA-SA-93-001; Federal Highway Administration, Department of Transportation: Washington, DC, USA, 1994. [Google Scholar]
  3. Migletz, J.; Graham, J.L.; Bauer, K.M.; Harwood, D.W. Service Life of Durable Pavement Markings. Transp. Res. Rec. 2001, 1749, 3–21. [Google Scholar] [CrossRef]
  4. Dravitzki, V.K.; Classen, C.T.; Lough, B.D.; Kneebone, D.C. The use of road studs: Effects on driving performance. Road Transp. Res. 2003, 12, 3–14. [Google Scholar]
  5. Zwahlen, H.T.; Schnell, T. Remaining Night-Time Visibility of Roadway Delineation Systems. In Proceedings of the Transportation Research Board 78th Annual Meeting, Washington, DC, USA, 10–14 January 1999. [Google Scholar]
  6. Villa, C.; Brémond, R.; Eymond, F.; Saint-Jacques, E. Characterization of luminescent road markings. Light. Res. Technol. 2023, 55, 459–473. [Google Scholar] [CrossRef]
  7. Bullough, J.D.; Liu, X. Assessing the visibility of raised pavement markers and alternative forms of delineation. Transport 2020, 35, 98–107. [Google Scholar] [CrossRef]
  8. Ye, F.; Pike, A. Studying the Nighttime Visibility Performance of Retroreflective Pavement Markers. Transp. Res. Rec. 2019, 2673, 334–344. [Google Scholar] [CrossRef]
  9. Zhu, B.; Song, C.; Guo, Z.; Zhang, Y.; Zhou, Z. Effectiveness of Active Luminous Lane Markings on Highway at Night: A Driving Simulation Study. Sustainability 2021, 13, 1043. [Google Scholar] [CrossRef]
  10. Cho, Y.; Kabassi, K.; Pyeon, J.-H.; Choi, K.; Wang, C.; Norton, T. Effectiveness study of methods for removing temporary pavement markings in roadway construction zones. J. Constr. Eng. Manag. 2013, 139, 257–266. [Google Scholar] [CrossRef]
  11. Wang, K.; Lu, Z.; Zou, Y.; Zhu, Y.; Yu, J. Preparation and Performance Characterization of an Active Luminous Coating for Asphalt Pavement Marking. Coatings 2023, 13, 1108. [Google Scholar] [CrossRef]
  12. Chen, J.; Li, R.; Zhang, Y.; Wu, Y.; He, H. Study on the Reflective Principle and Long-Term Skid Resistance of a Sustainable Hydrophobic Hot-Melt Marking Paint. Sustainability 2023, 15, 9950. [Google Scholar] [CrossRef]
  13. Burghardt, T.E.; Babic, D.; Pashkevich, A. Sustainability of thin layer road markings based on their service life. Transp. Res. Part D 2022, 109, 103339. [Google Scholar]
  14. Burghardt, T.E.; Pashkevich, A. Green Public Procurement criteria for road marking materials from insiders’ perspective. J. Clean. Prod. 2021, 298, 126521. [Google Scholar] [CrossRef]
  15. Hong, C.-W. Properties of Temperature Reduction of Cooling Asphalt Pavements Using High-Reflectivity Paints. KSCE J. Civ. Environ. Eng. Res. 2013, 33, 317–327. [Google Scholar] [CrossRef]
  16. Smadi, O.; Hawkins, N.; Nlenanya, I.; Aldemir-Bektas, B. Pavement marking retro-reflectivity and the safety effects of pavement marking maintenance. Transp. Res. Rec. 2016, 2585, 61–73. [Google Scholar]
  17. Zwahlen, H.T.; Russ, A. Photometric measurements of retroreflective raised pavement markers in Ohio. Transp. Res. Rec. 2002, 1794, 93–100. [Google Scholar]
  18. Gates, T.J.; Hawkins, H.G.; Rose, E.R. Effective Placement of Raised Pavement Markers to Assist Older Drivers; Texas Transportation Institute, Texas A&M University System: College Station, TX, USA, 2003. [Google Scholar]
  19. Sadeghpour, F.; Mohaymany, A.S.; Mehin, H.K. Intelligent transportation system: A planning support functionality for road studs. J. Transp. Eng. 2009, 135, 629–638. [Google Scholar]
  20. Shaheen, S.; Lipman, T.E. Reducing greenhouse gas emissions and fuel consumption: Sustainable approaches for surface transportation. IATSS Res. 2007, 31, 6–20. [Google Scholar] [CrossRef]
  21. Bahar, G.; Mollett, C.; Persaud, B.; Lyon, C.; Smiley, A.; Smahel, T.; McGee, H. Safety Evaluation of Permanent Raised Pavement Markers; NCHRP Report 518; National Research Council: Washington, DC, USA, 2004. [Google Scholar]
  22. Sun, X.; Das, S. Driver perception of raised pavement markers in snowstorms. J. Transp. Eng. 2012, 138, 705–711. [Google Scholar]
  23. Abboud, N.; Bowman, B.L. Establishing Crash-Based Retroreflectivity Threshold. In Proceedings of the 81st Annual Meeting of the Transportation Research Board, Washington, DC, USA, 13–17 January 2002. [Google Scholar]
  24. Graham, J.R.; Harrold, J.K.; King, L.E. Pavement Marking Retroreflectivity Requirements for Older Drivers. Transp. Res. Rec. 1996, 1529, 65–70. [Google Scholar] [CrossRef]
  25. Loetterle, F.E.; Beck, R.A.; Carlson, J. Public Perception of Pavement Marking Brightness. In Proceedings of the Transportation Research Board 78th Annual meeting, Washington, DC, USA, 10–14 January 1999. [Google Scholar]
  26. Migletz, J.; Graham, J.L.; Bauer, K.; Harwood, D.W.; City, K. Field Surveys of Pavement-Marking Retroreflectivity. Transp. Res. Rec. 1999, 1657, 71–78. [Google Scholar] [CrossRef]
  27. Lee, J.T.; Maleck, T.L.; Taylor, W.C. Analysis of the Correlation between Pavement Marking Visibility and Nighttime Accidents. In Proceedings of the 77th Annual Meeting of the Transportation Research Board, Washington, DC, USA, 11–15 January 1998. [Google Scholar]
  28. Craig, W.N.; Sitzabee, W.E.; Hummer, J.E.; Rasdorf, W. Impact of line location on Pavement marking retroreflectivity degradation. J. Public Work. Manag. Policy 2007, 12, 431–450. [Google Scholar] [CrossRef]
  29. Obeng, D.A.; Owusu, V.; Tuffour, Y.A. Degradation of retro-reflectivity of thermoplastic pavement markings on trunk roads in Ghana. Transp. Eng. 2021, 5, 100082. [Google Scholar] [CrossRef]
  30. Thanasupsin, K.; Sukniam, S. Degradation of the Retroreflectivity and Diffuse Illumination of Thermoplastic Pavement Markings: A Case Study in Thailand. In IOP Conference Series: Materials Science and Engineering, Proceedings of the Annual Conference on Computer Science and Engineering Technology (AC2SET), Medan, Indonesia, 23 September 2020; IOP Publishing: Bristol, UK, 2021; Volume 1088, p. 012056. [Google Scholar]
  31. Chou, C.-P.; Leong, K.-W.; Chen, A.-C.; Lee, Y.-X. Road marking retroreflectivity study via a visual algorithm. Int. J. Pavement Res. Technol. 2020, 13, 614–620. [Google Scholar] [CrossRef]
  32. De Salles, L.S.; da Silva Pereira, D.; Teixeira, D.L.K.; Pereira, L.P.S. Avaliação retrorrefletiva de pintura de demarcação horizontal: Peculiaridades e considerações sobre a norma e os requisitos mínimos nacionais. Transportes 2015, 23, 5–17. [Google Scholar] [CrossRef]
  33. He, H.; Zhou, Y.; Zhang, J.; Cao, J.; Leng, Z.; Su, W. Measuring Method and Standard System for Retroreflective Traffic Marking’s Photometric Characteristic. In Optical Measurement Systems for Industrial Inspection XI, Proceedings of the SPIE Optical Metrology 2019, Munich, Germany, 24–28 June 2019; Proc. SPIE: Bellingham, WA, USA, 2019; p. 11056. [Google Scholar] [CrossRef]
  34. Mazzoni, L.N.; Machado, D.D.N.; Vasconcelos, K.L.; Bernucci, L.L.B.; Linhares, G.R.; Branco, V.T.F.C. Characterization of glass beads by image methods for pavement marking retroreflectivity. Transportes 2022, 30, 12. [Google Scholar] [CrossRef]
  35. Owusu, V.; Tuffour, Y.A.; Obeng, D.A.; Salifu, M. Degradation of Retro-Reflectivity of Thermoplastic Pavement Markings: A Review. Open J. Civ. Eng. 2018, 8, 301–311. [Google Scholar] [CrossRef]
  36. Onyango, M.A.; Malyuta, D.; Owino, J.; Chimba, D. Verification of Pavement Marking Degradation Models using Eastern Tennessee Pavement Marking Retroreflectivity Data. In Proceedings of the 2nd Pan African International Conference on Science, Computing and Telecommunications, Arusha, Tanzania, 14–18 July 2014. [Google Scholar]
  37. Zhang, G.; Hummer, J.E.; Rasdorf, W.; Mastin, N. The Impact of Pavement Type and Roughness on Paint Marking Retroreflectivity. Public Work. Manag. Policy 2013, 18, 41–55. [Google Scholar] [CrossRef]
  38. National Asphalt Pavement Association. Designing and Constructing SMA Mixtures-State-of-the-Practice. Quality Improvement Series 122; National Asphalt Pavement Association: Lanham, MD, USA, 2002; pp. 20706–24407. Available online: https://www.asphaltpavement.org/ (accessed on 12 August 2024).
  39. National Asphalt Pavement Association. HMA Pavement Mix Type Selection Guide. Information Series 128; National Asphalt Pavement Association and Federal Highways Administration: Lanham, MD, USA, 2001; pp. 20706–24413. [Google Scholar]
  40. Netivei Israel. Chapter 51: Paving Works, Subchapter 04: Asphalt Layers. In The General Specification for Paving and Bridging Works; The National Transportation Infrastructure Company Ltd.: Or-Yehuda, Israel, 2016. [Google Scholar]
  41. Hyndman, R.J.; Fan, Y. Sample Quantiles in Statistical Packages. Am. Stat. 1996, 50, 361–365. [Google Scholar] [CrossRef]
  42. Lane, D. Percentiles. In Introduction to Statistic; Rice University: Houston, TX, USA, 2003; Retrieved 15 September 2007. [Google Scholar]
  43. Schoonjans, F.; de Bacquer, D.; Schmid, P. Estimation of population percentiles. Epidemiology 2011, 22, 750–751. [Google Scholar] [CrossRef]
  44. Langford, E. Quartiles in Elementary Statistics. J. Stat. Educ. 2006, 14, 1–20. [Google Scholar] [CrossRef]
  45. Federal Highway Administration. Traffic Data Computation Method Pocket Guide; Publication No. FHWA-PL-18-027; The Federal Highway Administration (FHWA), Department of Transportation: Washington, DC, USA, 2018. [Google Scholar]
  46. Schroeder, B.J. Transportation Planning. In Highway Engineering; Elsevier: Amsterdam, The Netherlands, 2016. [Google Scholar]
  47. Donnell, E.; Karwa, V.; Sathyanarayanan, S. Analysis of Effects of Pavement Marking Retroreflectivity on Traffic Crash Frequency on Highways in North Carolina: Application of Artificial Neural Networks and Generalized Estimating Equations. Transp. Res. Rec. 2009, 2103, 50–60. [Google Scholar] [CrossRef]
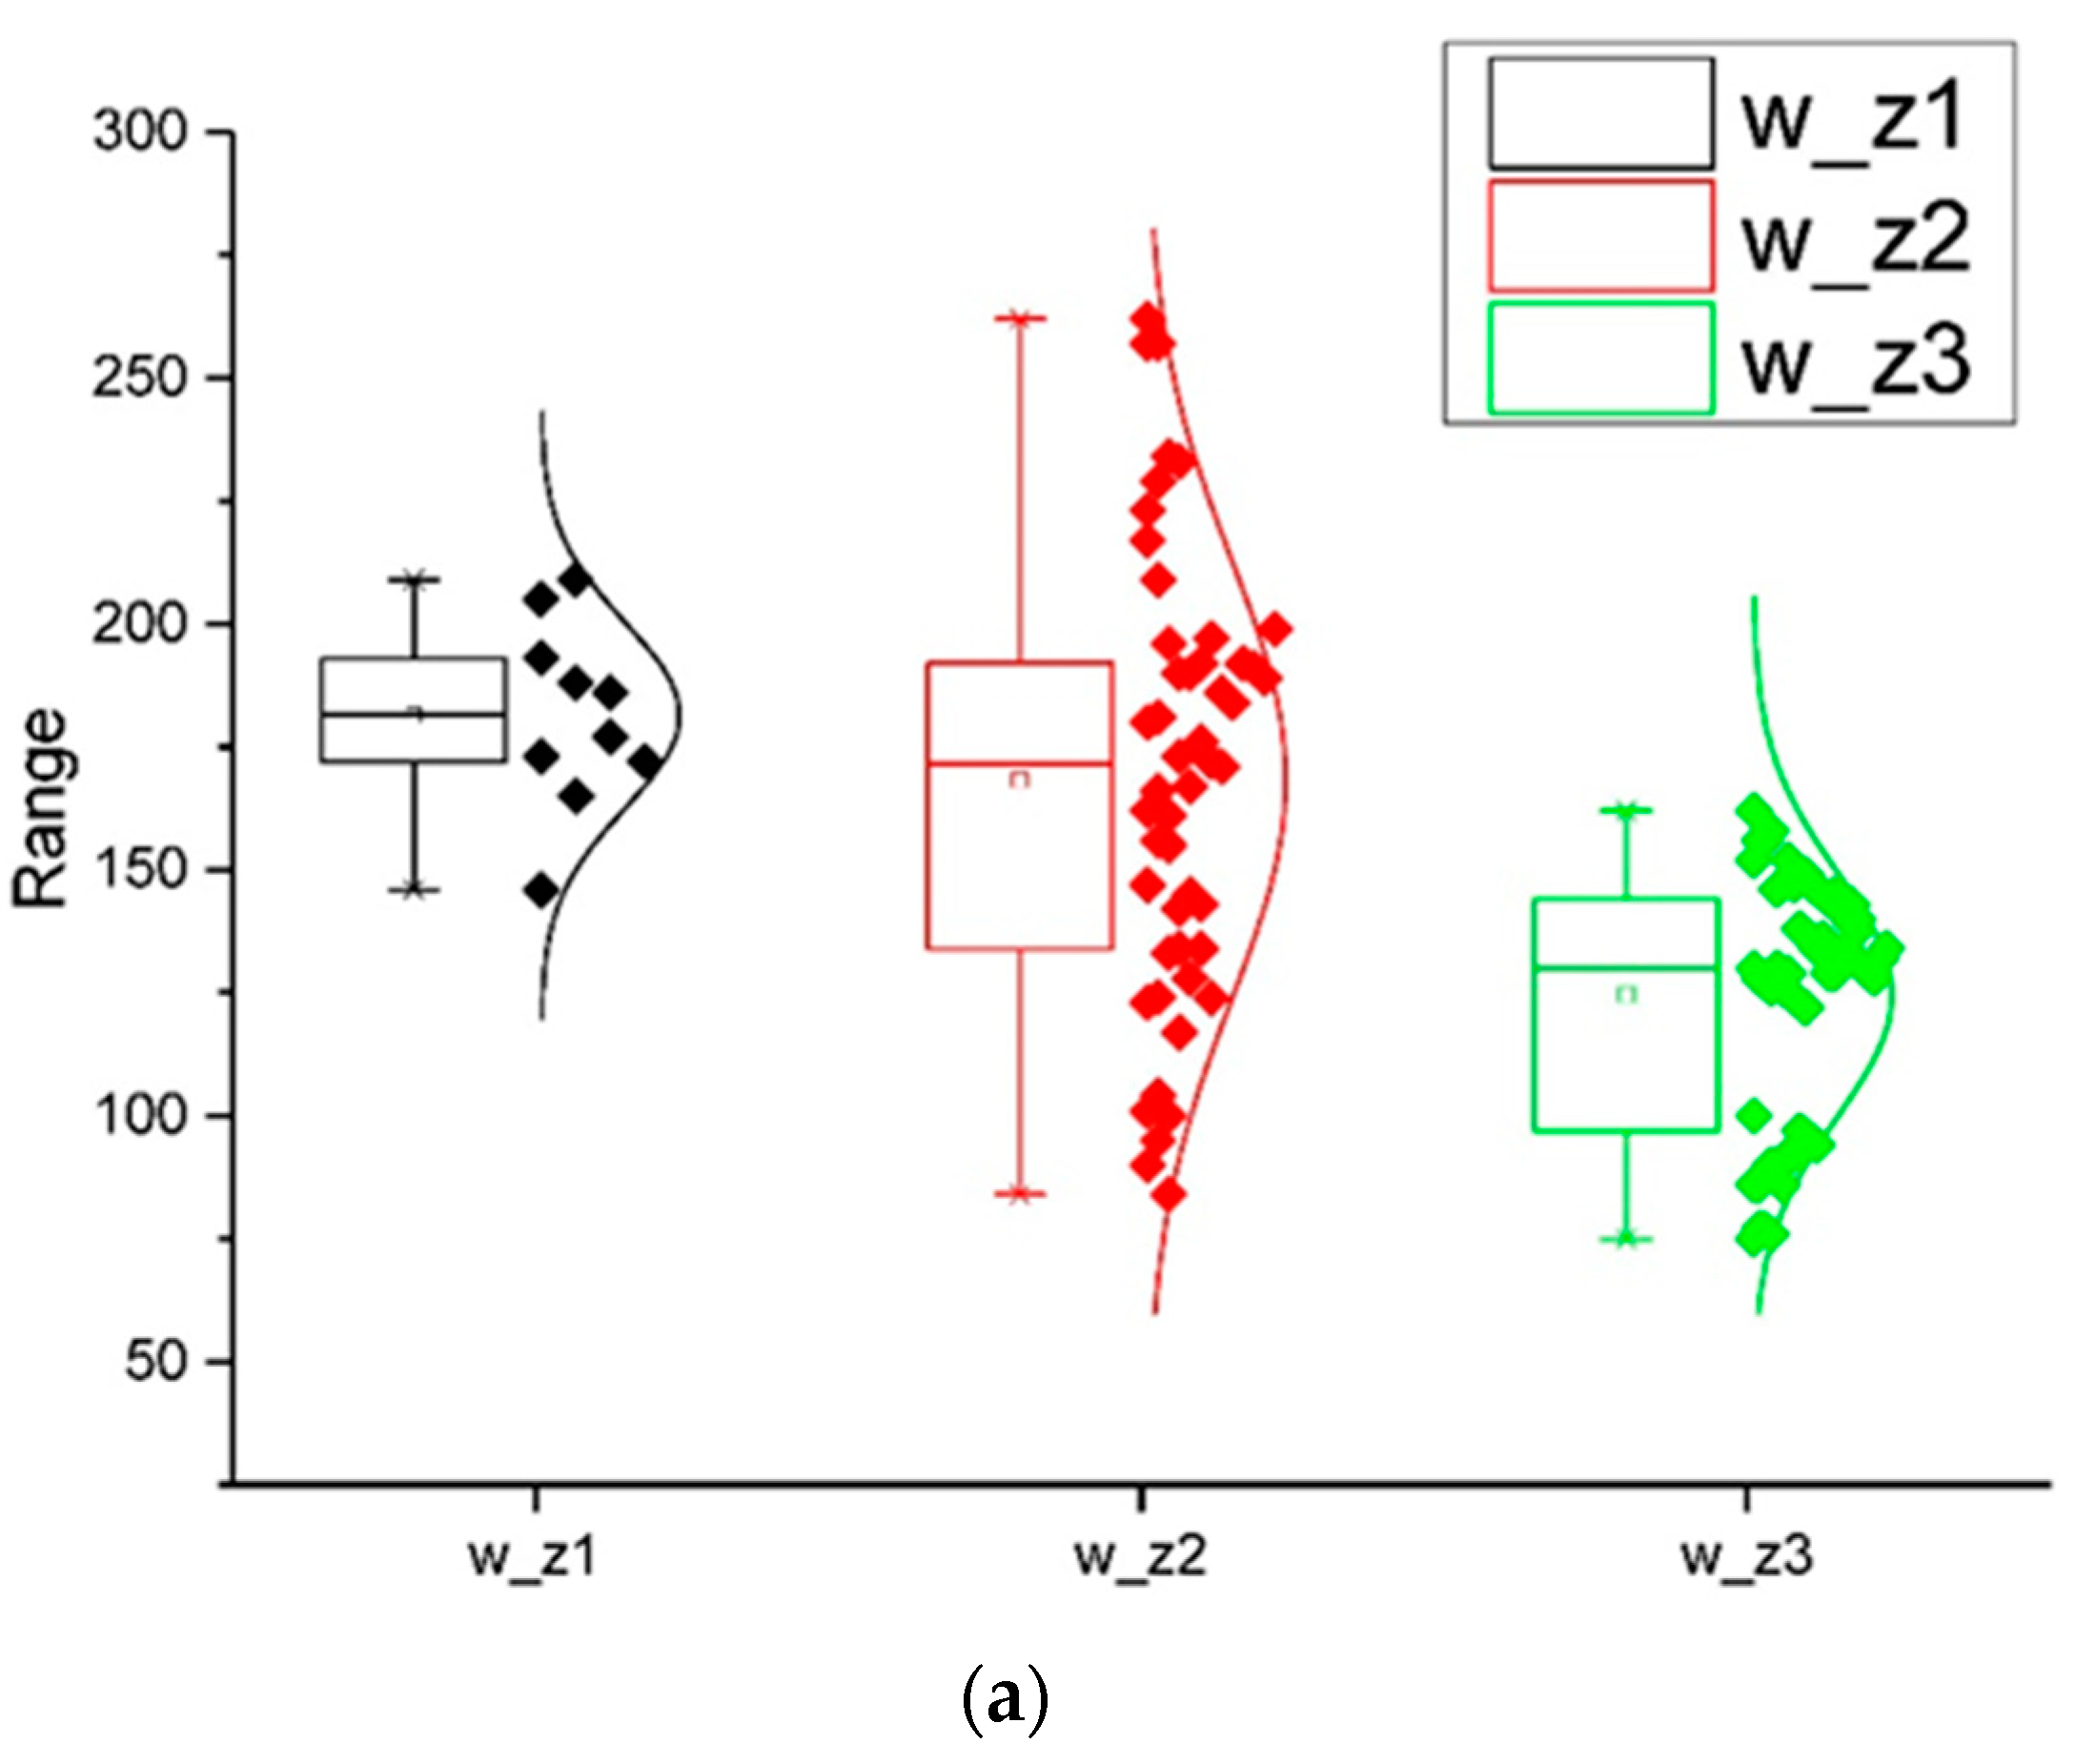
Figure 1. The relationships between the values of retroreflectivity degraded since line painting and the measurement date for the Zebra-type asphalt, painted in white (a) and yellow (b). The labels w_z1, w_z2, and w_z3 (on the X-axis) denote the white color, the Zebra mixture, and 1, 2, and 3 months post painting, respectively. Similarly, y_z1, y_z2, and y_z3 denote the yellow color, the Zebra mixture, and 1, 2, and 3 months post painting. Each box’s top and bottom edges represent the 25th (Q1) and 75th (Q3) percentiles, respectively, with the line inside indicating the median value (Q2). A small square denotes the mean value for each set. The upper range’s line signifies Q1 minus 1.5 times the interquartile range (IQR), while the lower line indicates Q3 plus 1.5 times the IQR, where the IQR is calculated as Q3 minus Q1.
Buildings 14 02525 g001aBuildings 14 02525 g001b
Figure 2. The relationships between the values of retroreflectivity degraded since line painting and the measurement date for basalt-type asphalt, painted in white (a) and yellow (b). The labels w_b1, w_b2, and w_b3 (in X-axis) denote the white color, the basalt mixture, and 3, 4, and 9 months post-painting, respectively. Similarly, y_b3, y_b4, and y_b9 denote the yellow color, the basalt mixture, and 3, 4, and 9 months post painting. Each box’s top and bottom edges represent the 25th (Q1) and 75th (Q3) percentiles, respectively, with the line inside indicating the median value (Q2). A small square denotes the mean value for each set. The upper range’s line signifies Q1 minus 1.5 times the interquartile range (IQR), while the lower line indicates Q3 plus 1.5 times the IQR, where the IQR is calculated as Q3 minus Q1.
Buildings 14 02525 g002aBuildings 14 02525 g002b
Figure 3. The relationships between the values of retroreflectivity degraded since line painting and the measurement date for TAMA-type asphalt, painted in white (a) and yellow (b). The labels w_t3, w_t4, w_t8, and w_t12 (in X-axis) denote the white color, the Tama mixture, and 3, 4, 8, and 12 months post painting, respectively. Similarly, labels y_t3, y_t4, y_t8, and y_t12 denote the yellow color, the Tama mixture, and 1, 2, and 3 months post painting. Each box’s top and bottom edges represent the 25th (Q1) and 75th (Q3) percentiles, respectively, with the line inside indicating the median value (Q2). A small square denotes the mean value for each set. The upper range’s line signifies Q1 minus 1.5 times the interquartile range (IQR), while the lower line indicates Q3 plus 1.5 times the IQR, where the IQR is calculated as Q3 minus Q1.
Buildings 14 02525 g003aBuildings 14 02525 g003b
Figure 4. The relationships between the values of retroreflectivity degraded since line painting and the measurement date for “three types of asphalt”, painted in white (a) and yellow (b). The dashed-line ellipse in (a) shows the example of retroreflectivity degradation for the Zebra mixture during the first three months after painting. The full-line ellipse shows the compared values of retroreflectivity for the Zebra, Basalt, and Tama mixtures (see more detail in Section 3.4). The dashed lines in (b) represent the range for the mean and median values that remain consistent throughout the measurement period (50–150 mcd/m2/lux) across all types of asphalt mixtures. The labels in both figures are explained in the figure captions for Figure 1, Figure 2 and Figure 3.
Buildings 14 02525 g004aBuildings 14 02525 g004b
Figure 5. The relationships between the post-painting time (months) and the retroreflectivity values (mcd/m2/lux).
Buildings 14 02525 g005
Figure 6. The relationships between the post-painting time (months) and the elaborated cumulative AADT.
Buildings 14 02525 g006
Figure 7. The relationships between the post-painting time (months) and the elaborated retroreflectivity value for the white lines.
Buildings 14 02525 g007
Figure 8. The regression between the measured (X-axis) and calculated (using Equation (6)) mean retroreflectivity values.
Buildings 14 02525 g008
Table 1. Aggregate grain distribution [40].
Mixture
Type
Percentage Passing, mm
1912.59.54.7520.075
Tama10090–9525–3020–2515–258–11
Basalt 10082–9456–7236–505–9
Zebra10090–9570–7532–3723–275–8
Table 2. Asphalt properties [40].
Mixture
Type
Properties
Porosity,
%
Minimum VMA,
%
Remaining
Strength,
%
Filler/
Bitumen
Ratio
Tama15–2517801.5–1.8
Basalt6–7.514–14.5801.1–1.5
Zebra6–7.514–14.5801.1–1.5
Disclaimer/Publisher’s Note: The statements, opinions and data contained in all publications are solely those of the individual author(s) and contributor(s) and not of MDPI and/or the editor(s). MDPI and/or the editor(s) disclaim responsibility for any injury to people or property resulting from any ideas, methods, instructions or products referred to in the content.