
Study on Mechanical Response and Constitutive Model of Rubber Concrete under Impact Load and Water Content Coupling

Abstract
:1. Introduction
2. Experimental Design
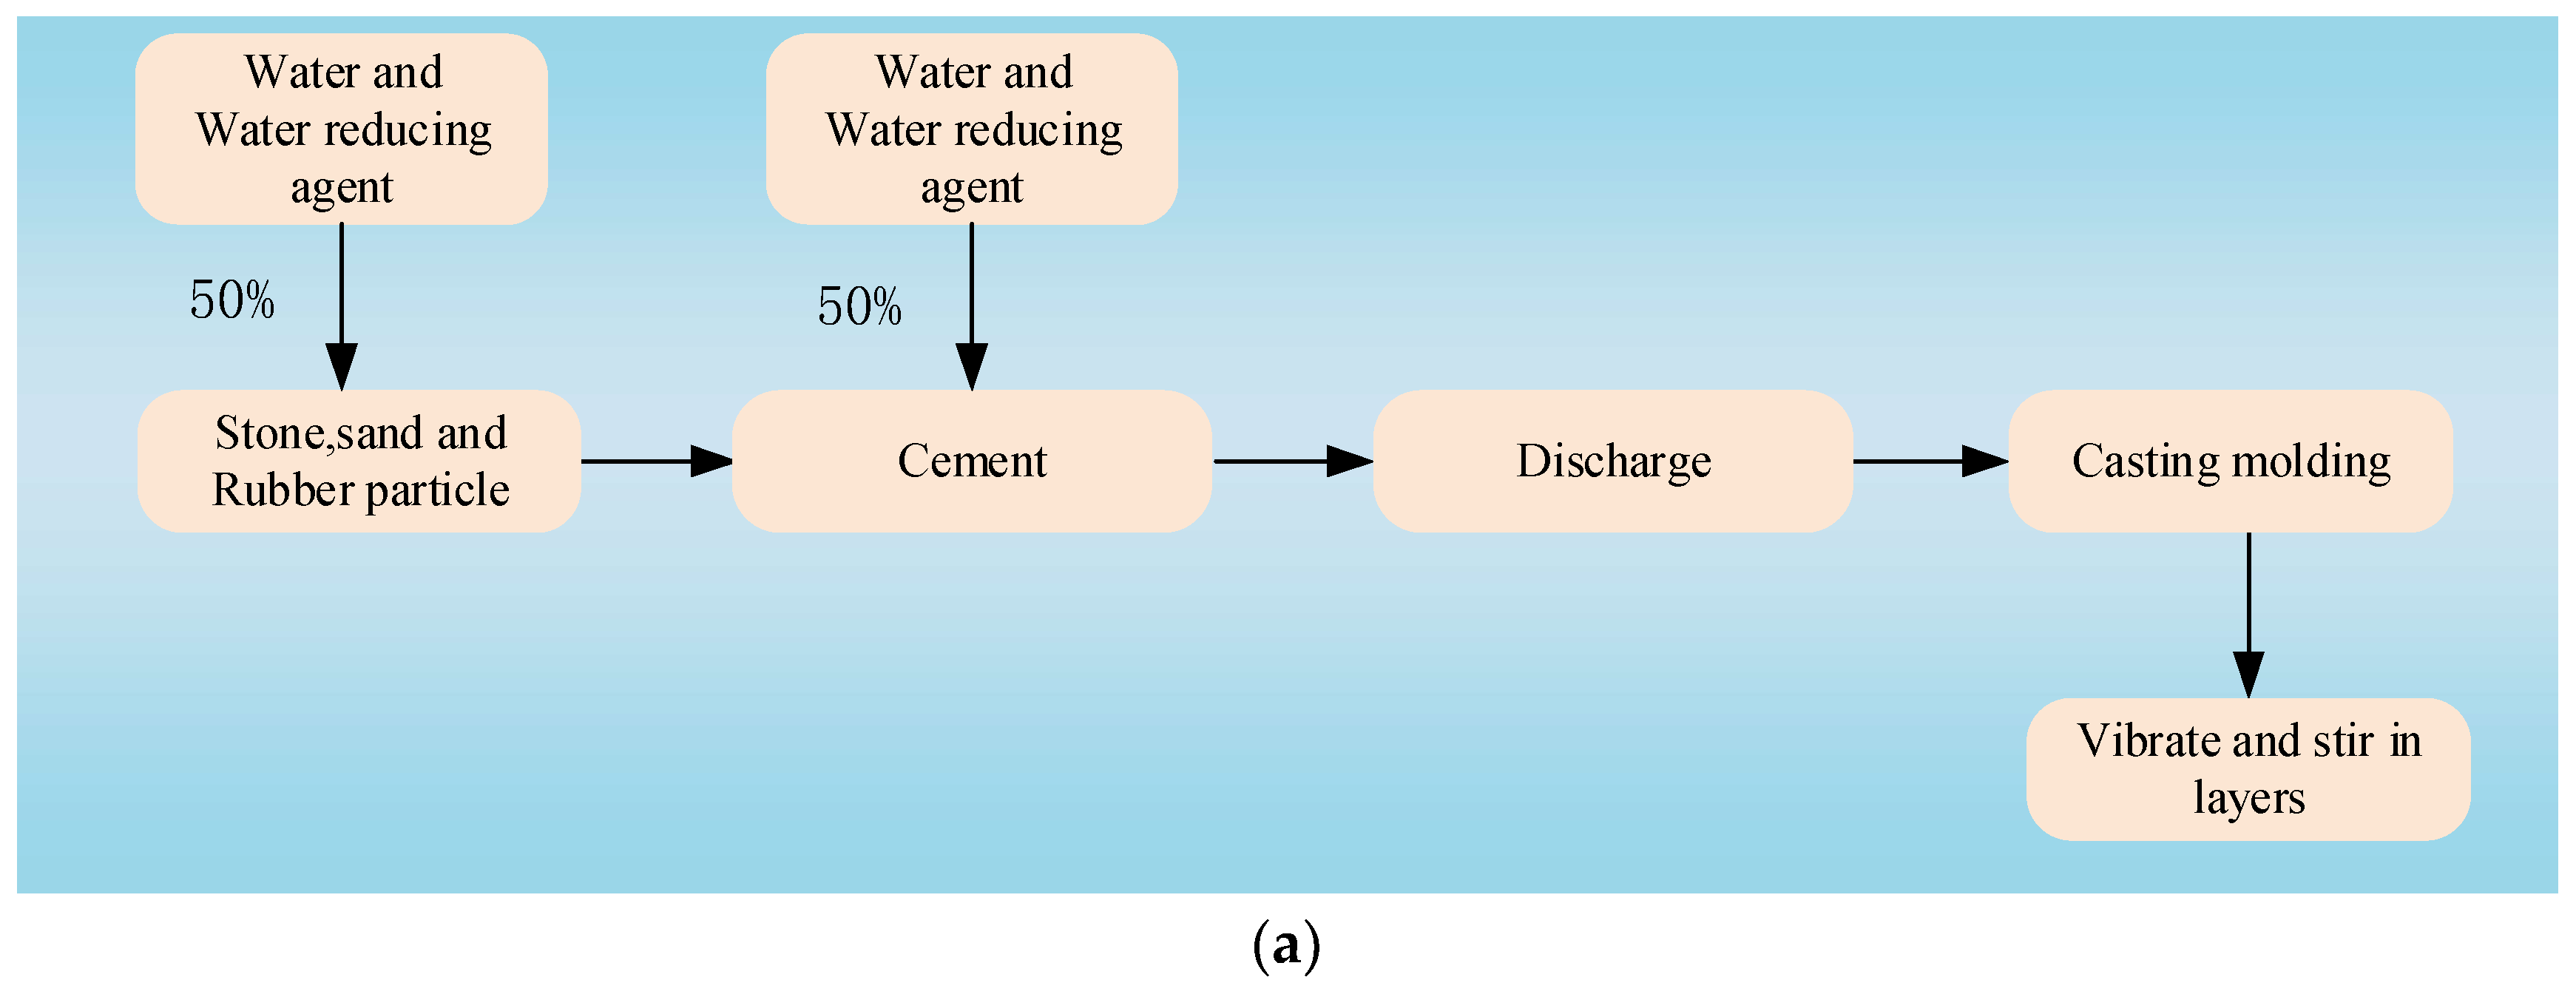
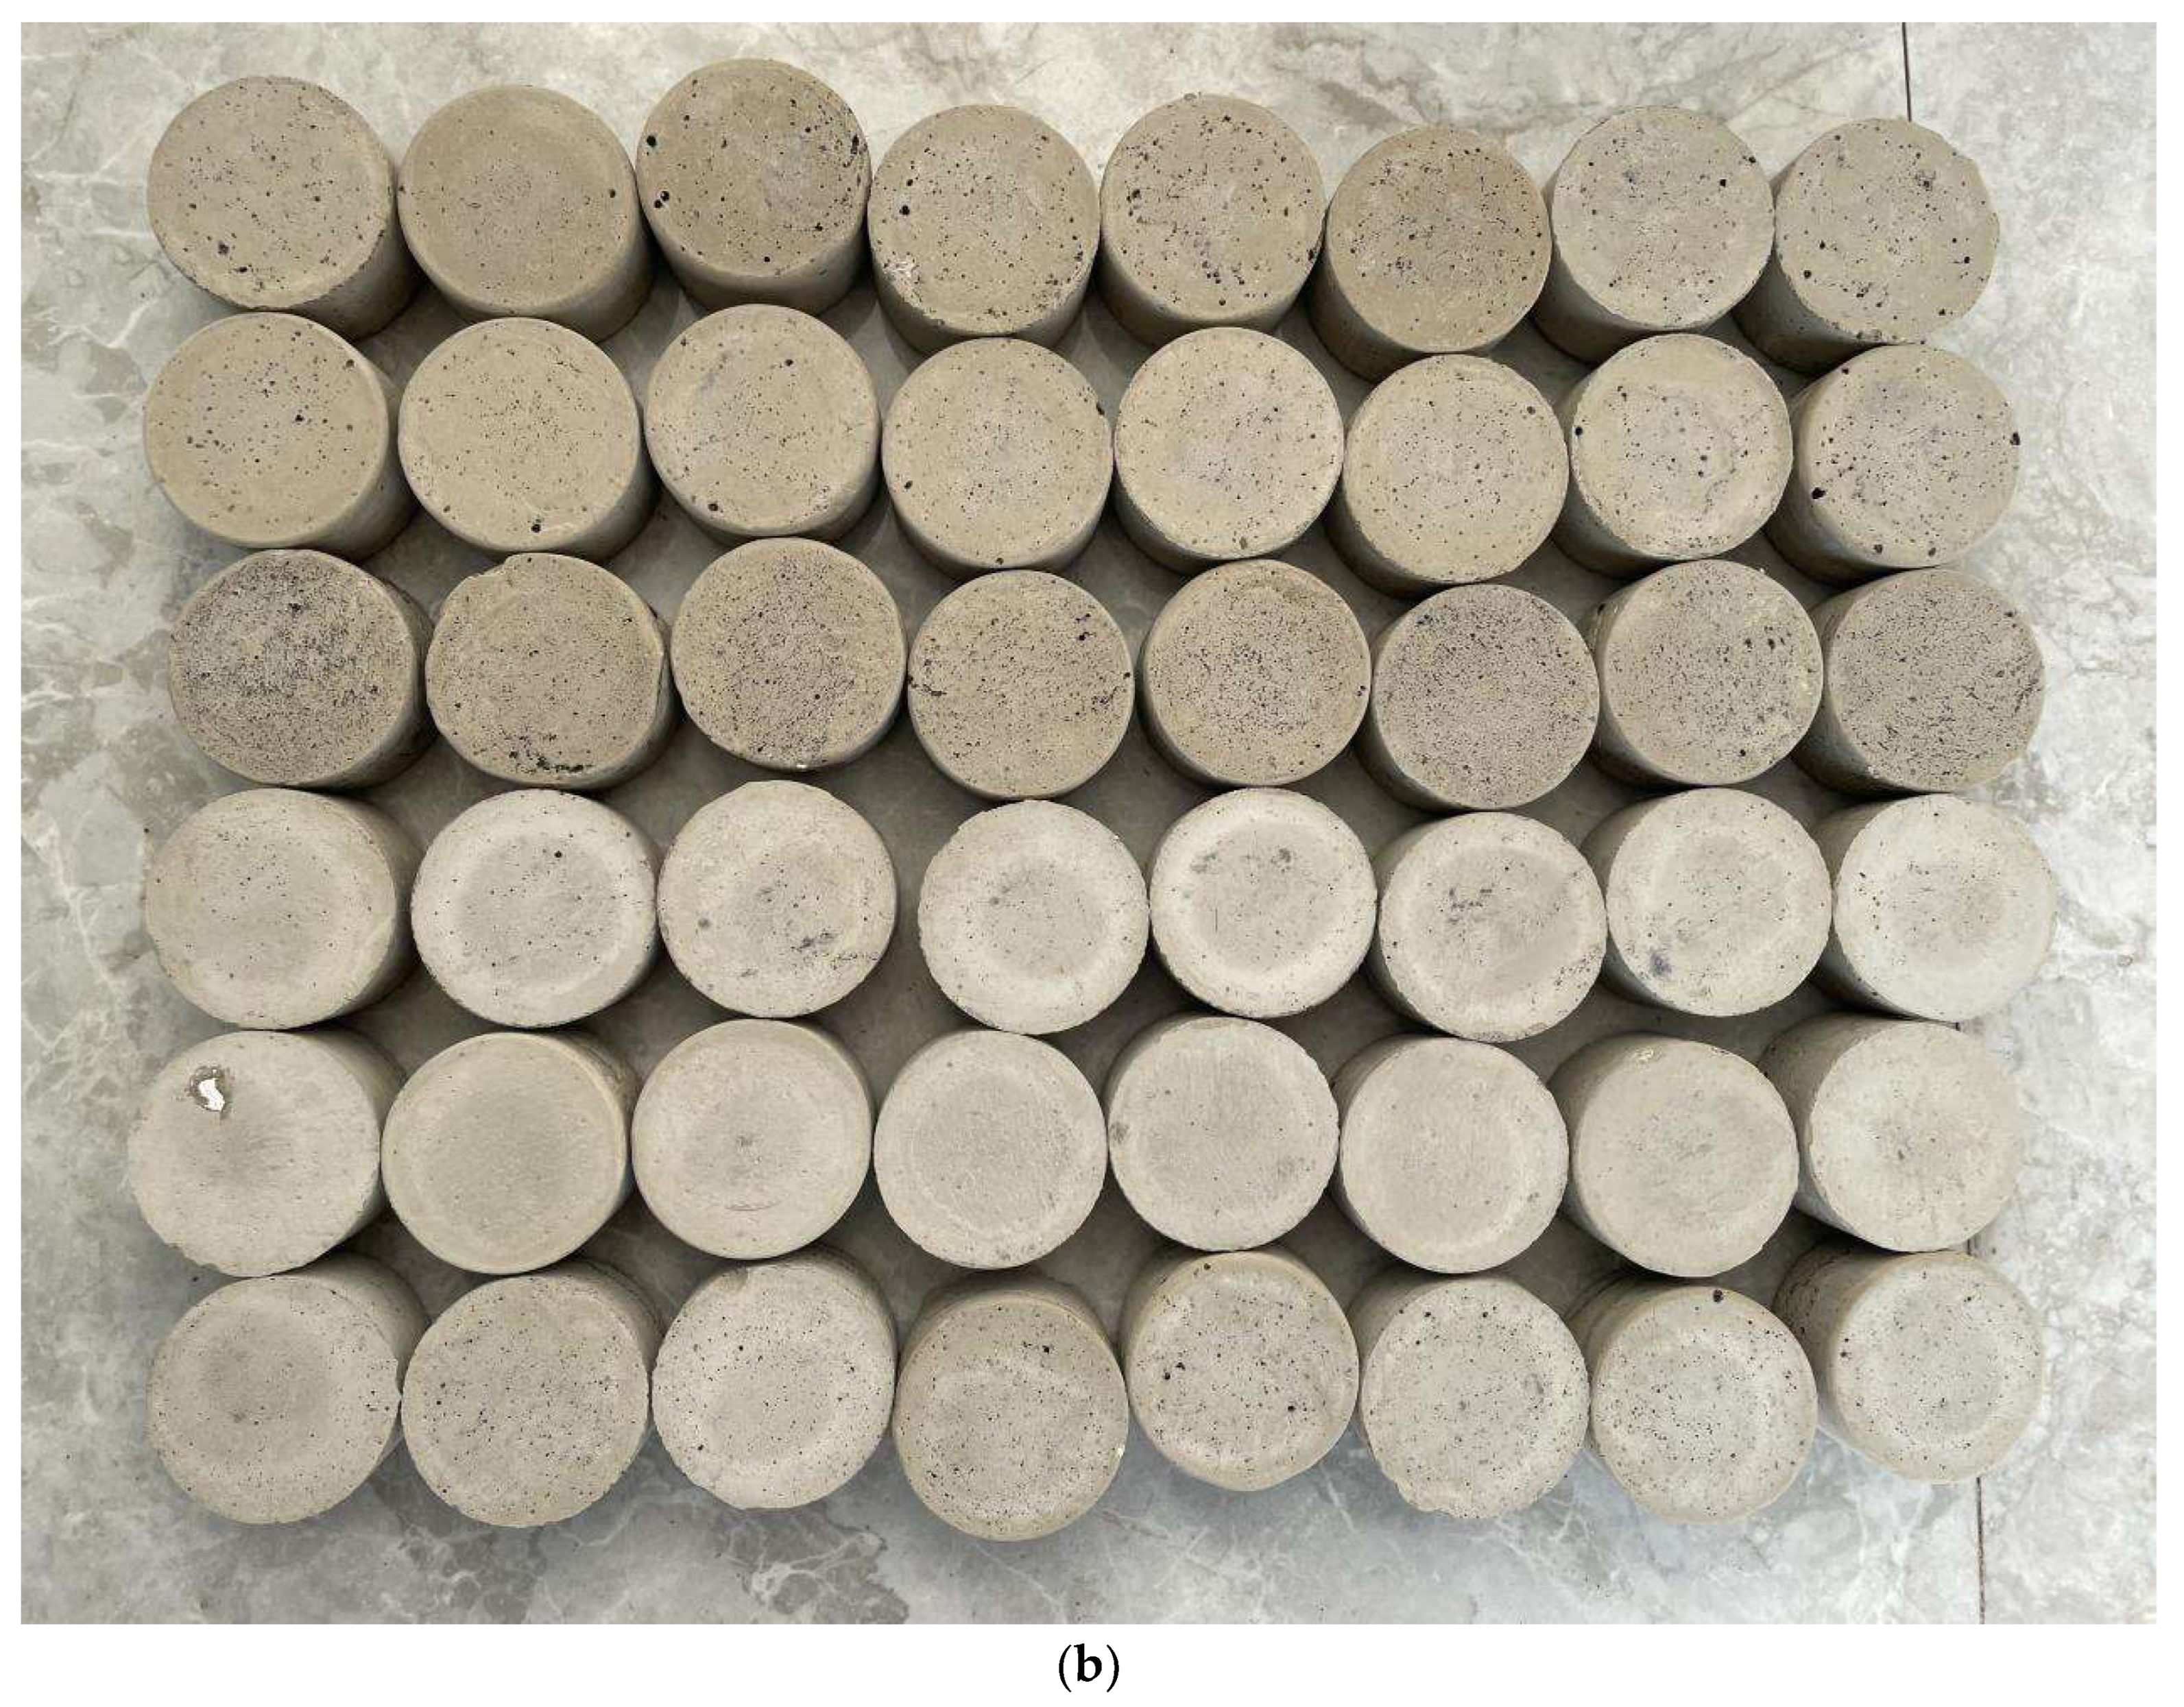
2.1. Materials
2.2. Test Scheme
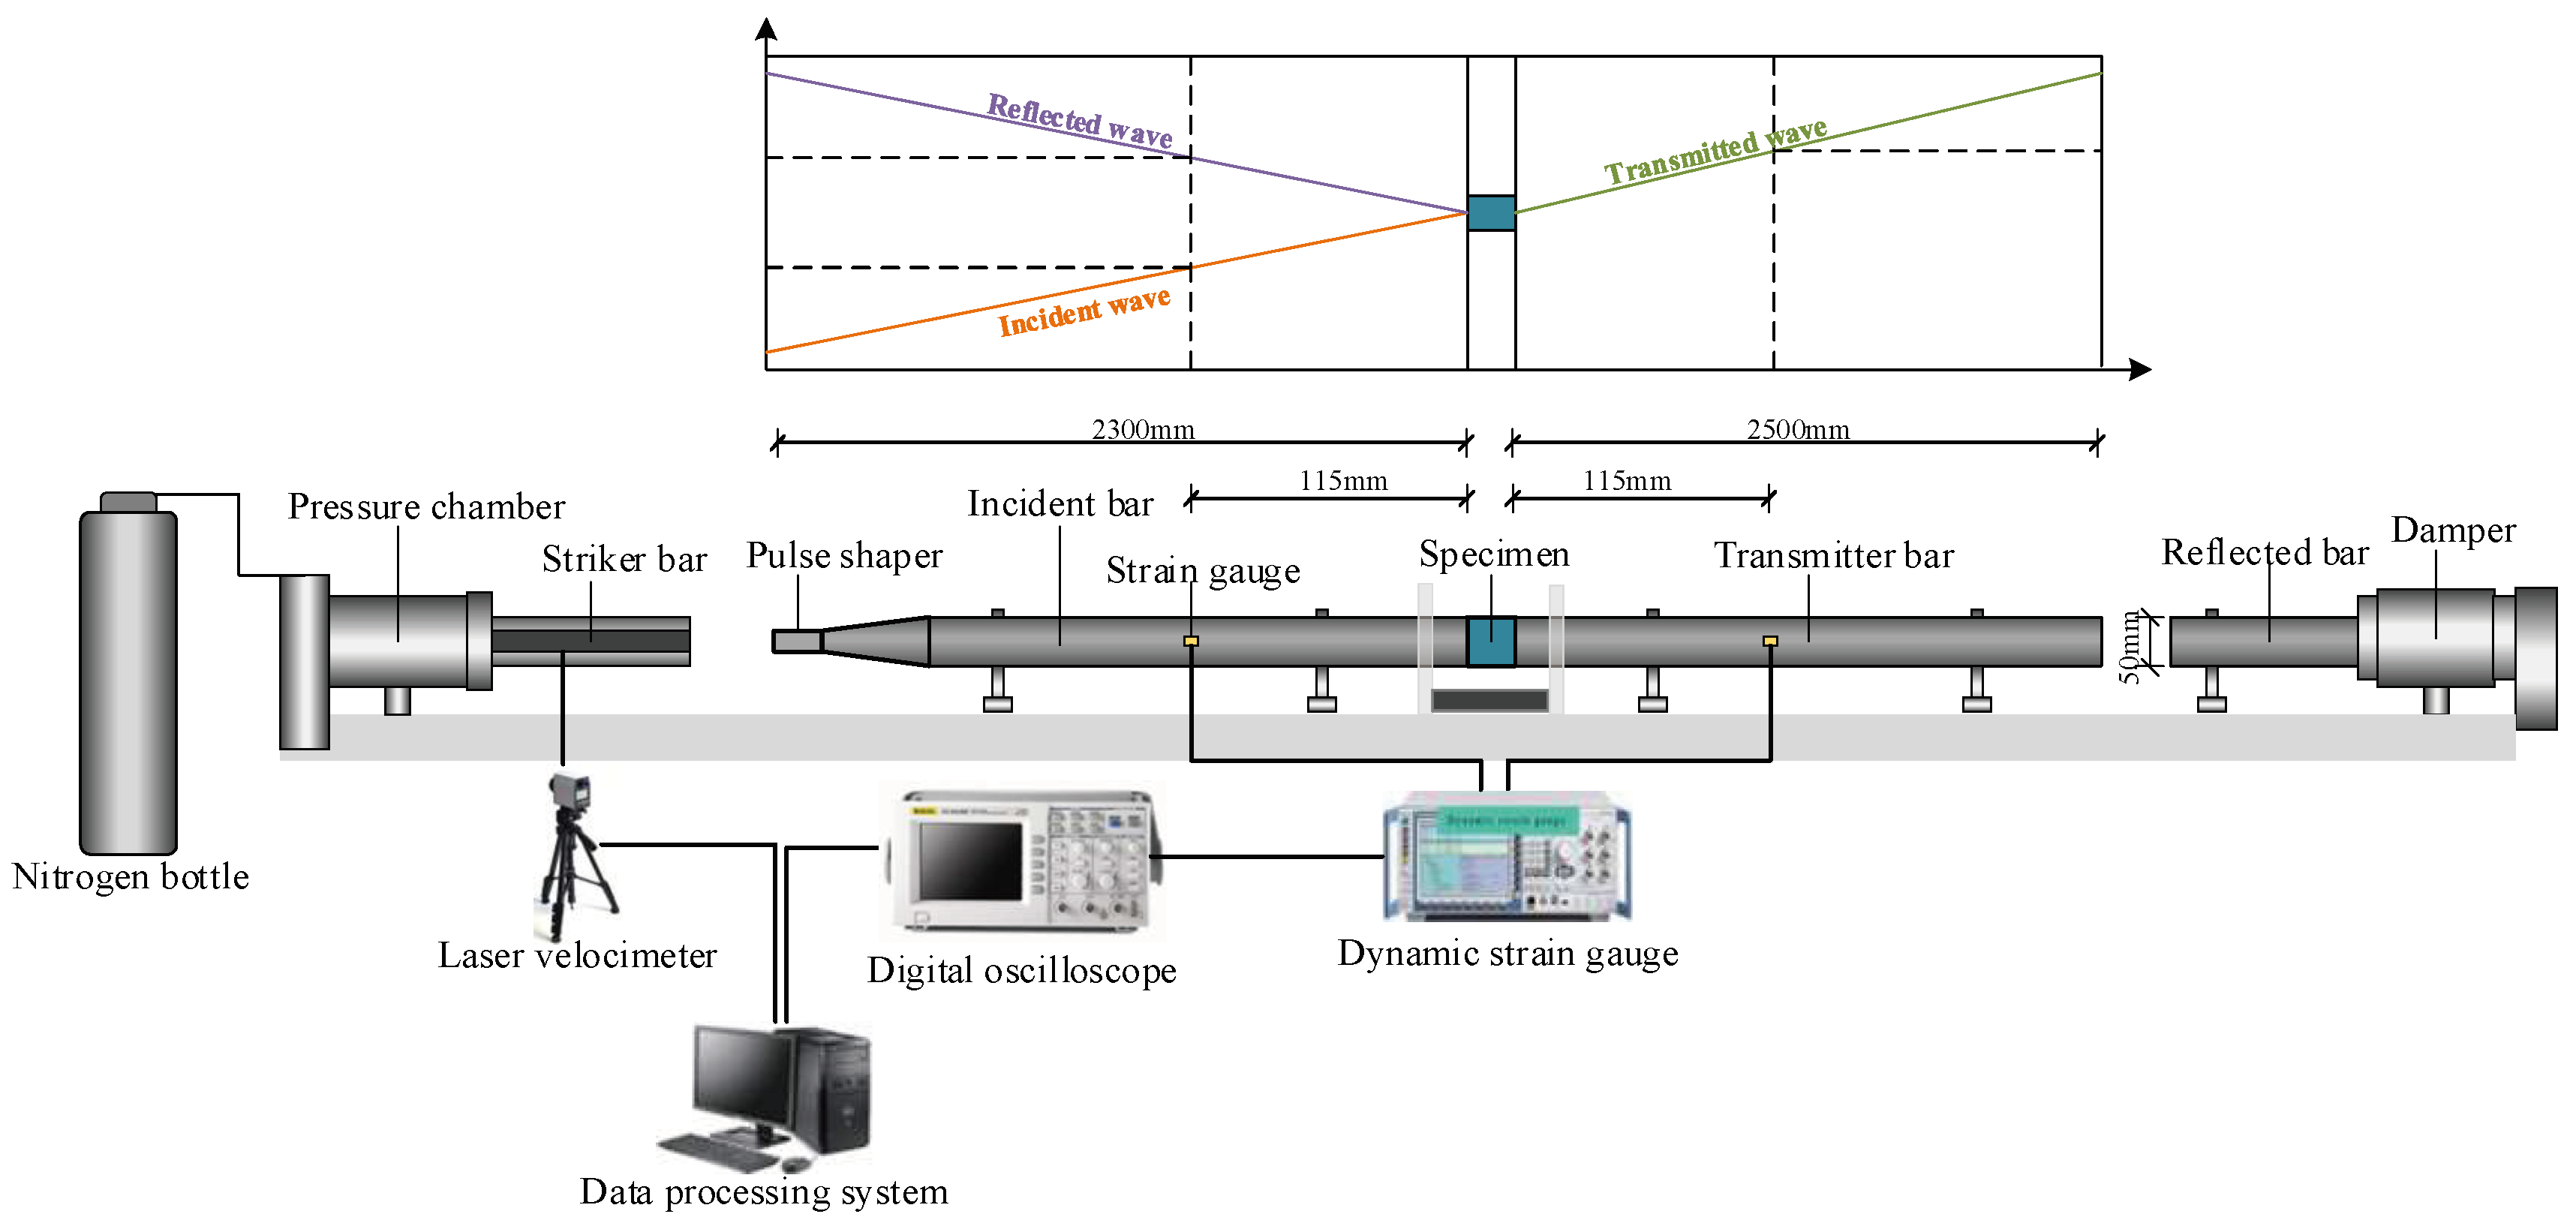
2.3. Strain Rate Measurement and Data Processing
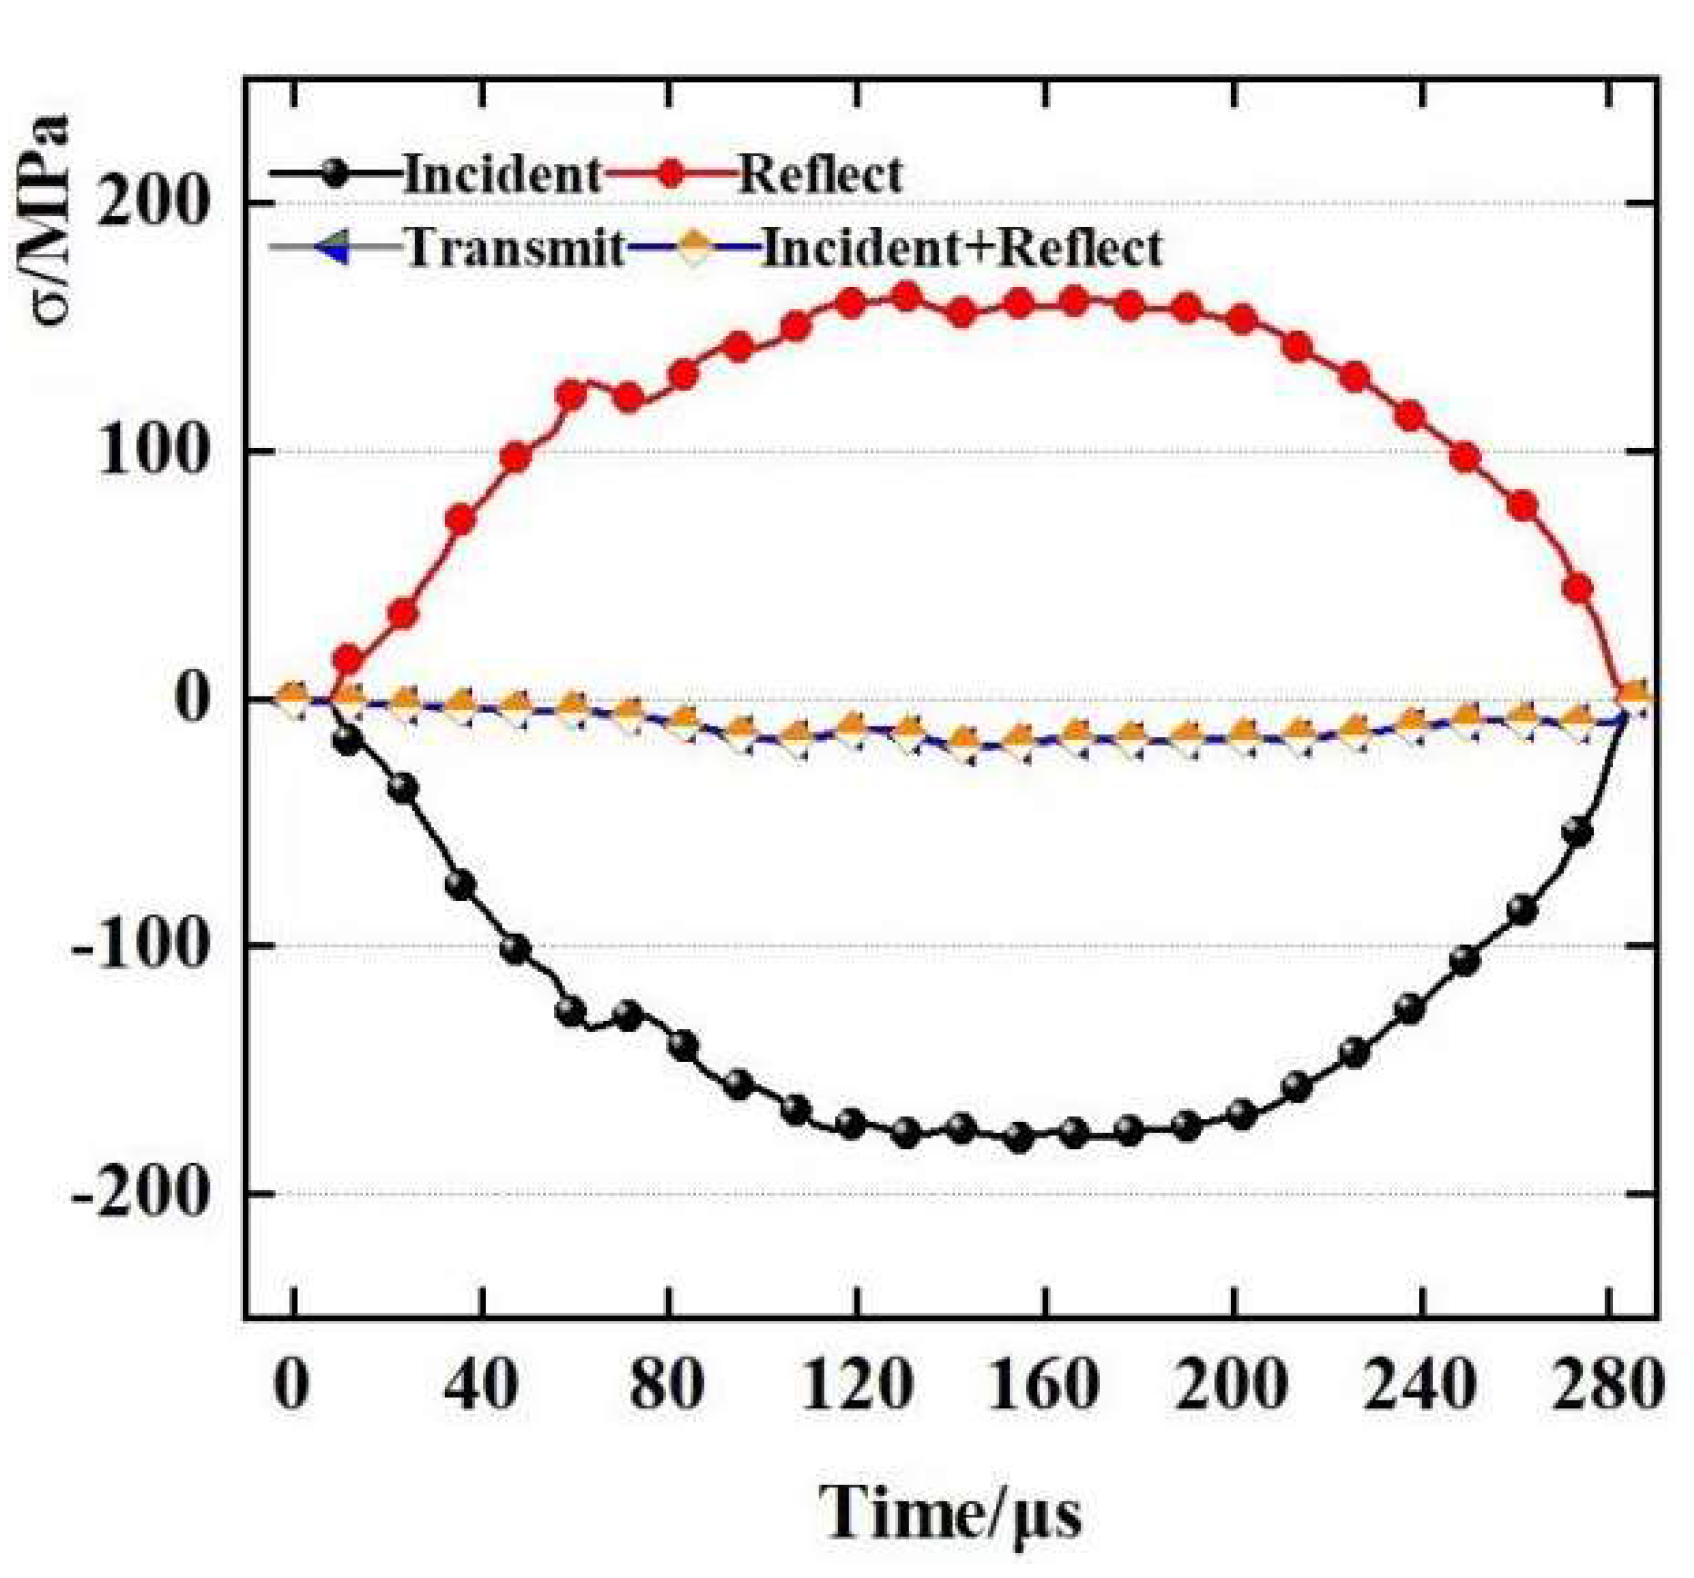
2.4. Dynamic Stress Balance
3. Experimental Results and Analysis
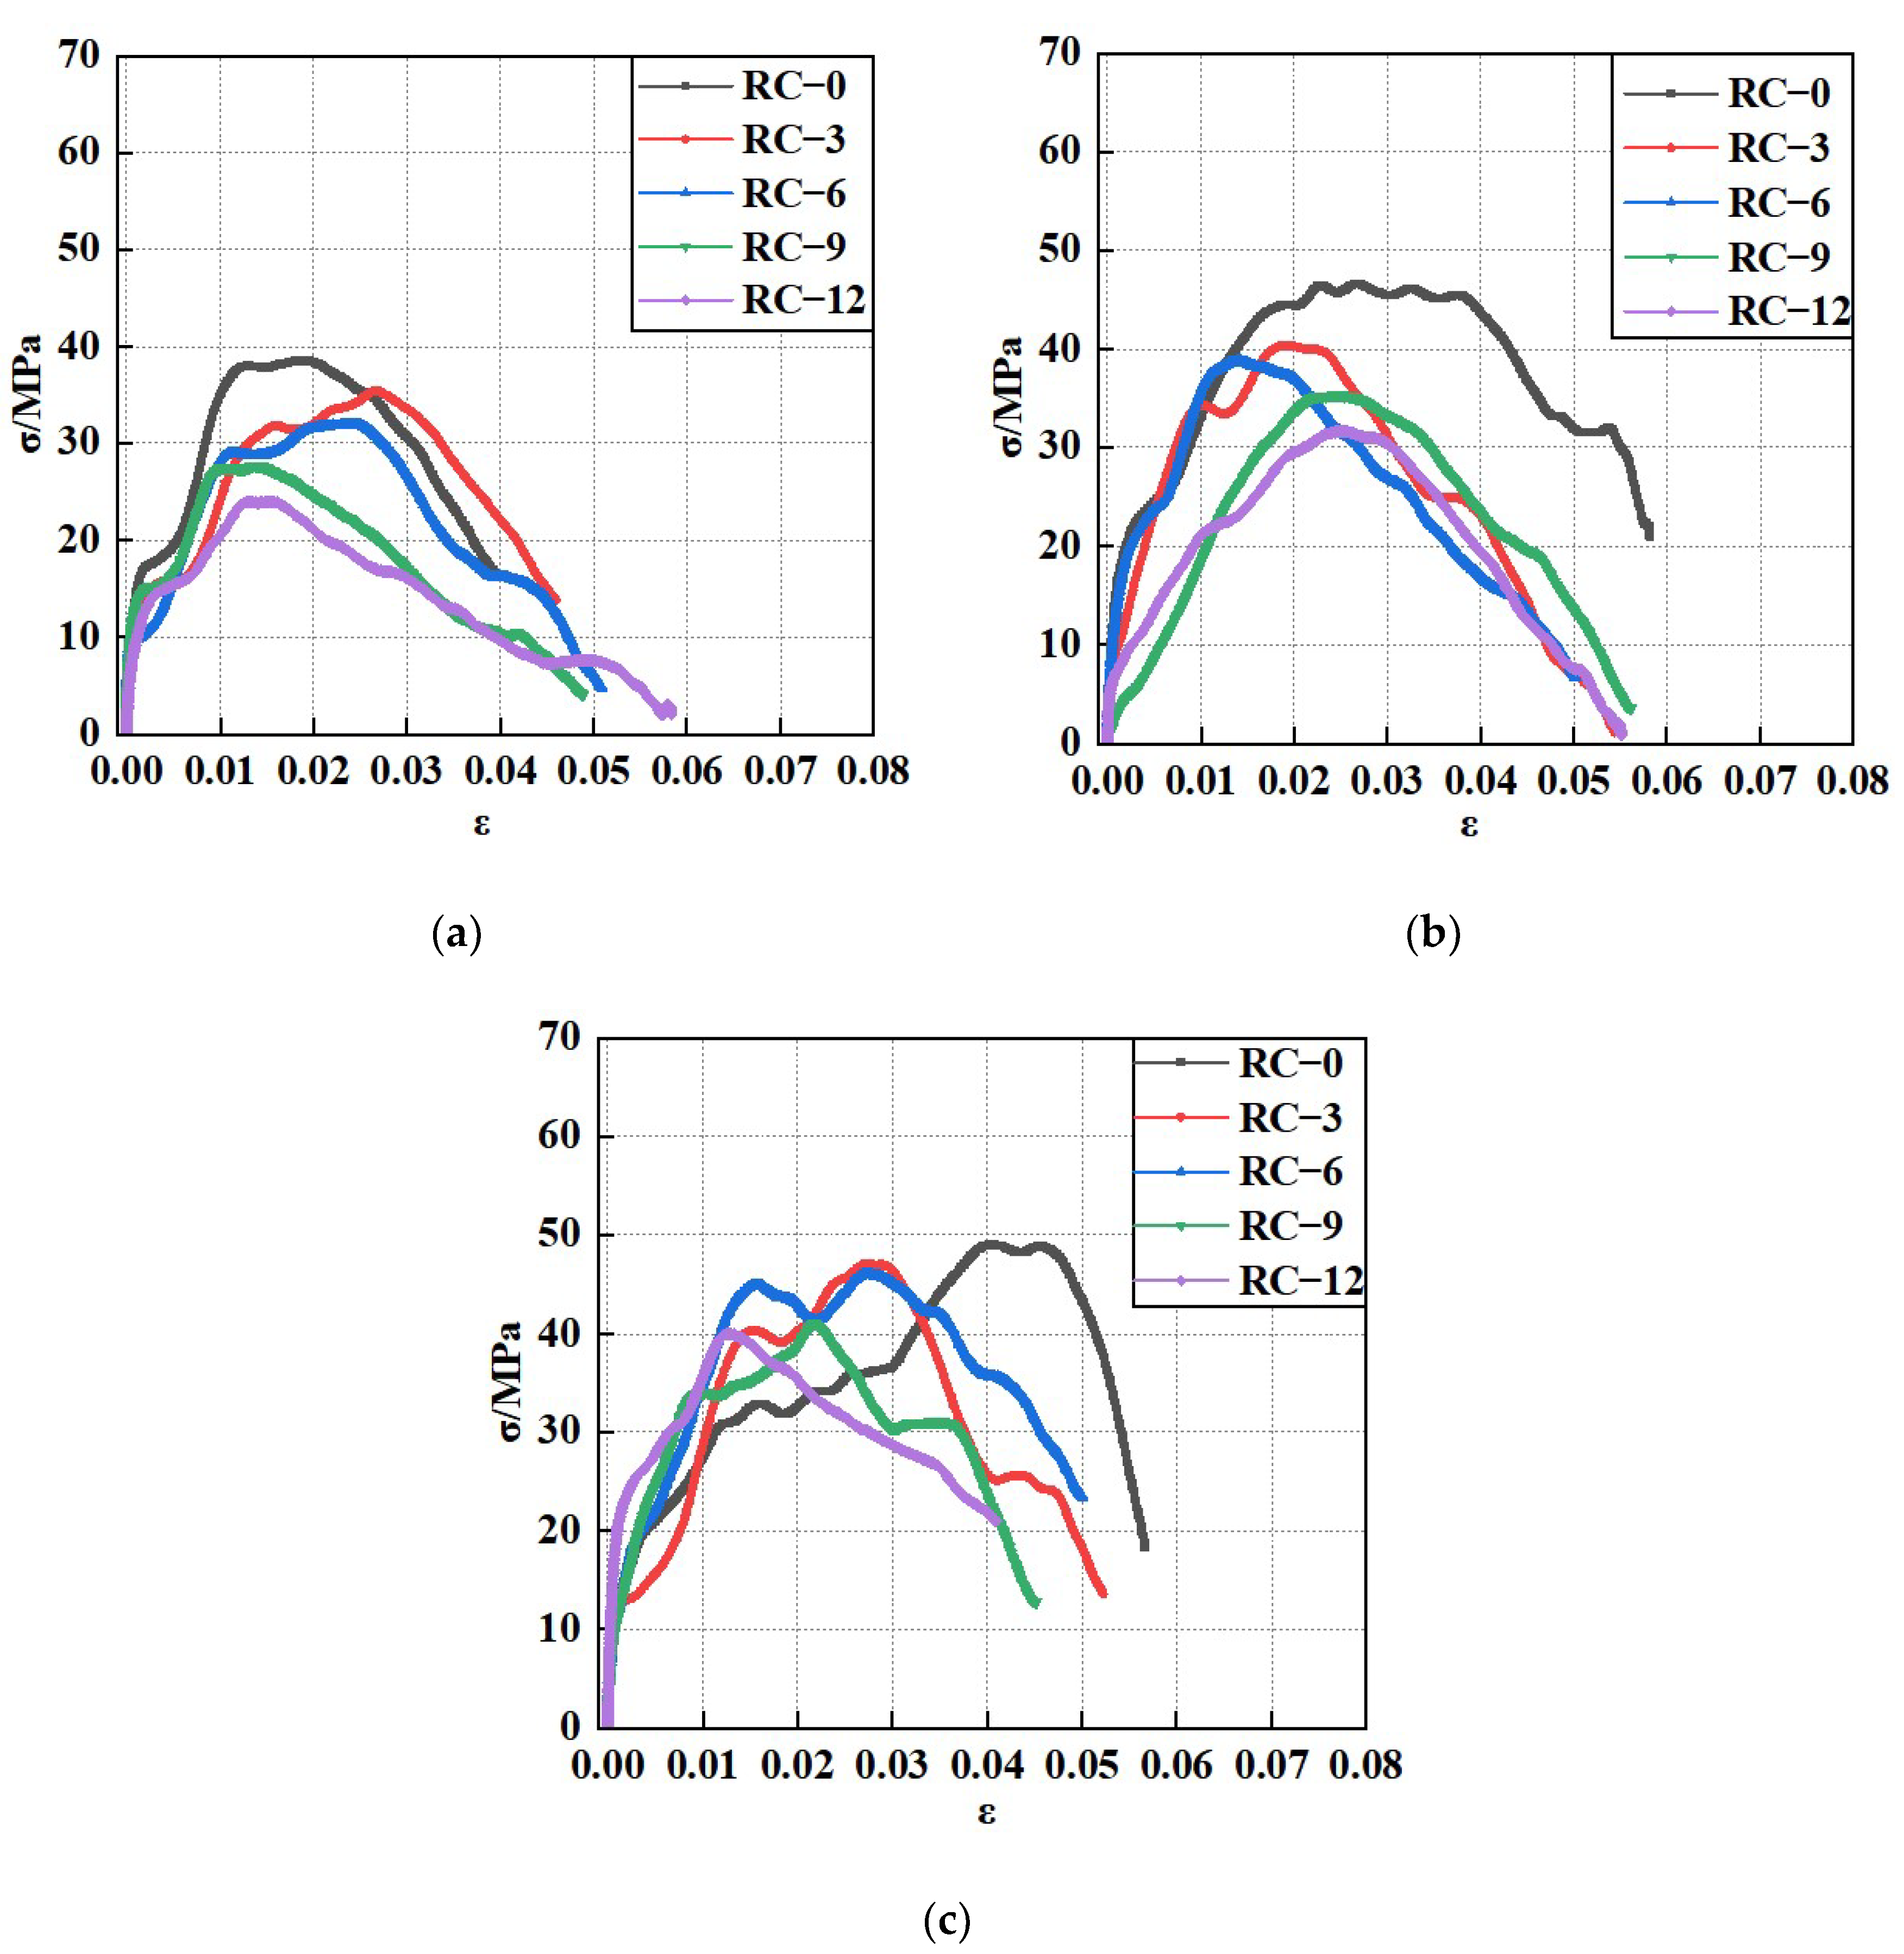
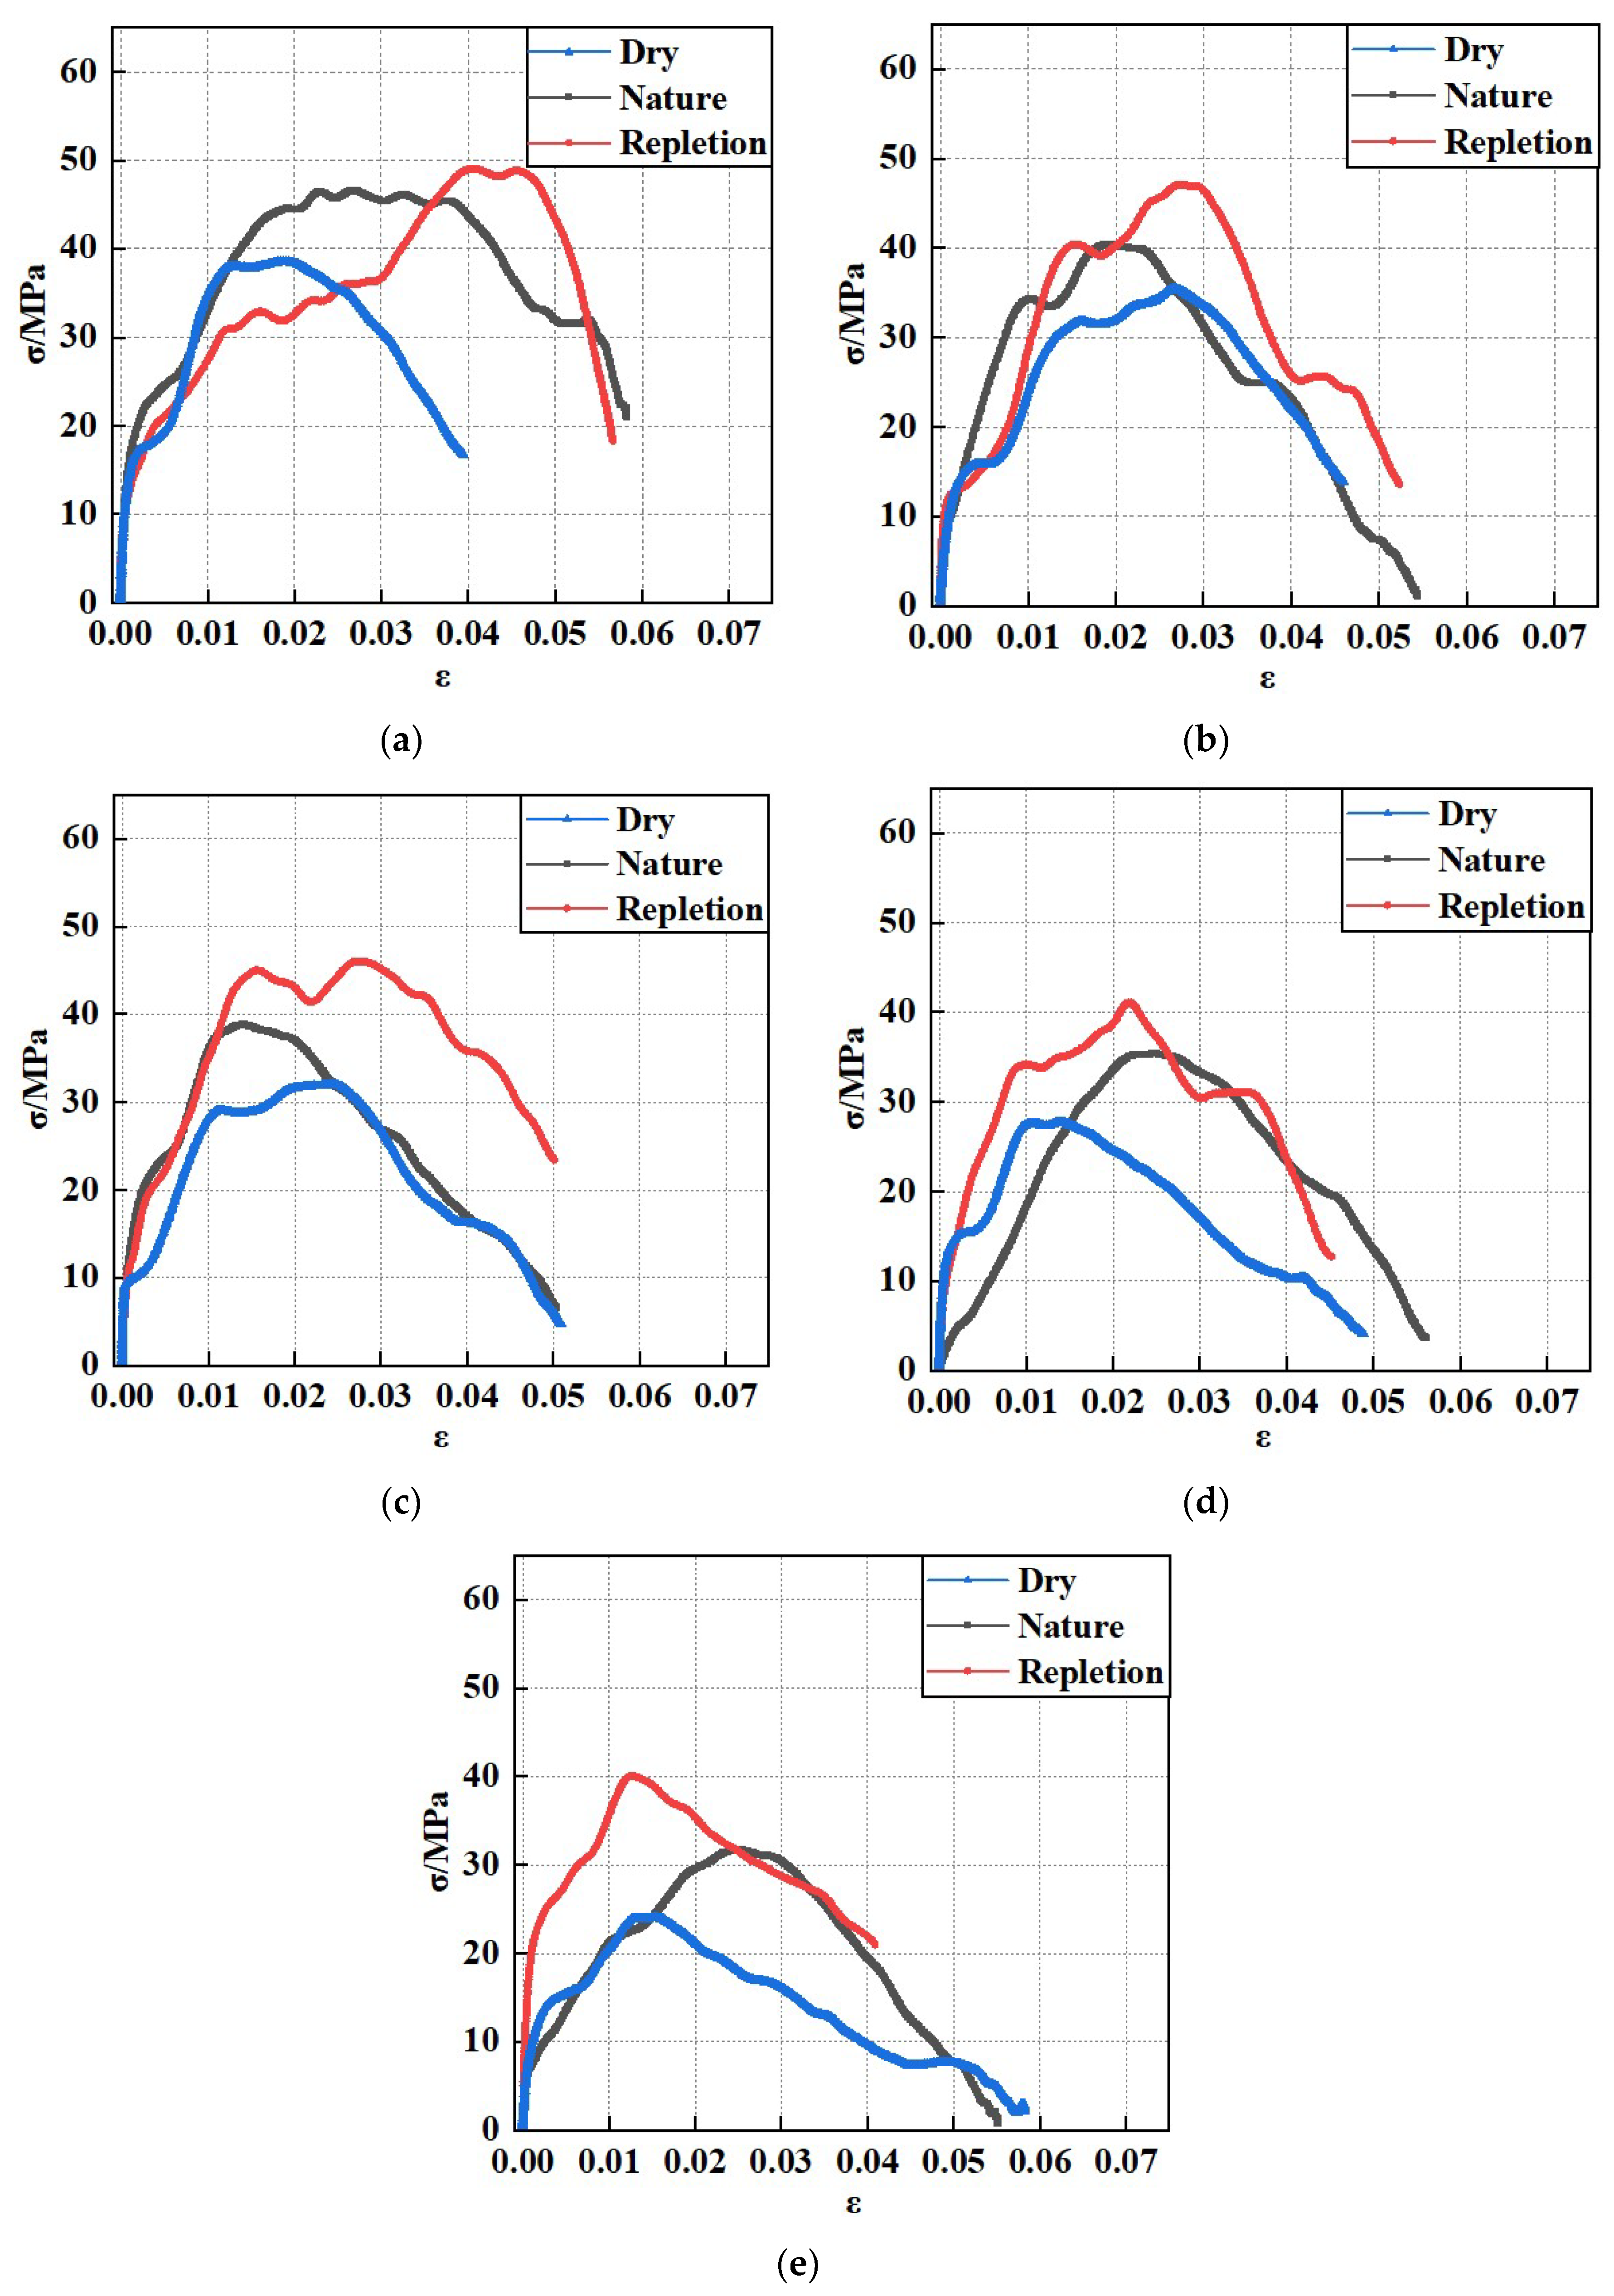
3.1. Stress–Strain Curve
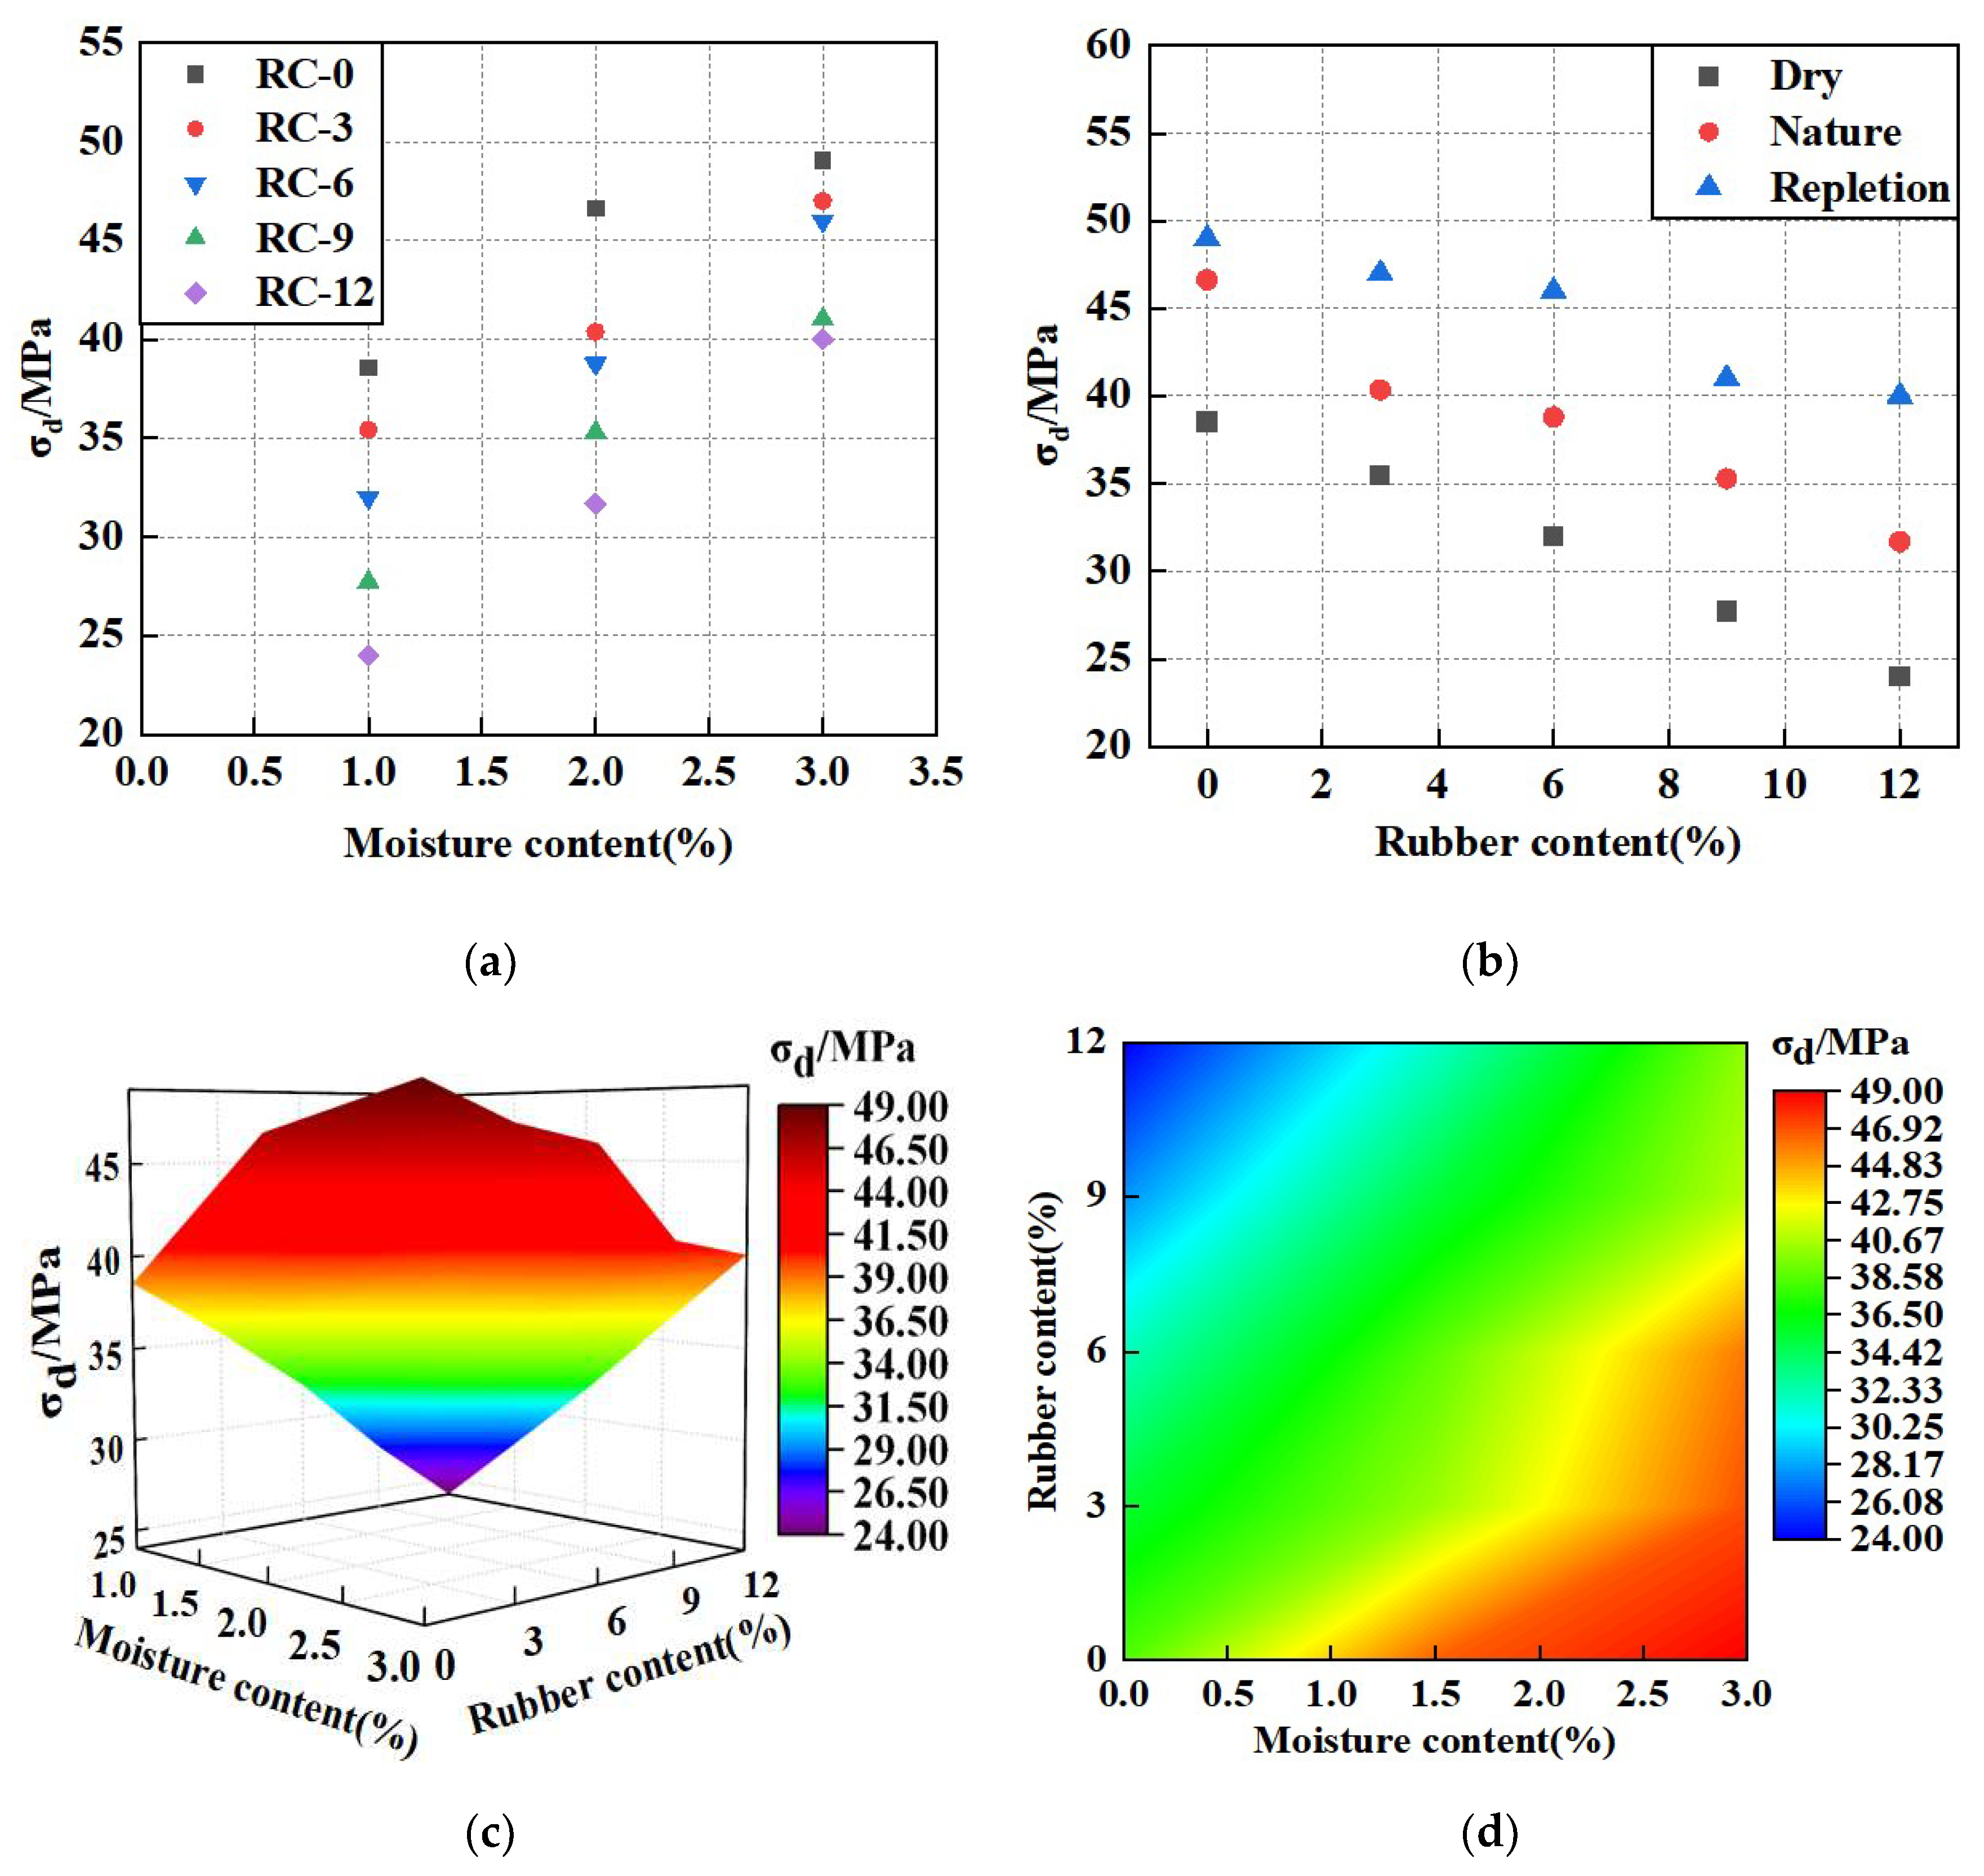
3.2. Peak Stress
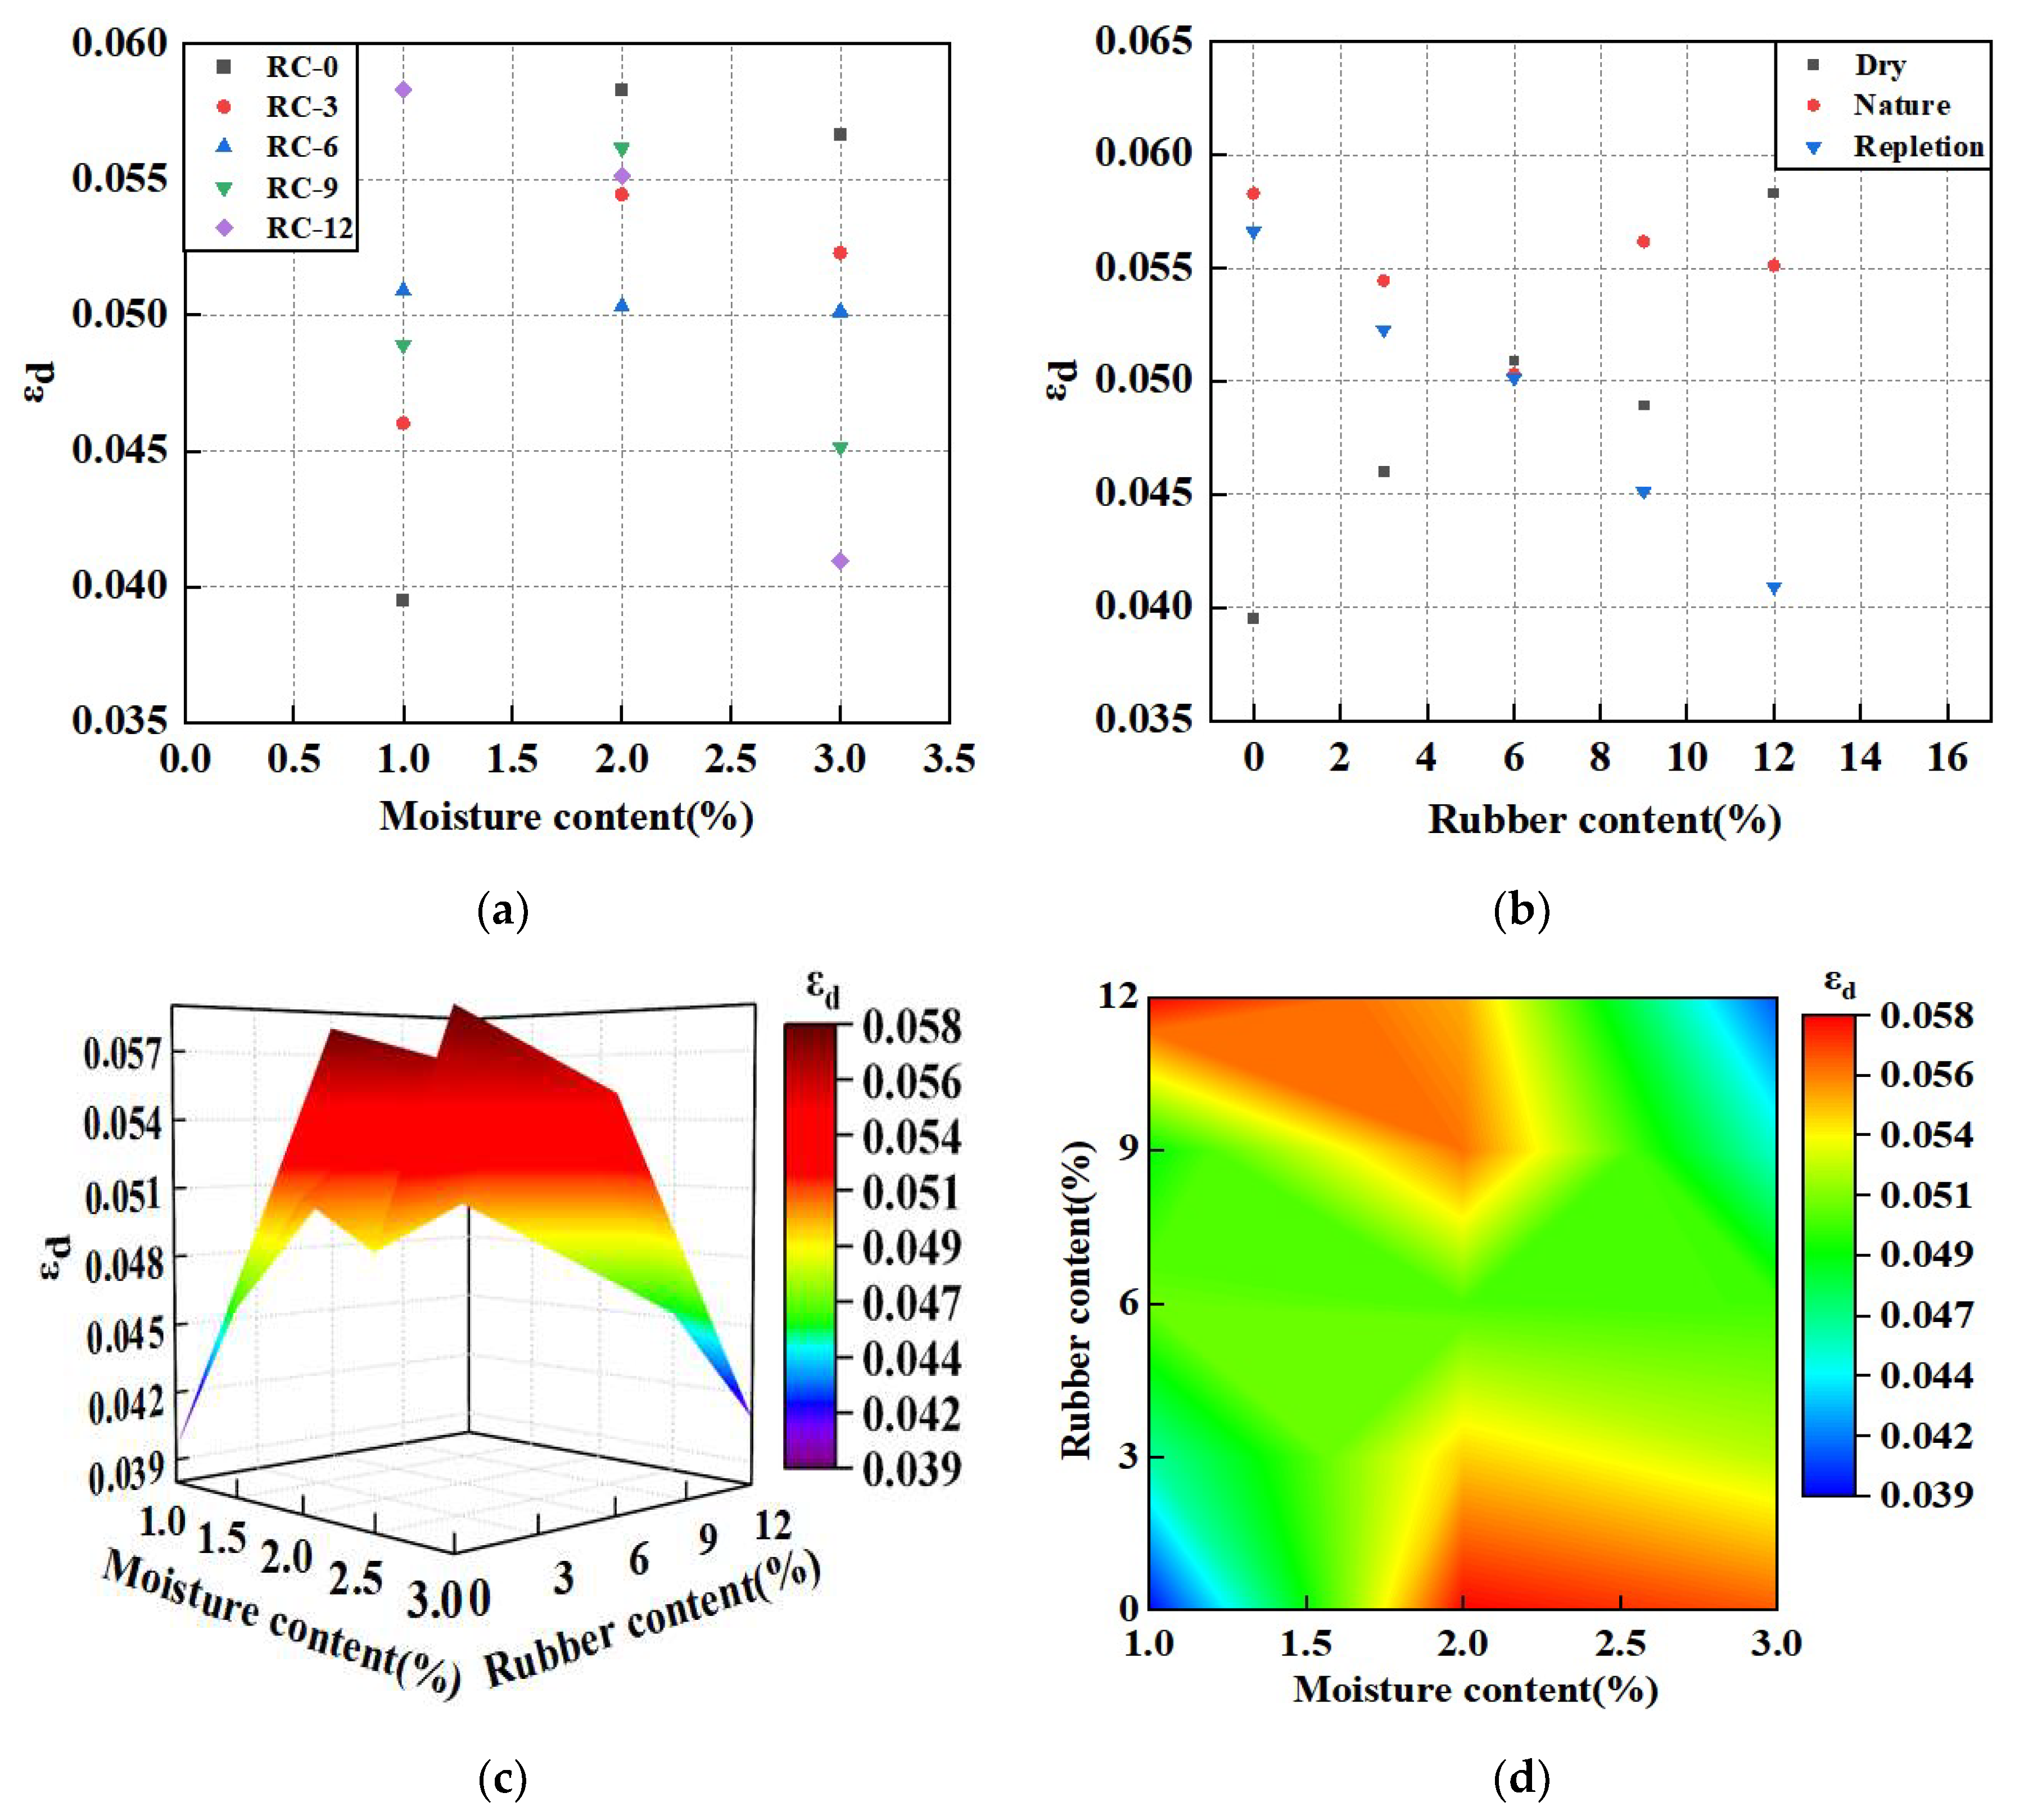
3.3. Peak Strain
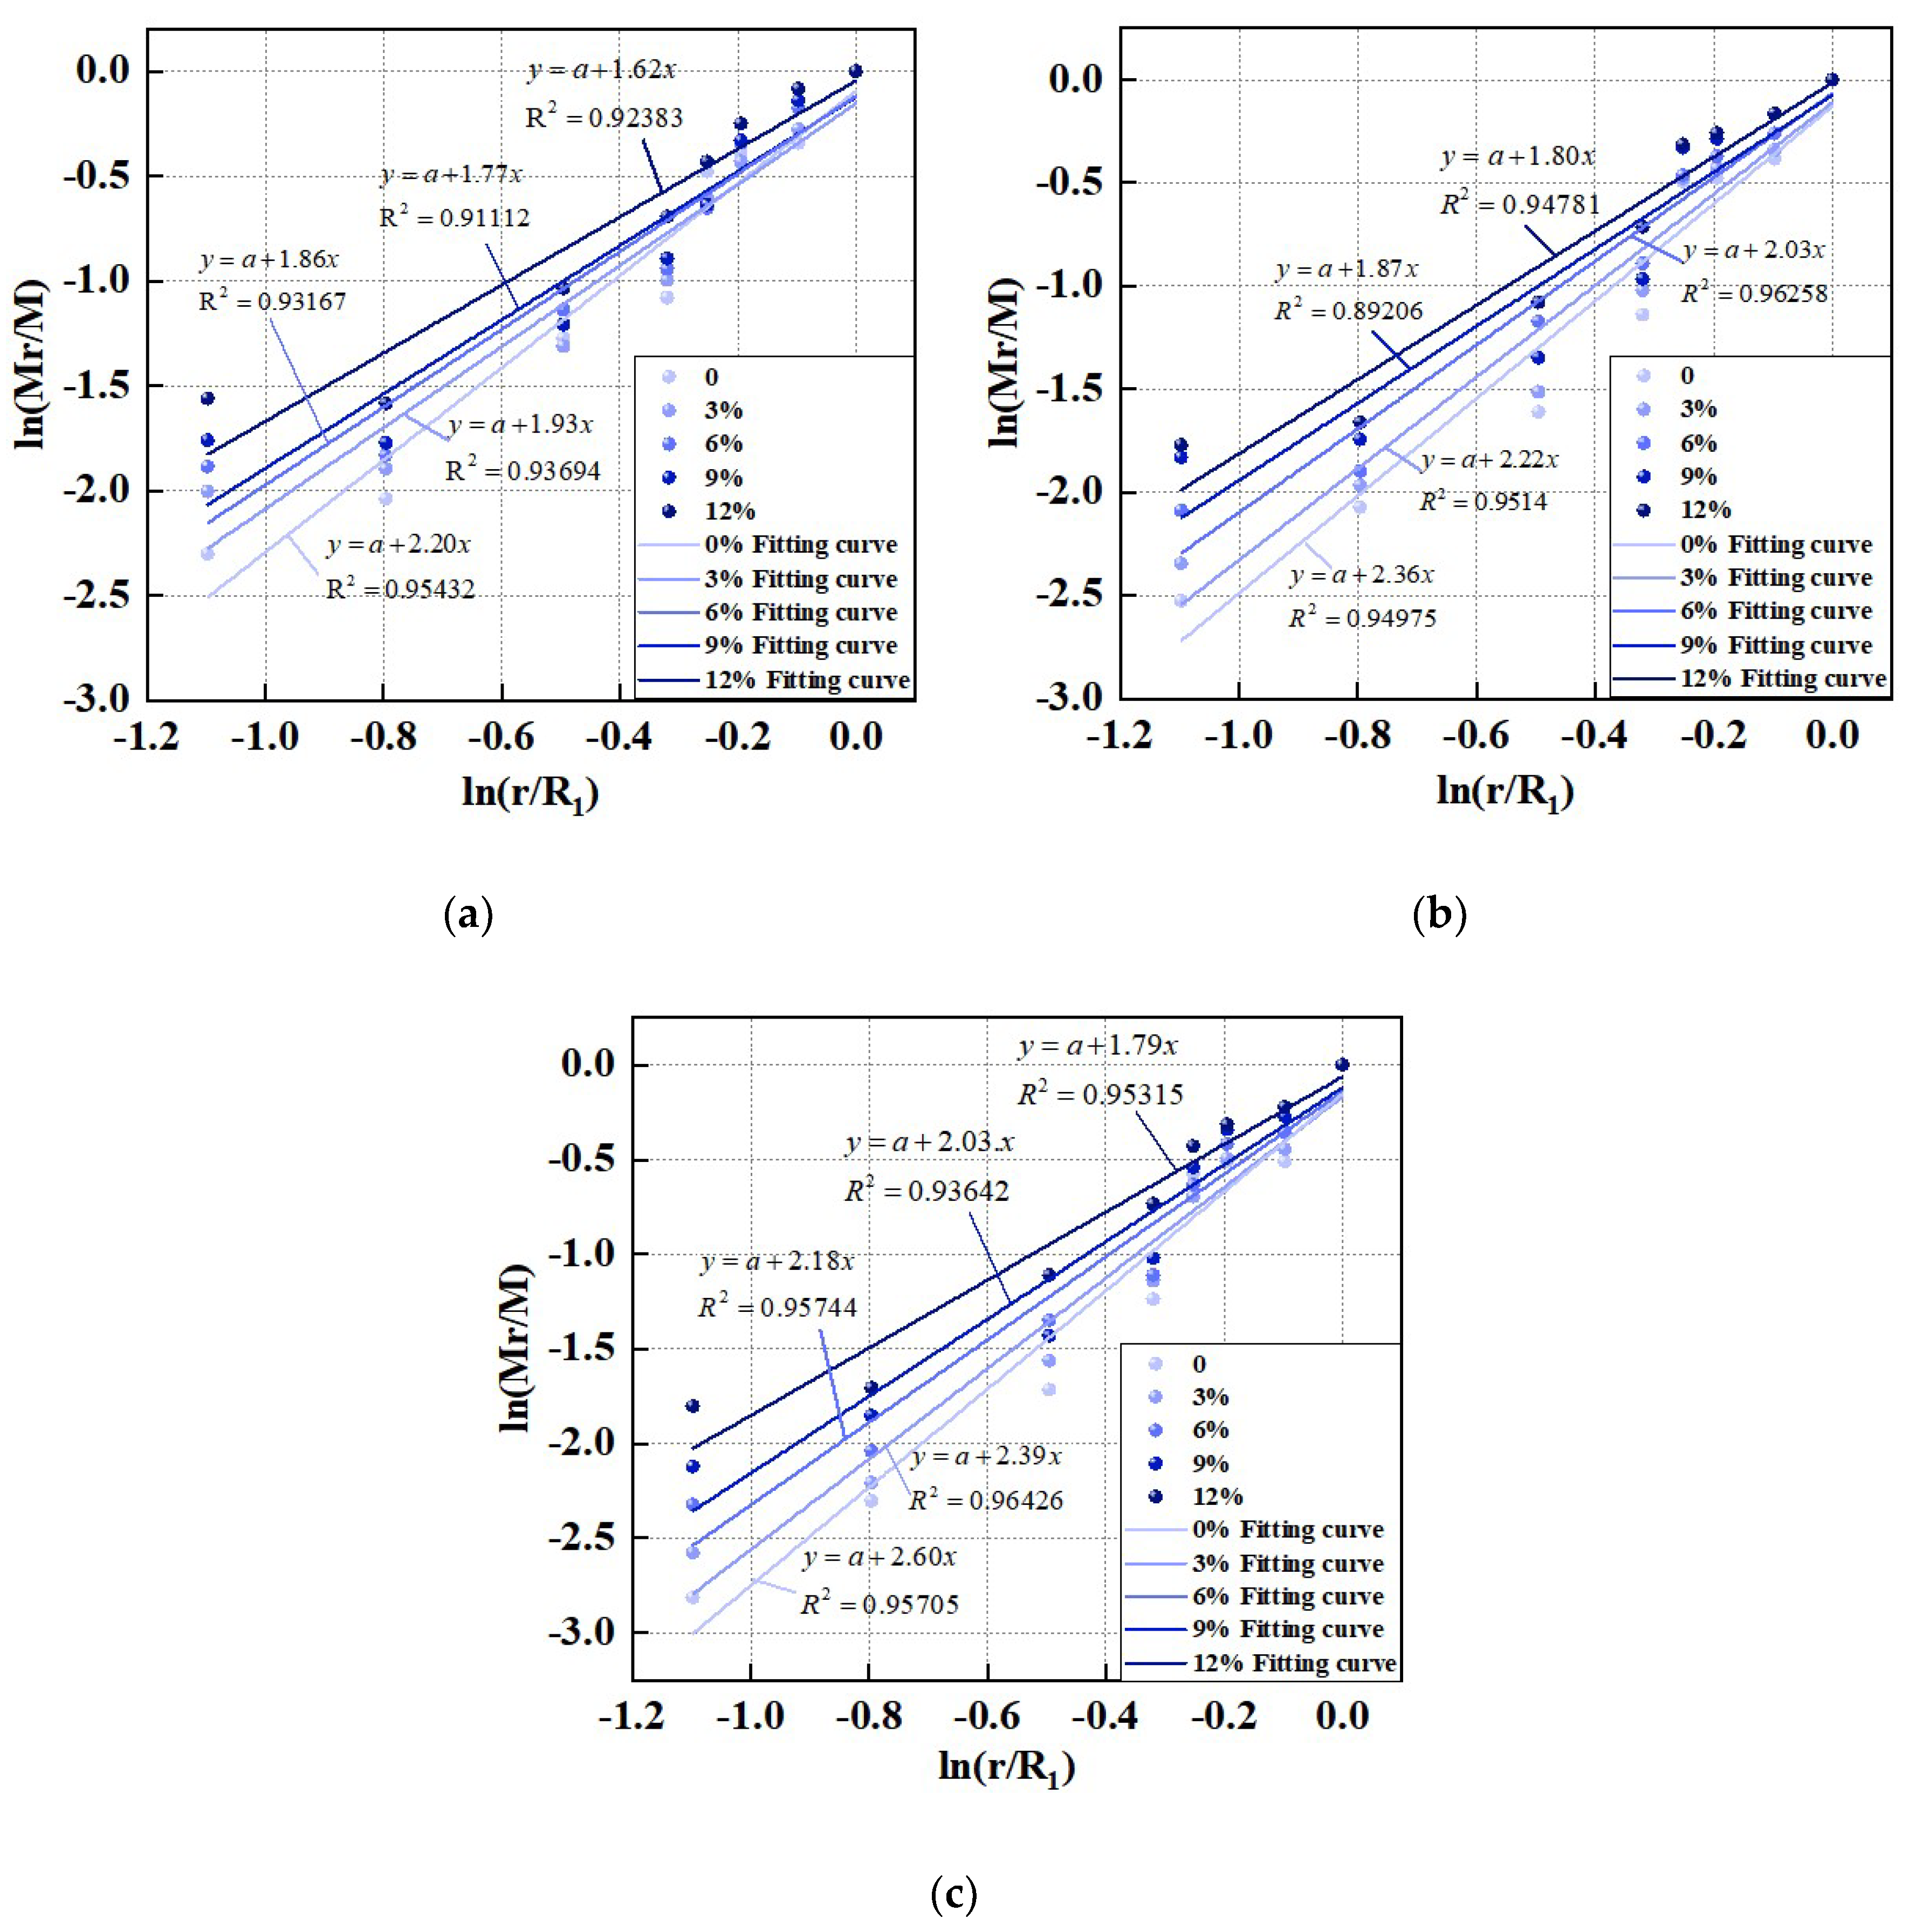
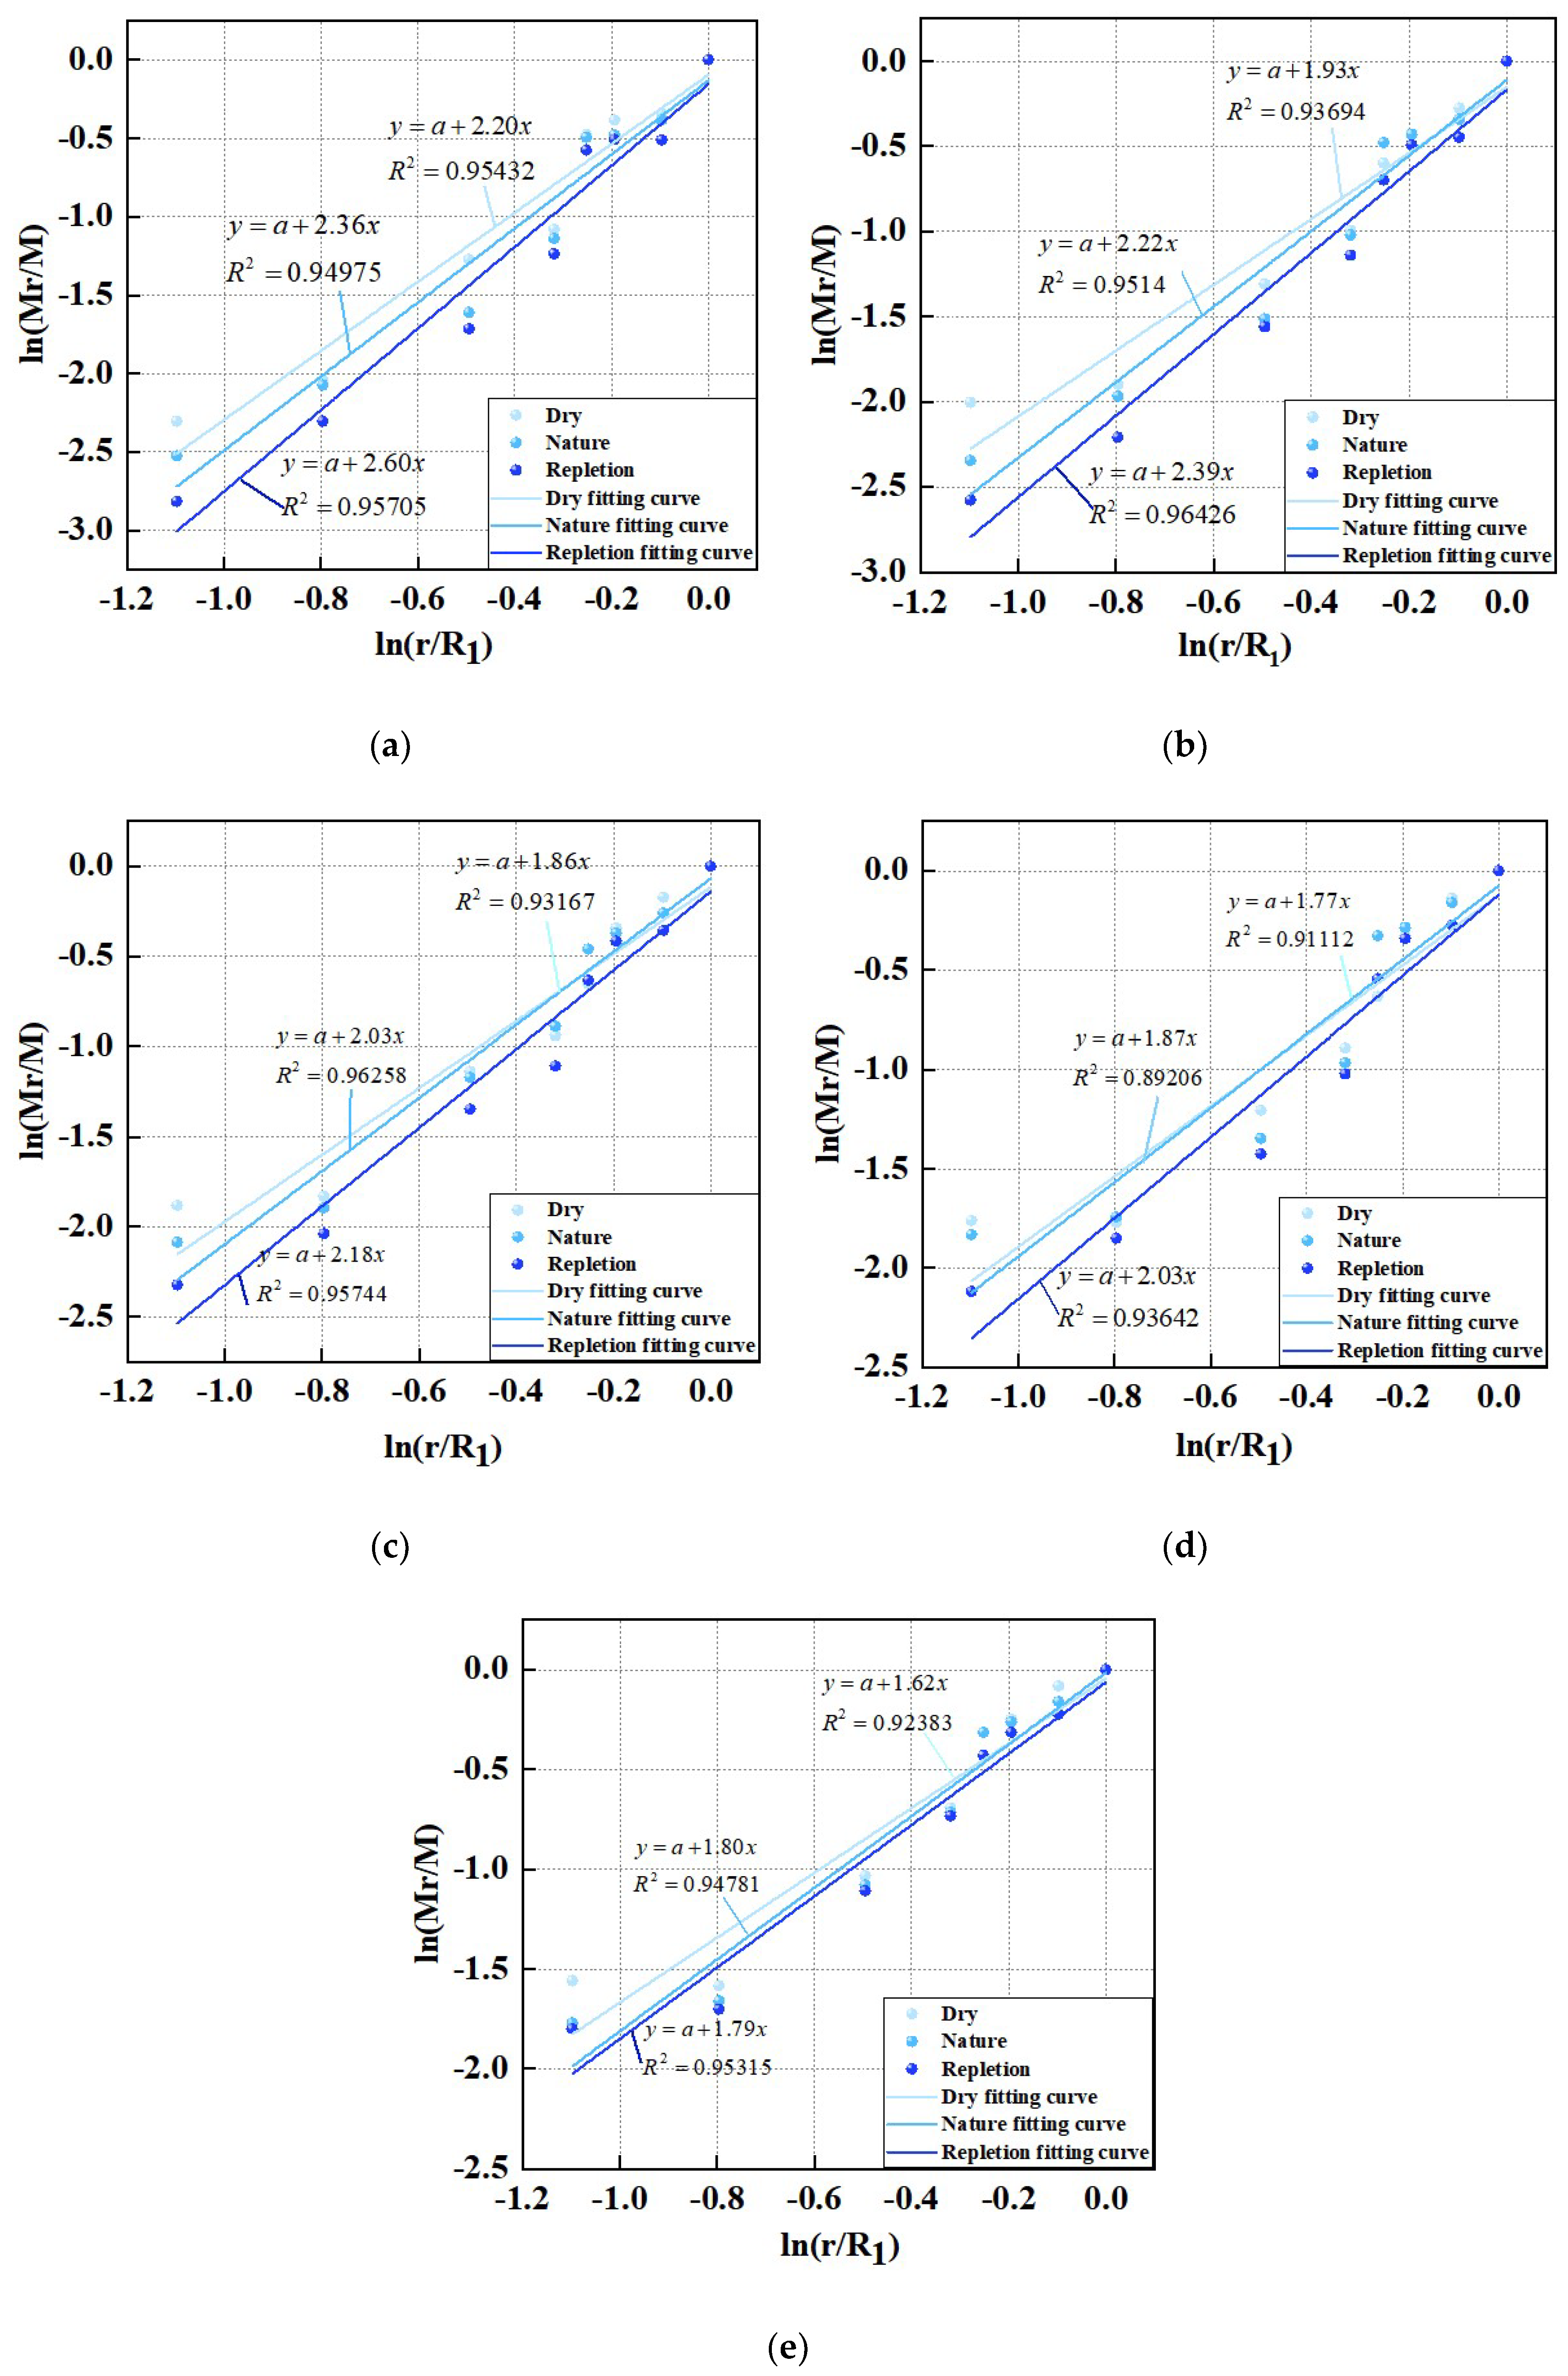
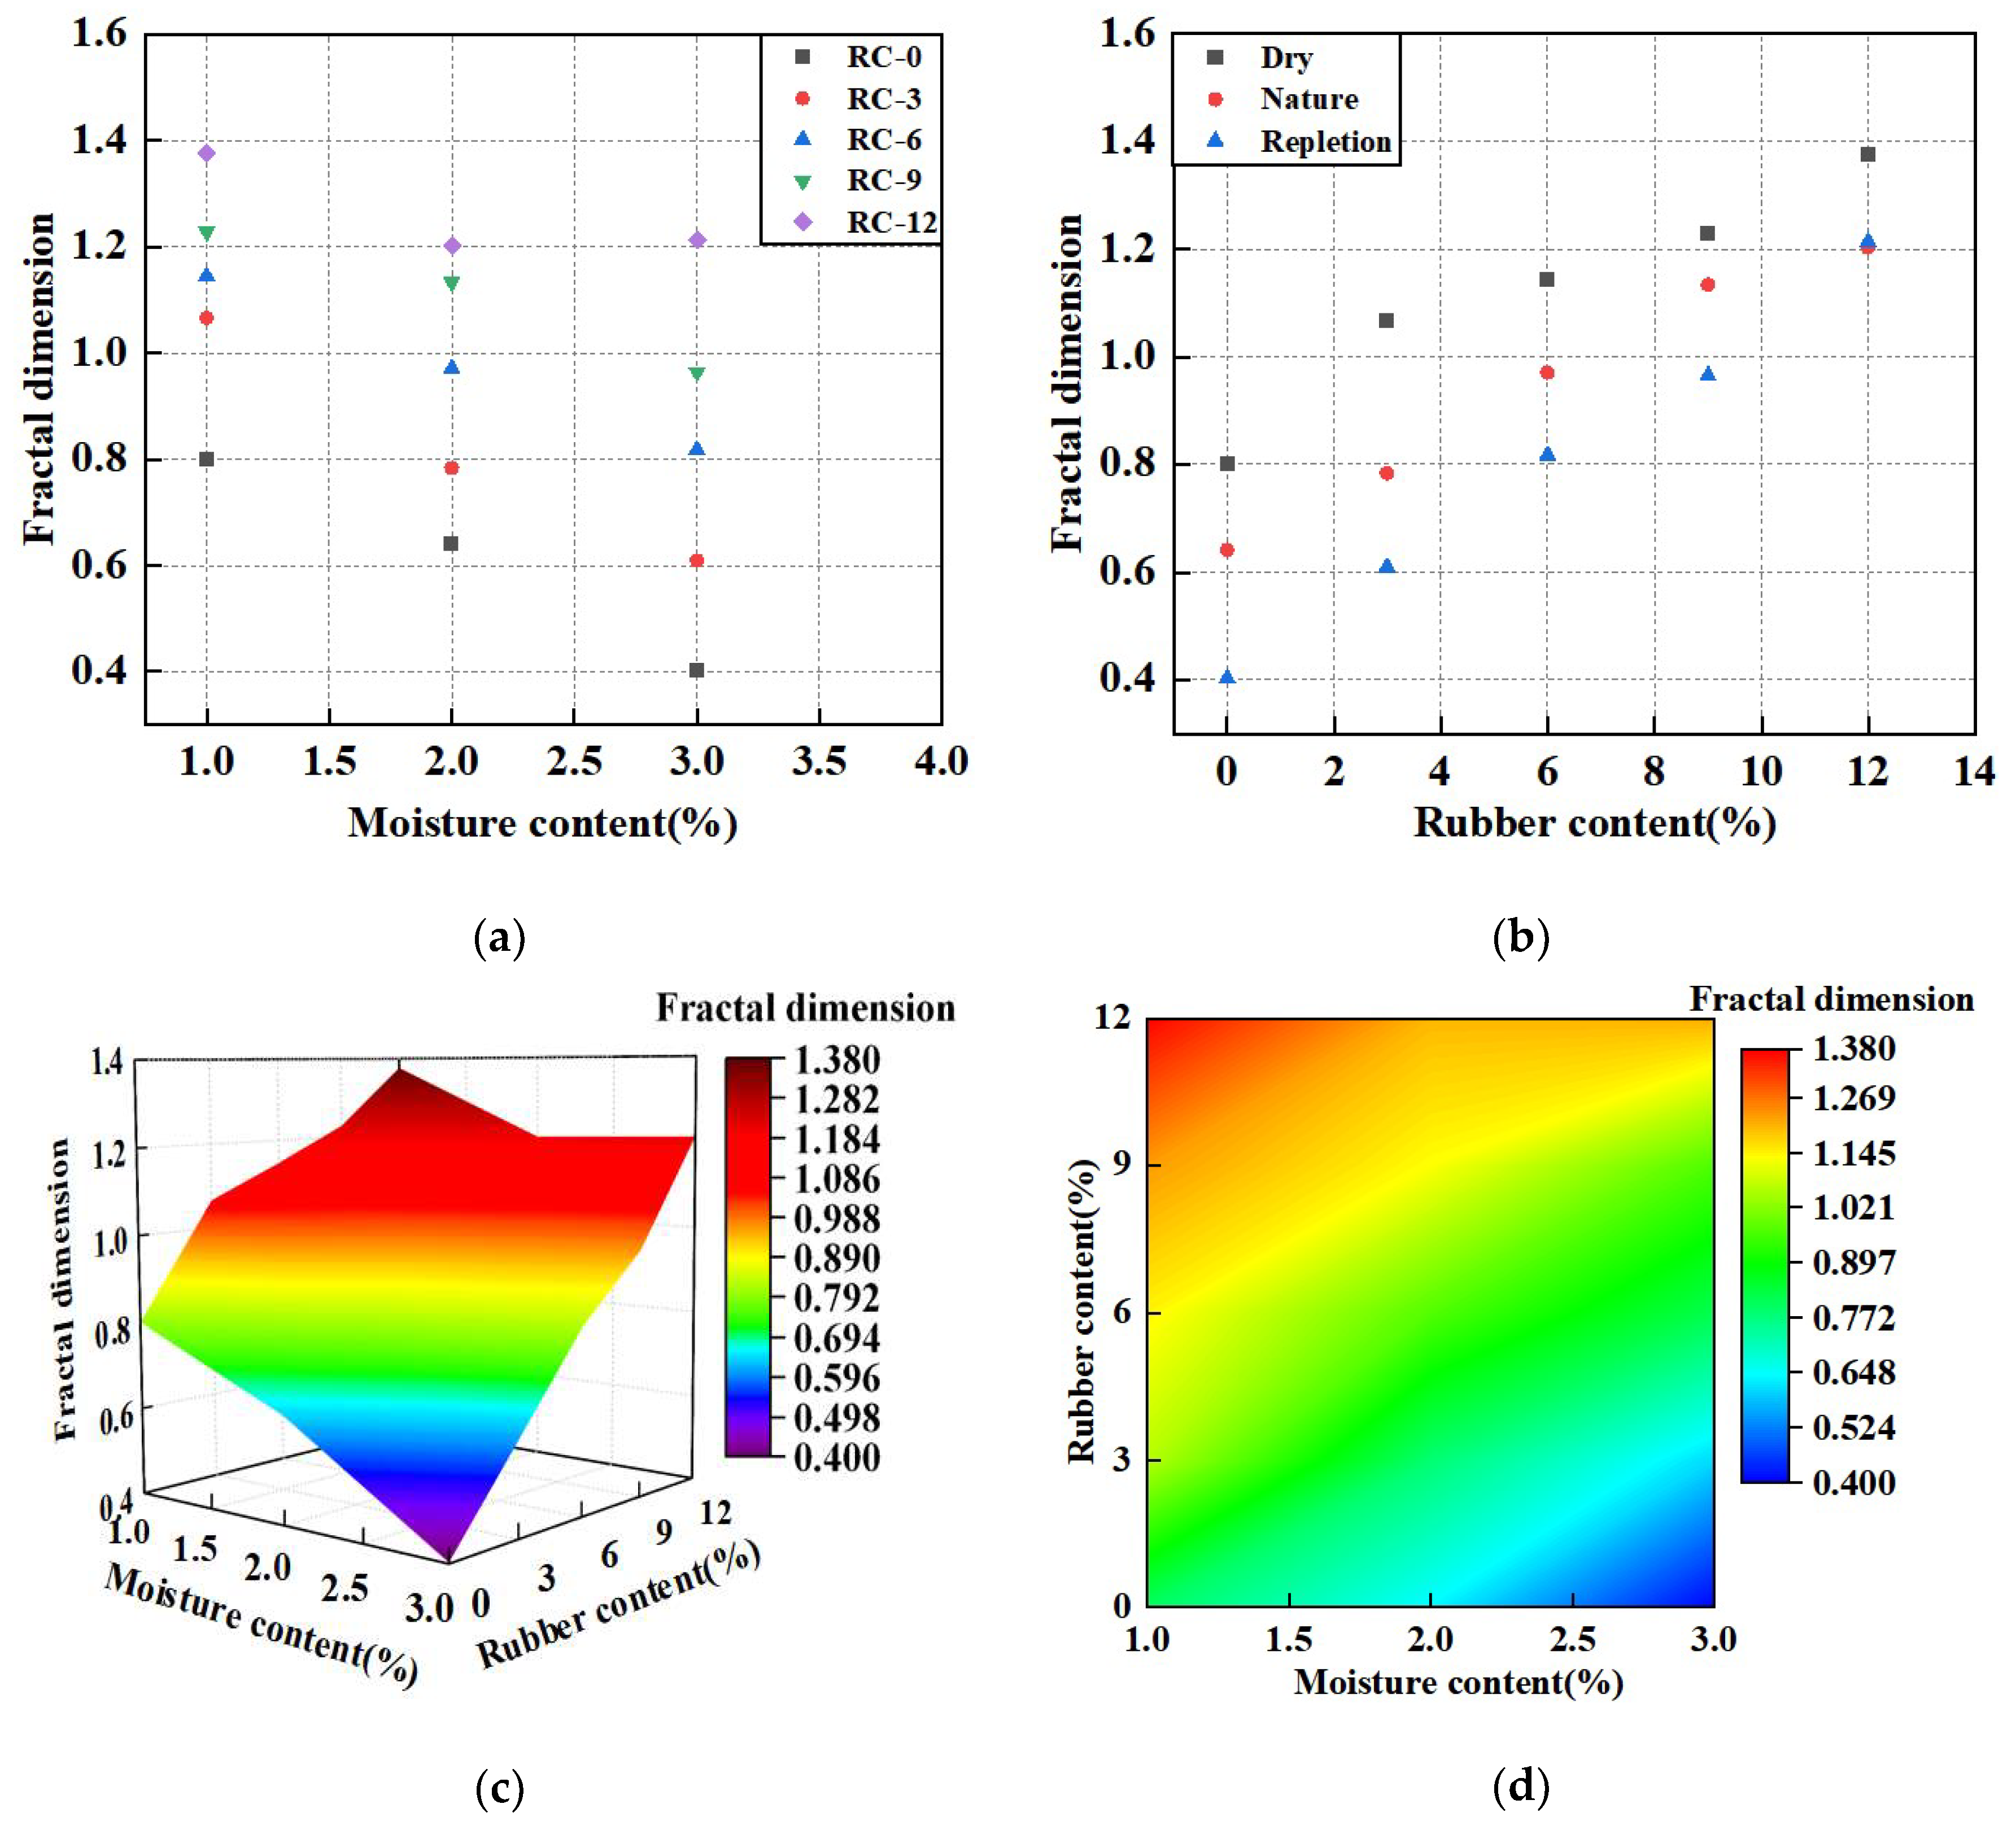
3.4. Fractal Dimension Features
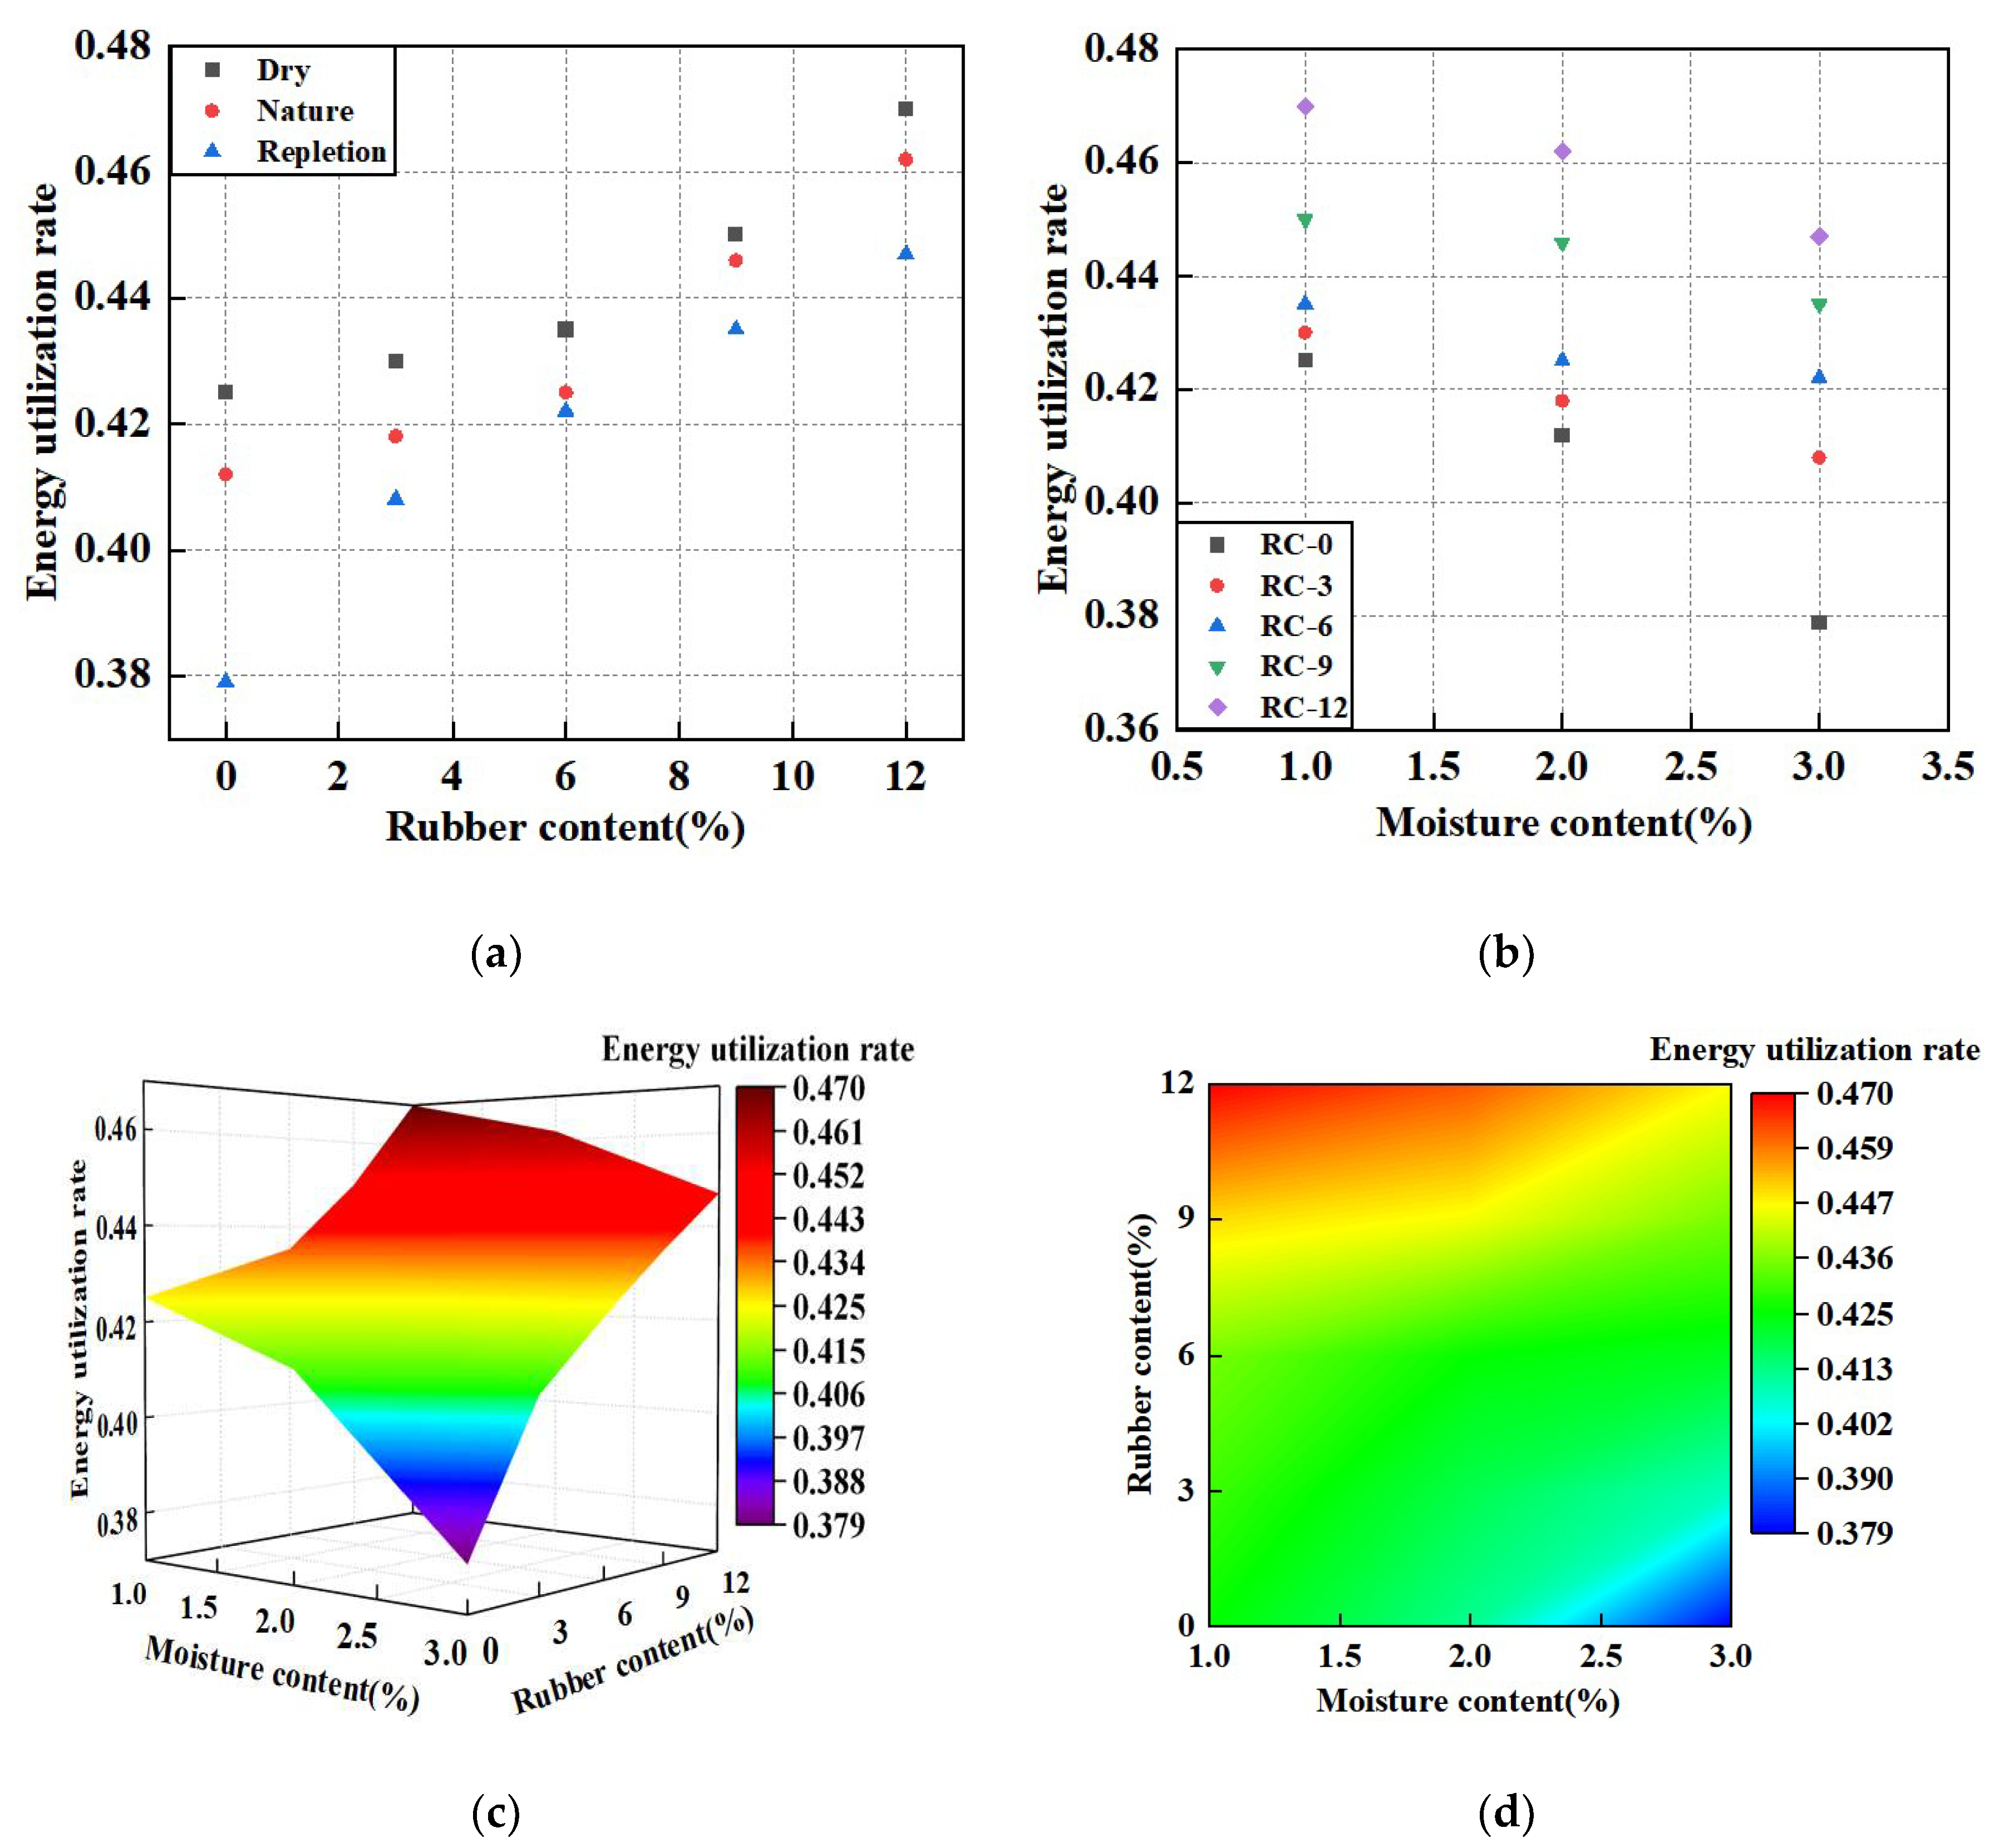
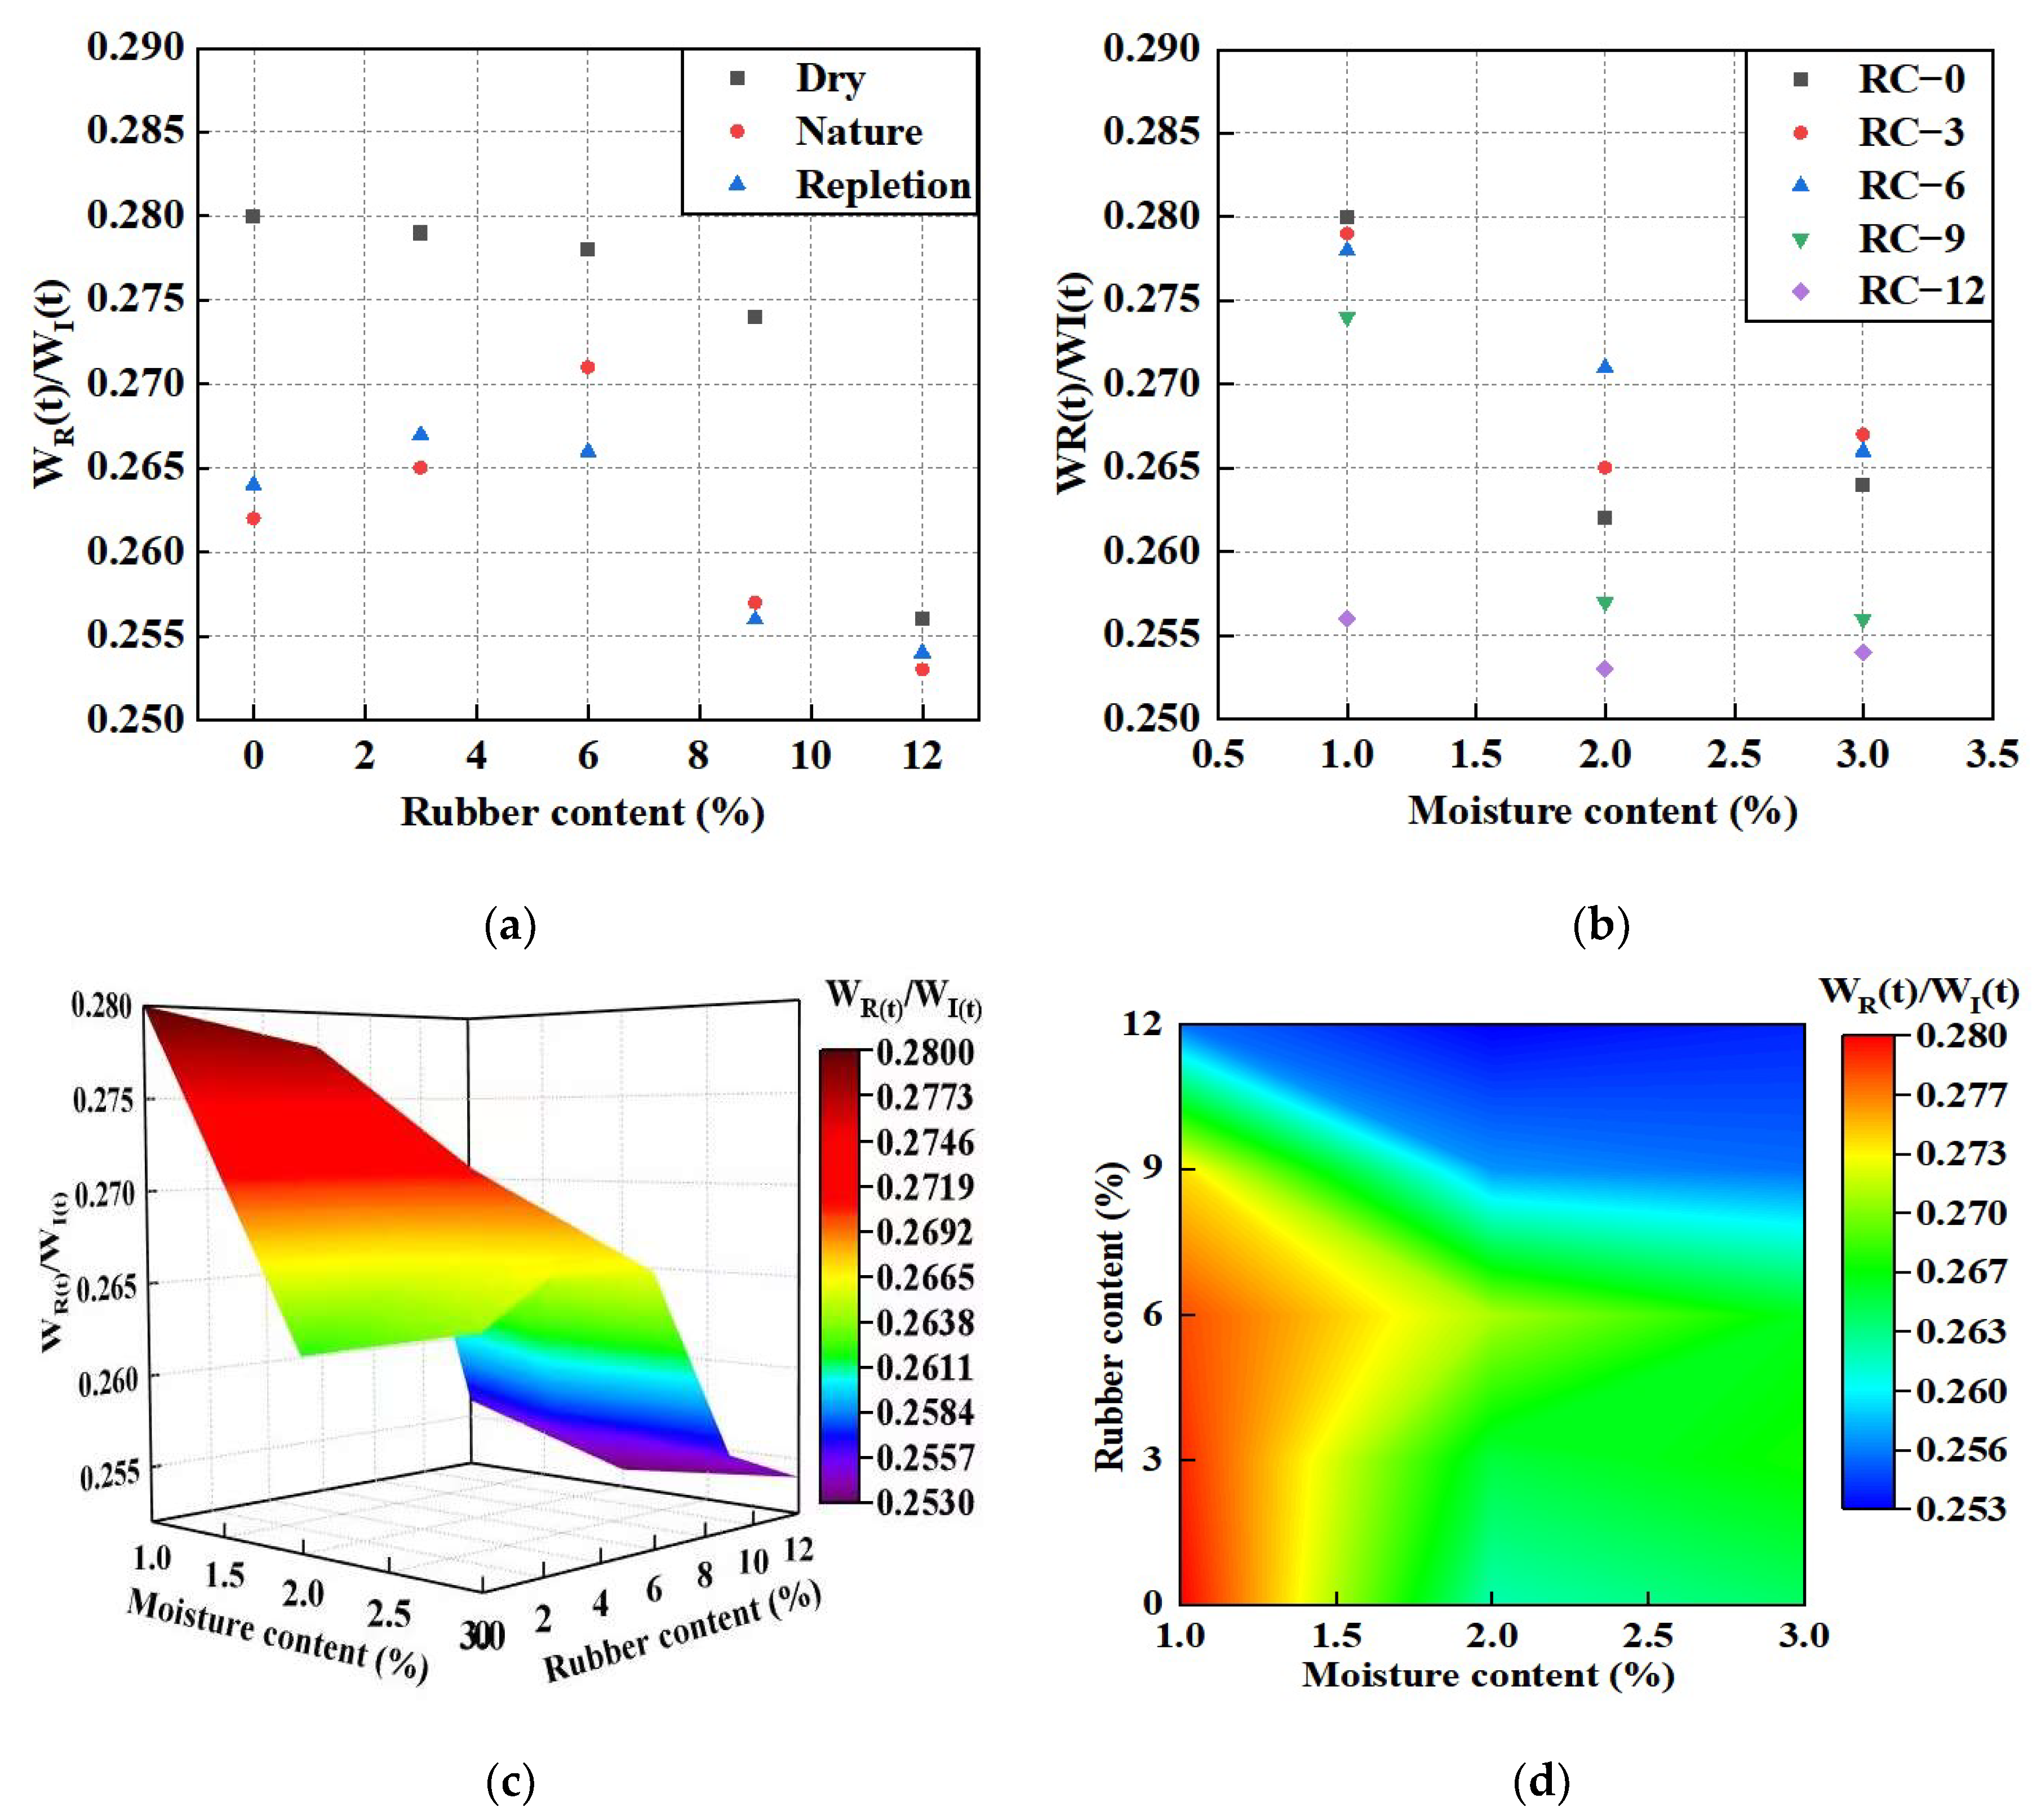
3.5. Energy Transfer Characteristics
3.6. Constitutive Model
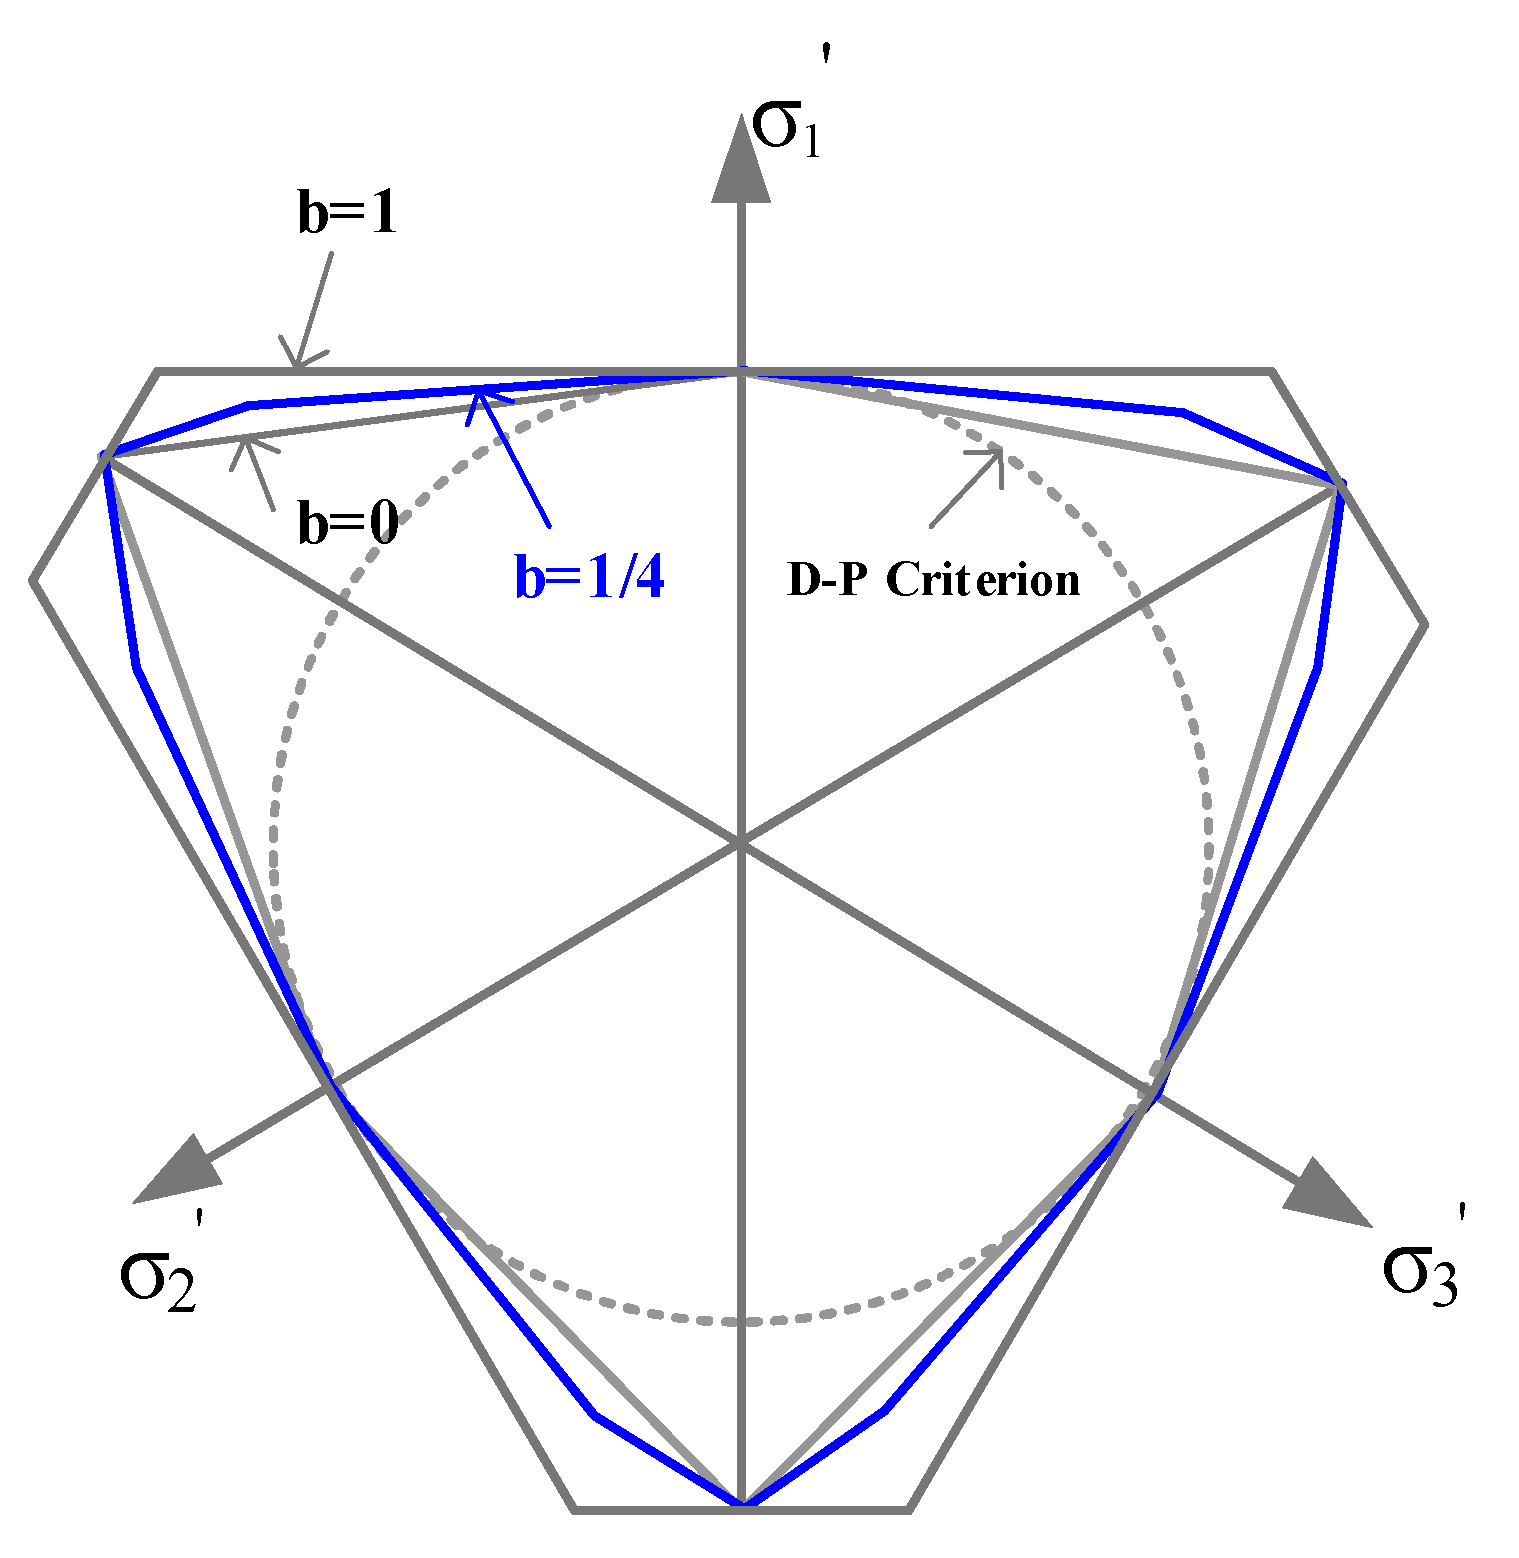
3.6.1. Unified Strength Theory
3.6.2. Establish a Constitutive Model of Damage
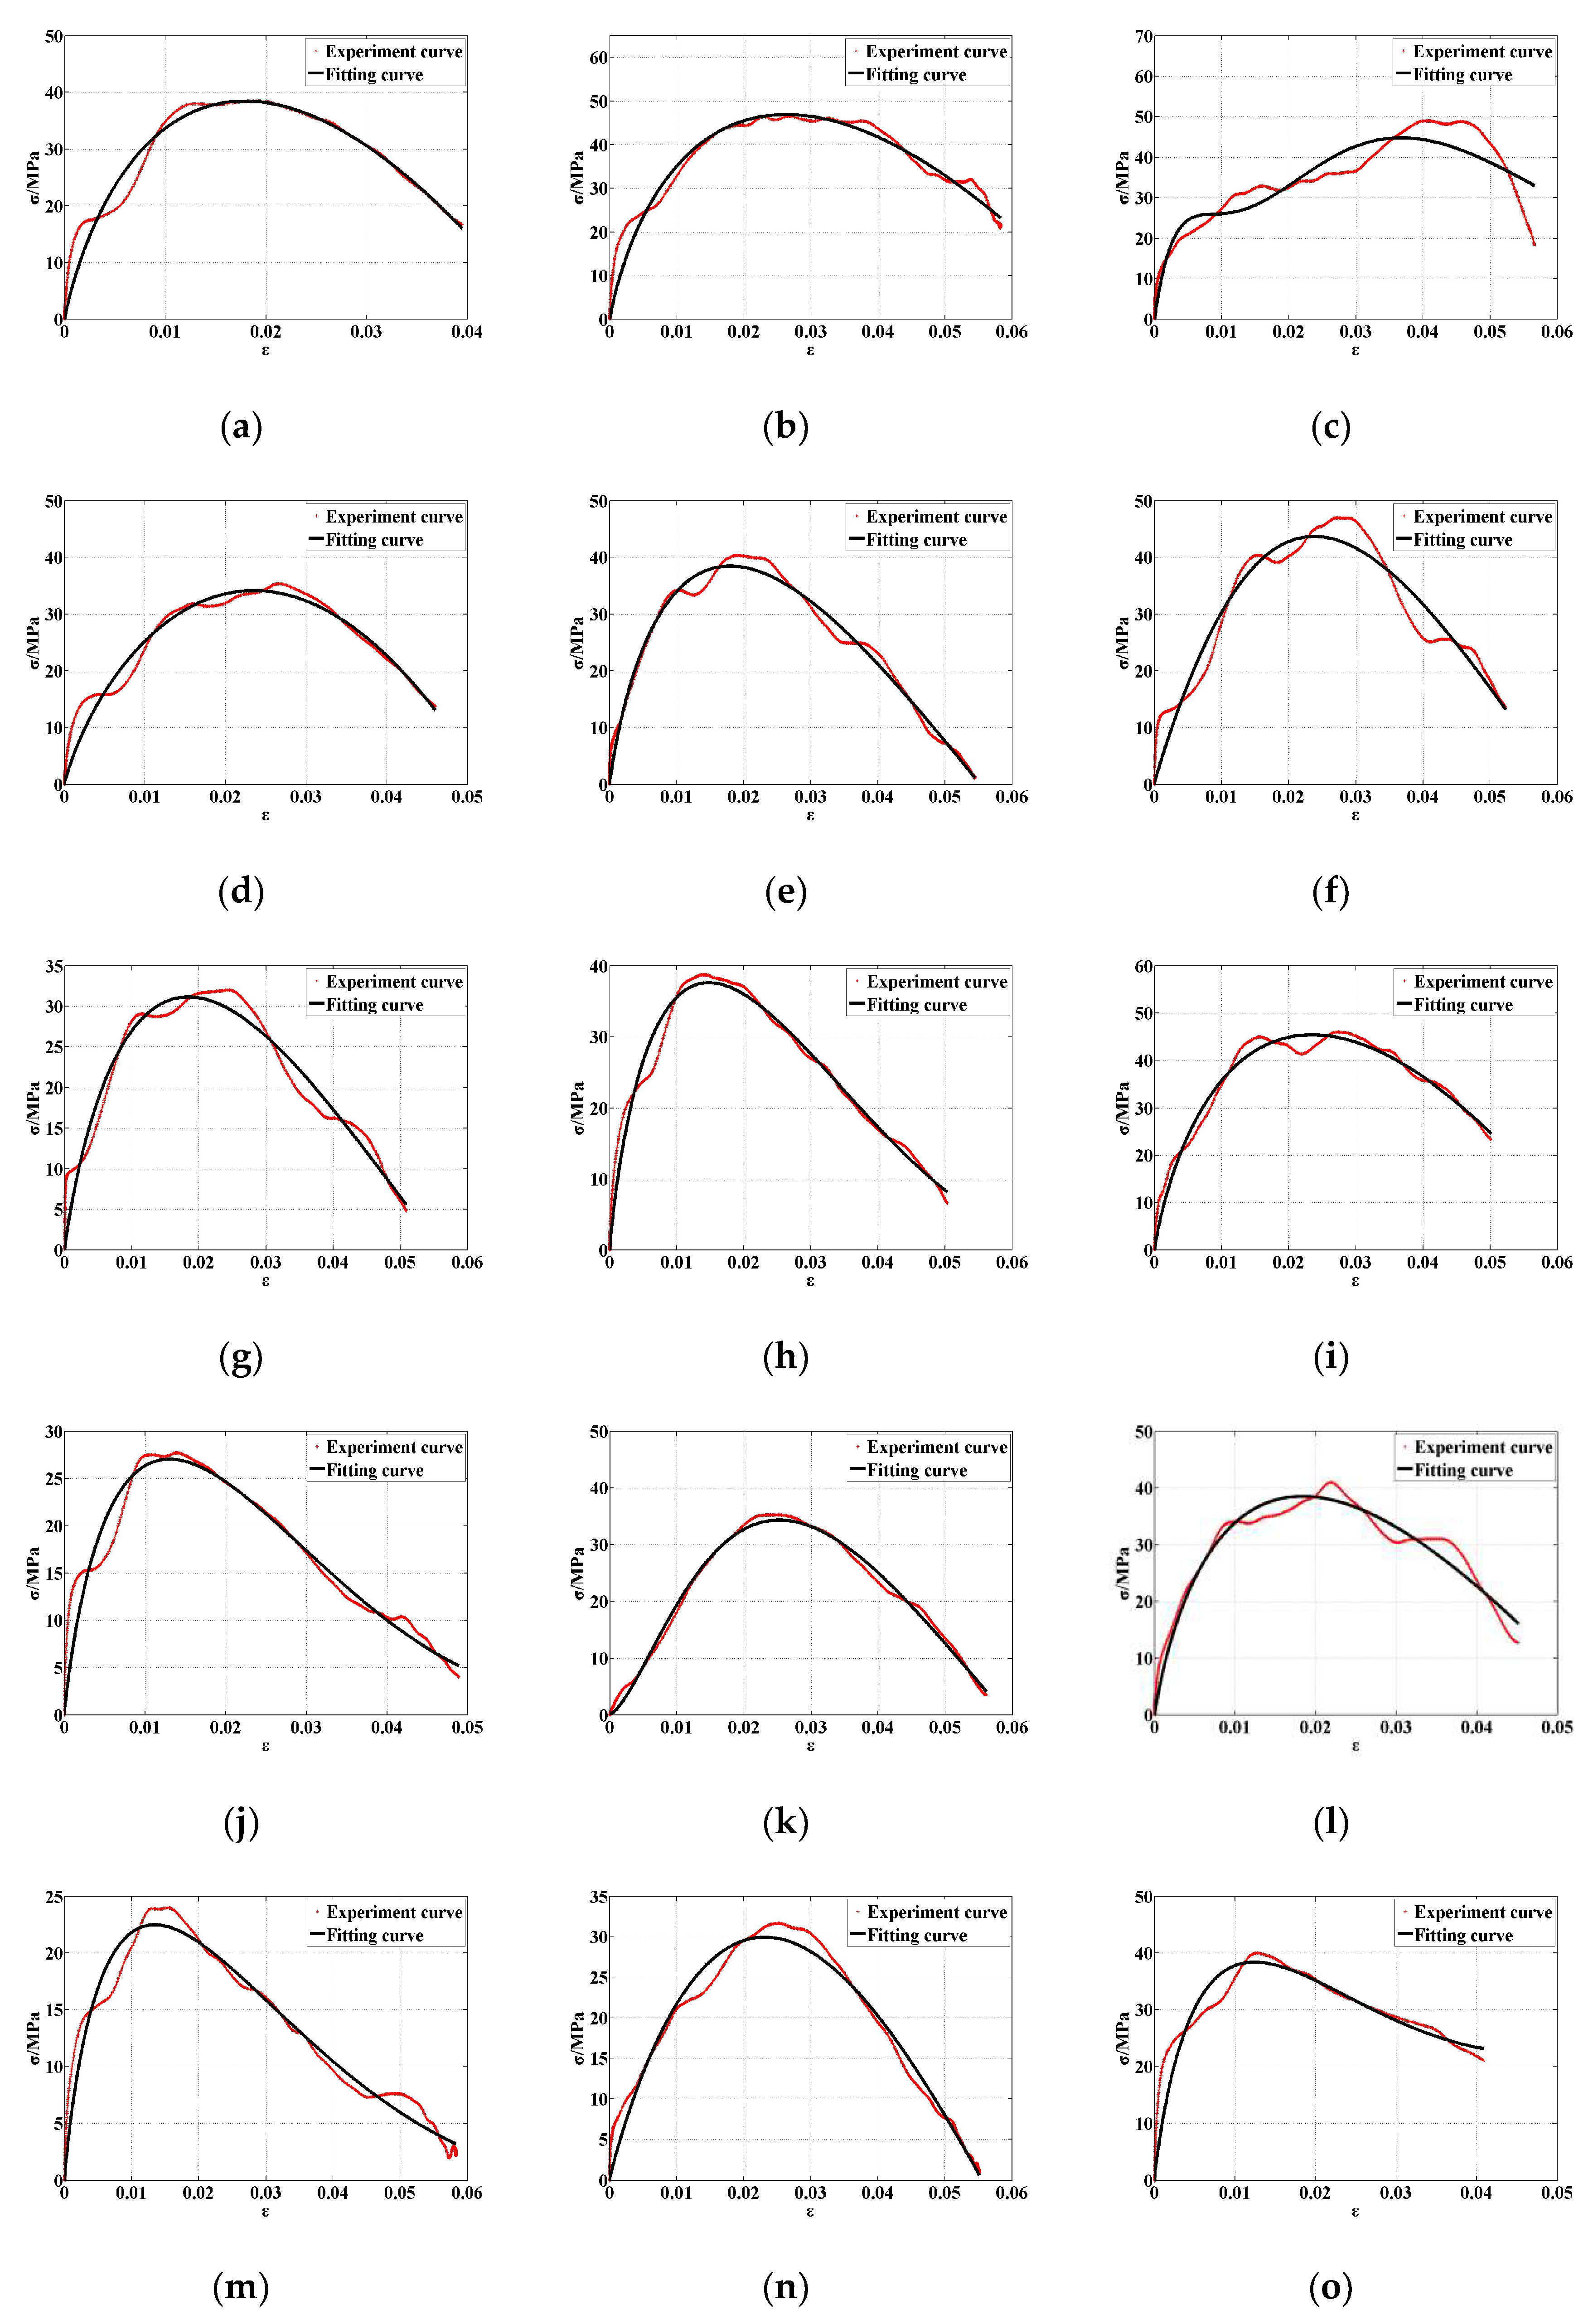
3.6.3. Constitutive Model Verification
4. Conclusions
5. Outlook
Author Contributions
Funding
Data Availability Statement
Conflicts of Interest
References
- Yang, L.; Xu, H.; Lu, J. Prospect of New Business Forms of Construction Engineering in the Era of Carbon Neutralization. Ind. Constr. Acad. Exch. Conf. 2022, 4, 1482–1485. [Google Scholar]
- Siddika, A.; Al Mamun, M.A.; Alyousef, R.; Amran, Y.M.; Aslani, F.; Alabduljabbar, H. Properties and utilizations of waste tire rubber in concrete: A review. Constr. Build. Mater. 2019, 224, 711–731. [Google Scholar] [CrossRef]
- Han, Z. A review of research on new types of elastic concrete. Tianjin Constr. 2004, 3, 35–37. [Google Scholar]
- Wu, H.; Shen, A.; Ren, G.; Ma, Q.; Wang, Z.; Cheng, Q.; Li, Y. Dynamic mechanical properties of fiber-reinforced concrete: A review. Constr. Build. Mater. 2023, 366, 130145. [Google Scholar] [CrossRef]
- Wu, S.-K.; Zhang, J.-W.; Song, Z.-X.; Fan, W.-B.; Zhang, Y.; Dong, X.-K.; Zhang, Y.-J.; Kan, B.-H.; Chen, Z.-S.; Zhang, J.-T.; et al. Review of the development status of rock burst disaster prevention system in China. J. Cent. South Univ. 2023, 30, 3763–3789. [Google Scholar] [CrossRef]
- Tang, H.; Ni, X.; Hu, S. Influence of Modified Rubber on Toughness of Concrete under Static Load and Dynamic. J. Anhui Univ. Sci. Technol. (Nat. Sci.) 2020, 40, 70–74. [Google Scholar]
- Haridharan, M.K.; Murugan, R.B.; Natarajan, C.; Muthukannan, M. Influence of Waste Tyre Crumb Rubber on Compressive Strength,Static Modulus of Elasticity and Flexural Srrength of Concrete. IOP Conf. Ser. Earth Environ. Sci. 2017, 80, 012014. [Google Scholar] [CrossRef]
- Eisa, A.S.; Elshazli, M.T.; Nawar, M.T. Experimental investigation on the effect of using crumb rubber and steel fibers on the structural behavior of reinforced concrete beams. Constr. Build. Mater. 2020, 252, 119078. [Google Scholar] [CrossRef]
- Atahan, A.O.; Yücel, A.Ö. Crumb rubber in concrete: Static and dynamic evaluation. Constr. Build. Mater. 2012, 36, 617–622. [Google Scholar] [CrossRef]
- Al-Tayeb, M.M.; Abu Bakar, B.H.; Akil, H.M.; Ismail, H. Performance of Rubberized and Hybrid Rubberized Concrete Structures under Static and Impact Load Conditions. Exp. Mech. 2012, 53, 377–384. [Google Scholar] [CrossRef]
- Yang, B.; Wang, J.; Yang, H.Y.; Zeng, L.N.; Feng, C.; Tan, S.Y. Effects of Flexible Functional Layer Incorporated with Rubber Powder on the Vibration Reduction of Cement Concrete Pavement. Appl. Mech. Mater. 2013, 368–370, 929–932. [Google Scholar]
- Al-Tayeb, M.M.; Abu Bakar, B.H.; Ismail, H.; Akil, H.M. Effect of partial replacement of sand by fine crumb rubber on impact load behavior of concrete beam: Experiment and nonlinear dynamic analysis. Mater. Struct. 2012, 46, 1299–1307. [Google Scholar] [CrossRef]
- Khan, I.; Shahzada, K.; Bibi, T.; Ahmed, A.; Ullah, H. Seismic performance evaluation of crumb rubber concrete frame structure using shake table test. Structures 2021, 30, 41–49. [Google Scholar] [CrossRef]
- Feng, W.; Liu, F.; Yang, F.; Jing, L.; Li, L.; Li, H.; Chen, L. Compressive behaviour and fragment size distribution model for failure mode prediction of rubber concrete under impact loads. Constr. Build. Mater. 2021, 273, 121767. [Google Scholar] [CrossRef]
- Liu, F.; Meng, L.Y.; Chen, G.X.; Li, L.J. Dynamic mechanical behaviour of recycled crumb rubber concrete materials subjected to repeated impact. Mater. Res. Innov. 2015, 19, S8-496-S498-501. [Google Scholar] [CrossRef]
- Pan, L.; Hao, H.; Cui, J.; Pham, T.M. Numerical study on dynamic properties of rubberised concrete with different rubber contents. Def. Technol. 2023, 24, 228–240. [Google Scholar] [CrossRef]
- Liu, Z.; Chen, X.; Wang, X.; Diao, H. Investigation on the dynamic compressive behavior of waste tires rubber-modified self-compacting concrete under multiple impacts loading. J. Clean. Prod. 2022, 336, 130289. [Google Scholar] [CrossRef]
- Pham, T.M.; Renaud, N.; Pang, V.; Shi, F.; Hao, H.; Chen, W. Effect of rubber aggregate size on static and dynamic compressive properties of rubberized concrete. Struct. Concr. 2021, 23, 2510–2522. [Google Scholar] [CrossRef]
- Chen, J.; Zhuang, J.; Shen, S.; Dong, S. Experimental investigation on the impact resistance of rubber self-compacting concrete. Structures 2022, 39, 691–704. [Google Scholar] [CrossRef]
- Jahami, A.; Issa, C.A. Exploring the use of mixed waste materials (MWM) in concrete for sustainable Construction: A review. Constr. Build. Mater. 2023, 398, 132476. [Google Scholar] [CrossRef]
- Gregori, A.; Castoro, C.; Mercuri, M.; Angiolilli, M. Numerical modelling of the mechanical behaviour of rubbercrete. Comput. Struct. 2021, 242, 106393. [Google Scholar] [CrossRef]
- Feng, W.; Liu, F.; Yang, F.; Li, L.; Jing, L.; Chen, B.; Yuan, B. Experimental study on the effect of strain rates on the dynamic flexural properties of rubber concrete. Constr. Build. Mater. 2019, 224, 408–419. [Google Scholar] [CrossRef]
- Wang, Z.; Li, J.; Wu, H.; Si, Y.; Xiong, W.; Lin, M.; Liu, Q. Energy dissipation analysis of concrete samples under impact loads of different high strain rates. Chin. J. Comput. Mech. 2022, 40, 621–627. [Google Scholar]
- Liu, F.; Chen, G.; Li, L.; Guo, Y. Study of impact performance of rubber reinforced concrete. Constr. Build. Mater. 2012, 36, 604–616. [Google Scholar] [CrossRef]
- Yang, R.; Xu, Y.; Chen, P.; Wang, J. Experimental study on dynamic mechanics and energy evolution of rubber concrete under cyclic impact loading and dynamic splitting tension. Constr. Build. Mater. 2020, 262, 120071. [Google Scholar] [CrossRef]
- Feng, W.; Liu, F.; Yang, F.; Li, L.; Jing, L. Experimental study on dynamic split tensile properties of rubber concrete. Constr. Build. Mater. 2018, 165, 675–687. [Google Scholar] [CrossRef]
- Gupta, T.; Tiwari, A.; Siddique, S.; Sharma, R.K.; Chaudhary, S. Chaudhary. Response Assessment under Dynamic Loading and Microstructural Investigation of Rubberized Concrete. J. Mater. Civ. Eng. 2017, 29, 15. [Google Scholar] [CrossRef]
- Thakare, A.A.; Singh, A.; Gupta, T.; Chaudhary, S. Effect of size variation of fibre-shaped waste tyre rubber as fine aggregate on the ductility of self-compacting concrete. Environ. Sci. Pollut. Res. 2022, 30, 20031–20051. [Google Scholar] [CrossRef] [PubMed]
- Liu, B.D.; Lv, W.J.; Li, L.; Li, P.F. Effect of moisture content on static compressive elasticity modulus of concrete. Constr. Build. Mater. 2014, 69, 133–142. [Google Scholar] [CrossRef]
- Chen, K.; Wang, Q.; Luo, D.; Zhou, B.; Zhang, K. Study on Dynamic Characteristics of Rubber-Red Clay Mixtures. Adv. Mater. Sci. Eng. 2020, 2020, 2343242. [Google Scholar] [CrossRef]
- Ranjith, P.; Jasinge, D.; Song, J.; Choi, S. A study of the effect of displacement rate and moisture content on the mechanical properties of concrete: Use of acoustic emission. Mech. Mater. 2008, 40, 453–469. [Google Scholar] [CrossRef]
- Mohammed, B.S.; Azmi, N.J. Strength reduction factors for structural rubbercrete. Front. Struct. Civ. Eng. 2014, 8, 270–281. [Google Scholar] [CrossRef]
- Ahmed, B.; Park, T.; Voyiadjis, G.Z. A comprehensive experimental review of strain rate, size effect, creep and confinement in concrete: Part III. Int. J. Damage Mech. 2023, 32, 746–807. [Google Scholar] [CrossRef]
- Huang, S.; Xia, K. Effect of heat-treatment on the dynamic compressive strength of Longyou sandstone. Eng. Geol. 2015, 191, 1–7. [Google Scholar] [CrossRef]
- Miao, Y.; Wang, Y.; Du, W.; He, H.; Deng, Q.; Dou, Q. Theoretical instructions for experimenting controllable Hopkinson pressure bar. Polym. Test. 2022, 108, 107520. [Google Scholar] [CrossRef]
- Zencker, U.; Clos, R. Limiting conditions for compression testing of flat specimens in the split hopkinson pressure bar. Exp. Mech. 1999, 39, 343–348. [Google Scholar] [CrossRef]
- Chen, M.; Zhong, H.; Wang, H.; Zhang, M. Behaviour of recycled tyre polymer fibre reinforced concrete under dynamic splitting tension. Cem. Concr. Compos. 2020, 114, 103764. [Google Scholar] [CrossRef]
- Hernández-Olivares, F.; Barluenga, G.; Bollati, M.; Witoszek, B. Static and dynamic behaviour of recycled tyre rubber-filled concrete. Cem. Concr. Res. 2002, 32, 1587–1596. [Google Scholar] [CrossRef]
- Wu, J.; Li, H.; Ma, D.; Wang, C. Multifractal Characteristics of Surface Crack Distribution in Concrete under Uniaxial Compression. Chin. Q. Mech. 2023, 44, 904–913. [Google Scholar] [CrossRef]
- Zhao, X.; Xu, S.; Li, Q. Fractal characteristics of fire-damaged ultra high toughness cementitious composite after impact loading. China Civ. Eng. J. 2019, 52, 44–55. [Google Scholar] [CrossRef]
- Li, X.; Xiao, D.; Pu, C.; Yue, B.; Long, Y.; Li, X.; Pei, G. Study on dynamic compression failure and energy dissipation characteristics of basalt fiber concrete under freeze-thaw. Ind. Miner. Process. 2024, 14. [Google Scholar]
- Ye, H.; Qian, Z.; Lei, T.; Wen, Y.; Li, R. Crushing energy dissipation characteristics of graphite ore rock under impact loads. Explos. Shock. Waves 2023, 43, 27–39. [Google Scholar] [CrossRef]
- Chen, B.; Zhao, F.; Tian, X. Study on Energy Dissipation and Fractal Characteristics of Fractured Sandstone Under Impact Load. China Mine Eng. 2024, 53, 39–47. [Google Scholar] [CrossRef]
- Tian, H.; Peng, W.; He, K.; Dong, Y.; Du, Y.; Zhong, X.; Wang, X.; Xi, N. Solving Limit Values of Cylinder and Spherical Shell Adopting Yu’s Unified Strength Theory. J. Xi’an Jiaotong Univ. 2018, 52, 1–11. [Google Scholar]
- Yu, M.; Yang, S.; Liu, C.; Liu, J. Unified Plane-Strain Slip Line Field Theory System. J. Civ. Eng. 1997, 30, 14–26+41. [Google Scholar]
- Wang, D.K.; Liu, S.M.; Wei, J.P.; Wang, H.L.; Peng, M. Analysis and strength statistical damage constitutive model of coal under impacting failure. J. China Coal Soc. 2016, 41, 3024–3031. [Google Scholar]
- Lei, T.; Qian, Z.; Ye, H.; Li, L.; Yu, M.; Kang, P.; Deng, B.; Li, Z.; Lei, B. Dynamic Characteristics and Damage Constitutive Model of Diorite under Impact Loading. Met. Mine 2024. [Google Scholar]


| ID | Mixing Ratio (kg/m3) | Rubber Content (%) | ||||||
|---|---|---|---|---|---|---|---|---|
| Cement | Stone and Sand | Silica Fume | Water–Cement Ratio | Mineral Powder | Water Reducing Agent | Steel Slag Powder | ||
| RC-0 | 0.500 | 0.500 | 0.002 | 0.300 | 0.004 | 0.010 | 0.003 | 0 |
| RC-3 | 0.500 | 0.470 | 0.002 | 0.300 | 0.004 | 0.010 | 0.003 | 3 |
| RC-6 | 0.500 | 0.440 | 0.002 | 0.300 | 0.004 | 0.010 | 0.003 | 6 |
| RC-9 | 0.500 | 0.410 | 0.002 | 0.300 | 0.004 | 0.010 | 0.003 | 9 |
| RC-12 | 0.500 | 0.380 | 0.002 | 0.300 | 0.004 | 0.010 | 0.003 | 12 |
| ID | WI(t)/J | WR(t)/J | WT(t)/J | WS(t)/J | WT(t)/WI(t) | WR(t)/WI(t) | Energy Utilization Rate | η/ (J/cm3) |
|---|---|---|---|---|---|---|---|---|
| RC-0-1 | 356.140 | 99.710 | 105.060 | 151.350 | 0.295 | 0.280 | 0.425 | 1.540 |
| RC-0-2 | 396.320 | 103.830 | 129.200 | 163.280 | 0.326 | 0.262 | 0.412 | 1.660 |
| RC-0-3 | 347.450 | 91.720 | 124.030 | 131.68 | 0.357 | 0.264 | 0.379 | 1.340 |
| RC-3-1 | 368.980 | 102.940 | 107.370 | 158.660 | 0.291 | 0.279 | 0.430 | 1.610 |
| RC-3-2 | 379.150 | 100.470 | 120.190 | 158.480 | 0.317 | 0.265 | 0.418 | 1.610 |
| RC-3-3 | 386.390 | 103.160 | 125.570 | 157.640 | 0.325 | 0.267 | 0.408 | 1.600 |
| RC-6-1 | 371.620 | 103.310 | 106.650 | 161.640 | 0.287 | 0.278 | 0.435 | 1.640 |
| RC-6-2 | 372.450 | 100.930 | 113.220 | 158.290 | 0.304 | 0.271 | 0.425 | 1.610 |
| RC-6-3 | 359.780 | 95.700 | 112.250 | 151.820 | 0.312 | 0.266 | 0.422 | 1.550 |
| RC-9-1 | 364.150 | 99.770 | 100.500 | 163.860 | 0.276 | 0.274 | 0.450 | 1.670 |
| RC-9-2 | 357.320 | 91.830 | 106.110 | 159.360 | 0.297 | 0.257 | 0.446 | 1.620 |
| RC-9-3 | 365.510 | 93.570 | 112.940 | 158.990 | 0.309 | 0.256 | 0.435 | 1.620 |
| RC-12-1 | 355.150 | 90.910 | 97.310 | 166.920 | 0.274 | 0.256 | 0.470 | 1.700 |
| RC-12-2 | 349.180 | 88.340 | 99.510 | 161.320 | 0.285 | 0.253 | 0.462 | 1.640 |
| RC-12-3 | 371.230 | 94.290 | 110.990 | 165.930 | 0.299 | 0.254 | 0.447 | 1.690 |
| ID | Experiment | Simulation | ||
|---|---|---|---|---|
| σd/Mpa | εd | σd/Mpa | εd | |
| RC-0-1 | 38.530 | 0.039 | 38.500 | 0.391 |
| RC-0-2 | 46.602 | 0.058 | 47.100 | 0.056 |
| RC-0-3 | 49.000 | 0.057 | 45.000 | 0.056 |
| RC-3-1 | 35.420 | 0.046 | 33.500 | 0.046 |
| RC-3-2 | 40.350 | 0.054 | 38.000 | 0.052 |
| RC-3-3 | 47.000 | 0.052 | 43.000 | 0.052 |
| RC-6-1 | 32.000 | 0.051 | 31.200 | 0.049 |
| RC-6-2 | 38.780 | 0.050 | 36.600 | 0.050 |
| RC-6-3 | 46.000 | 0.050 | 45.400 | 0.049 |
| RC-9-1 | 27.699 | 0.049 | 25.000 | 0.046 |
| RC-9-2 | 35.290 | 0.056 | 33.000 | 0.053 |
| RC-9-3 | 41.000 | 0.045 | 38.500 | 0.045 |
| RC-12-1 | 24.000 | 0.058 | 22.000 | 0.058 |
| RC-12-2 | 31.670 | 0.055 | 29.900 | 0.055 |
| RC-12-3 | 40.000 | 0.041 | 38.000 | 0.040 |
Disclaimer/Publisher’s Note: The statements, opinions and data contained in all publications are solely those of the individual author(s) and contributor(s) and not of MDPI and/or the editor(s). MDPI and/or the editor(s) disclaim responsibility for any injury to people or property resulting from any ideas, methods, instructions or products referred to in the content. |
© 2024 by the authors. Licensee MDPI, Basel, Switzerland. This article is an open access article distributed under the terms and conditions of the Creative Commons Attribution (CC BY) license (https://creativecommons.org/licenses/by/4.0/).
Share and Cite
Ling, R.; Zhou, C.; Wu, R.; Xie, Y.; Wu, C. Study on Mechanical Response and Constitutive Model of Rubber Concrete under Impact Load and Water Content Coupling. Buildings 2024, 14, 2528. https://doi.org/10.3390/buildings14082528
Ling R, Zhou C, Wu R, Xie Y, Wu C. Study on Mechanical Response and Constitutive Model of Rubber Concrete under Impact Load and Water Content Coupling. Buildings. 2024; 14(8):2528. https://doi.org/10.3390/buildings14082528
Chicago/Turabian StyleLing, Ru, Chenhao Zhou, Rui Wu, Ying Xie, and Chao Wu. 2024. "Study on Mechanical Response and Constitutive Model of Rubber Concrete under Impact Load and Water Content Coupling" Buildings 14, no. 8: 2528. https://doi.org/10.3390/buildings14082528