Abstract
Demand response is an effective solution for balancing supply and demand in modern energy supply systems. For utility or load aggregators, it is important to accurately target potential consumers to participate in demand response programs to recruit a massive number of users. This is especially important for the invitation-based demand response mode, which is currently often used in China. In this paper, a portrait-based method is proposed to effectively identify potential consumers for different demand response tasks based on historical loads. Eight indicators are proposed to quantify the energy consumption characteristics from different aspects, and an evaluation method is introduced. Then, a selection method based on the K-means clustering algorithm and support vector machine classifiers is proposed. The method is tested under two scenarios, including load shifting and monthly peak shaving. The results show that the proposed method can identify potential users effectively, and the accuracy of the trained classification model exceeds 99.9%. The proposed portrait-based identification method provides an effective way to describe users’ energy consumption characteristics and select potential users effectively, which is very useful for helping the utility or virtual plant with load management.
1. Introduction
Many countries have attempted to reduce carbon emissions by increasing renewable energy use and decreasing energy demands [1,2]. However, the energy consumption of society continues to increase due to climate change, electrification in buildings, and local development. The integration of renewable energy poses challenges to the grid due to its intermittent and unpredictable nature. On the other hand, an increase in new consumers (i.e., electric vehicles, data centers, etc.) also brings challenges to the grid. All these result in a supply and demand balance issue. This is especially significant during extreme weather events [3,4]. Demand response (DR) can be an effective strategy to alleviate the supply–demand imbalance by encouraging users to change their energy consumption behavior [5].
Demand response has been extensively studied and implemented in many countries, but it remains in the early stages in China. Currently, demand response programs in China are primarily pilot programs mainly implemented by local utilities and are limited to specific users who are invited to participate several days ahead [6,7]. The main objective of these programs is timely relief of high power supply pressure. Therefore, it is significant to accurately select candidates who are well-suited for participating in DR programs. Furthermore, load aggregators and virtual power plants are commonly employed in various countries to coordinate the distributed resources and address problems related to grid stability and reliability arising from congestion and voltage issues [8]. The economical operation of these entities depends on an effective DR mechanisms, and the selection of building users with high potential for different DR programs is their main concern. Therefore, it is important to develop an effective method to quantify the energy consumption characteristics of buildings and select appropriate DR participants.
Understanding users’ energy consumption characteristics is one key step in assessing their ability to participate in a DR program. One common method is based on load curves of buildings, i.e., load profiling, to identify users’ energy consumption patterns and further estimate their potential for DR [9,10,11]. To identify potential residential DR participants, daily household load consumption patterns were analyzed [12,13]. To better understand the peak demand behavior and relevant attributes of residential consumers during different periods in a day, a finite mixture of Gaussian distributions was implemented, resulting in ten representative behaviors during the peak time [12]. K-means clustering is often used to generate typical household load profiles [14,15]. The clustering results can be optimized by maximizing in-cluster similarities and between-cluster differences, so users with different consumption patterns can be classified more accurately. Classical optimization methods include well-behaved clustering algorithms, such as ensemble clustering [16] and fuzzy K-means [13], evaluation criterion adjustment for cluster validity, data dimensionality reduction, etc. [17,18,19]. Methods, such as initializing cluster centers using the particle swarm optimization algorithm [20] or optimizing the similarity calculation rules using dynamic time warping [21], are also used to optimize the clustering results. The influence of energy data granularity on clustering results was investigated, and K-means clustering was proved to be robust to variations in data resolution within a given temporal band [22]. The above research is mainly for single users, but the response capacity of individual users is often limited. Therefore, research has also expanded to the whole community [23]. To select potential users for DR programs through load curves, some studies segmented representative hourly electricity profiles from thousands of users to create a curve dictionary [24,25]. The consumers with relatively high peaks during the peak time were considered to have greater demand response potential [24]. Similarly, clustering methods were used to classify the electricity load profile patterns of several buildings on a campus [26,27]. The electrical consumption patterns of utility users were segmented through the power consumption data, demographics, and previous program enrollment information. The goal was to appropriately choose potential users with similar patterns for DR programs [28]. The daily electricity load from smart meters typically contains 24 or 96 data points, making load profiling computationally intensive due to its high dimensionality and redundancy. To address this challenge, researchers have employed dimensionality reduction methods, such as principal component analysis (PCA) [29] and feature extraction [30]. Features were defined to describe the daily electricity curve shape [31,32], including ‘peak load’, ‘base load’, ‘rise start time’, ‘high load start time’, and ‘high load finish time’. Additionally, some features were based on the statistical properties and distribution of daily electricity consumption [33,34], including curve shape changes, consumption during off-peak and peak periods, and the slopes of the transitions [34]. Frequency domain analysis can also be used to generate new features, like dominant frequency and amplitude [27,31]. Regardless of the different features or methods used, they all aim to generate representative electricity profiles of consumers. Although obtaining typical load profiles can help the utility to learn typical energy use patterns of buildings, it does not intuitively reflect the demand response potentials of buildings and therefore does not allow for quick targeting of potential users, especially when dealing with different demand response programs. Furthermore, the power utilities or load aggregators usually need to address a massive number of users, and the aforementioned load profiling methods are time- and resource-intensive due to clustering them one by one.
Obtaining the portrait of energy consumption users is another viable method to understand consumer characteristics [35,36] and identify potential candidates [37]. The user portrait first emerged in e-commerce and expanded to diverse industries with big data advances [38]. Its essence is to extract virtual representation labels from real data information of consumers. When it is used in building and energy systems, it can describe users’ energy consumption patterns effectively and reduce the data dimension required for consumer segmentation by clustering. To provide better differentiated service for customers in the electricity market, five features were proposed to obtain an energy user portrait, including the daily electricity consumption, the daily valley-to-peak, the seasonal fluctuation, the electricity arrears rate, and the electricity price sensitivity [39]. Then, K-means was applied to obtain typical electricity user classes, and different marketing strategies were provided accordingly. Similarly, to improve targeted marketing and supply services, a word vector model based on user portraits that reflects the level of electricity cost and power loss of users was proposed to describe the behavior preferences of power user groups [40]. Some scholars also began to apply the user portrait to characterize consumers for DR programs, such as analyzing the power consumption behaviors from electricity risk management [35] and auxiliary load regulations [36]. A user behavior tag library was constructed based on the user portrait and K-means clustering to reflect the power consumption behaviors of 2000 industrial and commercial users [35]. The tag library comprised nine indicators (including the contract capacity, the category of electric power consumption, etc.), which were labeled (small/medium/large) and processed numerically for clustering. Typical daily curves obtained from clustering and the distribution of numerical indicators of power load characteristics were applied simultaneously to characterize the user’s electricity behavior at both the user level and the industry level [36]. These indicators represent the user load level, typical peak–valley characteristics, and load development law. A combined daily load curve and user portrait method had been proposed to identify residential users’ adaptability and potential for incentive-based demand response programs [37]. Seven selected features were used to generate hierarchical user portraits. Four preliminary features were used to describe the DR adaptability, including the willingness, the load patterns, the regularity, and the volatility. Peak period details were added for precise user portraits. However, complicated calculations to obtain the user portrait may outweigh its benefits. Many indicators are proposed in the above studies, but mainly focus on the load curve pattern characteristics and are still not sufficient and convenient for potential user selection in DR programs for a large number of users at an urban scale.
In China, the monthly electricity bill of large customers is charged based on both the energy consumption (kWh) and the demand (kW). Therefore, different tariffs for the two charges are introduced by the utility to attract customers to participate in the demand response programs for load shifting and monthly peak shaving [41]. For the energy charge, time-of-use (TOU) tariffs have been designed. Users can shift loads from peak hours to off-peak hours by implementing measures like storage and scheduling to reduce the energy charge. For the demand charge, different prices for the monthly peak demand and the transformer capacity have been designed to guide users to reduce unnecessary expenses incurred by unreasonable power usage behavior or unused power reservations. How to effectively identify potential users to participate in load shifting and monthly peak shaving immediately is challenging [42].
Based on the literature review conducted above, the following research gaps still exist:
- Typical load curves can be used to characterize the energy use behavior, and they are often used for individual users. However, there may be millions of customers at the city scale, so this approach is limited to target candidates from numerous and diverse consumers due to large consumption tasks. Additionally, it is hard to closely relate load curves to the demand response program directly.
- Some indicators have been proposed in existing studies. However, they are not sufficient to meet the Chinese electricity market when considering different DR programs, including load shifting and monthly peak shaving. Furthermore, the targeting process is relatively complicated and still relies on typical load curves obtained by clustering.
- In facing numerous users on an urban scale, an energy-efficient selection method is required to quickly identify the potential building users for different DR programs, which is very important for the utility or the load aggregators.
To fill the above gaps, this study proposes a user energy portrait-based method to identify potential DR consumers for different DR programs. Eight task-oriented portrait features are used to describe consumption characteristics for a large number of building users in urban areas. Clustering based on the proposed portrait features was adopted to identify potential users from existing users, and tagging technology is used to label users’ potential level. Then, a classification model was built based on clustering and tagging results and was used to identify the potential pattern for new users. With this approach, the transmission system operators (TSOs), DR providers, and independent aggregators can directly select qualified users to participate in DR regulation.
The remainder of this paper is structured as follows. The method used to identify suitable candidates for DR tasks based on the user portrait is detailed in Section 2. The data information of building users in an urban area of China for testing the method is presented in Section 3. In Section 4, the performance of the method is analyzed. In Section 5, potential applications of the method in the future and the results are discussed. The conclusions are summarized in Section 6.
2. Electricity Pattern Characterization and Portrait-Based Identification Method
The proposed method to identify potential users for DR is presented in this section. Portrait features are proposed and detailed implementation steps of the method are introduced in detail.
2.1. Features for User Portrait Description
Eight portrait features are proposed to accurately characterize consumers and assess their potential for participation in various DR tasks. In most cities in China, time-of-use tariffs are implemented to flatten power demand profiles. These tariffs typically divide the day into up to four periods: valley, flat, peak, and critical peak. Four features of the energy consumption ratio during each period were chosen to represent the power consumption proportion during different periods, which are the consumption ratio during the peak period (CRPP), the consumption ratio during the critical peak period (CRCPP), the consumption ratio during the flat period (CRFP), and the consumption ratio during the valley period (CRVP). These indicators can be used to describe users’ energy consumption behavior at different periods. After users’ energy consumption preferences during different periods are determined, their ability for load shifting and peak shaving can be evaluated. In addition, the peak–valley difference rate (PVDR) was proposed to reflect the energy consumption imbalance of demand users.
- (1)
- Energy consumption ratio during the peak period (CRPP): This indicates the energy proportion consumed during the peak period compared to the total energy consumption over the entire analysis period.where Pd is a vector containing the energy consumption for an entire day, Pd,peak is a vector containing the energy consumption during the peak period of a day, D represents the number of days covered by the collected data, and the subscript sum denotes summation.
- (2)
- Energy consumption ratio during the critical peak period (CRCPP): This indicates the energy proportion consumed during the critical peak period compared to the total energy consumption over the entire analysis period.where Pd,critical peak is a vector containing the energy data during the critical peak period of a day.
- (3)
- Energy consumption ratio during the flat period (CRFP): This indicates the energy proportion consumed during the flat period compared to the total energy consumption over the entire analysis period.where Pd,flat is a vector containing the energy consumption data during the flat period of a day.
- (4)
- Energy consumption ratio during the valley period (CRVP): This indicates the energy proportion consumed during the valley period compared to the total energy consumption over the entire analysis period.where Pd,valley is a vector containing the energy consumption data during the valley period of a day.
- (5)
- Peak–valley difference rate (PVDR): This reflects the energy fluctuation during the analysis period. The following equation is an example based on one month.where the subscript max, min, and ave denote the maximum, minimum, and average values, respectively.
For monthly peak shaving, three indicators to quantify users’ energy consumption characteristics were proposed to capture the magnitude and time of high demands, aiming to assess the demand reduction potential. They are the peak demand during the analysis period (PD), demand optimization rate for a given response time (DOR), and time required to obtain the expected demand reduction (TREDR). The magnitude is represented by the peak demand and the demand optimization rate. The peak demand denotes the scale of consumers’ energy consumption. The demand optimization rate reflects the degree of the peak demand after monthly peak shaving, with a larger demand optimization rate implying a smaller power reduction rate via peak shaving. The required adjustment time reflects the effort users should pay, which measures the duration used by a certain demand reduction.
- (6)
- Peak demand during the analysis period (PD): This is the scale of energy consumed during the analysis period.where P is a vector containing all energy consumption data during the analysis period.
- (7)
- Demand optimization rate for a given response time (DOR): This represents the ratio of the maximum monthly demand after demand response for a given m hours compared to the original monthly peak demand.where is the (m + 1)th largest demand value in descending order of all energy consumption data during the analysis period. m can be adjusted for specific DR tasks according to the practical situation.
- (8)
- Time required to obtain the expected demand reduction (TREDR): This reflects the effort users must make to achieve an n% reduction in maximum demand.where N represents the total number of energy consumption data points during the analysis period. n can be adjusted for specific DR tasks according to the practical situation.
2.2. Methods and Steps to Identify Potential Users for DR
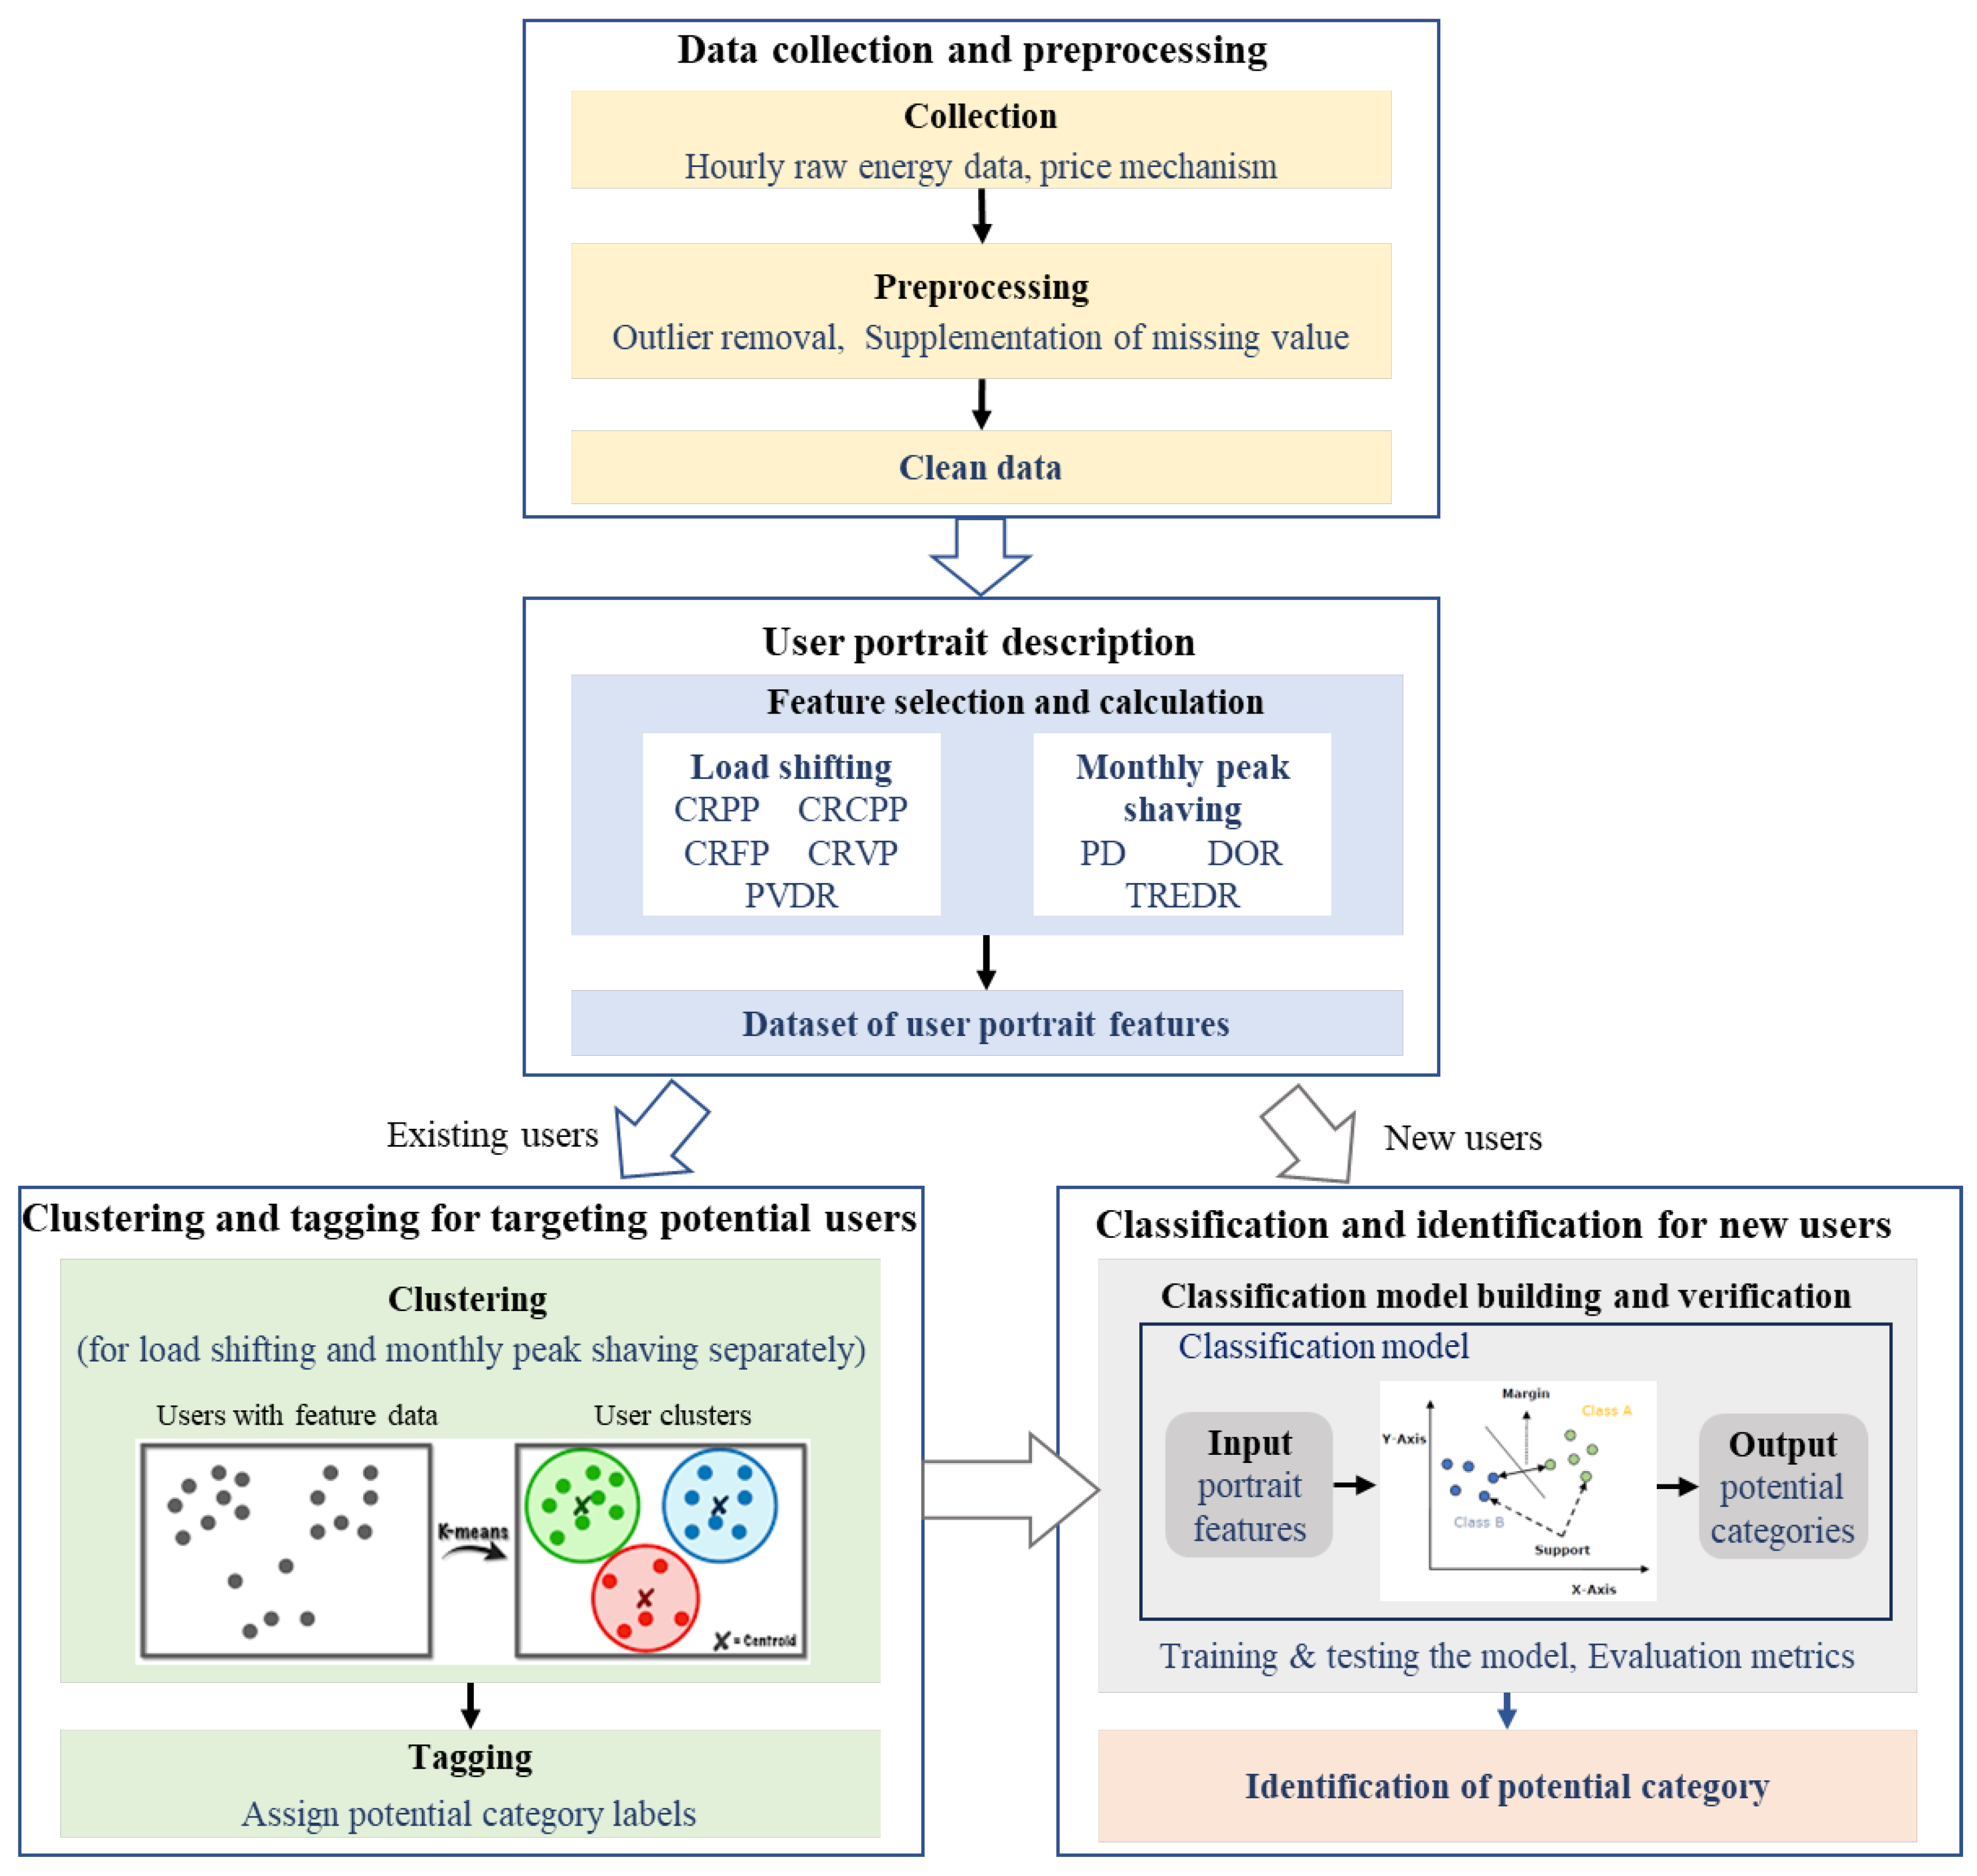
After the indicators are defined and calculated, the process of identifying and classifying the potential users for DR can start, as illustrated in Figure 1. The process consists of four major steps: data collection and preprocessing, user portrait description, clustering and tagging of existing users, and classification and identification of new users. The details of each step are as follows:

Figure 1.
Steps of the method to identify potential users based on the user portrait.
- 1.
- Data collection and preprocessing
The energy-related data mainly includes basic properties, energy consumption, price mechanism, weather data, etc. The energy consumption data are typically recorded by utility companies at intervals of 1 h or less than 1 h. However, the raw energy consumption data often suffer from transmission errors, equipment malfunctions, intentional destruction, and other factors, leading to missing values, anomalous points, mismatched types, etc. [43,44]. It is necessary to preprocess the raw energy consumption data. Key preprocessing steps in this paper include data cleaning and transformation. Major data cleaning processes involve preliminary screening of users, handling missing data, and eliminating outliers. Preliminary screening excludes users with poor data quality. All data of each user are organized in the same format for subsequent analysis.
- 2.
- User portrait description
Eight portrait features are selected for load shifting and monthly peak shaving, and are shown in Section 2.1. User portrait features can be described based on the energy consumption data. Five portrait features, including CRPP, CRCPP, CRFP, CRVP, and PVDR, are used to generate the user portrait for load shifting. Three portrait features, including PD, DOR, and TREDR, are used to generate the user portrait for monthly peak shaving.
- 3.
- Clustering and tagging of existing users
Clustering is used to identify potential users from existing users for whom energy consumption data was collected during the initial analysis phase. The user portrait feature serves as the input for clustering algorithms. The widely used method of K-means clustering is employed in this paper, considering its advantages of high computational efficiency and clear interpretability. k represents the preselected number of user clusters. The optimal value of k can be determined using domain knowledge and auxiliary judgment methods, such as the elbow method and the silhouette coefficient method, and the latter is used in this paper [45,46]. Two clustering processes are conducted to identify potential users for load shifting and monthly peak shaving tasks. The characteristics of each cluster can be obtained through comparative analysis. The potential of different clusters can be determined. Tag technology enables visualization of the DR potential across different user clusters.
- 4.
- Classification and identification of new users
After the clustering results and tags are obtained, the classification model can be developed to identify new users. Common classifiers include linear classifiers, decision trees, random forests, etc. Support vector machine (SVM) is chosen for user classification due to its robustness with small sample sizes and its widespread application in classification tasks. It operates by representing data points in high-dimensional space and determining the optimal boundary to separate the data into distinct classes [47]. Two classification models are constructed to assess the users’ potential in different DR programs based on clustering and tagging results in Step 3. The user portrait feature and potential category labels of two DR tasks are set as the input and output of the SVM classifiers.
The performance of the classification model is typically evaluated using metrics such as the accuracy and confusion matrix, as selected by this paper. Accuracy measures the rate of correct predictions, and it is equal to the ratio of the number of correct predictions and the total number of predictions of the classification model. A confusion matrix is a table that provides insights into the classification model’s performance in each category. The category that new users belong to can be identified based on the validated classification model.
3. Users and Energy Consumption Data Introduction
The energy consumption data of urban users collected by a smart meter in a city in China were used to demonstrate the proposed approach for identifying DR potential users. A total of 5864 users were involved, with contracted transformer capacities varying from 4 to 360,000 kVA. The energy consumption data between 1 December 2019 to 15 November 2020 was collected with a time step of one hour. The data include users’ basic properties, real-time voltage and current of the power system, as well as the price mechanism. Sparse missing values were interpolated linearly based on historical data. Users or dates with extensive missing data were removed. The process of handling outliers involved identification and elimination. Boxplots were employed in this paper to identify extreme outliers. Once identified, outliers were replaced using the same approach applied for missing data imputation. Then, data transformation was conducted by aggregating power data from different meters of one consumer and organizing all data into a uniform format.
Considering the quality issues associated with raw energy consumption data, certain screening principles were established and implemented to filter consumers. The screening process included the following steps:
- P1: Exclude users with a transformer contracted capacity of less than 315 kVA. Users with large capacities are of concern, considering the demand response efficiency.
- P2: Filter users with insufficient recorded data. Users with data of less than 300 days are removed.
- P3: Eliminate users with obvious data quality issues, such as null or zero values exceeding 50% of the total data size.
- P4: Remove users with many missing values, specifically those with an average of more than 500 missing data points per meter after statistical analysis.
- P5: Exclude users equipped with renewable energy. The energy consumption data of users with renewable energy generation are often negative.
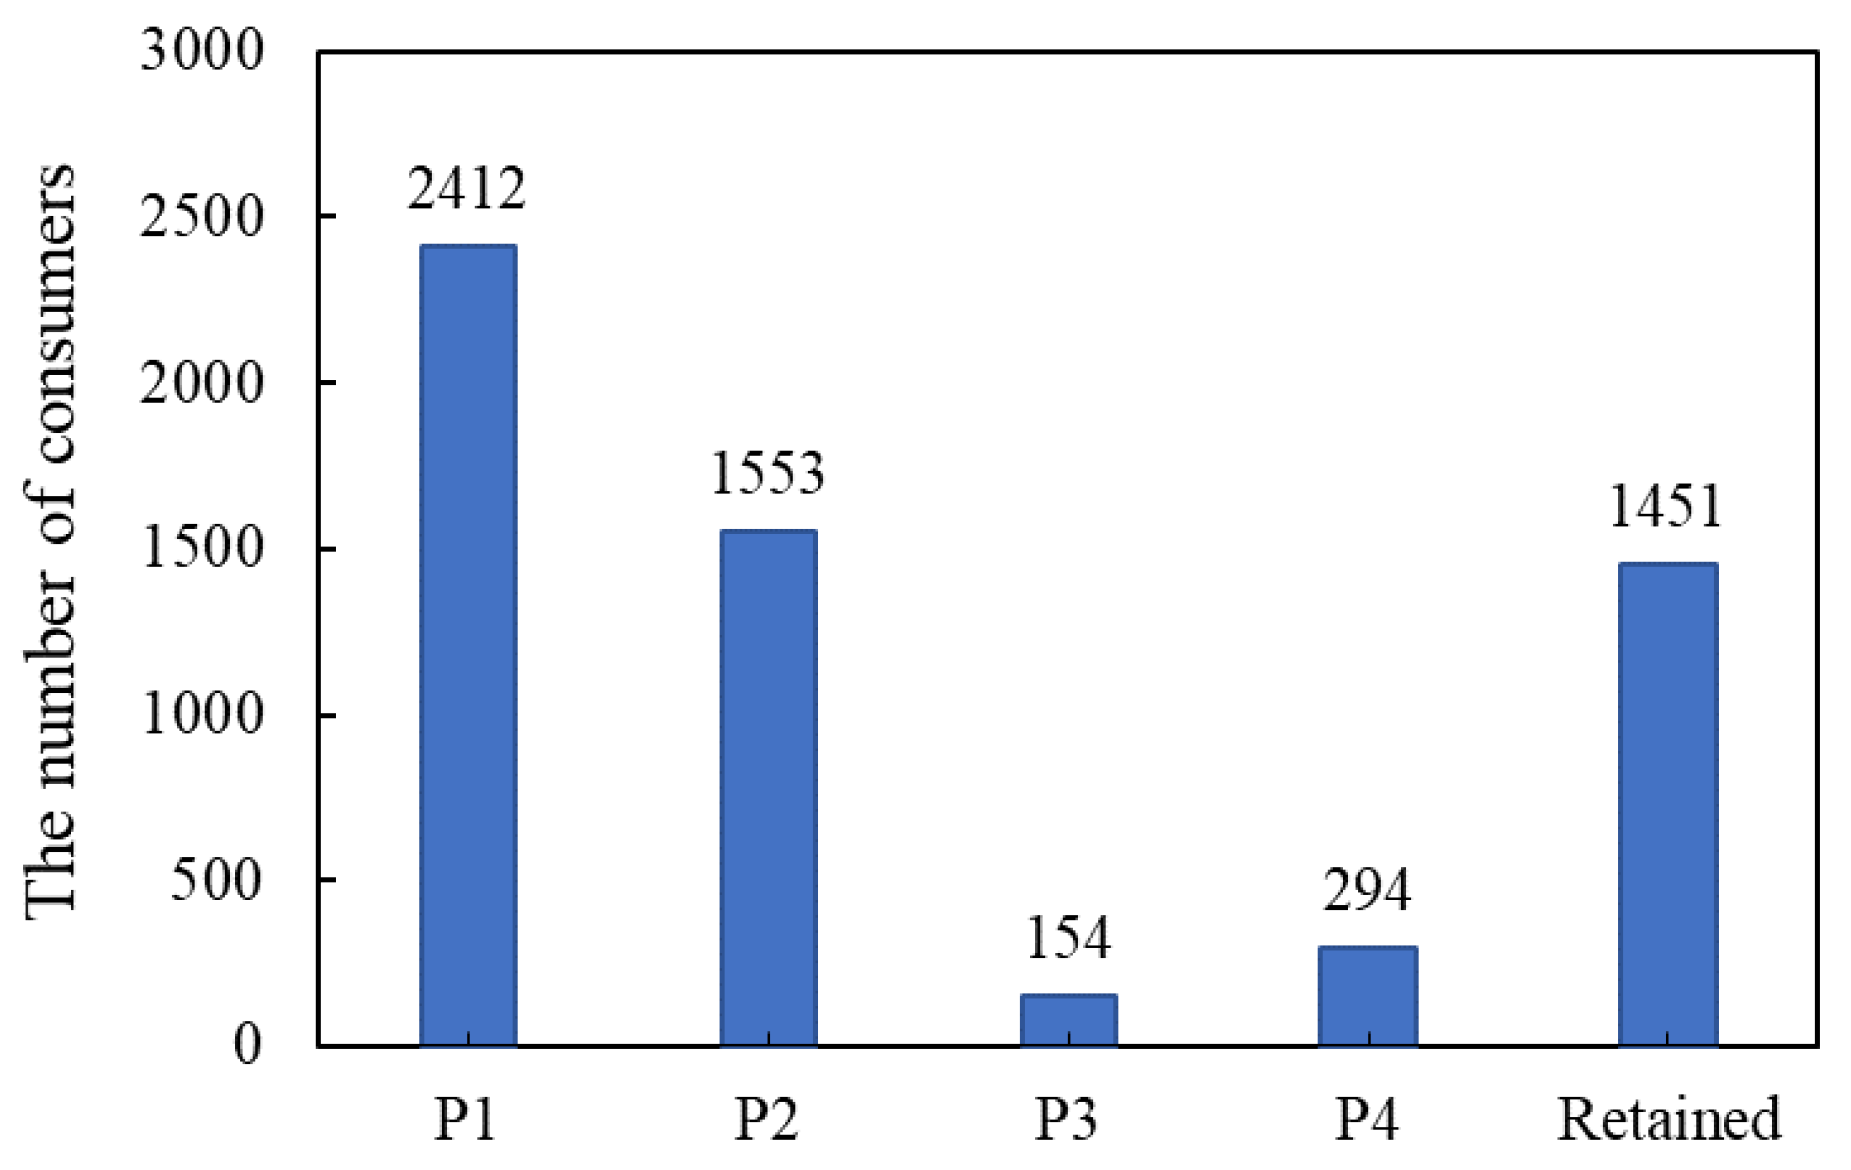
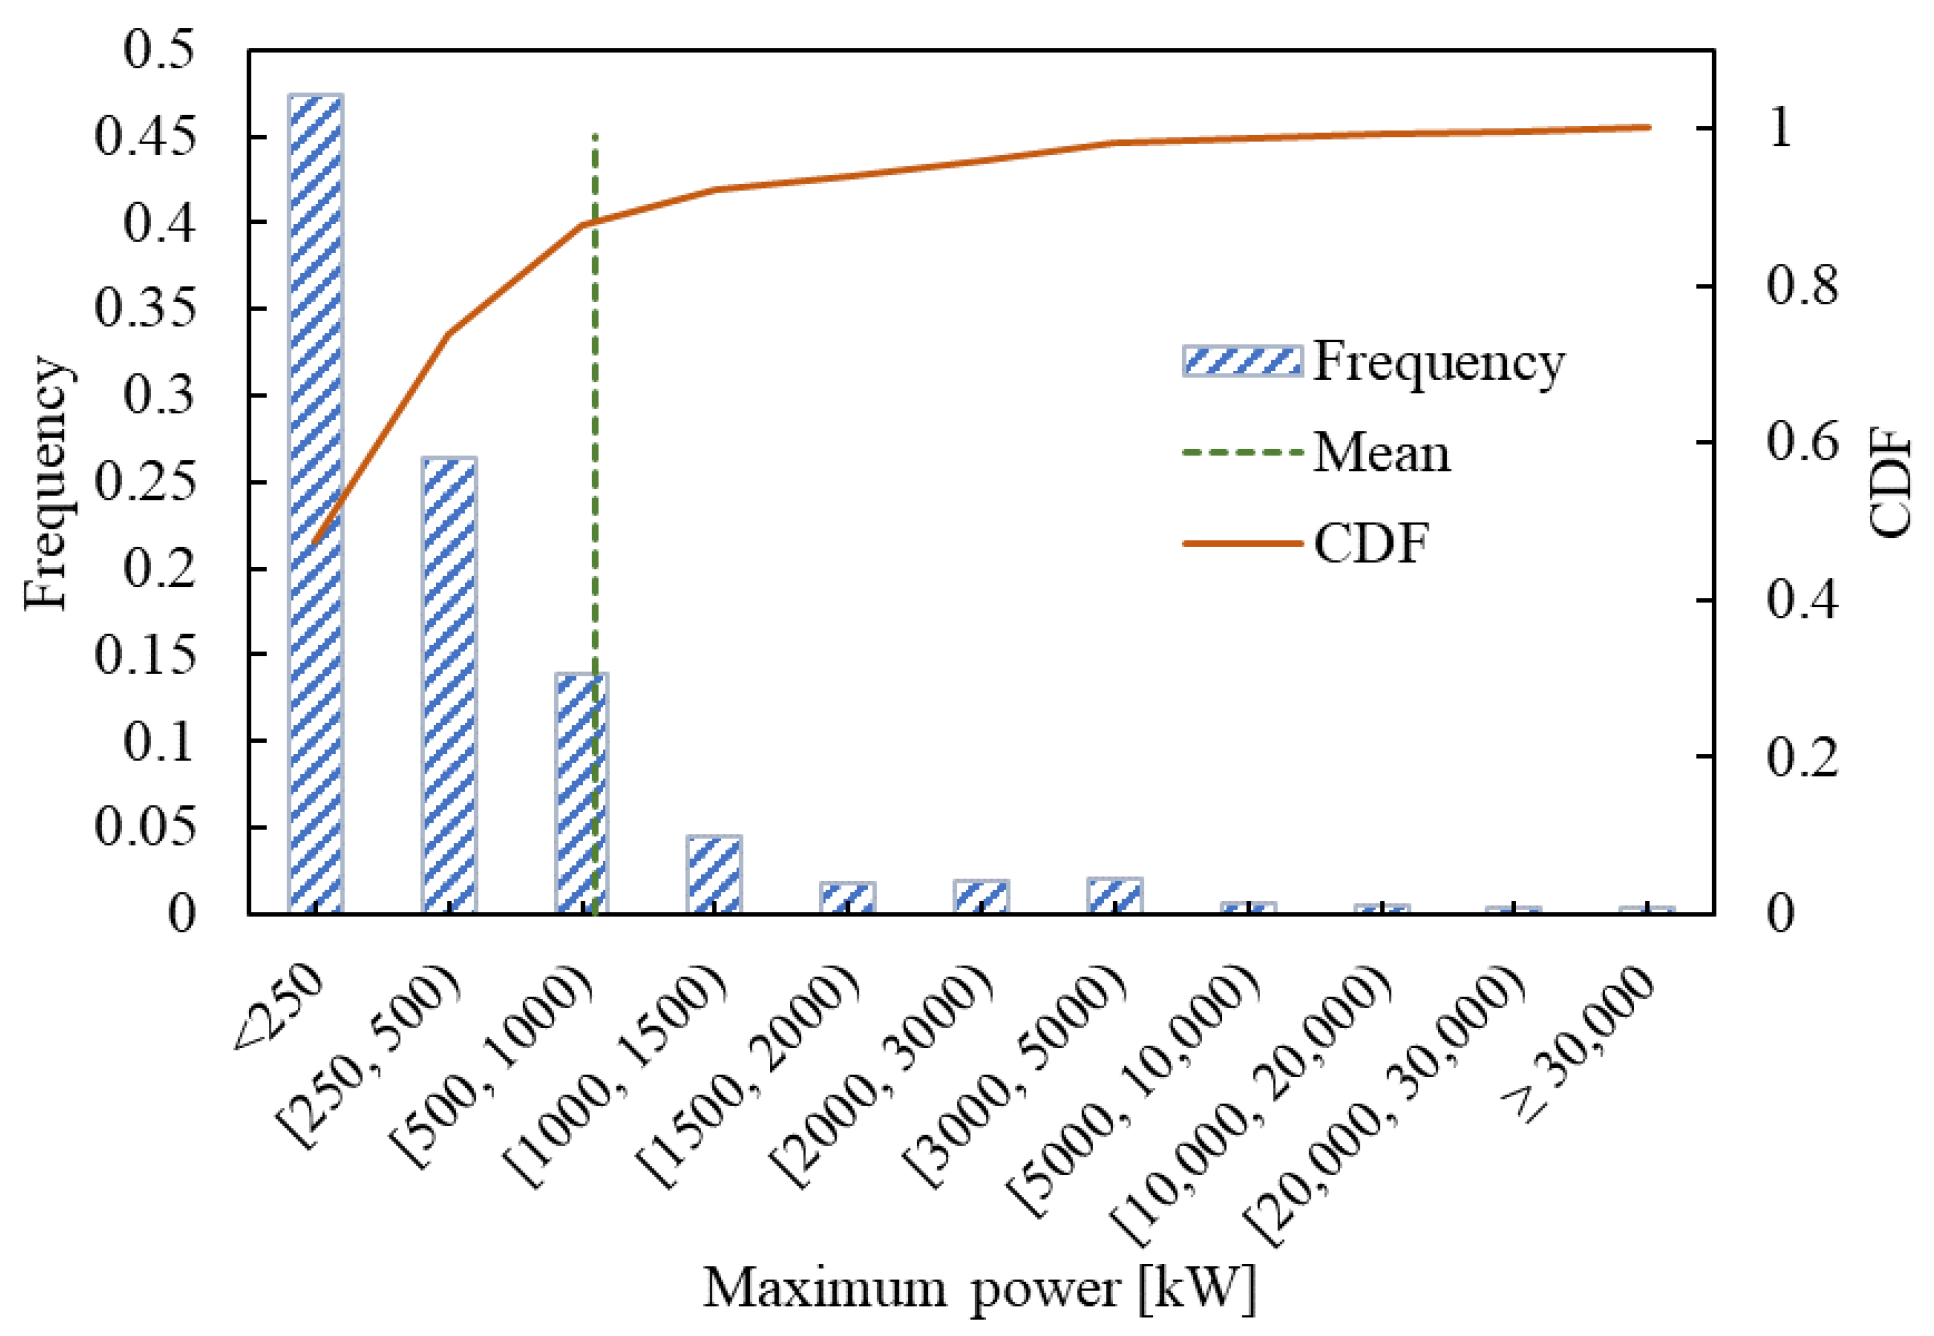
The numbers of users are shown in Figure 2 based on the aforementioned screening criteria. Finally, 1427 consumers were retained with acceptable data quality. Figure 3 displays the distribution of the retained users’ peak demand, ranging from 21.5 kW to 5121.6 kW. The majority have a maximum power of less than 1000 kW, contributing to over 87.7% of the total users. The average maximum power for all the users is 1046.7 kW, which corresponds to 0.88 on the cumulative density function (CDF) curve. This implies that approximately 88% of users have a maximum power lower than the average value.
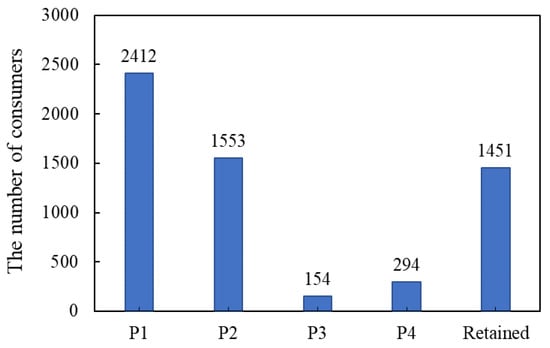
Figure 2.
Consumer numbers filtered under each principle (P1~P5).

Figure 3.
Distribution of the peak demand of the retained users.
The distribution of the retained users in different industries is presented in Figure 4. The industry information of 154 users (11% of the 1427 users) is not recorded in the smart meter platform. Of the remaining users, 1% belong to primary industries, 39% belong to secondary industries, 39% belong to tertiary industries, 6% are urban resident users, and 4% are rural resident users. The hourly power consumption of six users from different industries is shown in Figure 5. This shows that the power data of all six users were interrupted from 5 January 2020 to 31 January 2020, which is due to the lockdown of the city during COVID-19. It can be seen that all six users were affected by COVID-19 to different degrees. U3 had lower energy consumption until September because it is a university and did not re-open until the fall semesters of 2021 due to the lockdown and a strict epidemic prevention policy.
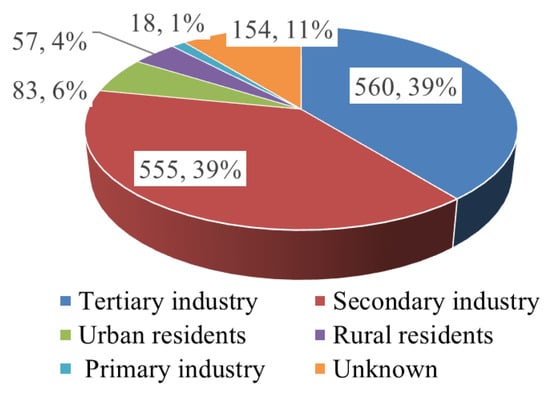
Figure 4.
Industry distribution of retained users.
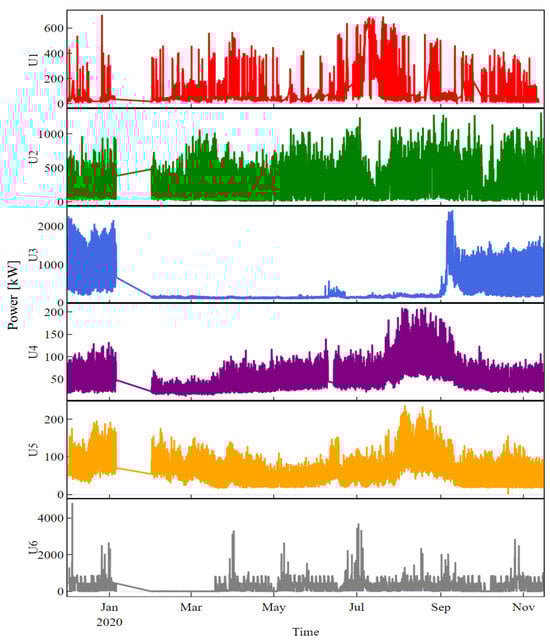
Figure 5.
Annual hourly energy consumption of six users from different industries (U1—primary industry, U2—secondary industry, U3—tertiary industry, U4—urban residents, U5—rural residents, U6—unknown).
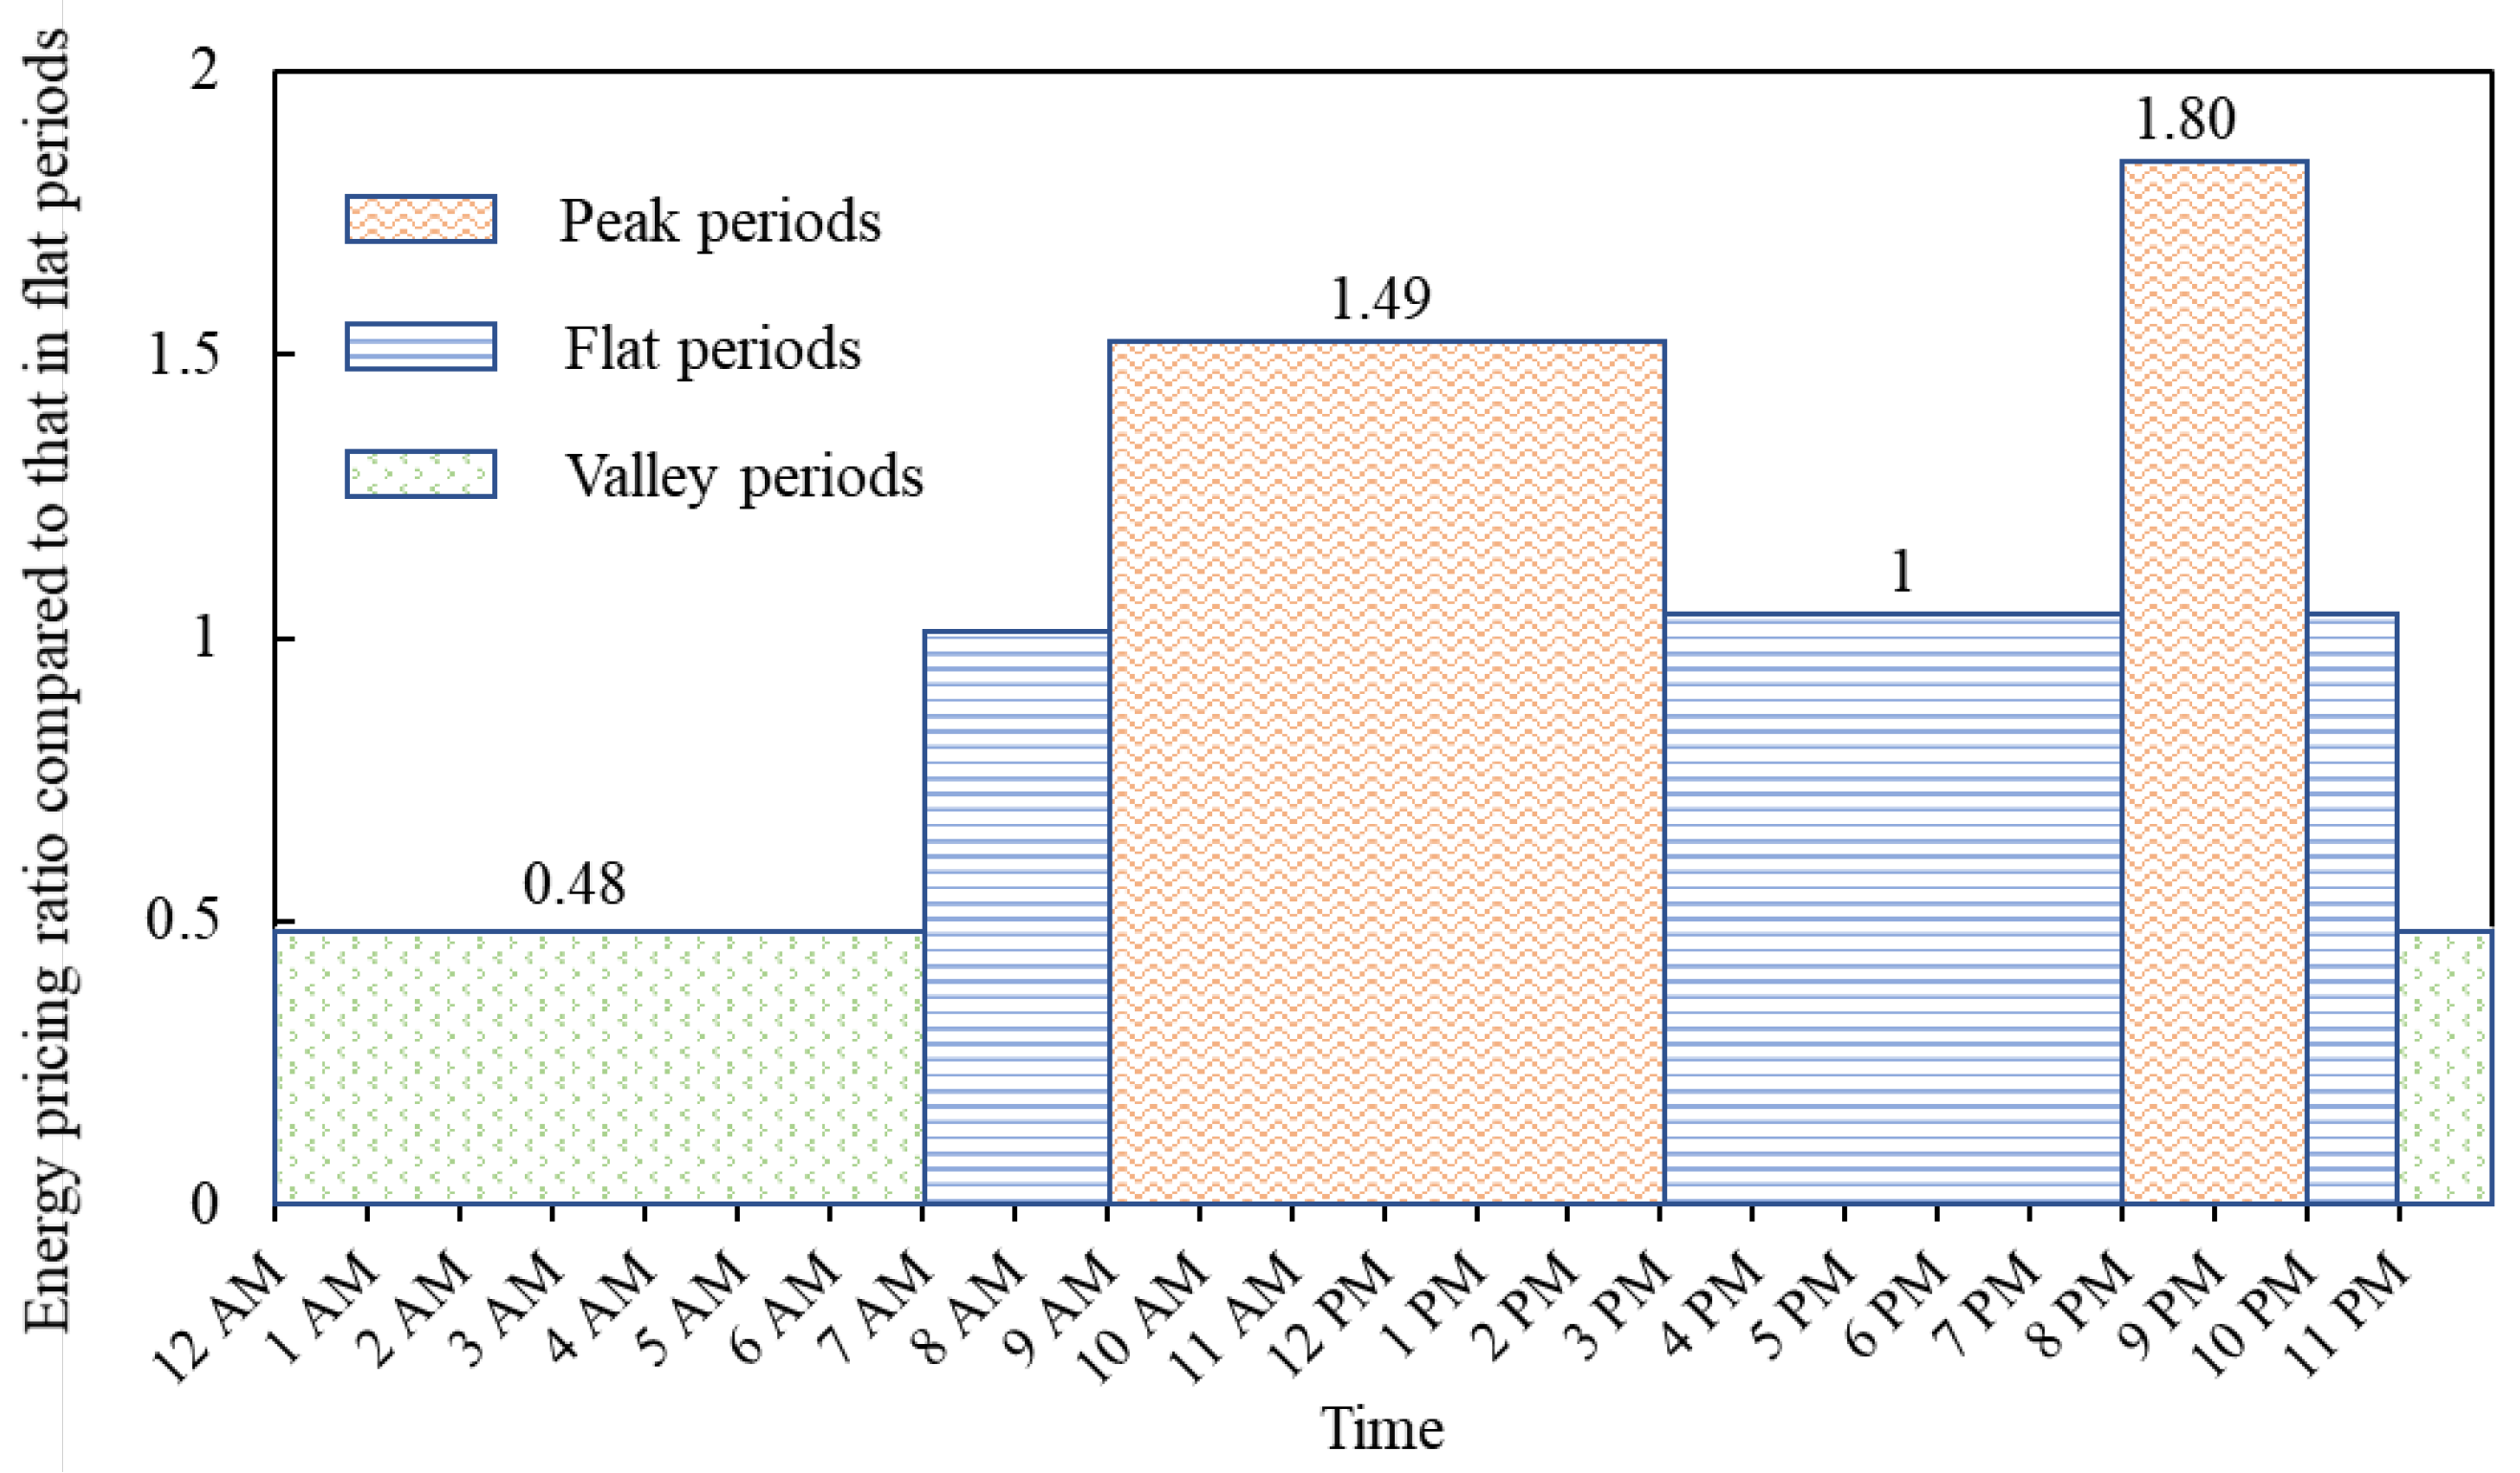
A time-of-use tariff was implemented in the city as shown in Figure 6 [41]. The division of peak, flat, and valley hours can be described as follows: (1) the peak period includes the normal peak period (9 a.m. to 3 p.m.) and critical peak period (from 8 p.m. to 10 p.m.); (2) the flat period spans from 7 a.m. to 9 a.m., 3 p.m. to 8 p.m. and 10 p.m. to 11 p.m.; and (3) the valley period spans from 11 p.m. to 7 a.m. of the next day. It was observed that each segment consists of eight hours. Different heights of rectangles represent the relative charge price. If the price during the flat period is taken as the benchmark, which is 1, the relative prices for critical peak periods, normal peak periods, and valley periods are 1.8, 1.49, and 0.48. It can be seen that the difference is quite large. To calculate the power demand optimization rate (DOR) and the required adjustment time (TREDR), two variables need to be determined, including the expected response time and demand reduction rate. The response time in one month (m) was set as 20 h in this paper, which means that the response time is less than 20 h per month. The expected demand reduction percentage (n) was assigned as 20%. m and n can be adjusted based on the preference of users or the utility.
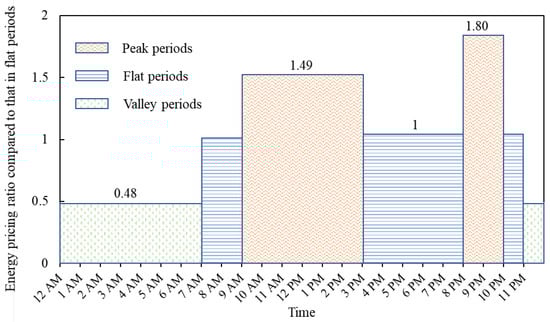
Figure 6.
The time division and time of use tariff in the city.
4. Results Analysis
4.1. Potential User Targeting Results for Load Shifting
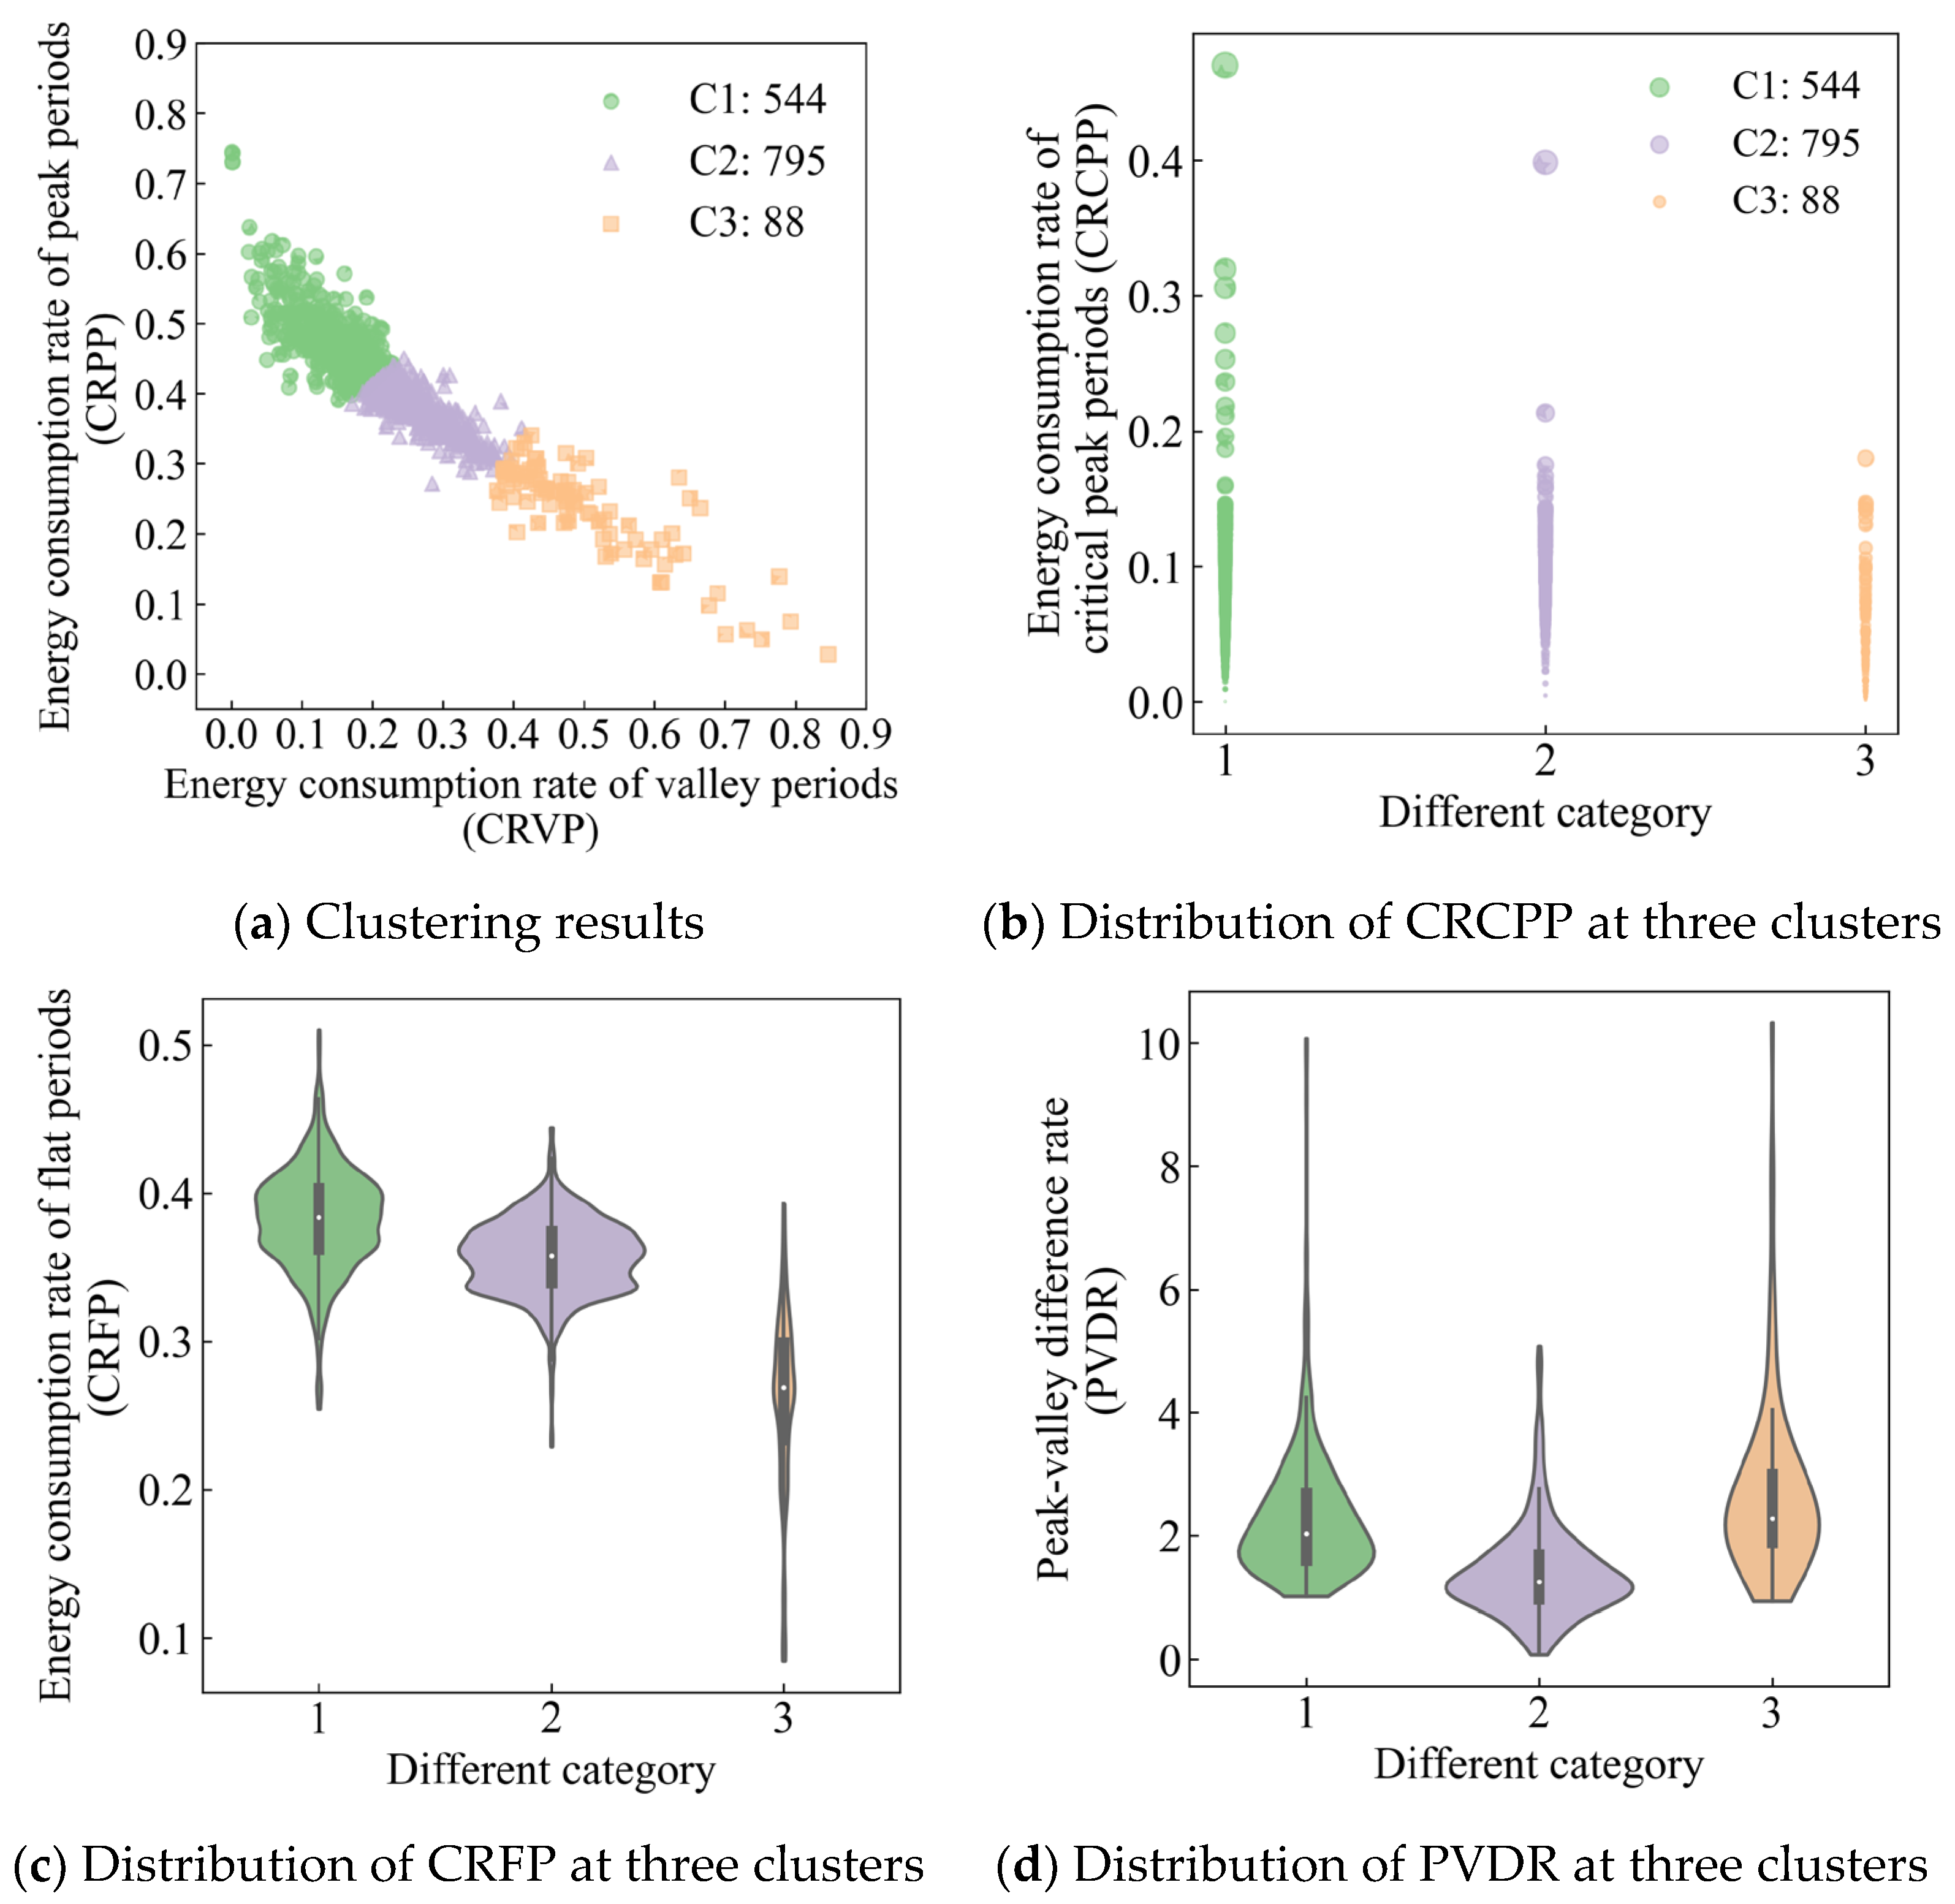
The selection results of users with load shifting potential are introduced in this part. Considering the correlation between CRPP and PVDR, only CRPP and CRVP were selected as clustering features after trying different combinations. The optimal k was set to 3, due to the energy consumption preferences of users. The clustering results and the distribution of the remaining features for identifying potential users are displayed in Figure 7. In Figure 7a, three clusters (C1, C2, and C3) are depicted, with 544 consumers in C1, 795 consumers in C2, and 88 consumers in C3. Users in C1 show higher CRPP values and lower CRVP values compared to users in the other clusters, so they use more energy during the peak hours than during valley hours. Conversely, users in C3 exhibit opposite behaviors, with higher CRVP values and lower CRPP values, indicating a preference for energy consumption during the valley hours. Users in C2 demonstrate moderate values for both CRPP and CRVP, indicating comparable energy usage between peak and valley periods. Figure 7b shows that some users in C1 exhibit higher energy consumption rates during critical peak periods. TSOs and other DR providers should prioritize attention to these users, particularly those with CRCPP values over 0.25, to alleviate power supply pressure during critical peak periods. In Figure 7c, the values of CRFP for C1, C2, and C3 are primarily distributed within the ranges of [0.36, 0.42], [0.33, 0.38], and [0.26, 0.31], respectively. This suggests that users with higher energy usage during peak periods are also more likely to consume during flat periods. Additionally, as shown in Figure 7d, the values of PVDR for C1 and C3 are generally higher than those for C2, with some users in C1 and C3 exhibiting significant energy consumption imbalances. This indicates a substantial potential for these users to respond to DR measures. In summary, clusters C1, C2, and C3 can be categorized as ‘peak period preference’, ‘peak valley balance’, and ‘valley period preference’, respectively. According to the identification results, the local utility or load aggregators can identify consumers with different categories for load shifting.
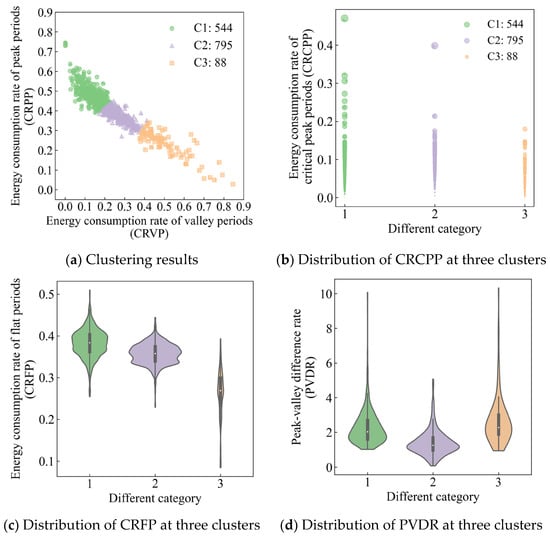
Figure 7.
Clustering results and feature distribution for targeting potential users of load shifting.
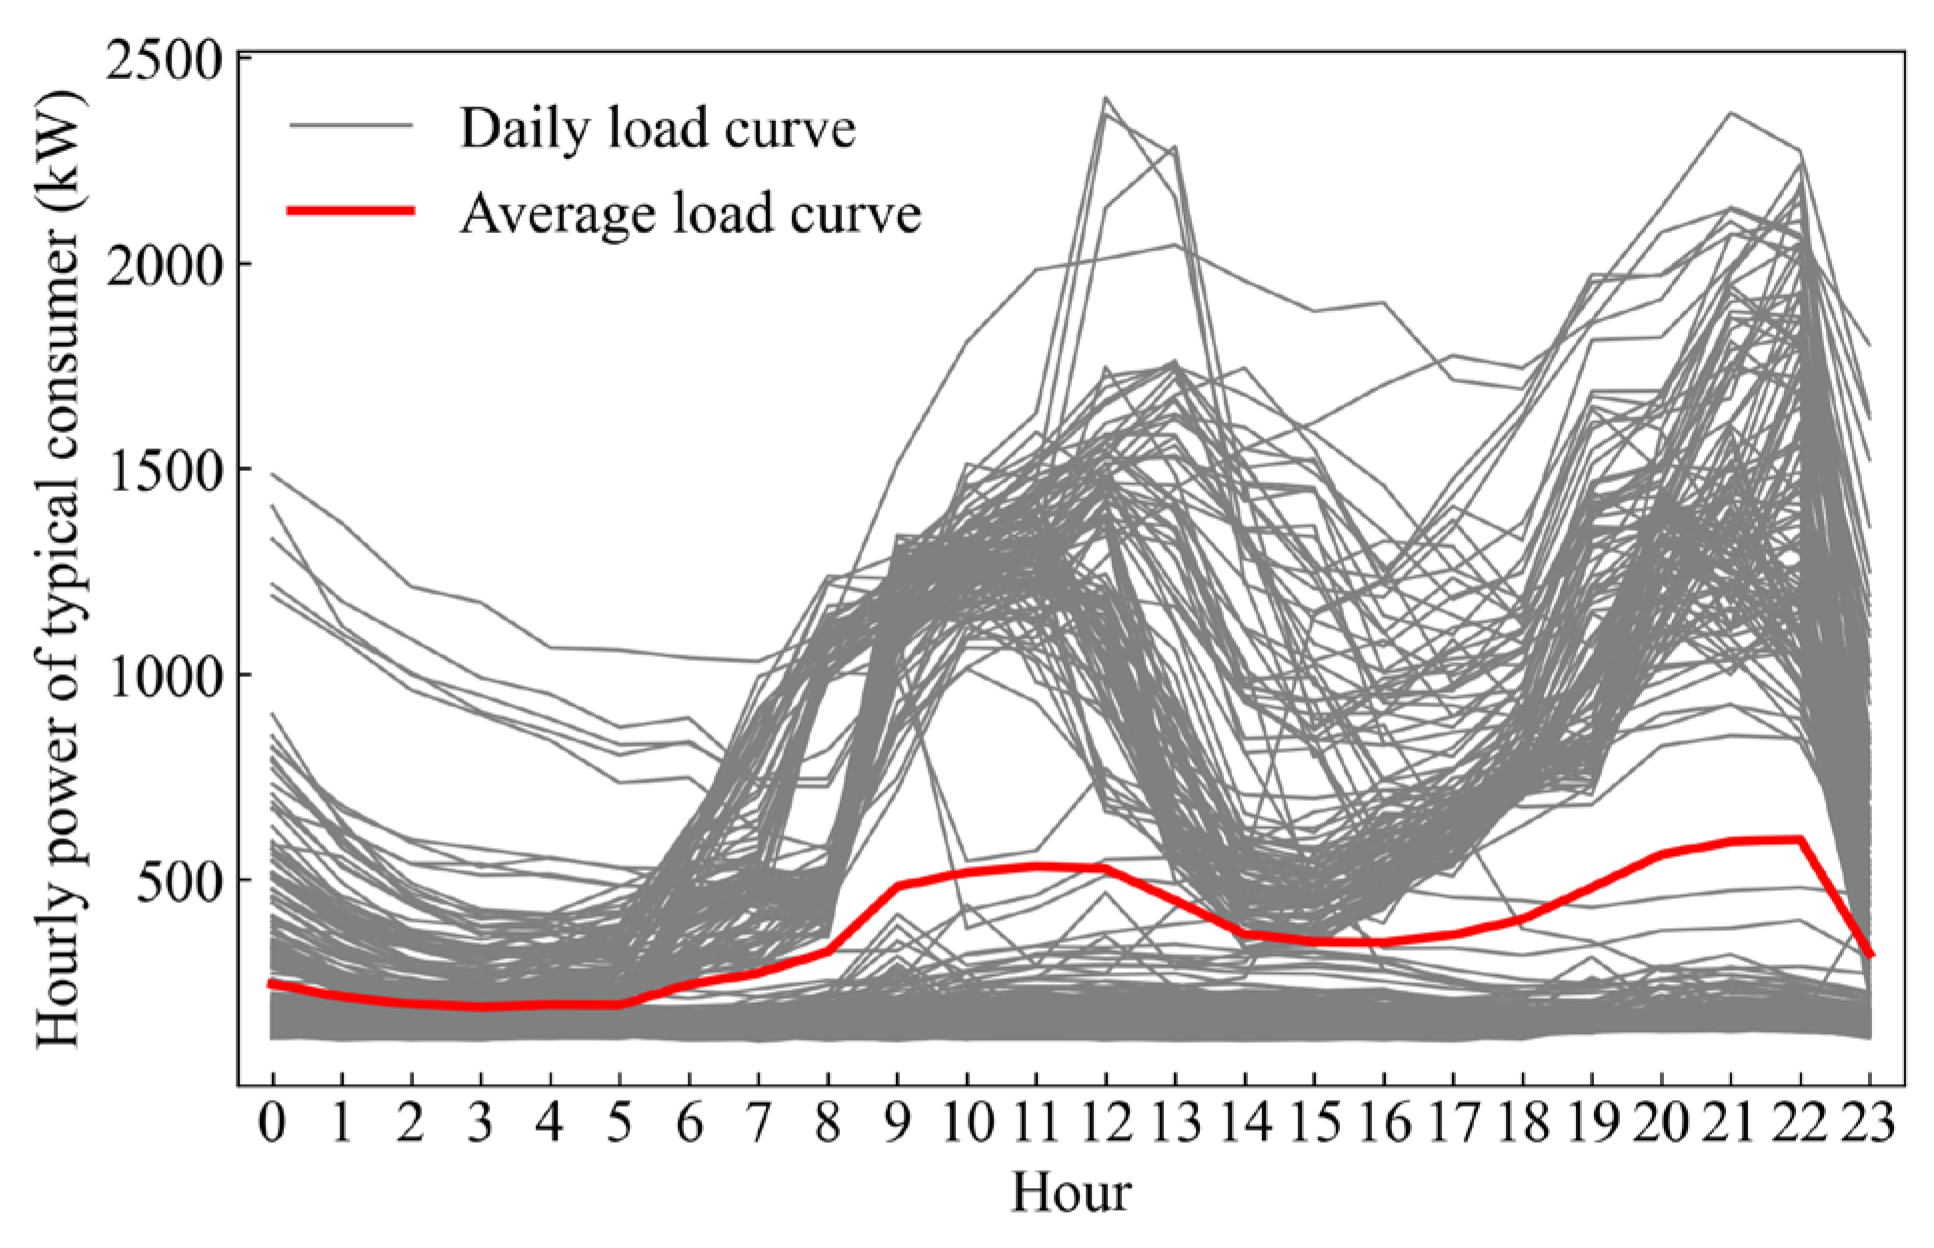
To validate the effectiveness of clustering and tagging, the user U3, which was randomly selected from cluster C1 labeled as ‘peak period preference’, was analyzed. U3′s daily load curves from 1 December 2019 to 15 November 2020 are shown in Figure 8. The thin gray lines depict the actual load curve for each day, while the thick red line represents the average load curve. The shape of the curves shows that the energy consumption of U3 is high from 9 a.m. to 2 p.m. and 8 p.m. to 10 p.m., consistent with the peak periods in the TOU tariff. This confirms the accuracy and effectiveness of the targeting results for potential users of load shifting.
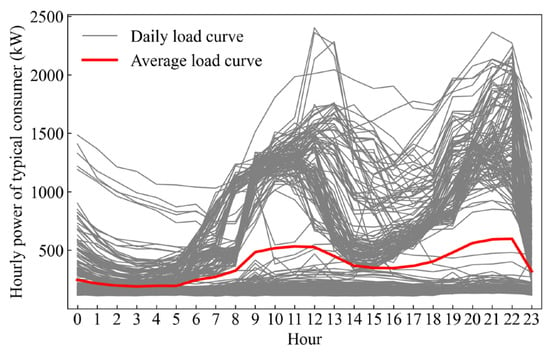
Figure 8.
Daily load curves of a typical consumer in C1.
4.2. Potential User Targeting Results for Monthly Peak Shaving
To mitigate the influence of the correlation between PD and DOR on the analysis results, DOR and TREDR were selected as the clustering features to identify potential users with monthly peak shaving. To determine the optimal number of clusters, silhouette scores were computed based on the Euclidean distance [48] with different k values. The k value spans from 2 to 12. The highest silhouette score was achieved when k is 4, which means that the best cluster for the users is 4.
The clustering results and feature distribution for identifying potential users of monthly peak shaving are shown in Figure 9. There are 869 (60.9%), 470 (32.9%), 75 (5.3%), and 13 (0.9%) consumers in clusters S1, S2, S3, and S4, respectively. Users in S2 and S3 have relatively small TREDR values, indicating that they require less time to achieve a 20% optimization rate of monthly peak demand. Additionally, users in S2 have a larger DOR than those in S3, suggesting that users in S3 can achieve a higher demand reduction rate compared to those in S2 when the response time lasts for 20 h for one month. On the other hand, users in S1 and S4 have larger TREDR values, indicating that they need more time to achieve the same optimization rate compared to S2 and S3. In particular, the time required for users in S4 is so long that it would affect the users significantly. Moreover, the DOR values of S1 and S4 are greater than those of the other two clusters, which means that users in S1 and S4 have lower demand reduction rates, suggesting that they require disproportionate effort to achieve significant results. The distribution of the peak demand for users in different categories is shown in Figure 9b, and it varies significantly. Some users in S1 have a maximum power of over 10,000 kW. This indicates that these users can obtain a substantial absolute demand reduction in a given time, which is still meaningful for relieving stress on power systems. In summary, the descending order of monthly peak shaving potential for different clusters is S3, S2, S1, and S4. These clusters can be labeled as ‘optimal for monthly peak shaving’ (S3), ‘suboptimal for monthly peak shaving’ (S2), ‘conditional for monthly peak shaving’ (S1), and ‘weak for monthly peak shaving’ (S4). By considering these potential differences, TSOs can prioritize users for monthly peak shaving, which can help improve the overall reliability of the grid.
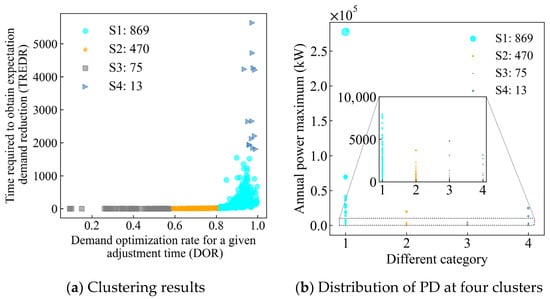
Figure 9.
Clustering results and PD distribution for targeting potential users of monthly peak shaving.
A representative user, U5 from S3 with ‘the optimal potential for monthly peak shaving’, was selected to analyze its economic benefits resulting from a 20% reduction in monthly peak demand. The response time required each month to achieve the desired demand reduction rate is illustrated in Figure 10, fand ranges from 1 to 28 h. The response time required for February is excluded because the energy consumption data are abnormal due to the production shutdown during COVID-19. In most months, the typical user only requires 1 to 4 h of response time, leading to savings of 15,420 to 36,435 CNY for the demand charge in electricity bills, based on a demand price of 38 CNY/kW. The savings will increase with higher pricing scenarios. The yearly total demand cost saving is 229,500 CNY, which is quite attractive by only adjusting the energy behavior in very limited hours.
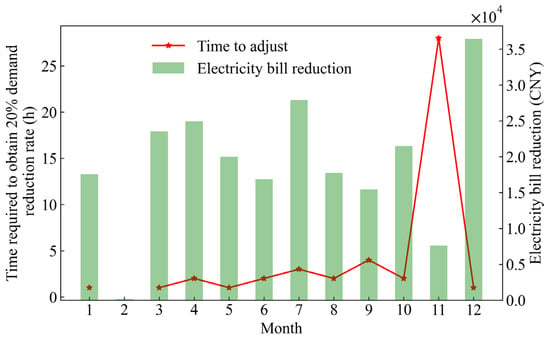
Figure 10.
Response time required and economic benefits obtained for a typical user in S3 under the 20% monthly peak demand reduction.
4.3. Identification Results of the Classification Model
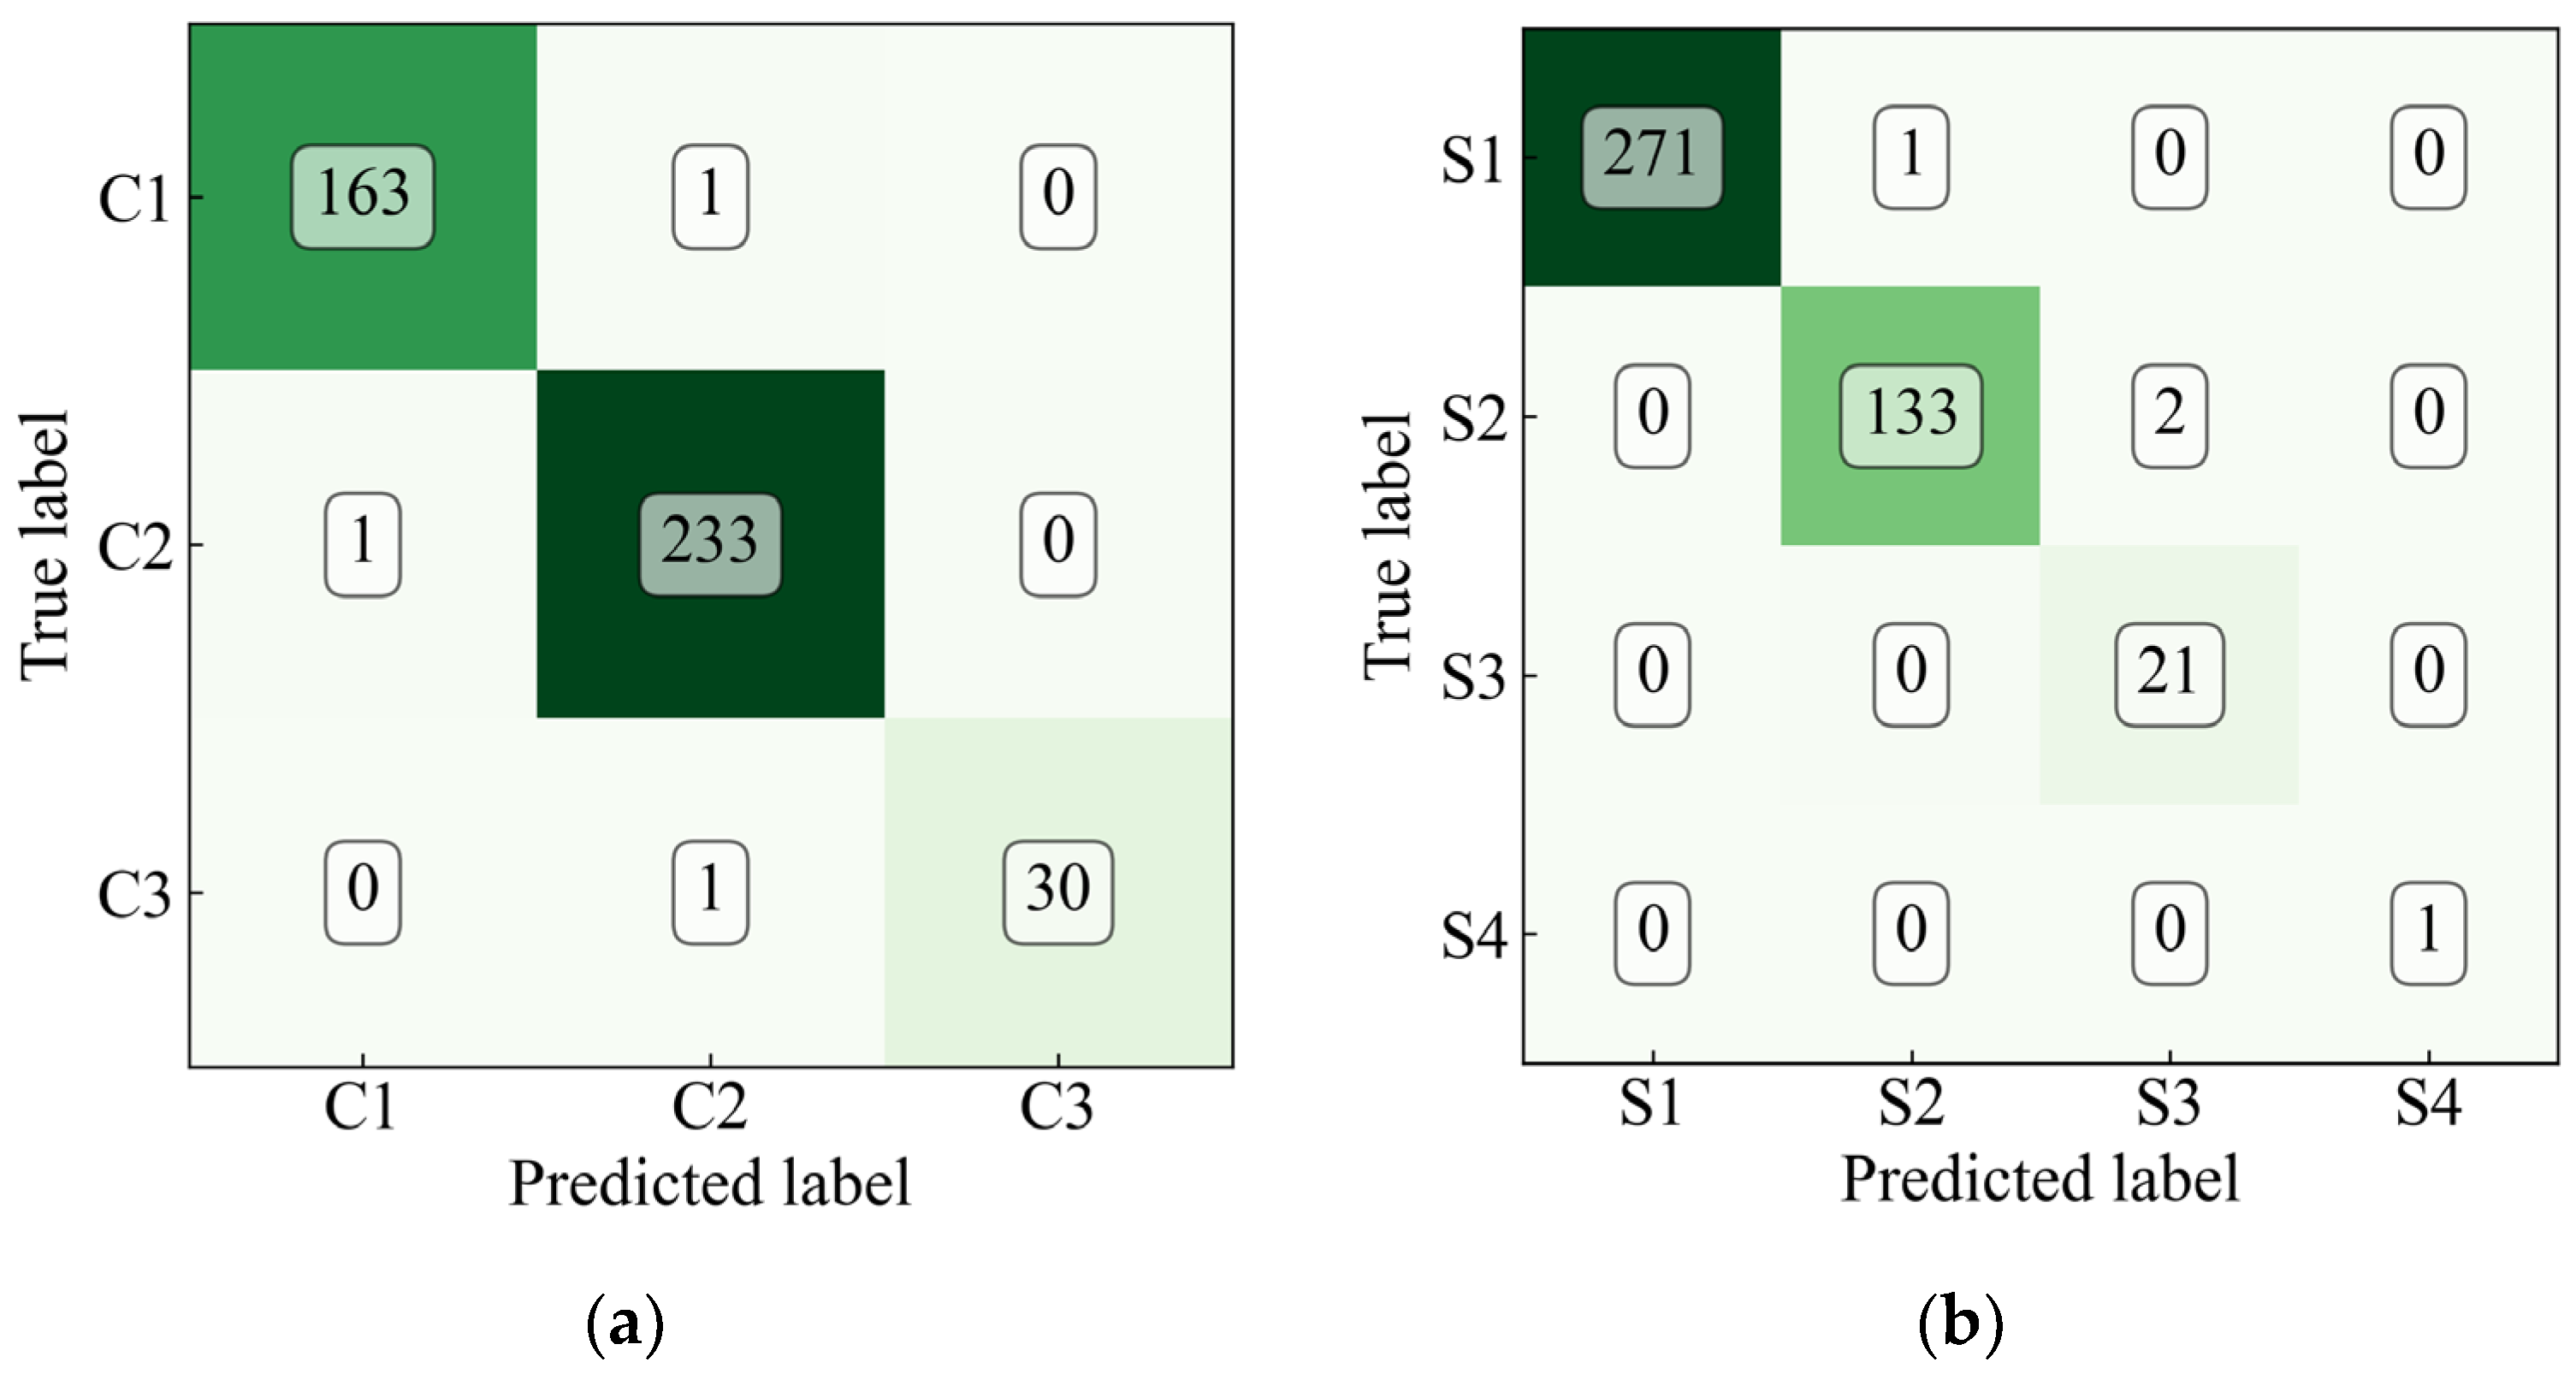
Two SVM classification models were constructed to identify the potential categories for load shifting and monthly peak shaving of new users. To ensure the robustness of the training model, the dataset was shuffled before splitting. The training and testing samples used to validate the model were divided with a ratio of 7:3. Then, the model parameters were determined through a 3-fold cross-validation to mitigate the risk of overfitting. The accuracy results of the two classification models are displayed in Table 1, indicating that the accuracy of both classification models exceeds 99% in both the training and testing samples. The confusion matrix is depicted in Figure 11. It shows that only a very limited number of consumers (1 and 2) are miscategorized by the load shifting classification model in C1 and C2. For the monthly peak shaving scenario, the model also has very few (1 and 2) misclassifications for S2 and S3, respectively. Therefore, it can be concluded that the classification model exhibits good performance for identifying potential DR consumers.

Table 1.
The accuracy of the two classification models.
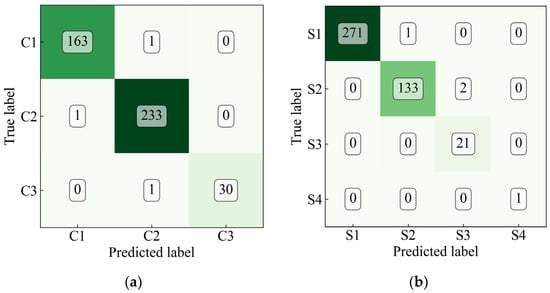
Figure 11.
The confusion matrix of the test set of the two classification models: (a) load shifting and (b) monthly peak shaving.
5. Discussion
User clusters with different energy consumption patterns and optimization potential levels were obtained using the clustering and tagging technology in this paper. Users labeled as ‘peak period preference’ consume high energy during the peak period, and have considerable potential to participate in load shifting and shaving. When the price of energy storage such as batteries is reasonable and the time-of-use tariff is attractive, energy storage can be installed. The users can benefit from lower bills and the stress of peak energy demand can be alleviated for the utility.
User clusters labeled as ‘optimal for monthly peak shaving’, ‘suboptimal for monthly peak shaving’, and ‘conditional for monthly peak shaving’ have the potential for monthly peak demand. In the long run, the utility can motivate users in these clusters to decrease their peak demand by implementing incentive-based DR programs. For instance, consumers are encouraged to use energy storage technology or control flexible loads to transfer or reduce peak demand, resulting in a reduction of monthly demand charges. In addition, when the peaks of these users occur simultaneously with the peak of the grid, the peak demand of the grid can be reduced and the need for plant expansion can be deferred.
In this paper, users are identified based on their historical loads without considering production or work schedules. When they change their energy patterns, generally the work schedule or production process of users is affected, which is not considered in this paper. The energy data used in this study were collected with one-hour granularity. In practice, the data granularity can be one hour or less. The data length for load shifting can be adjusted depending on the specific evaluation task, while the data length for monthly peak shaving should be at least one month. An accurate evaluation of the benefits should be based on an in-depth investigation of the user’s energy consumption details, which will be considered at the next stage.
6. Conclusions
This paper proposes a novel approach utilizing user portraits, clustering, tag technology, and classification methods to identify potential user clusters for demand response tasks. Eight portrait features are proposed to quantify users’ energy consumption characteristics. K-means clustering and SVM classification are used to identify users with varying optimization potential. The method is tested with energy consumption data from a city in China. Key conclusions include:
- (1)
- The eight selected portrait features can effectively characterize user patterns and are suitable for main demand response programs like load shifting and monthly peak shaving at an urban scale.
- (2)
- Potential users for load shifting can be quickly and efficiently identified using five portrait features and clustering them into three clusters: ‘peak period preference’, ‘peak valley balance’, and ‘valley period preference’. In this study, 554 of 1427 consumers have strong load shift potential.
- (3)
- Potential users for monthly peak shaving can be identified using three portrait features, clustered into four categories for monthly peak shaving: ‘optimal’, ‘suboptimal’, ‘conditional’, and ‘weak’. Of these, 75 and 470 users are identified as ‘the optimal’ and ‘the suboptimal’ for monthly peak shaving, respectively. These users can receive larger reductions in electricity bills, with annual savings of 229,500 CNY after a few dozen hours of response.
- (4)
- The classification model accurately identifies the potential level of new users with around a 99% accuracy, assisting utilities in identifying users without tags.
This method provides a rapid and precise way to identify suitable users for DR programs, aiding TSOs in enhancing the grid reliability, load aggregators in selecting potential users and improving their benefits, and users in optimizing energy consumption and reducing energy costs.
Author Contributions
Conceptualization, W.G. and Y.Z.; methodology, W.G.; validation, Z.L. and M.L.; formal analysis, L.S.; investigation, W.G.; data curation, M.L.; writing—original draft preparation, Y.Z.; writing—review and editing, W.G.; visualization, Y.Z. and L.S.; supervision, W.G. and Z.L. All authors have read and agreed to the published version of the manuscript.
Funding
The research is funded by the program Research and Application of Demand Response Potential Evaluation Technologies Based on Massive Electricity Data (No. B31532238944) supported by the State Grid Hubei Electric Power Research Institute.
Data Availability Statement
The raw data supporting the conclusions of this article will be made available by the authors on request.
Conflicts of Interest
The authors declare no conflicts of interest.
References
- Ahmed Ali, K.; Ahmad, M.I.; Yusup, Y. Issues, impacts, and mitigations of carbon dioxide emissions in the building sector. Sustainability 2020, 12, 7427. [Google Scholar] [CrossRef]
- Zhao, X.; Ma, X.; Chen, B.; Shang, Y.; Song, M. Challenges toward carbon neutrality in China: Strategies and countermeasures. Resour. Conserv. Recycl. 2022, 176, 105959. [Google Scholar] [CrossRef]
- Chinmoy, L.; Iniyan, S.; Goic, R. Modeling wind power investments, policies and social benefits for deregulated electricity market—A review. Appl. Energy 2019, 242, 364–377. [Google Scholar] [CrossRef]
- Li, L.; Wang, J.; Zhong, X.; Lin, J.; Wu, N.; Zhang, Z.; Meng, C.; Wang, X.; Shah, N.; Brandon, N. Combined multi-objective optimization and agent-based modeling for a 100% renewable island energy system considering power-to-gas technology and extreme weather conditions. Appl. Energy 2022, 308, 118376. [Google Scholar] [CrossRef]
- Aryandoust, A.; Lilliestam, J. The potential and usefulness of demand response to provide electricity system services. Appl. Energy 2017, 204, 749–766. [Google Scholar] [CrossRef]
- Zhang, T. China’s Demand Response in Action. Available online: https://www.integralnewenergy.com/?p=34063 (accessed on 23 March 2022).
- Zhang, Y.; Wu, Y.; Zhang, F.; Cai, J.; Li, Y.; Tang, L. Research on Power Demand Response of a Certain Area Power Grid for New Energy Consumption. J. Phys. Conf. Ser. 2021, 1894, 012025. [Google Scholar] [CrossRef]
- Oshnoei, A.; Kheradmandi, M.; Blaabjerg, F.; Hatziargyriou, N.D.; Muyeen, S.M.; Anvari-Moghaddam, A. Coordinated control scheme for provision of frequency regulation service by virtual power plants. Appl. Energy 2022, 325, 119734. [Google Scholar] [CrossRef]
- Pimm, A.J.; Cockerill, T.T.; Taylor, P.G. The potential for peak shaving on low voltage distribution networks using electricity storage. J. Energy Storage 2018, 16, 231–242. [Google Scholar] [CrossRef]
- Zhu, J.; Shen, Y.; Song, Z.; Zhou, D.; Zhang, Z.; Kusiak, A. Data-driven building load profiling and energy management. Sust. Cities Soc. 2019, 49, 101587. [Google Scholar] [CrossRef]
- Afzalan, M.; Jazizadeh, F.; Eldardiry, H. Two-Stage Clustering of Household Electricity Load Shapes for Improved Temporal Pattern Representation. IEEE Access 2021, 9, 151667–151680. [Google Scholar] [CrossRef]
- Haben, S.; Singleton, C.; Grindrod, P. Analysis and Clustering of Residential Customers Energy Behavioral Demand Using Smart Meter Data. IEEE Trans. Smart Grid 2016, 7, 136–144. [Google Scholar] [CrossRef]
- Czétány, L.; Vámos, V.; Horváth, M.; Szalay, Z.; Mota-Babiloni, A.; Deme-Bélafi, Z.; Csoknyai, T. Development of electricity consumption profiles of residential buildings based on smart meter data clustering. Energy Build. 2021, 252, 111376. [Google Scholar] [CrossRef]
- McLoughlin, F.; Duffy, A.; Conlon, M. A clustering approach to domestic electricity load profile characterisation using smart metering data. Appl. Energy 2015, 141, 190–199. [Google Scholar] [CrossRef]
- Rhodes, J.D.; Cole, W.J.; Upshaw, C.R.; Edgar, T.F.; Webber, M.E. Clustering analysis of residential electricity demand profiles. Appl. Energy 2014, 135, 461–471. [Google Scholar] [CrossRef]
- Zhao, Q.; Li, H.; Wang, X.; Pu, T.; Wang, J. Analysis of users’ electricity consumption behavior based on ensemble clustering. Glob. Energy Interconnect. 2019, 2, 479–488. [Google Scholar] [CrossRef]
- Yi, W.; Qixin, C.; Chongqing, K.; Mingming, Z.; Ke, W.; Yun, Z. Load profiling and its application to demand response: A review. Tsinghua Sci. Technol. 2015, 20, 117–129. [Google Scholar] [CrossRef]
- Rajabi, A.; Li, L.; Zhang, J.; Zhu, J.; Ghavidel, S.; Ghadi, M.J. A review on clustering of residential electricity customers and its applications. In Proceedings of the 2017 20th International Conference on Electrical Machines and Systems (ICEMS), Sydney, NSW, Australia, 11–14 August 2017; pp. 1–6. [Google Scholar]
- Chicco, G.; Napoli, R.; Piglione, F. Comparisons among clustering techniques for electricity customer classification. IEEE Trans. Power Syst. 2006, 21, 933–940. [Google Scholar] [CrossRef]
- Li, H.; Hu, B.; Liu, Y.; Yang, B.; Liu, X.; Li, G.; Wang, Z.; Zhou, B. Classification of Electricity Consumption Behavior Based on Improved K-Means and LSTM. Appl. Sci. 2021, 11, 7625. [Google Scholar] [CrossRef]
- Wen, L.; Zhou, K.; Yang, S. A shape-based clustering method for pattern recognition of residential electricity consumption. J. Clean. Prod. 2019, 212, 475–488. [Google Scholar] [CrossRef]
- Granell, R.; Axon, C.J.; Wallom, D.C.H. Impacts of Raw Data Temporal Resolution Using Selected Clustering Methods on Residential Electricity Load Profiles. IEEE Trans. Power Syst. 2015, 30, 3217–3224. [Google Scholar] [CrossRef]
- Hale, E.T.; Bird, L.A.; Padmanabhan, R.; Volpi, C.M. Potential Roles for Demand Response in High-Growth Electric Systems with Increasing Shares of Renewable Generation; National Renewable Energy Lab. (NREL): Golden, CO, USA, 2018. [Google Scholar]
- Kwac, J.; Flora, J.; Rajagopal, R. Household energy consumption segmentation using hourly data. IEEE Trans. Smart Grid 2014, 5, 420–430. [Google Scholar] [CrossRef]
- Zhang, X.; Ramírez-Mendiola, J.L.; Li, M.; Guo, L. Electricity consumption pattern analysis beyond traditional clustering methods: A novel self-adapting semi-supervised clustering method and application case study. Appl. Energy 2022, 308, 118335. [Google Scholar] [CrossRef]
- Bourdeau, M.; Basset, P.; Beauchêne, S.; Da Silva, D.; Guiot, T.; Werner, D.; Nefzaoui, E. Classification of daily electric load profiles of non-residential buildings. Energy Build. 2021, 233, 110670. [Google Scholar] [CrossRef]
- Panapakidis, I.P.; Papadopoulos, T.A.; Christoforidis, G.C.; Papagiannis, G.K. Pattern recognition algorithms for electricity load curve analysis of buildings. Energy Build. 2014, 73, 137–145. [Google Scholar] [CrossRef]
- Albert, A.; Maasoumy, M. Predictive segmentation of energy consumers. Appl. Energy 2016, 177, 435–448. [Google Scholar] [CrossRef]
- Yang, Q.; Yin, S.; Li, Q.; Li, Y. Analysis of electricity consumption behaviors based on principal component analysis and density peak clustering. Concurr. Comput. Pract. Exp. 2022, 34, e7126. [Google Scholar] [CrossRef]
- Ramos, S.; Soares, J.; Cembranel, S.S.; Tavares, I.; Foroozandeh, Z.; Vale, Z.; Fernandes, R. Data mining techniques for electricity customer characterization. Procedia Comput. Sci. 2021, 186, 475–488. [Google Scholar] [CrossRef]
- Li, H.; Wang, Z.; Hong, T.; Parker, A.; Neukomm, M. Characterizing patterns and variability of building electric load profiles in time and frequency domains. Appl. Energy 2021, 291, 116721. [Google Scholar] [CrossRef]
- Liu, X.; Ding, Y.; Tang, H.; Xiao, F. A data mining-based framework for the identification of daily electricity usage patterns and anomaly detection in building electricity consumption data. Energy Build. 2021, 231, 110601. [Google Scholar] [CrossRef]
- Dedić, A.; Konjić, T.; Ćalasan, M.; Dedić, Z. Fuzzy C-Means Clustering Applied to Load Profiling of Industrial Customers. Electr. Power Compon. Syst. 2022, 49, 1068–1084. [Google Scholar] [CrossRef]
- Granell, R.; Axon, C.J.; Kolokotroni, M.; Wallom, D.C. A reduced-dimension feature extraction method to represent retail store electricity profiles. Energy Build. 2022, 276, 112508. [Google Scholar] [CrossRef]
- Zhong, C.; Shao, J.; Zheng, F.; Zhang, K.; Lv, H.; Li, K. Research on electricity consumption behavior of electric power users based on tag technology and clustering algorithm. In Proceedings of the 2018 5th International Conference on Information Science and Control Engineering (ICISCE), Zhengzhou, China, 20–22 July 2018; pp. 459–462. [Google Scholar]
- Guan, W.; Zhang, D.; Yu, H.; Peng, B.; Wu, Y.; Yu, T.; Wang, K. Customer load forecasting method based on the industry electricity consumption behavior portrait. Front. Energy Res. 2021, 9, 742993. [Google Scholar] [CrossRef]
- Huang, Y.; Liu, Y.; Xu, L.; Guo, H. A Residential User Classification Approach Based on the Graded Portrait with Considering the IDR Adaptability and Potential. Front. Energy Res. 2022, 10, 1012721. [Google Scholar] [CrossRef]
- Huang, X.; Qiu, Z.; Su, J.; Shi, Z.; Yan, L. Knowledge Graph-based User Portrait Construction for Electricity Enterprise Suppliers. In Proceedings of the 2021 International Conference on Communications, Information System and Computer Engineering (CISCE), Beijing, China, 14–16 May 2021; pp. 81–84. [Google Scholar]
- Fan, R.; Jing, Z.; Guo, D. Digital Marketing Technology Based on Electricity User Portrait and K-means Clustering Algorithm. In Proceedings of the 2022 IEEE Conference on Telecommunications, Optics and Computer Science (TOCS), Dalian, China, 11–12 December 2022; pp. 800–806. [Google Scholar]
- Wang, N.; Wang, B.; Wang, X. Power user portrait recognition based on feature vector. In Proceedings of the International Conference on Artificial Intelligence and Intelligent Information Processing (AIIIP 2022), Qingdao, China, 17–29 June 2022; pp. 470–474. [Google Scholar]
- Chen, H.; Zhang, B.; Geng, H.; Wang, M.-M.; Gao, H. Demand response during the peak load period in China: Potentials, benefits and implementation mechanism designs. Comput. Ind. Eng. 2022, 168, 108117. [Google Scholar] [CrossRef]
- Palensky, P.; Dietrich, D. Demand Side Management: Demand Response, Intelligent Energy Systems, and Smart Loads. IEEE Trans. Ind. Inform. 2011, 7, 381–388. [Google Scholar] [CrossRef]
- AbuBaker, M. Data Mining Applications in Understanding Electricity Consumers’ Behavior: A Case Study of Tulkarm District, Palestine. Energies 2019, 12, 4287. [Google Scholar] [CrossRef]
- Martin Nascimento, G.F.; Wurtz, F.; Kuo-Peng, P.; Delinchant, B.; Jhoe Batistela, N.; Laranjeira, T. GreEn-ER–Electricity consumption data of a tertiary building. Front. Sustain. Cities 2023, 5, 1043657. [Google Scholar] [CrossRef]
- Mehar, A.M.; Matawie, K.; Maeder, A. Determining an optimal value of K in K-means clustering. In Proceedings of the 2013 IEEE International Conference on Bioinformatics and Biomedicine, Shanghai, China, 18–21 December 2013; pp. 51–55. [Google Scholar]
- Yuan, C.; Yang, H. Research on K-value selection method of K-means clustering algorithm. J 2019, 2, 226–235. [Google Scholar] [CrossRef]
- Wang, F.; Lu, X.; Chang, X.; Cao, X.; Yan, S.; Li, K.; Duić, N.; Shafie-Khah, M.; Catalão, J.P. Household profile identification for behavioral demand response: A semi-supervised learning approach using smart meter data. Energy 2022, 238, 121728. [Google Scholar] [CrossRef]
- Bora, D.J.; Gupta, A.K. Effect of Different Distance Measures on the Performance of K-Means Algorithm: An Experimental Study in Matlab. arXiv 2014, arXiv:1405.7471. [Google Scholar]


Disclaimer/Publisher’s Note: The statements, opinions and data contained in all publications are solely those of the individual author(s) and contributor(s) and not of MDPI and/or the editor(s). MDPI and/or the editor(s) disclaim responsibility for any injury to people or property resulting from any ideas, methods, instructions or products referred to in the content. |
© 2024 by the authors. Licensee MDPI, Basel, Switzerland. This article is an open access article distributed under the terms and conditions of the Creative Commons Attribution (CC BY) license (https://creativecommons.org/licenses/by/4.0/).