
Enhancing Electric Vehicle Charging Infrastructure: A Techno-Economic Analysis of Distributed Energy Resources and Local Grid Integration
 , , , ,
Abstract
:1. Introduction
- (1)
- Utilizing solely the local grid infrastructure.
- (2)
- Employing an integrated DER and local grid configuration.
2. Related Work
2.1. Studies on Infrastructure Design of EVCS
2.2. Studies Focusing on Optimization Strategies for EV Charging
2.3. Studies Focusing on Service Fee Calculations for EV Charging
2.4. Studies Focusing on the Integration of DERs and EVCSs
- (1)
- A comprehensive analysis of different building types and a real data-based economic evaluation are presented. Previous studies have focused on specific building types or limited data, whereas this paper analyzes EVCS operation data from building types, including residential, commercial/business, and public facilities. The characteristics and challenges of each environment are identified, and real data provided by KEPCO are used to evaluate the economics, ROI, and payback period, thereby obtaining reliable results;
- (2)
- Integration of DERs and the local grid: While existing studies mainly focus on either DERs or the power grid, this paper proposes to maximize the efficiency and cost-effectiveness of EVCSs through the integration of DERs and the local power grid. In doing so, we explore ways to increase energy reliability, address grid congestion, and generate additional revenue by selling excess energy from DERs.
- (3)
- Optimization strategy through seasonal and hourly demand pattern analysis: While existing studies mainly consider the overall demand pattern, this paper analyzes the EVCS operation data in detail by monthly, weekly, and hourly data to understand the variability in charging demand. Based on this, an efficient charging infrastructure operation strategy is proposed, and policy and regulatory factors are considered to provide effective support.
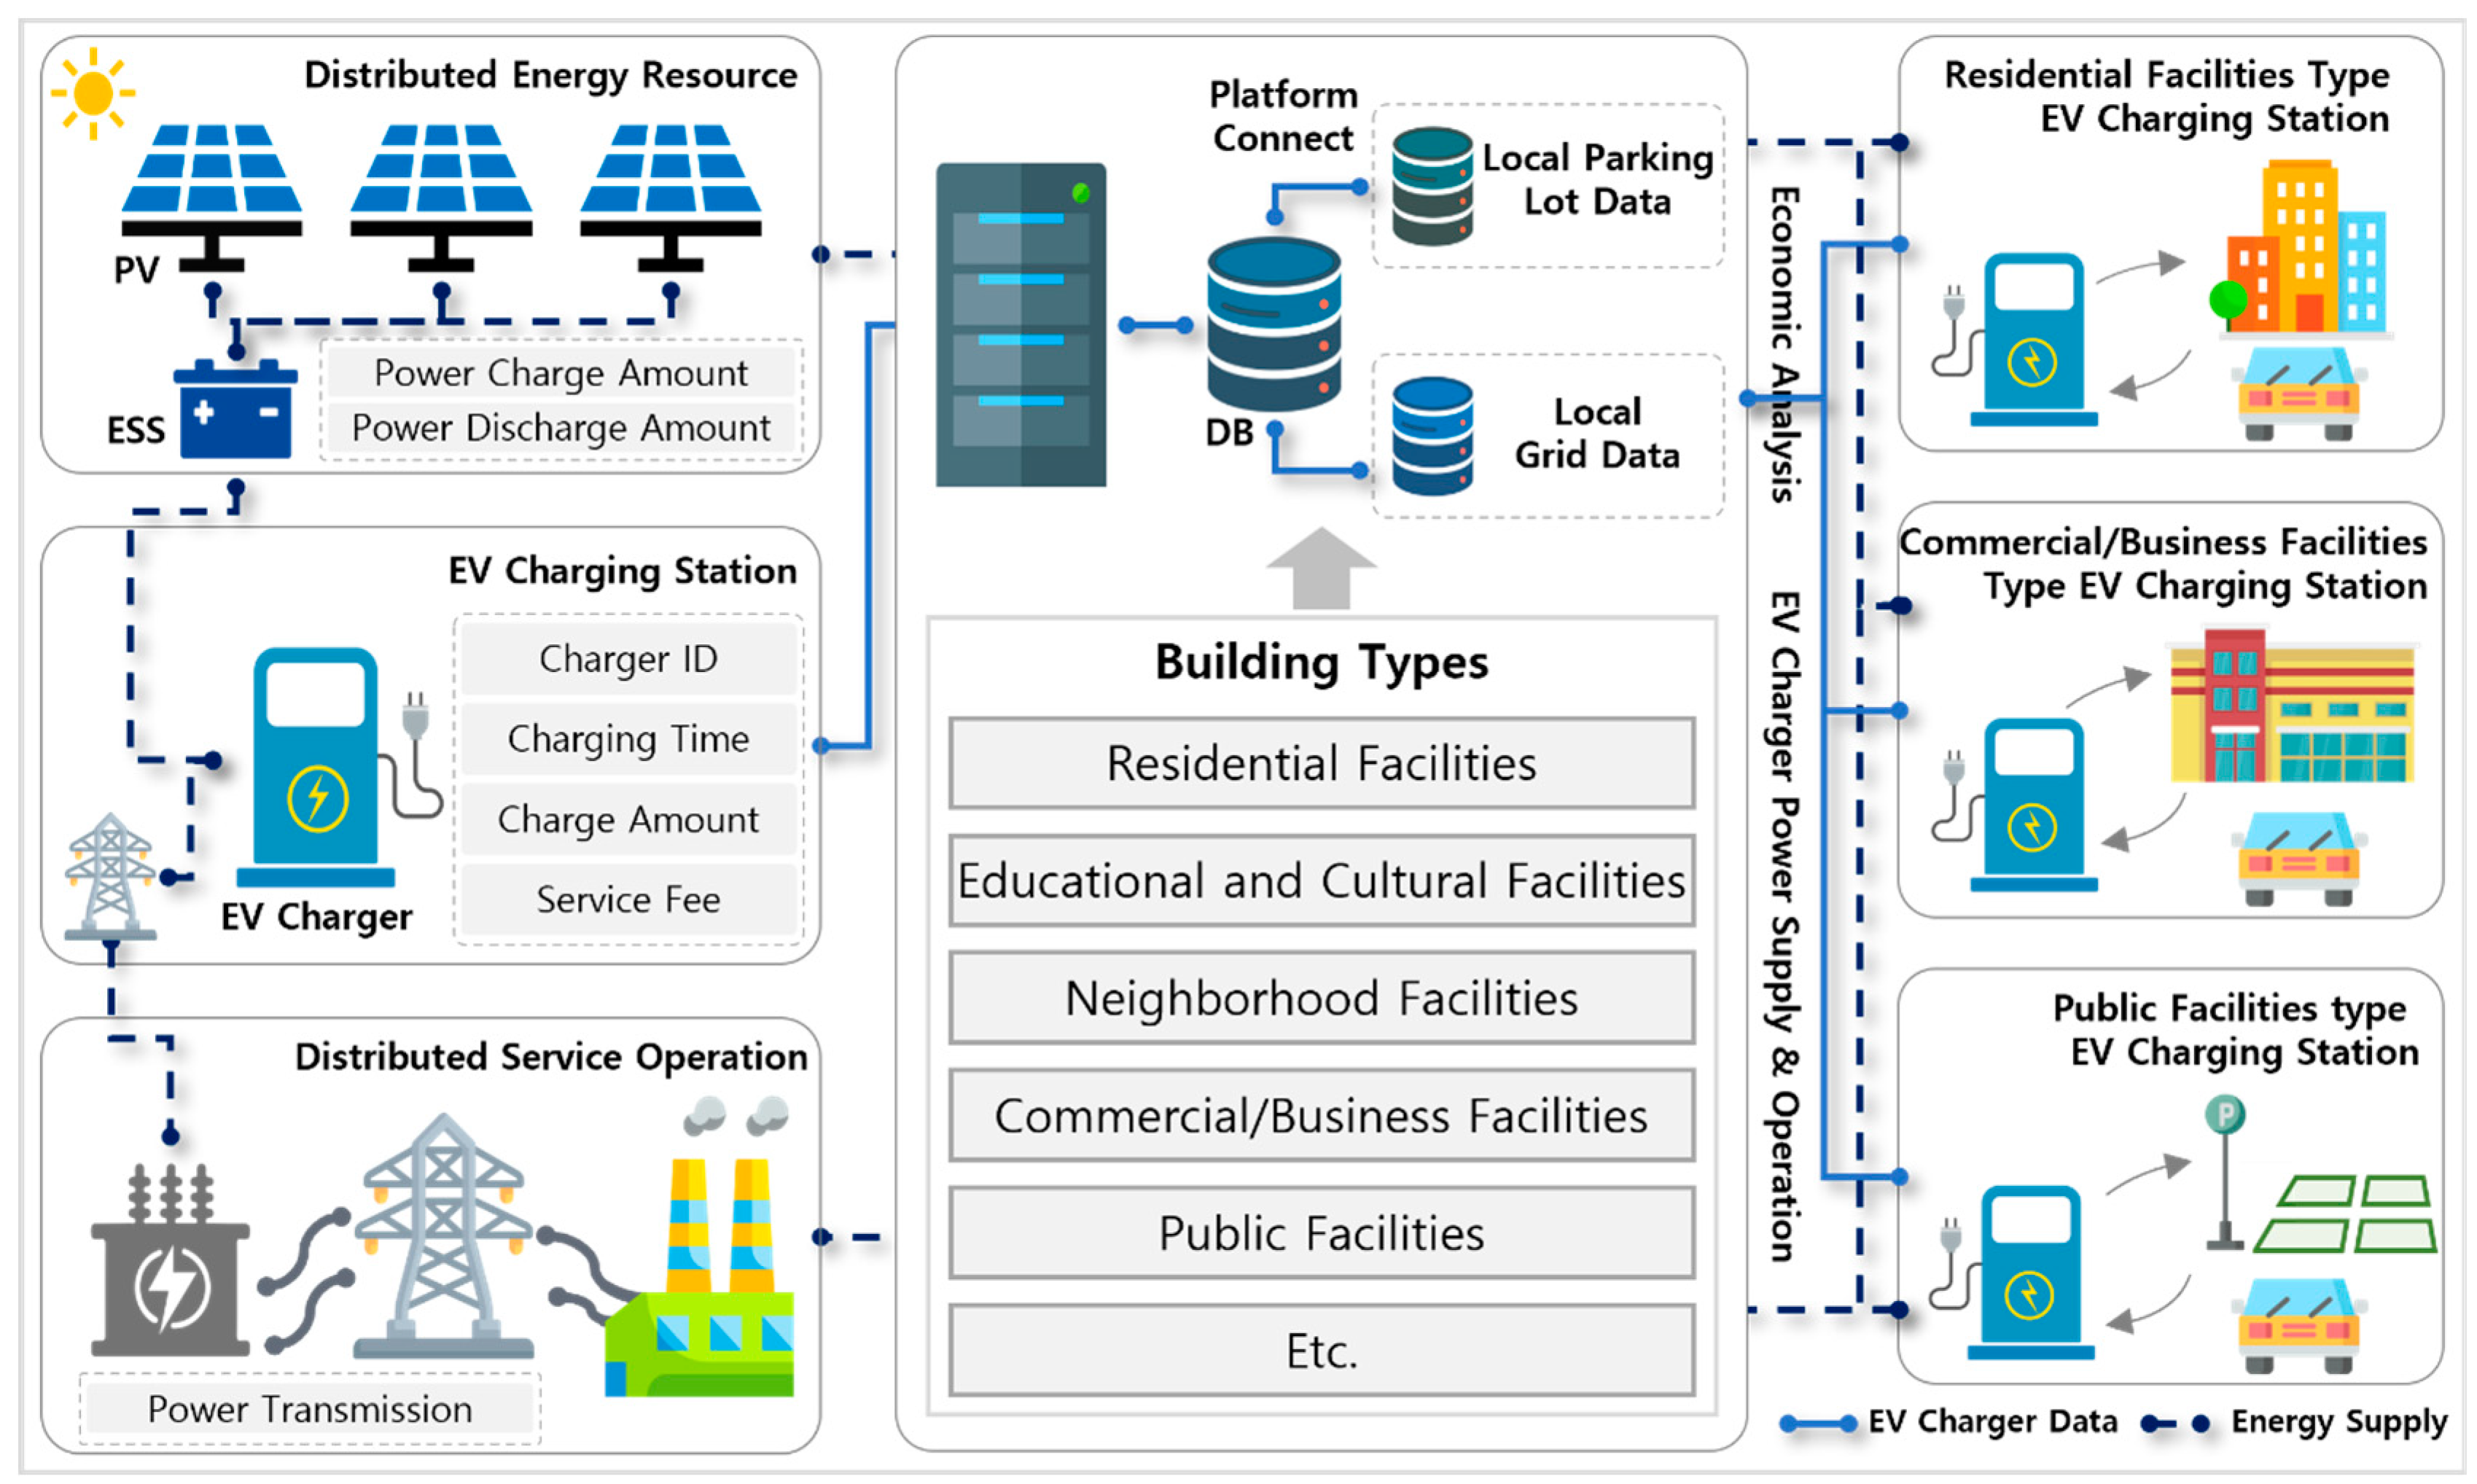
3. Process for EVCS Techno-Economic Analysis
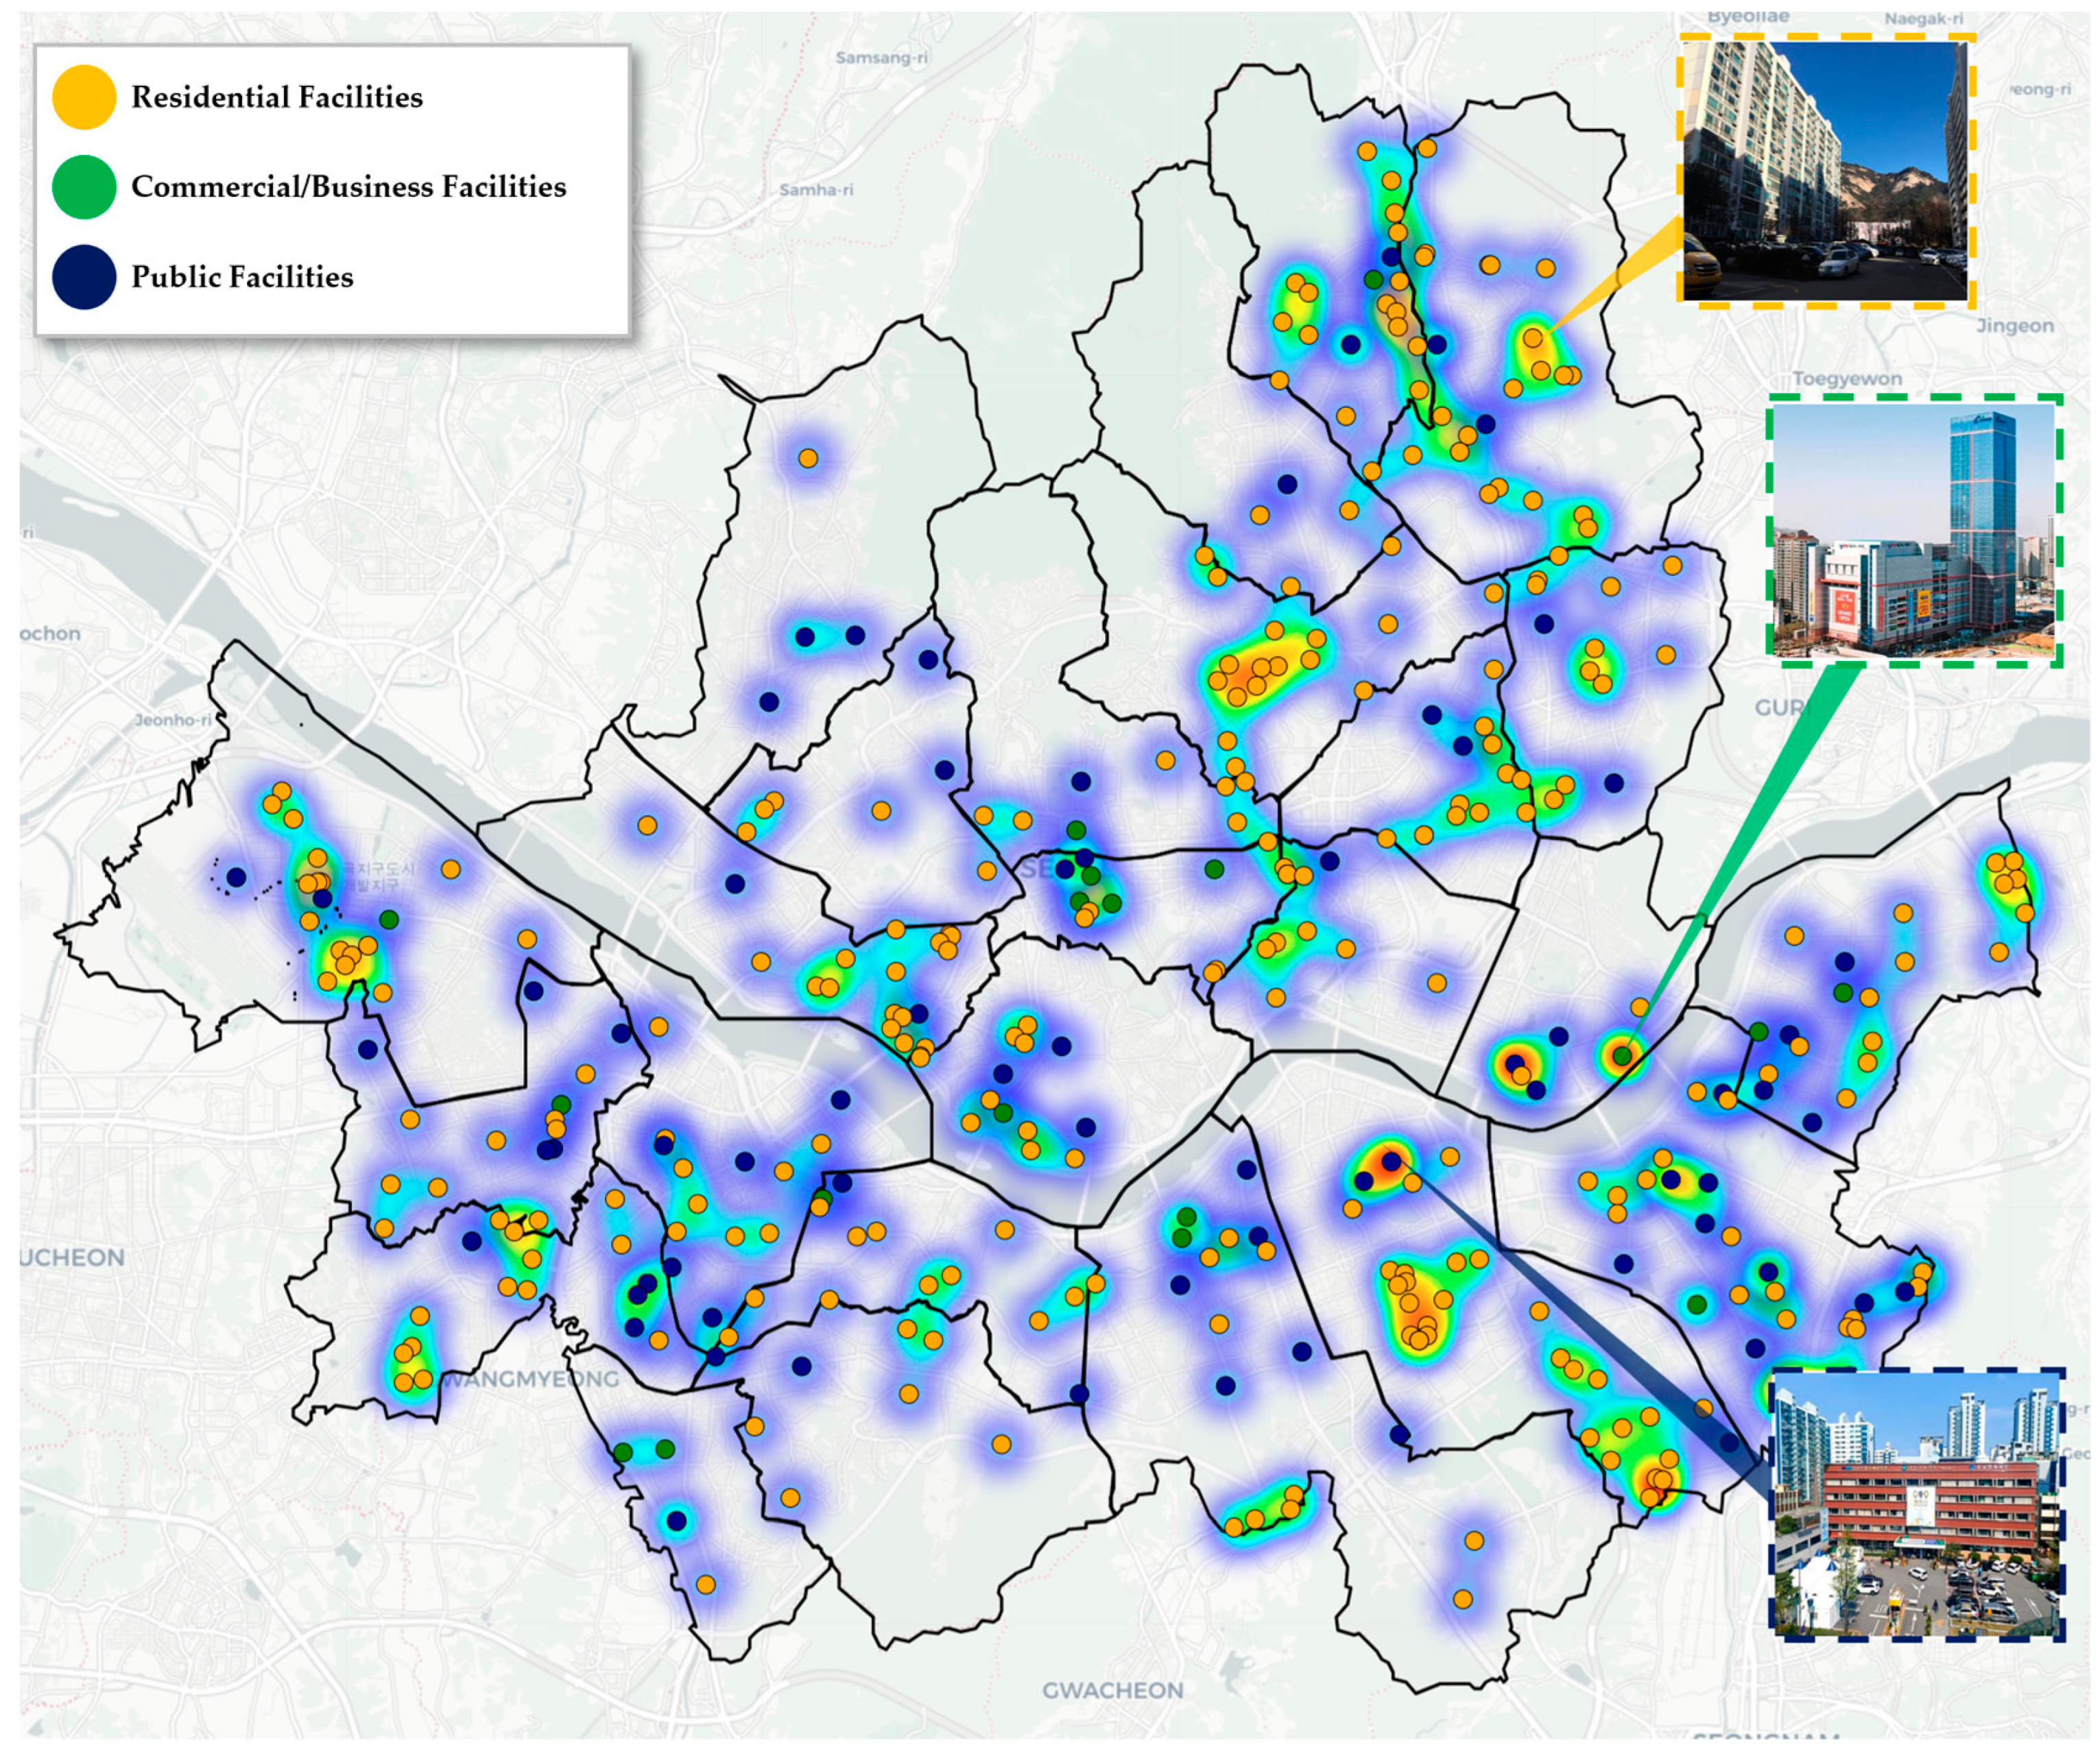
3.1. Selection of EVCS Testbeds and Analysis of Building Types Using Public Data
3.2. Examination of the Operational Characteristics of EVCS Testbeds by Building Type
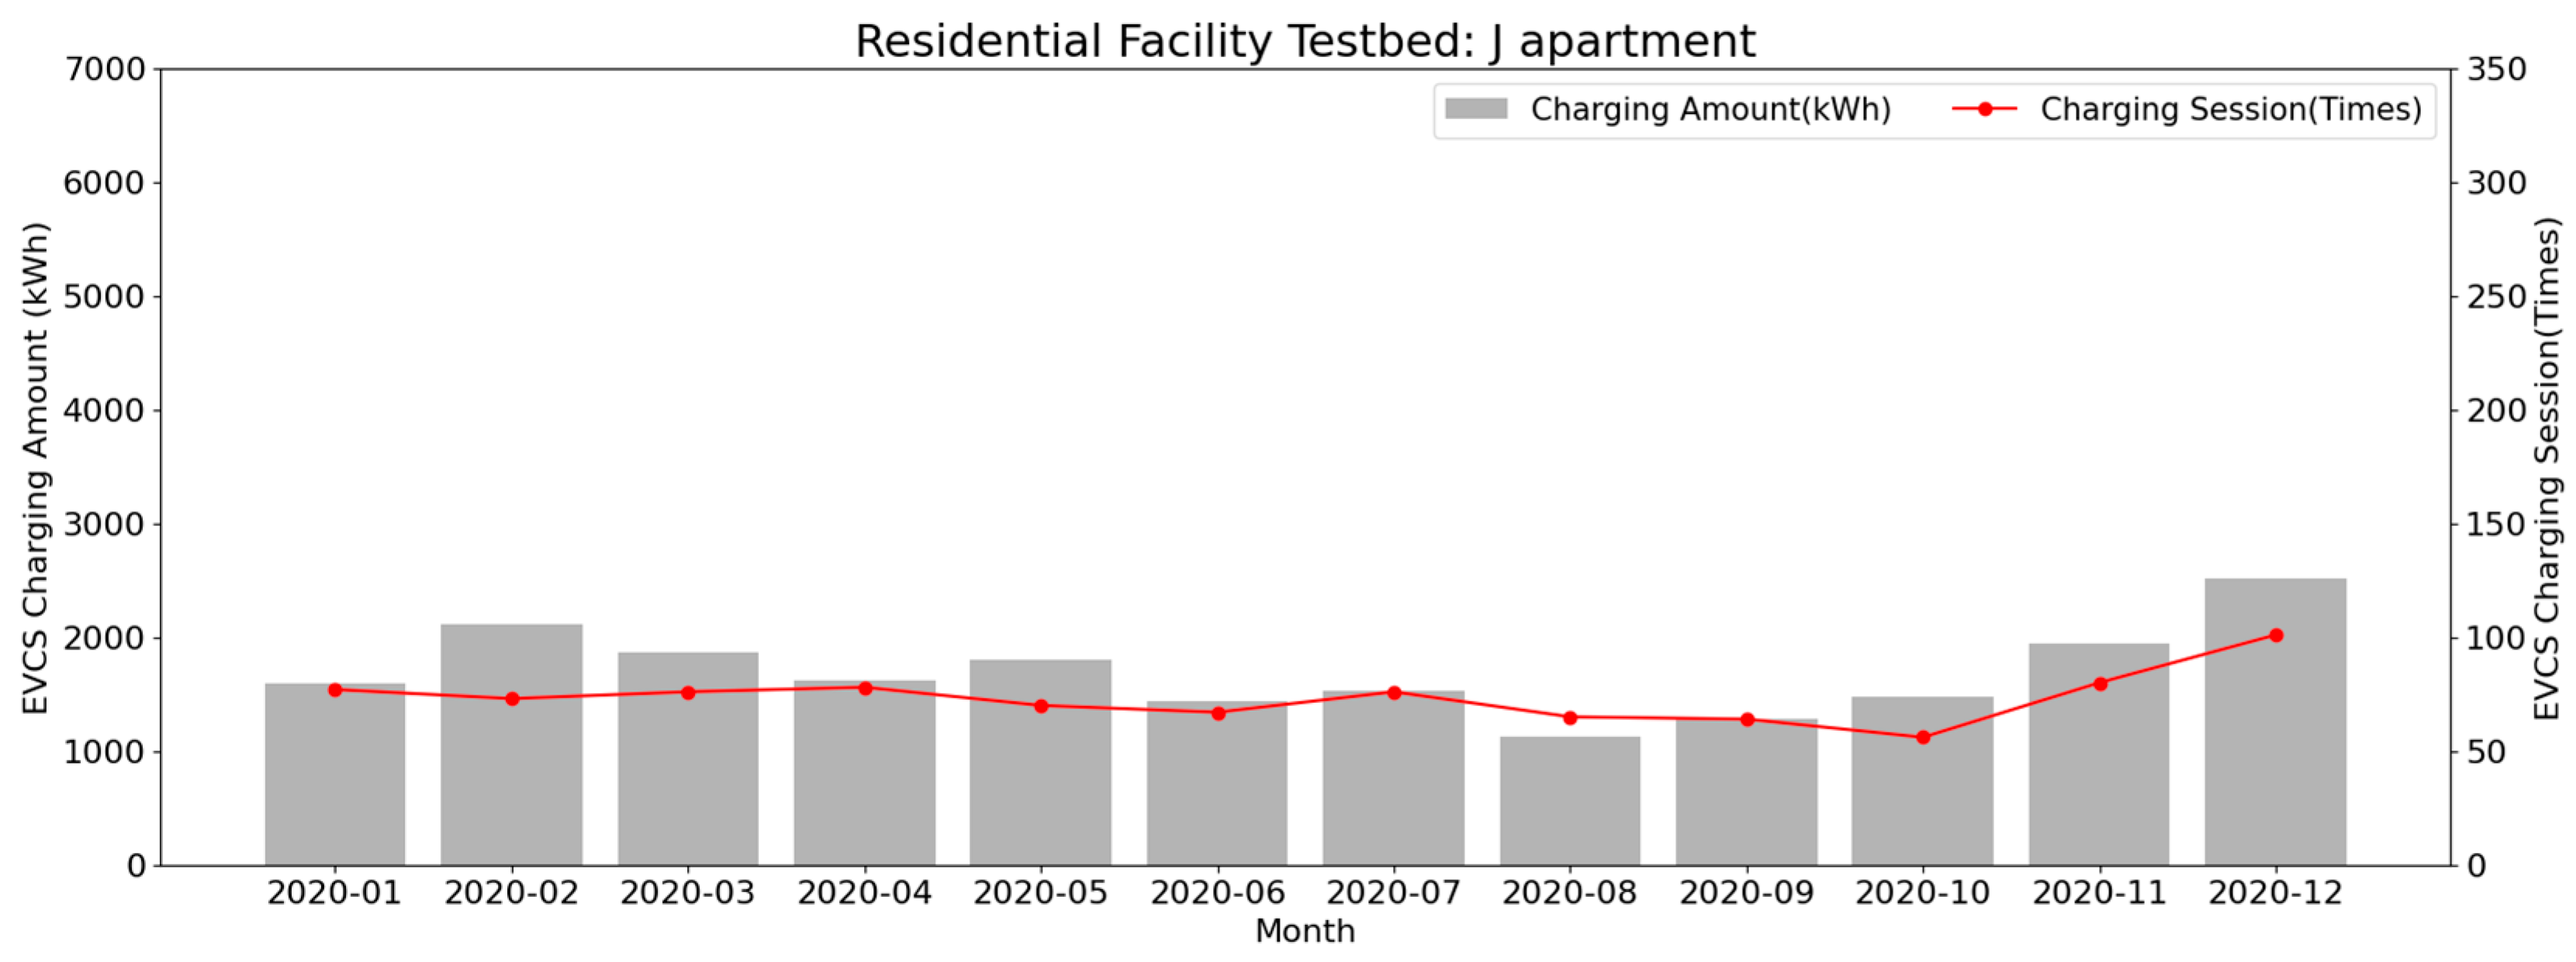
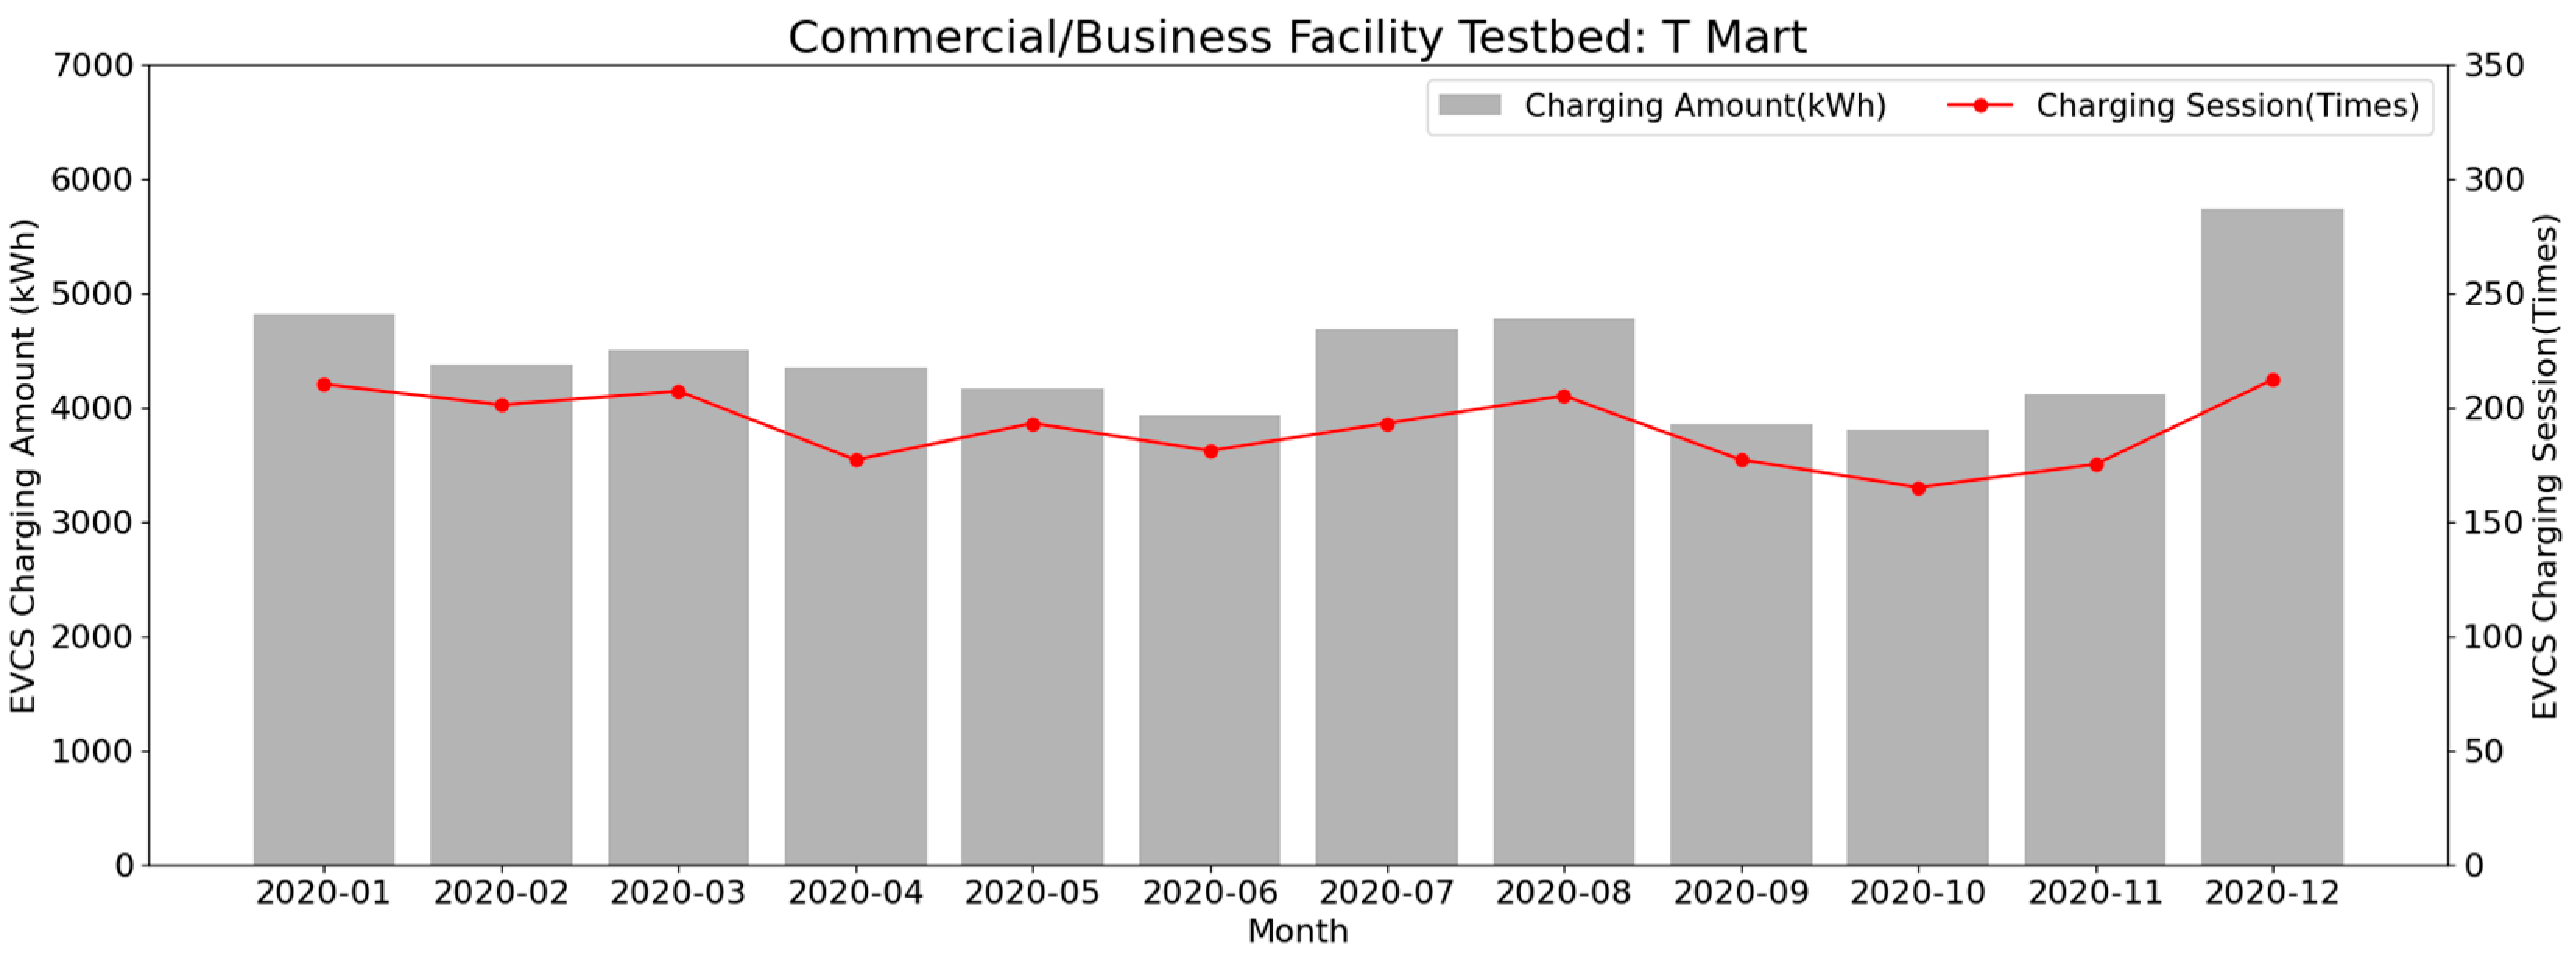
3.2.1. Monthly Operation Characteristics Analysis
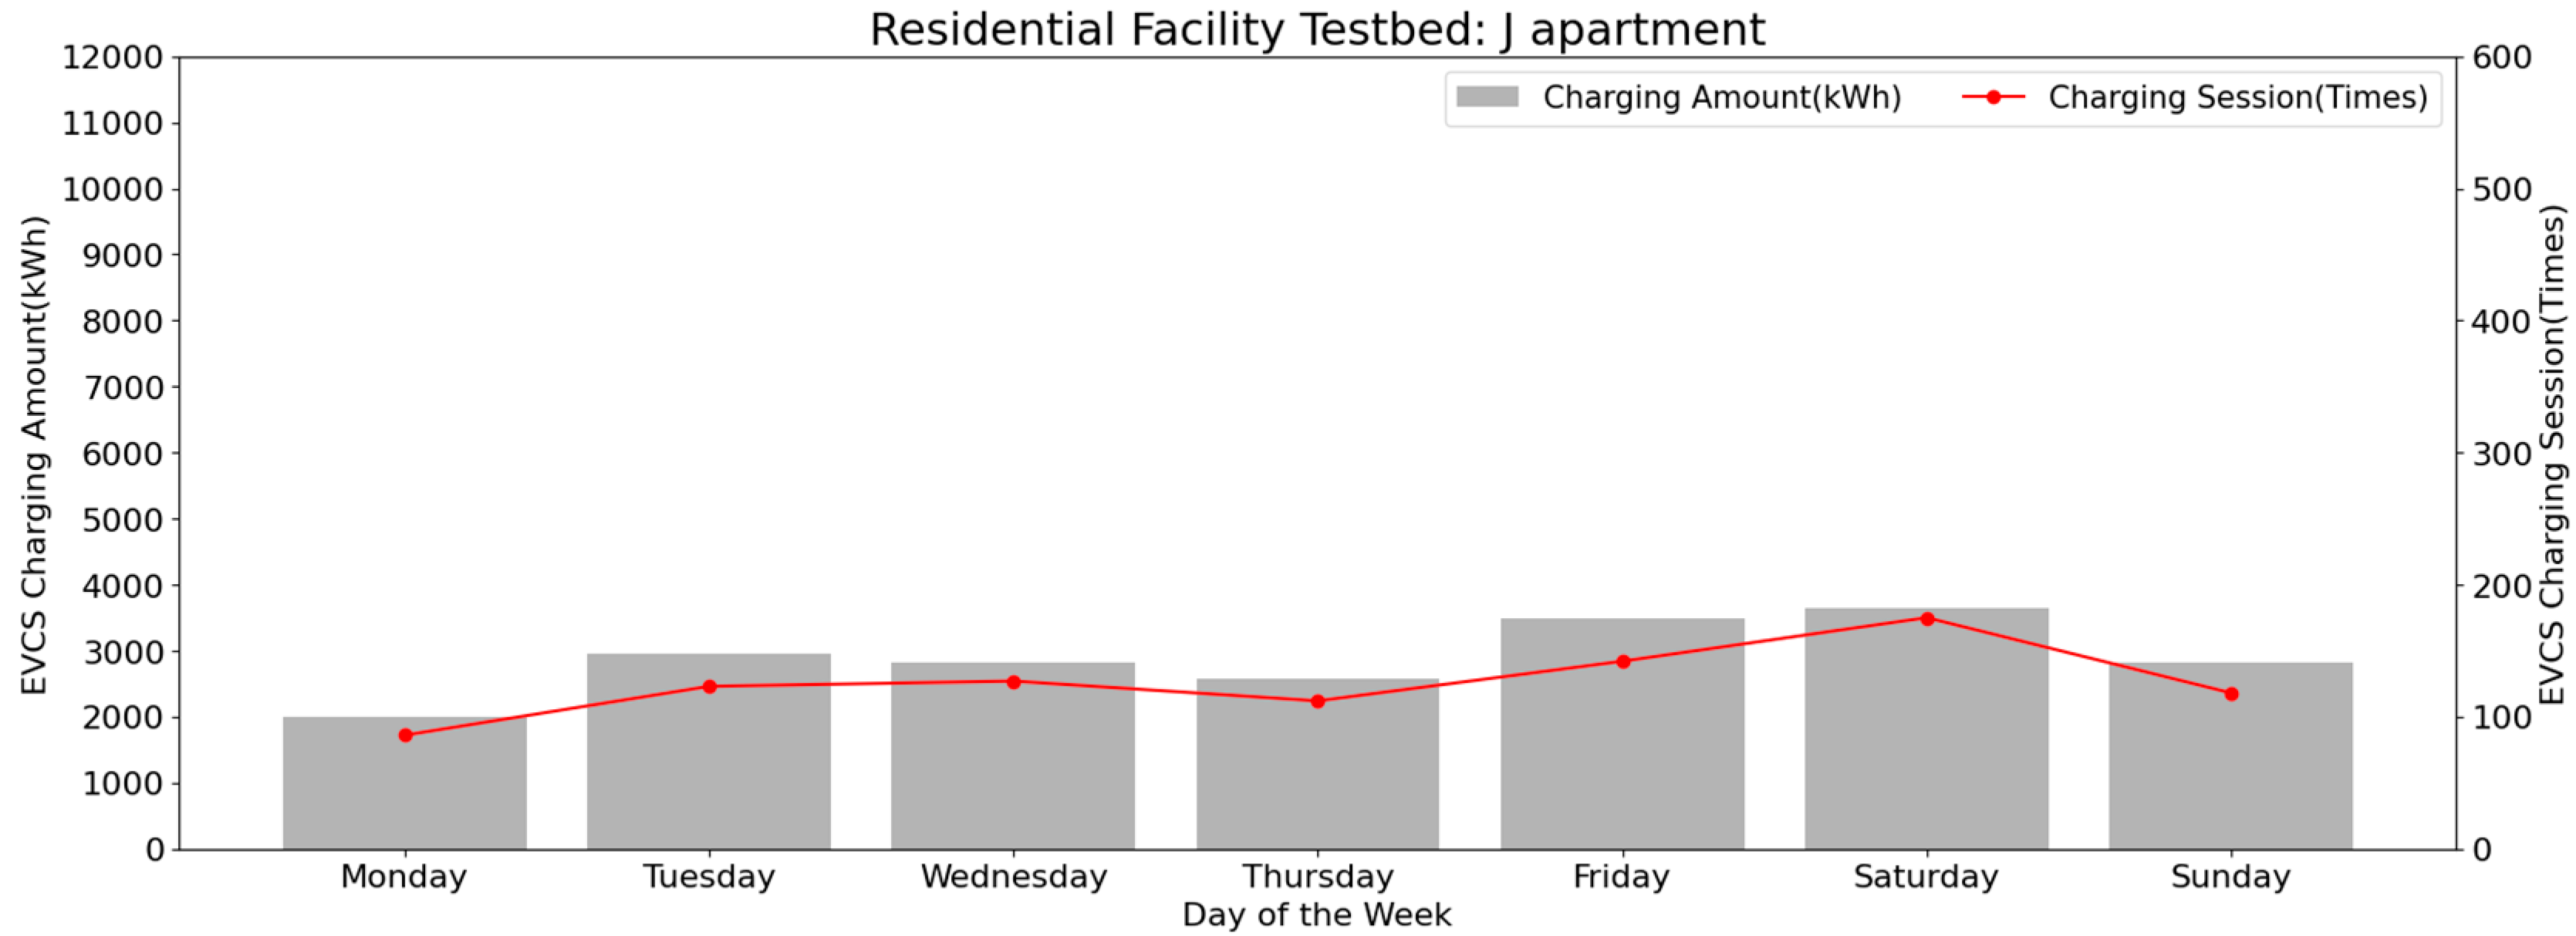
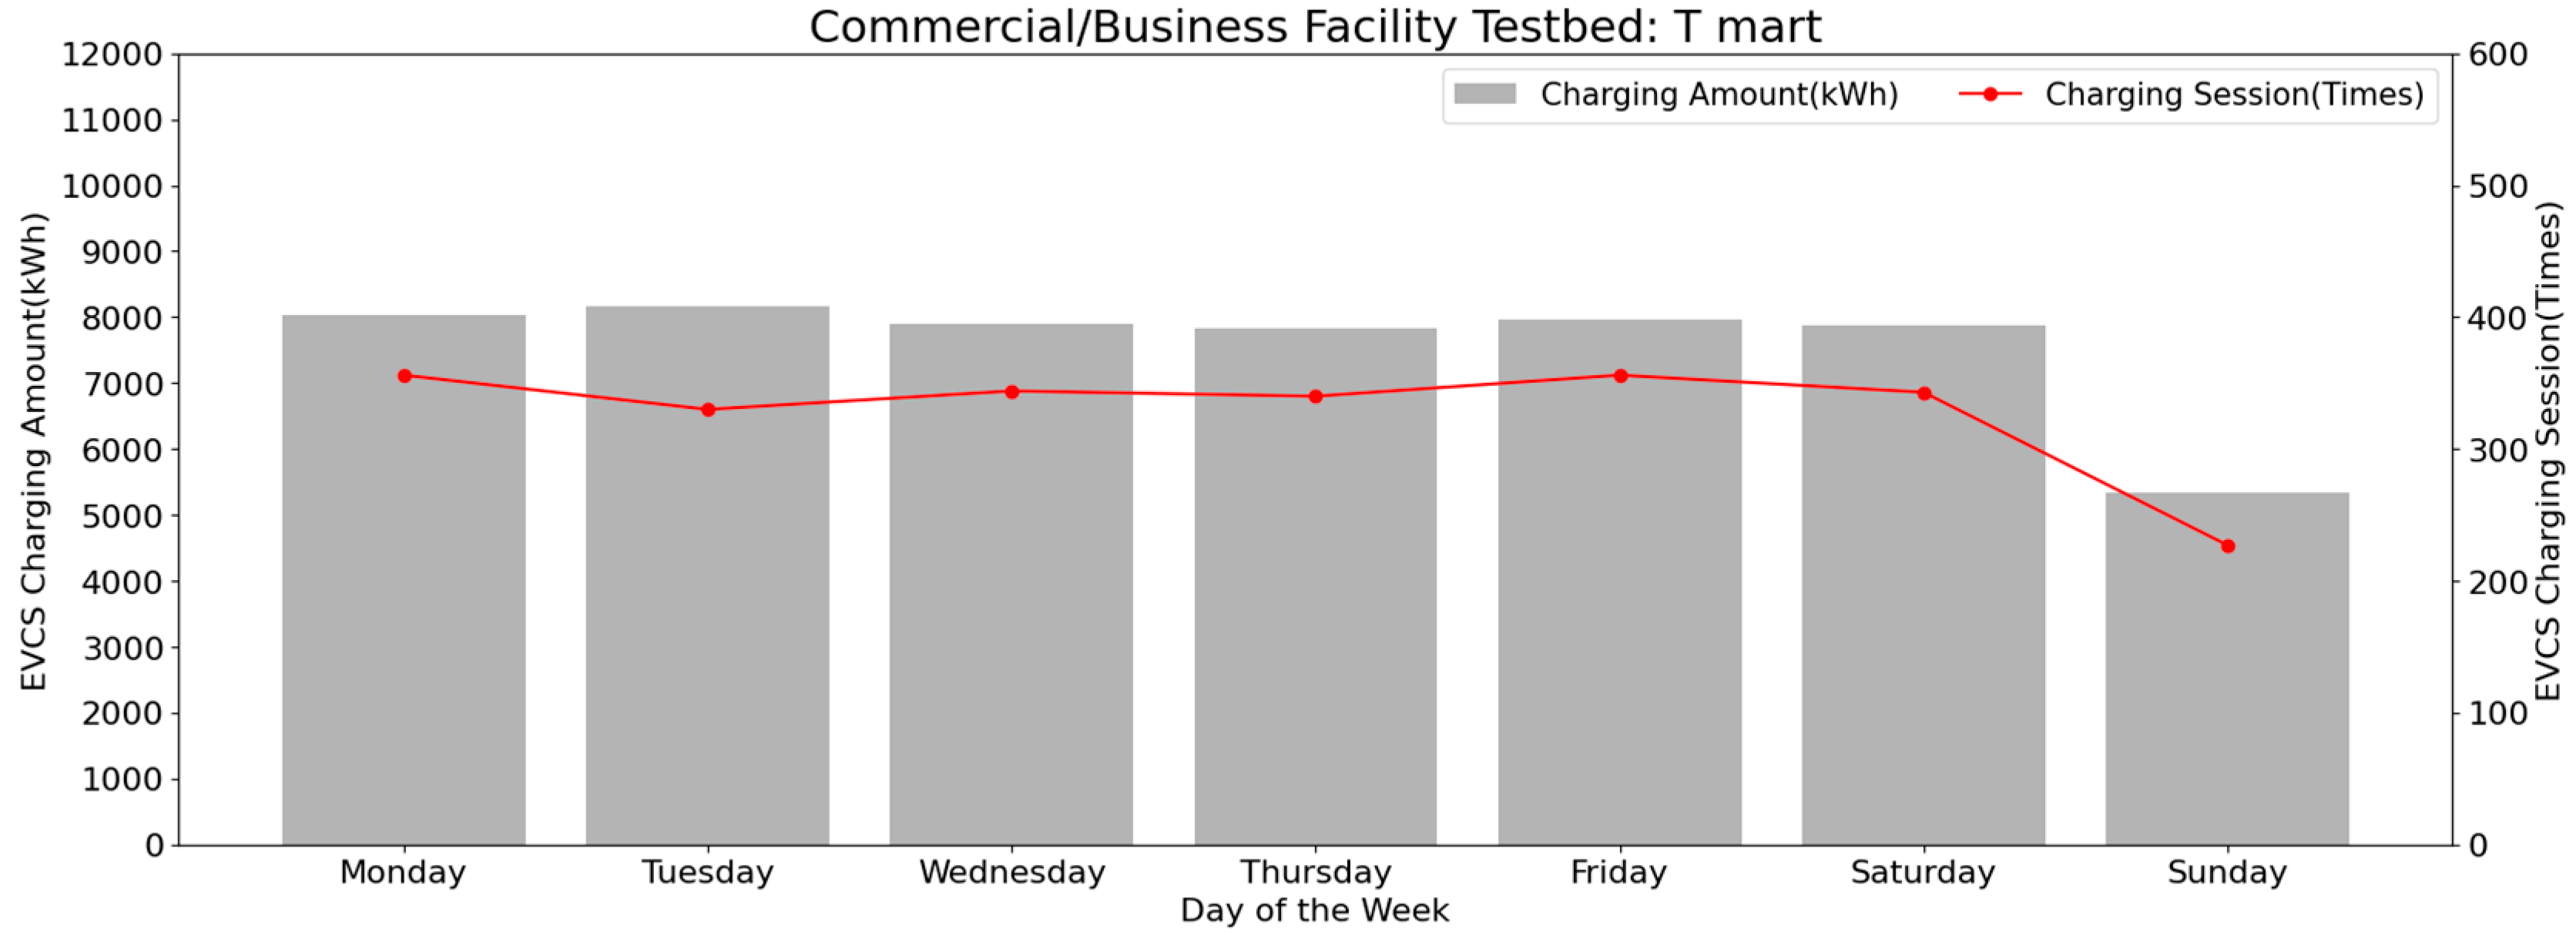
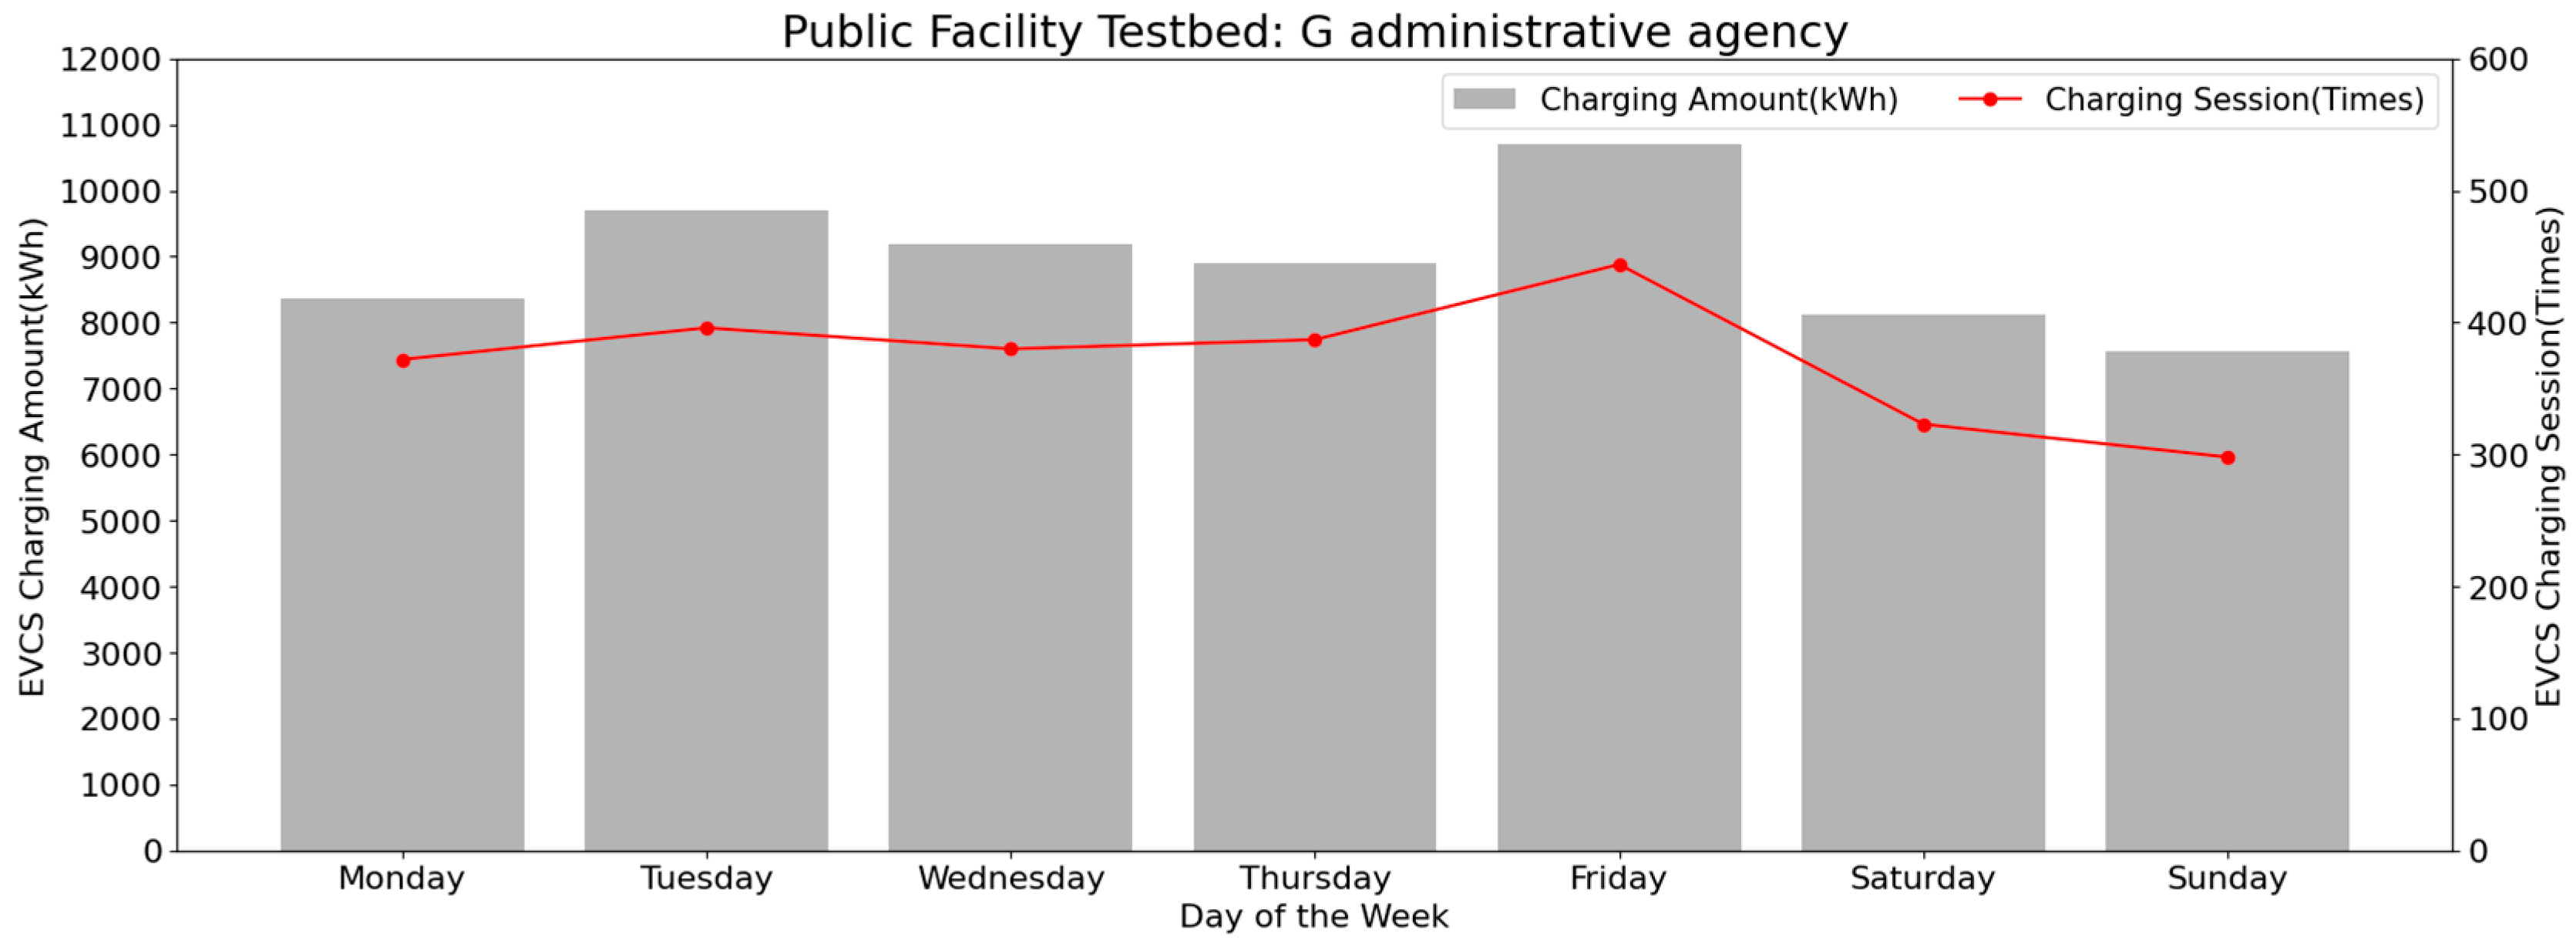
3.2.2. Weekly Operation Characterization
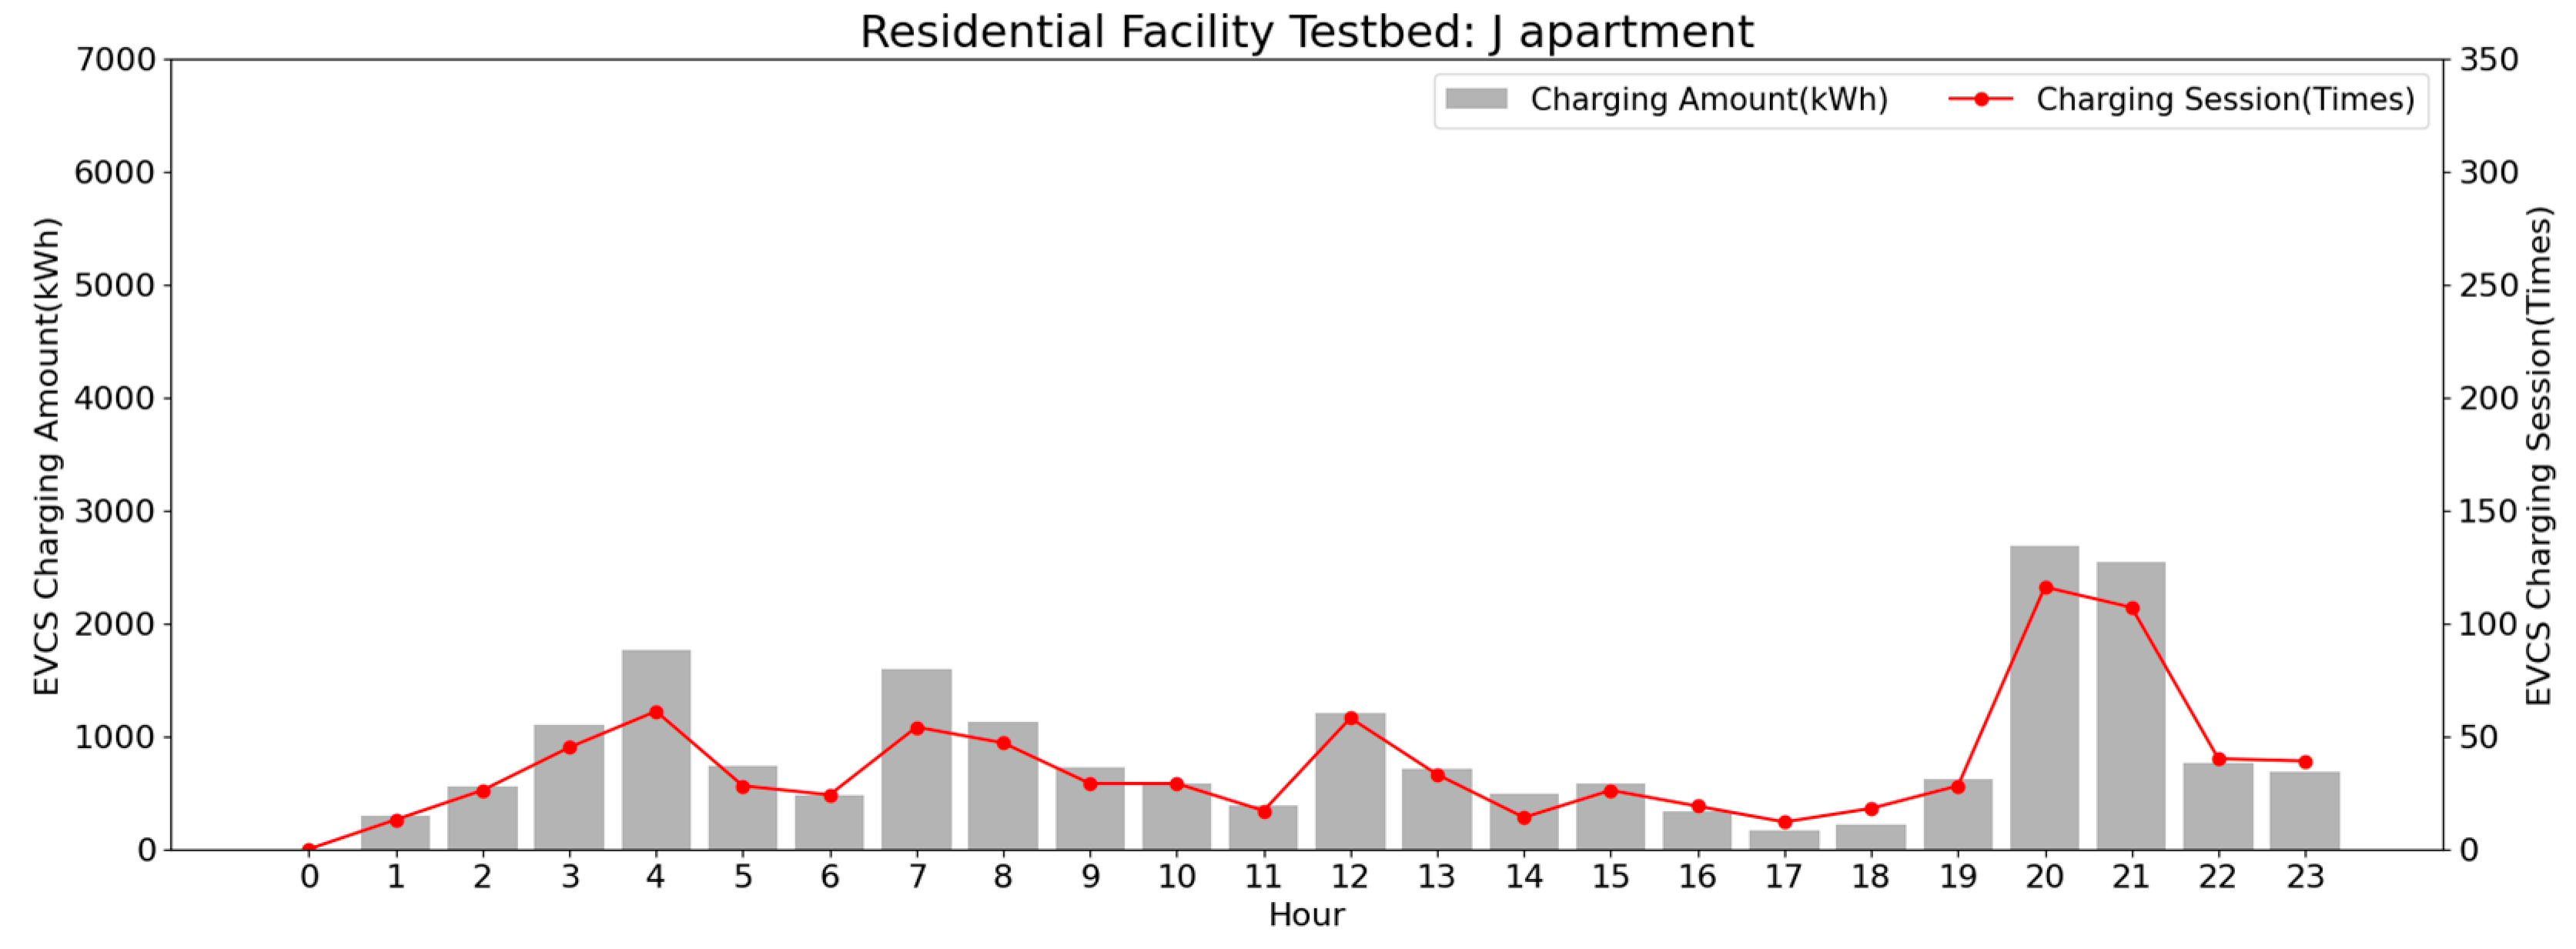
3.2.3. Hourly Operational Characterization
4. Techno-Economic Analysis for EVCS Based on Local Grid
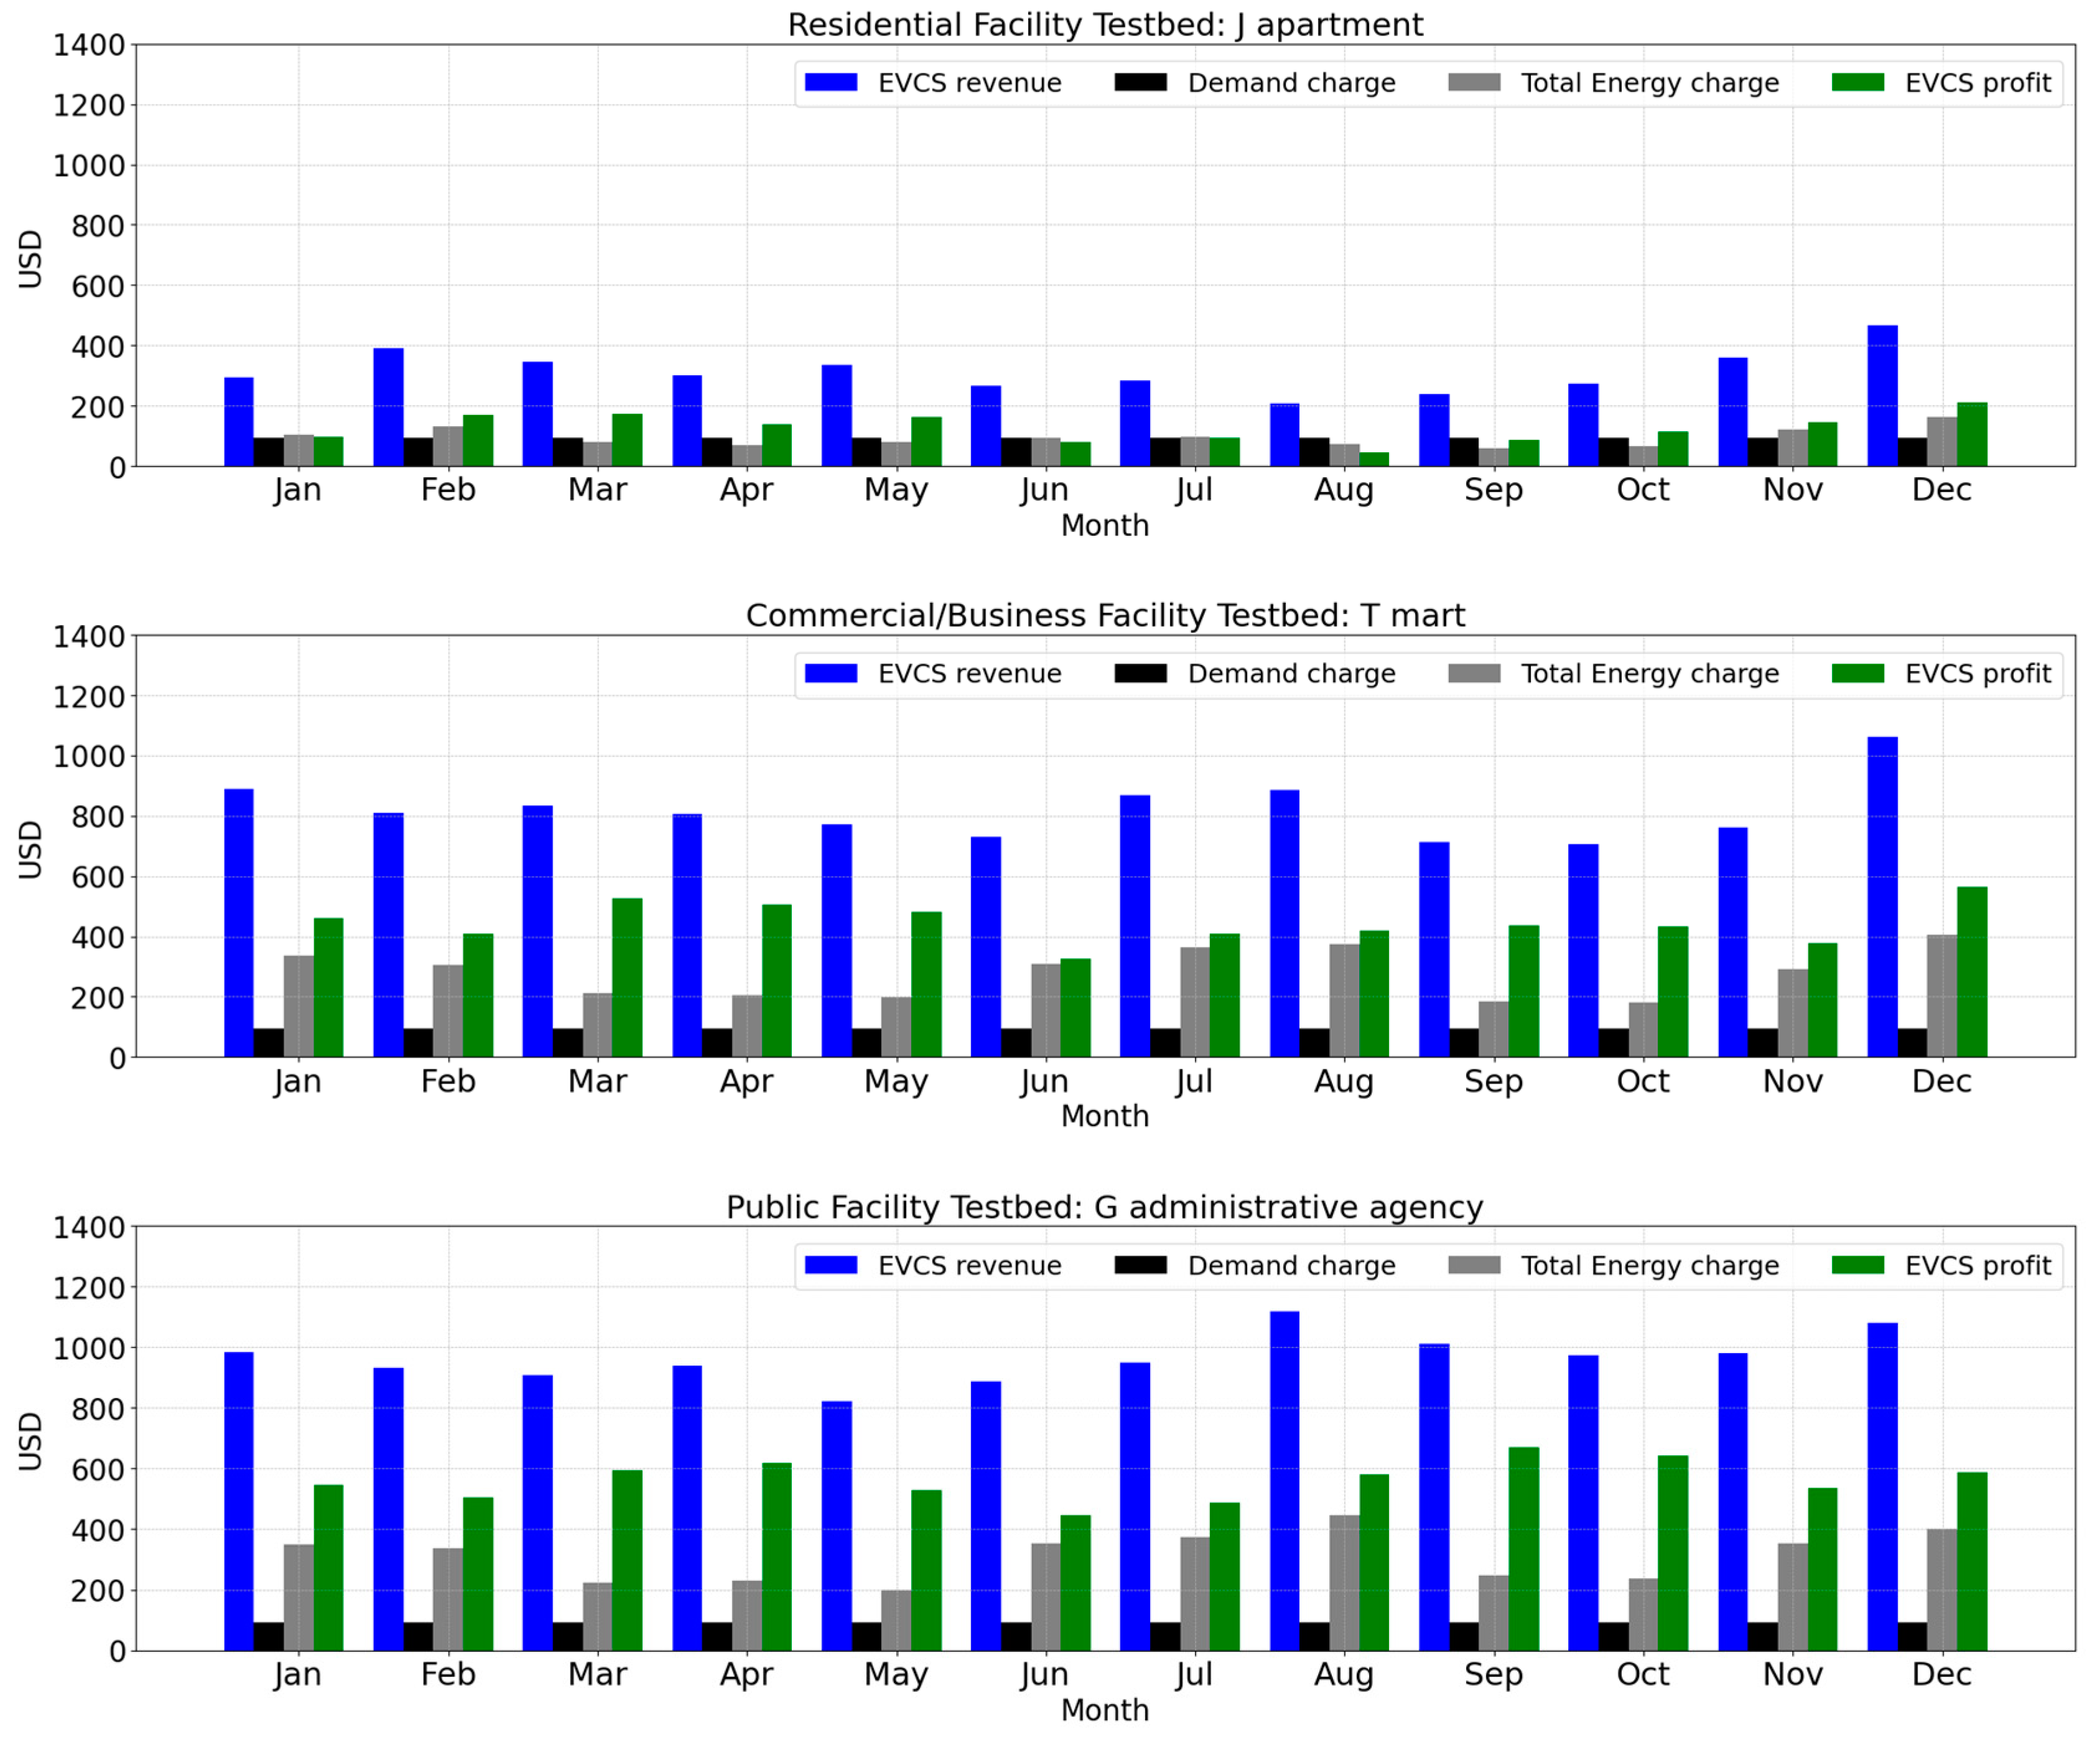
4.1. Examination of Revenue Generated by the EVCS Charging Services
4.2. Examination of the Cost of Electricity Used for EVCS Fast Charging Service
4.3. Examination of ROI Investment Process Based on EVCS Profit
4.4. Technical and Economic Analysis of Local Grid Operation to EVCS Testbeds
5. Technical and Economic Analysis of EVCSs Based on Integration of DERs and Local Grid Operations
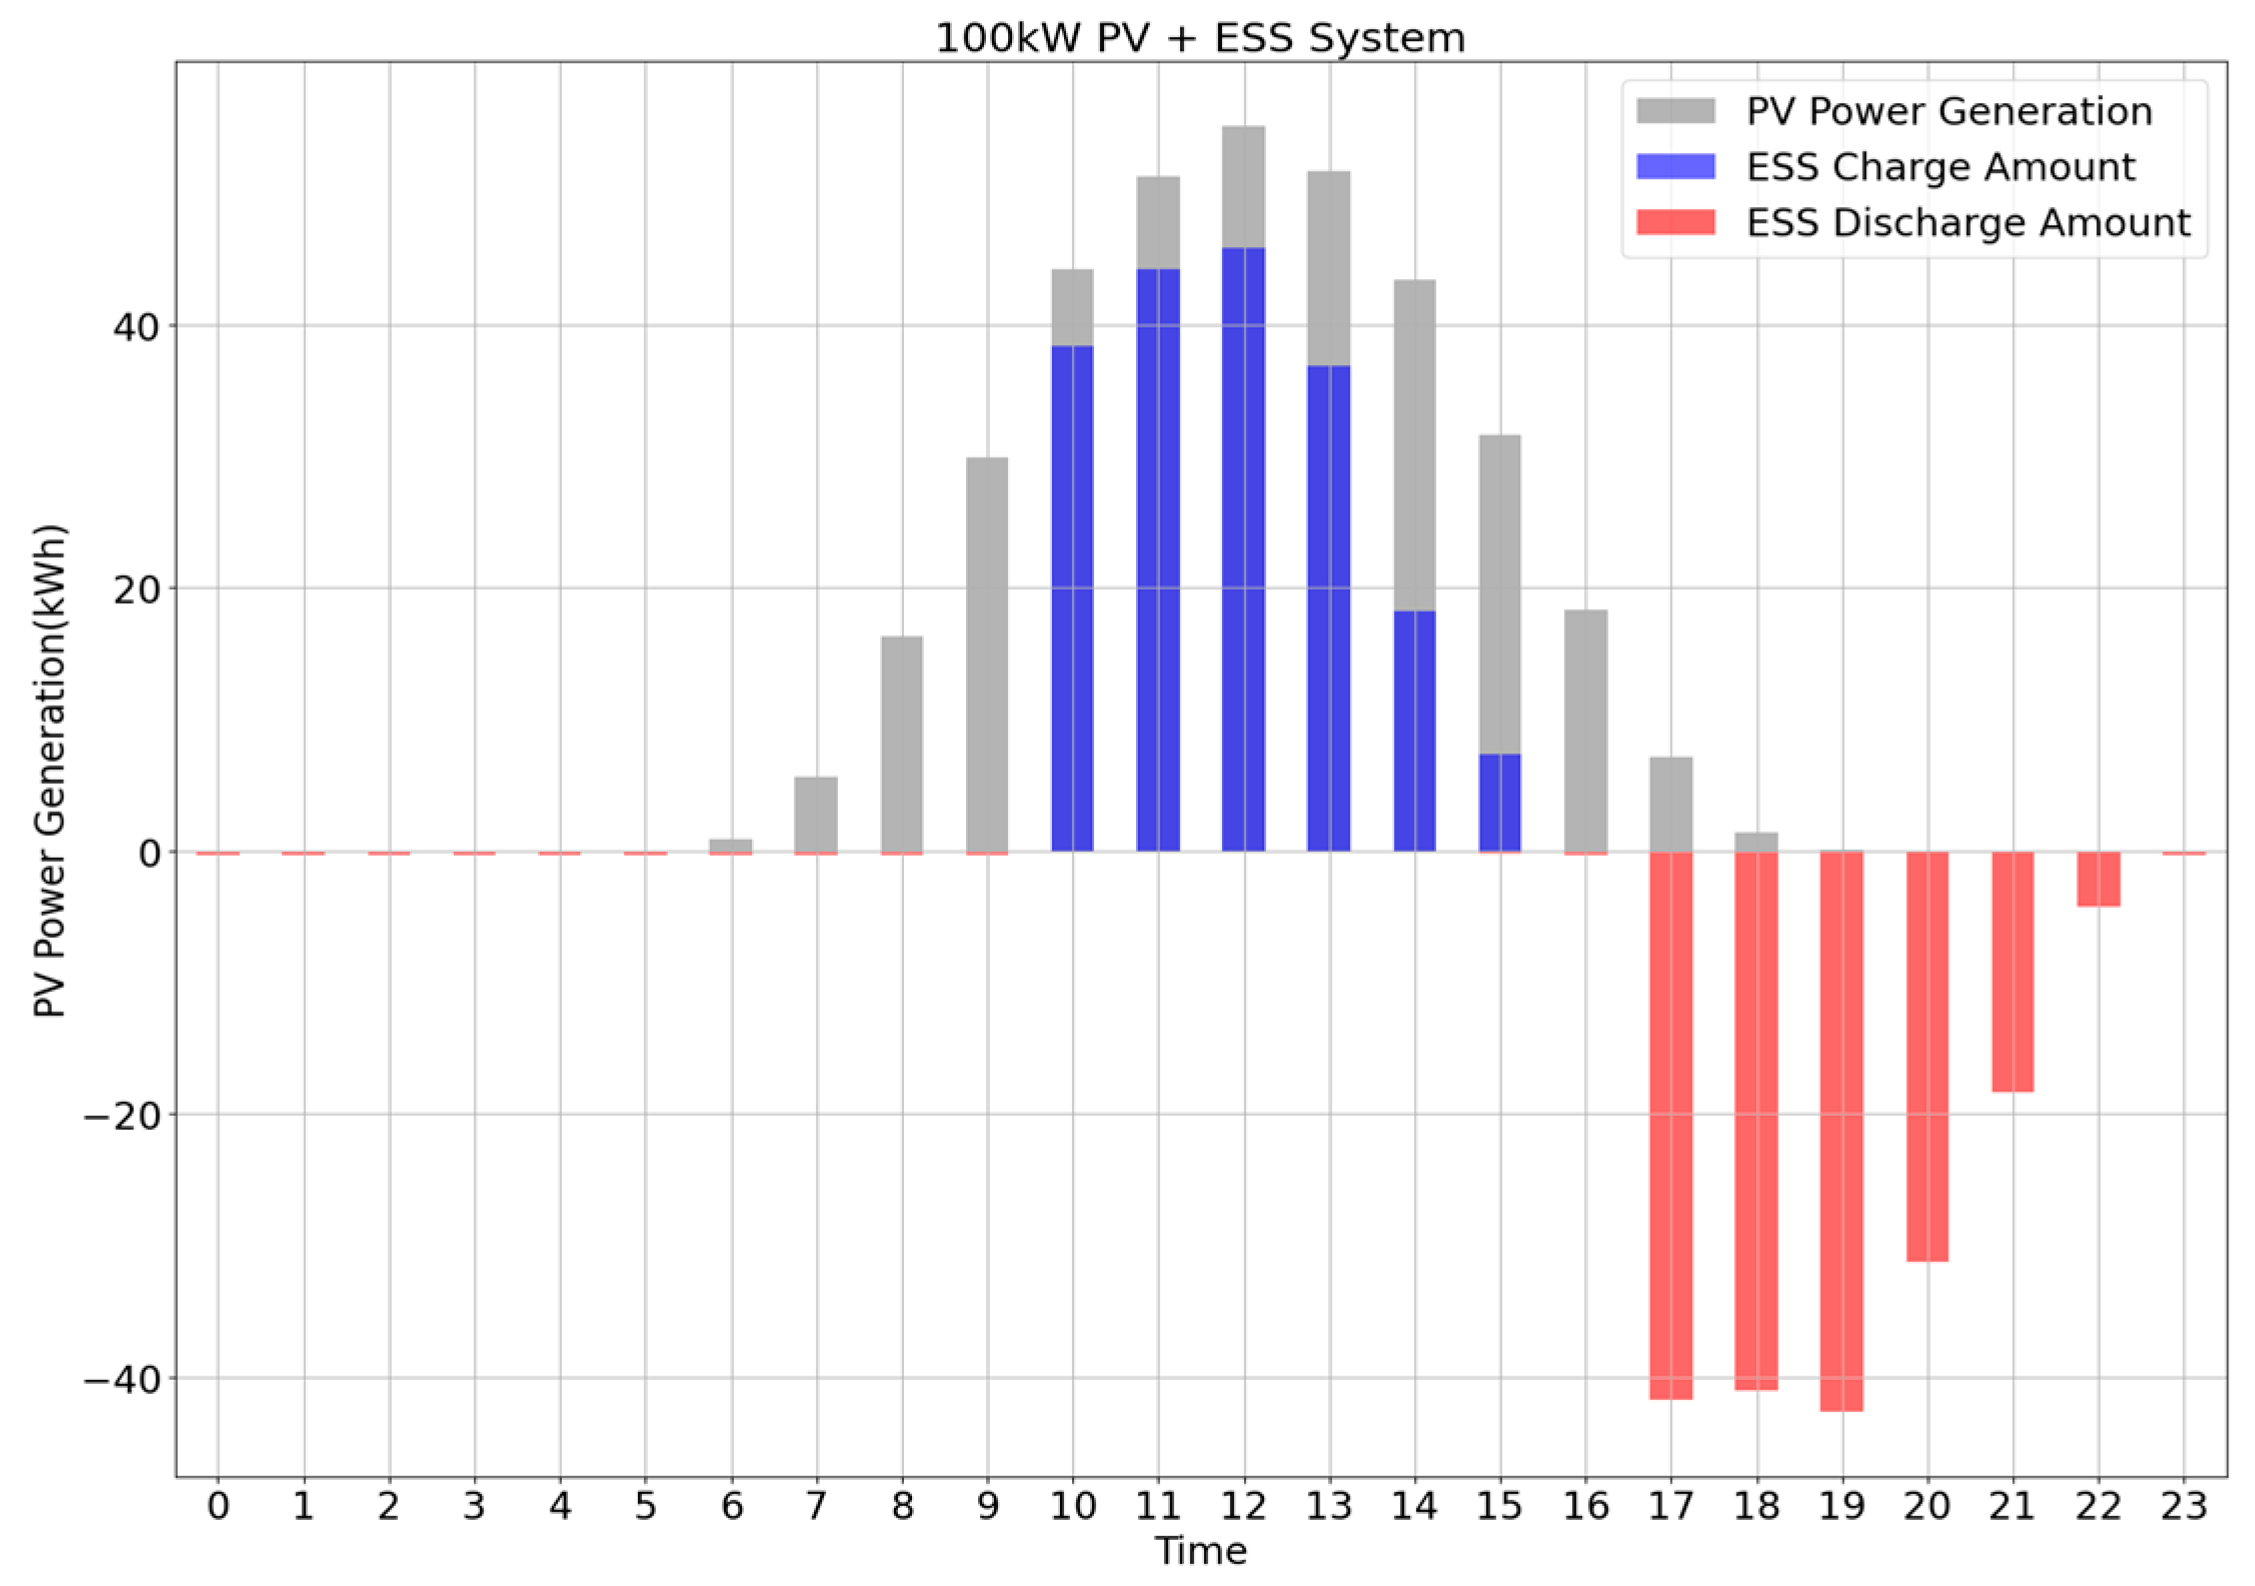
5.1. Simulation of DERs Utilizing PV
5.2. Technical and Economic Analysis of EVCS Testbeds Integrated with DERs and Local Power Grid Operations
6. Conclusions and Discussion
- (1)
- Integration of different DERs: Future research should investigate the integration of various DERs, including wind and hydropower, in suburban and rural areas, with the aim of enhancing energy efficiency and cost savings;
- (2)
- Regional and seasonal variations: It is recommended that future research investigate how geographic region and seasonal variations affect the integration and efficiency of different DERs, not just solar power;
- (3)
- User behavior and installation location: It is essential to analyze the impact of user behavior, EVCS installation location, electricity supply reliability, price volatility, and policy factors on EVCS usage patterns in order to improve deployment and operational strategies;
- (4)
- Policy and regulatory compliance: The impact of policies, regulations, economic incentives, and subsidies on the integration and efficiency of DERs and EVCSs in different regions must be investigated.
- (5)
- CAPEX analysis: A comprehensive CAPEX analysis, including the costs associated with ESSs, is essential to evaluate the economic viability of integrating DERs and EVCSs and to inform the development of effective financial support mechanisms by policymakers.
Author Contributions
Funding
Data Availability Statement
Conflicts of Interest
References
- Jagani, S.; Marsillac, E.; Hong, P. The Electric Vehicle Supply Chain Ecosystem: Changing Roles of Automotive Suppliers. Sustainability 2024, 16, 1570. [Google Scholar] [CrossRef]
- He, L.Y.; Liu, L.; Ouyang, Y.; Li, L.L. Consumer Demand, Pollutant Emissions and Public Health under Increasing Block Tariffs and Time-of-Use Pricing Policies for Household Electricity in China. Emerg. Mark. Financ. Trade 2020, 56, 2993–3014. [Google Scholar] [CrossRef]
- Shahzad, K.; Cheema, I.I. Low-carbon technologies in automotive industry and decarbonizing transport. J. Power Sources 2024, 591, 233888. [Google Scholar] [CrossRef]
- Zhang, Y.L.; Liu, X.Y.; Wei, W.S.; Peng, T.J.; Hong, G.; Meng, C. Mobile charging: A novel charging system for electric vehicles in urban areas? Appl. Energy 2020, 278, 115648. [Google Scholar] [CrossRef]
- Asna, M.; Shareef, H.; Prasanthi, A. Planning of fast charging stations with consideration of EV user, distribution network and station operation. Energy Rep. 2023, 9, 455–462. [Google Scholar] [CrossRef]
- Fiori, C.; Ahn, K.; Rakha, H.A. Power-based electric vehicle energy consumption model: Model development and validation. Appl. Energy 2016, 168, 257–268. [Google Scholar] [CrossRef]
- Ahmad, F.; Iqbal, A.; Asharf, I.; Marzband, M.; Khan, I. Placement and Capacity of EV Charging Stations by Considering Uncertainties With Energy Management Strategies. IEEE Trans. Ind. Appl. 2023, 59, 3865–3874. [Google Scholar] [CrossRef]
- Elkadeem, M.R.; Abido, M.A. Optimal planning and operation of grid-connected PV/CHP/battery energy system considering demand response and electric vehicles for a multi-residential complex building. J. Energy Storage 2023, 72, 108198. [Google Scholar] [CrossRef]
- Yousuf, A.K.M.; Wang, Z.L.; Paranjape, R.; Tang, Y.L. An In-Depth Exploration of Electric Vehicle Charging Station Infrastructure: A Comprehensive Review of Challenges, Mitigation Approaches, and Optimization Strategies. IEEE Access 2024, 12, 51570–51589. [Google Scholar] [CrossRef]
- Woo, H.; Son, Y.; Cho, J.T.; Kim, S.Y.; Choi, S. Optimal expansion planning of electric vehicle fast charging stations. Appl. Energy 2023, 342, 121116. [Google Scholar] [CrossRef]
- Loni, A.; Asadi, S. Data-driven equitable placement for electric vehicle charging stations: Case study San Francisco. Energy 2023, 282, 128796. [Google Scholar] [CrossRef]
- Afshar, S.; Pecenak, Z.K.; Barati, M.; Disfani, V. Mobile charging stations for EV charging management in urban areas: A case study in Chattanooga. Appl. Energy 2022, 325, 119901. [Google Scholar] [CrossRef]
- Enescu, F.M.; Birleanu, F.G.; Raboaca, M.S.; Raceanu, M.; Bizon, N.; Thounthong, P. Electric Vehicle Charging Station Based on Photovoltaic Energy with or without the Support of a Fuel Cell-Electrolyzer Unit. Energies 2023, 16, 762. [Google Scholar] [CrossRef]
- Marinescu, C. Design Consideration Regarding a Residential Renewable-Based Microgrid with EV Charging Station Capabilities. Energies 2021, 14, 5085. [Google Scholar] [CrossRef]
- Huang, K.; Zhao, J.T.; Sun, X.H.; Li, W.; Zheng, S. Analysis of Optimal Operation of Charging Stations Based on Dynamic Target Tracking of Electric Vehicles. Electronics 2022, 11, 3175. [Google Scholar] [CrossRef]
- Sugihara, H.; Funaki, T. Increasing electric vehicle hosting capacity and equality for fast charging stations using residential photovoltaics in medium- and low-voltage distribution networks. IEEJ Trans. Electr. Electron. Eng. 2020, 15, 364–371. [Google Scholar] [CrossRef]
- Li, W.Z.; Yang, L.L.; Wen, Z.; Chen, J.L.; Wu, X. On the Optimization Strategy of EV Charging Station Localization and Charging Piles Density. Wirel. Commun. Mob. Comput. 2021, 2021, 6675841. [Google Scholar] [CrossRef]
- Bayram, I.S.; Devetsikiotis, M.; Jovanovic, R. Optimal design of electric vehicle charging stations for commercial premises. Int. J. Energy Res. 2022, 46, 10040–10051. [Google Scholar] [CrossRef]
- Gong, C.Y.; Yao, Z.L.; Chen, H.; Huang, D.M.; Wang, X.L.; Wang, Z.X.; Shi, S. An optimal coordinated planning strategy for distributed energy station based on characteristics of electric vehicle charging behavior under carbon trading mechanism. Int. J. Electr. Power Energy Syst. 2023, 147, 108884. [Google Scholar] [CrossRef]
- Asaad, A.; Ali, A.; Mahmoud, K.; Shaaban, M.F.; Lehtonen, M.; Kassem, A.M.; Ebeed, M. Multi-objective optimal planning of EV charging stations and renewable energy resources for smart microgrids. Energy Sci. Eng. 2023, 11, 1202–1218. [Google Scholar] [CrossRef]
- Park, S.; Yun, S.P.; Lee, K.G.; Kang, B.K.; Choi, M.I.; Jang, H. Design and Implementation of a Futuristic EV Energy Trading System (FEETS) Connected with Buildings, PV, and ESS for a Carbon-Neutral Society. Buildings 2023, 13, 829. [Google Scholar] [CrossRef]
- Li, H.; Han, B.; Li, G.J.; Wang, K.Y.; Xu, J.; Khan, M.W. Decentralized collaborative optimal scheduling for EV charging stations based on multi-agent reinforcement learning. IET Gener. Transm. Distrib. 2024, 18, 1172–1183. [Google Scholar] [CrossRef]
- Mazumder, M.; Debbarma, S. EV Charging Stations With a Provision of V2G and Voltage Support in a Distribution Network. IEEE Syst. J. 2021, 15, 662–671. [Google Scholar] [CrossRef]
- Jiang, Z.Y.; Han, J.Z.; Li, Y.T.; Chen, X.Y.; Peng, T.D.; Xiong, J.L.; Shu, Z. Charging station layout planning for electric vehicles based on power system flexibility requirements. Energy 2023, 283, 128983. [Google Scholar] [CrossRef]
- Wang, Z.S.; Li, X.; Li, Y.; Zhao, T.Q.; Xia, X.; Zhang, H.Z. An Optimization Framework for Low-Carbon Oriented Integrated Energy System Management in Commercial Building under Electric Vehicle Demand Response. Processes 2021, 9, 1737. [Google Scholar] [CrossRef]
- Ullah, Z.; Wang, S.R.; Wu, G.; Hasanien, H.M.; Rehman, A.U.; Turky, R.A.; Elkadeem, M.R. Optimal scheduling and techno-economic analysis of electric vehicles by implementing solar-based grid-tied charging station. Energy 2023, 267, 126560. [Google Scholar] [CrossRef]
- De Lima, T.D.; Franco, J.F.; Lezama, F.; Soares, J. A Specialized Long-Term Distribution System Expansion Planning Method With the Integration of Distributed Energy Resources. IEEE Access 2022, 10, 19133–19148. [Google Scholar] [CrossRef]
- Castle, J.; Hendry, D. Five sensitive intervention points to achieve climate neutrality by 2050, illustrated by the UK. Renew. Energy 2024, 226, 120445. [Google Scholar] [CrossRef]
- Zhu, Y.; Ding, Y.; Wei, S.; Zafar, H.M.Y.; Yan, R. Electric Vehicle Charging Facility Configuration Method for Office Buildings. Buildings 2023, 13, 906. [Google Scholar] [CrossRef]
- Griffiths, B. Harnessing TOU Rate Complexity to Reduce Residential EV Charging Costs. 2021. Available online: https://ssrn.com/abstract=3812640 (accessed on 15 August 2024).
- Kucuksari, S.; Erdogan, N. EV Specific Time-of-use Rates Analysis for Workplace Charging. In Proceedings of the IEEE Transportation Electrification Conference and Expo (ITEC), Electr Network, Chicago, IL, USA, 21–25 June 2021; pp. 783–788. [Google Scholar]
- Bao, Y.; Chang, F.Y.; Shi, J.K.; Yin, P.C.; Zhang, W.G.; Gao, D.W. An Approach for Pricing of Charging Service Fees in an Electric Vehicle Public Charging Station Based on Prospect Theory. Energies 2022, 15, 5308. [Google Scholar] [CrossRef]
- Wang, S.Y.; Bi, S.Z.; Zhang, Y.J.A.; Huang, J.W. Electrical Vehicle Charging Station Profit Maximization: Admission, Pricing, and Online Scheduling. IEEE Trans. Sustain. Energy 2018, 9, 1722–1731. [Google Scholar] [CrossRef]
- Panossian, N.; Muratori, M.; Palmintier, B.; Meintz, A.; Lipman, T.; Moffat, K. Challenges and opportunities of integrating electric vehicles in electricity distribution systems. Curr. Sustain. Renew. Energy Rep. 2022, 9, 27–40. [Google Scholar] [CrossRef]
- Cappers, P.; Satchwell, A.; Brooks, C.; Kozel, S. A Snapshot of EV-Specific Rate Designs among US Investor-Owned Electric Utilities. 2023. Available online: https://emp.lbl.gov/publications/snapshot-ev-specific-rate-designs (accessed on 15 August 2024).
- Cancian, B.P.; Andrade, J.C.G.; Freitas, W. Technical-Economic Evaluation of EV Fast Charging Station with Distributed Energy Resources. J. Control. Autom. Electr. Syst. 2022, 33, 1724–1738. [Google Scholar] [CrossRef]
- Qiang, H.; Tang, W.Q.; Hu, Y.C.; Sun, X.P.; Zheng, J.F. Profit improvement strategy of electric vehicle charging stations sharing carbon trading revenue. J. Renew. Sustain. Energy 2023, 15, 025903. [Google Scholar] [CrossRef]
- Kouka, K.; Masmoudi, A.; Abdelkafi, A.; Krichen, L. Dynamic energy management of an electric vehicle charging station using photovoltaic power. Sustain. Energy Grids Netw. 2020, 24, 100402. [Google Scholar] [CrossRef]
- Fang, X.L.; Wang, Y.B.; Dong, W.; Yang, Q.; Sun, S.Y. Optimal energy management of multiple electricity-hydrogen integrated charging stations. Energy 2023, 262, 125624. [Google Scholar] [CrossRef]
- Cabrera-Tobar, A.; Blasuttigh, N.; Pavan, A.M.; Lughi, V.; Petrone, G.; Spagnuolo, G. Energy Scheduling and Performance Evaluation of an e-Vehicle Charging Station. Electronics 2022, 11, 3948. [Google Scholar] [CrossRef]
- Li, J.W.; He, S.C.; Yang, Q.Q.; Ma, T.Y.; Wei, Z.B. Optimal Design of the EV Charging Station With Retired Battery Systems Against Charging Demand Uncertainty. IEEE Trans. Ind. Inform. 2023, 19, 3262–3273. [Google Scholar] [CrossRef]
- Kintner-Meyer, M.; Davis, S.; Sridhar, S.; Bhatnagar, D.; Mahserejian, S.; Ghosal, M. Electric Vehicles at Scale–Phase I Analysis: High EV Adoption Impacts on the Western US Power Grid. 2020. Available online: https://www.pnnl.gov/sites/default/files/media/file/EV-AT-SCALE_1_IMPACTS_final.pdf (accessed on 15 August 2024).
- Li, X.; He, Y.C.; Guo, L.D.; Yang, G.T. Multi-year planning for the integration combining distributed energy system and electric vehicle in neighborhood based on data-driven model. Int. J. Electr. Power Energy Syst. 2022, 140, 108079. [Google Scholar] [CrossRef]
- Yoon, G.; Kim, S.; Shin, H.; Cho, K.; Jang, H.; Lee, T.; Choi, M.I.; Kang, B.; Park, S.; Lee, S.; et al. Carbon-Neutral ESG Method Based on PV Energy Generation Prediction Model in Buildings for EV Charging Platform. Buildings 2023, 13, 2098. [Google Scholar] [CrossRef]
- Han, Y.; Chen, W.R.; Li, Q.; Yang, H.Q.; Zare, F.; Zheng, Y.K. Two-level energy management strategy for PV-Fuel cell-battery-based DC microgrid. Int. J. Hydrogen Energy 2019, 44, 19395–19404. [Google Scholar] [CrossRef]
- Bekiroglu, E.; Esmer, S. Improved Energy Management System for Wind Power-Based Microgrid with EV Charge Station. Electr. Power Compon. Syst. 2024, 52, 1808–1820. [Google Scholar] [CrossRef]
- de Lima, T.D.; Soares, J.; Lezama, F.; Franco, J.F.; Vale, Z. A Risk-Based Planning Approach for Sustainable Distribution Systems Considering EV Charging Stations and Carbon Taxes. IEEE Trans. Sustain. Energy 2023, 14, 2294–2307. [Google Scholar] [CrossRef]
- Preusser, K.; Schmeink, A. Energy Scheduling for a DER and EV Charging Station Connected Microgrid With Energy Storage. IEEE Access 2023, 11, 73435–73447. [Google Scholar] [CrossRef]
- Choi, M.I.; Kang, B.; Lee, S.; Park, S.; Beck, J.S.; Lee, S.H. Empirical study on optimization methods of building energy operation for the sustainability of buildings with integrated renewable energy. Energy Build. 2024, 305, 113908. [Google Scholar] [CrossRef]
- Ha, J.; Lee, J.; Choi, S.; Park, S. COVID-19 waves and their characteristics in the Seoul metropolitan area (20 January 2020–31 August 2022). Public Health Wkly. Rep. 2023, 16, 111–136. [Google Scholar]
- Al-Wreikat, Y.; Serrano, C.; Sodre, J. Effects of ambient temperature and trip characteristics on the energy consumption of an electric vehicle. Energy 2022, 238, 122028. [Google Scholar] [CrossRef]
- Mahlberg, J.; Desai, J.; Bullock, D. Evaluation of Electric Vehicle Charging Usage and Driver Activity. World Electr. Veh. J. 2023, 14, 308. [Google Scholar] [CrossRef]
- Byrne, J.; Taminiau, J.; Kurdgelashvili, L.; Kim, K. A review of the solar city concept and methods to assess rooftop solar electric potential, with an illustrative application to the city of Seoul. Renew. Sustain. Energy Rev. 2015, 41, 830–844. [Google Scholar] [CrossRef]


| Type | 2020 | 2021 | 2022 |
|---|---|---|---|
| Data Collection Period | January 2020~ December 2020 | January 2021~ December 2021 | January 2022~ December 2022 |
| Number of EVCSs (EA) | 391 | 409 | 443 |
| Amount of Collected Data (Sessions) | 278,071 | 138,999 | 252,149 |
| Type | Residential Facilities | Educational/Cultural Facilities | Neighborhood Facilities | Commercial/Business Facilities | Public Facilities | Other Facilities |
|---|---|---|---|---|---|---|
| Number of EVCSs (EA) | 281 | 10 | 6 | 18 | 70 | 6 |
| Number of Fast Chargers (EA) | 301 | 21 | 13 | 35 | 101 | 8 |
| EVCS Charging Session (times) | 31,194 | 5936 | 9321 | 18,725 | 67,041 | 3939 |
| EVCS Charging Amount (kWh) | 780,323 | 152,814 | 221,760 | 437,545 | 1,609,891 | 98,662 |
| Charging Time (min) | 2,314,955 | 322,653 | 447,157 | 947,566 | 3,487,964 | 223,283 |
| Average Charge Time per Session (min) | 74 | 54 | 48 | 51 | 52 | 57 |
| Average Charging Session (Times) | 85 | 16 | 25 | 51 | 138 | 11 |
| Type (Unit: USD/kWh) | Demand Price | Energy Charge | |||
|---|---|---|---|---|---|
| TOU Electricity | Summer | Spring, Autumn | Winter | ||
| Tariff (EVCS) | 1.87 | Low load | 0.045 | 0.039 | 0.052 |
| Medium load | 0.074 | 0.046 | 0.066 | ||
| Peak load | 0.09 | 0.049 | 0.076 | ||
| Type (Unit: USD) | Residential Facility Testbed | Commercial/ Business Facility Testbed | Public Facility Testbed |
|---|---|---|---|
| Total Investment (Fast charger, 1EA) | 14,484.5 | 14,484.5 | 14,484.5 |
| EVCS Revenue | 3760.3 | 9832.5 | 11,587.5 |
| Demand Charge | 1121.1 | 1121.1 | 1121.1 |
| Total Energy Charge | 1131.2 | 3365.2 | 3741.3 |
| EVCS Profit | 1508 | 5346.1 | 6725.1 |
| ROI (%) | 10.4% | 36.9% | 46.4% |
| EVCS Payback Period (years) | 9.61 | 2.71 | 2.15 |
| Type (Unit: m2) | Residential Facility | Commercial/ Business Facility | Public Facility |
|---|---|---|---|
| Area | 640 | 570 | 608 |
| Operational Period | Residential Facility (Unit: USD) | Commercial/ Business Facility (Unit: USD) | Public Facility (Unit: USD) |
|---|---|---|---|
| Jan 2020 | 481.7 | 284.5 | 336.3 |
| Feb 2020 | 475.5 | 326.8 | 313.3 |
| Mar 2020 | 671.1 | 495.8 | 566.8 |
| Apr 2020 | 817.6 | 697.3 | 676.9 |
| May 2020 | 774.8 | 657.8 | 665.8 |
| Jun 2020 | 674.4 | 522.5 | 515.5 |
| Jul 2020 | 570.2 | 405.7 | 369.5 |
| Aug 2020 | 554.8 | 352.4 | 304.0 |
| Sep 2020 | 633.3 | 519.8 | 445.4 |
| Oct 2020 | 734.5 | 568.8 | 550.2 |
| Nov 2020 | 544.7 | 403.1 | 340.5 |
| Dec 2020 | 572.3 | 397.1 | 361.6 |
| total | 7504.8 | 5631.6 | 5445.7 |
| Type (Unit: USD) | Residential Facility Testbed | Commercial/ Business Facility Testbed | Public Facility Testbed |
|---|---|---|---|
| Total Investment (Fast charger, 1EA) | 14,484.5 | 14,484.5 | 14,484.5 |
| EVCS Revenue | 3760.3 | 9832.5 | 11,587.5 |
| Demand Charge | 1121.1 | 1121.1 | 1121.1 |
| Total Energy Charge | 688 | 2285 | 2555.6 |
| Residual Energy Sales Revenue | 7504.8 | 5631.6 | 5445.7 |
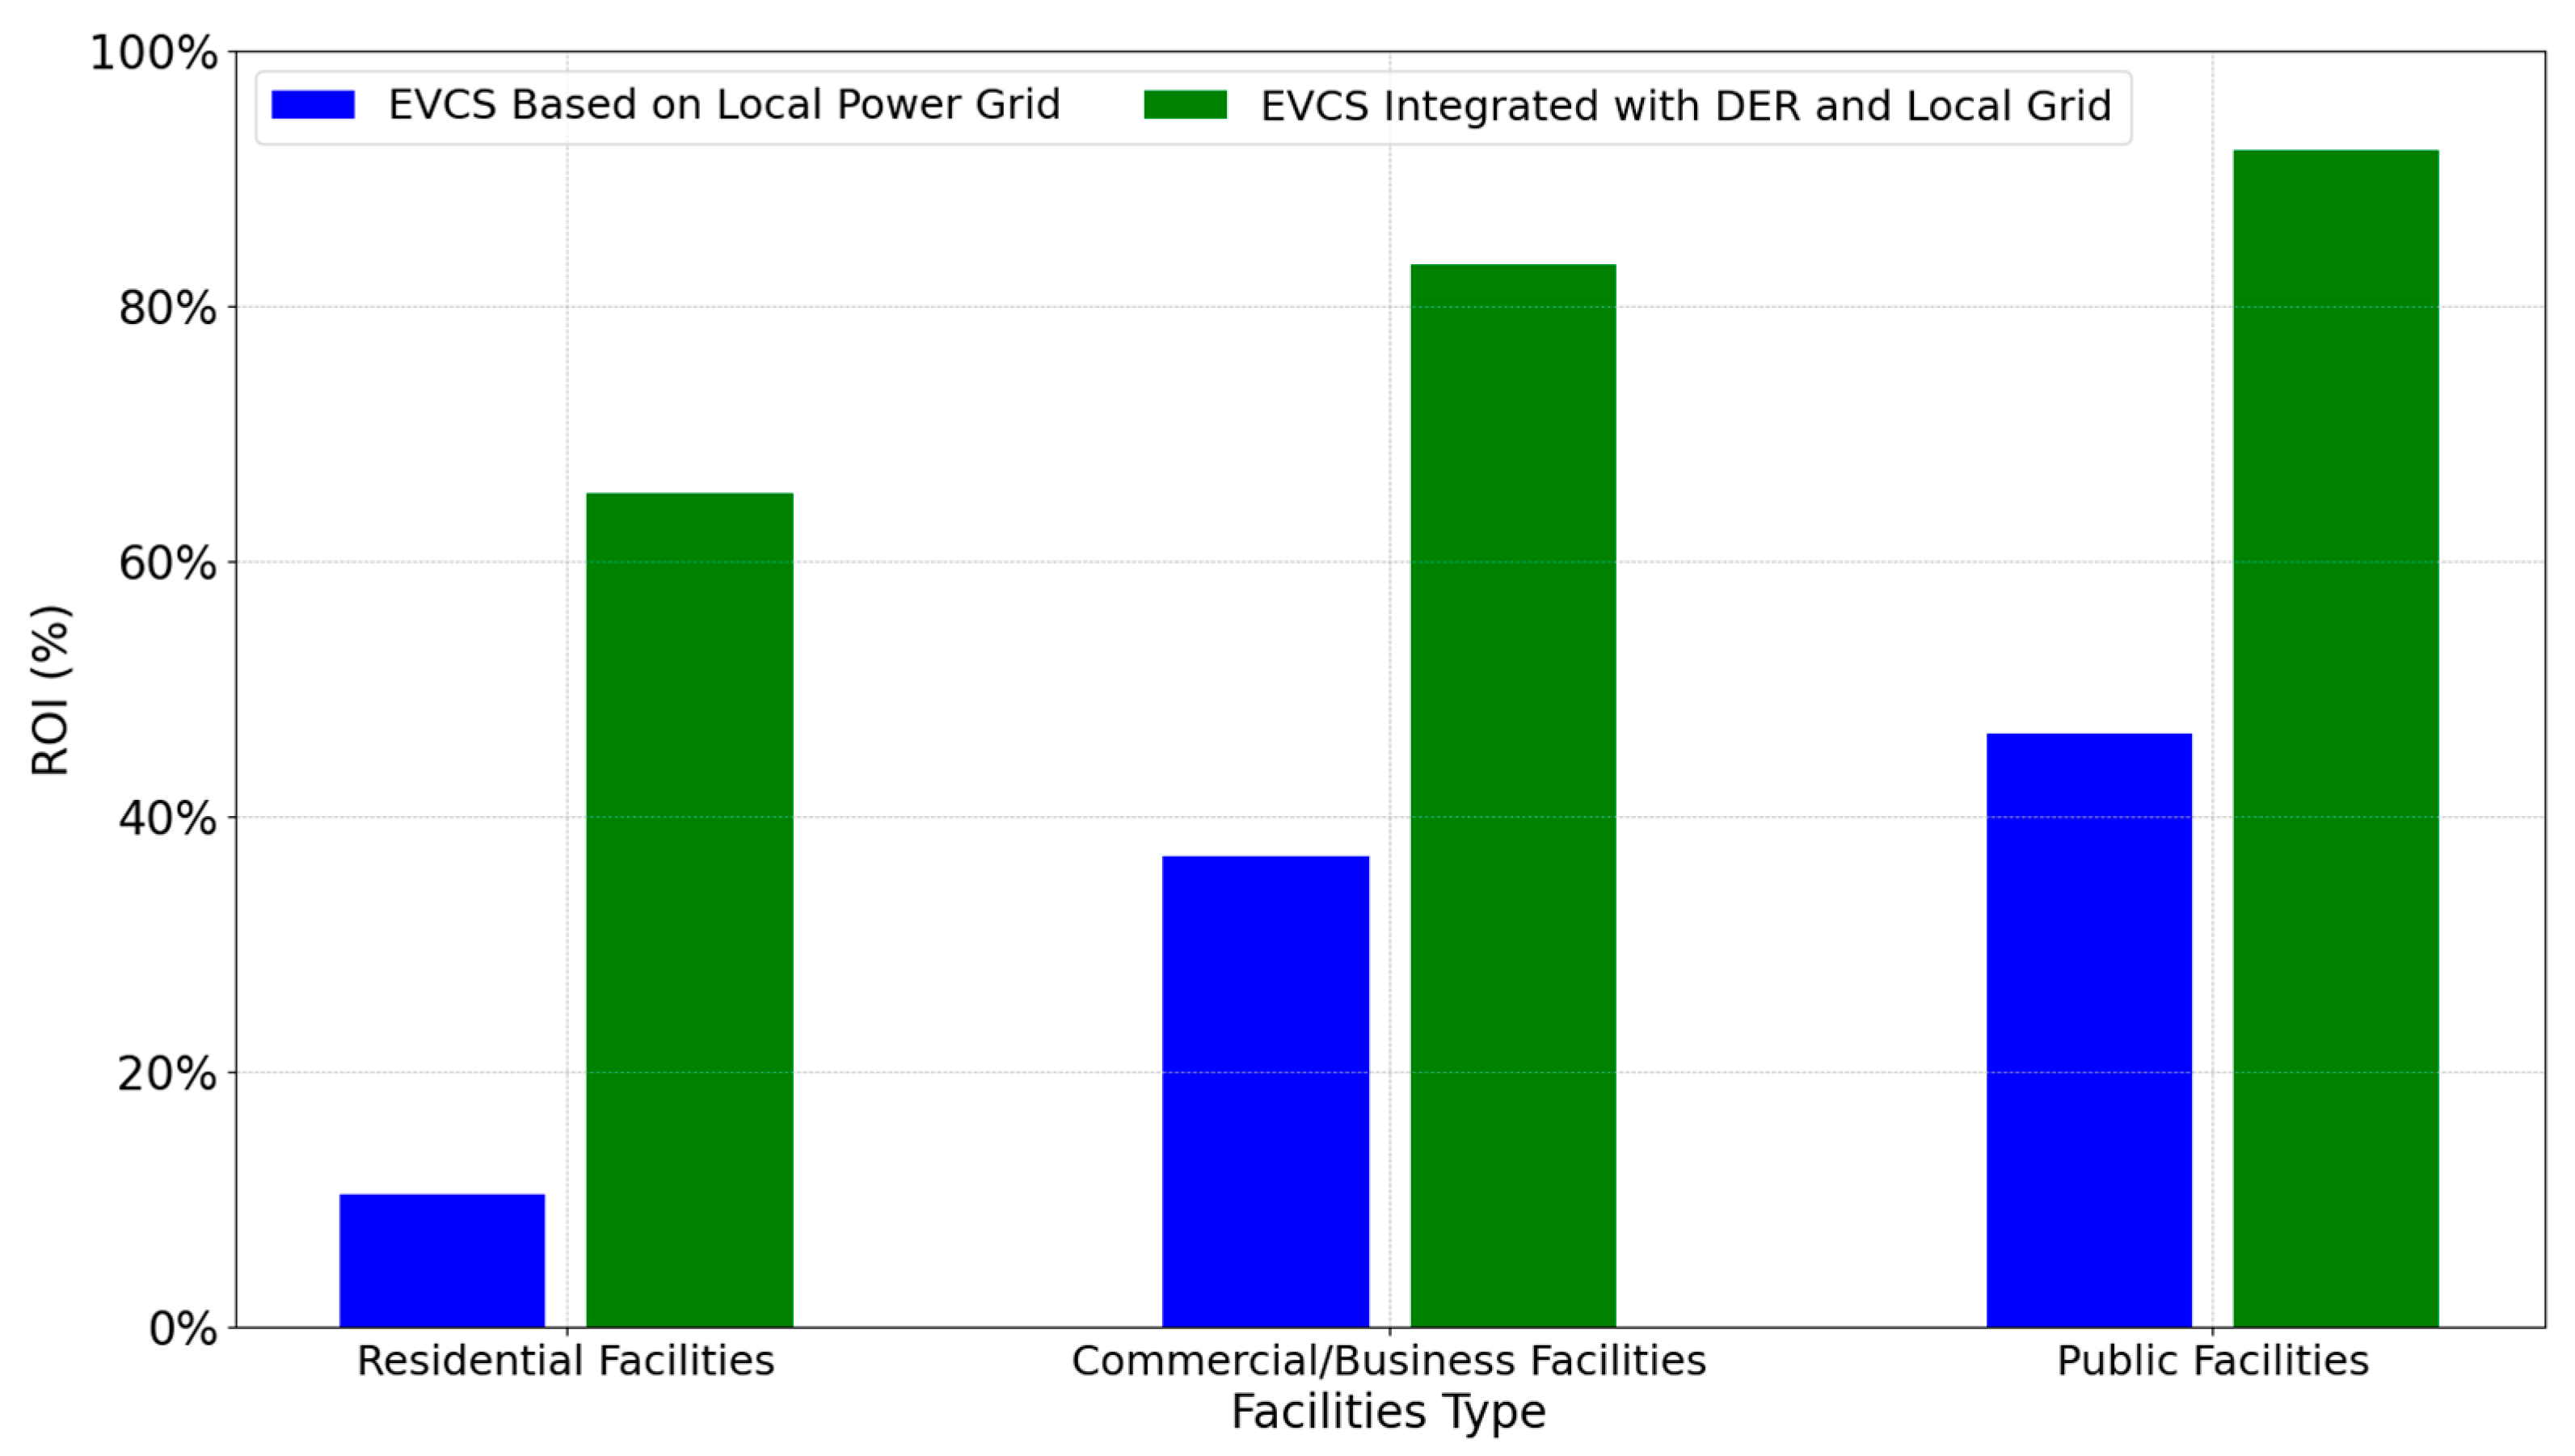
| EVCS Profit | 9456 | 12,058 | 13,356.5 |
| ROI (%) | 65.3 | 83.2 | 92.2 |
| EVCS Payback Period (years) | 1.53 | 1.20 | 1.08 |
Disclaimer/Publisher’s Note: The statements, opinions and data contained in all publications are solely those of the individual author(s) and contributor(s) and not of MDPI and/or the editor(s). MDPI and/or the editor(s) disclaim responsibility for any injury to people or property resulting from any ideas, methods, instructions or products referred to in the content. |
© 2024 by the authors. Licensee MDPI, Basel, Switzerland. This article is an open access article distributed under the terms and conditions of the Creative Commons Attribution (CC BY) license (https://creativecommons.org/licenses/by/4.0/).
Share and Cite
Lee, T.; Yoon, G.; Kang, B.; Choi, M.-i.; Park, S.; Park, J.; Park, S. Enhancing Electric Vehicle Charging Infrastructure: A Techno-Economic Analysis of Distributed Energy Resources and Local Grid Integration. Buildings 2024, 14, 2546. https://doi.org/10.3390/buildings14082546
Lee T, Yoon G, Kang B, Choi M-i, Park S, Park J, Park S. Enhancing Electric Vehicle Charging Infrastructure: A Techno-Economic Analysis of Distributed Energy Resources and Local Grid Integration. Buildings. 2024; 14(8):2546. https://doi.org/10.3390/buildings14082546
Chicago/Turabian StyleLee, Tacklim, Guwon Yoon, Byeongkwan Kang, Myeong-in Choi, Sangmin Park, Junhyun Park, and Sehyun Park. 2024. "Enhancing Electric Vehicle Charging Infrastructure: A Techno-Economic Analysis of Distributed Energy Resources and Local Grid Integration" Buildings 14, no. 8: 2546. https://doi.org/10.3390/buildings14082546