Abstract
The use of different components, such as alternative aggregates, represents an innovation in construction. According to various studies, these components improve certain properties of the elements that incorporate them. Specifically, recycled construction aggregates (RCAs)—such as crushed ceramic bricks (CCBs)—offer several benefits, including reducing landfill waste, enhancing the mechanical properties of the elements that integrate them, and ensuring availability. This research focuses on utilizing these waste materials and determining their feasibility and compatibility (in the short term) for manufacturing traditional earth blocks (EBs). This is achieved by studying the physical and mechanical properties of CCBs in matrices for EB construction, adhering to performance standards, emphasizing the advantages these aggregates provide for mechanical properties in sustainable construction and applying them in the context of traditional construction. Correlations were established through a statistical study of experimental data, graphically indicating the relationship between the different properties of CCBs, the mix design process, and the structural behavior of the resulting EB. Based on the key variable of the CCB replacement percentage, properties such as the elastic module by ultrasound, porosity, and expansion by hygroscopicity were analyzed, alongside mechanical properties like compressive and flexural strength. The results show that EBs with CCBs increases porosity by up to 21.59%. These blocks exhibit dimensional shrinkage of up to 14.5%, correlating with the increase in the CCB content. This aggregate replacement leads to a reduction in compressive strength (up to −23%) and flexural strength (up to −17.43%); however, all CCB content levels studied met the requirements of the applied standards. It is concluded that CCBs satisfactorily modifies the properties of the EBs and is suitable for use in construction.
1. Introduction
Globally, buildings that use earth as a component of their construction systems represent one-third of all structures [1]; according to F. Pacheco-Torgal [2] these represent 50% of housing construction systems, with significant prevalence in rural areas and countries in Africa, Latin America, the Middle East, Asia, and Europe [3]. In these regions, due to factors such as geographic location, social economic, political, or technical conditions, many buildings—particularly residential ones—exhibit poor habitability conditions [4,5,6].
Currently, there is growing interest in researching adobe-EBs to optimize its physical (hygrothermal) properties [7,8,9,10], chemical compositions [11], mechanical and seismic behavior [12], reinforcement (using fibers) [13], and the need for in situ studies (including historical analyses) [14,15]. Numerous studies have focused on determining the physical–mechanical and hygrothermal properties of stabilized earth blocks (SEBs) and compressed earth blocks (CEBs). The primary objective is to achieve adequate strength, using various methods such as physical compaction (to improve compressive strength) and the addition of fibers, chemical stabilizers like lime or cement, or combinations thereof.
Meanwhile, construction and demolition waste (CDW) continues to increase annually, posing a global problem [16,17,18]. CDW accounts for approximately 30% of global solid waste [19]. Leveraging its properties and reducing waste generation through its reuse as a byproduct in new activities, such as recycling for construction, presents a significant opportunity [20].
Among the various types of construction and demolition waste, ceramic brick debris (mainly composed of fired ceramic brick residues) stands out. According to the National Institute of Statistics of Spain (INE), ceramic brick waste (CBW) represents 54% of all construction and demolition waste in the country [21]. In the Soibelman report, this figure varies according to countries’ different construction contexts, ranging from 10% to 26% [22].
Traditional EB offer several valuable properties, such as an adequate thermal performance, good humidity regulations, and low production costs. Rigassi [23] considers CEB to be an evolution of traditional EB (adobe). However, it is important to highlight that their stabilization involves increased production costs, CO2 emissions, and embodied energy [24]. Therefore, the mechanical advantages must be weighed against their sustainability value. Earth-based construction provides economic and sustainable solutions, while offering intrinsic benefits such as habitability, thermal comfort, energy efficiency, sustainability, and affordability [25].
Previous studies have focused on the use of CCBs in SEBs or CEBs to achieve an efficient property performance or maximize strength. The current use of RCA as a source of new raw materials for construction has become standardized, while CCBs have become a promising material for applications such as replacing natural aggregates in mortars [26,27,28,29], geopolymers [30,31,32], concrete [33,34,35,36], soil stabilization [37], and aggregates for SEB and CEB [38,39,40], among others.
The various studies that have been carried out have focused on determining the physical–mechanical and hygrothermal properties of SEBs and CEBs. Their main objective is to achieve adequate resistance through several procedures, such as: physical compaction (for compressive strength), the use of added fibers, chemical additives such as lime or cement for stabilization, or the combination of any of the above.
This demonstrates that research into the use of CCB as aggregates in the composition of EB is still incomplete. Therefore, this work aims to study the effect produced by the use of CCB as a replacement for the aggregates that make up typical EB mixtures, in order to establish their physical–mechanical properties.
As the hypothesis of this research, it is proposed that the percentage of CCB replacement significantly affects the physical–mechanical properties of EB, depending on the amount of replacement used relative to soil (E). However, it is feasible that variations in these properties remain within the applicable regulatory standards.
1.1. Study of Physical–Mechanical Properties in EB
Soil as a raw material in construction shows variability in its characteristics and properties, which depend on factors such as its composition, manufacturing method, and environmental characteristics, among others [11]; therefore, it is essential to study it to improve its resistance, durability, and ability to generate comfort in the buildings in which it is used.
In addition, resistance and durability can also be increased through physical methods (compaction) by achieving chemical stabilization, or by applying fibers that provide improvements in the deformation behavior [41]. In the first of these—physical methods—variations in the density and porosity directly affect the strength of the resulting matrix, its bearing capacity, and also the improvement of its other mechanical properties [42]. On the other hand, chemical stabilizers, such as lime, cement, or additives, can modify the structure of the matrix that incorporates them (increased cohesion between the particles produces an improvement in the mechanical resistance). Finally, the incorporation of natural or synthetic fibers can provide “additional” mechanical strength (achieved by a uniform distribution of the load stresses, especially bending stresses) [38].
In research where different aggregates were used, including some such as RCAs, the existence of relationships linked to the trends of their mechanical properties was demonstrated [43]. For example, P. Saiz Martínez concluded that for low replacement percentages of aggregates by RCA, the physical–mechanical properties establish better results, but when the replacement percentage was increased excessively, the behavior of the properties decreased, due to reduced cohesion between particles and the increase in the porosity generated [40].
Consequently, the behavior of the properties of the EBs has a direct correlation with the constituent components and with their matrix structure. Their modification by any of the aforementioned methods leads to a significant alteration of their properties [44]. Thus, the study of the physical–mechanical properties of different compounds in EBs (which cause increases in their resistance) is crucial for the development of this construction system.
1.2. Incorporation of CCB in Eb Manufacturing
Several researchers have studied the effects of CCBs on SEBs and CEBs when used as stabilizing aggregates; these CCBs cause incidences in several properties of these EBs, such as: their density [45], their thermal [20,46,47] and mechanical properties [20,40,45,46,47], durability [45,46], and resistance to abrasion [20], as well as other aspects such as production costs [47], etc. There is also a lack of specific research dealing with the properties of EBs without stabilization, or only with CCBs as substitute aggregates. Therefore, the use of CCBs in soil-based construction systems, and specifically, in the manufacture of EBs, currently represents an innovation in sustainable construction.
2. Materials
The EBs studied consisted of different soil (E), CCBs, and water contents. These aggregates are shown in Figure 1, where differences in the particle sizes and shapes can be seen, as well as their tones or color.
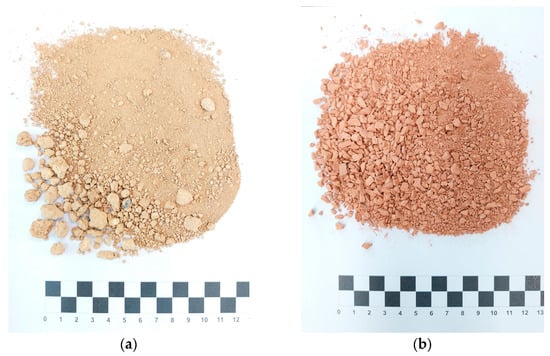
Figure 1.
Aggregates used to produce EBs: (a) E, (b) CCBs.
2.1. Soil
The E used comes from near the town of Viladamat, Spain (42°08′08.1″ N 3°02′54.3″ E). It was supplied by an industry that guarantees compliance with E-080 [48] and UNE 41410 standards for its product. It was established as the ideal choice due to its granulometric characterization and fineness modulus (FM), the determination of its clay and moisture content (HC), its Atterberg limits, specific gravity, and shrinkage.
The FM of a material is defined as the descriptive parameter related to its particle size gradation. It is obtained by adding the percentages of the sample materials that are retained by the standard sieve sizes (5, 10, 18, 35, 60, and 125, divided by 100) [49].
Based on the standard soil classification system, ASTM D2487-11 [50], the properties of E are classified as well-graded sand with clay (SW-SC), within the limits established in the UNE 41410 standard [51] as suitable for EB manufacture. The following composition was established (%): 88.3 of sand, 2.72 of silt, and 8.14 of clay. The Atterberg limits determined with ASTM D4318-17e1 [52] were 17.89% HC for the liquid limit (LL) and 17.24% HC for the plastic limit (PL). Finally, its specific gravity was set at 1266 Kg/m3, with HC of 3.69% and linear shrinkage of 5.33% [53] in LL. The properties are shown in Table 1, while the particle size distribution is shown in Figure 2. The following nomenclature agreement is established: XX% E + XX% CCB, where XX% is the percentage of each component in the different studio mixes. In this figure, the maximum and minimum limits correspond to those specified in UNE 41410 [51].

Table 1.
Physical properties of earth and CCB.
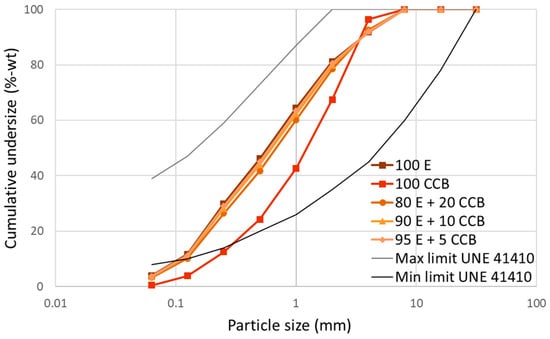
Figure 2.
Granulometry of the E and CCBs used, and of the different dosages studied.
2.2. CCB Aggregates
The ceramic brick aggregates (CCB) were obtained from a treatment and recycling plant (a waste management company) near the town of Manresa, Spain (41°45′25.3″ N 1°47′05.1″ E), which had previously separated, cleaned, crushed, and screened the fired ceramic bricks. This process transforms construction waste into second-generation aggregates. Regarding the use of these second-generation aggregates in this research, it was considered that they retain their inherent and immutable condition as established by the waste management plant, as this is the commercially available condition of their production. Only the particle size was adjusted manually, through sieving with a No. 5 sieve (4 mm), in compliance with ASTM E11/95 [54] and UNE 7050-2 [55] standards and meeting the granulometric requirements of E-080. To prepare the samples in the characterization stage, the guidelines established in the UNE 103:100 [56] standard were followed, while the UNE-EN ISO 17892-1 [57] standard was applied for moisture determination. Finally, the CCB used was considered free of organic or carbonated material, so no additional treatment was required.
The particle size was limited to a maximum of 5 mm. Its Atterberg limits were determined in a sieved sample with a particle size of less than 400 μ (UNE Standard 7-050/2 [55]), obtaining 14.51% of HC for LL and 28.55% of HC for PL. The specific gravity was 1120.03 Kg/m3 with one HC of 0.4% (considering it as a crushed aggregate). The physical properties are shown in Table 1 and the particle size distribution is in Figure 2.
2.3. Water
Drinking water was used in the characterization and manufacture, according to the RD 3/2023 [58] standards, with its composition being certified by the drinking water quality reports of Aigües de Barcelona; this also meets the requirements of the E-080 [48] standard for the manufacture of EBs.
3. Methods
The research of the EBs was composed of three differential stages (DS): the first involved characterizing the component materials of the mixtures; the second related to the dosage and manufacture of the specimens; and the third was the experimental evaluation of the physical–mechanical properties of the manufactured specimens. In cases where statistical data processing was required, the Statistical Software Package for Social Sciences (SPSS) v. 29.0.0.0 (241) was used. The Image-Pro v. 11.0.4 Build 9821 software by Media Cybernetics was used for the image analysis study.
All results were carefully verified and analyzed in each specific case, for example, in obtaining representative batches of materials, verifying the contents and components of the clay used, following a standardized and detailed manufacturing process, considering the testing ages of the different specimens and properties, and adhering to the standardized specifications of the tests.
3.1. Characterization of Aggregates
The specific and apparent gravity of the E and the CCBs were determined according to the ASTM C128-22 [59] standard; the HC of the aggregates was determined in compliance with the UNE-EN ISO 12570:2000 [60] specifications.
A particle size analysis was carried out according to UNE-EN ISO 17892-4:2019 [61] to determine the particle size distribution. Sieves with openings of 8, 4, 2, 1, 0.5, 0.25, 0.125, and 0.063 mm were used, as indicated in the ISO 3310 standard [62]. To achieve the correct distribution of particle size, the limits indicated in both the “soil texture diagram spindle” of the UNE 41410-2023 standard [50] and the referential limits of the ASTM C144-18 standard [63] were considered. Several authors [64,65,66,67] observed that an increase in the incorporation of CCBs also leads to an increase in the mechanical strength of the EBs; however, in some cases this can also cause an (sometimes undesired) increase in their porosity or voids.
Some previous studies have established ranges for material replacements in the composition of EBs, such as the use of waste date palm [64], where different dosage percentages were studied, with a maximum replacement of up to 15% of E with waste date palm. This study found a decline in the performance of mechanical properties with more than 11% replacement. Another study utilized natural coal aggregates [65] as a replacement material for E; this research analyzed three additional dosages beyond the control, with a maximum replacement content of up to 20% (the maximum replacement value according to recommendations from PR XP P13-901 [68] and Houben et al. [69]). A decreasing trend in performance and properties was established, with an optimal value (for density and compressive strength of 15% replacement). On the other hand, similar studies using organic stabilizers with contents between 3 and 6% (such as barley straw, hemp shiv, and corn cob barley straw) [67] established a loss in compressive and flexural strength in the blocks incorporating them. With regards to replacing E with bio-aggregates (barley and lavender straw) [66], two dosages were prescribed (in addition to the control) within a replacement material range of 3–6% by weight. It was found that the 3% replacement of lavender straw achieved adequate durability, while the barley straw replacement improved the thermal properties.
All the aforementioned studies can be considered as references for the extreme limitations of the maximum and minimum content levels of alternative materials replacing E, or for a dosage constituting the matrix of an EB under study (in accordance with the applicable standards). They also demonstrate that the efficiency of the studied properties falls within this range of replacement percentages.
The following criteria were assessed in order to establish the study dosages: first, the provisions of the UNE 41410-2023 [51] standard were considered, which prescribe a limit of 15% additive use (with chemical reagent input as a stabilizer). Then, based on the results of the fineness modulus obtained from the materials used, this parameter is maximized when the maximum value of the CCB content is reached, replacing the E by 35%. Therefore, a maximum replacement percentage of CCBs by E of 20% and values with intervals of 10 and 5% were also established, which were then used to determine the proportional relationship of this effect or the fundamental study variables in the physical and mechanical properties. The results of the different particle size combinations under study are shown in Figure 2.
The Atterberg limits, understood as being the water content values that cause the material to exhibit plastic and liquid behavior, were set according to ASTM D4318-17e1 [53] (Figure 3). The plastic limit of a soil (UNE-EN ISO 17892-12 standard [70]) is the lowest moisture content with which the soil can be considered to have a plastic behavior. The liquid limit is the moisture content at which a soil, mixed with water, exhibits liquid behavior and some resistance to shear, tested using the Casagrande method (UNE-EN ISO 17892-12 standard [70]). According to the E-080 [48] standard, the HC used in the manufacture of the EB must not exceed 20%; if exceeded, this could lead to a loss of resistance in the EB. According to P. Wiehle et al. [71], the type and quantity of clay, as well as other parameters—such as the organic content—influence the HC of the soils, and in turn, the HC also influences the mechanical behavior of the EBs. Therefore, the results of the LL and PL established for the materials used were compared with those indicated in the E-080 standard in order to determine the optimal HC of the different dosages. In the case of LL regressions, both materials present an inverse sense of proportionality between the variables, with significant correlation coefficients R2 that could be considered very strong [72]; in the case of PL, it is evident that CCBs will require higher HC than E to achieve workable consistencies.
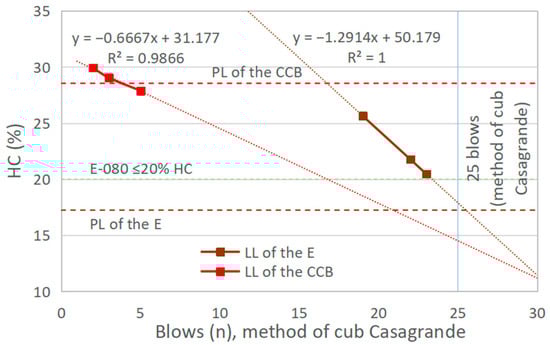
Figure 3.
Comparison of the LL and PL of the E and the CCBs under study.
In the case of E, the LL values are projected with HC < 20%, which is not achieved in the case of CCBs. This could be adverse in the mechanical properties of EBs if their contents were high (predominance in behavior due to the predominance of the content). Therefore, in accordance with E-080, HC of 17.24% is established by extrapolation for E; a tendency to increase the HC is expected to be directly correlated with an increase in the replacement of E by CCBs in the other study mixtures, which will bring them closer to the Atterberg limits.
Table 2 shows the quantities of the different EB components needed to produce 1m3.
Table 2.
Matrix compositions of the studied EBs.
The shrinkage test or shrinkage limit was performed for sample E in accordance with the AS 1289.3.4.1-2008 [53] standard. A ring-type mold with a 55 mm diameter and 12 mm thickness was used. The study mixture with HC equal to LL was poured in, then the sample was allowed to dry for 24 h at room temperature. It was then dried for a further 24 h in an electric oven (100 ± 5 °C), obtaining a shrinkage of 5.33%.
The incidence of chemical composition was carried out by thermogravimetric analysis (TGA) (see Section 3.3.6 and Section 4.7).
3.2. Manufacturing
The manufacture of mixtures and specimens was carried out according to the specifications of the E-080 standard [48], making one type of mixture with homogeneous characteristics per day. H. Houben, in his book Earth Construction Technology [73], indicates the feasibility of making mixtures for earth construction by applying different mechanical methods, although he also indicates the risk of possible lump formation and a lack of homogeneity. This can be solved by means of the correct particle size combination, by determining and correcting the HC in the mixing, the introduction of the materials into the mixer in the correct order or sequence, and correct handling techniques.
A 150 l Guy Noel brand 25 rpm electric concrete mixer model B150 was used to prepare the mixtures, after saturating the walls of the concrete mixer with water to prevent the loss of the HC. The introduction of the components and handling of the concrete mixer were as follows: introduction of the E and CCB with the concrete mixer tank in a vertical position; when rotation begins it is slowly tilted to a 30° angle; finally, the mixing was carried out gradually and the required water was introduced during the mixing process (see Figure 4).
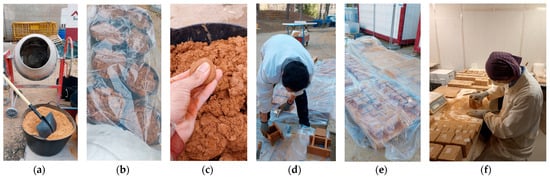
Figure 4.
(a) Concrete mixer and mixing materials; (b) First saturation and hydration rest; (c) Humidity control and correction; (d) Block making in molds; (e) Drying and curing; (f) Face polishing.
Similar studies note that the best indicators were achieved with mixing tanks filled to between 28 and 32% of their capacity (saturation of their capacity causes a decrease in the homogeneity of the mixture) [74]. For our study, it was established that the uniformity of the mixture and its optimal consistency were reached at 30% of the tank’s capacity and with a 30 min mixing time.
Prior to kneading, the HC of the materials was determined, and if required, was corrected, thus guaranteeing that the HC dictated in the design of the different mixtures was maintained. At the end of the mixing period, the homogeneity of the mixture and the HC were verified; if correct, the mixture was manually extracted using shovels, placed in 50 L plastic containers, and left to rest for 24 h. To prevent any loss of HC, the containers were protected from wind, rain, and solar radiation by being covered with a plastic film. After resting, it was poured in approximately 2 cm layers into previously moistened wooden molds until they were full. Finally, a moistened trowel was used to ensure the specimens were flush with the upper and lower faces.
The molds used were made from pine and coated with two layers of a water-repellent product for outdoor wood. The dimensions of the molds for the different specimens and the tests that they were used in are shown in Table 3.
Table 3.
Specimen dimensions and study test.
Specimens were dried and cured for a period of 90 days to achieve a HC between 1.4 and 2%. During this water stabilization process, the weight of specimens A, B and C was determined with a Kern digital scale, model KB 3600-2N (capacity of 3600 g and accuracy of 0.01 g). Their final dimensions (width, length, and height) were determined with a Storm brand Vernier (accuracy of 0.01 mm). On the other hand, the D specimens were weighed on a Gram HGM Series digital scale (capacity of 20 kg and accuracy of 1 g); their dimensions were determined with a flexible metal tape measure (accuracy of 1 mm).
Next, after drying, all specimens except for D and E had their faces polished with No. 80 and 180 sandpaper in order to eliminate surface irregularities and to ensure accurate measurements and readings in the subsequent tests. Finally, the weight and dimensions of each specimen were determined again.
3.3. Experimental Evaluation
The complete process of characterization, manufacture, and testing of EB properties required a duration of one year (2023–2024). The specific physical and mechanical properties tested are detailed below.
3.3.1. Test to Determine Apparent Density and Porosity
The UNE-EN ISO 18754:2022 [75] standard was applied in order to determine these properties; each result obtained was the average of four type A specimens per study dosage. The equipment used was a Telstar S.A-Torricelli Mod. CD-6, equipped with a cold trap to prevent moisture from passing into the engine. Once the vacuum has been carried out (duration 15 min), the specimens were totally immersed in alcohol. The specimen container was then matched to the atmospheric pressure and the saturated and submerged weight was determined. The dry weight was determined by drying the samples in an oven for five days at 60 ± 5 °C to avoid disintegration due to shrinkage of the specimens. With the above parameters, the regulatory formulations were applied to obtain the bulk solid density, bulk density, and pore content.
3.3.2. Method for Hygroscopic Expansion Test
Taking into account the shrinkage of the E used (see Section 2.1), the case of the dimensional variation caused by the replacement percentage of E by CCB was studied. In this case, the ASTM C426-22 [76] and UNE-EN 1367-4 [77] standards were considered; in particular, four type B specimens were tested per study dosage. In each specimen, two hydraulic shrinkage anchor pins were arranged, using hydrophobic and thermo-resistant adhesive (Ceys-Montack) on the faces. These reference points were then used to establish the dimensional changes they experienced, which were determined using a precision micrometer, Mitutoyo brand with an accuracy of 0.0001 mm.
The process included the following phases: The samples were dried in an oven for 72 h at 60 ± 5 °C, then their temperature was stabilized by placing them in an acrylic climatic chamber (equipped with silica gel) for 24 h at 20% relative humidity (RH). Then, they were left for another 24 h at a temperature of 20 °C and 45% RH, at which point the first determination of dimensional variation was made. All subsequent determinations were made with specimens placed in a wet chamber (20 °C and 100% RH) every 24 h for seven days. The weight was established using a Kern scale with a maximum capacity of 3600 g and accuracy of 0.01 g, to establish the moisture contents of the specimens together with the volumetric changes.
3.3.3. Method for Compressive Strength Test
This property was obtained by jointly adapting the ASTM C39 [78], ASTM C-67 [79], UNE-EN 772-1:2011 [80], and E-080 [58] standards; according to the latter, six type C specimens were made for each study dosage. As an adaptation, the upper and lower faces of the specimens were refaced by applying a 5.4 mm neoprene layer, then they were positioned in contact with 9 mm thick metal distribution plates in order to guarantee the correct distribution of the applied load. A Mecánica Científica S.A brand multi-test press with a capacity of 300 KN was used to apply the loads; the load application speed was established at 3 N/min.
3.3.4. Method for Three-Point Bending Test
This was carried out by applying ASTM C-67 [79], ASTM C1161-13 [81], and E-080 [48]; the latter was only as a criterion to establish the number of specimens (six of type D for each percentage of replacement). The test configuration was to position the rollers (Φ = 40 mm) at a mid-axes distance of 30 cm at the bottom of the specimen, with the third at the top in the center. The press used was the same as for the compression test, except that the speed applied was 0.25 N/min in order to allow the properties to be obtained correctly.
3.3.5. Method for Ultrasound Analysis Test
The objective of this test is to measure pulse velocity by ultrasonic wave transmission (UPVs) induced by two transducers positioned at the ends of the study specimen. Using the UPV data, the property of the Elastic Modulus, also known as Young’s modulus (E∂), can be indirectly and quantitatively established. This test was carried out in accordance with the ASTM e 1876-01 [82] and UNE-EN 14146:2004 [83] standards, applied to seven available type A specimens and four type B specimens, in order to verify the effect of size on the results. The UPV used was the Pundit Lab (+) Proceq model, equipped with transducers and contact gel, a guarantee of the continuity of the interface. See Figure 5.

Figure 5.
UPV equipment positioned in one of the samples.
3.3.6. Method for TGA Test
This was performed with a Netzsch STA 449 F5 Jupiter thermogravimetric analyzer (Figure 6). The study samples were simplified by sectioning representative sizes produced from manual crushing to samples equal to 5 g. Temperatures ranging from ambient temperature to 1000 °C were applied during the test, the heating rate was established as a constant equal to 10 °C/min, and the sample was subjected to a hydrogen atmosphere to avoid calcination due to the ignition of the components.

Figure 6.
TGA equipment.
4. Results and Discussion
4.1. Characterization Results
The granulometric analyses of E, CCBs, and the mixtures with the different replacements of E by CCBs are within the limits of the soil texture diagram spindle. Thus, they have established themselves as aggregates with particle grades suitable for use in the EB factory [51].
The LL and PL describe the consistency and behavior of the mixtures as a function of the HC, marking these parameters for the ideal dosage in the aggregates studied. For E, the HC obtained in LL was 17.89 and PL was 17.24%; these limits establish a plasticity index close to the maximum HC parameters for EB manufacture, thus making possible its use in EBs, as specified in E-80 (HC% ≤ 20), while C. Kouakou established it at (16 ≤ HC% ≤ 35) [84].
In the case of the CCBs, the LL and PL established values of 14.51 and 28.55% of HC, respectively, thereby giving them a higher need for HC. During this test, the CCB established a “dry” consistency in the Casagrande cup method; in all the tests carried out, the phenomenon of liquefaction was present when a small number of blows were applied. According to the UNE-EN ISO 17892-12:2019 [70] standard, the CCB used is classified as non-plastic flooring.
The HC results of the consistency test according to E-080 for the different dosages—starting with E—are shown in Figure 7. Here, the results of the HC analysis of the different replacements according to particle size graduation—with a particle range up to 5 mm—(E-080) turned out to be positioned below the LL (14.89% HC of E and 14.51% HC of CCB) and PL (17.24% HC of E and 28.55% HC of CCB) from both materials. These dosages also show a direct and upward trend in the HC according to the content of CCBs replaced in E.
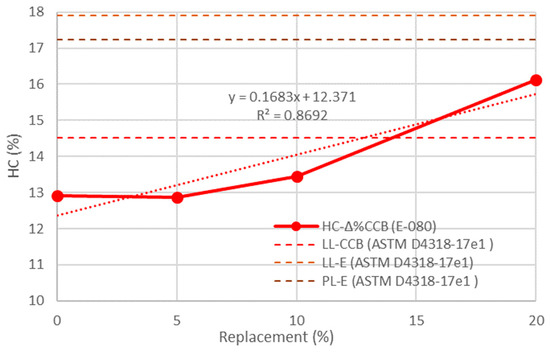
Figure 7.
HC content for CCBs replacing E.
4.2. Density and Apparent Porosity
Figure 8 shows the results of the apparent solid density (1350.03, 1374.93, 1394.33, and 1429.87 kg/m3, respectively), bulk density (1154.44, 1151.98, 1135.24, and 1121.16 kg/m3, respectively), and pore content (14.49, 16.21, 18.58, and 21.59%, respectively) for the different study matrices. The observed relationships indicate that an increase in the replacement percentage produces an increase in the apparent solid density and pore content. Respectively, these are linked to the fact that the CCB is denser and its structure produces an increase in porosity [40]. On the other hand, the increase in CCBs in the study matrix will produce a decrease in the bulk density, as this is established considering the pores present in the materials.
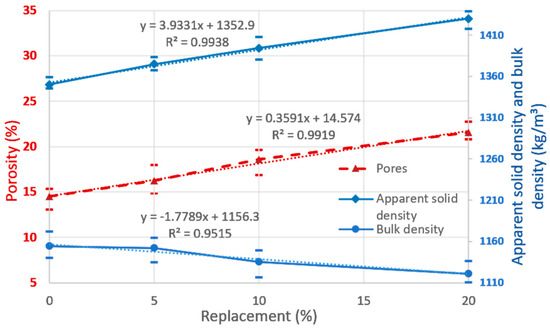
Figure 8.
Apparent solid density, bulk density, and pore content.
4.3. Hygroscopic Expansion Test Results
The replacement of CCBs in the study matrices, and the HC present, involved three phases of the longitudinal dimensional variation (Δx in mm) of the specimens. The first represents the specimens in the drying chamber conditions (with silica gel) at 20% RH and 21 °C; the second phase represents the specimens in ambient (laboratory) conditions at 48% RH and 20 °C (Δx was established when the constant weight was reached); finally, the third stage deals with those specimens in humidity chamber conditions at 100% RH and 20 °C (See Figure 9).
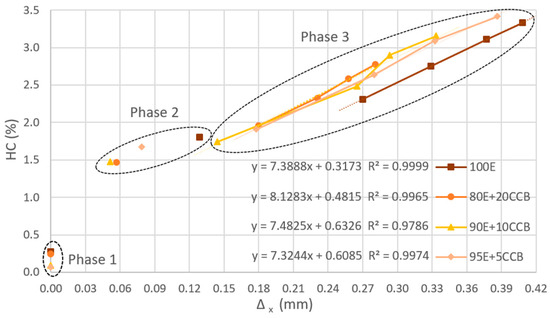
Figure 9.
Δx of the study matrices from HC ≈ 0. Regression equations valid only for phase 3.
In the case of phase one, the study variables are in stable conditions of volumetric variation (samples with HC ≈ 0%). In phase two, the inclusion of CCBs leads to more stability of Δx than in the case of 100E. Finally, in phase three, the samples establish a direct correlation with the duration of exposure in a wet room, and maintain the same stability criterion of Δx indicated in phase two. However, the path between the points for the same study variable (increments of Δx) reduces its rate of change over time.
The dimensional difference between phase one and two is attributable to the greater absorption capacity that E has (with significant clay contents) compared to the variables that contain CCBs (which have a stabilized and rigid structural matrix).
In phase three (first study point), there are Δx values of approximately double those established in phase two, an effect achieved by having abundant moisture to saturate and open porosity for access. Its justification is just as valid as the arguments indicated above for E and CCBs.
With regard to phase three (a group of relative points per study variable), the slopes (s) that describe them reach values in the range of 7.3244 ≤ s ≤ 8.1283 (with a standard deviation (σ) of: σ = 0.3743). This establishes similar sensitive values, s, in the study variables of this phase, which can be explained if we consider that the increase in the capacity of Δx is not correlative to the structure of the matrix, but to the phenomenon of interstitial saturation.
Observed over time, the travel distances of the four points are higher in the matrices containing CCBs than the one that only has E (100E); this shows that its saturation process is lower and, therefore, more time will be required to equal Δx than in the 100E sample.
4.4. Compressive Strength Test Results
All the compressive strength results obtained (fc in MPa) from the EB were established above the minimum requirement of the E-0.80 standard, being in the order of 1.6 times higher (for the mean of matrices containing CCBs) and twice as much (for 100E) above it. If we consider the UNE 41410 standard (for CEBs), these would be classified as BTC3 type (for 100E, fc limit ≥ 3) and for the rest of the study matrices incorporating CCBs, they are of the BTC2 type (fc limit ≥ 1.3).
To validate the experimental results, a statistical study was carried out to evaluate the data. Shapiro–Wilk tests were performed for each dataset corresponding to the percentage of CCB replacement, yielding asymptotic or bilateral significance values of p ≥ 0.05 for all group correlations. Thus, normal distributions (parametric tests) were assumed. The Pearson correlation was chosen to evaluate the degree of correlation between the percentage of CCB replacement and the uniaxial compressive strength of all experimental values. This resulted in a correlation coefficient of −0.832 (bilateral p < 0.001). This correlation should be considered as being strong or very strong [72].
The regressive tendency of the experimental results is inverse and decreases according to the amount of CCBs replacing E. This is attributable in the first instance to the significant increase in porosity, the reduction in the bulk density (also linked to porosity), and finally to the loss of the matrix’s cohesive capacity, which occurs when the clay content provided by E is reduced.
Using the regression equation (see Figure 10) and projecting hypothetical replacement percentages until the minimum acceptance limit of E-080 (fc = 1 MPa) is reached, it is found that the maximum theoretical replacement of CCBs by up to 41% of E is acceptable.
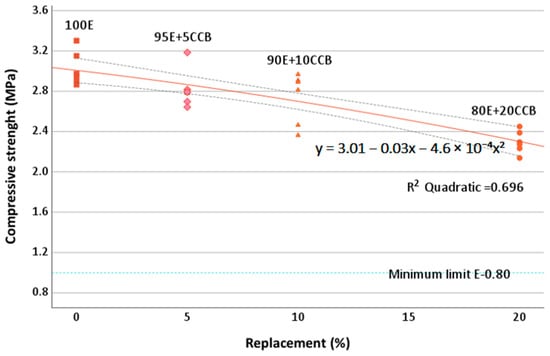
Figure 10.
RH ratio for the study matrices. The dashed line shows the mean confidence interval (CI) for 95%.
4.5. Three-Point Bending Test Results
In this case, it is established that the values achieved from the different study matrices all exceed the minimum limit of the E-080 standard (tensile test with ft = 0.08 MPa). The behavior of the different matrices studied is consistent with the behavior of the fc, as mentioned above; however, for the bending strength (fb), it is linked with parameters related to the structure of the matrix itself, such as the shape and angularity of the aggregates, the interstitial transition zone (ITZ)), and good particle size graduation, porosity, and density. These last three properties are coherent and binding for fb in the EB studied, as well as in the results presented in previous sections of this research.
Specifically, the values obtained for fb (see Figure 11) cover a range of general variations for all the BS of 1 ≤ fb ≤ 1.6 MPa studied, exceeding those indicated as acceptable for flexo-traction (fbt) (fbt ≥ 0.35 MPa) by P. Walker [85], or even those established for SEBs and CEBs (0.4 ≤ fbt ≤ 1.2 MPa) [86]. It is worth noting that in the case of the 95E + 5CCB study matrix, one of the results for this variable is classified as a statistical outlier (7 MPa), falling below the First Quartile (Q1) at a distance of more than −1.5 times the Interquartile Range (IQR); this is a statistical outlier > Q1–1.5 (IQR). The E-80 standard allows (due to the natural variability of the test and materials) two of the lowest values to be eliminated from the six replicable samples for a given study variable, thereby establishing the representative value as the average of the four best results. However, it has been decided to present all results in this case to show the full range of experimental information contained in this study.

Figure 11.
Ratio of fb to study matrices, CI = 95%.
4.6. Ultrasound Analysis Test Results
To determine E∂, it is necessary to first establish the value of the longitudinal strain constant with respect to the transverse constant (μ Poisson’s coefficient); to do so, previous research related to this coefficient [12,87,88] was consulted. As a result, and considering the resistance values reported, Miccoli’s work [87] was selected for its similarity to this study. It was necessary to carry out a statistical evaluation of numerical regression and coupling with the values established here. The results obtained were μ = 0.401, 0.413, 0.418, and 0.442 for 100E, 95E + 5CCB, 90E + 10CCB, and 80E + 20CCB, respectively. Applying the provisions of the regulations [82,83], the E∂ resulting from the study matrices presented a variation of 2.19 ≥ E∂ ≥ 1.34 GPa, in accordance with [8,71,87]. See Figure 12.
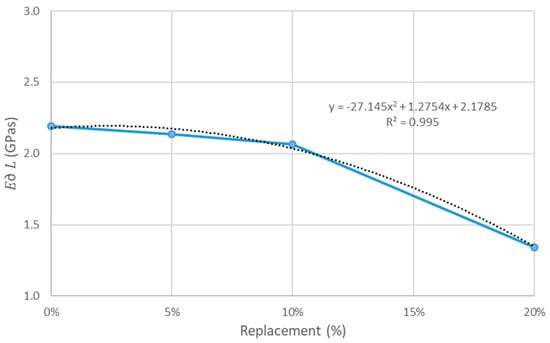
Figure 12.
E∂ obtained for the different study matrices.
It can be indicated that the CCBs within the study matrices indirectly alter the E∂ values of the matrices, causing the E to reduce E∂ when the content of CCBs increases. This is attributable to the generation of greater porosity, intricately linked to the increase in CCBs in the study matrices.
4.7. TGA Test Results
The results of the TGA test show five DS, which were identified by the significant variation of the curves of the derivative (dTGA (%/min)). Likewise, dTGA is obtained from the mass loss percentage ratio (TGA in %/W) vs. the temperature increase (°C) data. See Figure 13.

Figure 13.
TG and dTGA tests for 100E and the different matrices incorporating replacement CCBs.
The DS-1 was established in the temperature range (TR), with an ambient temperature ≤ TR ≤ 268.75 °C, establishing the first peak (P): P-1 = 138 °C and P-2 = 209 °C. These changes in DS-1 correlate with the phenomenon of an endothermic reaction by the removal of surface water and the loss of water located at the interlayer of the matrix [89,90,91]. Comparing the mass losses of each study matrix (in T = 268.75 °C), the following values were established: 2.69, 2.47, 2.36, and 2.05% for 100E, 95E + 5CCB, 90E + 10CCB, and 80E + 20CCB, respectively.
The DS-2 was set at 268.76 ≤ TR ≤ 360.34 °C without showing significant P; the change in DS-2 corresponds to the decomposition of the organic matter contained in the matrix of the study variables [89,90,92]. The mass losses were 0.25, 0.24, 0.24, and 0.22%, respectively.
The DS-3 was established at 360.35 ≤ TR ≤ 625.65 °C, with P-3 = 560 °C, which corresponds to the transformation of α quartz into β quartz [90,91,93]. The changes in DS-3 are generally related to the onset of the dehydroxylation of clayey materials (illite, vermiculite, chlorite, and kaolinite) [89,91,92,94]. A comparison of mass losses shows 1.58, 1.49, 1.36, and 1.20%, respectively.
The DS-4 was in the range of 625.67 ≤ TR ≤ 823.48 °C without showing significant P; the change in DS-4 corresponds to the decomposition of magnesite and the beginning of calcite decomposition [90,91,94]. The changes in mass loss are 2.47, 2.33, 2.25, and 1.96%, respectively.
Finally, the DS-5 is established at 823.49 ≤ TR ≤ 993.61 °C, identifying P-4 = 929 °C (the most significant of the entire test, and the one considered by the DS-5 itself). These changes are attributed to the endothermic decomposition of carbonates (calcite, kaolinite, and dolomite) [90,92,94] and the final decomposition of clayey materials (illite, vermiculite, and chlorite) [89,91,94]. The comparison of areas of mass loss in DS-5 were 7.64, 7.36, 6.84, and 6.18 (%/W-ºC), respectively.
Without discriminating by DS, the total mass loss area (TMLA, %/W-ºC) (ambient temperature ≤ TMLA ≤ 1000 °C) obtained for each of the matrices in Figure 13 was TMLA = 14.64 for 100E, 13.82 for 95E + 5CCB, 12.98 for 90E + 10CCB, and 11.53 for 80E + 20CCB, which means a percentage decrease of 5.61, 11.34, and 21.22% with respect to 100E. This establishes a direct correlation between the mass loss—TGA test—and the replacement of CCBs by E in the study matrices.
The behavior of the variables for this TGA test is linked to the crystallization (vitrification) experienced by the CCBs in their previous use, prior to being integrated as components of the EBs. In this previous stage, the clay structures were subjected to high temperatures for firing [89,91,95], changing their three-dimensional structure and reducing the distances between their layers [89]. This establishes an inverse relationship between the content of active clay minerals and the CCB content of the matrix available for calcination in TGA. Finally, in addition to the above, matrix structures with reduced microstructural porosities are created [96], resulting in a less available water content and clay compounds for elimination. The correlation resulting from this test is also consistent with the results of the apparent solid density.
4.8. Microstructural Study of the Constituent Matrices
As an alternative study to provide further insight into the causes of the physical and mechanical behavior of the EB, an Optical Image Analysis (OIA) study was conducted to examine the study variables and understand the microstructure of the matrices of these materials. For this purpose, study specimens of approximately 2 × 2 × 1 cm were prepared by extracting samples from untested EB specimens (cut using a diamond blade on a mechanical saw). These samples were embedded in epoxy resin and, after hardening, one face was metallographically polished. Figure 14 shows an example of the process for obtaining the study samples for OIA (100E matrix case). Once the images of the processed samples were obtained, the Image-Pro v. 11.0.4 Build 9821 software was used for the OIA.
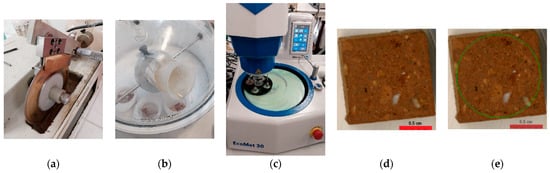
Figure 14.
Example of obtaining samples for OIA study. (a) Sample cutting, (b) epoxy resin embedding, (c) metallographic polishing, (d) surface of the face to be studied, and (e) definition of area of interest.
Using the OIA study protocol established in the Imagen-Pro software, four phases were identifiable in each area of interest.
Phase 1: Earth (E) + CCB (in light orange). This phase represents the combination of both materials (in the respective proportions of each sample) in their small particle size fraction, which constitutes the “background” material permeating the entire matrix and binding the components of the other study phases.
Phase 2: Porosity (in black). This phase represents the absence of a material composition, identified as voids or pores that have not been filled with any material.
Phase 3: Ceramic aggregate (CCBs) (in dark orange). This phase shows the ceramic aggregates present, characterized by large particle sizes that can be identified individually and are completely surrounded by compounds from the matrix defined in Phases 1 or 2.
Phase 4: White aggregate (in white). This phase identifies aggregates that, due to their composition, are not part of the CCB. These are distinguishable from the rest of the E material by their large particle size and white color.
This study measured the areas within the region of interest for the different phases of each study matrix, which were then reported as percentages of each phase (ensuring comparable representativity among the studied samples). The average area of all study samples was 1.32 cm2 (with σ = 0.0111). Figure 15 shows the results of the images after applying the phase identification protocol.
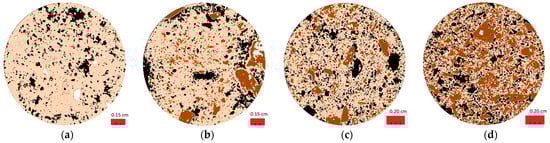
Figure 15.
Identification of the four phases of components present in the microstructure of each area of interest in the different matrices that compose the research. (a) Matrix 100E, (b) Matrix 95E + 5CCB, (c) Matrix 90E + 10CCB, and (d) Matrix 80E + 20CCB.
With the phases quantified in percentage terms, Figure 16 shows them with regard to the replacement matrices of the research.
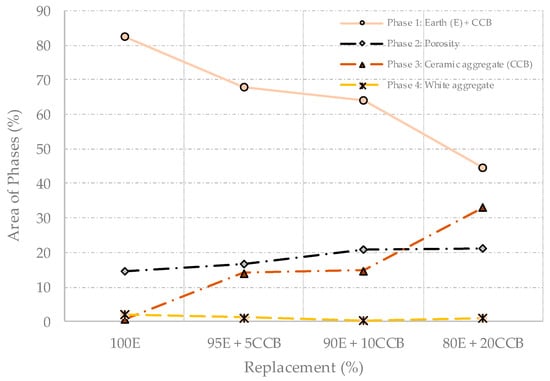
Figure 16.
Percentage areas of the different phases identified in the OIA process.
From the results of the quantified areas (in percentage terms) of each phase identified in the matrix, the following deductions can be presented.
Phase 1 (E + CCB): This is the most representative of the four study phases in percentage terms for the EB matrix. Its trend is inversely (decreasing) proportional to the increase in CCBs, with a pronounced and consistent pattern. This indicates that this phase is directly linked to the behavior of the uniaxial compression and bending test mechanical properties, where the intrinsic properties of E contribute to the strength of the matrix, while the increase in CCBs leads to a reduction in strength. However, this does not apply to thermal effects (TGA), where matrices with a higher CCB content are less prone to weight loss during testing.
Phase 2 (Porosity): The trend closely aligns with that shown in Figure 8. The average variation between the two techniques, for all study variables, was only 0.69% (with a differential variation range from −0.26 to +2.35%). Regarding its distribution within the regions of interest, in the case of 100E, the porosity shows a notably localized concentration in specific areas. As the percentage of CCBs in the EB increases, the porosity decreases in size but becomes more dispersed. This implies that increasing the CCB content leads to increased porosity within the matrix, shifting from large pores to smaller, more dispersed ones.
Phase 3 (CCB): The percentage area behavior is directly proportional to the replacement factor of E with CCBs and the results of the physical properties of the EBs (e.g., apparent solid density, which is consistent as this property is based on the crushed aggregate). However, it is inversely proportional to the mechanical properties (uniaxial compression and bending test), indicating that increases in the CCB content negatively affect both mechanical properties.
Phase 4 (White Aggregate): This phase shows an overall mean of only 1.14% across all study variables (with a maximum value of 2.04% for the 100E variable). Thus, its impact on the behavior of physical or mechanical properties is not considered significant or predominant.
4.9. Environmental Considerations
Additionally, it should be noted that the use of EBs also involves certain significant environmental considerations; for example, previous life cycle analysis (LCA) studies—focused on stabilized EBs—have shown that traditional EBs release less CO2 and contain less embodied energy [24,97]. This only has an impact when the processes are mechanized or incorporate compounds—stabilizers—that require additional treatment, such as calcination [44]. These CO2 emissions and energy consumption during production generate an environmental impact [98].
If the use of second-generation materials is considered in the composition of the EBs, it contributes to establishing lower environmental profiles. A specific case is CCBs, which are a byproduct of the industry. This not only revalues waste materials, but also reduces the need for virgin materials, thereby preserving and avoiding the depletion of other material deposits [44].
Therefore, it can generally be said that EBs (without firing or stabilizers) release lower carbon quantities into the atmosphere compared to SEBs and CEBs (which both produce 80% less than fired bricks) [99]. It should be noted that this does not eliminate the need to analyze the potential variations in the different clays and aggregates that form each EB matrix in order to establish a complete LCA. For instance, there are losses in the quality of the original material—CCBs—that prevent its total recycling, thereby limiting its recovery potential [24]. Another environmental factor to consider in LCA in EBs, which may be considered concomitant or indirect, is the reduced environmental impact due to the shorter transportation distance [100] to construction sites and aggregate quarries, which are usually nearby. This contrasts with constituent matrices that require industrialized components such as cement or other stabilizers [101].
Likewise, the environmental impact produced by the transport of the EBs used in CCBs represents a lower CO2 emission, since it can be reduced by 0.49 L/100 km for every 100 kg of a reduction in the weight transported (previous data [47] extracted from [102]). Therefore, it can be established that, in the present research, including CCBs in the EBs can reduce the density and decrease the weight by approximately 50 kg/m3 for an 80E + 20CCB mix, which represents a maximum reduction of 0.245 L/100 km during transportation.
5. Conclusions
Based on a thorough analysis of the soil and compatible aggregates, such as crushed brick, along with the manufacturing technique and curing process of traditional unstabilized, unfired earth blocks, this study demonstrates the potential development of traditional blocks, with the aim of standardizing and qualifying them as a suitable material for construction and building applications.
The results show that crushed ceramic brick aggregates modify the physical and mechanical properties of earth blocks (unstabilized and unfired), with the replacement percentage of the new aggregate being a key determinant of the physical–mechanical properties. This relationship is influenced by the soil apparent density, bulk density, and pore content, resulting in less dense and more porous earth blocks as the aggregate dosage increases. This makes them viable and ideal for use in wall systems that control hygrothermal conditions in buildings through controlled pore generation, paving the way for future research directions. Furthermore, these properties support their classification as a sustainable material by promoting the use of residual (or second-generation) materials and reducing associated transportation costs.
Crushed ceramic brick aggregates in earth blocks significantly reduce dimensional shrinkage or variations caused by ambient humidity, resulting in a construction element that performs better in environments with high relative humidity.
Regarding the results for the compressive strength, flexural strength, and elastic modulus, the earth blocks showed a good mechanical performance, meeting the minimum requirements set by regulations. These results are comparable to those obtained in similar studies, and in some cases, they even meet the requirements established for both stabilized and compressed earth blocks. Thus, earth blocks incorporating crushed brick aggregates are suitable for use in building construction. However, to complete the analysis of the blocks’ durability properties, further research on this material is needed with regard to standardizing its use, particularly with recycled aggregates such as crushed ceramic brick. For instance, future studies could examine the impact of different types of clay on the mechanical properties of blocks incorporating crushed brick aggregates or other recycled aggregates.
The above highlights the viability of using crushed ceramic brick aggregates as a replacement for traditional aggregates in earth block production, with the main advantage being their stress–strain behavior.
Finally, it is necessary to indicate that the existence of uncertainties, such as the intrinsic variability of the origin or batches of materials (over time), requires establishing validation processes for their possible applicability.
Author Contributions
Conceptualization, J.M.G.-S.; methodology, J.M.G.-S. and C.A.C.-E.; software, C.A.C.-E.; validation, M.C.G.-S.; formal analysis, C.A.C.-E.; investigation, J.M.G.-S. and M.C.G.-S.; resources, J.M.G.-S. and M.C.G.-S.; data curation, C.A.C.-E.; writing—original draft preparation, C.A.C.-E. and J.M.G.-S.; writing—review and editing, M.C.G.-S.; visualization, C.A.C.-E. and J.M.G.-S.; supervision, J.M.G.-S. All authors have read and agreed to the published version of the manuscript.
Funding
This research received no external funding.
Data Availability Statement
The original contributions presented in this study are included in the article. Further inquiries can be directed to the corresponding author.
Acknowledgments
The authors thank PROGRAMA NACIONAL DE BECAS Y CRÉDITO EDUCATIVO-PERU (PRONABEC) for its doctoral scholarship program, the EPSEB-UPC, and the Department of Architecture Technology-EPSEB-UPC.
Conflicts of Interest
The authors declare no conflicts of interest.
Acronyms/Abbreviations/Initialisms
| CBW | Ceramic brick waste |
| CCB | Crushed ceramic brick |
| CCBs | Crushed ceramic bricks |
| CDW | Construction demolition waste |
| CEB | Compressed earth block |
| CEBs | Compressed earth blocks |
| CI | Confidence interval |
| DS | Differential stages |
| dTGA | Derived from thermogravimetric analysis |
| E | Soil |
| EB | Earth block |
| EBs | Earth blocks |
| FM | Fineness modulus |
| HC | Moisture content |
| IQR | Interquartile Range |
| ITZ | Interstitial transition zone |
| LL | Liquid limit |
| OIA | Optical Image Analysis |
| P | Peak |
| PL | Plastic limit |
| RCA | Recycled construction aggregate |
| RCAs | Recycled construction aggregates |
| RH | Relative humidity |
| RD | Royal decree |
| S | Slope |
| SEB | Stabilized earth block |
| SEBs | Stabilized earth blocks |
| SPSS | Statistical Software Package for Social Sciences |
| T | Temperature |
| TGA | Thermogravimetric analysis |
| TMLA | Total mass loss area |
| TR | Temperature range |
| UPV | Ultrasonic pulse velocity |
| W | Weight |
| Symbols: | |
| Δx | Longitudinal dimensional variation |
| Φ | Diameter |
| E∂ | Young’s modulus |
| fc | Compressive strength |
| fb | Bending strength |
| fbt | Flexo-traction |
| σ | Standard deviation |
| μ | Poisson coefficient |
| Others: | |
| ASTM | American Society for Testing and Material Standards |
| BTC2 | Classification for Type 2 earth blocks according to their compressive strength, determined by UNE 41410 standard |
| BTC3 | Classification for Type 3 earth blocks according to their compressive strength, determined by the UNE 41410 standard |
| INE | National Institute of Statistics of Spain |
| ISO | International Organization for Standardization |
| E-080 | Peruvian standard for design and construction with reinforced earth |
| UNE | Una Spanish Standard Norm |
References
- Jaquin, P.A.; Augarde, C.E. Earth Building: History, Science and Conservation. Dec. [Online]. 2012. Available online: https://durham-repository.worktribe.com/output/1124958 (accessed on 13 December 2024).
- Pacheco-Torgal, F. 1—Introduction to eco-efficient masonry bricks and blocks. In Eco-Efficient Masonry Bricks and Blocks; Pacheco-Torgal, F., Lourenço, P.B., Labrincha, J.A., Kumar, S., Chindaprasirt, P., Eds.; Woodhead Publishing: Oxford, UK, 2015; pp. 1–10. [Google Scholar] [CrossRef]
- Viñuales, G.M. Tecnología y construcción con tierra. Apunt. Rev. Estud. Sobre Patrim. Cult.—J. Cult. Herit. Stud. 2007, 20, 220–231. [Google Scholar]
- Simões, G.M.F.; Labaki, L.C. Thermal discomfort and adaptation strategies in Brazilian social housing. Build. Environ. 2025, 269, 112368. [Google Scholar] [CrossRef]
- Ogu, V.I. Rural housing quality in Nigeria: A case study from Imo State. Habitat Int. 1994, 18, 53–65. [Google Scholar] [CrossRef]
- Mamani, G.M.; Cahuapaza, Y.R.E.; García, A.J.M.; Asencio, S.F.; Mamani, V.E. Evaluation of thermal insulation in rural dwellings for their natural bioclimatic conditioning at 3820 m.a.s.l. SciELO Prepr. 2023. [Google Scholar] [CrossRef]
- Taallah, B.; Guettala, A.; Guettala, S.; Kriker, A. Mechanical properties and hygroscopicity behavior of compressed earth block filled by date palm fibers. Constr. Build. Mater. 2014, 59, 161–168. [Google Scholar] [CrossRef]
- Haddad, K.; Lannon, S.; Latif, E. Investigation of Cob construction: Review of mix designs, structural characteristics, and hygrothermal behaviour. J. Build. Eng. 2024, 87, 108959. [Google Scholar] [CrossRef]
- Bamogo, H.; Ouedraogo, M.; Sanou, I.; Ouedraogo, K.; Kalifa, D.; Aubert, J.; Millogo, Y. Improvement of water resistance and thermal comfort of earth renders by cow dung: An ancestral practice of Burkina Faso. J. Cult. Herit. 2020, 46, 42–51. [Google Scholar] [CrossRef]
- Cagnon, H.; Aubert, J.; Coutand, S.; Magniont, C. Hygrothermal properties of earth bricks. Energy Build. 2014, 80, 208–217. [Google Scholar] [CrossRef]
- Lahbabi, S.; Bouferra, R.; Saadi, L.; Khalil, A. Study of the physicochemical, mineralogical, and geotechnical properties of clayey soils to improve the durability of eco-construction materials in the rural region. Constr. Build. Mater. 2024, 411, 134304. [Google Scholar] [CrossRef]
- Miccoli, L.; Müller, U.; Fontana, P. Mechanical behaviour of earthen materials: A comparison between earth block masonry, rammed earth and cob. Constr. Build. Mater. 2014, 61, 327–339. [Google Scholar] [CrossRef]
- Charai, M.; Salhi, M.; Horma, O.; Mezrhab, A.; Karkri, M.; Amraqui, S. Thermal and mechanical characterization of adobes bio-sourced with Pennisetum setaceum fibers and an application for modern buildings. Constr. Build. Mater. 2022, 326, 126809. [Google Scholar] [CrossRef]
- Wakil, M.; El Mghari, H.; Kaitouni, S.I.; El Amraoui, R. Thermal energy performance of compressed earth building in two different cities in Moroccan semi-arid climate. Energy Built Environ. 2024, 5, 800–816. [Google Scholar] [CrossRef]
- Papayianni, I. Earth Block Houses of Historic Centers. A Sustainable Upgrading with Compatible Repair Materials. Procedia Environ. Sci. 2017, 38, 274–282. [Google Scholar] [CrossRef]
- Wang, C.; Xiao, J.; Zhang, G.; Li, L. Interfacial Properties of Modeled Recycled Aggregate Concrete Modified by Carbonation. Constr. Build. Mater. 2016, 105, 307–320. [Google Scholar] [CrossRef]
- Bao, Z. Applicability of the environmental Kuznets curve to construction waste management: A panel analysis of 27 European economies. Resour. Conserv. Recycl. 2023, 188, 106667. [Google Scholar] [CrossRef]
- Min, V.; Panuwatwanich, K. Enhancing performance of construction waste management: Factor analysis from the building contractors’ perspectives. Clean. Waste Syst. 2024, 9, 100176. [Google Scholar] [CrossRef]
- Ahmed, J.K.; Atmaca, N.; Khoshnaw, G.J. Building a Sustainable Future: An Experimental Study on Recycled Brick Waste Powder in Engineered Geopolymer Composites. Case Stud. Constr. Mater. 2024, 20, e02863. [Google Scholar] [CrossRef]
- Junior, A.C.; Teixeira, E.; Mateus, R. Improving the mechanical, thermal and durability properties of compressed earth blocks by incorporating industrial waste and by-products: A systematic literature review. Constr. Build. Mater. 2024, 438, 137063. [Google Scholar] [CrossRef]
- National Extraction by Type of Indicator and Years. INE. [Online]. Available online: https://www.ine.es/jaxi/Datos.htm?path=/t26/p086/serie/l0/&file=02001.px (accessed on 27 January 2023).
- Soibelman, L. Material de Desperdicio en la Industria de la Construcción: Incidencia y Control; Cuadernos FICA: Champaign, IL, USA, 2000. [Google Scholar]
- Rigassi, V. Compressed Earth Blocks: Manual of Production; Deutsches Zentrum fur Entwicklungstechnologien, GATEBASIN: Berlin, Germany, 1985. [Google Scholar]
- Fernandes, J.; Peixoto, M.; Mateus, R.; Gervásio, H. Life cycle analysis of environmental impacts of earthen materials in the Portuguese context: Rammed earth and compressed earth blocks. J. Clean. Prod. 2019, 241, 118286. [Google Scholar] [CrossRef]
- Widera, B. Comparative analysis of user comfort and thermal performance of six types of vernacular dwellings as the first step towards climate resilient, sustainable and bioclimatic architecture in western sub-Saharan Africa. Renew. Sustain. Energy Rev. 2021, 140, 110736. [Google Scholar] [CrossRef]
- Basta, A.H.; Lotfy, V.F.; Shafik, E.S. Synergistic valorization of rice straw and red brick demolition in development performance of lightweight cement mortars. J. Build. Eng. 2024, 92, 109769. [Google Scholar] [CrossRef]
- Sathiparan, N. Performance of sustainable cement mortar containing different types of masonry construction and demolition wastes. Clean Technol. Environ. Policy 2024, 26, 1861–1881. [Google Scholar] [CrossRef]
- Lutfi, M.A.; Dawood, E.T.; Al-Busaltan, S. Evaluating Waste Brick powder incorporation on Mortar properties. AIP Conf. Proc. 2023, 2862, 020004. [Google Scholar] [CrossRef]
- Ghrieb, A.; Abadou, Y.; Bustamante, R.; de Rojas, M.I.S. Investigation of the pore structure performance of dune sand mortar with ceramic waste. Proc. Inst. Civ. Eng.-Eng. Sustain. 2023, 177, 284–298. [Google Scholar] [CrossRef]
- Borçato, A.G.; Thiesen, M.; Medeiros-Junior, R.A. Incorporation of clay brick wastes and calcium hydroxide into geopolymers: Compressive strength, microstructure, and efflorescence. J. Build. Eng. 2024, 88, 109259. [Google Scholar] [CrossRef]
- İlcan, H.; Külak, A.Y.; Şahmaran, M. 3D-printable construction and demolition waste-based geopolymer: Investigating the effects of additives on engineering properties. J. Build. Eng. 2024, 87, 109094. [Google Scholar] [CrossRef]
- Gaddam, A.G.; Gondu, V.R.; Yamsani, S.K.; Adigopula, V.K. Comprehensive utilization of brick waste as a precursor in synthesizing geopolymer for treating black cotton soil. Int. J. Geotech. Eng. 2023, 18, 360–366. [Google Scholar] [CrossRef]
- Haq, M.A.U.; Xia, P.; Khan, S.; Hassam, M.; Sohaib, M.; Gong, F. Optimal utilization of low-quality construction waste and industrial byproducts in sustainable recycled concrete. Constr. Build. Mater. 2024, 428, 136362. [Google Scholar] [CrossRef]
- Mangngi, P.; Tjaronge, M.W.; Caronge, M.A. Durability assessment of concrete containing recycled coarse refractory brick aggregate. Innov. Infrastruct. Solut. 2024, 9, 144. [Google Scholar] [CrossRef]
- Nasr, M.; Salman, A.; Ghayyib, R.; Shubbar, A.; Al-Mamoori, S.; Al-Khafaji, Z.; Hashim, T.; Hasan, Z.; Sadique, M. Effect of Clay Brick Waste Powder on the Fresh and Hardened Properties of Self-Compacting Concrete: State-of-the-Art and Life Cycle Assessment. Energies 2023, 16, 12. [Google Scholar] [CrossRef]
- Ghosh, S. Utilization of recycled refractory brick as fine aggregate on various properties of sustainable concrete. Mater. Today Proc. 2023, in press. [CrossRef]
- Quispe, E.H.; Salvador, C.G.R.; Aranda, J.J.M.; Montoya, N.I.V.; Morejón, I.Y.P. Improvement of Bearing Capacity with Cement, Lime and Brick Waste in Soft Soils for Foundation Purposes. Civil. Eng. Archit. 2024, 12, 97–108. [Google Scholar] [CrossRef]
- Labiad, Y.; Meddah, A.; Beddar, M. Performance of sisal fiber-reinforced cement-stabilized compressed-earth blocks incorporating recycled brick waste. Innov. Infrastruct. Solut. 2023, 8, 107. [Google Scholar] [CrossRef]
- Kasinikota, P. Predicting the effect of crushed brick particle size on anisotropy, physical and mechanical properties of compressed stabilized earth blocks using ultrasonic pulse velocity. Mater. Struct. 2021, 54, 112. [Google Scholar] [CrossRef]
- Kasinikota, P. Evaluation of compressed stabilized earth block properties using crushed brick waste. Constr. Build. Mater. 2021, 280, 122520. [Google Scholar] [CrossRef]
- Minke, G. Building with Earth: Design and Technology of a Sustainable Architecture, 2nd and rev. ed.; Birkhäuser: Basel, Switzerland; Berlin, Germany; Boston, MA, USA, 2006. [Google Scholar]
- Martínez, P.S.; Cortina, M.G.; Martínez, F.F.; Sánchez, A.R. Comparative study of three types of fine recycled aggregates from construction and demolition waste (CDW), and their use in masonry mortar fabrication. J. Clean. Prod. 2016, 118, 162–169. [Google Scholar] [CrossRef]
- Panizza, M.; Natali, M.; Garbin, E.; Ducman, V.; Tamburini, S. Optimization and mechanical-physical characterization of geopolymers with Construction and Demolition Waste (CDW) aggregates for construction products. Constr. Build. Mater. 2020, 264, 120158. [Google Scholar] [CrossRef]
- Turco, C.; Junior, A.C.P.; Teixeira, E.R.; Mateus, R. Optimisation of Compressed Earth Blocks (CEBs) using natural origin materials: A systematic literature review. Constr. Build. Mater. 2021, 309, 125140. [Google Scholar] [CrossRef]
- Latha, A.T.; Murugesan, B.; Kabeer, K.I.S.A. Valorisation of municipal solid waste incinerator bottom ash for the production of compressed stabilised earth blocks. Constr. Build. Mater. 2024, 423, 135827. [Google Scholar] [CrossRef]
- Aninda, S.S. Effectiveness of waste concrete powder in fabricating compressed stabilized earth blocks: Strength, durability and thermal assessment. J. Build. Eng. 2023, 80, 107989. [Google Scholar] [CrossRef]
- Kongkajun, N.; Laitila, E.A.; Ineure, P.; Prakaypan, W.; Cherdhirunkorn, B.; Chakartnarodom, P. Soil-cement bricks produced from local clay brick waste and soft sludge from fiber cement production. Case Stud. Constr. Mater. 2020, 13, e00448. [Google Scholar] [CrossRef]
- Normas del Reglamento Nacional de Edificaciones (RNE). [Online]. Available online: https://www.gob.pe/institucion/sencico/informes-publicaciones/887225-normas-del-reglamento-nacional-de-edificaciones-rne (accessed on 21 October 2024).
- Standard Terminology Relating to Concrete and Concrete Aggregates. [Online]. Available online: https://www.astm.org/c0125-03.html (accessed on 13 December 2024).
- Standard Practice for Classification of Soils for Engineering Purposes (Unified Soil Classification System). [Online]. Available online: https://www.astm.org/d2487-17.html (accessed on 4 July 2024).
- UNE 41410:2023; Bloques de Tierra Comprimida (BTC) Para Muros y Tabiques. UNE: Madrid, Spain, 2023. Available online: https://www.une.org/encuentra-tu-norma/busca-tu-norma/norma?c=N0072146 (accessed on 4 July 2024).
- Standard Test Methods for Liquid Limit, Plastic Limit, and Plasticity Index of Soils. [Online]. Available online: https://www.astm.org/d4318-17e01.html (accessed on 15 June 2023).
- AS 1289.3.4.1-2008; Methods of Testing Soils for Engineering Purposes, Method 3.4.1: Soil Classification Tests—Determination of the Linear Shrinkage of a Soil—Standard Method|Standards Australia Store. Standards Australia Limited: Sydney, Australia, 2008. Available online: https://store.standards.org.au/product/as-1289-3-4-1-2008 (accessed on 4 July 2024).
- Standard Specification for Wire Cloth and Sieves for Testing Purposes. [Online]. Available online: https://www.astm.org/e0011-95.html (accessed on 13 December 2024).
- UNE 7050-2:1997; Tamices y Tamizado de Ensayo. Parte 2: Telas Metálicas, Chapas Perforadas y Láminas Electroformadas. Medidas Nominales de las Aberturas. UNE: Madrid, Spain, 1997. Available online: https://www.une.org/encuentra-tu-norma/busca-tu-norma/norma?c=N0000151 (accessed on 4 July 2024).
- UNE 103100:1995; Preparación de Muestras para Ensayos de Suelos. UNE: Madrid, Spain, 1995. Available online: https://www.une.org/encuentra-tu-norma/busca-tu-norma/norma?c=N0007827 (accessed on 13 December 2024).
- UNE-EN ISO 17892-1:2015; Investigación y Ensayos Geotécnicos. Ensayos de Laboratorio de Suelos. Parte 1: Determinación de la Humedad. UNE: Madrid, Spain, 2015. Available online: https://www.une.org/encuentra-tu-norma/busca-tu-norma/norma?c=N0055454 (accessed on 13 December 2024).
- BOE-A-2023-628 Real Decreto 3/2023, de 10 de Enero, por el que se Establecen los Criterios Técnico-Sanitarios de la Calidad del Agua de Consumo, su Control y Suministro. [Online]. Available online: https://www.boe.es/buscar/act.php?id=BOE-A-2023-628 (accessed on 4 July 2024).
- Standard Test Method for Relative Density (Specific Gravity) and Absorption of Fine Aggregate. [Online]. Available online: https://www.astm.org/c0128-22.html (accessed on 4 July 2024).
- UNE-EN ISO 12570:2000; Prestaciones Higrotérmicas de los Productos y Materiales para Edificios. Determinación del Contenido de Humedad Mediante Secado a Elevadas Temperaturas. UNE: Madrid, Spain, 2000. Available online: https://www.une.org/encuentra-tu-norma/busca-tu-norma/norma?c=N0023664 (accessed on 4 July 2024).
- UNE-EN ISO 17892-4:2019; Investigación y Ensayos Geotécnicos. Ensayos de Laboratorio de Suelos. Parte 4: Determinación de la Distribución Granulométrica. UNE: Madrid, Spain, 2019. Available online: https://www.une.org/encuentra-tu-norma/busca-tu-norma/norma?c=N0062597 (accessed on 4 July 2024).
- ISO 3310-1:2016; Normas AENOR. ISO: Geneva, Switzerland, 2016. Available online: https://tienda.aenor.com/norma-iso-3310-1-2016-062410 (accessed on 10 July 2024).
- Standard Specification for Aggregate for Masonry Mortar. [Online]. Available online: https://www.astm.org/c0144-18.html (accessed on 5 July 2024).
- Khoudja, D.; Taallah, B.; Izemmouren, O.; Aggoun, S.; Herihiri, O.; Guettala, A. Mechanical and thermophysical properties of raw earth bricks incorporating date palm waste. Constr. Build. Mater. 2021, 270, 121824. [Google Scholar] [CrossRef]
- Lahdili, M.; El Abbassi, F.-E.; Sakami, S.; Aamouche, A. Mechanical and Thermal Behavior of Compressed Earth Bricks Reinforced with Lime and Coal Aggregates. Buildings 2022, 12, 10. [Google Scholar] [CrossRef]
- Giroudon, M.; Laborel-Préneron, A.; Aubert, J.-E.; Magniont, C. Comparison of barley and lavender straws as bioaggregates in earth bricks. Constr. Build. Mater. 2019, 202, 254–265. [Google Scholar] [CrossRef]
- Laborel-Préneron, A.; Aubert, J.-E.; Magniont, C.; Maillard, P.; Poirier, C. Effect of Plant Aggregates On Mechanical Properties Of earth bricks. J. Mater. Civil. Eng. 2017, 29, 12. [Google Scholar] [CrossRef]
- XP P13-901; Blocs de Terre Comprimée Pour Murs et Cloisons: Definitions—Spécifications—Méthodes D’essais—Conditions de Reception. Afnor EDITIONS: Saint-Denis, France, 2001. Available online: https://www.boutique.afnor.org/fr-fr/norme/xp-p13901/blocs-de-terre-comprimee-pour-murs-et-cloisons-definitions-specifications-m/fa120503/487 (accessed on 13 December 2024).
- Houben, H.; Guillaud, H. Earth Construction: A Comprehensive Guide; Intermediate Technology Publications: Rugby, UK, 1994. [Google Scholar]
- UNE-EN ISO 17892-12:2019; Investigación y Ensayos Geotécnicos. Ensayos de Laboratorio de Suelos. Parte 12: Determinación del Límite Líquido y del Límite Plástico. UNE: Madrid, Spain, 2019. Available online: https://www.une.org/encuentra-tu-norma/busca-tu-norma/norma?c=norma-une-en-iso-17892-12-2019-n0062183 (accessed on 13 December 2024).
- Wiehle, P.; Simon, S.; Baier, J.; Dennin, L. Influence of relative humidity on the strength and stiffness of unstabilised earth blocks and earth masonry mortar. Constr. Build. Mater. 2022, 342, 128026. [Google Scholar] [CrossRef]
- Akoglu, H. User’s guide to correlation coefficients. Turk. J. Emerg. Med. 2018, 18, 91–93. [Google Scholar] [CrossRef]
- Houben, H. Earth Construction Technology. [Online]. 1992. Available online: http://archive.org/details/5226-earth-construction-technology (accessed on 10 July 2024).
- Reyna-Ruiz, J.M.C.; Gómez-Soberón, M.; Rojas-Valencia, N. Feasibility and Application of Local Closed-Loop Materials to Produce Compressed and Stabilized Earth Blocks. Materials 2024, 17, 13. [Google Scholar] [CrossRef]
- UNE-EN ISO 18754:2022; (Ratificada) Cerámicas Técnicas (Cerámicas Avanzadas, Cerámicas Técnicas Avanzadas). Determinación de la Densidad y de la Porosidad Aparente. [Online]. UNE: Madrid, Spain, 2022. Available online: https://www.une.org/encuentra-tu-norma/busca-tu-norma/norma/?c=norma-une-en-iso-18754-2022-n0069596 (accessed on 5 July 2024).
- Standard Test Method for Linear Drying Shrinkage of Concrete Masonry Units. [Online]. Available online: https://www.astm.org/c0426-22.html (accessed on 16 June 2023).
- UNE-EN 1367-4:2009; Ensayos para Determinar las Propiedades Térmicas y de Alteración de los Áridos. Parte 4: Determinación de la Retracción Por Secado. UNE: Madrid, Spain, 2009. Available online: https://www.une.org/encuentra-tu-norma/busca-tu-norma/norma?c=N0043307 (accessed on 5 July 2024).
- Standard Test Method for Compressive Strength of Cylindrical Concrete Specimens. [Online]. Available online: https://www.astm.org/c0039_c0039m-21.html (accessed on 4 July 2024).
- Standard Test Methods for Sampling and Testing Brick and Structural Clay Tile. [Online]. Available online: https://www.astm.org/c0067_c0067m-23.html (accessed on 16 June 2023).
- UNE-EN:2011; Métodos de Ensayo de Piezas para Fábrica de albañilería. Parte 1: Determinación de la Resistencia a Compresión. UNE: Madrid, Spain, 2011. Available online: https://www.une.org/encuentra-tu-norma/busca-tu-norma/norma?c=N0047873 (accessed on 4 July 2024).
- Standard Test Method for Flexural Strength of Advanced Ceramics at Ambient Temperature. [Online]. Available online: https://www.astm.org/c1161-13.html (accessed on 5 July 2024).
- 1876 Método de Prueba Estándar para el Módulo de Young Dinámico, el Módulo de Corte y el Coeficiente de Poisson Mediante Excitación de Impulso de Vibración. [Online]. Available online: https://www.astm.org/e1876-22.html (accessed on 4 July 2024).
- UNE-EN 14146:2004; Métodos de Ensayo para Piedra Natural. Determinación del Módulo de Elasticidad Dinámico. UNE: Madrid, Spain, 2004. Available online: https://www.une.org/encuentra-tu-norma/busca-tu-norma/norma?c=N0032544 (accessed on 4 July 2024).
- Kouakou, C. Strength and elasto-plastic properties of non-industrial building materials manufactured with clay as a natural binder. Appl. Clay Sci. 2009, 44, 27–34. [Google Scholar] [CrossRef]
- Walker, P. The Australian Earth Building Handbook; SAI Global Limited: Sydney, Australia, 2002. [Google Scholar]
- Bogas, J.A.; Real, S.; Cruz, R.; Azevedo, B. Mechanical performance and shrinkage of compressed earth blocks stabilised with thermoactivated recycled cement. J. Build. Eng. 2023, 79, 107892. [Google Scholar] [CrossRef]
- Miccoli, L.; Garofano, A.; Fontana, P.; Müller, U. Experimental testing and finite element modelling of earth block masonry. Eng. Struct. 2015, 104, 80–94. [Google Scholar] [CrossRef]
- Wiehle, P. Material behaviour of unstabilised earth block masonry and its components under compression at varying relative humidity. Case Stud. Constr. Mater. 2022, 17, e01663. [Google Scholar] [CrossRef]
- Tadonbou, J.; Pliya, P.; Beaucour, A.-L.; Faria, P.; Noumowe, A. Behavior of earth mortars at high temperature. Constr. Build. Mater. 2024, 425, 136093. [Google Scholar] [CrossRef]
- El Hammouti, A.; Charai, M.; Channouf, S.; Horma, O.; Nasri, H.; Mezrhab, A.; Karkri, M.; Tankari, M. Laboratory-testing and industrial scale performance of different clays from eastern Morocco for brick manufacturing. Constr. Build. Mater. 2023, 370, 130624. [Google Scholar] [CrossRef]
- Földvári, M. Handbook of Thermogravimetric System of Minerals and Its Use in Geological Practice; Geological Institute of Hungary (Magyar Állami Földtani Intézet): Budapest, Hungary, 2011. [Google Scholar]
- Kumar, G.S.; Saini, P.K.; Deoliya, R.; Mishra, A.K.; Negi, S.K. Characterization of laterite soil and its use in construction applications: A review. Resour. Conserv. Recycl. Adv. 2022, 16, 200120. [Google Scholar] [CrossRef]
- Wang, S.; Gainey, L.; Baxter, D.; Wang, X.; Mackinnon, I.D.R. Xi Thermal behaviours of clay mixtures during brick firing: A combined study of in-situ XRD, TGA and thermal dilatometry. Constr. Build. Mater. 2021, 299, 124319. [Google Scholar] [CrossRef]
- Öztürk, S. Optimization of thermal conductivity and lightweight properties of clay bricks. Eng. Sci. Technol. Int. J. 2023, 48, 101566. [Google Scholar] [CrossRef]
- Bruno, A.W.; Gallipoli, D.; Perlot, C.; Mendes, J. Optimization of bricks production by earth hypercompaction prior to firing. J. Clean. Prod. 2019, 214, 475–482. [Google Scholar] [CrossRef]
- Ettoumi, M.; Jouini, M.; Neculita, C.M.; Bouhlel, S.; Coudert, L.; Taha, Y.; Benzaazoua, M. Characterization of phosphate processing sludge from Tunisian mining basin and its potential valorization in fired bricks making. J. Clean. Prod. 2021, 284, 124750. [Google Scholar] [CrossRef]
- Cabeza, L.F.; Boquera, L.; Chàfer, M. Embodied energy and embodied carbon of structural building materials: Worldwide progress and barriers through literature map analysis. Energy Build. 2021, 231, 110612. [Google Scholar] [CrossRef]
- Junior, A.C.; Jacinto, C.; Turco, C.; Fernandes, J.; Teixeira, E.; Mateus, R. Analysis of the effect of incorporating construction and demolition waste on the environmental and mechanical performance of earth-based mixtures. Constr. Build. Mater. 2022, 330, 127244. [Google Scholar] [CrossRef]
- Oti, J.E.; Kinuthia, J.M. Engineering properties of unfired clay masonry bricks. Eng. Geol. 2009, 107, 130–139. [Google Scholar] [CrossRef]
- Fraj, A.B. Concrete based on recycled aggregates—Recycling and environmental analysis: A case study of Paris region. Constr. Build. Mater. 2017, 157, 952–964. [Google Scholar] [CrossRef]
- Arrigoni, A.; Beckett, C.T.S.; Ciancio, D.; Pelosato, R.; Dotelli, G. Rammed Earth incorporating Recycled Concrete Aggregate: A sustainable, resistant and breathable construction solution. Resour. Conserv. Recycl. 2018, 137, 11–20. [Google Scholar] [CrossRef]
- Bandivadekar, A.; Bodek, K.; Cheah, L.; Evans, C.; Groode, T.; Heywood, J.; Kasseris, E.; Kromer, M.; Weiss, M. On the Road in 2035: Reducing Transportation’s Petroleum Consumption and GHG Emissions; Massachusetts Institute of Technology: Cambridge, MA, USA, 2008. [Google Scholar]


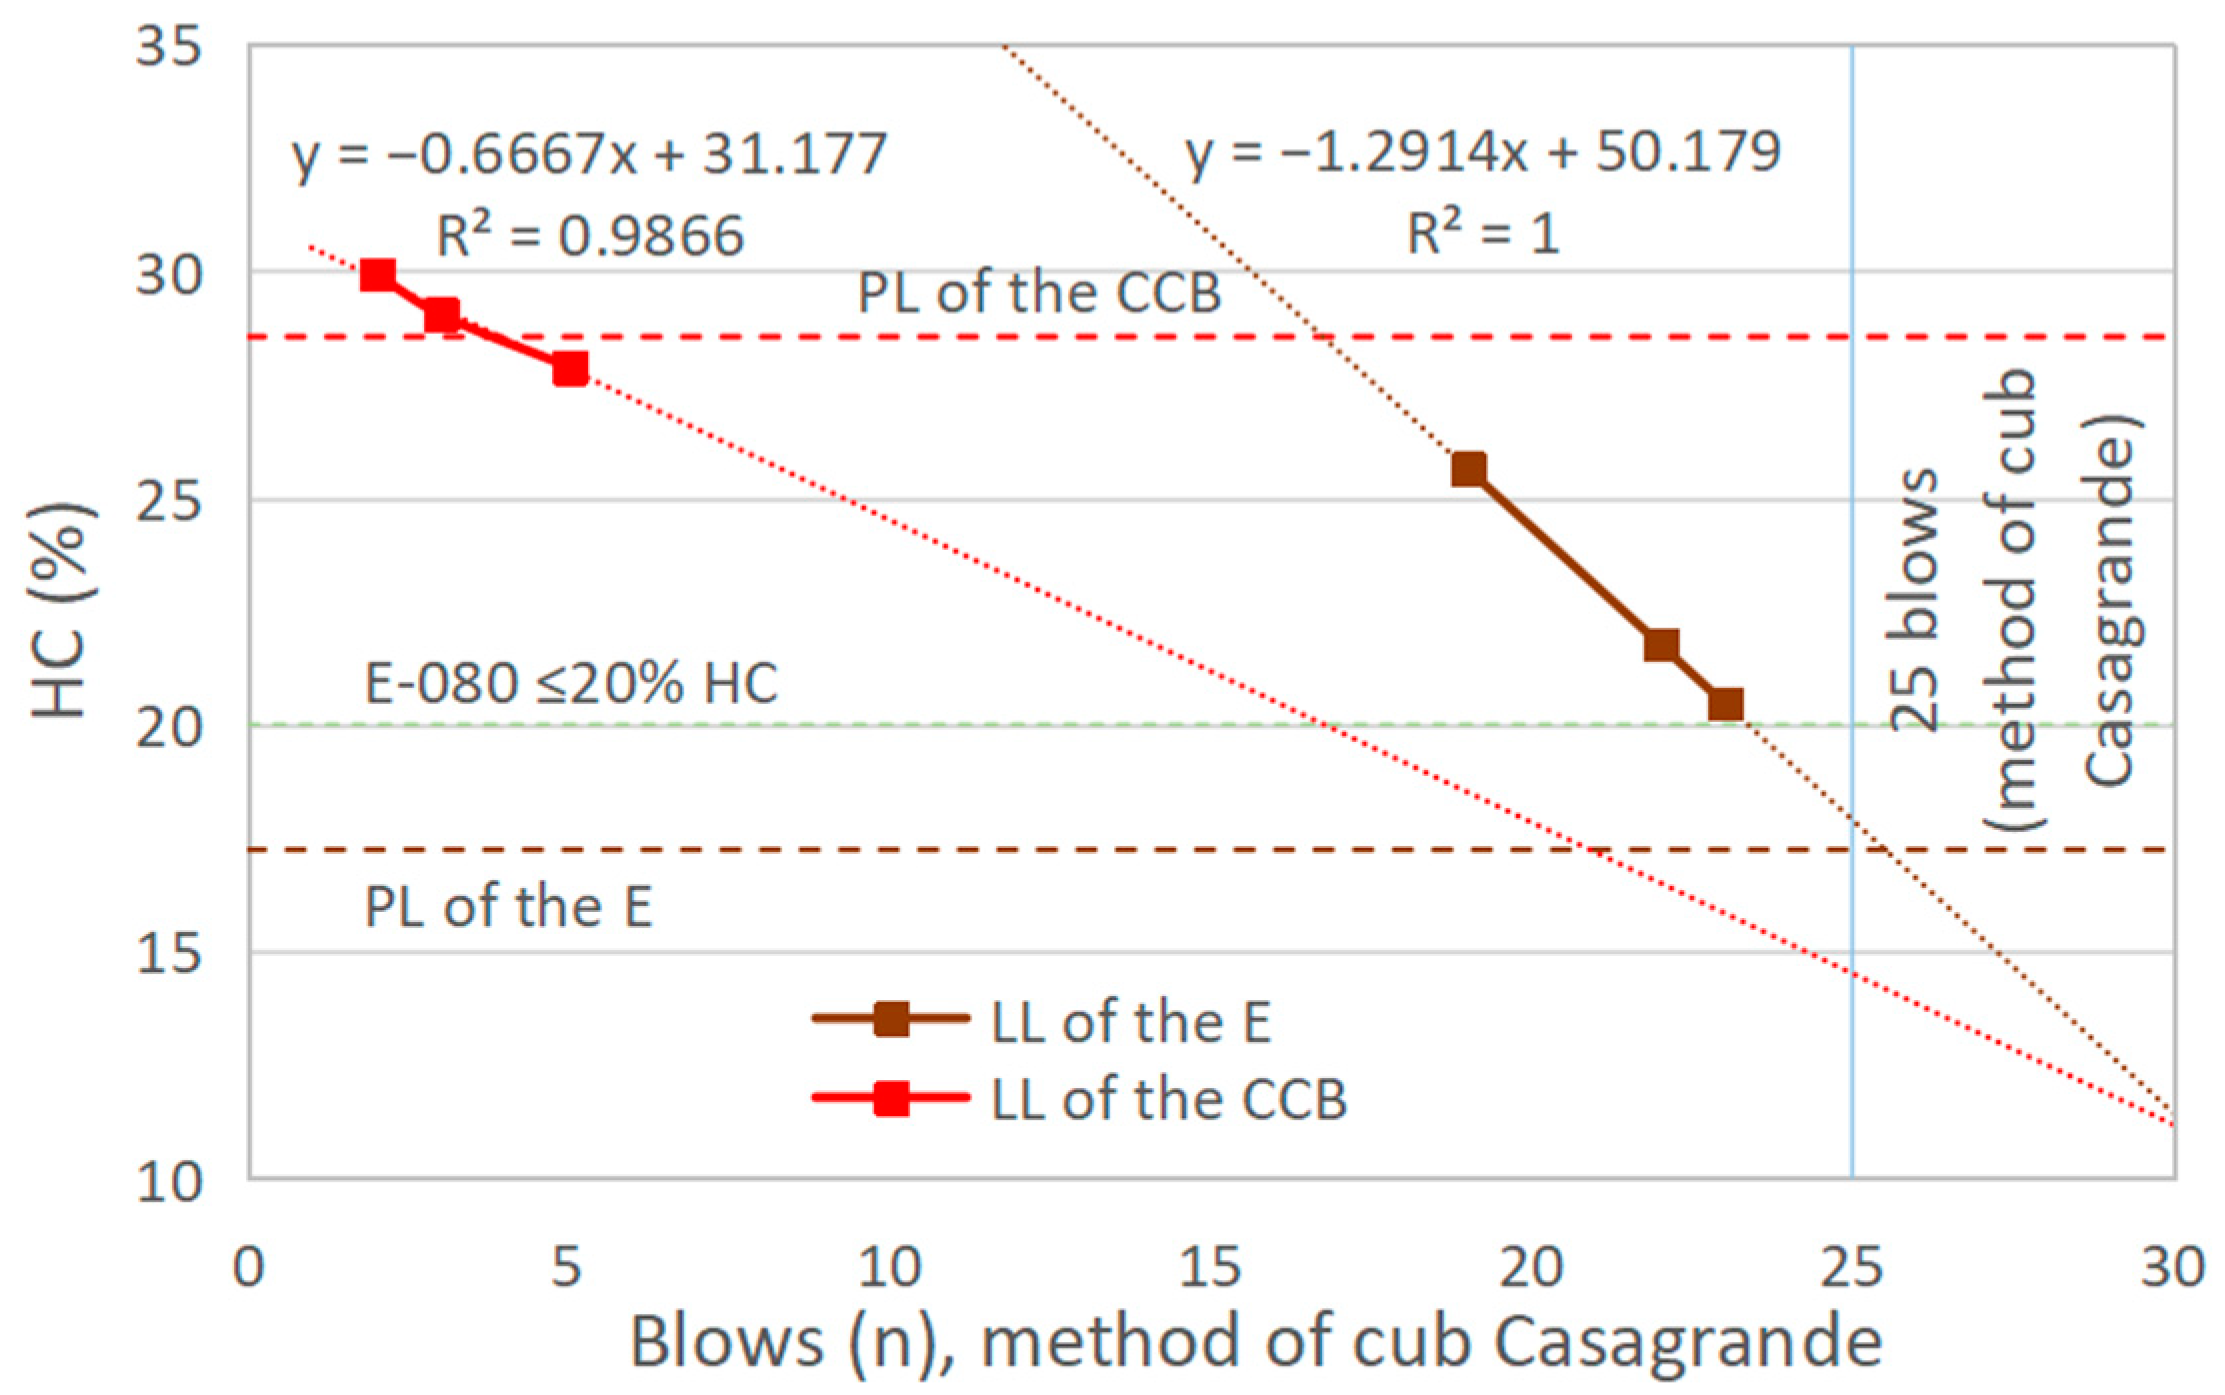
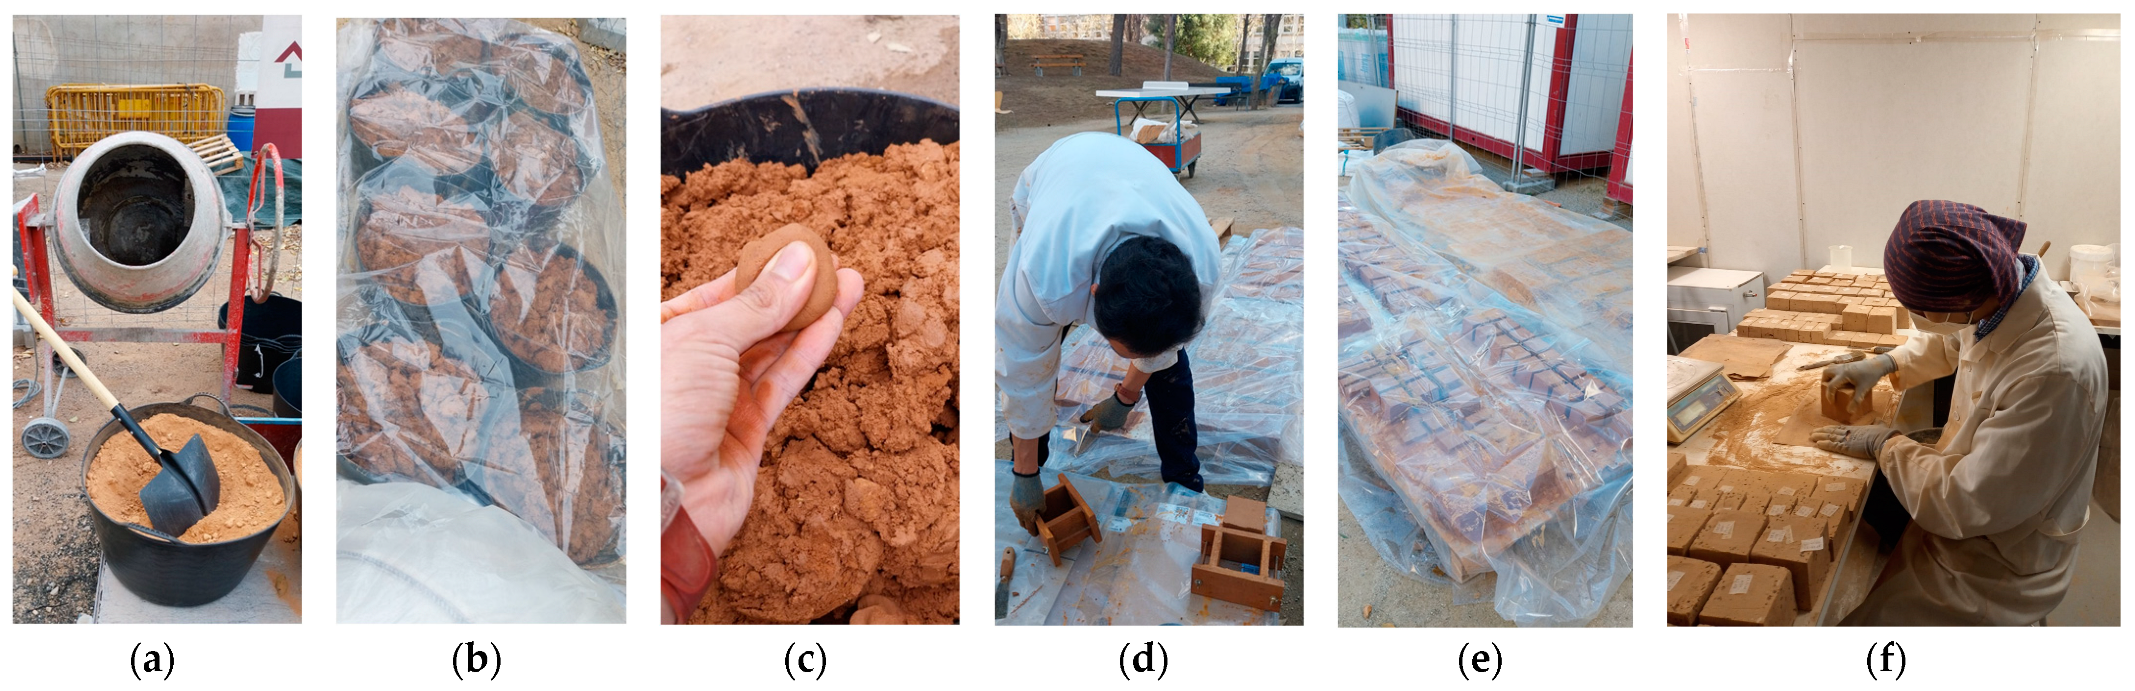
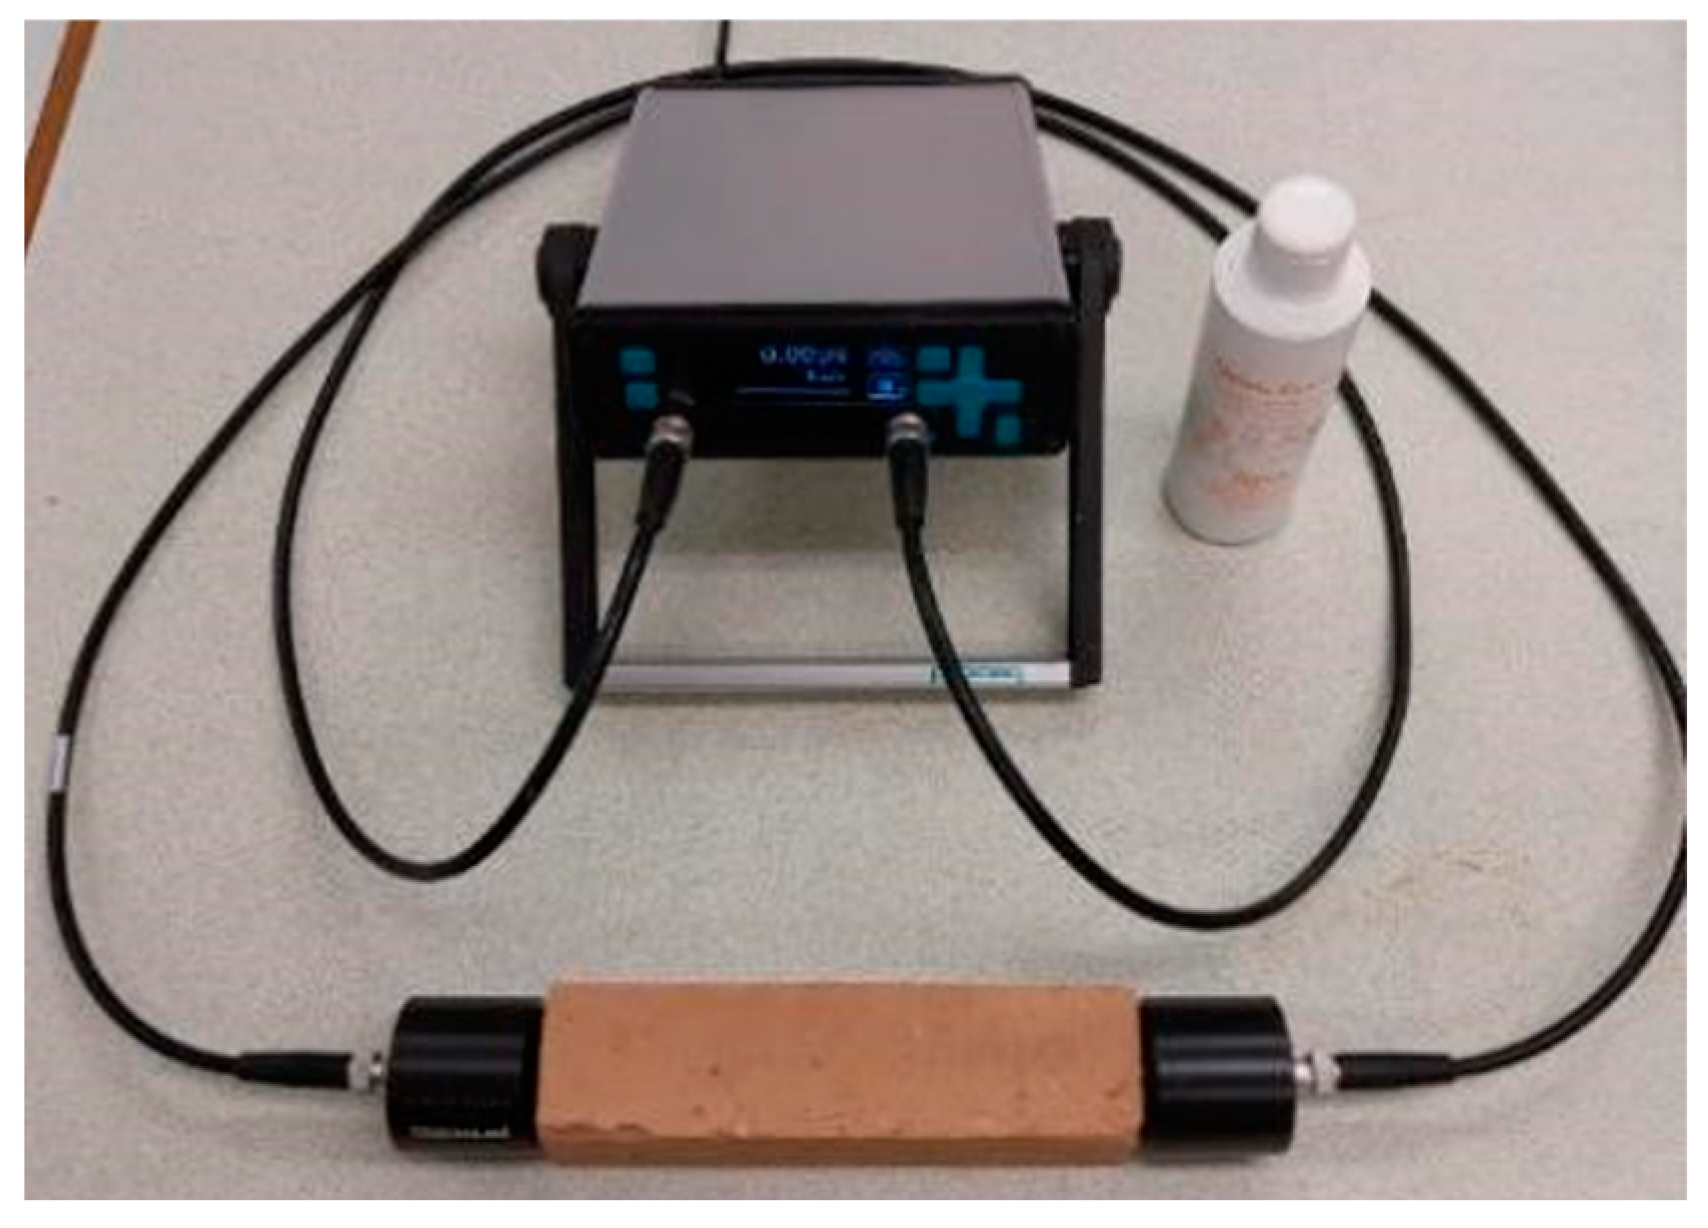
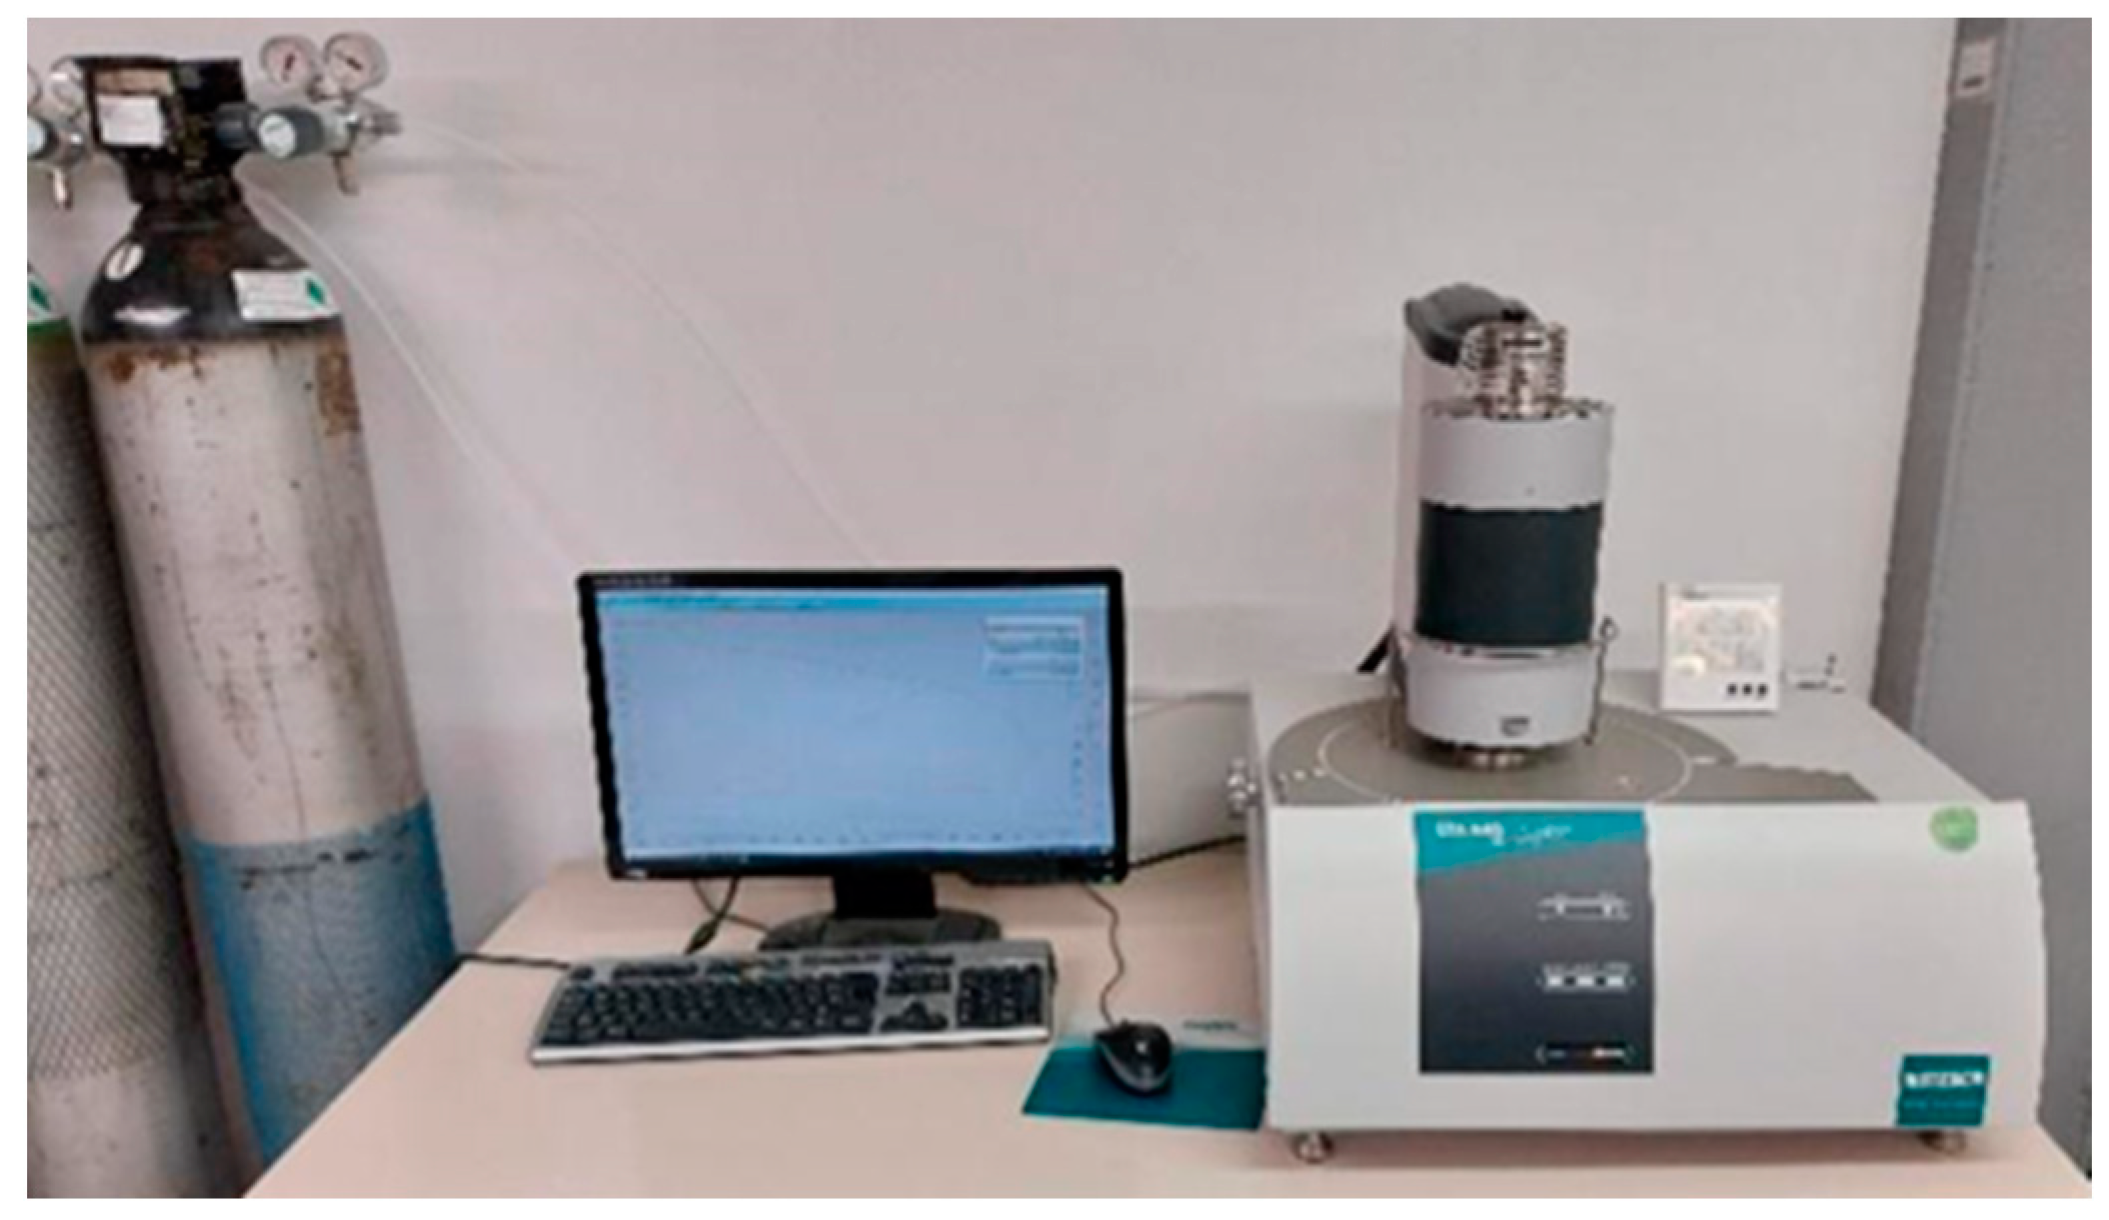
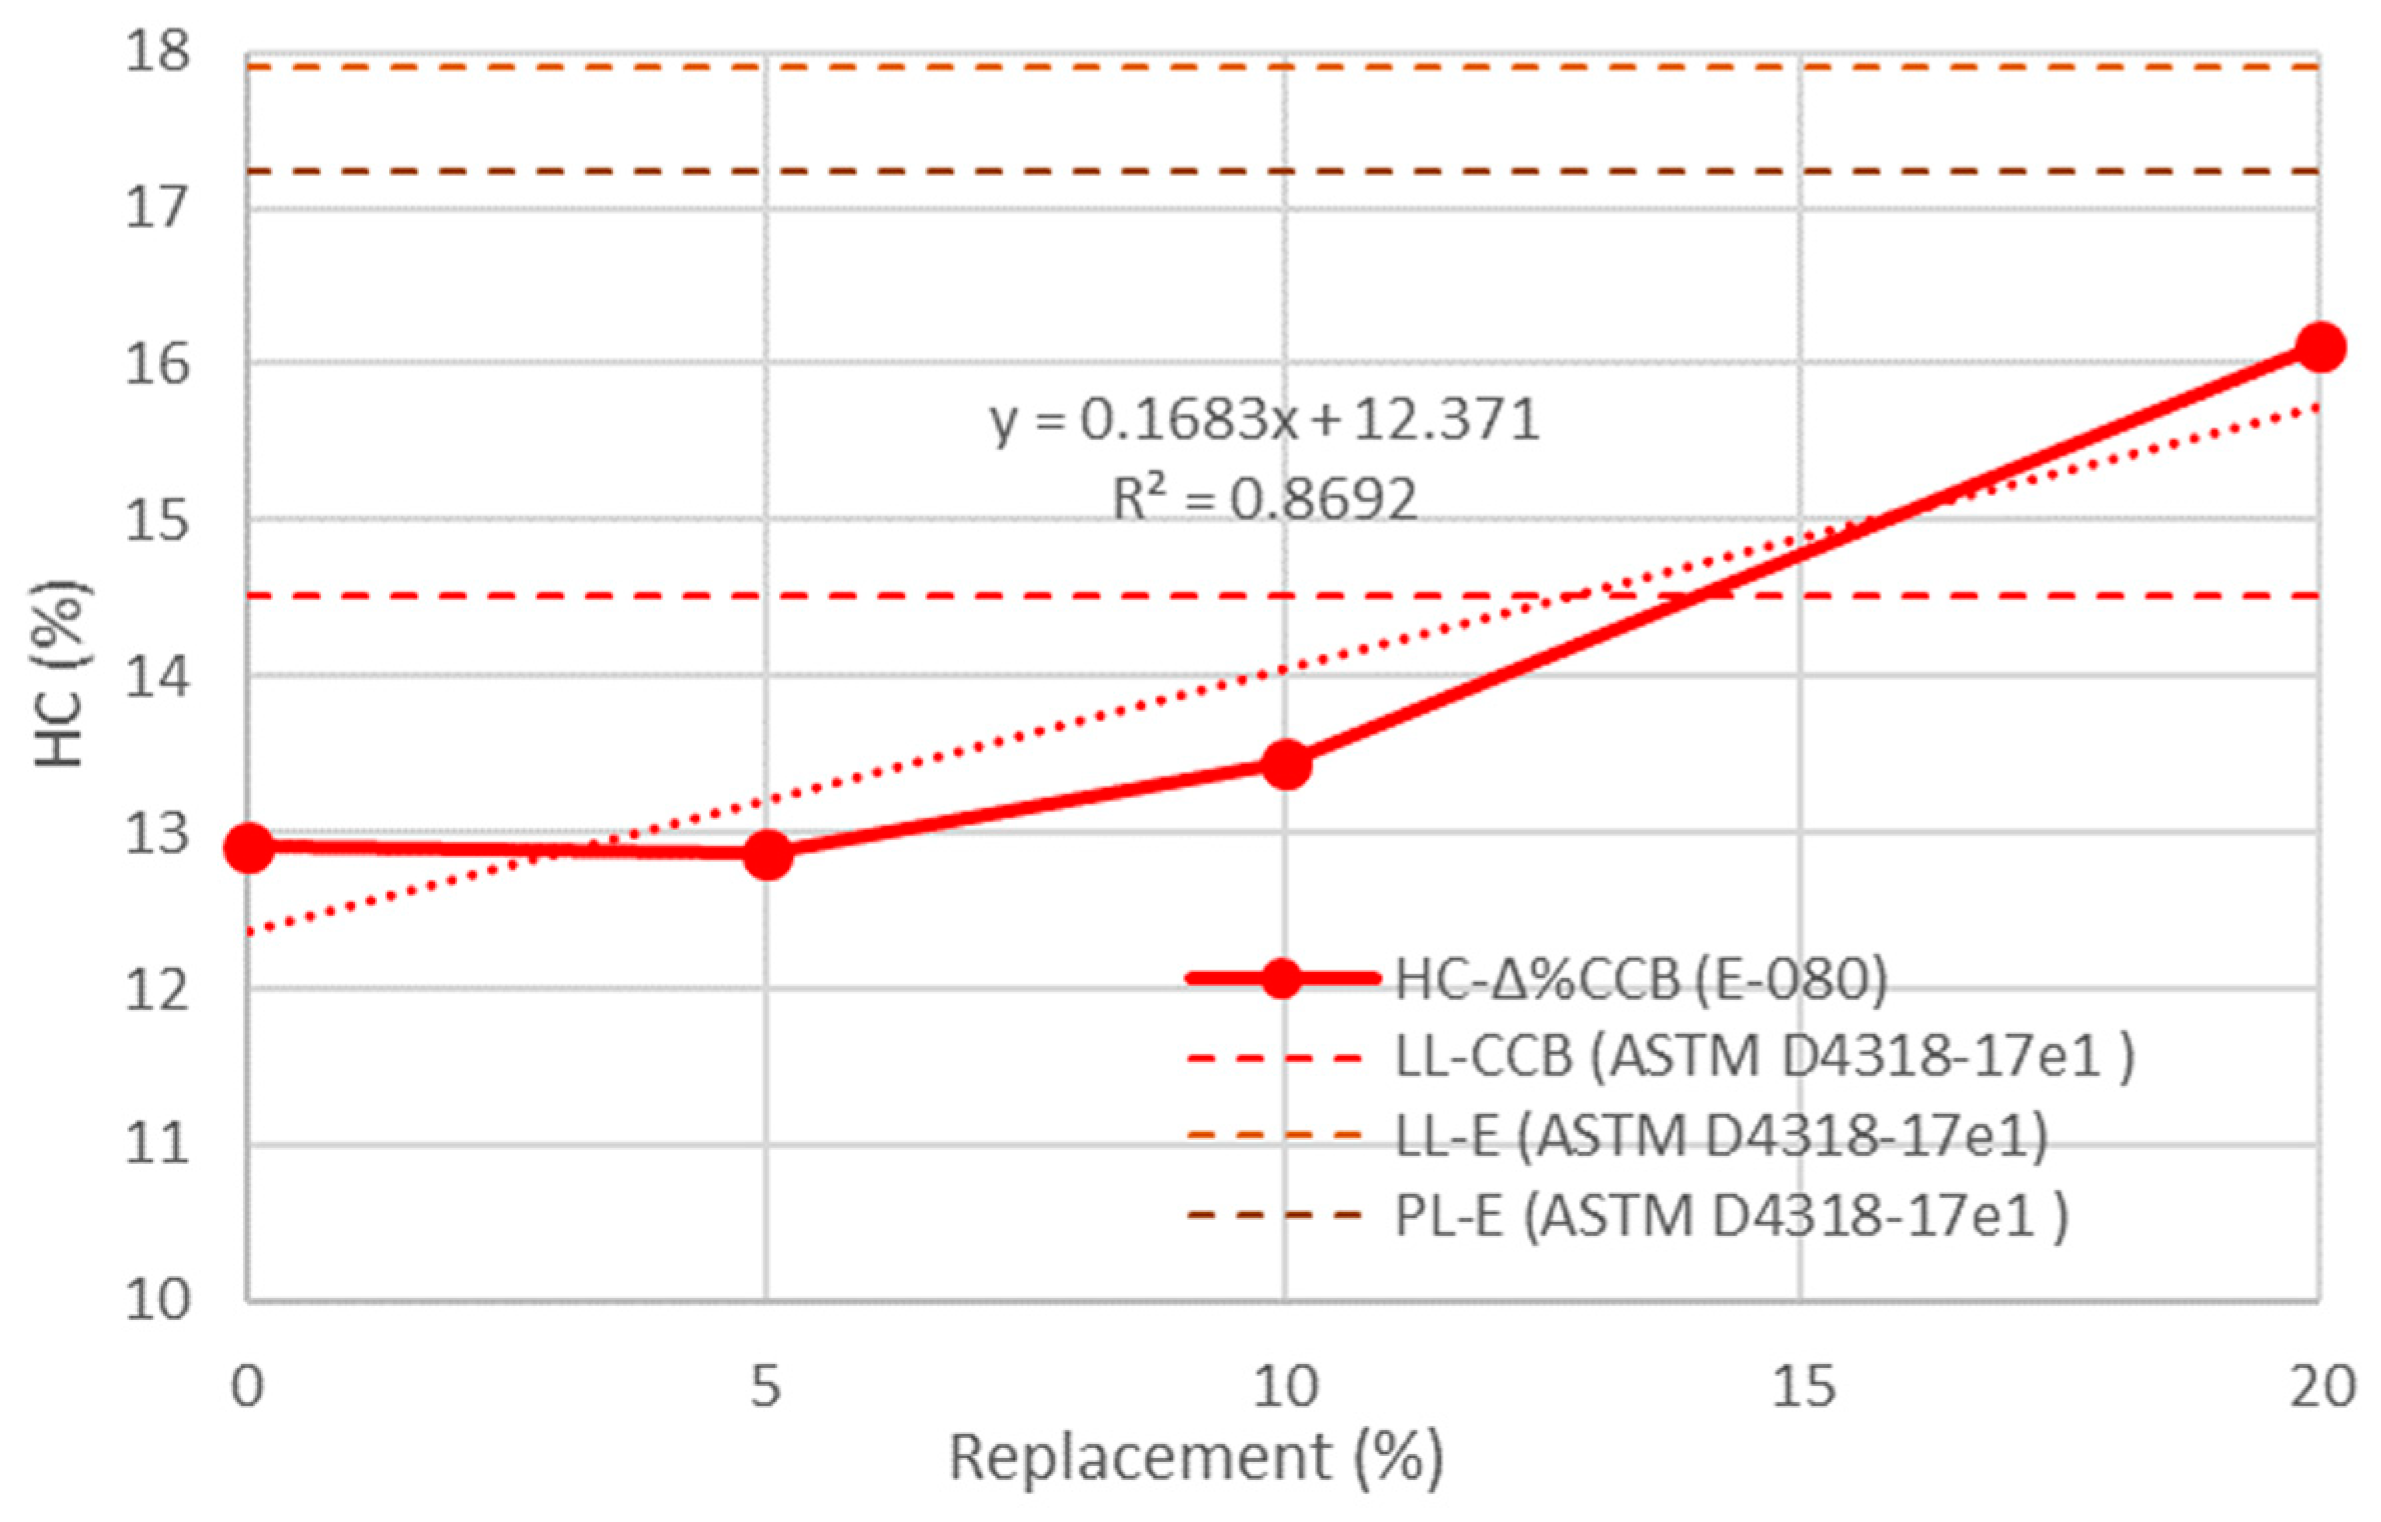
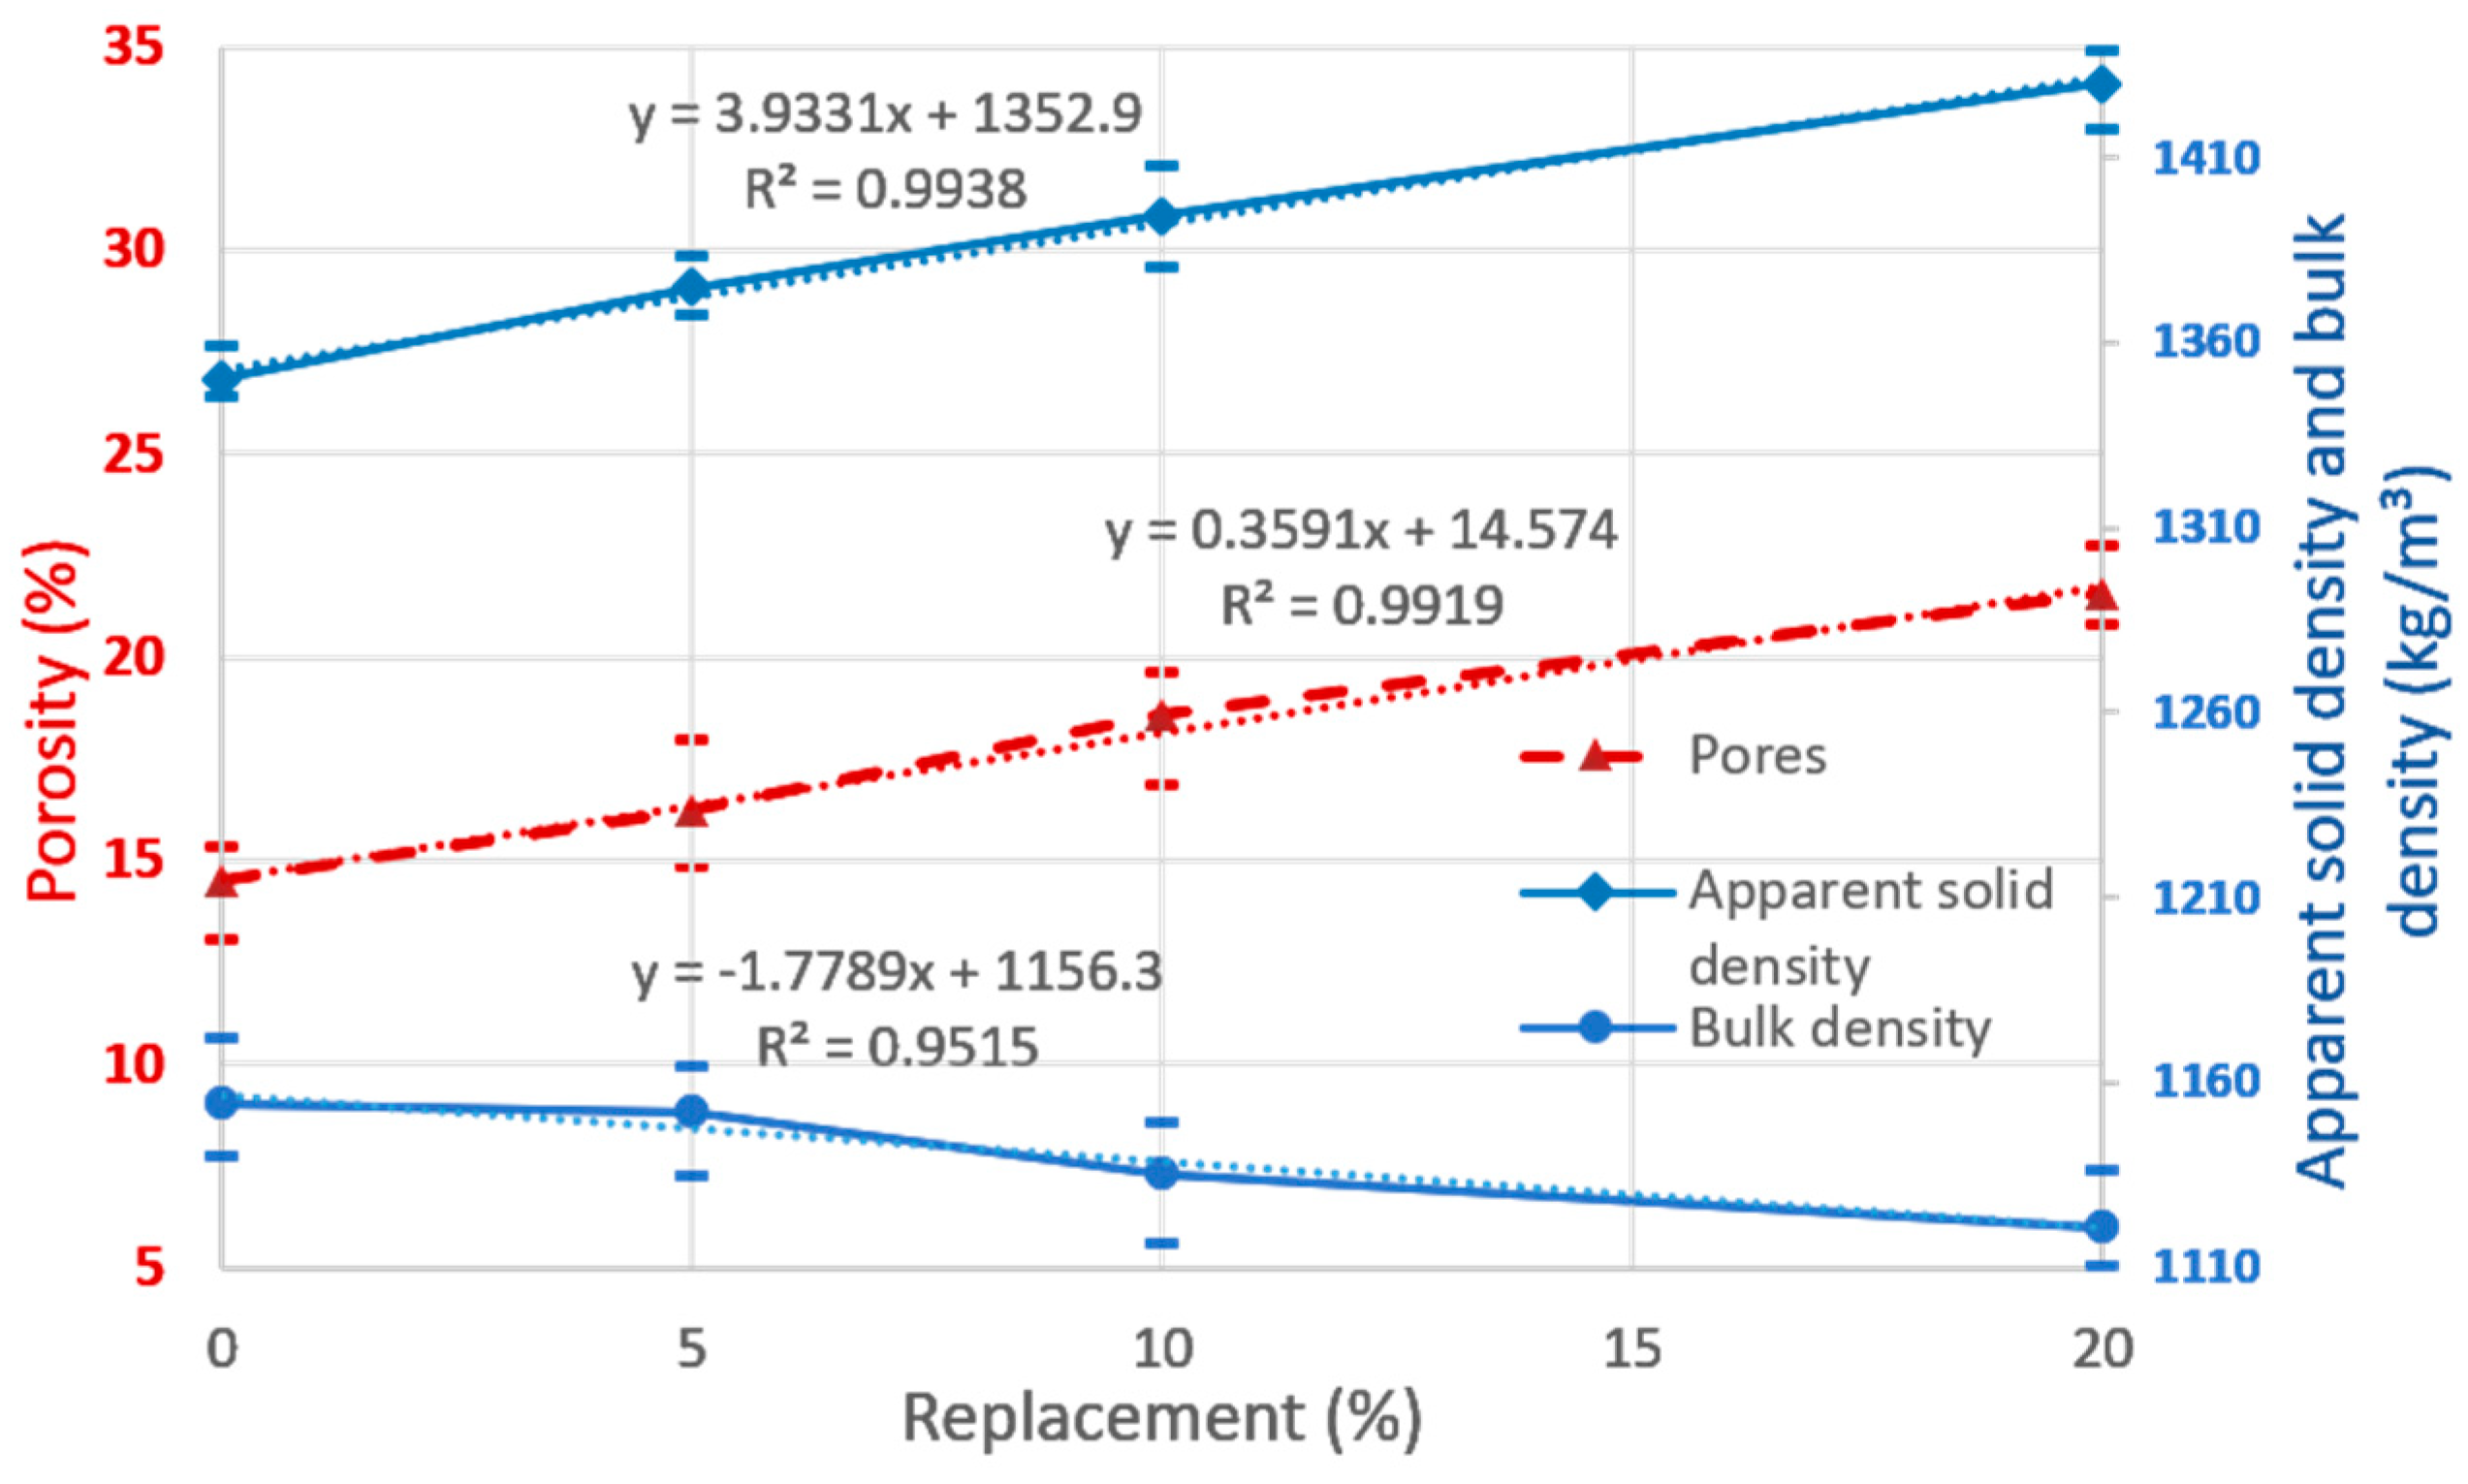
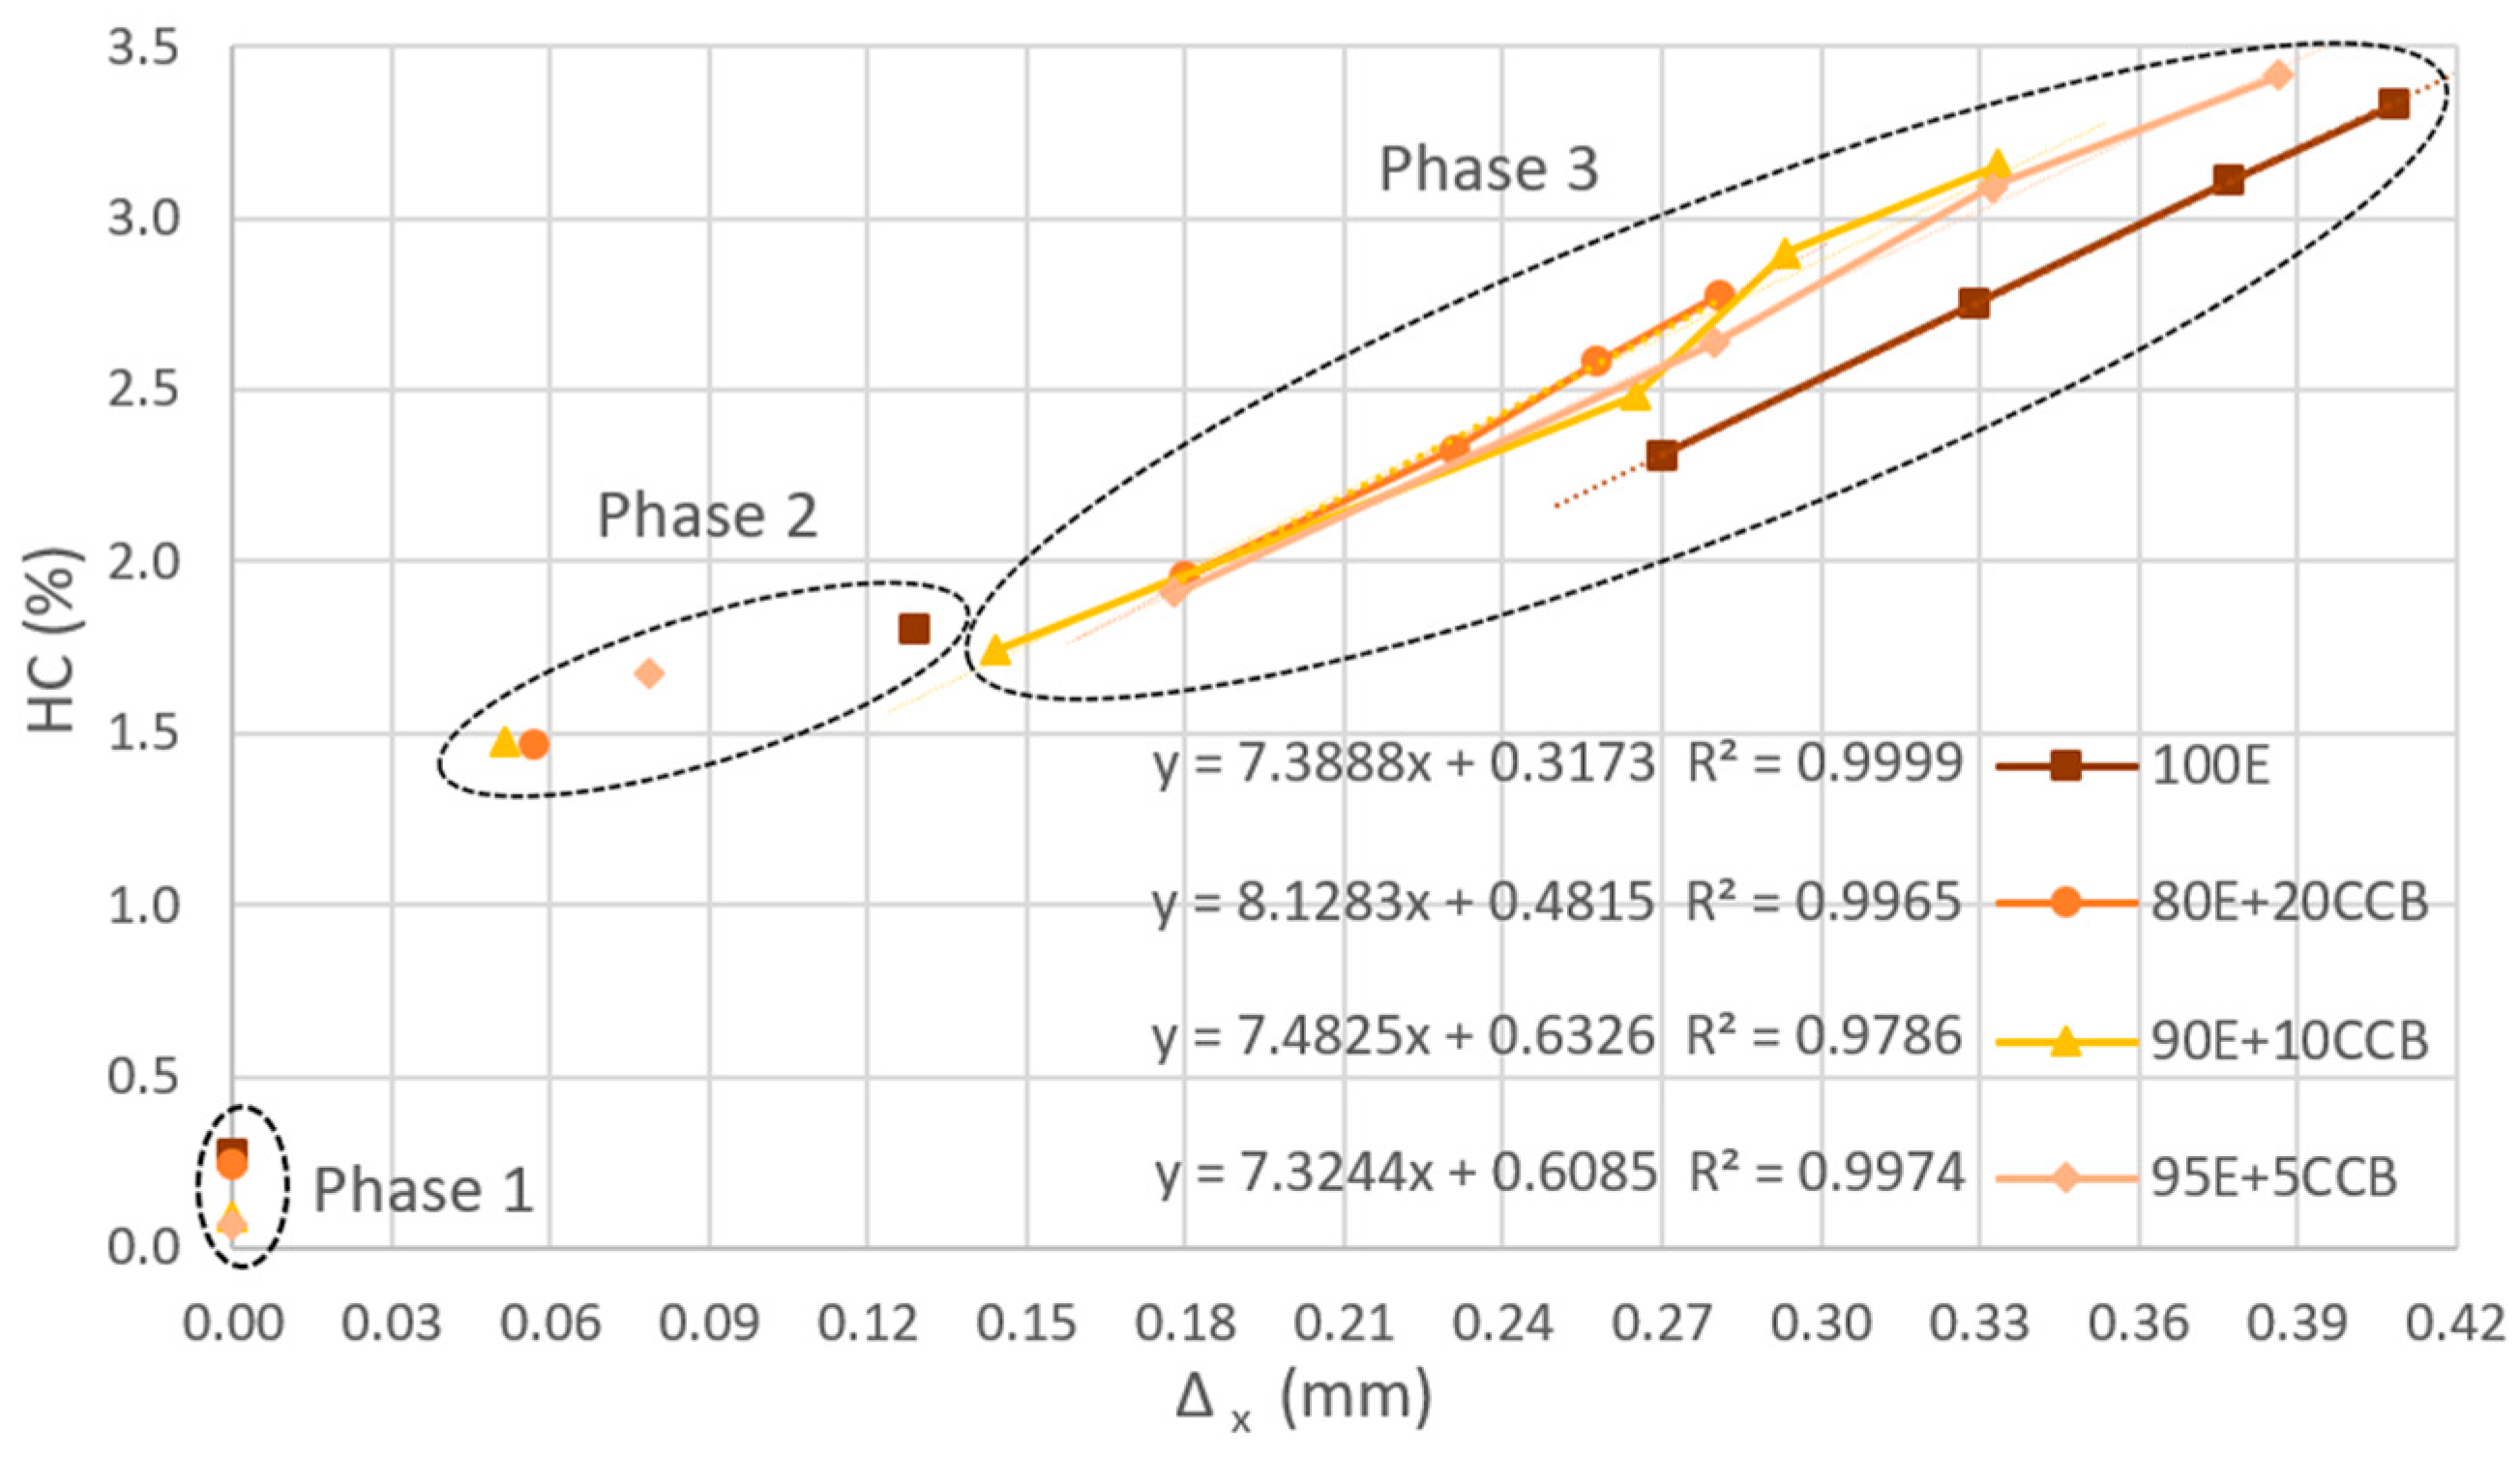
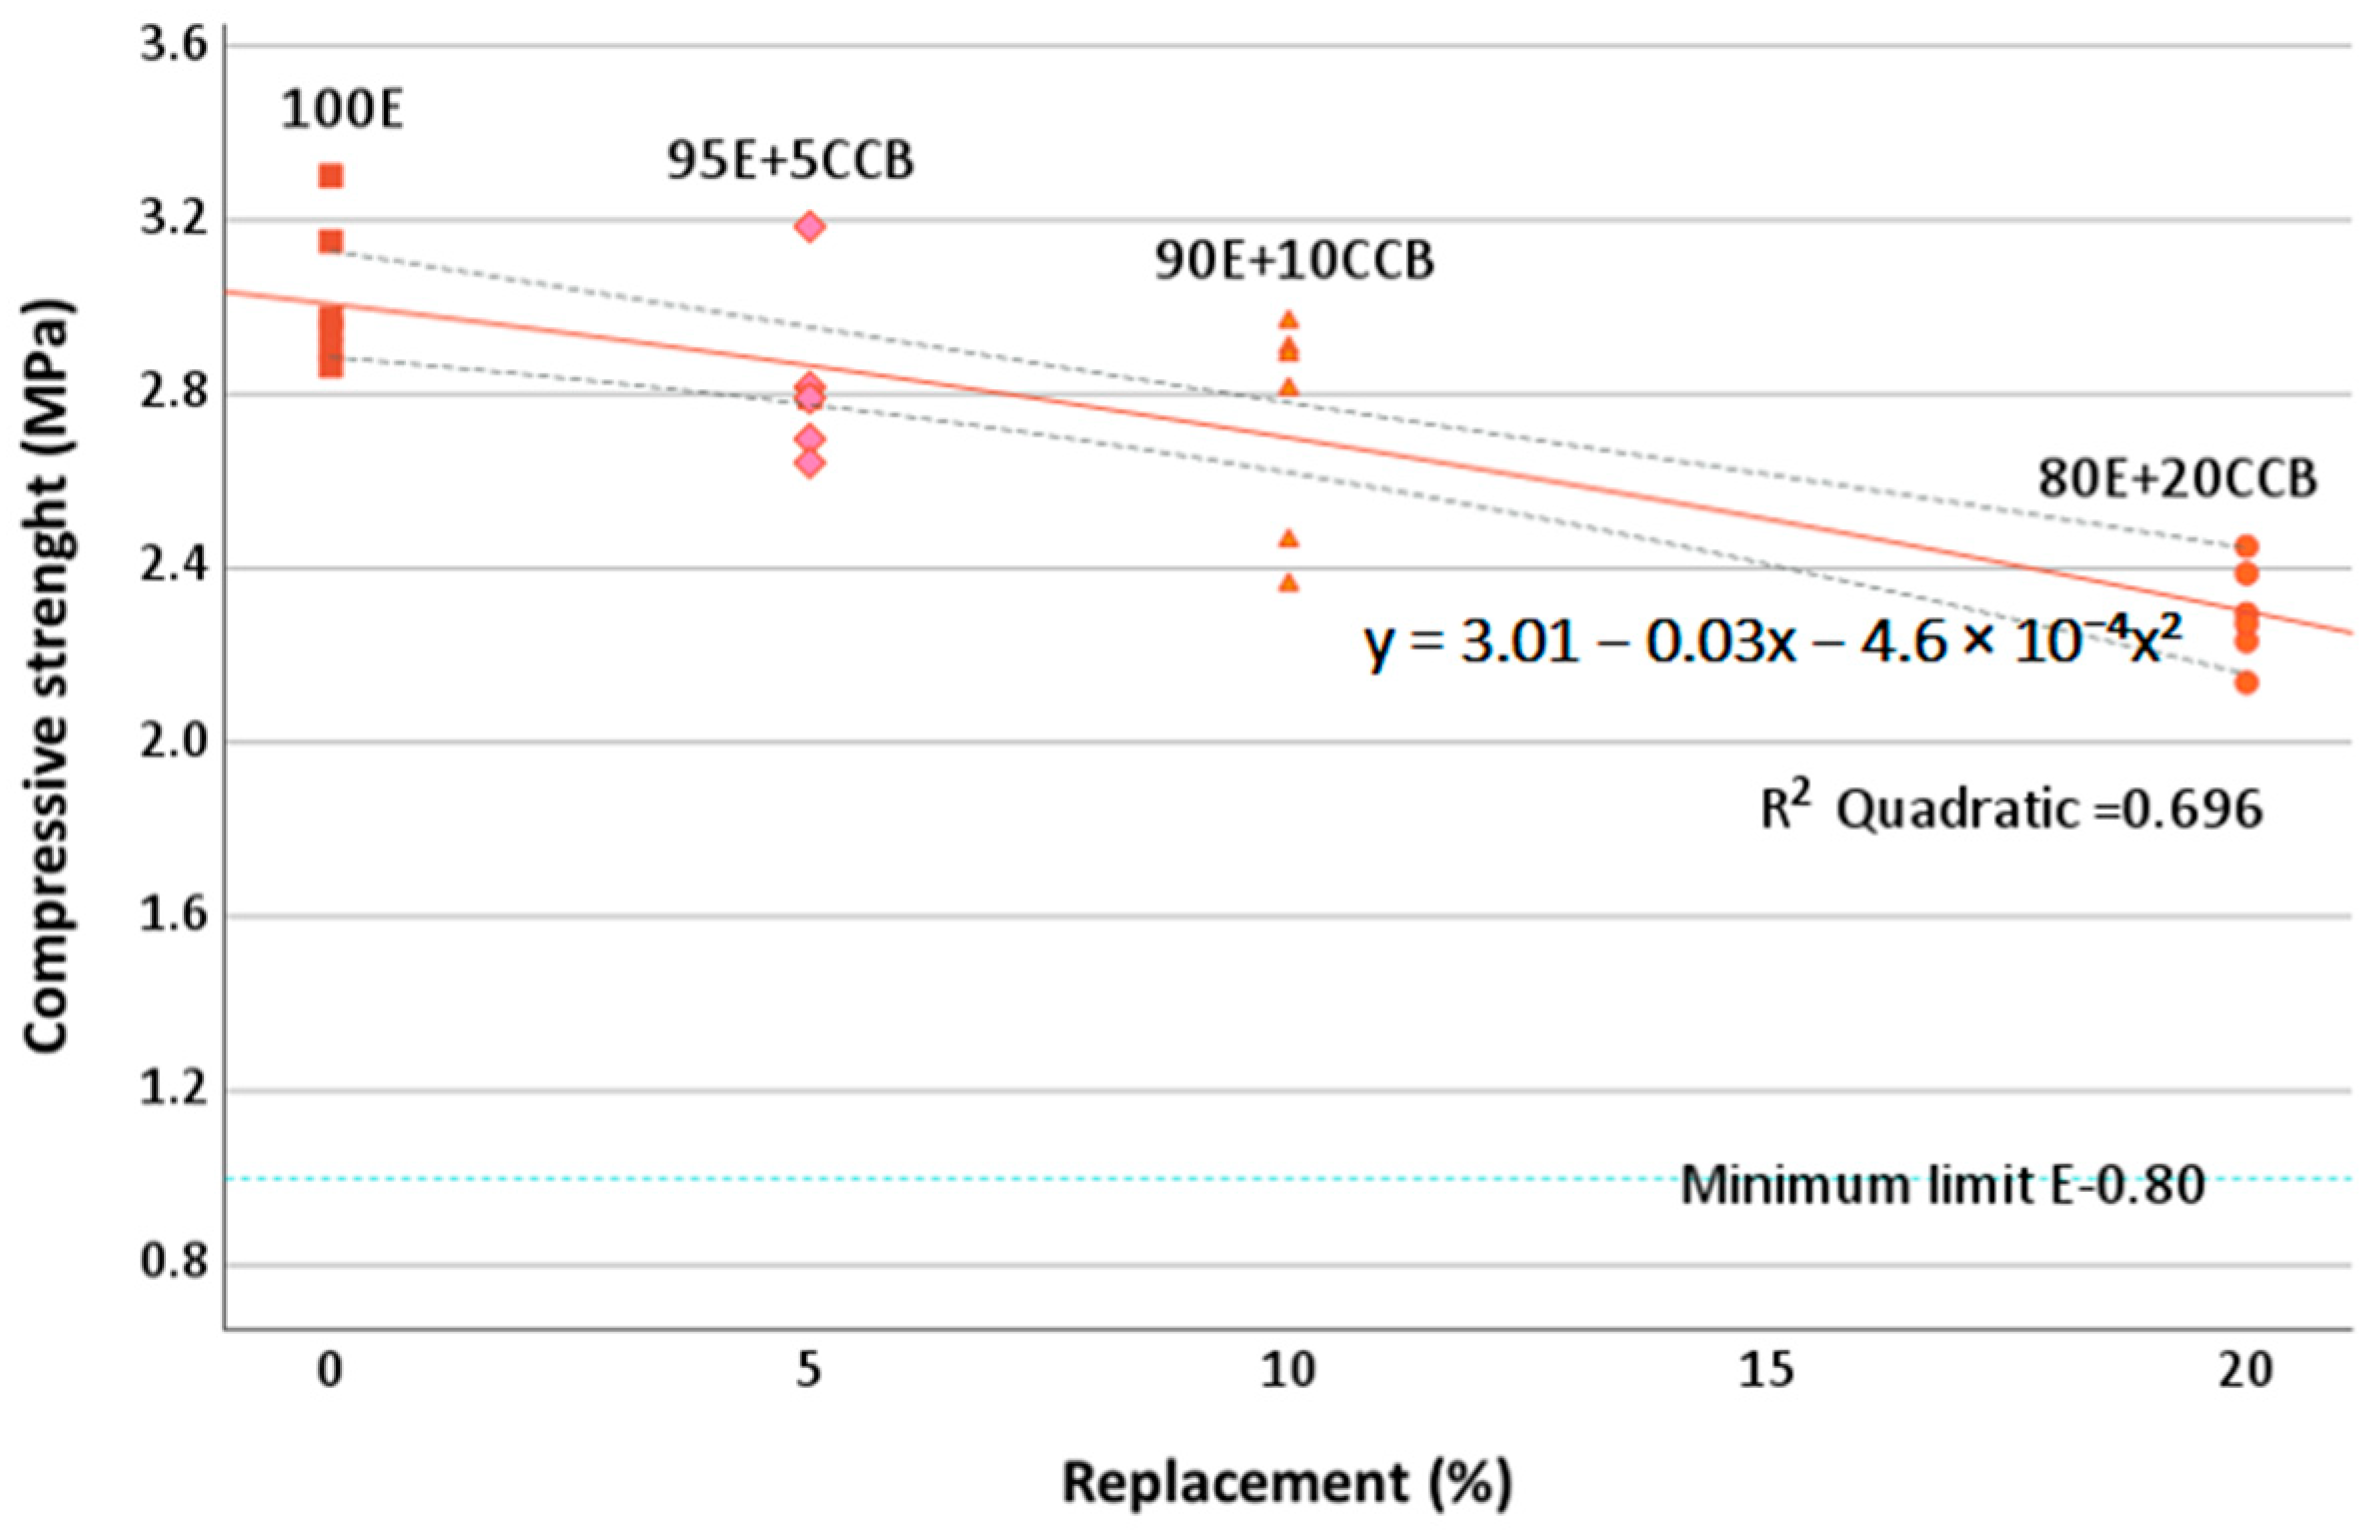
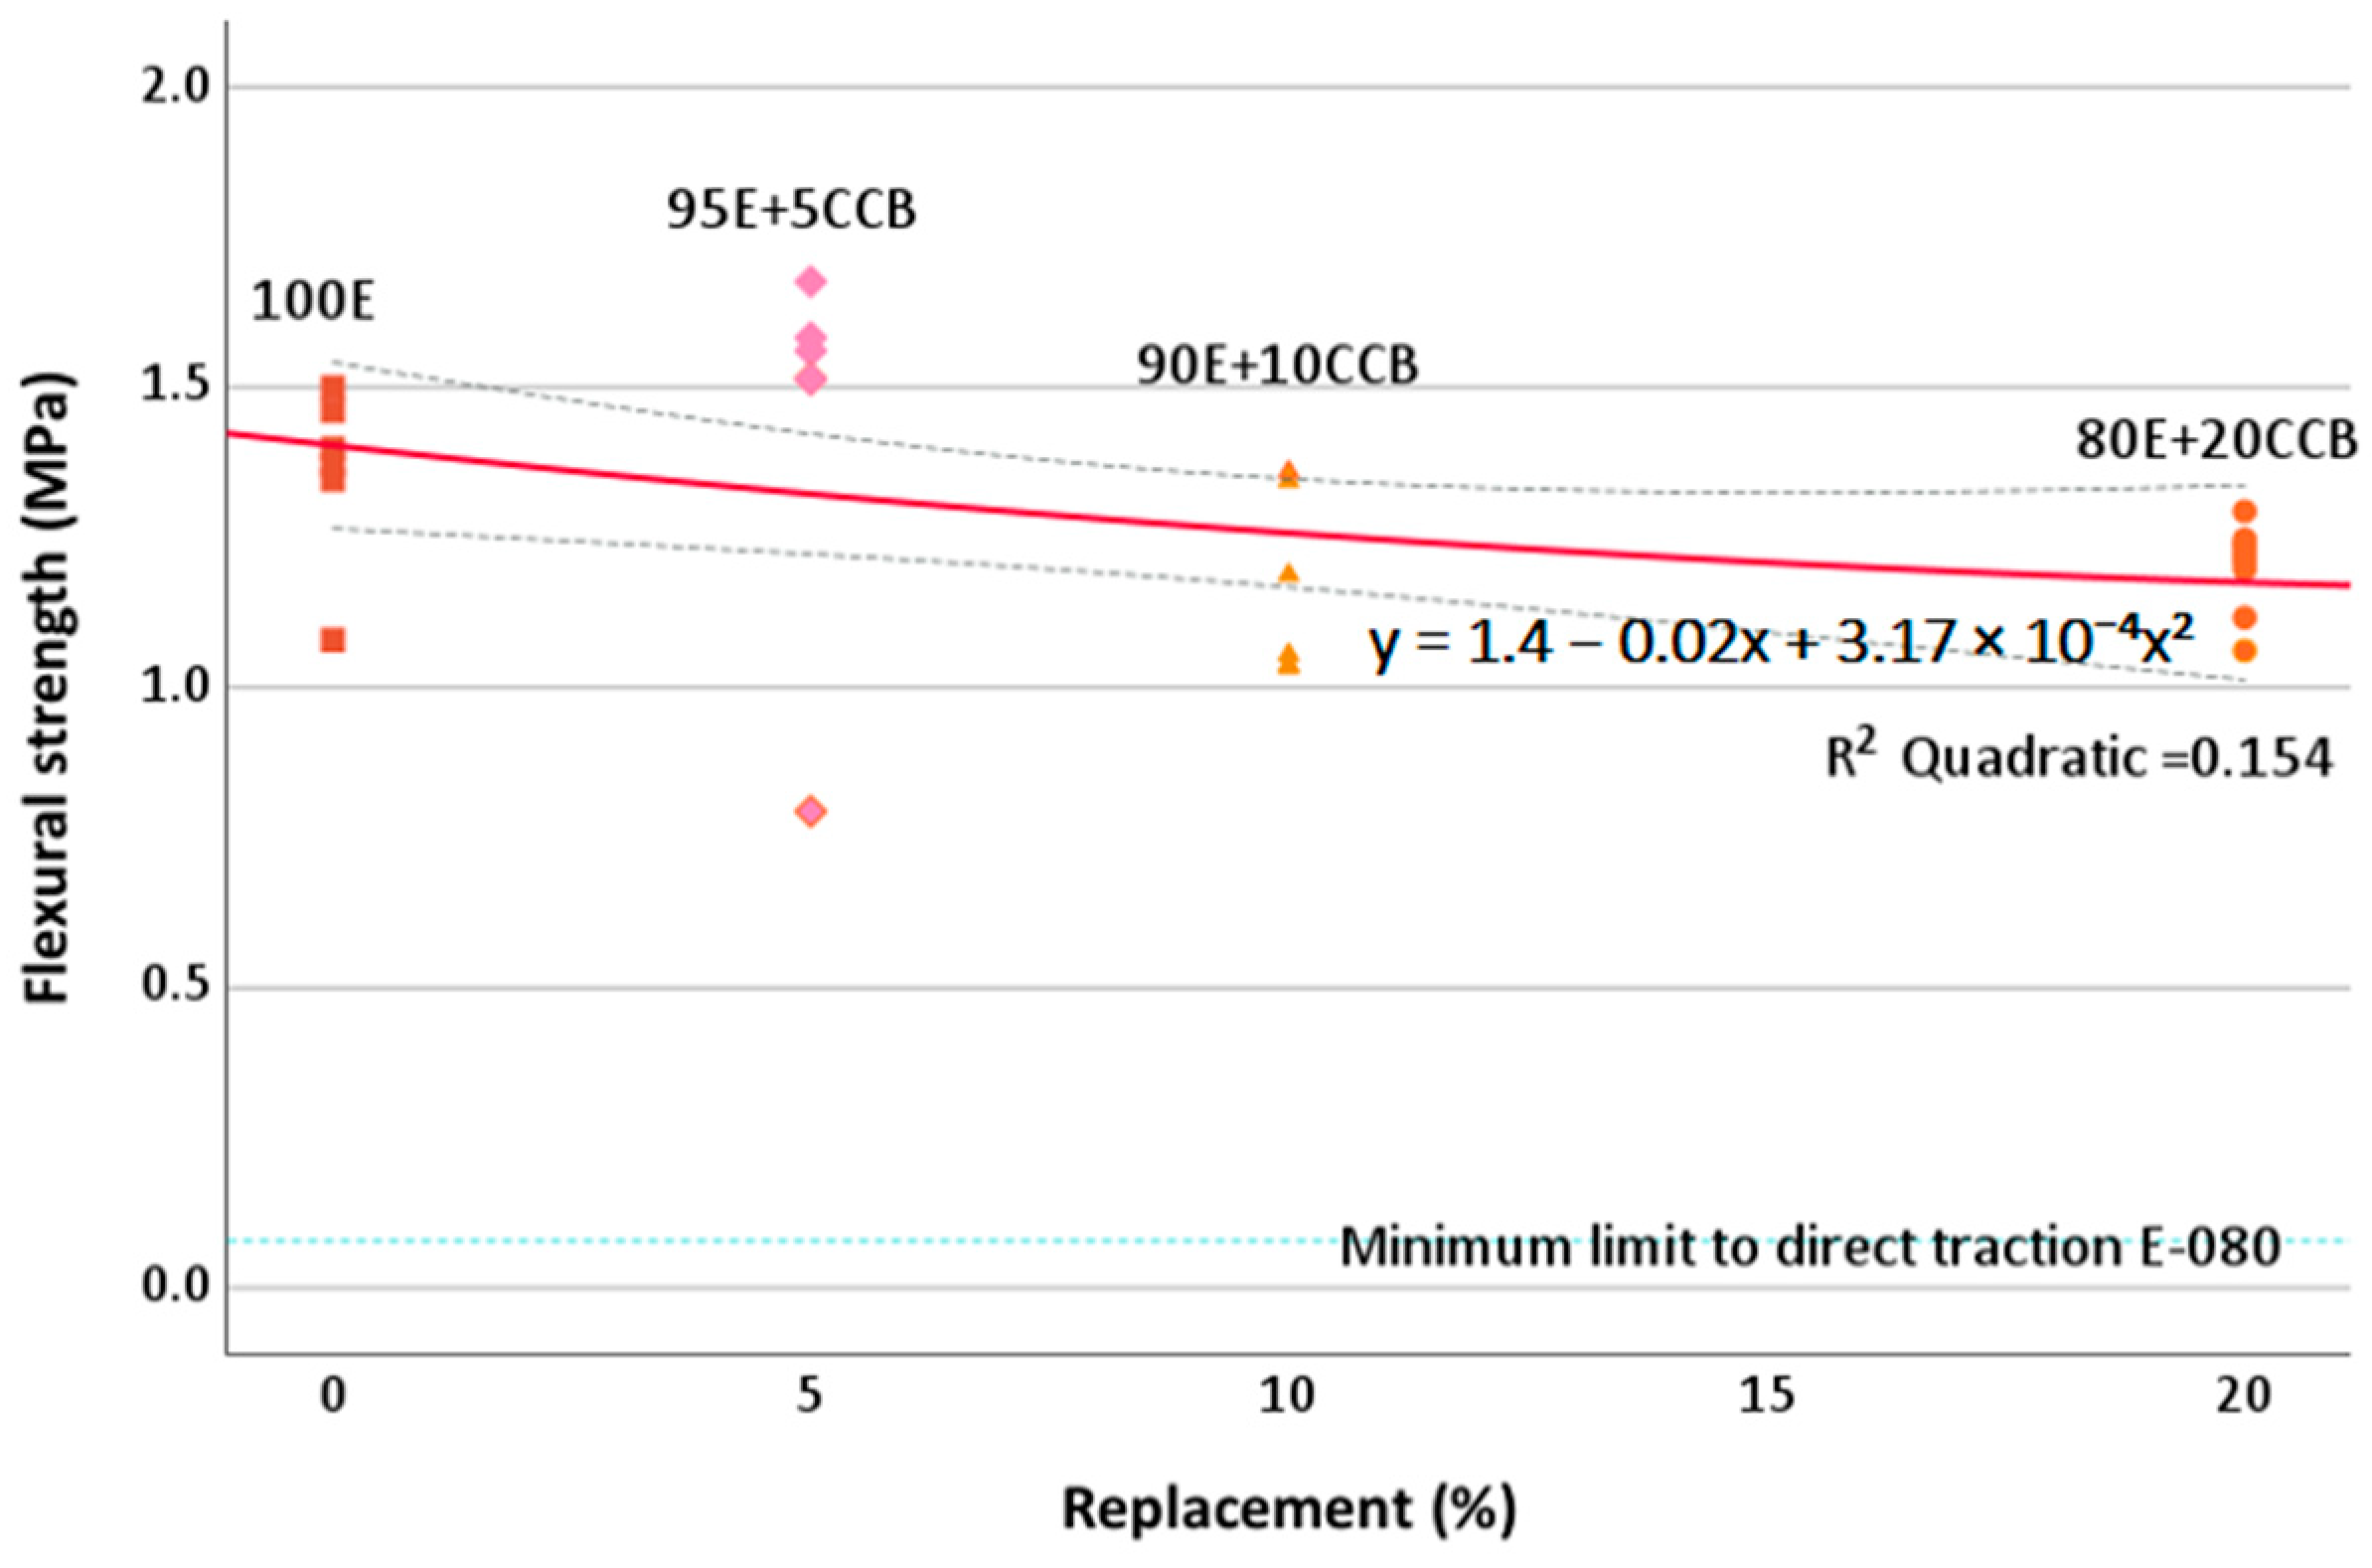
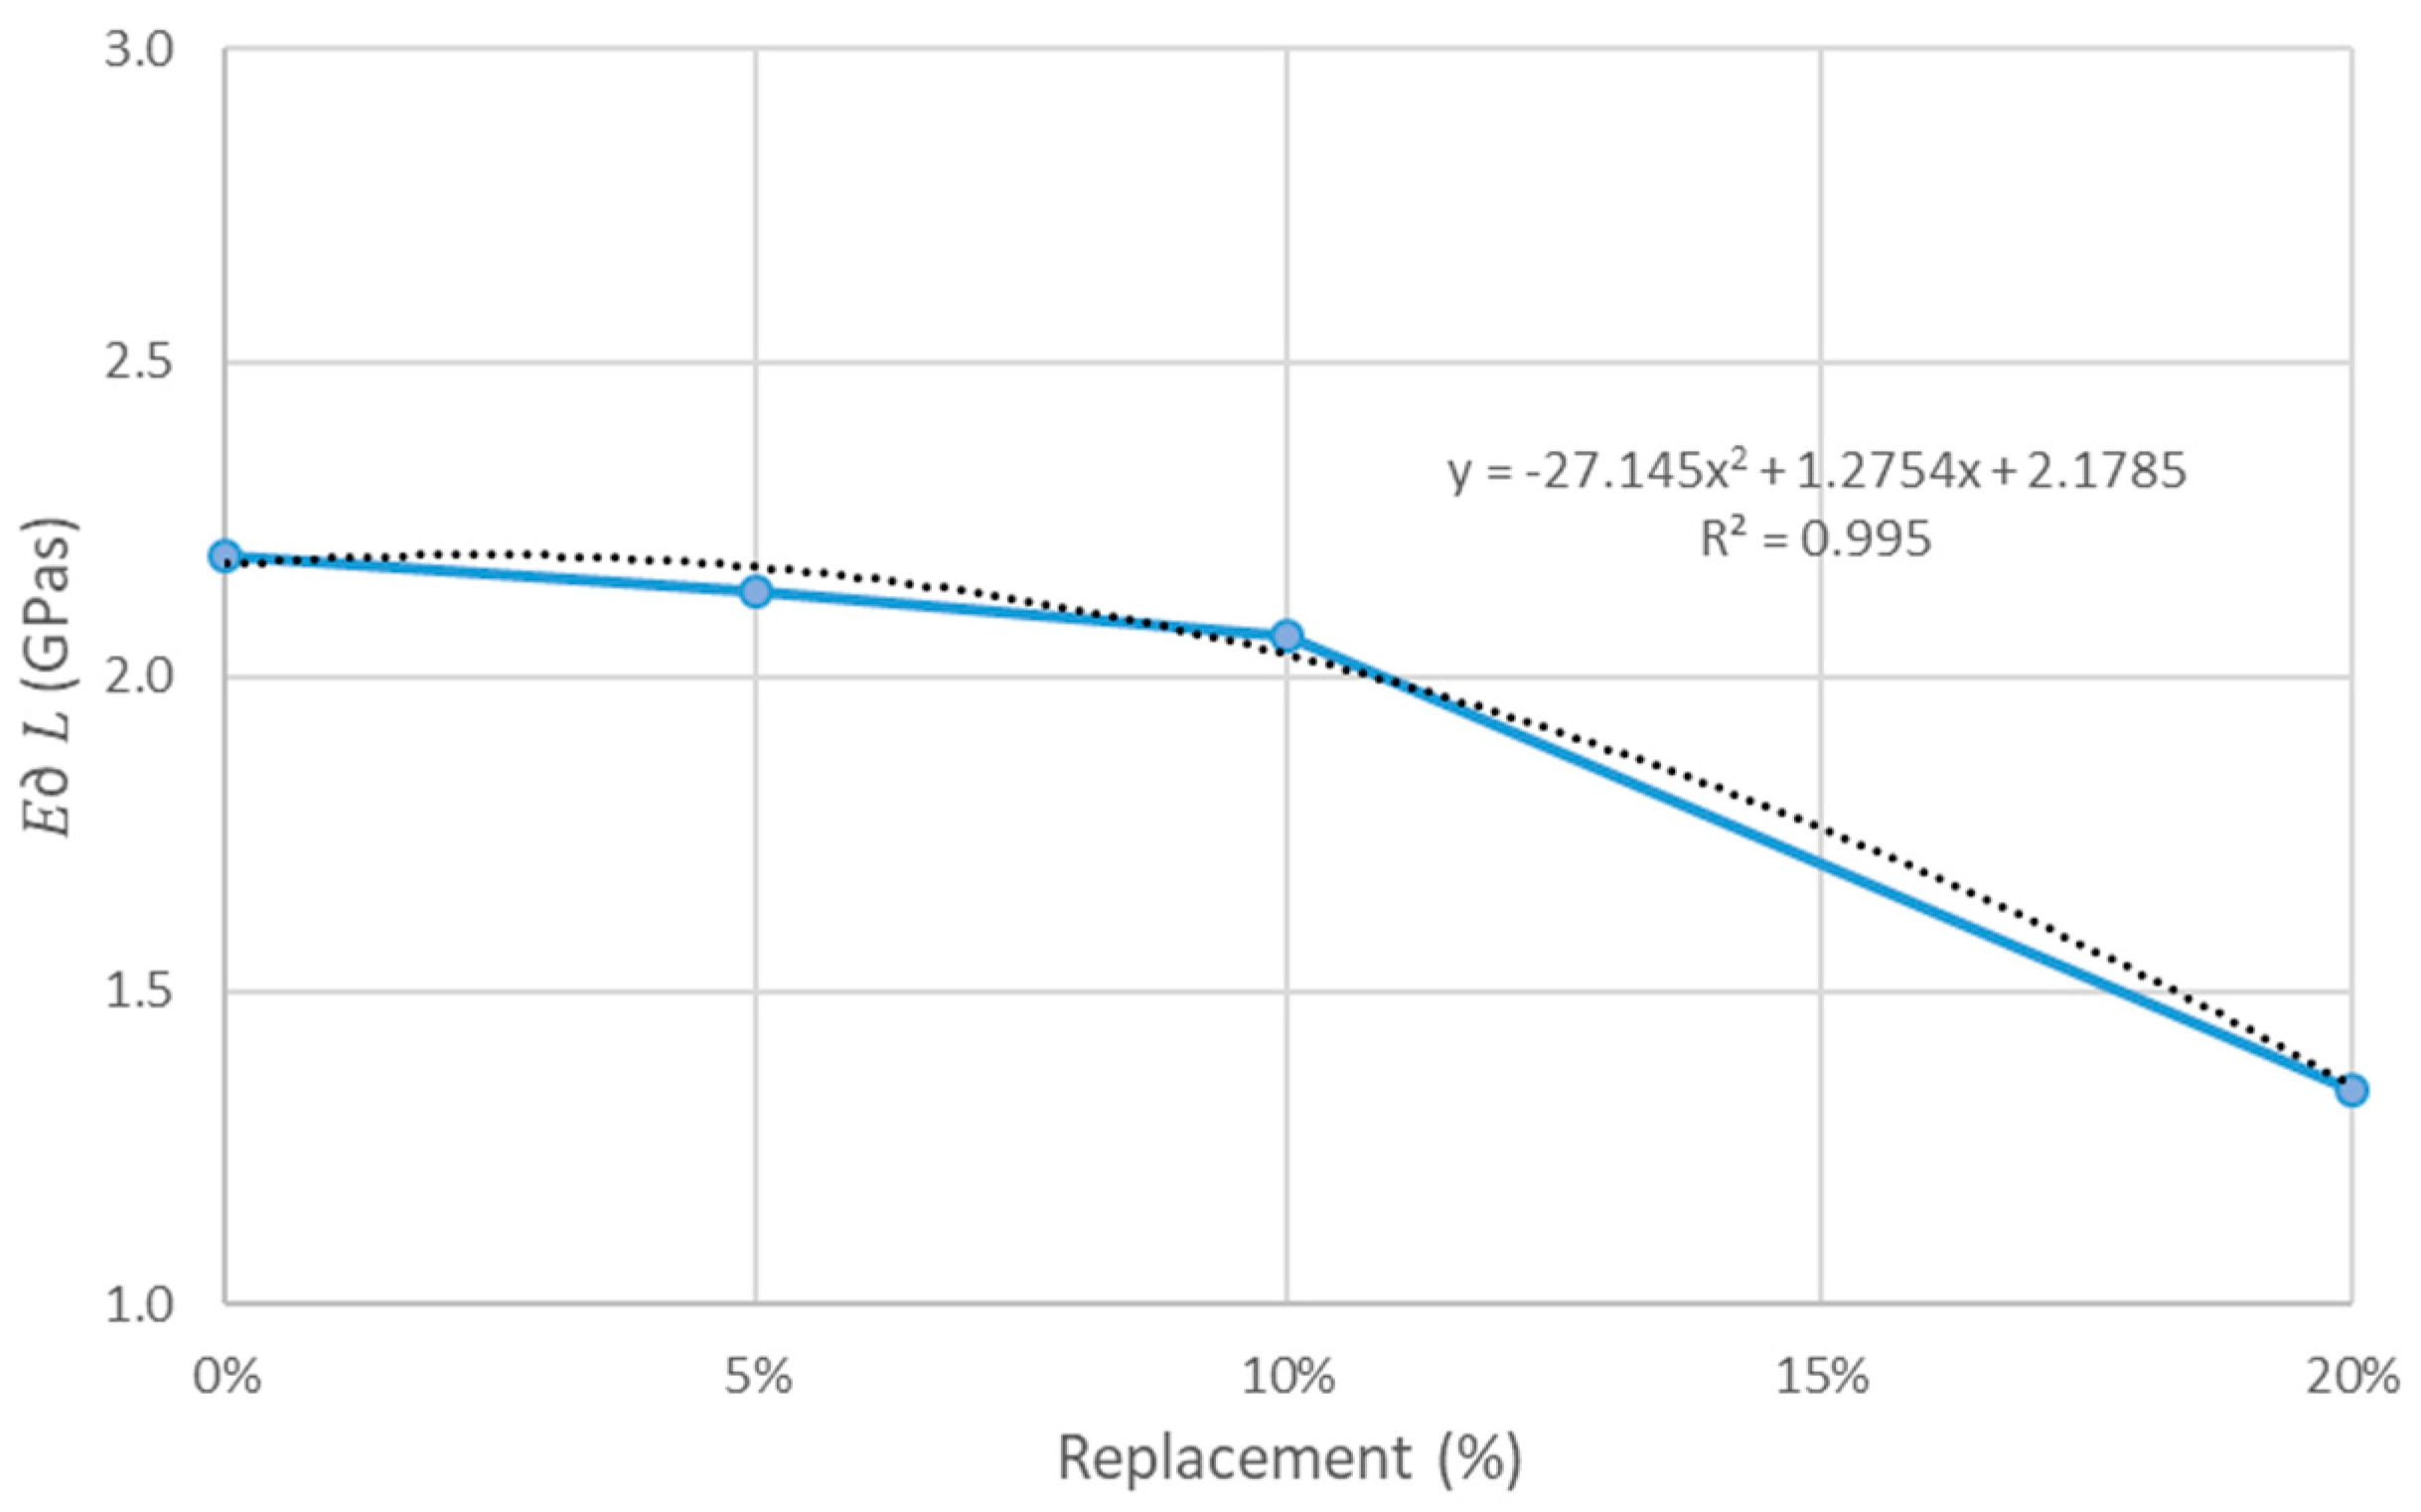
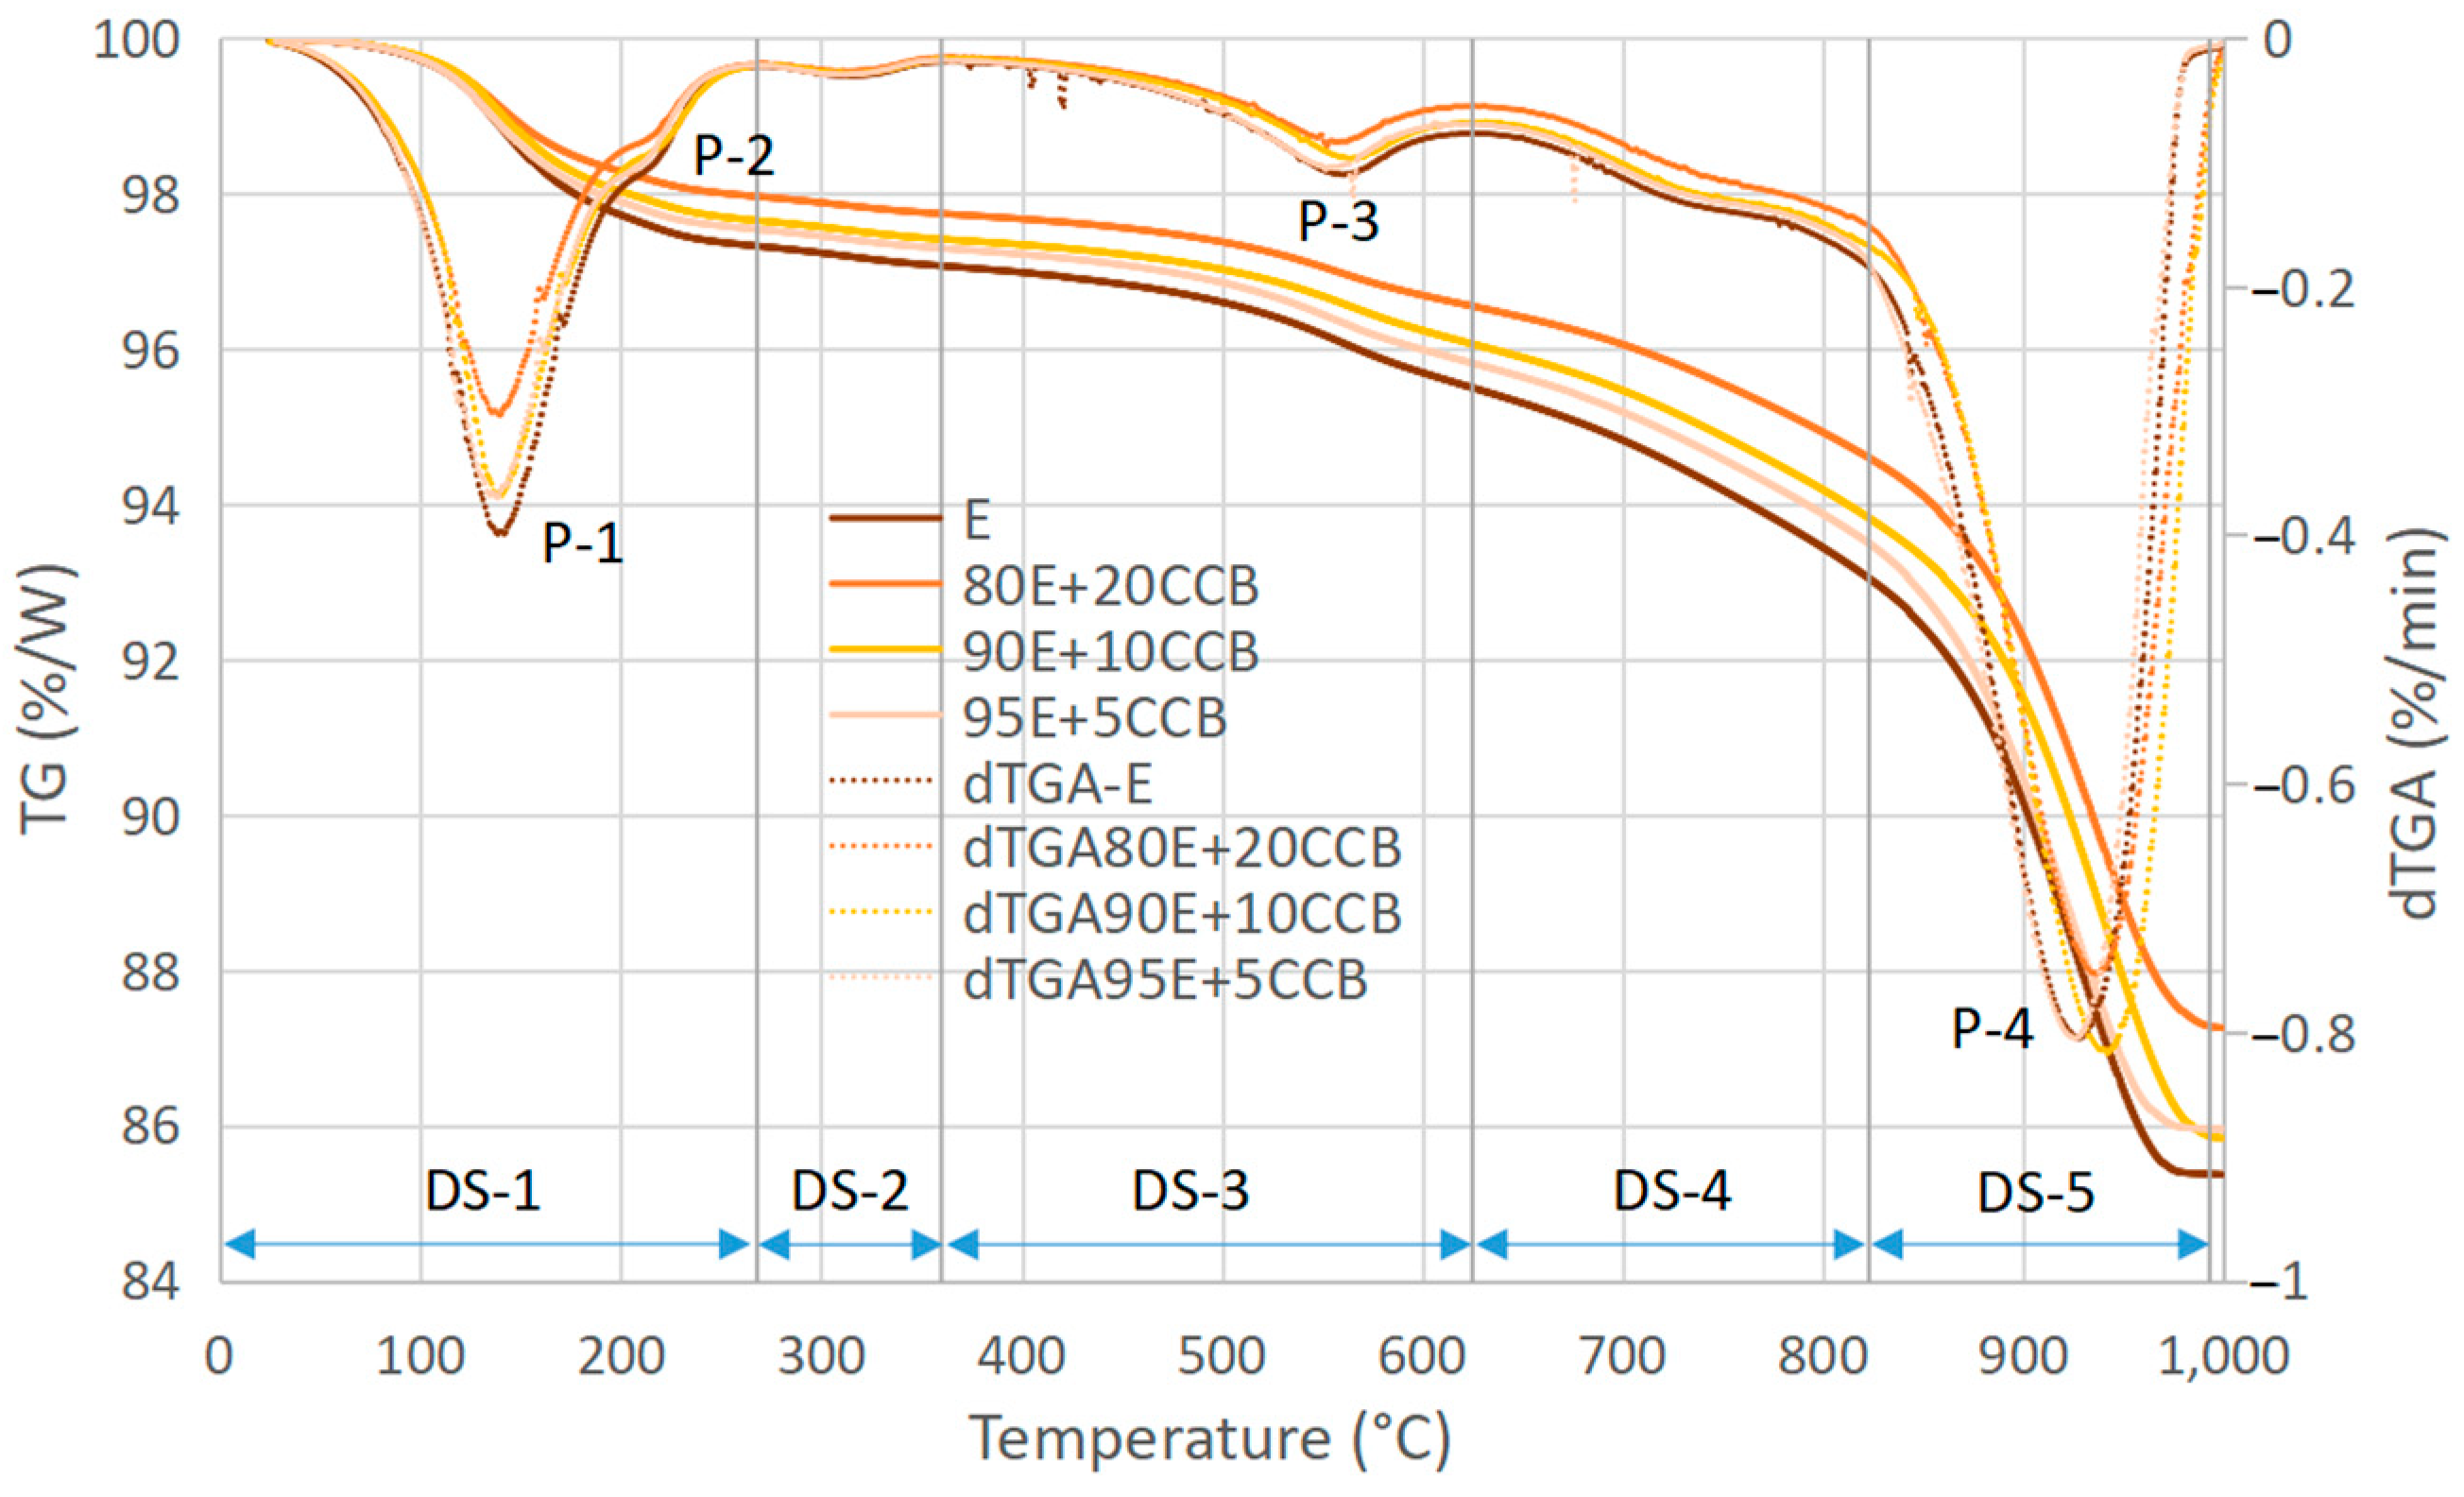


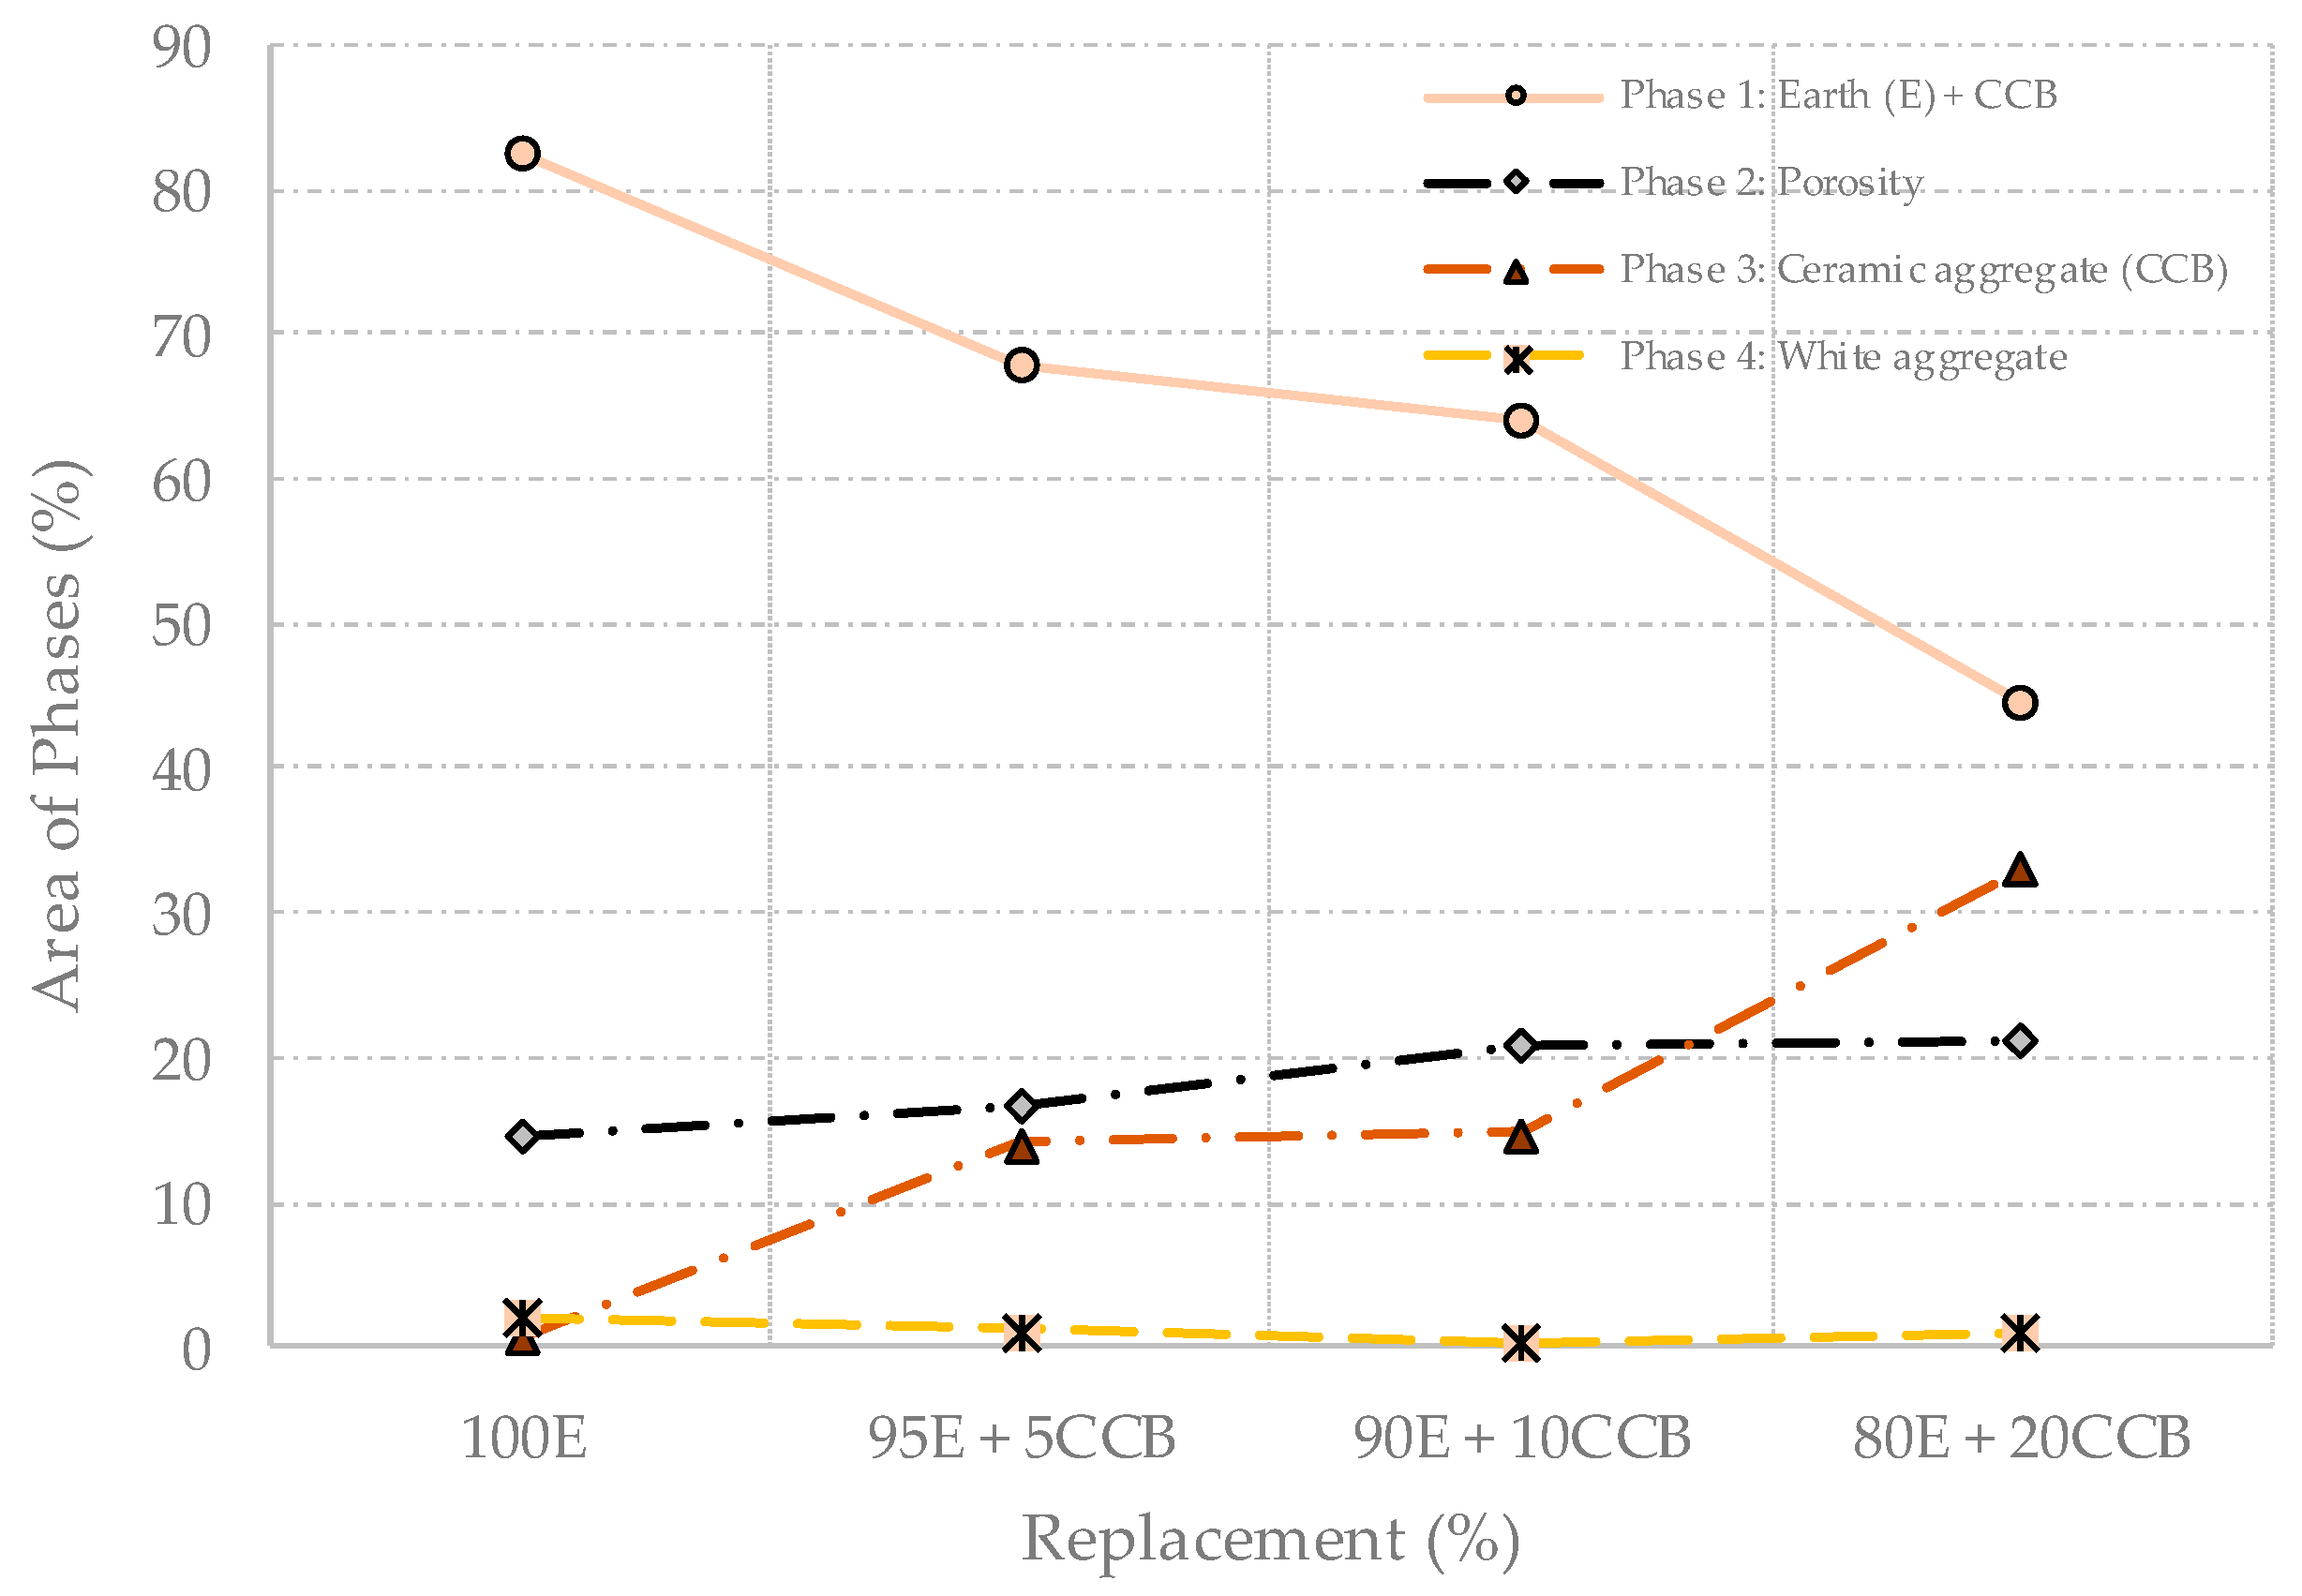
Disclaimer/Publisher’s Note: The statements, opinions and data contained in all publications are solely those of the individual author(s) and contributor(s) and not of MDPI and/or the editor(s). MDPI and/or the editor(s) disclaim responsibility for any injury to people or property resulting from any ideas, methods, instructions or products referred to in the content. |
© 2025 by the authors. Licensee MDPI, Basel, Switzerland. This article is an open access article distributed under the terms and conditions of the Creative Commons Attribution (CC BY) license (https://creativecommons.org/licenses/by/4.0/).