
Assessing the Air Humidity Characteristics of Local Climate Zones in Guangzhou, China


Abstract
:1. Introduction
2. Methods
2.1. Study Area
2.2. LCZ Sites
2.3. Data
2.4. Typical Days for UMI Development
2.5. Humidity Parameters
- RH
- Ea
- VPD
- Definition of UMI
3. Results
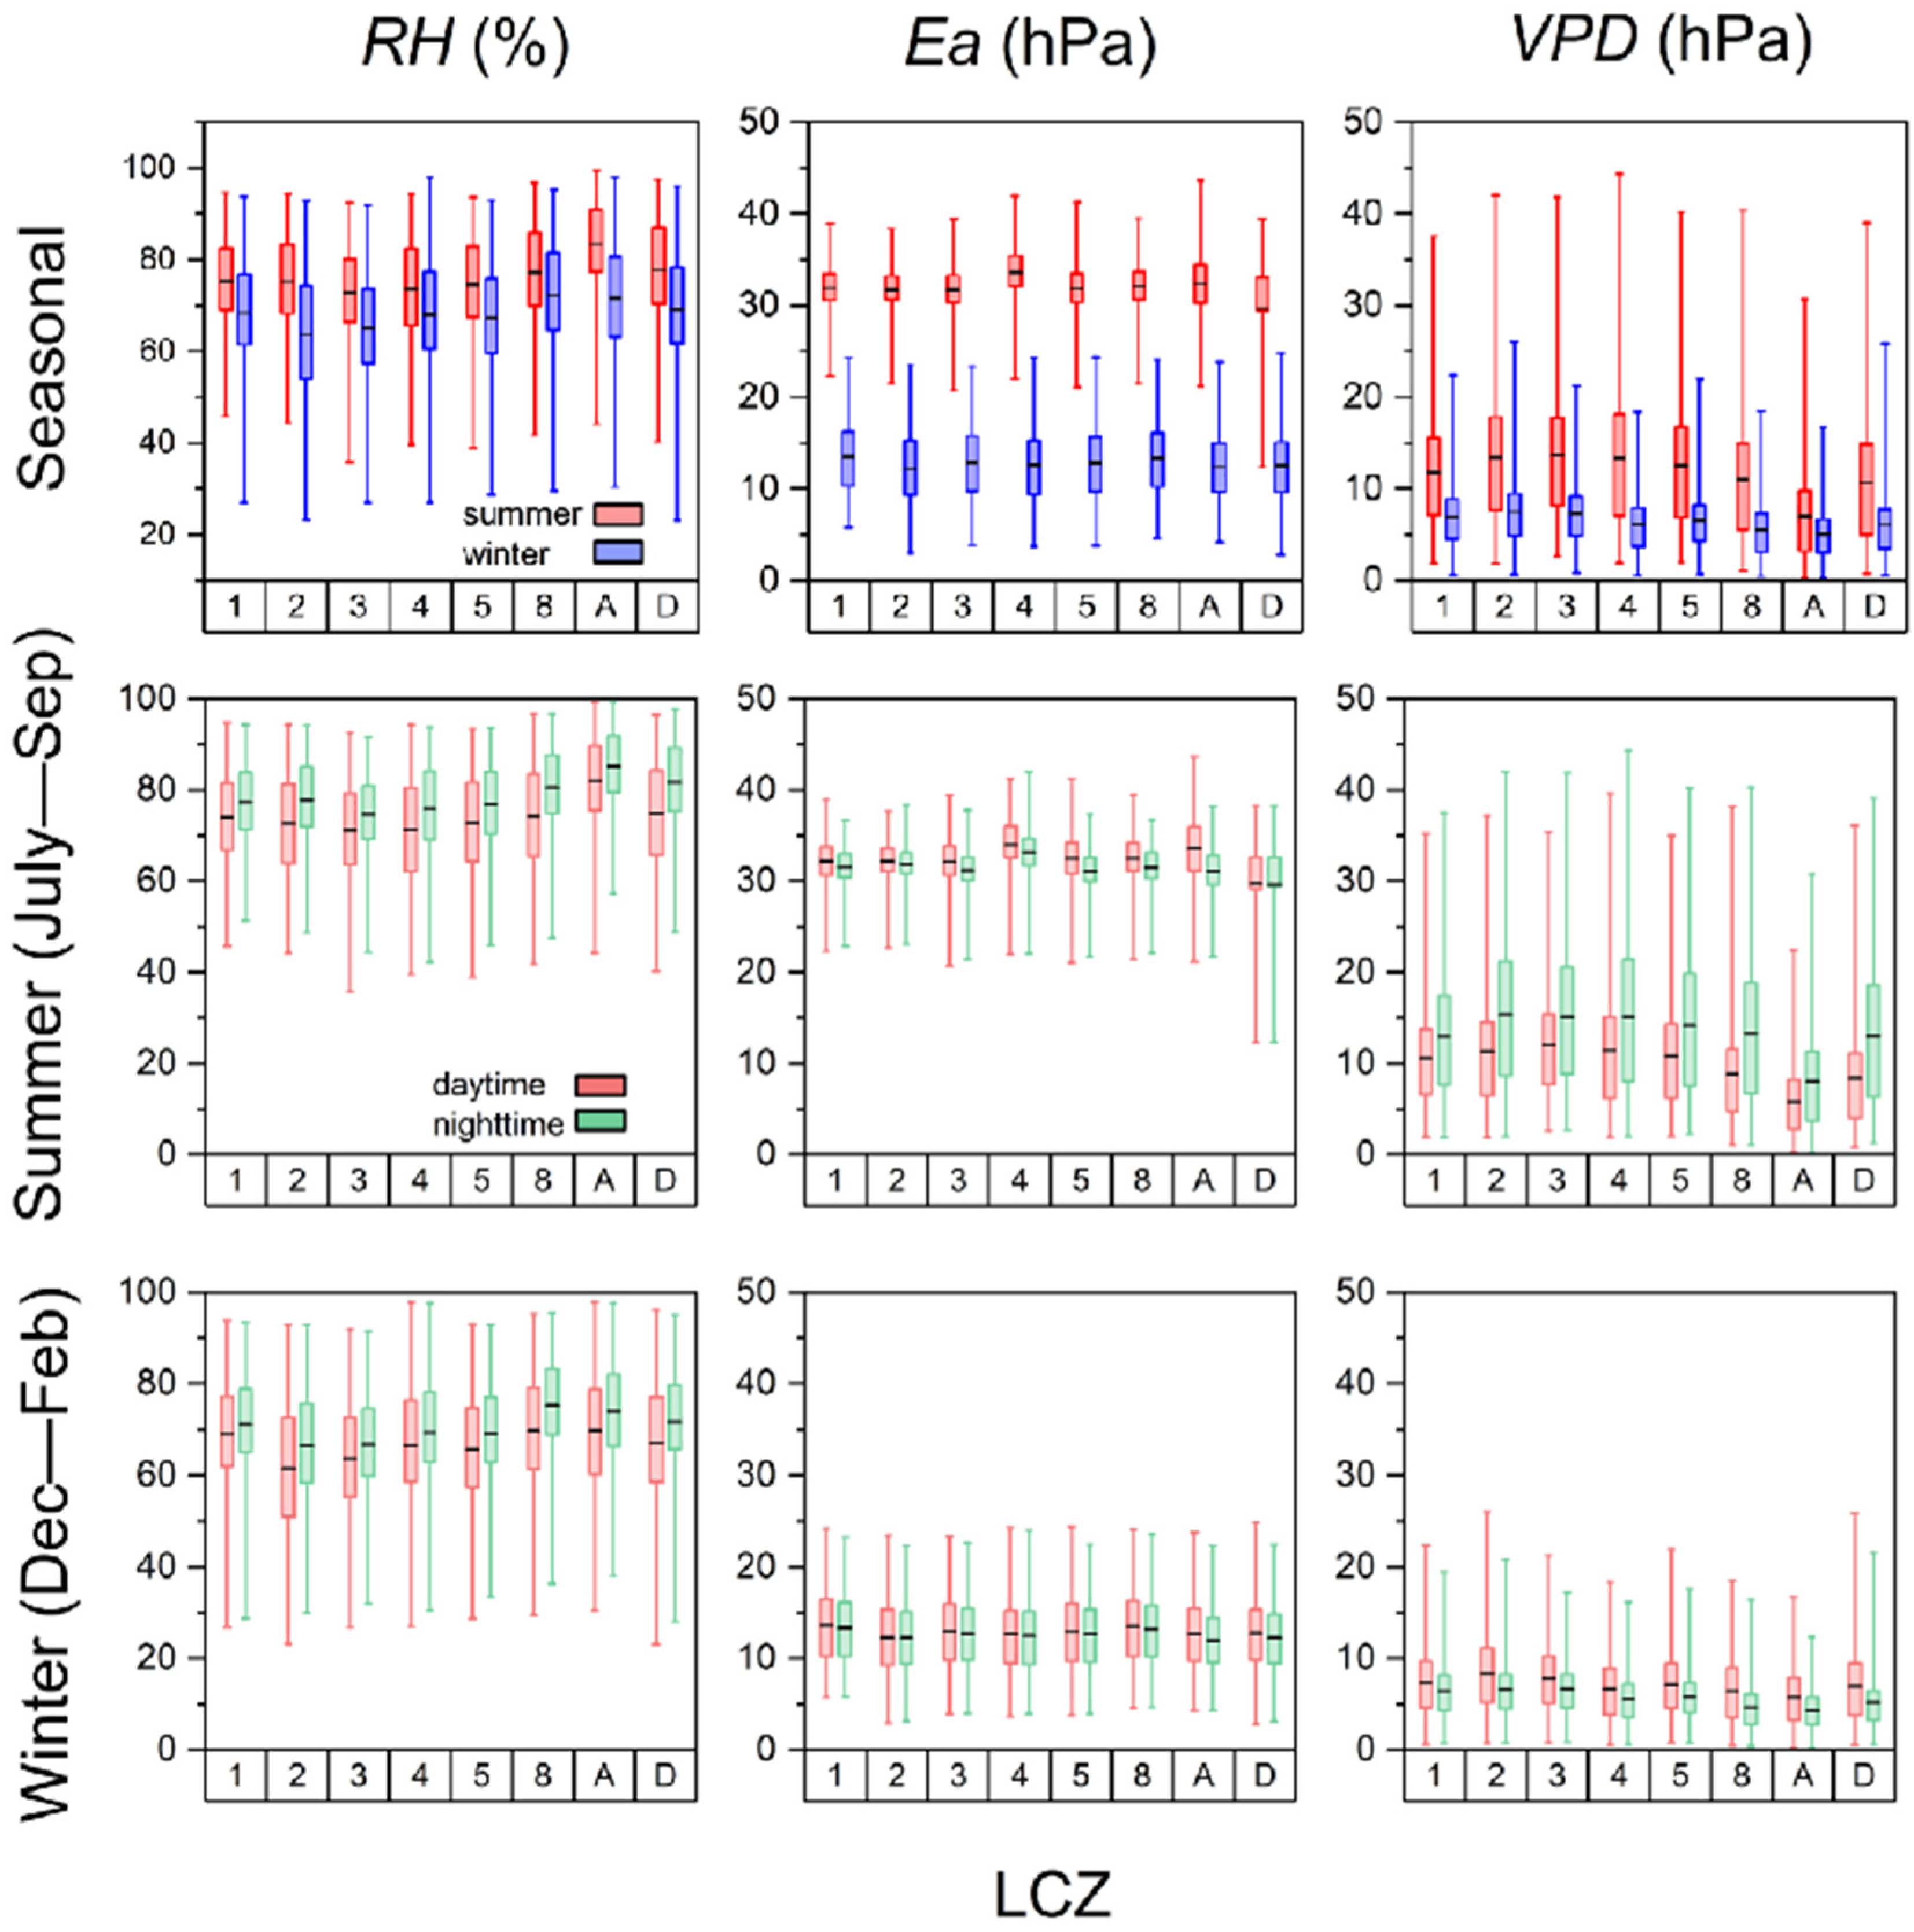
3.1. Temporal Pattern of Humidity
3.2. Temporal UMI Pattern
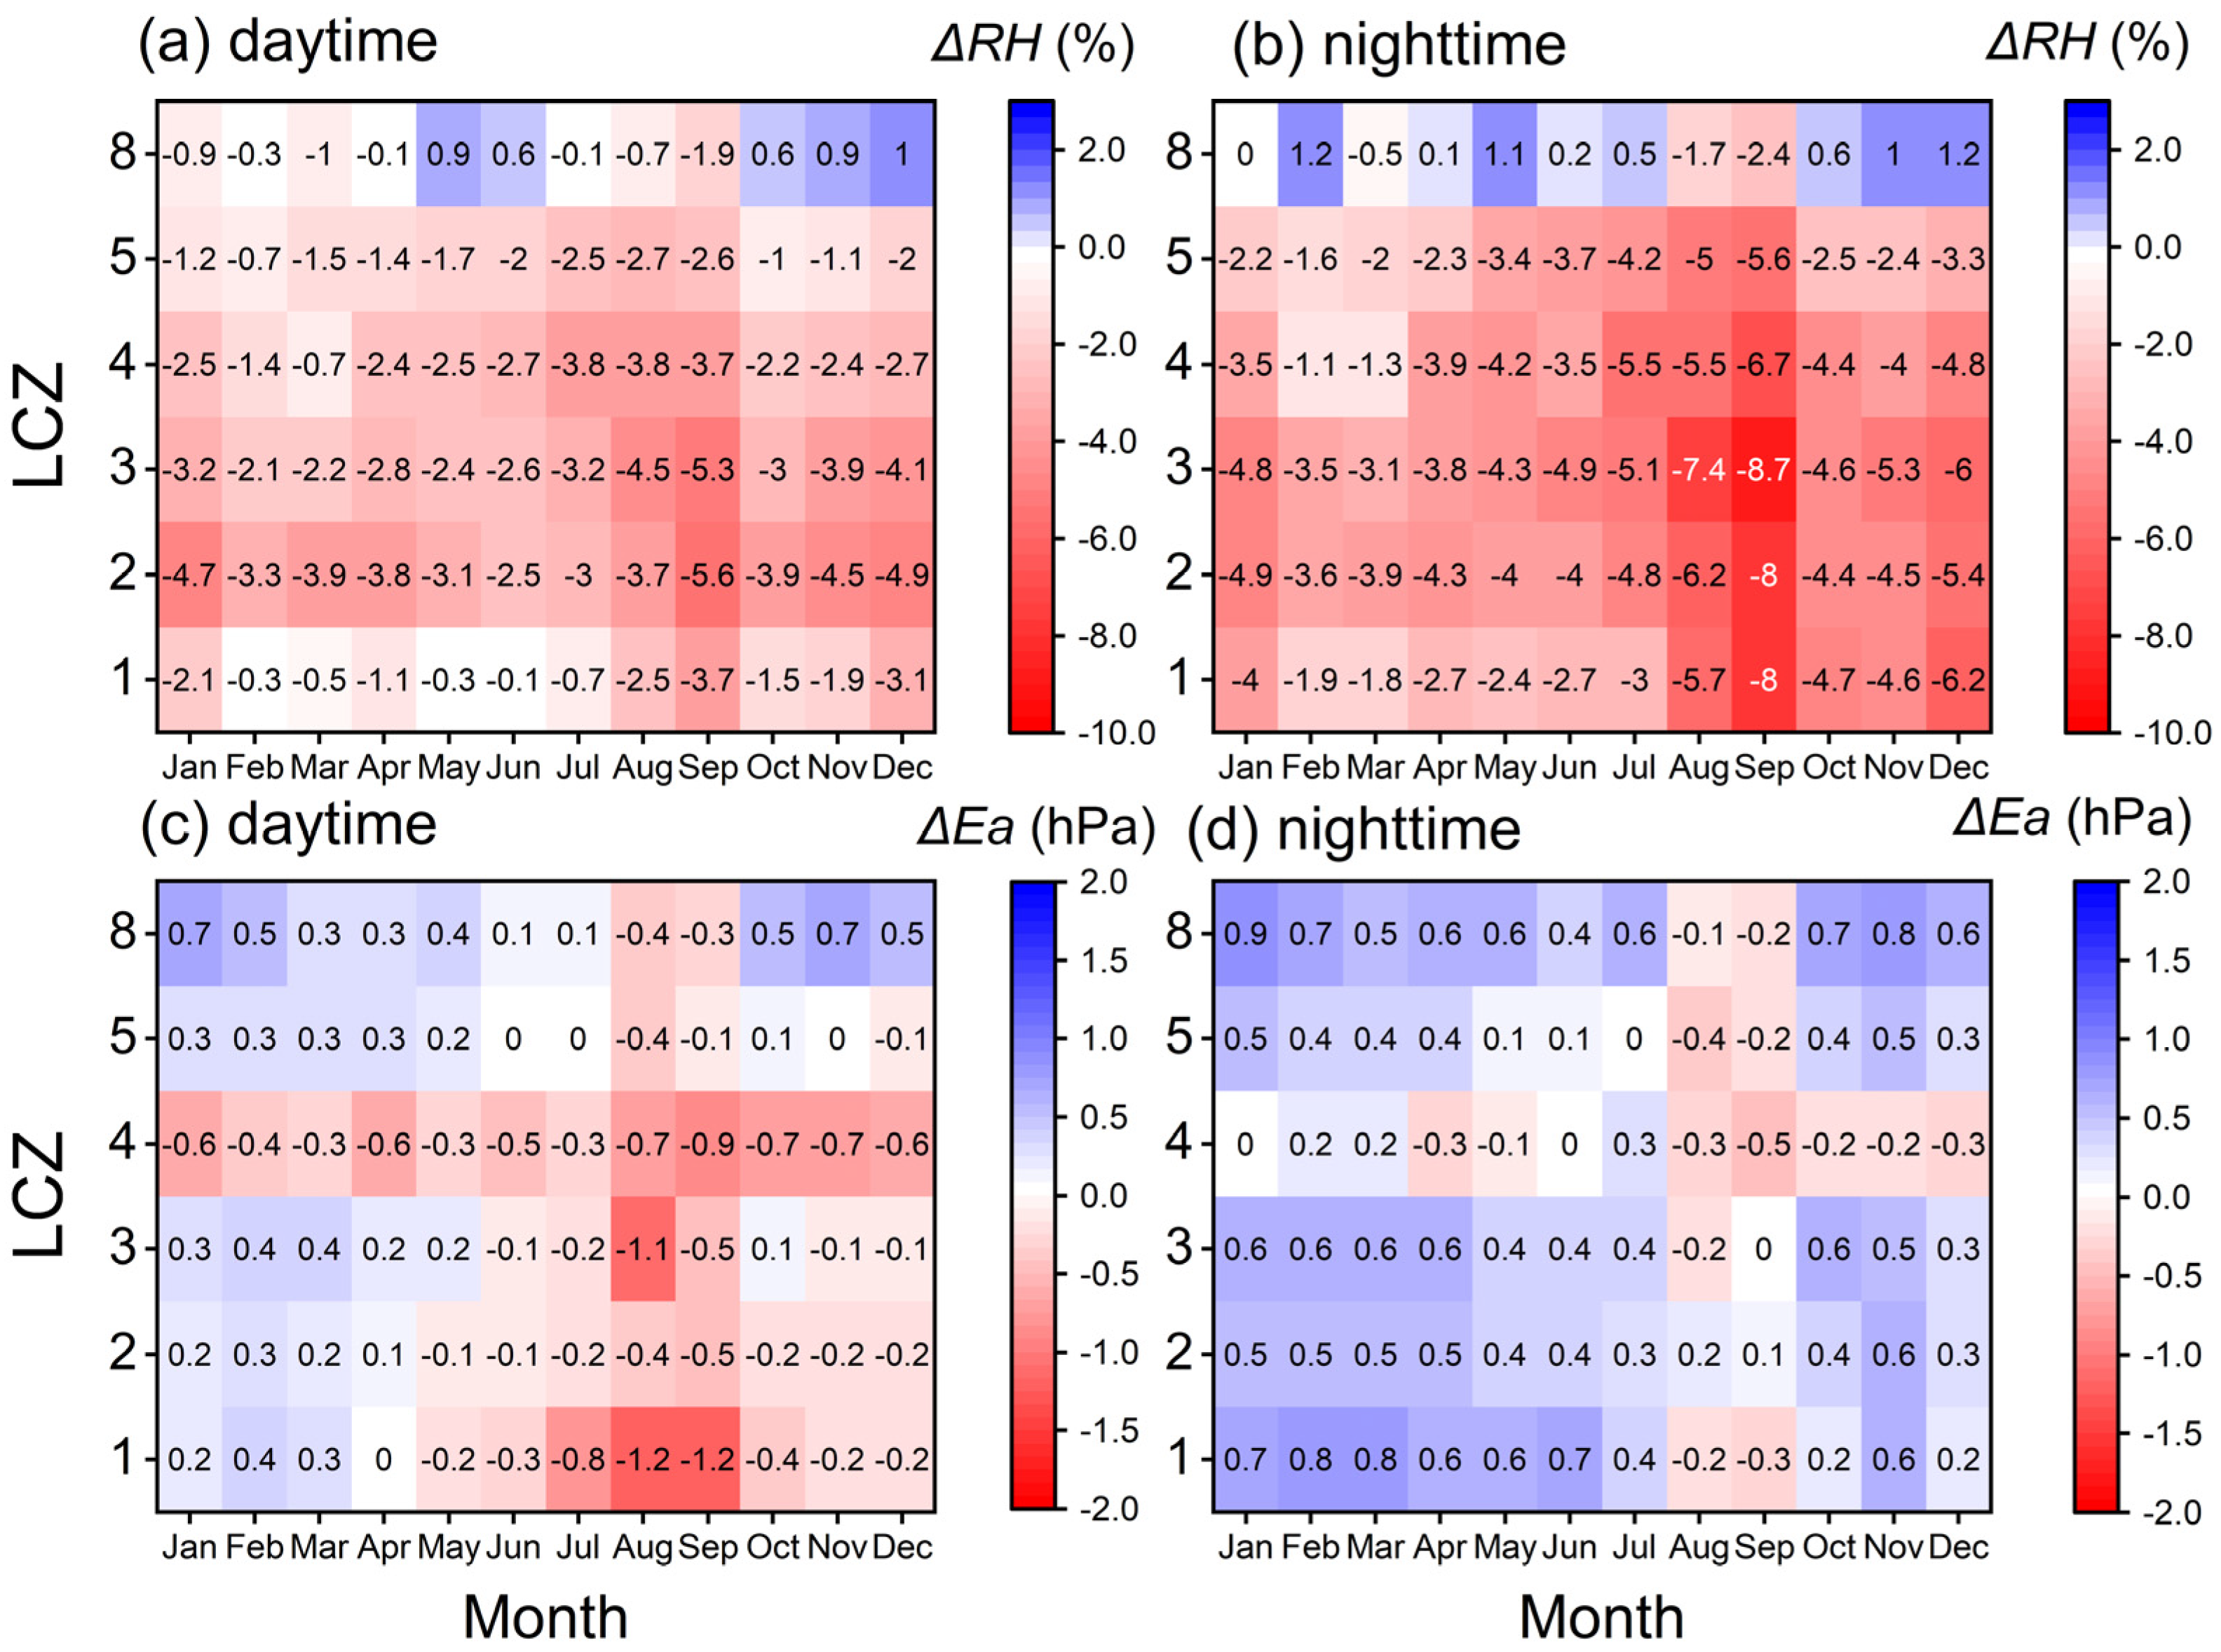
3.2.1. Monthly Variations
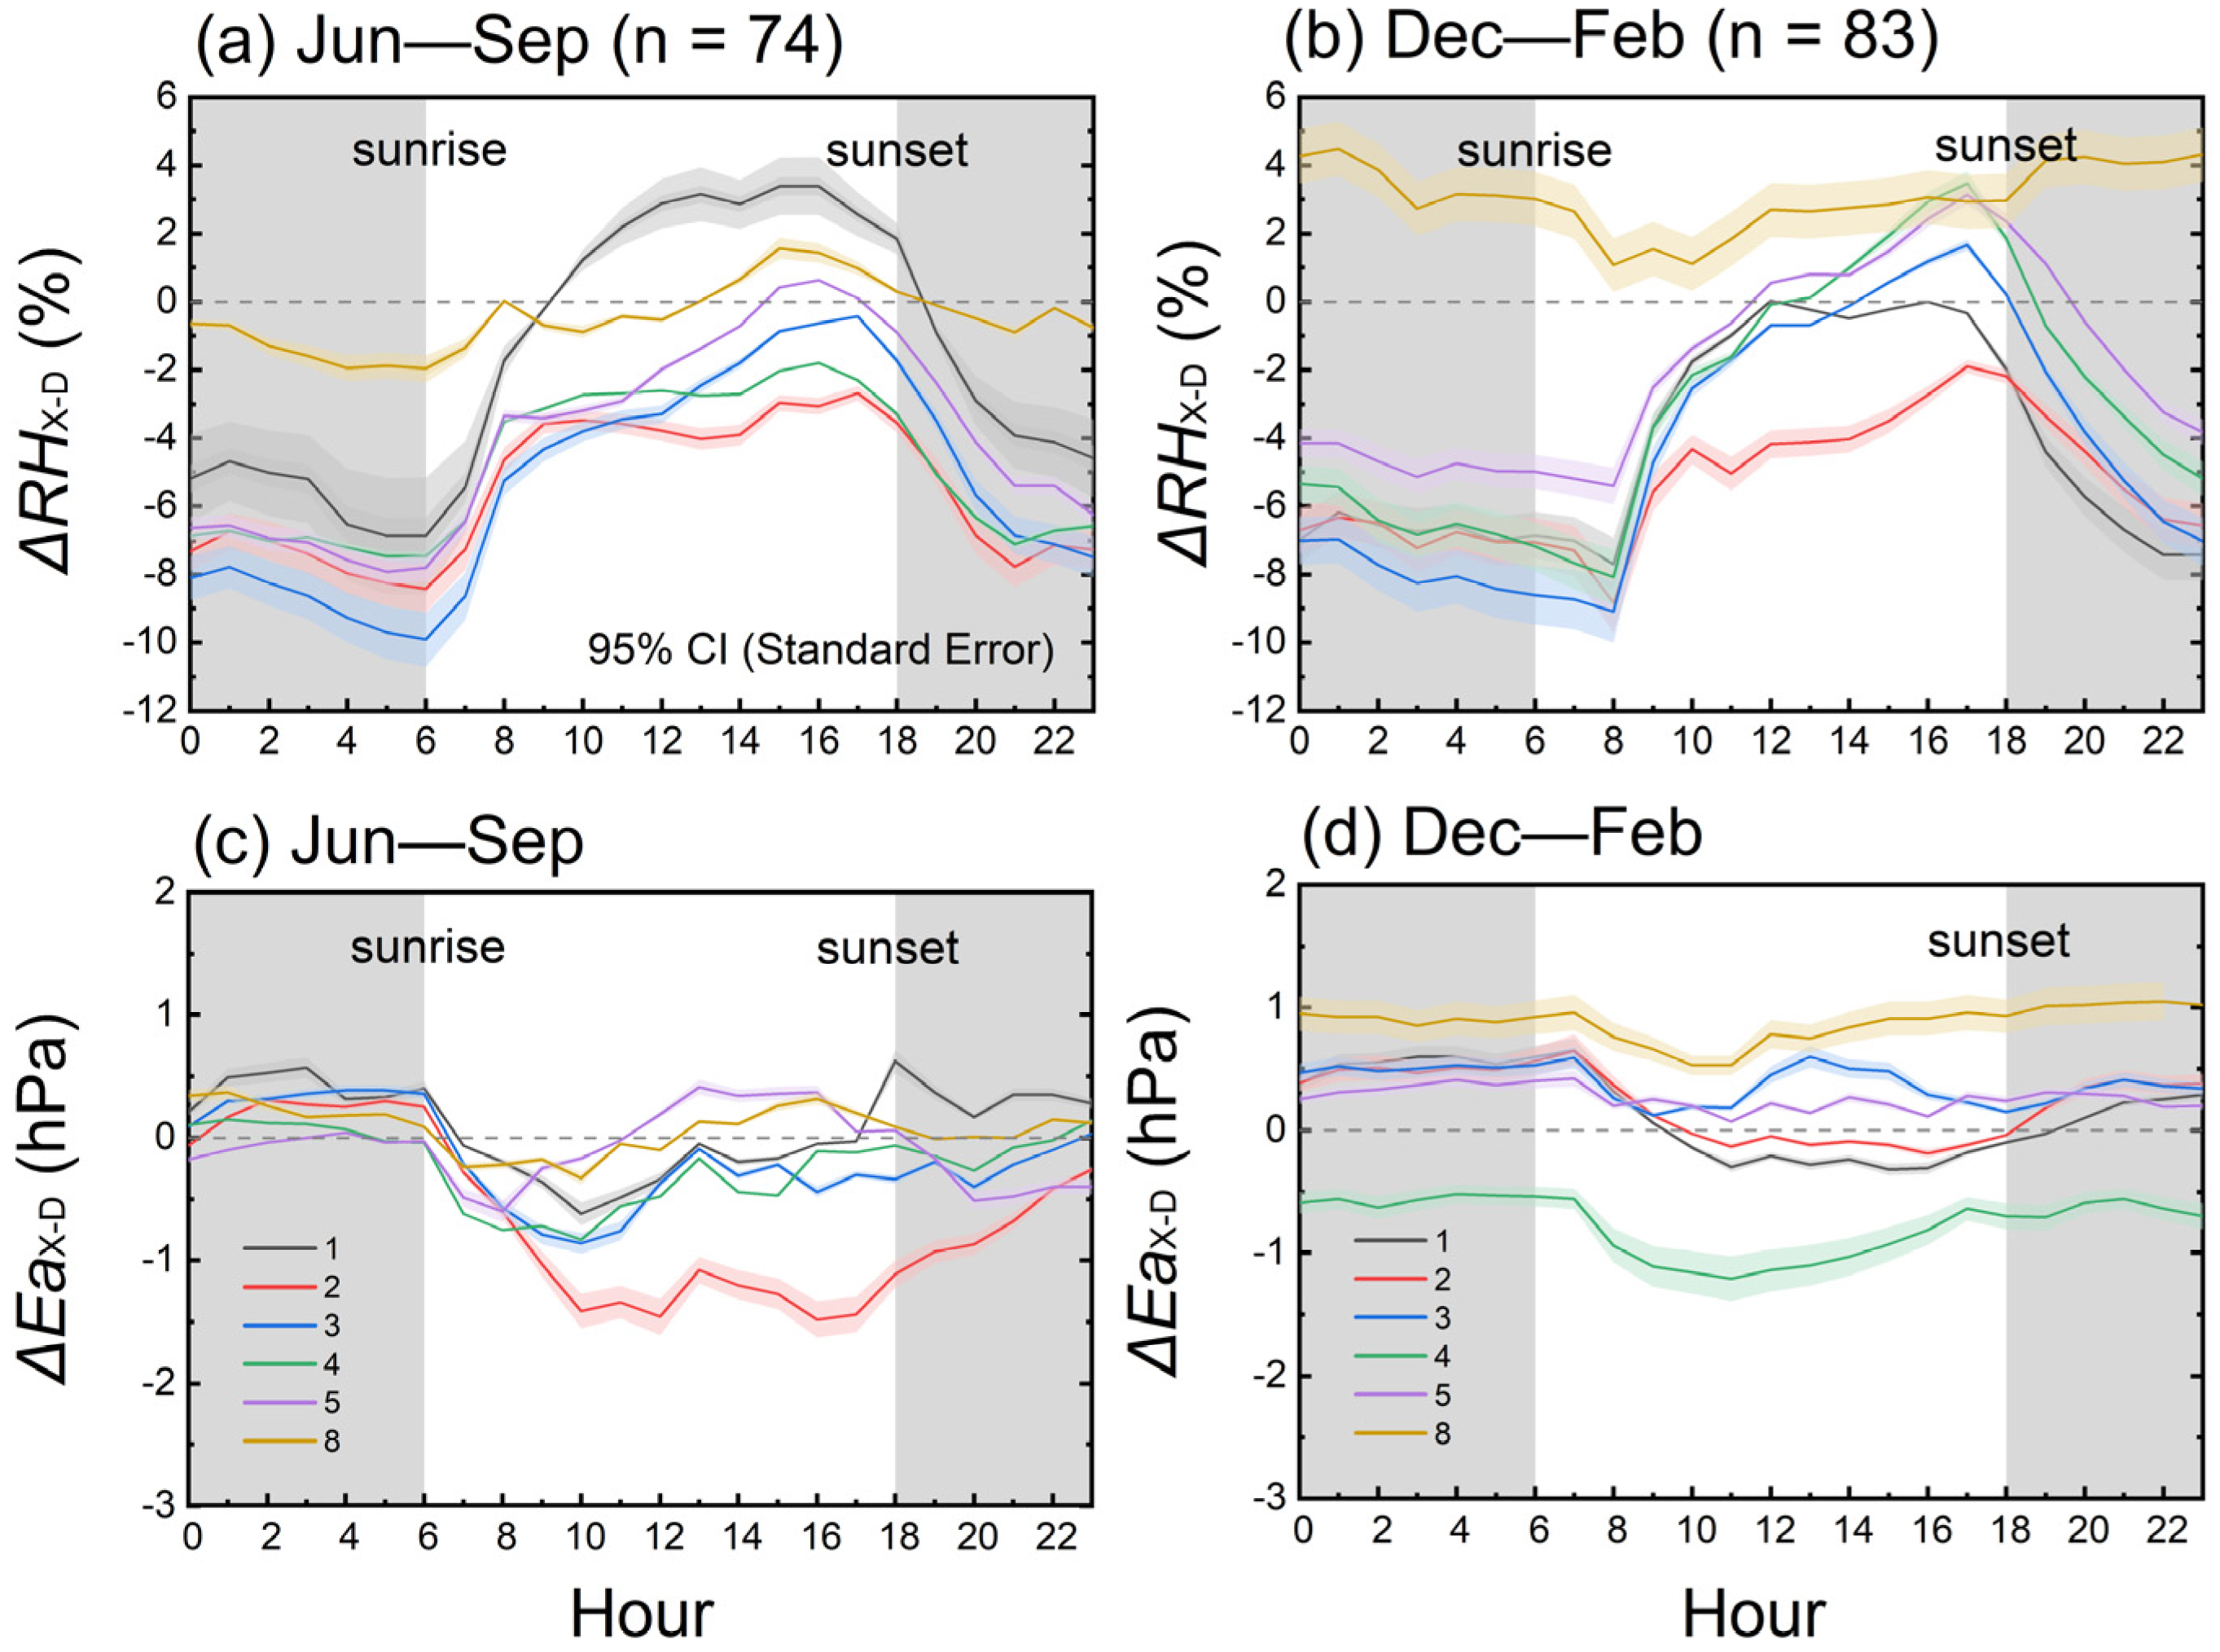
3.2.2. Hourly Variation
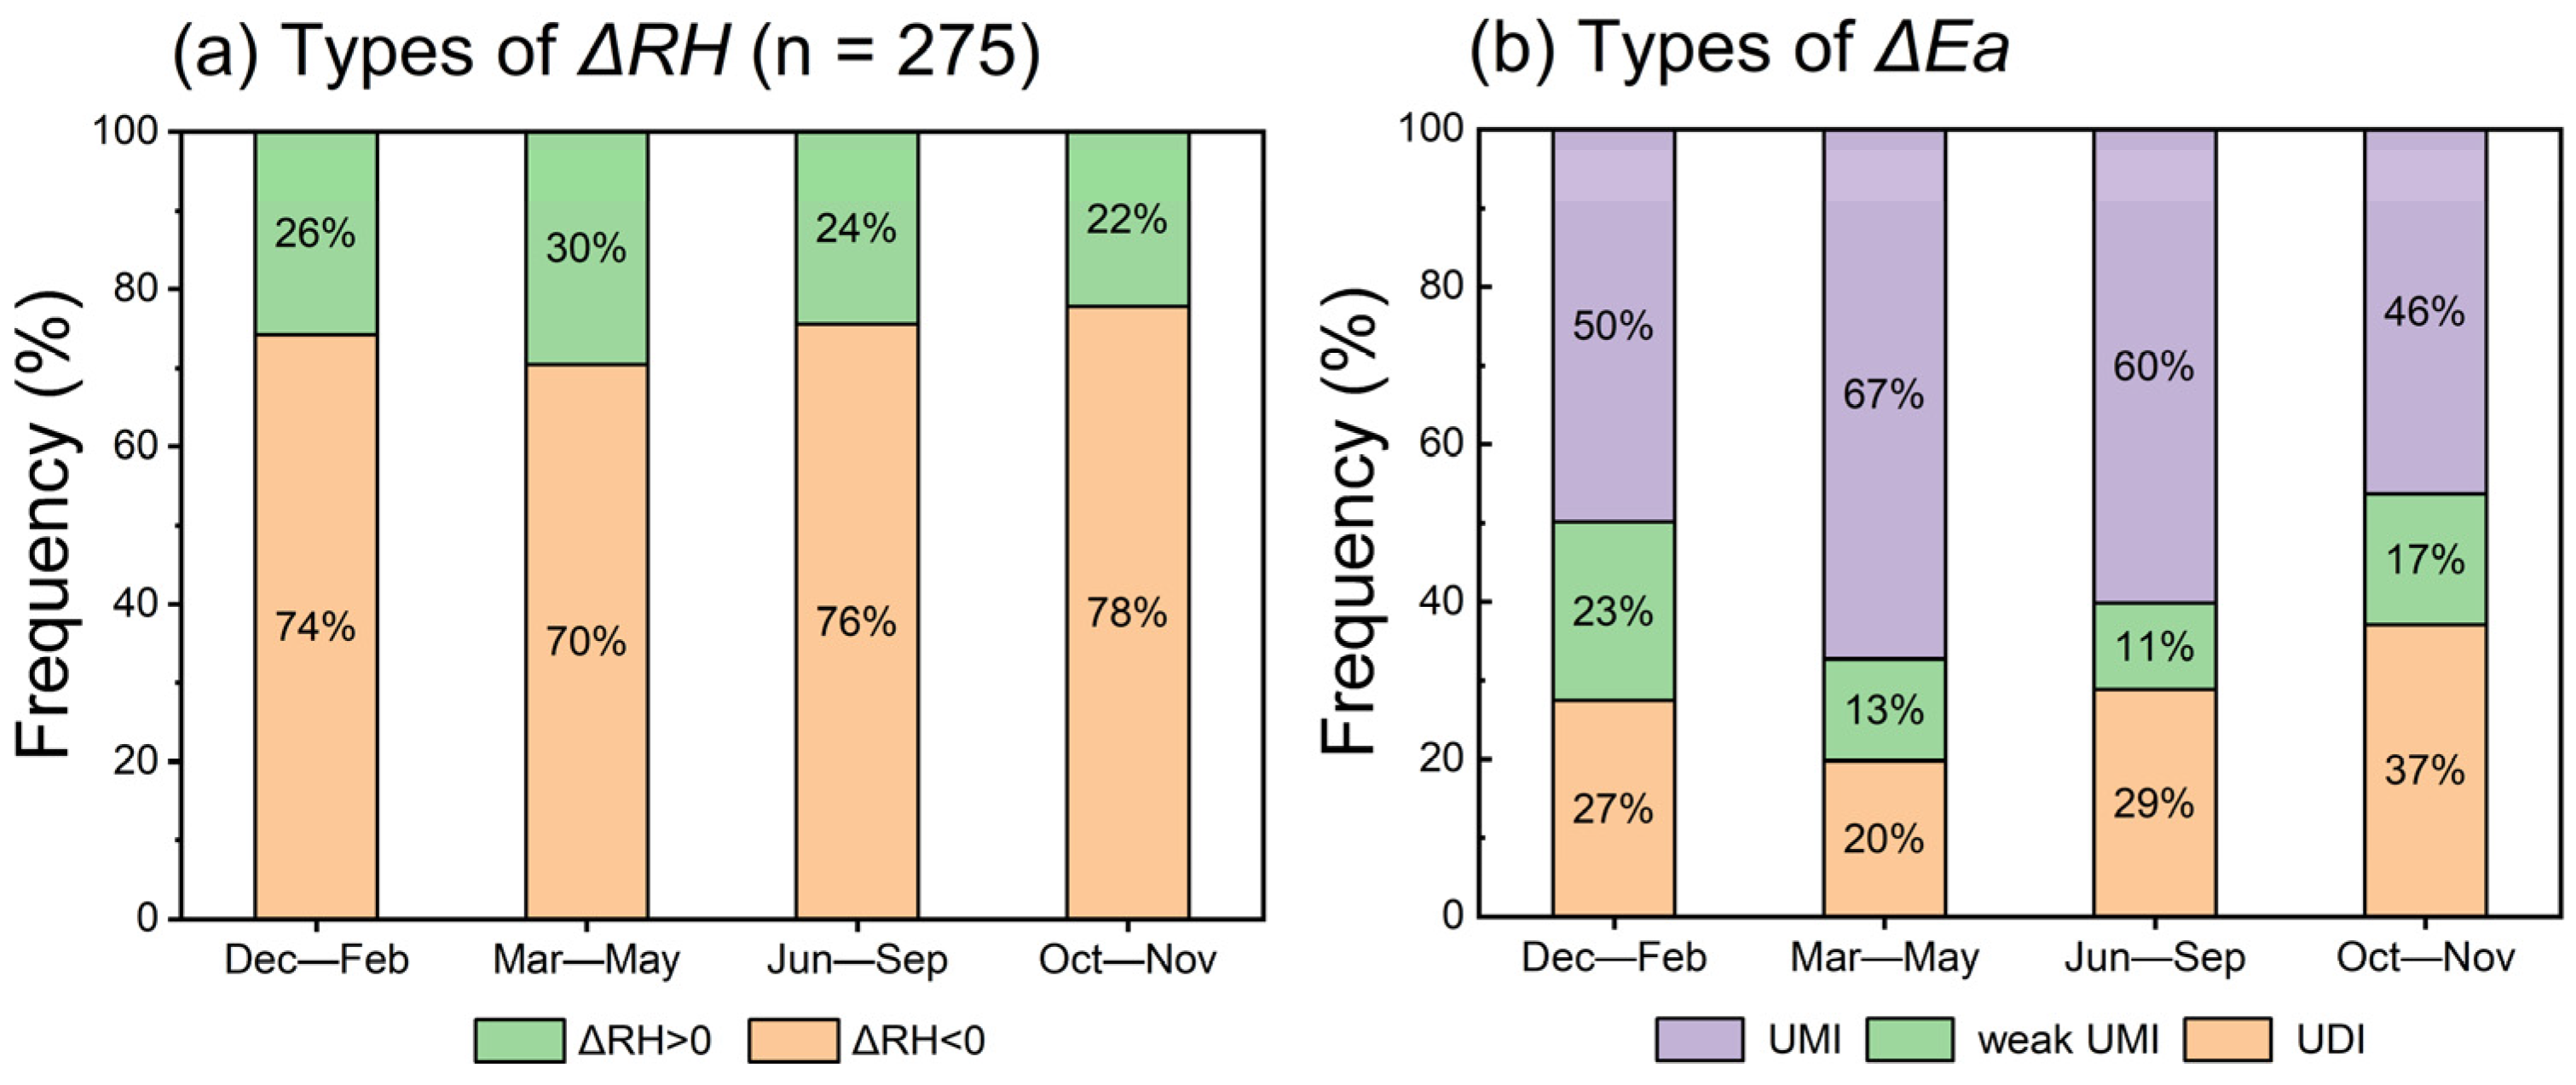
3.3. UMI Frequency
3.4. Influencing Factors of UMI
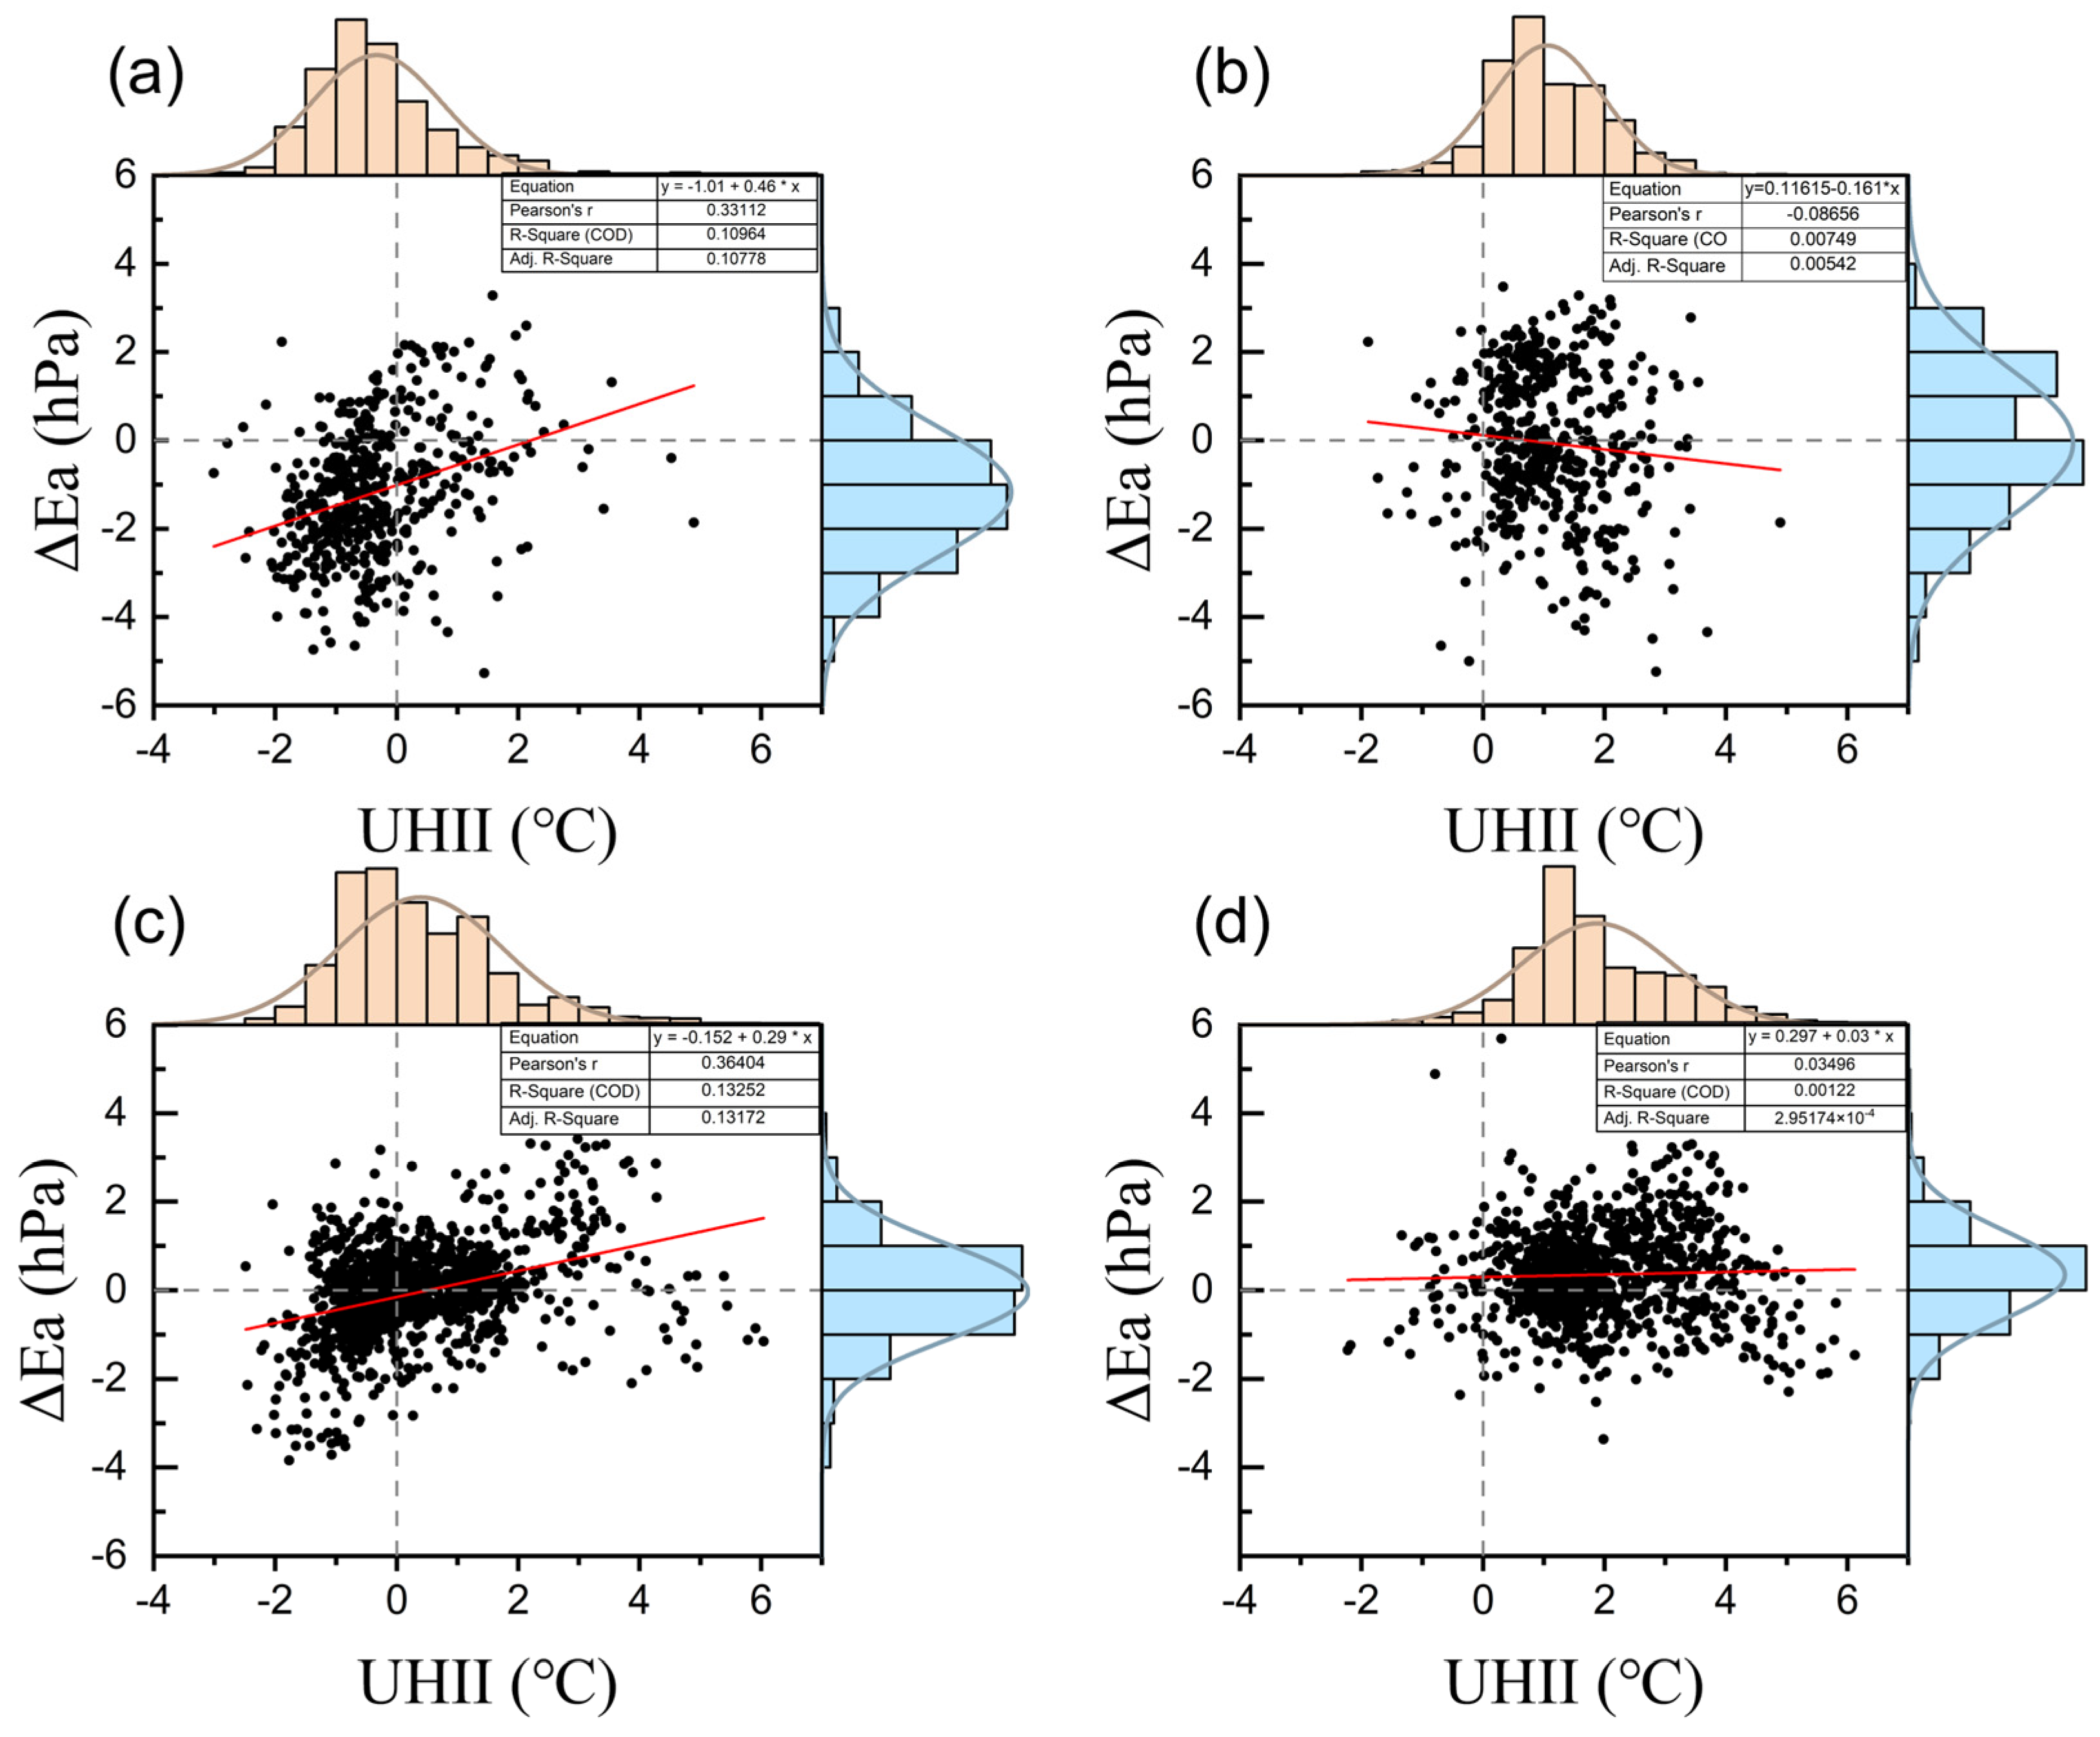
3.4.1. UHI
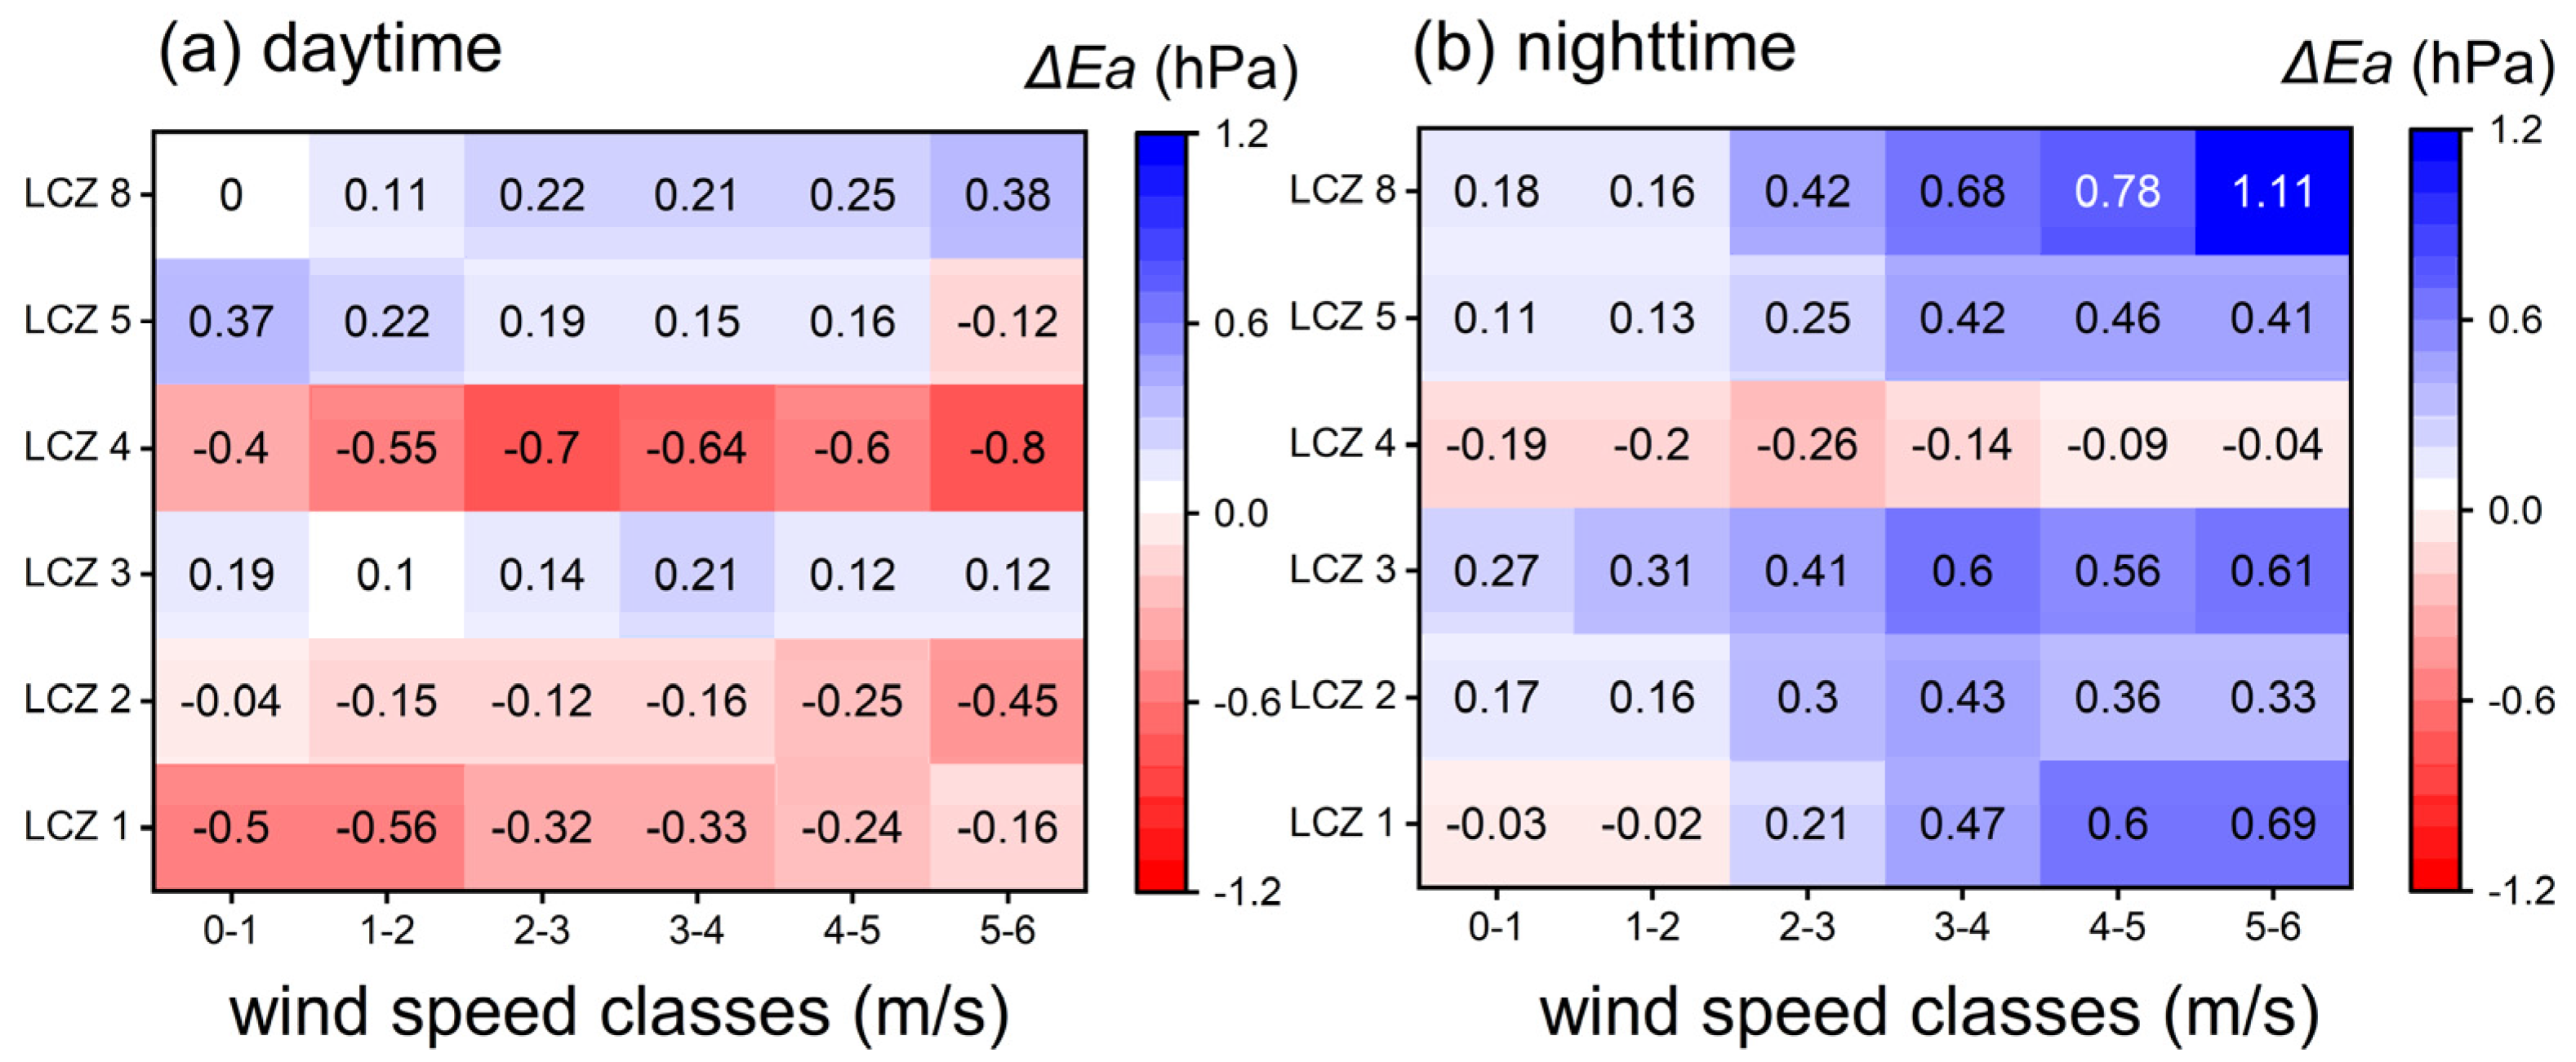
3.4.2. Wind Speed
4. Discussion
4.1. Reference Rural Site
4.2. Humidity-Based Indices
4.3. Humidity Characteristic

| Ref. | Location | Theme | Method |
|---|---|---|---|
| [12] | Turin | Temporal—spatial characteristics of UDIs and the impact of wind | Fixed measurement |
| [16] | Hong Kong | Mechanism of synergistic UHIs and UMIs | Numerical modeling |
| [18] | Novi Sad | Relationship between T and RH, AH, Ea, q, VPD, and the humidity characteristics under special weather conditions | Fixed measurement |
| [20] | Guangzhou | Characteristics and mechanisms of UMIs under different urban morphology and sky conditions | Fixed measurement |
| [34] | Hong Kong | Effects of urbanization (ventilation and land use) on humidity environments and temporal—spatial characteristics of UMIs | Numerical modeling |
| [44] | BTHUA | Long-term trend of atmospheric humidity and the urban expansion effect | Fixed measurement |
| [45] | Beijing | Evaluating the cooling and humidifying effects of urban vegetation coverage across different LCZs | Fixed measurement |
| [46] | China | Impact of urbanization on the humidity environment and mechanisms of climate change that affect UDIs and UMIs | Fixed measurement |
| [47] | Beijing | Seasonal and spatial characteristics of UMIs and UDIs, and their causes | Numerical modeling |
| [48] | 15 cities | Differences in ΔT and Δq between the urban and rural sites (LCZ X − LCZ D) were analyzed on multiple time scales (diurnal, seasonal, and annual) | Fixed measurement |
| [49] | Barcelona | The impact of model resolution and urban land use information (LCZs) on humidity predictions | Numerical modeling |
5. Conclusions
Author Contributions
Funding
Data Availability Statement
Conflicts of Interest
References
- Qian, Y.; Chakraborty, T.C.; Li, J.; Li, D.; He, C.; Sarangi, C.; Chen, F.; Yang, X.; Leung, L.R. Urbanization Impact on Regional Climate and Extreme Weather: Current Understanding, Uncertainties, and Future Research Directions. Adv. Atmos. Sci. 2022, 39, 819–860. [Google Scholar] [CrossRef]
- Ren, Z.; Fu, Y.; Dong, Y.; Zhang, P.; He, X. Rapid urbanization and climate change significantly contribute to worsening urban human thermal comfort: A national 183-city, 26-year study in China. Urban CLim. 2022, 43, 101154. [Google Scholar] [CrossRef]
- Hou, H.; Liu, K.; Li, X.; Chen, S.; Wang, W.; Rong, K. Assessing the urban heat island variations and its influencing mechanism in metropolitan areas of Pearl River Delta, South China. Phys. Chem. Earth 2020, 120, 102953. [Google Scholar] [CrossRef]
- Luan, Q.; Cao, Q.; Huang, L.; Liu, Y.; Wang, F. Identification of the Urban Dry Islands Effect in Beijing: Evidence from Satellite and Ground Observations. Remote Sens. 2022, 14, 809. [Google Scholar] [CrossRef]
- Chen, L.; Frauenfeld, O.W. Impacts of urbanization on future climate in China. Clim. Dyn. 2016, 47, 345–357. [Google Scholar] [CrossRef]
- Tsoka, S.; Tsikaloudaki, A.; Theodosiou, T. Analyzing the ENVI-met microclimate model’s performance and assessing cool materials and urban vegetation applications—A review. Sustain. Cities Soc. 2018, 43, 55–76. [Google Scholar] [CrossRef]
- Berardi, U.; Jafarpur, P. Assessing the impact of climate change on building heating and cooling energy demand in Canada. Renew. Sustain. Energy Rev. 2020, 121, 109681. [Google Scholar] [CrossRef]
- Yang, J.; Jin, S.; Xiao, X.; Jin, C.; Xia, J.; Li, X.; Wang, S. Local climate zone ventilation and urban land surface temperatures: Towards a performance-based and wind-sensitive planning proposal in megacities. Sustain. Cities Soc. 2019, 47, 101487. [Google Scholar] [CrossRef]
- Stewart, I.D.; Oke, T.R. Local Climate Zones for Urban Temperature Studies. Bull. Am. Meteorol. Soc. 2012, 93, 1879–1900. [Google Scholar] [CrossRef]
- Yang, P.; Ren, G.Y.; Hou, W. Temporal-Spatial Patterns of Relative Humidity and the Urban Dryness Island Effect in Beijing City. J. Appl. Meteorol. Climatol. 2017, 56, 2221–2237. [Google Scholar] [CrossRef]
- Unger, J.; Skarbit, N.; Gál, T. Absolute moisture content in mid-latitude urban canopy layer: Part 2: Results from Szeged, Hungary. Acta Climatol. 2018, 51–52, 47–56. [Google Scholar] [CrossRef]
- Milelli, M.; Bassani, F.; Garbero, V.; Poggi, D.; von Hardenberg, J.; Ridolfi, L. Characterization of the Urban Heat and Dry Island effects in the Turin metropolitan area. Urban CLim. 2023, 47, 13. [Google Scholar] [CrossRef]
- Deosthali, V. Impact of rapid urban growth on heat and moisture islands in Pune City, India. Atmos. Environ. 2000, 34, 2745–2754. [Google Scholar] [CrossRef]
- Zhou, Y.; Wang, Z.H.; He, Y.Q.; Deng, S.H.; Leng, T.T. Features of Thermal and Humid Environments in Chenggong New District of Kunming. J. Environ. Prot. Ecol. 2020, 21, 390–404. [Google Scholar]
- Yoshida, A.; Yasuda, R.; Kinoshita, S. Mobile Observation of Air Temperature and Humidity Distributions under Summer Sea Breezes in the Central Area of Osaka City. Atmosphere 2020, 11, 1234. [Google Scholar] [CrossRef]
- Huang, X.J.; Song, J.Y.; Wang, C.H.; Chui, T.F.M.; Chan, P.W. The synergistic effect of urban heat and moisture islands in a compact high-rise city. Build. Environ. 2021, 205, 16. [Google Scholar] [CrossRef]
- Yang, X.S.; Peng, L.L.H.; Chen, Y.; Yao, L.Y.; Wang, Q.Q. Air humidity characteristics of local climate zones: A three-year observational study in Nanjing. Build. Environ. 2020, 171, 16. [Google Scholar] [CrossRef]
- Dunjic, J.; Milosevic, D.; Kojic, M.; Savic, S.; Luzanin, Z.; Secerov, I.; Arsenovic, D. Air Humidity Characteristics in “Local Climate Zones” of Novi Sad (Serbia) Based on Long-Term Data. ISPRS Int. J. Geo-Inf. 2021, 10, 810. [Google Scholar] [CrossRef]
- Du, R.Q.; Song, J.Y.; Huang, X.J.; Wang, Q.; Zhang, C.; Brousse, O.; Chen, P.W. High-resolution regional modeling of urban moisture island: Mechanisms and implications on thermal comfort. Build. Environ. 2022, 207, 11. [Google Scholar] [CrossRef]
- Shi, Y.; Zhang, Y. Urban morphological indicators of urban heat and moisture islands under various sky conditions in a humid subtropical region. Build. Environ. 2022, 214, 108906. [Google Scholar] [CrossRef]
- Xiang, X.; Zhai, Z.; Fan, C.; Ding, Y.; Ye, L.; Li, J. Modelling future land use land cover changes and their impacts on urban heat island intensity in Guangzhou, China. J. Environ. Manag. 2024, 366, 121787. [Google Scholar] [CrossRef]
- Luo, F.; Yang, Y.; Zong, L.; Bi, X. The interactions between urban heat island and heat waves amplify urban warming in Guangzhou, China: Roles of urban ventilation and local climate zones. Front. Environ. Sci. 2023, 11, 1084473. [Google Scholar] [CrossRef]
- Shi, Y.R.; Xiang, Y.R.; Zhang, Y.F. Urban Design Factors Influencing Surface Urban Heat Island in the High-Density City of Guangzhou Based on the Local Climate Zone. Sensors 2019, 19, 20. [Google Scholar] [CrossRef] [PubMed]
- Oke, T.R.; Mills, G.; Christen, A.; Voogt, J.A. Urban Climates||Atmospheric Moisture; Cambridge University Press: Cambridge, UK, 2017; pp. 254–269. [Google Scholar] [CrossRef]
- Cai, M.; Ren, C.; Xu, Y.; Dai, W.; Wang, X.M. Local Climate Zone Study for Sustainable Megacities Development by Using Improved WUDAPT Methodology—A Case Study in Guangzhou. Procedia Environ. Sci. 2016, 36, 82–89. [Google Scholar] [CrossRef]
- Yang, X.S.; Yao, L.Y.; Jin, T.; Peng, L.L.H.; Jiang, Z.D.; Hu, Z.Y.; Ye, Y.H. Assessing the thermal behavior of different local climate zones in the Nanjing metropolis, China. Build. Environ. 2018, 137, 171–184. [Google Scholar] [CrossRef]
- Chen, G.; He, M.J.; Li, N.; He, H.; Cai, Y.N.; Zheng, S.L. A Method for Selecting the Typical Days with Full Urban Heat Island Development in Hot and Humid Area, Case Study in Guangzhou, China. Sustainability 2021, 13, 320. [Google Scholar] [CrossRef]
- Oke, T.R. Boundary Layer Climates. Earth Sci. Rev. 1987, 27, 265. [Google Scholar]
- Bolton, D. The Computation of Equivalent Potential Temperature. Mon. Weather. Rev. 1980, 108, 1046–1053. [Google Scholar] [CrossRef]
- Wexler, A. Vapor Pressure Formulation for Water in Range 0 to 100 °C. A Revision. J. Res. Natl. Bur. Standards. Sect. A Phys. Chem. 1976, 80A, 775–785. [Google Scholar] [CrossRef]
- Kuttler, W.; Weber, S.; Schonnefeld, J.; Hesselschwerdt, A. Urban/rural atmospheric water vapour pressure differences and urban moisture excess in Krefeld, Germany. Int. J. Climatol. 2007, 27, 2005–2015. [Google Scholar] [CrossRef]
- Mohajerani, A.; Bakaric, J.; Jeffrey-Bailey, T. The urban heat island effect, its causes, and mitigation, with reference to the thermal properties of asphalt concrete. J. Environ. Manag. 2017, 197, 522–538. [Google Scholar] [CrossRef]
- Zhao, Z.Q.; He, B.J.; Li, L.G.; Wang, H.B.; Darko, A. Profile and concentric zonal analysis of relationships between land use/land cover and land surface temperature: Case study of Shenyang, China. Energy Build. 2017, 155, 282–295. [Google Scholar] [CrossRef]
- Wang, Z.X.; Song, J.Y.; Chan, P.W.; Li, Y.G. The urban moisture island phenomenon and its mechanisms in a high-rise high-density city. Int. J. Climatol. 2021, 41, E150–E170. [Google Scholar] [CrossRef]
- Stewart, I.; Oke, T. Thermal Differentiation of Local Climate Zones Using Temperature Observations from Urban and Rural Field Sites; University of British Columbia: Vancouver, BC, Canada, 2010. [Google Scholar]
- Siu, L.W.; Hart, M.A. Quantifying urban heat island intensity in Hong Kong SAR, China. Environ. Monit. Assess. 2013, 185, 4383–4398. [Google Scholar] [CrossRef]
- Fisher, J.B.; Malhi, Y.; Bonal, D.; Da Rocha, H.R.; De Araujo, A.C.; Gamo, M.; Goulden, M.L.; Hirano, T.; Huete, A.R.; Kondo, H.; et al. The land-atmosphere water flux in the tropics. Glob. Change Biol. 2009, 15, 2694–2714. [Google Scholar] [CrossRef]
- Richards, K. Urban and rural dewfall, surface moisture, and associated canopy-level air temperature and humidity measurements for Vancouver, Canada. Bound. Layer Meteorol. 2005, 114, 143–163. [Google Scholar] [CrossRef]
- Wang, Y.; Li, Y.; Chan, P.W. The Impact of Urbanization on Moisture Excess in Hong Kong. Energy Procedia 2015, 78, 3061–3065. [Google Scholar] [CrossRef]
- Aljoumani, B.; Sanchez-Espigares, J.A.; Kluge, B.; Wessolek, G.; Kleinschmit, B. Analyzing Temporal Trends of Urban Evaporation Using Generalized Additive Models. Land 2022, 11, 508. [Google Scholar] [CrossRef]
- Jim, C.Y.; Peng, L.L.H. Weather effect on thermal and energy performance of an extensive tropical green roof. Urban For. Urban Green. 2012, 11, 73–85. [Google Scholar] [CrossRef]
- Hao, L.; Huang, X.L.; Qin, M.S.; Liu, Y.Q.; Li, W.H.; Sun, G. Ecohydrological Processes Explain Urban Dry Island Effects in a Wet Region, Southern China. Water Resour. Res. 2018, 54, 6757–6771. [Google Scholar] [CrossRef]
- Luo, M.; Lau, N.-C. Urban Expansion and Drying Climate in an Urban Agglomeration of East China. Geophys. Res. Lett. 2019, 46, 6868–6877. [Google Scholar] [CrossRef]
- Li, X.; Fan, W.; Wang, L.; Luo, M.; Yao, R.; Wang, S.; Wang, L. Effect of urban expansion on atmospheric humidity in Beijing-Tianjin-Hebei urban agglomeration. Sci. Total Environ. 2021, 759, 144305. [Google Scholar] [CrossRef]
- Li, Y.; Fan, S.; Li, K.; Ke, K.; Dong, L. Contributions of urban green and blue spaces on local-scale climate in the core area of Beijing, China. Urban Ecosyst. 2023, 26, 1639–1650. [Google Scholar] [CrossRef]
- Luo, Z.R.; Liu, J.H.; Zhang, Y.X.; Zhou, J.J.; Yu, Y.D.; Jia, R.T. Spatiotemporal characteristics of urban dry/wet islands in China following rapid urbanization. J. Hydrol. 2021, 601, 7. [Google Scholar] [CrossRef]
- Luo, Z.R.; Liu, J.H.; Zhang, Y.X.; Zhou, J.J.; Shao, W.W.; Yu, Y.D.; Jia, R.T. Seasonal variation of dry and wet islands in Beijing considering urban artificial water dissipation. NPJ Clim. Atmos. Sci. 2021, 4, 9. [Google Scholar] [CrossRef]
- Yang, X.; Xu, S.; Peng, L.L.H.; Chen, Y.; Yao, L. General air temperature and humidity features of local climate zones: A multi-city observational study in eastern China. Urban Clim. 2023, 51, 101652. [Google Scholar] [CrossRef]
- Ribeiro, I.; Martilli, A.; Falls, M.; Zonato, A.; Villalba, G. Highly resolved WRF-BEP/BEM simulations over Barcelona urban area with LCZ. Atmos. Res. 2021, 248, 105220. [Google Scholar] [CrossRef]


| LCZ Type | Urban Morphological Indicator and Their Range of LCZ Categories | ||||
|---|---|---|---|---|---|
| H/W | SVF | BSF (%) | ISF (%) | HRE (m) | |
| 1 Compact high-rise | 2.24 (>2) | 0.48 (0.2–0.4) | 30.55 (40–60) | 49.28 (40–60) | 35 (>25) |
| 2 Compact mid-rise | 1.06 (0.75–2) | 0.526 (0.3–0.6) | 42.70 (40–70) | 54.69 (30–50) | 19 (10–25) |
| 3 Compact low-rise | 0.84 (0.75–1.5) | 0.57 (0.2–0.6) | 44.86 (40–70) | 51.61 (20–50) | 11 (3–10) |
| 4 Open high-rise | 1.13 (0.7–1.25) | 0.56 (0.5–0.7) | 26.14 (20–40) | 56.93 (30–40) | 28 (>25) |
| 5 Open mid-rise | 0.83 (0.3–0.75) | 0.51 (0.5–0.8) | 28.21 (20–40) | 55.27 (30–50) | 20 (10–25) |
| 8 Large low-rise | 0.18 (0.1–0.3) | 0.73 (>0.7) | 36.31 (30–50) | 35.60 (40–50) | 5 (3–10) |
| A Dense trees | 2 (>1) | - | 4.4 (<10) | 1 (<10) | 13 (3–30) |
| D Low plants | <0.1 (<0.1) | 0.9 (>0.9) | 4.8 (<10) | 2.7 (<10) | <1 (<1) |
| Jan | Feb | Mar | Apr | May | Jun | Jul | Aug | Sep | Oct | Nov | Dec | 3 y Total | |
|---|---|---|---|---|---|---|---|---|---|---|---|---|---|
| 2020 | 0 | 6 | 2 | 9 | 3 | 3 | 7 | 4 | 1 | 5 | 8 | 11 | 275 |
| 2021 | 20 | 16 | 13 | 11 | 5 | 5 | 3 | 3 | 9 | 6 | 16 | 14 | |
| 2022 | 11 | 0 | 10 | 11 | 5 | 2 | 10 | 8 | 19 | 13 | 1 | 5 |
| LCZ Type | ANOVA Results | ||||
|---|---|---|---|---|---|
| Source | Sum_sq | df | F | PR (>F) | |
| Daytime ΔRH | LCZ | 9.38774 × 10⁴ | 5.0 | 710.2 | 0.0 |
| Residual | 1.48106 × 10⁶ | 56,023.0 | - | - | |
| Nighttime ΔRH | LCZ | 1.07122 × 10⁵ | 5.0 | 810.6 | 0.0 |
| Residual | 1.05777 × 10⁶ | 40,020 | - | - | |
| Daytime ΔEa | LCZ | 626.441951 | 5.0 | 131.3 | 8.9519 × 10−139 |
| Residual | 53,471.38311 | 56,023 | - | - | |
| Nighttime ΔEa | LCZ | 785.23118 | 5.0 | 288.2 | 5.6970 × 10−304 |
| Residual | 21,809.35418 | 40,020 | - | - | |
Disclaimer/Publisher’s Note: The statements, opinions and data contained in all publications are solely those of the individual author(s) and contributor(s) and not of MDPI and/or the editor(s). MDPI and/or the editor(s) disclaim responsibility for any injury to people or property resulting from any ideas, methods, instructions or products referred to in the content. |
© 2024 by the authors. Licensee MDPI, Basel, Switzerland. This article is an open access article distributed under the terms and conditions of the Creative Commons Attribution (CC BY) license (https://creativecommons.org/licenses/by/4.0/).
Share and Cite
Tan, X.; Zhang, Q.; Chen, Y.; Wang, J.; Zhao, L.; Chen, G. Assessing the Air Humidity Characteristics of Local Climate Zones in Guangzhou, China. Buildings 2025, 15, 95. https://doi.org/10.3390/buildings15010095
Tan X, Zhang Q, Chen Y, Wang J, Zhao L, Chen G. Assessing the Air Humidity Characteristics of Local Climate Zones in Guangzhou, China. Buildings. 2025; 15(1):95. https://doi.org/10.3390/buildings15010095
Chicago/Turabian StyleTan, Xiao, Qi Zhang, Yiqi Chen, Junsong Wang, Lihua Zhao, and Guang Chen. 2025. "Assessing the Air Humidity Characteristics of Local Climate Zones in Guangzhou, China" Buildings 15, no. 1: 95. https://doi.org/10.3390/buildings15010095
APA StyleTan, X., Zhang, Q., Chen, Y., Wang, J., Zhao, L., & Chen, G. (2025). Assessing the Air Humidity Characteristics of Local Climate Zones in Guangzhou, China. Buildings, 15(1), 95. https://doi.org/10.3390/buildings15010095