Abstract
Reinforced concrete structures often require retrofitting due to damage caused by natural disasters such as earthquakes, floods, or hurricanes; deterioration from aging; or exposure to harsh environmental conditions. Retrofitting strategies may involve adding new structural elements like shear walls, dampers, or base isolators, as well as strengthening the existing components using methods such as reinforced concrete, steel, or fiber-reinforced polymer jacketing. Selecting the most appropriate retrofit method can be complex and is influenced by various factors, including initial cost, long-term maintenance, environmental impact, and overall sustainability. This study proposes utilizing an artificial neural network (ANN) to predict sustainable and cost-effective seismic retrofit solutions. By training the ANN with a comprehensive dataset that includes jacket thickness, material specifications, reinforcement details, and key sustainability indicators (economic and environmental factors), the model was able to recommend optimized retrofit designs. These designs include ideal values for jacket thickness, concrete strength, and the configuration of reinforcement bars, aiming to minimize both costs and environmental footprint. A major focus of this research was identifying the optimal number of neurons in the hidden layers of the ANN. While the number of input and output neurons is defined by the dataset, determining the right configuration for hidden layers is critical for performance. The study found that networks with one or two hidden layers provided more reliable and efficient results compared to more complex architectures, achieving a total regression value of 0.911. These findings demonstrate that a well-tuned ANN can serve as a powerful tool for designing sustainable seismic retrofit strategies, helping engineers make smarter decisions more quickly and efficiently.
1. Introduction
Optimizing sustainable seismic retrofit (SSR) involves selecting and proportioning the components of a retrofit strategy to create a blend with the desired properties. This process can be intricate, often involving trial and error, and frequently requires considerable time and effort [1,2]. Multiple methods are proposed and tested to optimize SSR to meet specific requirements for strength, functionality, durability, and cost-effectiveness [3,4]. If the results do not align with the criteria, adjustments are made to the strategies until the desired properties are achieved [5,6]. The objective of seismic retrofit is to enhance the building’s resilience against anticipated seismic forces depending on the seismic intensity of the region and other factors [7]. The basic parameters impacting the decision for retrofit selection include structural performance enhancement, installation cost, and the impact on the building’s inhabitants [8,9]. However, additional factors may be integrated to customize the retrofit characteristics based on specific needs or conditions. These can involve disruption of utilities, foundation intervention requirements, the need for skilled labor, work duration, architectural alterations, impact on available spacing, etc. [10]. Furthermore, the variety of SSR options is significant; thus, a standard technique may not apply if even a single property differs. This inconsistency necessitates the establishment of multiple criteria before a specific optimization technique can be adopted.
The optimization process is inherently complex, involving both standard and trial methods [11,12,13], such as multi-criteria decision-making processes [14,15,16]. This complexity necessitates the use of soft computing practices, such as artificial intelligence [17,18], but typically for only one input and output set [19,20]. Consequently, if an artificial neural network (ANN) is developed to handle various retrofit types, it may encounter missing data issues [19,20]. For instance, if a specific retrofit includes a property while another does not, the corresponding input value for the ANN will be absent in the second case. ANN modeling is a viable approach in this context, where the artificial neuron is a numerical representation of a genetic neuron capable of processing data [21,22]. When multiple neurons are interconnected, they form a network that typically consists of three layers: the input, hidden, and output layers. Several factors determine the number of neurons in each layer [23]. The input parameters govern the input layer, while the output layer corresponds to the targets to achieve the results. The number of hidden layers and their arrangement can be tuned to achieve the optimal structure.
The network’s architecture significantly influences training time and accuracy. While some literature discusses how network structure impacts performance, there is no definitive method for identifying the best structure [24,25]. Additionally, numerous studies on the effects of hyperparameter disparity have failed to propose solutions for datasets with missing parameters [26,27]. The most effective neural network architecture for a specific problem is typically determined through experimental trials. The network size greatly affects learning time, model complexity, and, most importantly, its ability to generalize effectively. Choosing the right size is crucial for optimizing performance. As the size increases, the computational demands also rise, making it more efficient to maintain a smaller network size whenever possible [28]. Achieving a decent estimate of a function is challenging and necessitates a search across various network architectures [29]. If the number of neurons in a network is insufficient compared to the problem complexity, it can lead to “underfitting.” Conversely, more neurons can lead to “overfitting,” negatively impacting the network’s performance. To determine the optimum architecture of a network, standard practices include using cross-validation and early stopping.
This paper evaluates numerous ANNs for optimizing SSR using a constructive network construction technique. This method starts with the least possible network and progressively increases the number of neurons and hidden layers to obtain the optimal. The network comprises three layers: the input, the hidden, and the output layers.
Although much of the published literature deals with optimizing energy retrofit strategies, few studies have addressed SSR optimization using artificial neural networks. For instance, in Shabbir et al. [30], an AI framework was introduced that utilized data-driven models to assess, design, and retrofit structures. This framework emphasized the main global traits of the model while also examining them locally to fine-tune the input constraints. It recommended essential adjustments to the inputs to attain the required structural performance. The methodology used interpretability techniques, including feature importance, feature interactions, Shapley Additive Explanations, Local Interpretable Model-agnostic Explanations (LIME), partial dependence plots (PDPs), and individual conditional expectations. These techniques were employed to identify and highlight the important features. Similarly, a seismic retrofit system was proposed by Gharagoz et al. [31] utilizing a machine learning procedure. The system consisted of several L-shaped steel plates with reduced sections arranged in parallel. The performance of the retrofit system was assessed through life-cycle assessment, seismic fragilities, and a resilience index. The developed design procedure has been shown to meet multiple design objectives effectively. Falcone et al. [32] proposed an ANN. They used it as a potential alternative to finite element analysis (FEA) to quickly and precisely evaluate the enhanced configurations in the existing reinforced concrete (RC) building typologies. The outcomes show that the ANN is an effective computational model for approximating FEA in the structural retrofits of RC buildings considering various structural configurations.
This work aims to create a neural network that optimizes SSR by determining the ideal configuration of neurons in the hidden layer. An optimal ANN capable of managing missing input data could predict SSR, ultimately saving time and money across the board.
2. Research Significance
Various ANN models have been established to approximate energy retrofits, with only a few studies exploring SSR to find an optimal structure. This study evaluates various network architectures to select the most suitable network size for optimizing SSR. Additionally, to improve the neural network training, the model is designed to accommodate the local retrofit approach, i.e., applied to structural members like beams, columns, or both. It utilizes a substantially larger database for training, consisting of attribute data with around 16,807 retrofit configurations being generated.
3. Experimental Investigations
An ANN model was developed using the PYTHON Keras library. Attributes were selected from the structural retrofit database because a specific property must be known for more than 70 percent of the samples. Seven properties were chosen as input parameters, and five output parameters were defined; details are provided in Table 1. The output parameters are provided in the database or calculated using the listed properties.

Table 1.
Details of input parameters used in ANN.
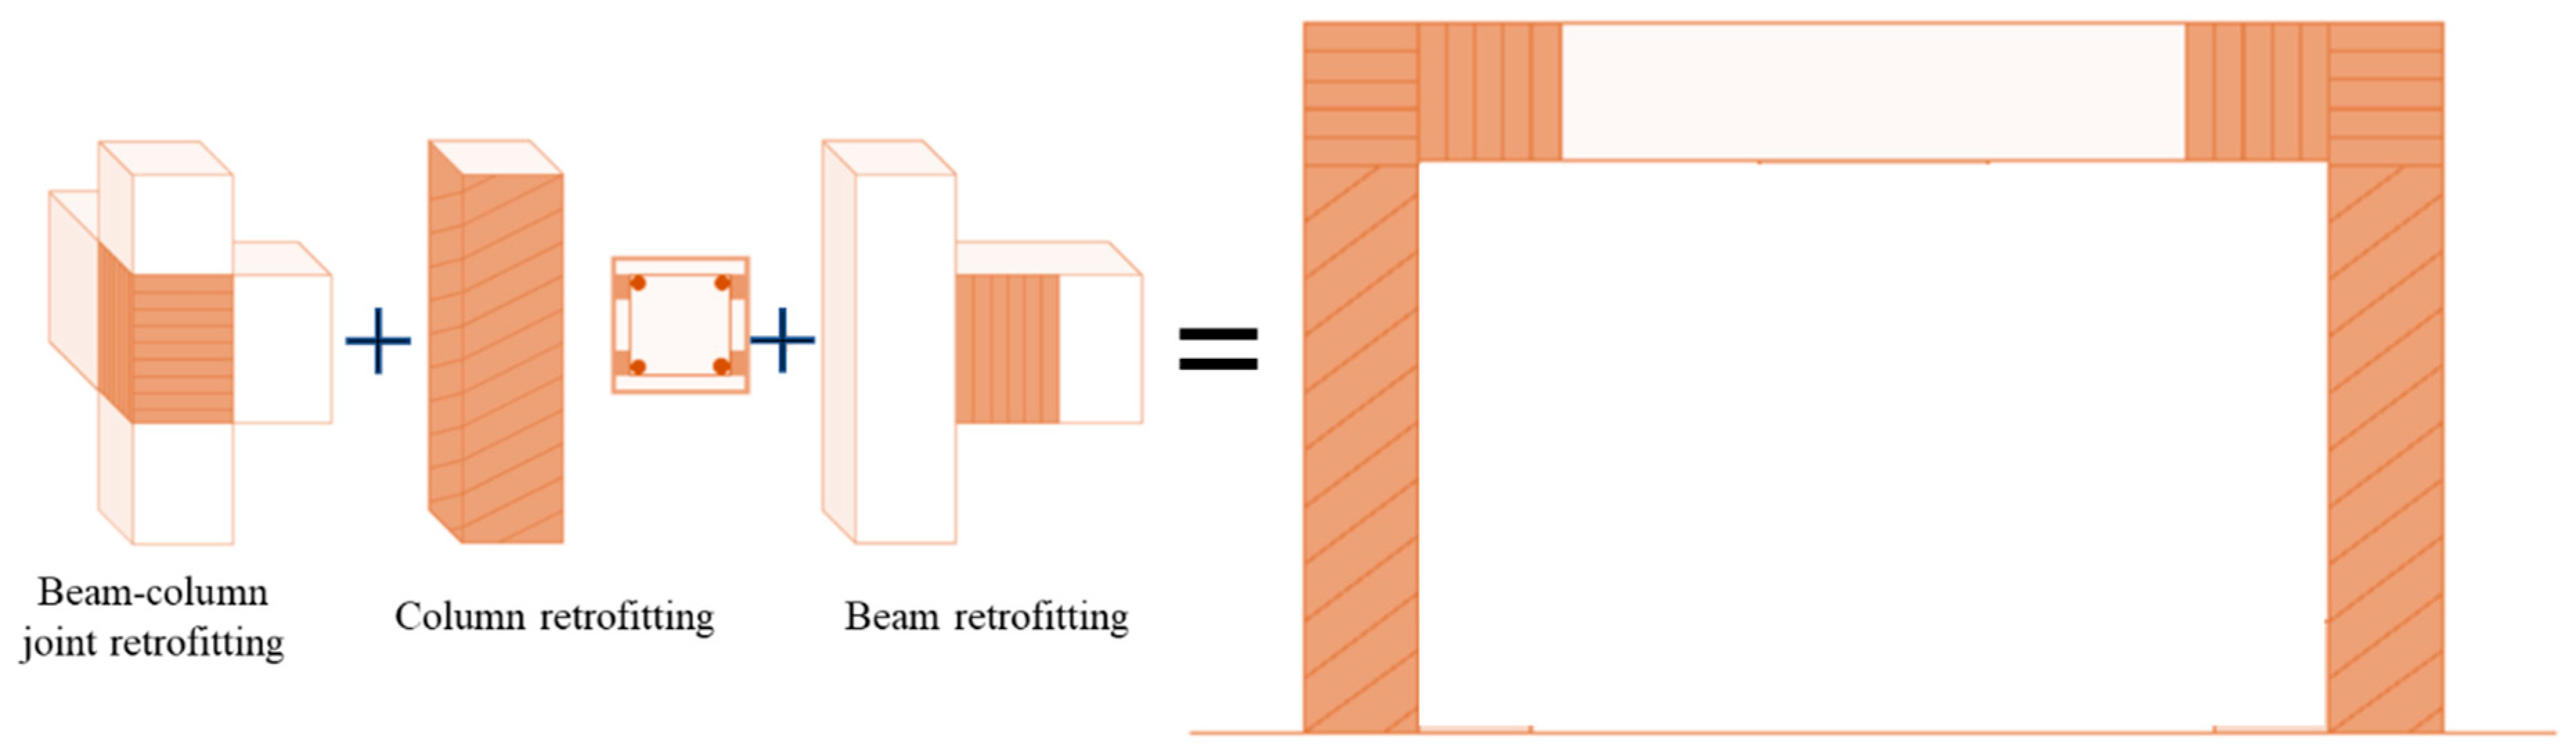
The type of retrofit studied in this work is a local retrofit strategy, i.e., building columns are assumed to be retrofitted using the reinforced concrete jacketing approach. To make the retrofit more effective and yield maximum results, the beam–column joint and 1/5th of the beam length were also retrofitted to transfer the loads effectively through the frame system (see Figure 1). An easy encoding rule was created to define the retrofit strategies to produce a colossal dataset of samples swiftly. Since all the columns were assumed to be of uniform cross-section, the application of RC jacketing was also uniform, hence leading to being described by only one configuration, i.e., square in this case, which is fairly appropriate to have the size of the input layer X possibly small. Each variable (Xi) described the most appropriate and easy-to-use option that various researchers have adopted in their studies. Among various alternatives, the five most important structural parameters of the seismic retrofit were selected, i.e., jacket thickness, the strength of concrete in the jacket, size and no. of longitudinal bars in the jacket, and spacing of transverse bars in the jacket. In addition to the structural parameters, two sustainability parameters were used in the input vector, i.e., retrofit cost and its environmental impact in terms of global warming potential (GWP), i.e., equivalent kg-CO2 emission. All the retrofit options’ cost and GWP values were normalized to the largest value and used as a range (0–1) for simplicity. All the details of input variables are presented in Table 1. A total of 7 inputs were selected, with five possible (and mainly used) values for each input, which resulted in a total of 75 combinations.
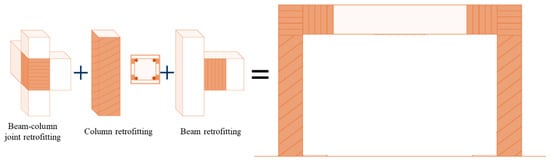
Figure 1.
Retrofitting method considered in this study.
Thus, a set of 16,807 retrofit arrangements was produced. Such arrangements varied in the topology, rebar distribution, and size of the RC jackets added to the columns of the 3D frame. Such details were utilized to adjust the model structure and the retrofitted ones, with an explicit section and topology. A “fiber section model” was used to distribute the plasticity of the cross-section and jacket [33,34,35]. The built-in model in ETABS [36] was used for the steel rebar’s elastic–plastic behavior, with the rebar’s modulus of elasticity being chosen to equal 210 GPa (29,000 ksi), and the yield stress, fy, being 276 MPa (40 ksi). The plasticity was allocated at the end section in the “plastic–hinge” zone (Lp), as shown in Figure 2 [32]. In the current work, Lp was taken at a distance of 0.1 of the member’s length from the support’s face. Thus, the seismic capacity of the original structure was first evaluated this way, and then retrofit actions were applied to determine the impact of various retrofit solutions on the seismic capacity enhancement of the structure. Various factors were used to compare the capacity enhancement, among which the base shear–roof displacement parameter served a fundamental position as a deciding factor for the seismic capacity enhancement of the structure. Nonlinear pushover analysis was used with the displacement-controlled environment since it provides the post-peak behavior of the structure till collapse. The loading protocol involved the application of lateral displacement at each floor level of the structure, and the base shear was calculated at each step. Since the maximum displacement was accounted for at the roof level, the roof displacement was plotted against the base shear to represent the capacity curve of the whole structure.
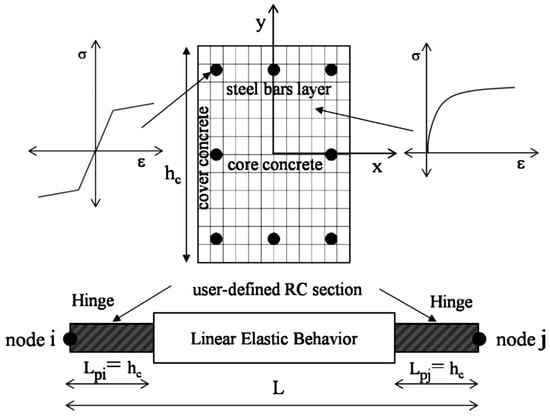
Figure 2.
The FEM model of RC columns and jackets.
3.1. The Neural Network Database
The database contains data for 16,807 samples (Supplementary Materials, source https://doi.org/10.1016/j.dib.2020.106477). Table 1 summarizes various properties of the input parameters. The choice of seismic retrofit strategies depends on different input parameters. Concrete strength is crucial: higher strength can improve load-carrying ability and may lessen the need for extensive retrofitting, whereas lower strength requires more rigorous intervention. Jacket thickness directly impacts confinement and strength gains: thicker jackets enhance performance, increase weight, and decrease usable space, necessitating careful consideration. The quantity and size of longitudinal bars influence structural capacity and ductility: a greater number or size increases strength but may also complicate construction and incur higher costs. Similarly, the arrangement of transverse bars affects confinement and shear resistance—closer spacing boosts performance but can lead to greater complexity and expenses. The cost of retrofitting is a significant consideration, as solutions must find a balance between safety enhancements and budgetary limits. Finally, the global warming potential (GWP) of materials and methods has become increasingly relevant, promoting the use of eco-friendly retrofit options that reduce carbon emissions while maintaining structural integrity. The database includes numerous attributes related to structural retrofit options. However, we selected 7 properties, with 5 serving as output parameters. The output parameters assumed were the optimized jacket thickness, concrete grade, No. and the size of the main bars, and spacing of transverse bars in the jacket. These 5 output parameters are essential because an optimized retrofit solution typically requires these metrics to evaluate the appeal of the retrofit. The selection of a diverse range of 7 input properties allows for various combinations, providing stakeholders with the flexibility to optimize their retrofit solutions effectively. One of the limitations of the current study is that it only addressed the retrofitting of reinforced concrete frame structures; however, the approach can be further developed, for example, in the context of historical constructions, which are abundant across Europe [37,38].
3.2. The ANN
An artificial neuron is a numerical model inspired by biotic neurons designed for data processing. Like a biological neuron, an artificial neuron processes input values multiplied by specific weights to represent the significance of each input on the output quantity. These normalized inputs are added together, and a transfer function, the sigmoid function, commonly used because of its numerical convenience, is then applied to produce the output. It is important to note that the input vector may not explicitly employ a transfer function. In contrast, the hidden and output layers use the “tangent sigmoid” function as their transfer function.
A group of interconnected neurons arranged in a specific architecture results in an ANN where data flows among the neurons. In this study, the network consisted of three layers, as discussed previously. We utilized a forecasting network that employed a back-propagation algorithm.
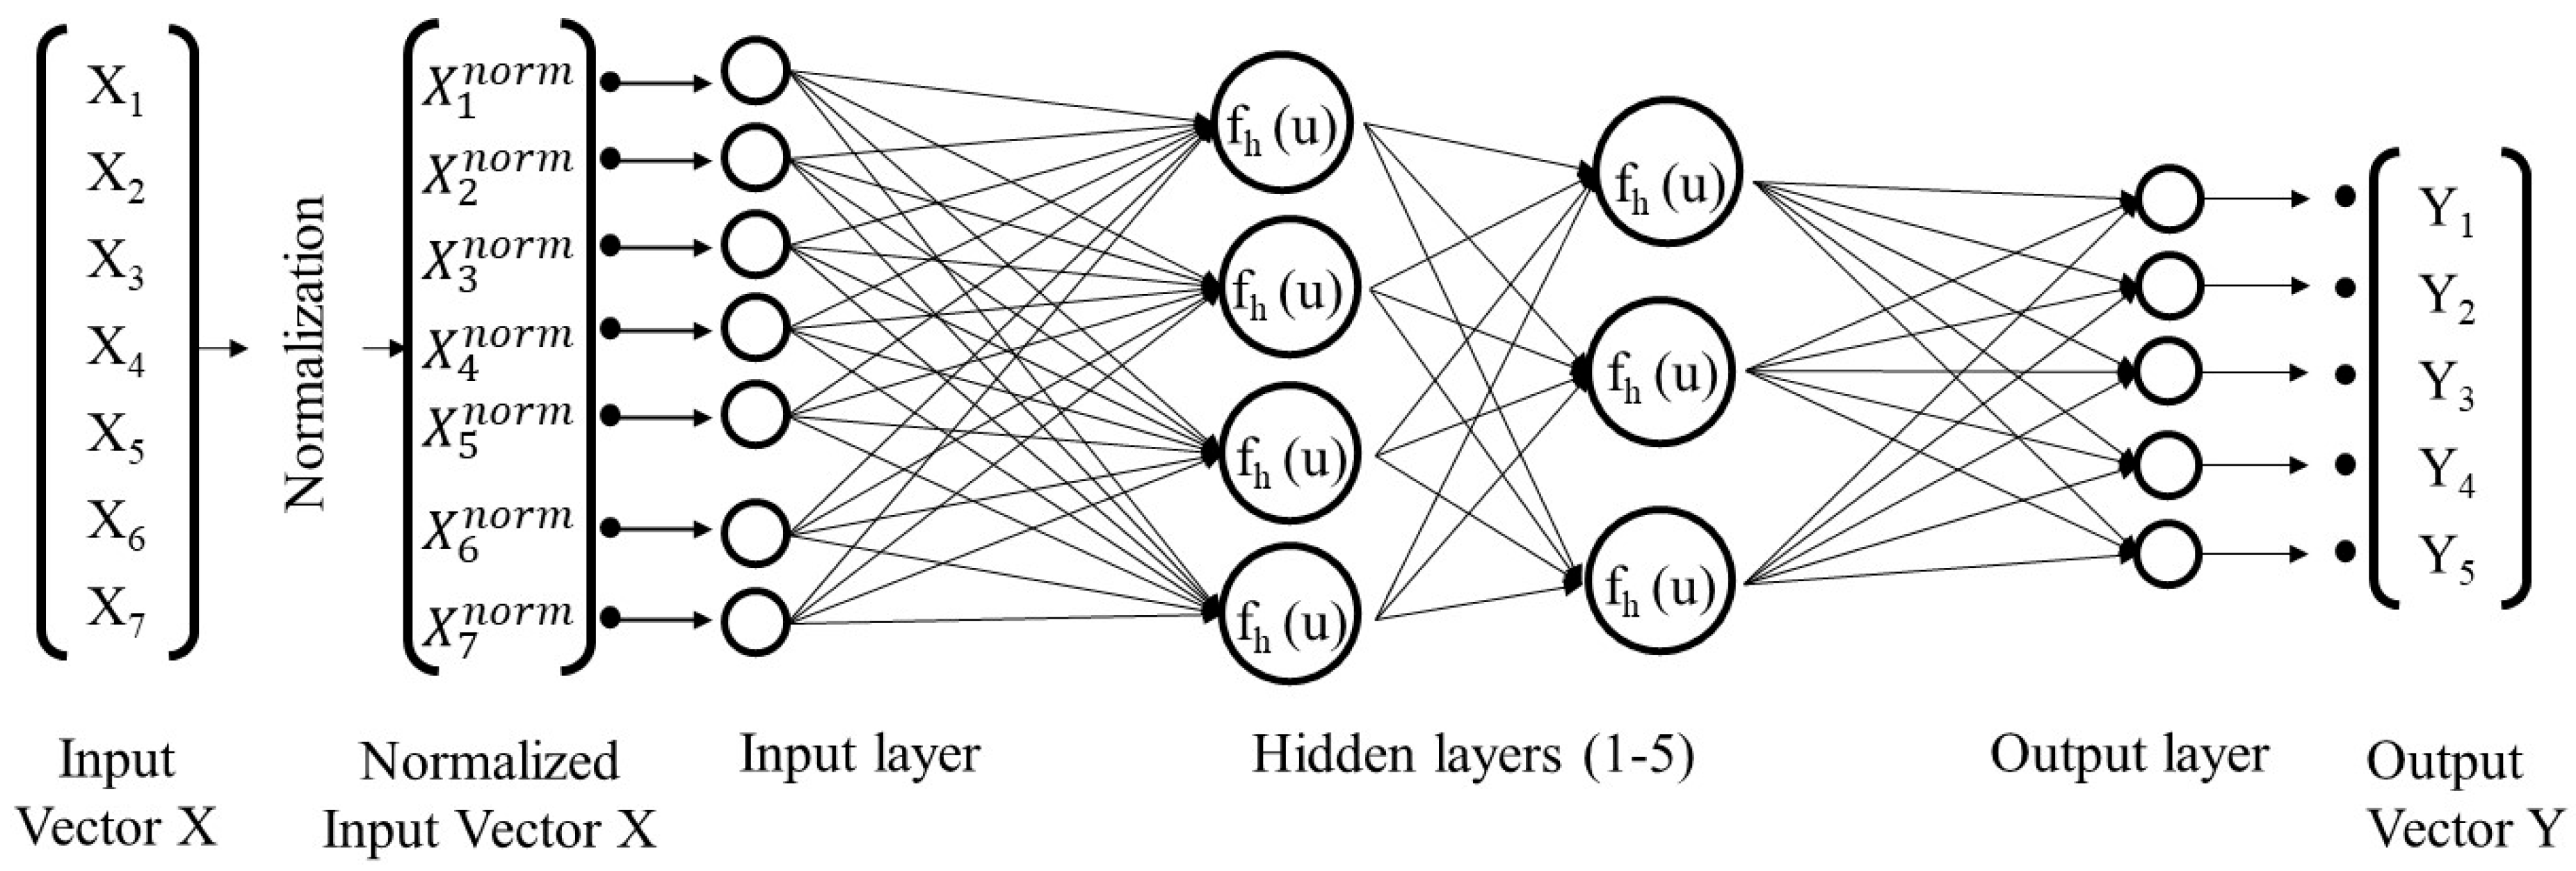
The sizes of the layers (input and output) are defined by their respective factors. The input layer comprises seven neurons, while the output layer includes five. The number of neurons in the hidden layer and the hidden layers quantity can be adjusted. This configuration begins with a solo hidden layer containing between 2 and 250 neurons and can be extended to include numerous hidden layers, each having a variable neuron configuration.
The ANN uses input–output samples to identify the fundamental behavior patterns based on these parameters. It calculates its target values to minimize the disparity between the networks and tangible outputs. This difference is measured using the mean squared error (MSE). The backpropagation process permits the network to transmit errors reverse through the layers during each iteration, allowing for the adjustment of the normalization associated with each neuron. This process persists until we attain the lowest possible MSE, ensuring optimal results.
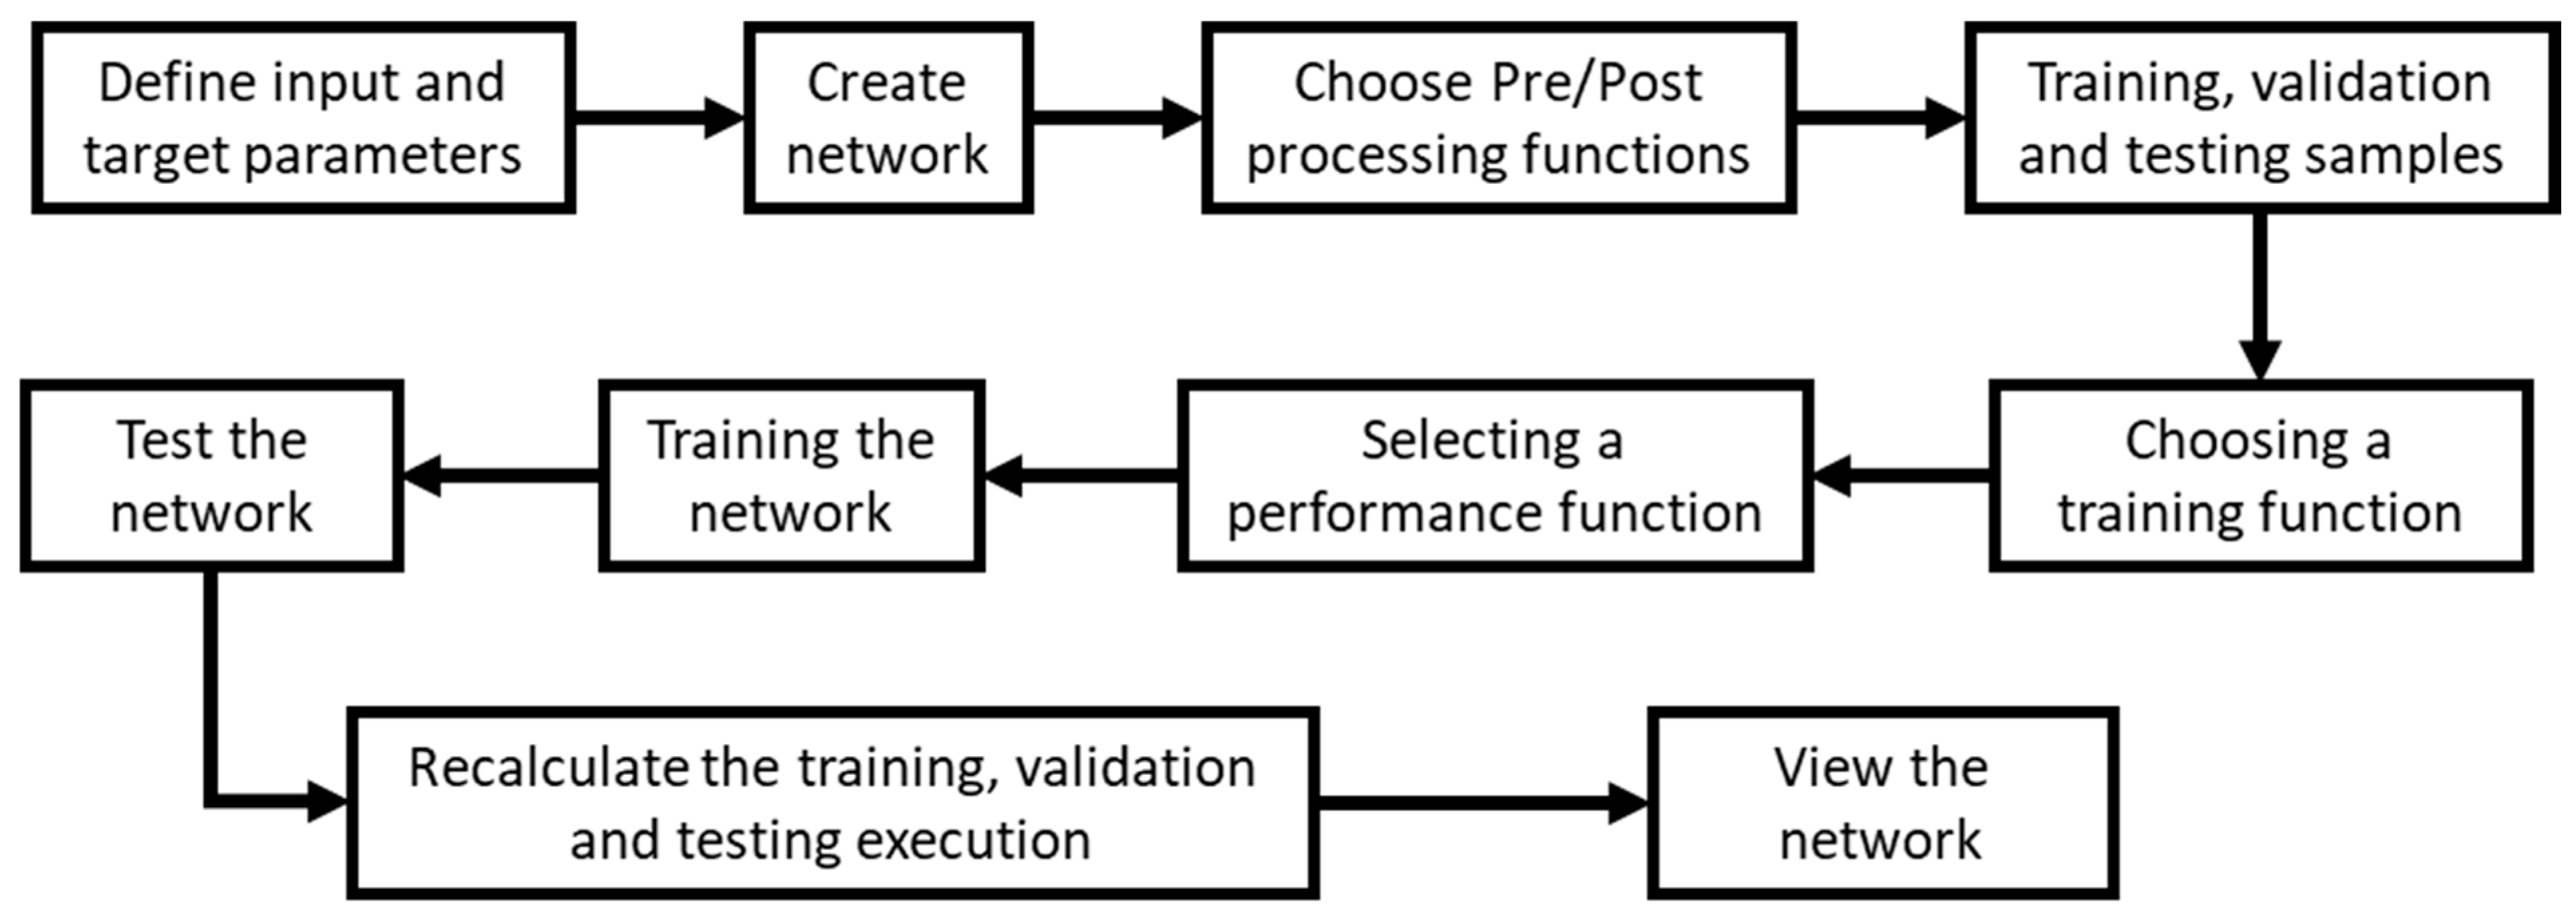
Figure 3 depicts the artificial neural network model designed for optimizing SSR. Before putting the data into the network, it undergoes preprocessing, which includes linear normalization and scaling. The processed input–output sample data is then fed into the network to estimate the target values based on the network’s calculations. To prepare the data, we used Python’s “train_test_split” function, which divided the data into three distinct categories: training, testing, and validation samples. This was achieved through libraries such as NumPy or scikit-learn. The flow diagram in Figure 4 outlines the key phases involved in developing the network. The training data facilitates the network’s ability to absorb the relationships between inputs and outputs, enabling it to generalize these underlying connections. The validation dataset is used for premature stopping, preventing it from becoming stuck in a relative minimum. Lastly, the testing dataset assesses how fine the network has adapted to new data.
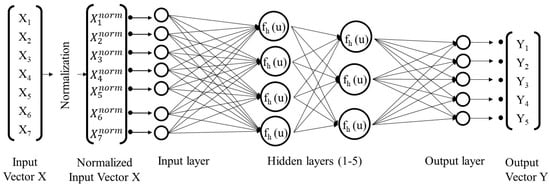
Figure 3.
ANN structure with the most effective results used in this research.

Figure 4.
Necessary stages for the improvement of ANN.
3.3. Investigation Items
Neuron quantity in the hidden layer was varied, starting with at least 2 neurons in the only layer and reaching 250. The hidden layers were also simulated from one to five, with distinctive neural configurations tested for every trial. We evaluated several constraints to evaluate the effectiveness of the network, including validation performance measured by MSE, the normal regression value, the number of iterations (epochs) needed to achieve the least error, and the training time relative to neuron configuration.
4. Analysis and Results
Raising the neuron quantity in a solo hidden layer consistently reduced the MSE across all the trials. However, adding more layers did not enhance the network’s performance (see Figure 5). The least MSE achieved was 0.00198, corresponding to a network with 65 neurons distributed across two hidden layers, consisting of 38 and 27, respectively. All the other network structures resulted in higher MSE values. The worst architecture yielded an MSE of 0.01599 and included 16 neurons spread across four layers configured as 6-5-3-2 neurons, respectively. It was found that changes to the hidden layer quantity and the assembly of neurons within those layers influenced the network’s performance. For instance, the MSE was 0.00306 for 10 neurons in one layer. This value increased to 0.01681 with a configuration of 5-4-1 neurons in three hidden layers before decreasing to 0.01013 with five hidden layers, each containing 2 neurons. The same trend is evident in Figure 5, where spikes indicate increases in MSE as the neurons rise to 40. This resulted in the least and most MSE of 0.00285 and 0.00532, respectively. Adding more layers did not yield efficient results till the layers were configured with 80 neurons, culminating in a least MSE of 0.00271 with a layout of 30-20-15-10-5 neurons across the layers. Networks beyond 100 neurons in the hidden layers were not evaluated for various arrangements due to stagnant execution and high computational resource demands.
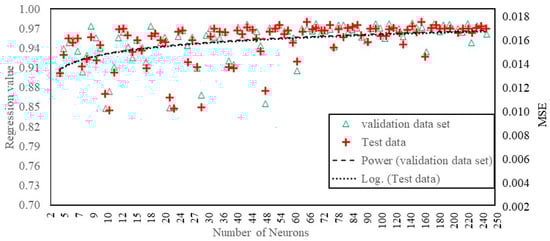
Figure 5.
Performance of the network considering MSE.
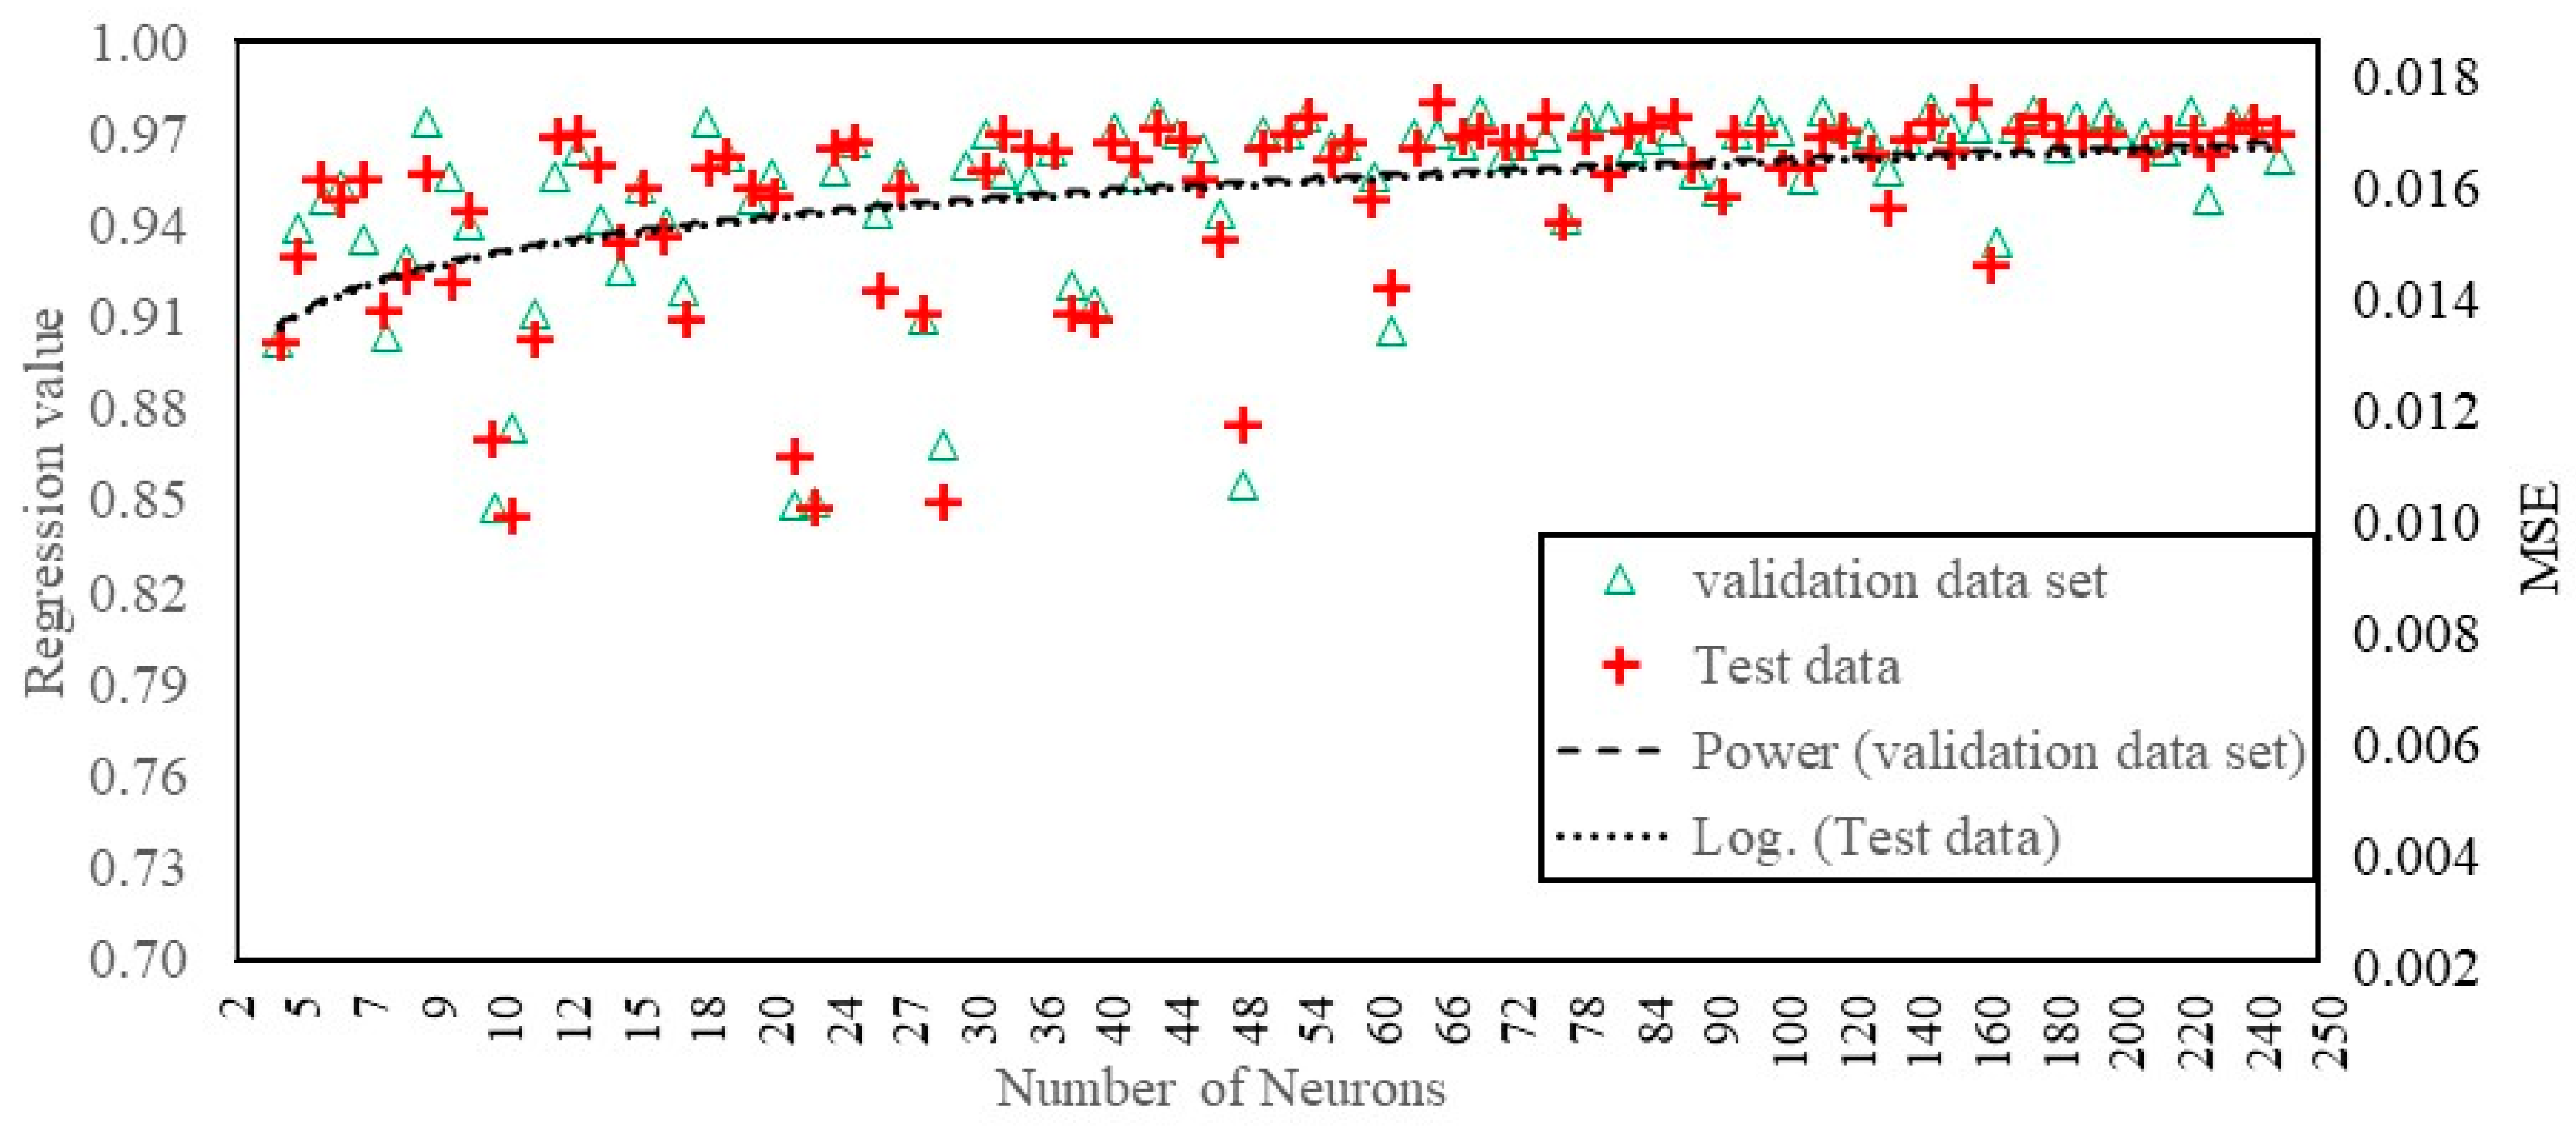
As the neuron quantity increases, the network becomes better at simplifying the original patterns in the input–output figures. To ensure adequate training examples, 80% of the data was assigned for training, 10% for validation, and 10% was reserved for testing afterward. The graph in Figure 6 illustrates the relationship between the normal regression values and neuron quantity in the network. As the regression value approached one, the network’s output closely matched the actual output. The best simplification was achieved with an average regression value of 0.991 using a configuration of 65 neurons arranged in a 38-27 pattern. In contrast, the worst generalization had a regression value of 0.839, corresponding to a configuration with 15 neurons arranged in a 5-4-3-2-1 pattern. Additionally, a decrease in the mean squared error (MSE) correlates with a higher regression value. Once the network reached 40 neurons or more, its mean regression value consistently exceeded 0.944.
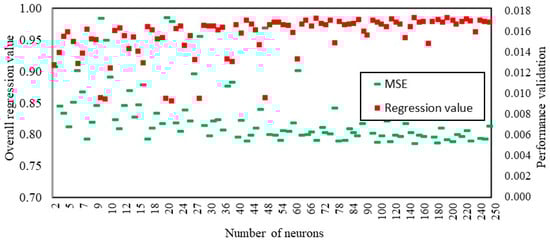
Figure 6.
Neuron quantity vs. regression value.
Training time (Tt) refers to the duration required for a network to process data and synchronize to a minimum mean squared error (MSE), effectively measuring how long it takes for the network to achieve optimal curve fitting. Figure 7 shows a minimal rise in Tt until the ANN attains a hidden layer size of 65 neurons. With 65 neurons in one layer, the Tt was 0.62 min. However, when the configuration was adjusted to 38-27 neurons, the Tt increased significantly to 5.45 min. Beyond 100 neurons, the training time rose dramatically, reaching a maximum of 51.7 min. This indicates that such large configurations are unsuitable for the current application, although they may not pose significant issues for more configurations.
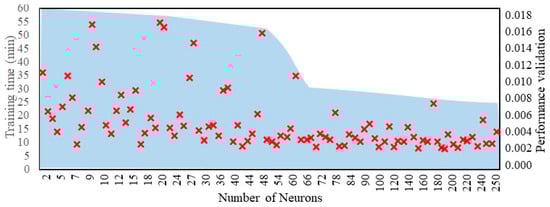
Figure 7.
Neuron quantity and training time.
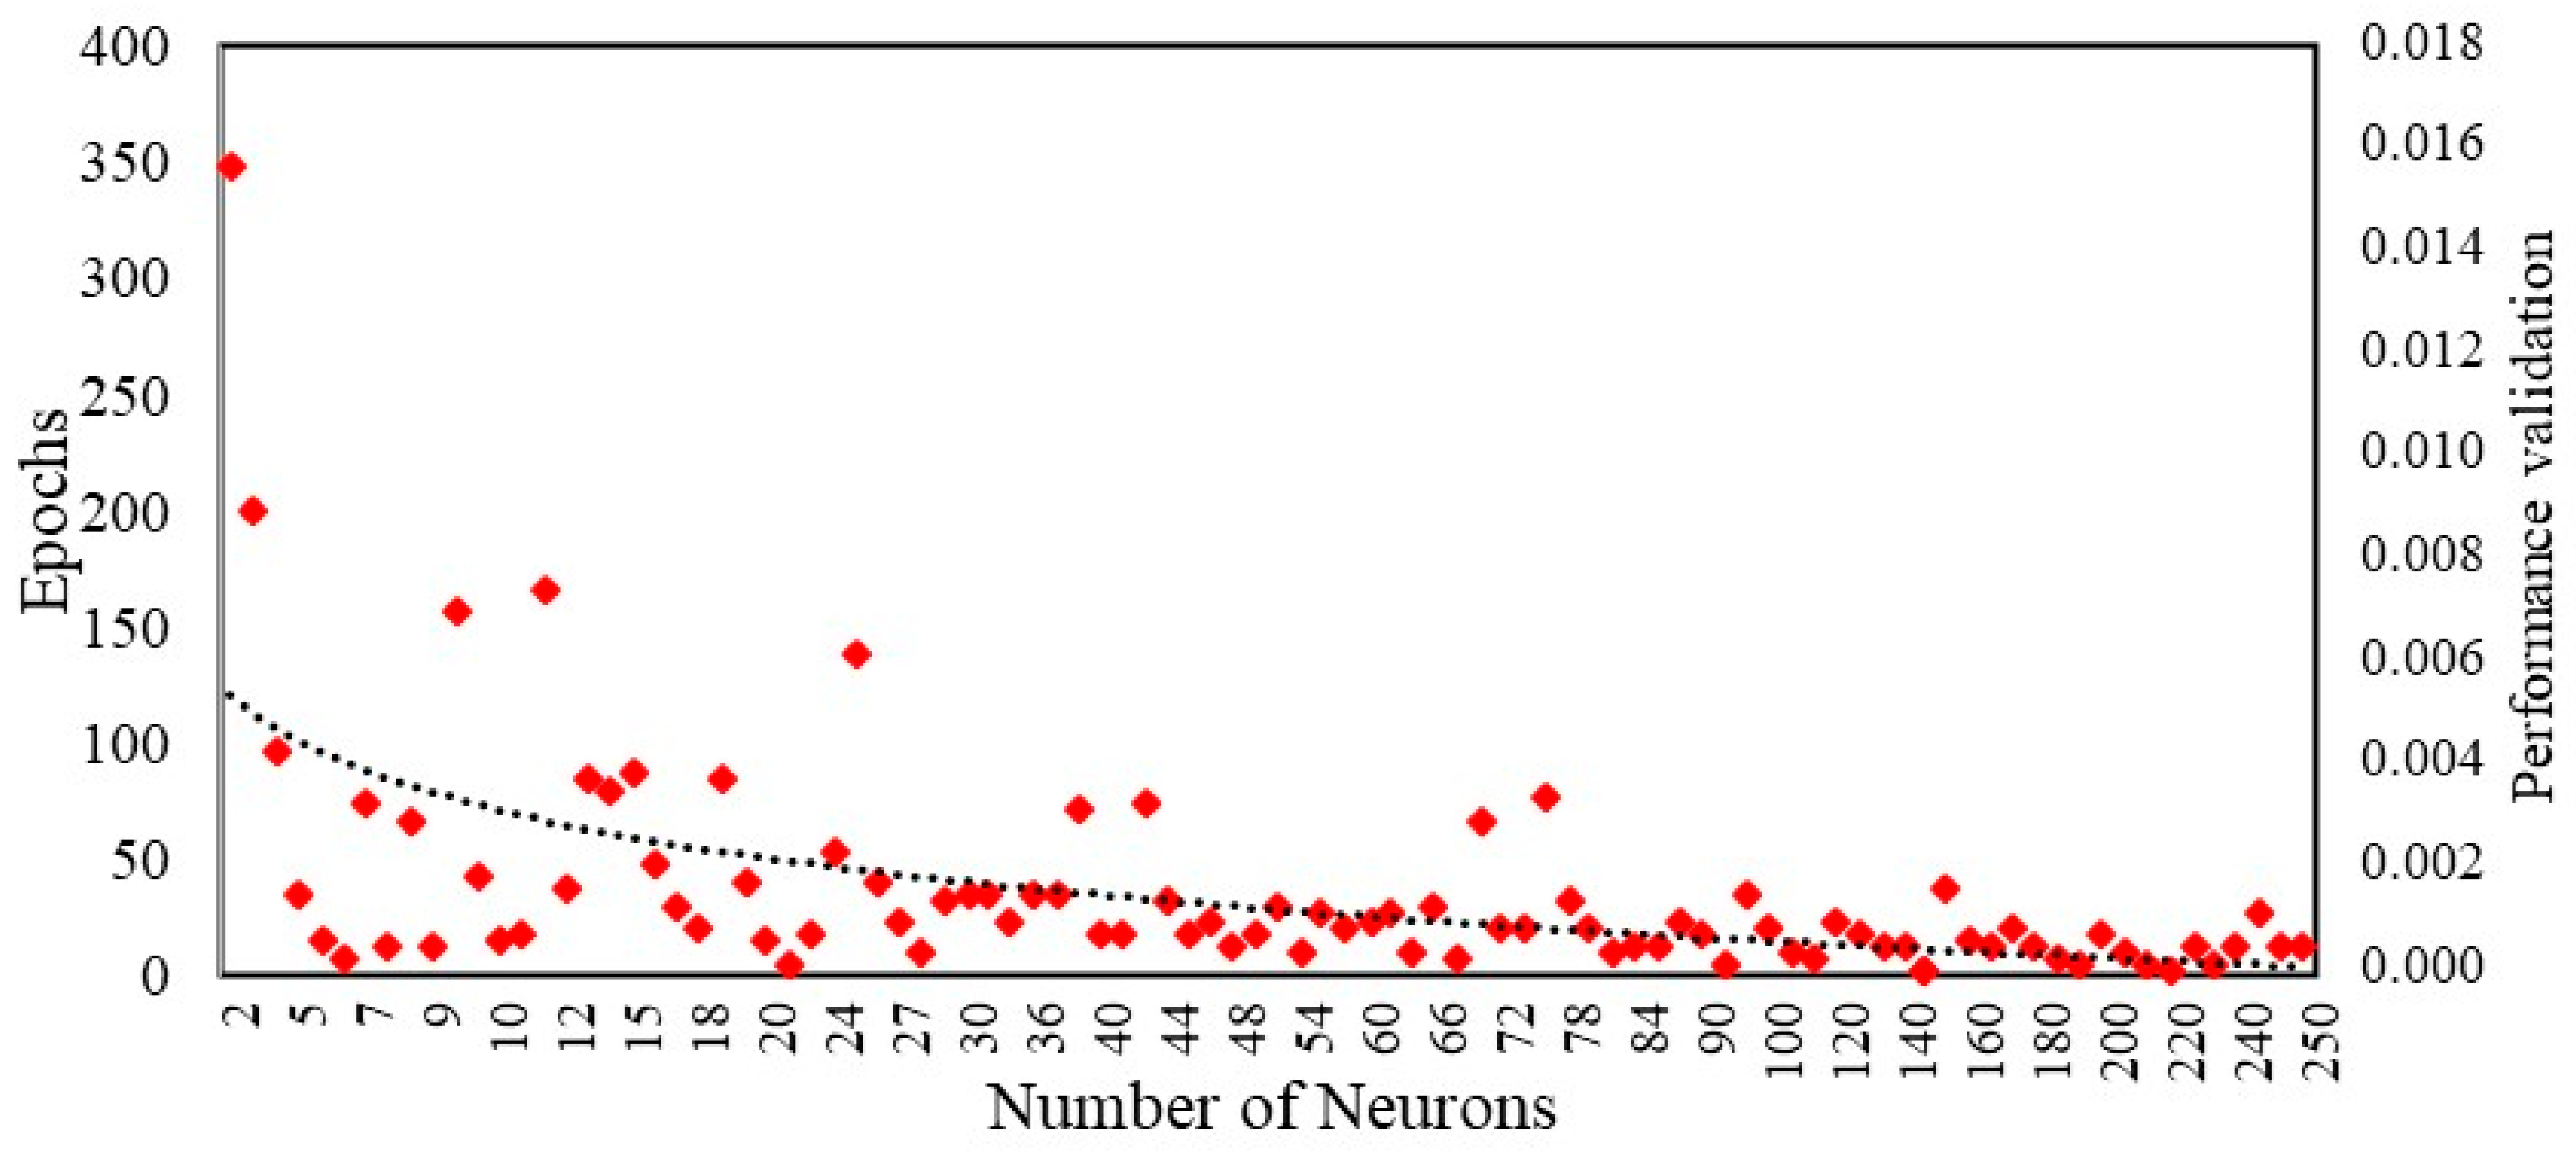
The network’s epoch values indicate the number of iterations required to achieve the minimum MSE. Figure 8 illustrates the relationship between the neurons and the epochs. The least number of epochs recorded was 10, while the maximum reached 349. The number of epochs varied till the neuron quantity reached 38. For networks with over 38 neurons in one layer, the iterations needed to reach the best fit consistently endured below 28.

Figure 8.
Number of neurons vs. epochs.
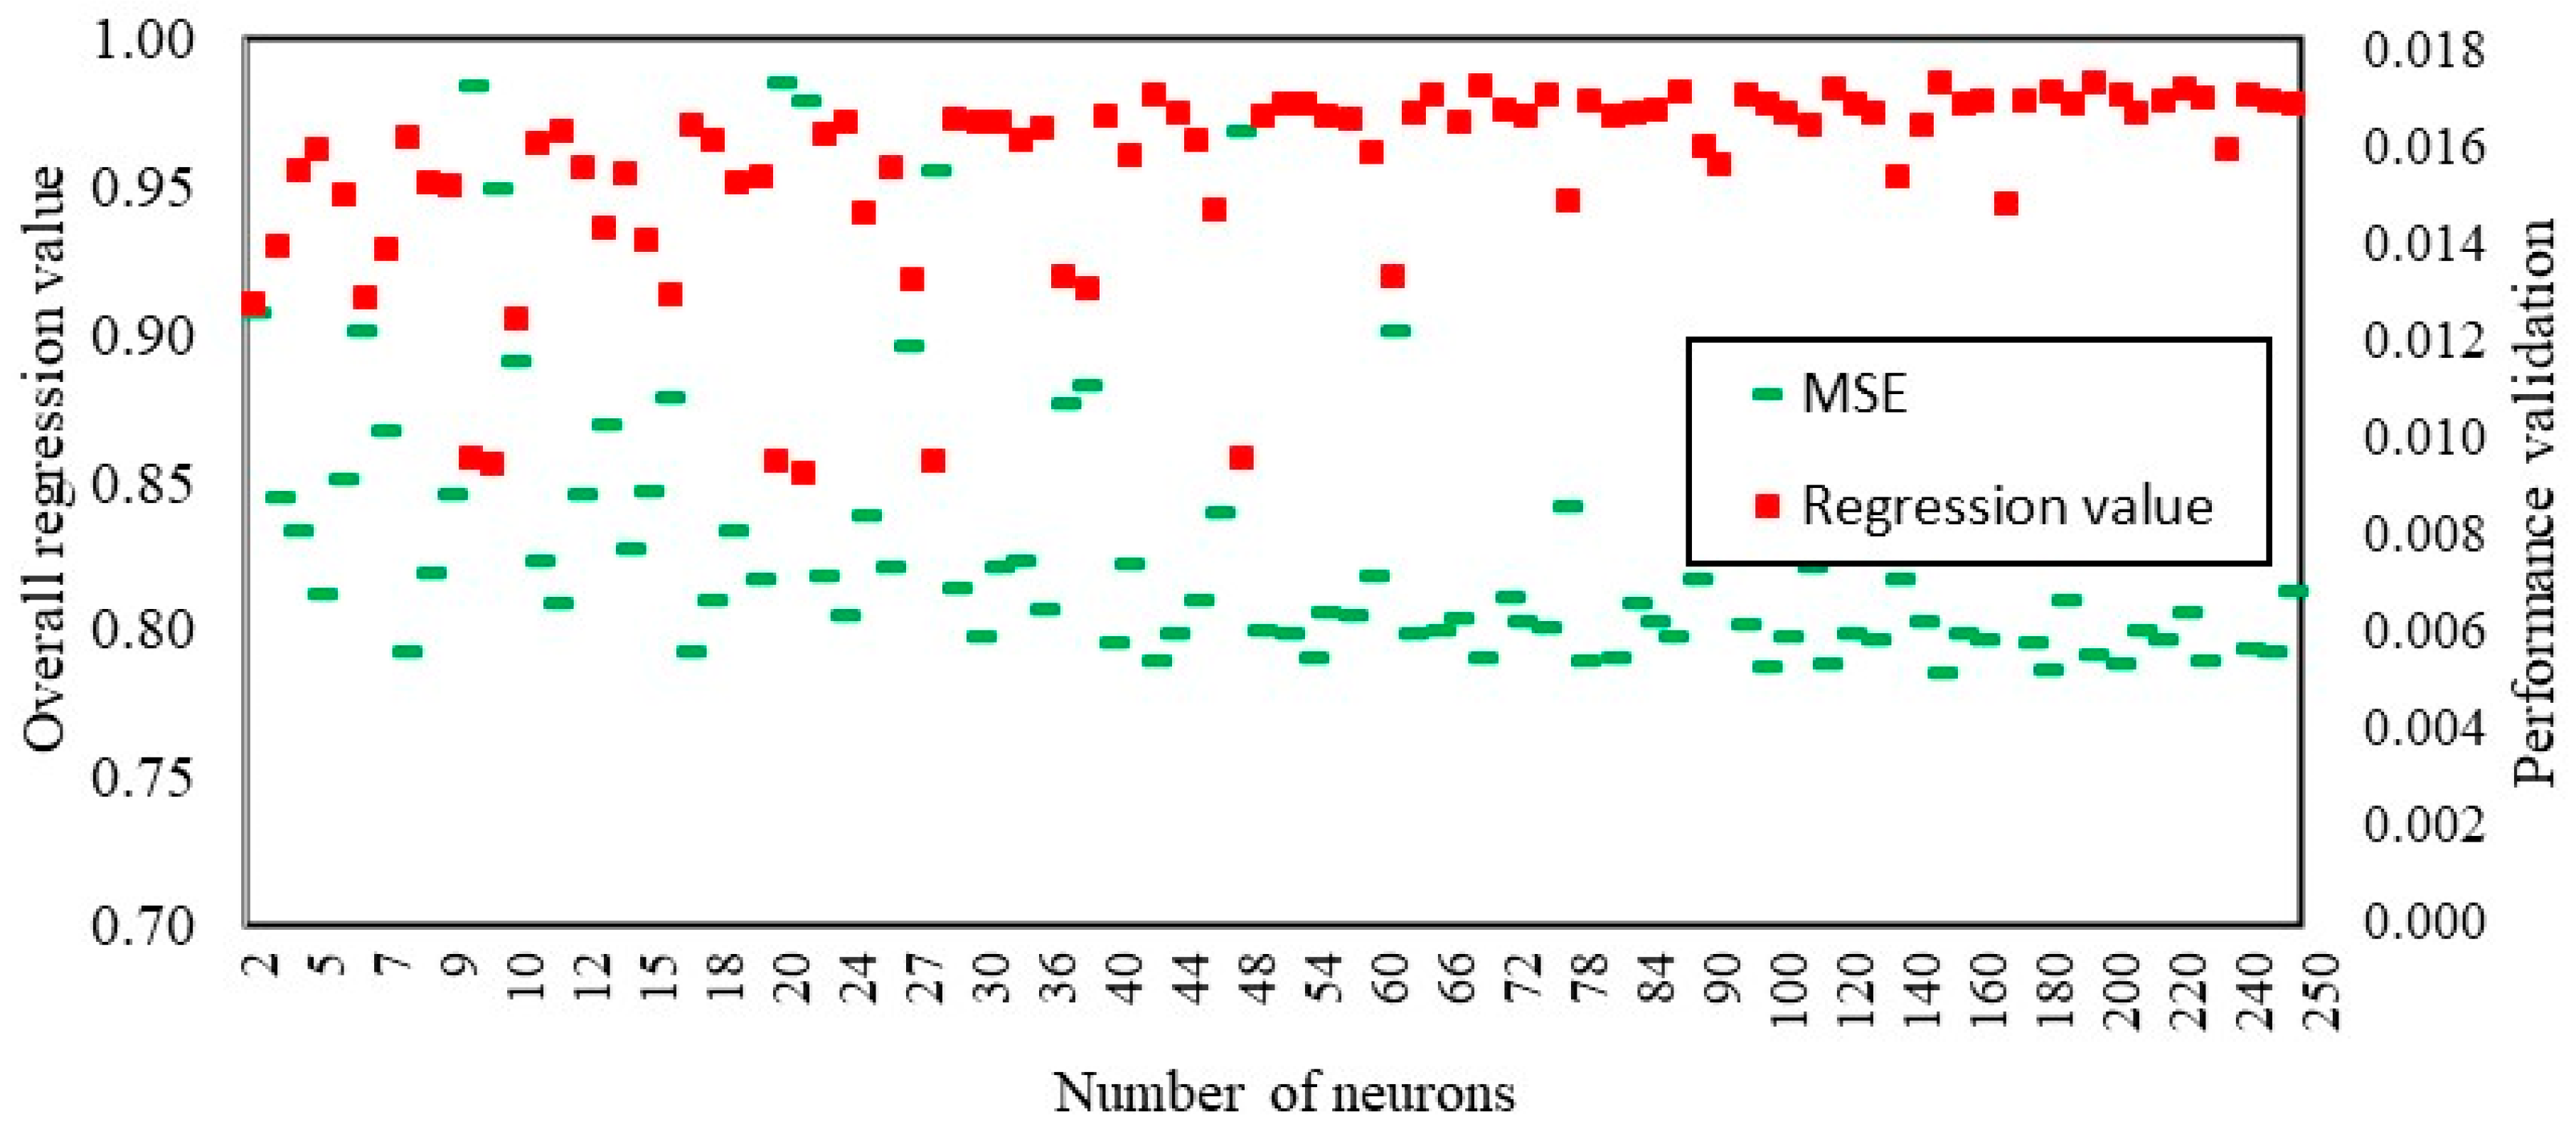
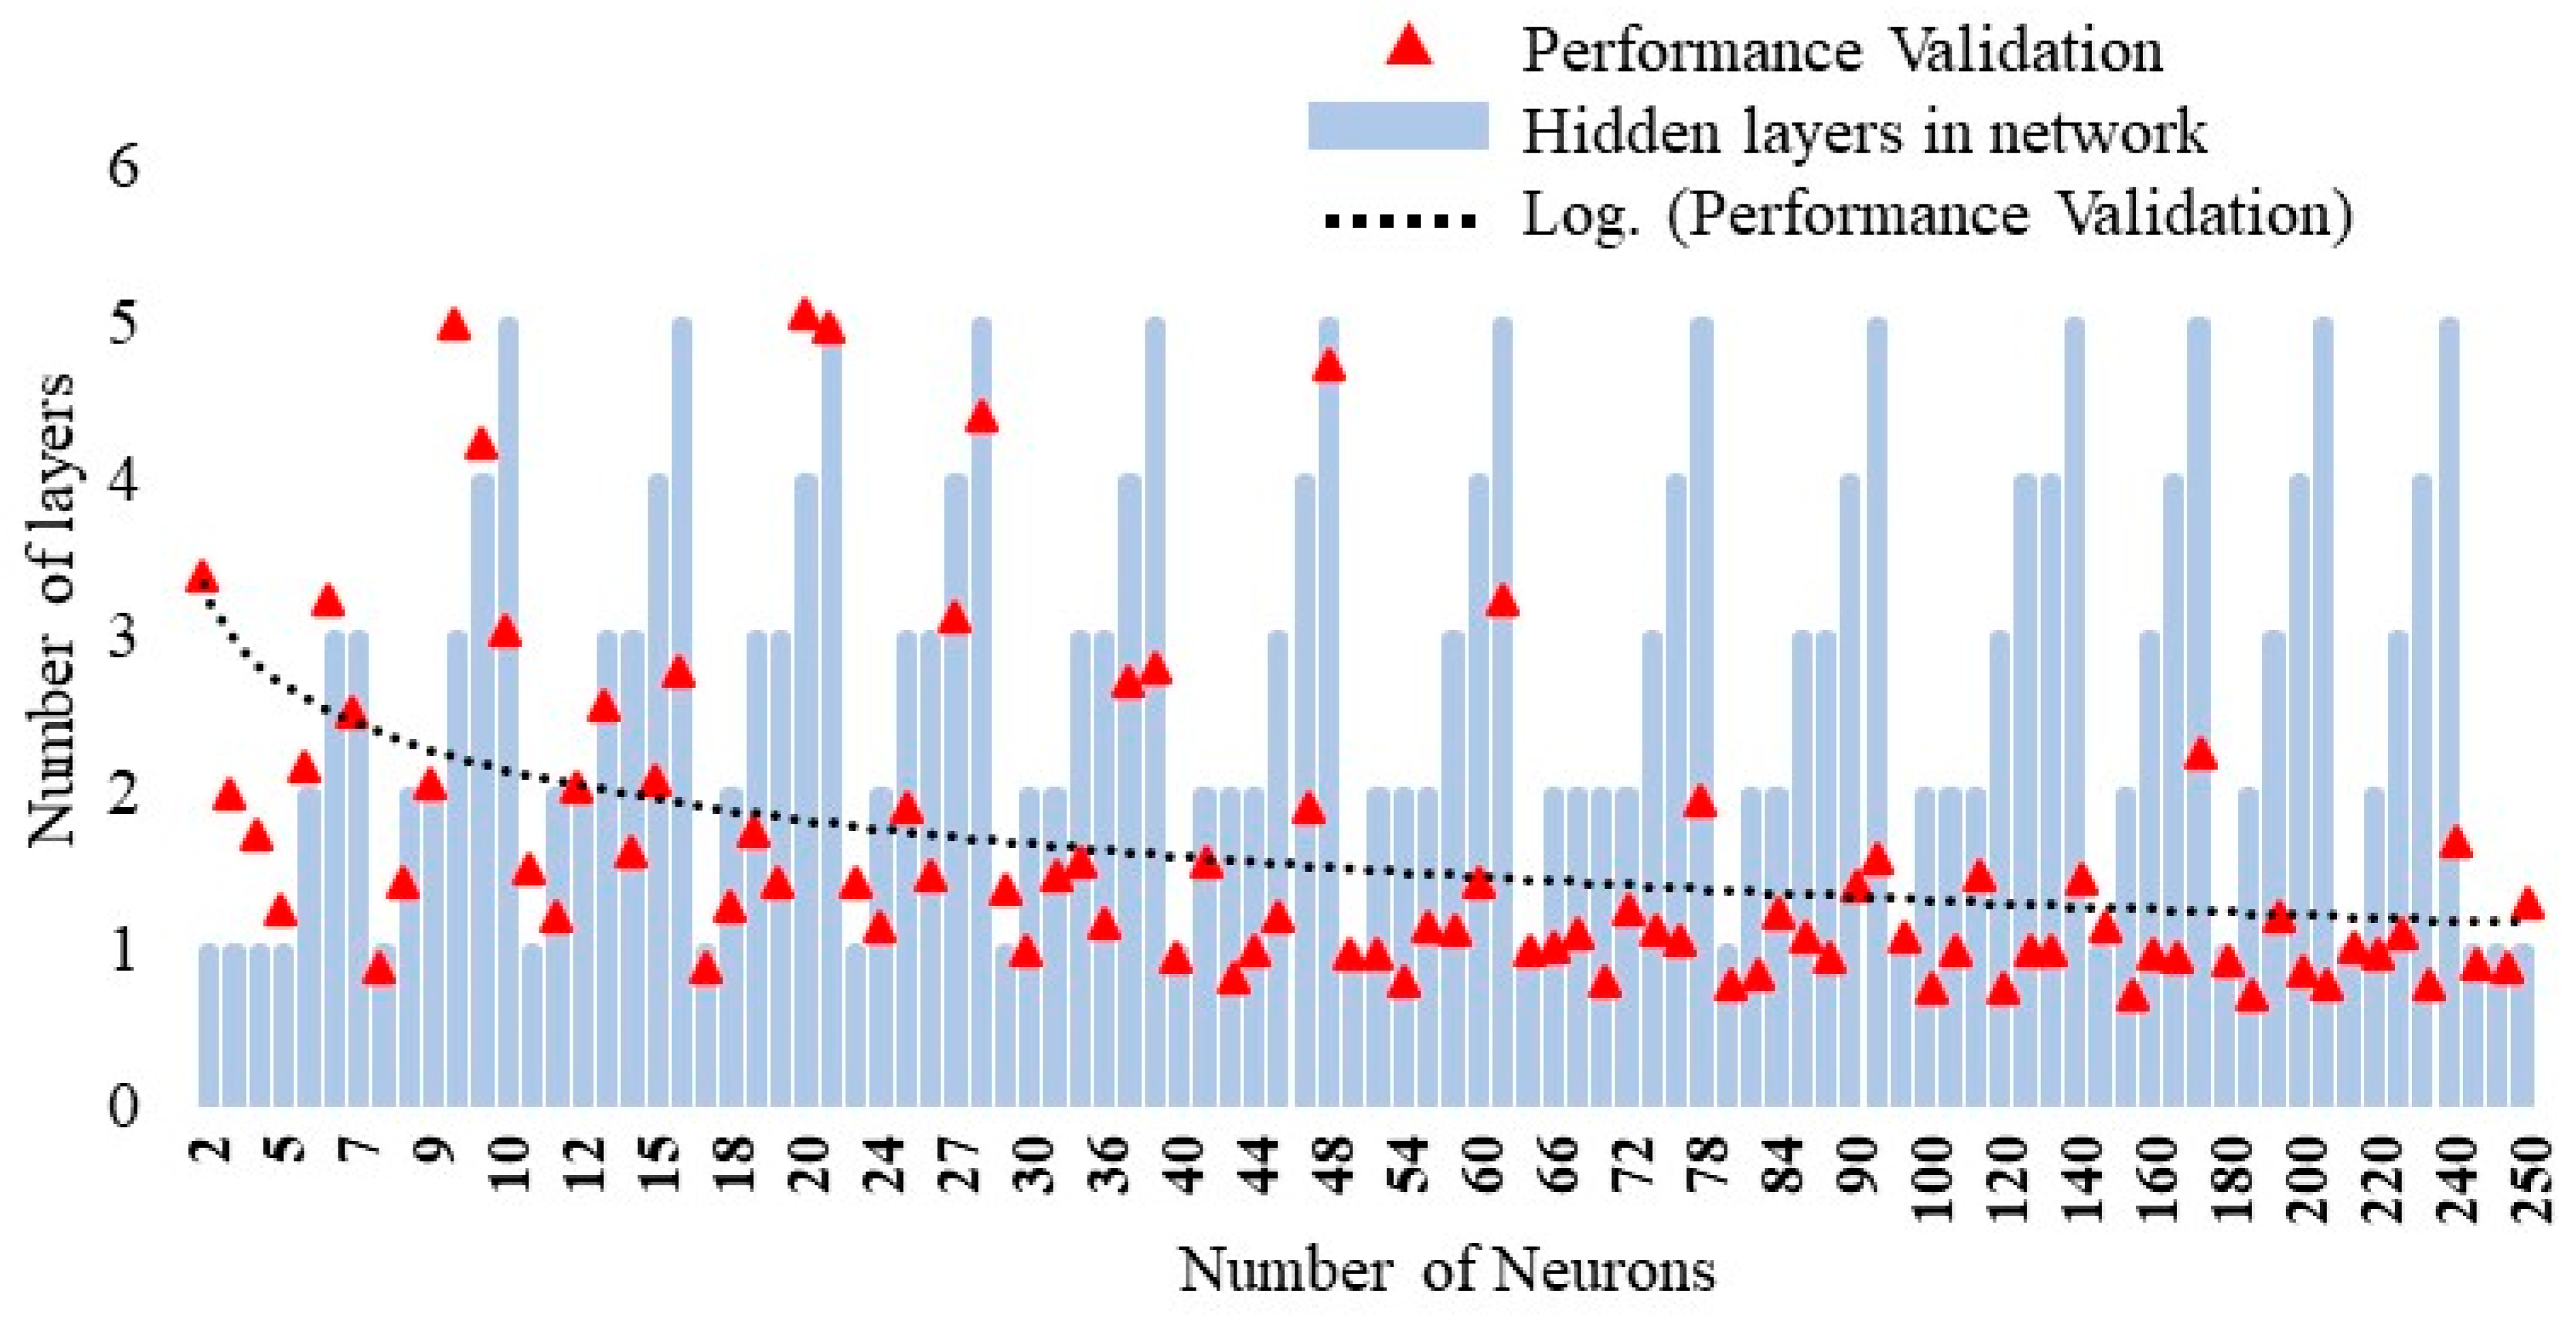
The relationship between hidden layers and network performance is illustrated in Figure 9. Networks with more than two hidden layers demonstrated a higher mean squared error (MSE) than those with one or two hidden layers, indicating that configurations with one or two hidden layers achieved better overall. Networks with three, four, and five hidden layers showed significant variability in performance, necessitating more trial formations to achieve the least MSE. The figure reveals that different network architectures can achieve similar performance levels. To identify an enhanced network for this work, we should concentrate on configurations with one or two hidden layers while evaluating criteria such as MSE, Tt, regression value, and iteration numbers. Several optimal network architectures, emphasizing their best performance, were tested, and it was seen that MSE is directly proportional to mean regression. The 65-neuron arrangement of the 7-(38-27)-5 structure with two hidden layers was the most effective regarding MSE and regression. While it required the maximum Tt, it completed its epochs in a reasonable timeframe, specifically 41 epochs, compared to 11 epochs for the 100-neuron architecture and 3.95 epochs for the 2-neuron structure. Overall, the hidden layers do not appear to correlate with MSE, the number of epochs, Tt, or average regression value. It should be noted that the results of the application align well with the regulations of the site where the case study is located.
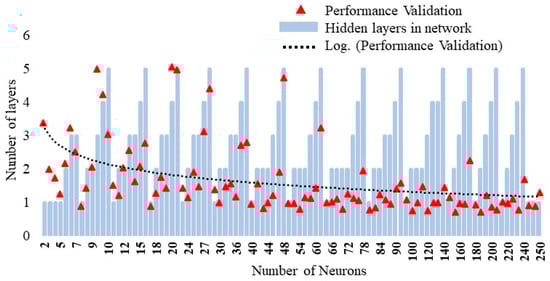
Figure 9.
Hidden layers vs. performance of the network.
5. Conclusions
Subsequent conclusions can be made using the results acquired from several arrangements of neurons in the ANN using PYTHON as the tool.
Numerous neural network configurations must be evaluated to determine which best generalizes the input–output data relationship. The network exhibited a more significant mean squared error (MSE) with minimum neurons, fluctuating between the most and least values until an acceptable structure was identified. Notably, “overfitting” was not detected during the study, indicating that the offered input–output dataset contained sufficient examples.
With sufficient input–output dataset examples, the network could generalize the fundamental relation using as few as two neurons in one hidden layer, achieving a total regression value of 0.911. However, performance deteriorated when the same neurons were distributed in various layers until the hidden layer size increased to 65. Both training and testing regression values were altered until the network grasped a hidden layer size of 38 neurons for one or more hidden layers.
Networks with one or two hidden layers outperformed those with 3-, 4-, and 5-layer arrangements. The MSE and average regression values were found to have a direct proportional relationship. The configuration of 65 neurons with a 7-(38-27)-5 structure, which included two hidden layers, was identified as the most effective regarding regression and MSE. Although it required the longest training time, it achieved a relatively low number of epochs (39) compared to 10 epochs for the 100-neuron architecture and 350 for the 2-neuron structure.
It is suggested that one or two hidden-layer networks be utilized to create an optimized, sustainable seismic retrofit tool that can optimize not only the retrofit techniques offered in this study but also the underlying technology.
Supplementary Materials
Supplementary material associated with this article can be found in the online version at https://doi.org/10.1016/j.dib.2020.106477.
Author Contributions
Conceptualization, H.A.A. and W.A.T.; Methodology, H.A.A.; Software, H.A.A.; Validation, H.A.A.; Investigation, W.A.T.; Resources, W.A.T.; Data curation, H.A.A.; Writing—original draft, H.A.A.; Writing—review & editing, W.A.T.; Visualization, W.A.T.; Supervision, W.A.T.; Project administration, W.A.T.; Funding acquisition, W.A.T. All authors have read and agreed to the published version of the manuscript.
Funding
This work was supported by the Deanship of Scientific Research, Vice Presidency for Graduate Studies and Scientific Research, King Faisal University, Saudi Arabia (Grant No. KFU252240).
Institutional Review Board Statement
The research was conducted with integrity, fidelity, and honesty. All the ethical procedures were considered.
Data Availability Statement
The dataset used/or analyzed during the current study is available from the corresponding author upon reasonable request.
Acknowledgments
The authors acknowledge the Deanship of Scientific Research, Vice Presidency for Graduate Studies and Scientific Research, King Faisal University, Saudi Arabia (Grant No. KFU252240).
Conflicts of Interest
The authors declare that there is no conflict of interest.
References
- Sorace, S.; Costoli, I.; Terenzi, G. Seismic assessment and dissipative bracing retrofit-based protection of infills and partitions in RC structures. Eng. Struct. 2023, 281, 115781. [Google Scholar] [CrossRef]
- Zhao, J.; Qiu, H. Seismic performance and damage evolution of RC frames retrofitted by the novel GESB system: A numerical study. Eng. Fail. Anal. 2023, 152, 107513. [Google Scholar] [CrossRef]
- Hung, C.-C.; Hsiao, H.-J.; Shao, Y.; Yen, C.-H. A comparative study on the seismic performance of RC beam-column joints retrofitted by ECC, FRP, and concrete jacketing methods. J. Build. Eng. 2023, 64, 105691. [Google Scholar] [CrossRef]
- American Society of Civil Engineers. Seismic Evaluation and Retrofit of Existing Buildings (41-23); American Society of Civil Engineers: Reston, VA, USA, 2023; p. 752. [Google Scholar]
- Villalba, P.; Sánchez-Garrido, A.J.; Yepes, V. Life cycle evaluation of seismic retrofit alternatives for reinforced concrete columns. J. Clean. Prod. 2024, 455, 142290. [Google Scholar] [CrossRef]
- Omidian, P.; Khaji, N.; Aghakouchak, A.A. Seismic time-dependent resilience assessment of aging highway bridges incorporating the effect of retrofitting. Structures 2024, 63, 106347. [Google Scholar] [CrossRef]
- Ahmed, A.; Shahzada, K.; Ali, S.M.; Khan, A.N.; Shah, S.A.A. Confined and unreinforced masonry structures in seismic areas: Validation of macro models and cost analysis. Eng. Struct. 2019, 199, 109612. [Google Scholar] [CrossRef]
- Ahmed, A.; Shahzada, K. Seismic vulnerability assessment of confined masonry structures by macro-modeling approach. Structures 2020, 27, 639–649. [Google Scholar] [CrossRef]
- Ahmed, H.A.; Shahzada, K.; Fahad, M. Performance-based seismic assessment of capacity enhancement of building infrastructure and its cost-benefit evaluation. Int. J. Disaster Risk Reduct. 2021, 61, 102341. [Google Scholar] [CrossRef]
- Di Trapani, F.; Malavisi, M.; Carlo Marano, G.; Pio Sberna, A.; Greco, R. Optimal seismic retrofitting of reinforced concrete buildings by steel-jacketing using a genetic algorithm-based framework. Eng. Struct. 2020, 219, 110864. [Google Scholar] [CrossRef]
- Lin, C.; Chen, C.; Bie, Z. A probabilistic resilience assessment method for distribution system operation with probabilistic optimal power flow. Energy Rep. 2022, 8, 1133–1142. [Google Scholar] [CrossRef]
- Ahmed, H.A.; Tanoli, W.A. Investigating the confinement effects on masonry behavior based on friction interface. Sci. Rep. 2024, 14, 12982. [Google Scholar] [CrossRef] [PubMed]
- Dong, G.; Hajirasouliha, I.; Pilakoutas, K.; Asadi, P. Multi-level performance-based seismic design optimisation of RC frames. Eng. Struct. 2023, 293, 116591. [Google Scholar] [CrossRef]
- Ahmed, H.A.; Sadiq, A.; Shahzada, K. Confined hollow concrete block masonry buildings: An experimental approach for vulnerability assessment. Compos. Adv. Mater. 2022, 31, 1–12. [Google Scholar] [CrossRef]
- Ahmed, H.A. Vulnerability assessment of sustainable seismic retrofit solutions for reinforced concrete structures: A mul-ti-faceted approach. Front. Struct. Civ. Eng. 2025, 19, 598–622. [Google Scholar] [CrossRef]
- Ahmed, H.A.; Fahad, M.; Haroon, M. Development of Sustainable Concrete to assure Resilience and Durability via Self-Sensing. Int. J. Adv. Nat. Sci. Eng. Res. 2024, 8, 76–84. [Google Scholar]
- Caterino, N.; Cosenza, E. A multi-criteria approach for selecting the seismic retrofit intervention for an existing structure accounting for expected losses and tax incentives in Italy. Eng. Struct. 2018, 174, 840–850. [Google Scholar] [CrossRef]
- Asadi, E.; Salman, A.M.; Li, Y. Multi-criteria decision-making for seismic resilience and sustainability assessment of diagrid buildings. Eng. Struct. 2019, 191, 229–246. [Google Scholar] [CrossRef]
- Qian, J.; Dong, Y. Multi-criteria decision making for seismic intensity measure selection considering uncertainty. Earthq. Eng. Struct. Dyn. 2020, 49, 1095–1114. [Google Scholar] [CrossRef]
- Akbar, A.; Liew, K.M. Multicriteria performance evaluation of fiber-reinforced cement composites: An environmental perspective. Compos. Part B Eng. 2021, 218, 108937. [Google Scholar] [CrossRef]
- Sánchez-Garrido, A.J.; Navarro, I.J.; Yepes, V. Multi-criteria decision-making applied to the sustainability of building structures based on Modern Methods of Construction. J. Clean. Prod. 2022, 330, 129724. [Google Scholar] [CrossRef]
- Arshad, A.; Konstantinidis, D. Effect of multi-component excitation on the sliding response of unanchored components in nuclear facilities. Nucl. Eng. Des. 2022, 390, 111707. [Google Scholar] [CrossRef]
- Magliulo, G.; D’Angela, D.; Piccolo, V.; Di Salvatore, C.; Caterino, N. Seismic capacity and performance of code-conforming single-story RC precast buildings considering multiple limit states and damage criteria. J. Build. Eng. 2023, 70, 106316. [Google Scholar] [CrossRef]
- Sheela, K.G.; Deepa, S.N. Review on Methods to Fix Number of Hidden Neurons in Neural Networks. Math. Probl. Eng. 2013, 2013, 425740. [Google Scholar] [CrossRef]
- Fumumoto, Y.; Owaki, S.; Nakamura, M. Effect of number of neurons of a neural-network on compensation performance of SPM non-linear waveform distortion. In Proceedings of the 2017 Opto-Electronics and Communications Conference (OECC) and Photonics Global Conference (PGC), Singapore, 31 July–4 August 2017. [Google Scholar]
- Kavzoglu, T. Determining optimum structure for artificial neural networks. In Proceedings of the 25th Annual Technical Conference and Exhibition of the Remote Sensing Society, Citeseer, Cardiff, UK, 8–10 September 1999; Available online: https://wos-journal.info/journalid/17279 (accessed on 31 May 2025).
- Shibata, K.; Yusuke, I. Effect of number of hidden neurons on learning in large-scale layered neural networks. In Proceedings of the 2009 ICCAS-SICE, Fukuoka, Japan, 18–21 August 2009. [Google Scholar]
- Burkitt, A.N. Optimization of the Architecture of Feed-forward Neural Networks with Hidden Layers by Unit Elimination. Complex Syst. 1991, 5, 371–380. [Google Scholar]
- Melchiorre, J.; D’Amato, L.; Agostini, F.; Rizzo, A.M. Acoustic emission onset time detection for structural monitoring with U-Net neural network architecture. Dev. Built Environ. 2024, 18, 100449. [Google Scholar] [CrossRef]
- Shabbir, K.; Noureldin, M.; Sim, S.-H. Data-driven model for seismic assessment, design, and retrofit of structures using explainable artificial intelligence. Comput.-Aided Civ. Infrastruct. Eng. 2025, 40, 281–300. [Google Scholar] [CrossRef]
- Gharagoz, M.M.; Noureldin, M.; Kim, J. Machine learning-based design of a seismic retrofit frame with spring-rotational friction dampers. Eng. Struct. 2023, 292, 116053. [Google Scholar] [CrossRef]
- Falcone, R.; Ciaramella, A.; Carrabs, F.; Strisciuglio, N.; Martinelli, E. Artificial neural network for technical feasibility prediction of seismic retrofitting in existing RC structures. Structures 2022, 41, 1220–1234. [Google Scholar] [CrossRef]
- Joseph, R.; Mwafy, A.; Alam, M.S. Seismic performance upgrade of substandard RC buildings with different structural systems using advanced retrofit techniques. J. Build. Eng. 2022, 59, 105155. [Google Scholar] [CrossRef]
- Scalvenzi, M.; Gargiulo, S.; Freddi, F.; Parisi, F. Impact of seismic retrofitting on progressive collapse resistance of RC frame structures. Eng. Fail. Anal. 2022, 131, 105840. [Google Scholar] [CrossRef]
- Passoni, C.; Caruso, M.; Felicioni, L. The evolution of sustainable renovation of existing buildings: From integrated seismic and environmental retrofitting strategies to a life cycle thinking approach. Bull. Earthq. Eng. 2024, 22, 6327–6357. [Google Scholar] [CrossRef]
- Computers and Strcutures. Csi Analysis Reference Manual for Sap2000, Etabs and Safe; Computers & Structures: Walnut Creek, CA, USA, 2021. [Google Scholar]
- Scamardo, M.; Zucca, M.; Crespi, P.; Longarini, N.; Cattaneo, S. Seismic Vulnerability Evaluation of a Historical Masonry Tower: Comparison between Different Approaches. Appl. Sci. 2022, 12, 11254. [Google Scholar] [CrossRef]
- Zucca, M.; Reccia, E.; Longarini, N.; Cazzani, A. Seismic Assessment and Retrofitting of a Historical Masonry Building Damaged during the 2016 Central Italy Seismic Event. Appl. Sci. 2022, 12, 11789. [Google Scholar] [CrossRef]


Disclaimer/Publisher’s Note: The statements, opinions and data contained in all publications are solely those of the individual author(s) and contributor(s) and not of MDPI and/or the editor(s). MDPI and/or the editor(s) disclaim responsibility for any injury to people or property resulting from any ideas, methods, instructions or products referred to in the content. |
© 2025 by the authors. Licensee MDPI, Basel, Switzerland. This article is an open access article distributed under the terms and conditions of the Creative Commons Attribution (CC BY) license (https://creativecommons.org/licenses/by/4.0/).