Article

Structural Design and Mechanical Characteristics of a New Prefabricated Combined-Accident Oil Tank

1
Wuhan Huayuan Electric Power Design Institute Co., Ltd., Wuhan 430056, China
2
School of Civil Engineering and Architecture, Wuhan Institute of Technology, Wuhan 430074, China
3
School of Civil and Hydraulic Engineering, Huazhong University of Science and Technology, Wuhan 430074, China
*
Author to whom correspondence should be addressed.
Buildings 2025, 15(14), 2477; https://doi.org/10.3390/buildings15142477
Submission received: 5 June 2025 / Revised: 5 July 2025 / Accepted: 11 July 2025 / Published: 15 July 2025

Abstract

To address the persistent challenges of substantial land occupation, intricate construction sequencing, and extended project timelines inherent to conventional substation accident oil sumps, this research introduces a novel integrally prefabricated circular cross-section oil containment structure. The study establishes a finite element representation of this prefabricated system to systematically examine structural deformation mechanisms and failure patterns under combined hydrostatic and geostatic loading scenarios. Through parametric analysis of the oil tank structure, the influences of longitudinal reinforcement diameter, thickness–diameter ratio, height–diameter ratio, and concrete-strength grade on the mechanical characteristics of the structure are explored. Utilizing the response surface methodology for the parametric optimization in finite element analysis, a comprehensive optimization of critical geometric design variables is conducted. These results indicate that longitudinal reinforcement diameter and concrete-strength grade exert negligible influence on concrete stress except for stress increase under internal pressure, with higher concrete grades. The thickness-to-diameter ratio dominantly regulates structural responses: response surface optimization achieved 12% stress reduction and 14% displacement mitigation at 220 mm wall thickness under internal pressure, despite a 4% stress increase under external loading. Height-dependent effects require specific optimization, with 18% stress reduction beyond 3000 mm under external pressure but 20% stress increase at 3400 mm under top loads. Geometric refinements enable 34–50% displacement reduction in critical zones, providing validated references for prefabricated oil tanks.

1. Introduction

With the global transition in energy structure and the rapid development of the power industry, substations, serving as critical nodes in power transmission and distribution, face increasingly stringent safety and environmental protection requirements. However, the risk of transformer oil leakage persists during operation. Therefore, substations are commonly equipped with main transformer-accident oil tanks as primary containment structures to collect discharged oil following transformer failures or fire incidents. These tanks achieve waste oil storage through oil–water separation, effectively mitigating secondary pollution caused by uncontrolled oil discharge [1].
Traditional accident oil tanks are typically constructed using reinforced concrete (or masonry) structures, with common construction methods including cast-in-place on-site or field assembly of factory-prefabricated components. However, these structures face multiple challenges: stringent environmental and anti-leakage requirements, large footprints necessitating coordinated planning with main substation layouts, difficulties in land allocation for capacity expansion or retrofitting, wet-process construction activities requiring on-site operations, complex construction sequences, prolonged timelines, low labor efficiency, and high energy consumption [2]. To address these limitations, prefabricated modular structures are being progressively implemented in power transmission and distribution projects. The prefabricated modular accident oil tank system involves designing standardized tank units that undergo factory-based integral prefabrication in bulk. Each tank unit possesses a defined oil storage capacity and can be transported to construction sites for mechanized installation or combined into larger configurations as required [3]. This approach aligns with national policies promoting prefabricated construction, eco-friendly practices, and energy-efficient solutions. Furthermore, it enables standardized (modular) design–manufacturing integration, mechanized installation, and intelligent operation-maintenance management in power infrastructure projects. These advancements establish a foundation for enhancing the quality of transmission and distribution engineering while elevating technical and managerial standards in the power industry [2,3].
The design methodology for reinforced-concrete accident oil tanks originates from structural reservoir design principles in municipal engineering. These tanks primarily consist of elastic thin-plate structures, necessitating structural design focused on the mechanical behavior of thin-walled configurations. Recent advancements in failure mechanisms of thin-walled structures by domestic and international researchers [4,5,6,7] have informed this field. For instance, Liu et al. [7] developed an analytical model for prestressed thin-walled cylindrical shells, deriving stiffness characteristic curves validated through experimental tests, confirming the theoretical accuracy of these mechanical properties. However, accurate mechanical analysis of accident oil tanks requires spatial structural analysis of the entire thin-walled system to account for inter-component interactions between structural panels, presenting significant computational complexity [8,9,10]. Wang et al. [3] demonstrated the feasibility of fully prefabricated oil tanks by adapting mature design specifications from underground utility tunnels. Their study utilized the “single-compartment longitudinal interlocking socket joint” configuration from utility tunnel standards, providing critical design and construction recommendations for joint reinforcement in fully prefabricated systems. Additionally, Qu et al. [10] investigated rectangular transformer oil tanks through numerical simulations, revealing that tank dimensions critically influence gravitational oil–water separation efficiency. Their findings indicate that reduced tank capacity effectively decreases peak accident oil contamination levels while extending pollution threshold exceedance duration, establishing volumetric optimization as a key design parameter.
While significant advancements have been made in understanding the mechanical properties and failure characteristics of reinforced-concrete structures [11,12,13,14], the complex mechanical behaviors of reinforced-concrete oil tanks under combined multi-directional loading (including circumferential soil and hydraulic lateral pressures, basal groundwater buoyancy, overburdened soil weight, and additional live loads) remain incompletely understood, particularly regarding stress mechanisms, deformation patterns, and crack-induced failure modes [2,3]. Current engineering implementations of precast oil containment systems mainly adopt a modular assembly methodology, involving division of conventional structures into prefabricated elements that are individually lifted and interconnected via pre-installed dowel bars and secondary grouting processes to achieve structural continuity [15]. This design method moderately decreases in cast-in-place concrete pouring activities, while it remains ineffective in resolving spatial efficiency limitations and increasingly stringent fluid-tightness specifications for oil retention systems.
Distinct from segmented precast methods, this study proposes an integrally prefabricated monolithic circular cross-section accident oil tank system. The system adopts factory-integrated prefabrication of monolithic units combined with on-site modular installation, significantly reducing wet-work processes while enhancing construction efficiency. Addressing critical unresolved issues—including deformation mechanisms and failure modes under combined hydrostatic and earth pressures, coupled with the effects of longitudinal reinforcement diameter, thickness-to-diameter ratio, height-to-diameter ratio, and concrete-strength grade on mechanical behavior, and multivariate collaborative optimization under complex loading—this research establishes a finite element model for the integrally prefabricated tank. The model systematically investigates structural response mechanisms under soil–water combined loads, quantifies impacts of key design parameters on concrete stress and displacement through multi-condition parametric analysis (covering self-weight, earth pressure, surcharge, and buoyancy), and reveals the dominant effects of thickness-to-diameter and height-to-diameter ratios. Furthermore, it innovatively applies multivariate multi-objective response surface methodology to synergistically optimize stress and displacement objective functions, providing a scientific basis for optimizing prefabricated tank design, advancing substation construction technology.

2. Design of the Novel Integrally Prefabricated Accident Oil Tank Structure

2.1. Design Concept

Based on the oil–water separation principle, accident oil tanks can adopt three typical structural configurations: filtration type, air-flotation type, and gravity type [16]. The gravity type has been widely adopted in substation engineering, due to its lower investment costs. Traditional gravity-type accident oil tanks primarily consist of oil discharge pipes, an emergency oil inlet pipe, an oil tank base plate, tank wall and other components [17], as seen in Figure 1a. Structurally, these tanks are categorized into dual-chamber and single-chamber types [18]. The dual-chamber type, typically featuring a rectangular cross-section, employs a partition wall to divide the tank into two compartments. This design prolongs the flow path of oil–water mixtures within the tank, thereby enhancing oil–water separation time [16]. In contrast, the single-chamber type (siphon type) utilizes the siphon principle by installing a siphon pipe on the outlet side to extend separation time. This configuration is available in both circular and rectangular cross-sectional forms [16,18,19]. However, conventional designs predominantly employ open-air cast-in situ concrete structures, suffering from three critical drawbacks: (1) prolonged construction periods; (2) lack of sealed covers, allowing rainwater ingress that dilutes oil layers and reduces effective capacity; and (3) short flow paths in single-tank structures (especially rectangular ones), resulting in insufficient residence time for separation.
Currently, prefabricated inspection chambers for rainwater and sewage systems are being widely promoted in domestic municipal engineering projects. The China Institute of Building Standard Design & Research has compiled and published the Prefabricated Inspection Chambers standard drawings (22S521) [20], which specify prefabricated chambers with internal diameters ranging from 1 m to 1.8 m. Building upon these designs, substation oil storage tanks can be optimized in terms of wall thickness, connection interfaces, reinforcement configuration, and concrete impermeability, to transform them into lighter-weight oil-retaining accident tanks. Therefore, this work proposes a fully factory-prefabricated circular siphon-type oil containment tank unit (Figure 1b,c). The core innovation lies in a transformative construction paradigm: standardized reinforced-concrete prefabricated cylinders with sealed covers are interconnected via flanges to form a modular tank cluster, simultaneously extending oil–water flow paths/residence time and preventing rainwater infiltration. The tanks are interconnected via pre-embedded flanges based on the principle of communicating vessels, ensuring that their total volume remains equivalent to that of traditional monolithic accident oil tanks, while fulfilling oil storage requirements. The proposed structure comprises a reinforced-concrete circular tank and an adjustable reinforced-concrete shaft structure integrated above the tank. The tank assembly sequentially includes, from bottom to top: a base slab, tank walls, a sludge discharge pipe (with outlet) and an oil inlet pipe embedded in the walls, the adjustable shaft structure, and a cover slab. The cover slab is equipped with an inspection entrance and ventilation pipes. For effective oil–water separation and anti-seepage, the oil inlet pipe is set 100–150 cm above the sludge discharge outlet. Internal joints use stepped tongue-and-groove connections (lower opening toward inner wall), sealed with cement/waterproof mortar. The shaft height is adjustable, to ensure safe access depth. Generally, this integrally prefabricated tank can be manufactured in prefabrication plants, with its capacity and modular configuration tailored to project demands. On-site hoisting installation enhances structural integrity, eliminates the inefficiencies of cast-in-place construction (e.g., high energy consumption, prolonged timelines, and low productivity), and enables mechanized deployment. The design simultaneously fulfills oil–water separation duration requirements and aligns with energy-saving and environmental protection objectives.

2.2. Design Parameters

The novel monolithic prefabricated emergency oil tank utilizes siphon principles for drainage and oil retention, integrating both functions within a single tank structure. The operational principles and internal configuration are illustrated in Figure 1c. In accordance with specifications from the “Standard for design of fire protection for fossil fuel power plants and substations” (GB50229-2019) [21], “Code for design of 35kV~110kV substation” (GB50059-2011) [22], and “Fire prevention code of petrochemical enterprise design” (GB50160-2008) [23], the capacity, inlet/outlet elevation, and pre-filled water level of conventional oil tanks constitute critical parameters influencing oil–water separation effectiveness [17]. Consequently, the structural design of the novel oil tank primarily addresses the following aspects:
(1)
The accidental oil discharge capacity Q(t) can be determined by selecting the maximum oil discharge rate from a single main transformer. This ensures the design accounts for the worst-case scenario during failure events.
(2)
The oil discharge volume V can be calculated using the oil density γ = 0.89 t/m3, resulting in V = Q/0.89 m3. This conversion standardizes the mass-to-volume relationship for containment planning.
(3)
The post-discharge base water depth h1 (m) must be larger than 0.6 m to accommodate oil recovery pipes and partition wall openings. However, h1 may be reduced if a top-mounted pump is used for oil extraction, depending on operational requirements.
(4)
The oil pool wall thickness b should be designed within the range of 150 mm to 200 mm. This specification balances structural stability with construction feasibility.
(5)
The maximum oil level after discharge must remain below the lowest elevation of the main transformer pit or the bottom elevation of the discharge inlet. This prevents oil backflow and ensures safe containment.
(6)
Fully enclosed oil pools require ventilation holes with an area more than the cross-section of the discharge pipe, positioned more than 0.3 m above the maximum oil level. These holes are unnecessary if manholes or open ports exist at the upper section of the pool.
(7)
For covered oil pools, manholes with a radius no smaller than 300 mm must be installed on the top or upper walls. These manholes should extend at least 0.4 m above the siphon crown to prevent oil overflow before siphon activation, while avoiding excessive height, which complicates the process.
(8)
The pool radius R must not be smaller than 0.6 m, to prevent oil surface icing and debris accumulation. A radius of 1.0 m is recommended, in practice, to simplify dredging and construction activities.
(9)
The height of the oil layer h2 can be determined by the geometric relationship of the pool. Specifically, the pool area is A = πR2 and the pool volume is V = Ah2 = 1.12 Q, so h2 is calculated as 1.12 Q/(πR2).
(10)
The total pool height H can be calculated by the formula H = h1 + h2 + h3, where h3 (the vertical distance from the maximum oil level to the pool crown) is determined by the largest value derived from manhole or ventilation requirements. For open-top pools, h3 may be minimized to below the discharge pipe invert or increased if site conditions allow, potentially eliminating the need for ventilation holes or manholes.
(11)
Drainpipe height h is the siphon outlet-to-water level height (see Figure 1c). In detail, the drainage pipe height h can be governed by the hydrostatic equilibrium equation, which is related to the oil layer height h2 (h = 0.89h2).
(12)
The initial water level must be positioned below the bottom elevation of the drainage pipe, to ensure proper siphon functionality during emergency operations.
(13)
A water replenishment valve is installed above the initial water level to offset leakage or evaporation losses. This valve is kept slightly open for continuous drip-feed water supply, though indoor pools serving outdoor transformers may omit it after initial filling.
(14)
The oil inlet height h4 must exceed ground level by at least 0.5 m and be positioned at least 100 mm above outlets to prevent spills. Anti-clogging devices such as screens are required at inlets.
(15)
The inlet- and outlet-pipe diameters D are determined by oil flow rate and velocity requirements. The minimum inlet diameter must not be smaller than 150 mm to ensure adequate discharge capacity.

3. Mechanical Characteristics Analysis of the Novel Integrally Prefabricated Accident Oil Tank Structure

This section aims to investigate the structural response and failure boundaries of the novel oil tank under critical construction and service scenarios. By simulating four ultimate limit states involving combinations of self-weight, internal water pressure, external earth pressure, top load, and buoyancy, it systematically identifies mechanical behavior characteristics and critical load-bearing capacities during sensitive lifecycle phases. The resulting load–displacement relationships, stress distributions, and failure modes under these key scenarios establish essential safety constraints and performance targets for the subsequent cost-effective multi-parameter optimization design in the subsequent section.

3.1. Finite Element Model

3.1.1. Model Parameters and Meshing

In compliance with the design criteria outlined in the Prefabricated Assembly Inspection Chambers standard drawings (22S521) [20], each monolithic precast oil containment structure shall maintain a minimum effective volume of 5 m3 for oil drainage, with mandatory 50 cm headspace between maximum oil level and ceiling slab [24]. The optimized structural configuration comprises a vertical dimension of 2800 mm, an internal diameter of 2100 mm, and a wall thickness of 160 mm, with 200 mm thick top and bottom slabs. The reinforcement configuration consists of dual concentric circular arrangements with 36 longitudinal bars (14 mm diameter) in both outer and inner rings, complemented by 8 mm diameter hoops spaced at 100 mm intervals. Material specifications include C40 concrete and HPB400 steel, with 40 mm cover thickness for slabs and 35 mm cover for remaining elements.
Based on preceding analysis, considering that the upper wellbore adjustment structure and cover plate neither participate in liquid storage nor bear significant external loads, due to their compact dimensions, and will be subsequently installed through tongue-and-groove connections without involvement in the integral prefabrication process, this study focuses on the mechanical characteristic analysis of the reinforced-concrete chamber structure in the novel monolithic prefabricated oil tank, as shown in Figure 1. Empirical evidence substantiates negligible mechanical influence of this detachable assembly on the primary structure. Therefore, the reinforced-concrete chamber structure is modeled using a decoupled modeling approach in ANSYS finite element software 19.2, where steel reinforcement and concrete are treated as discrete entities. This methodology effectively captures the deformation interactions and failure mechanisms between concrete and reinforcement [25,26,27]. The concrete matrix is simulated with SOLID185 hexahedral elements, with steel reinforcement modeled as LINK8 truss elements. In the decoupled modeling framework, nodal connections between concrete and reinforcement elements are established through coupling constraints. To prevent constraint application conflicts at slave nodes, concrete element nodes are designated as master nodes, while reinforcement nodes serve as slave nodes [27]. The geometrically complex tank structure is discretized using SMARTSIZE-controlled tetrahedral meshing. Grid sensitivity analysis determines an optimal element size of 0.06 m, achieving computational efficiency while maintaining stress calculation accuracy within 0.02% tolerance. The complete finite element model of the prefabricated oil tank chamber is presented in Figure 2.

3.1.2. Material Properties

In the finite element analysis process, the constitutive behavior of concrete primarily characterizes its stress–strain relationships under multiaxial stress states. The development of concrete constitutive models generally relies on established theoretical foundations, incorporating material parameter calibration through consideration of concrete’s distinctive mechanical characteristics. Table 1 shows the principal material parameters for the oil tank concrete. Since this research emphasizes concrete failure mechanisms in the plastic stage, the ascending curve of the uniaxial stress–strain relationship adopts the formulation prescribed in the “Code for Design of Concrete Structures” (GB/T 50010-2010, 2024 revision) [28]:
σ c = f c 1 1 ε c ε 0 n ,   ε c ε 0  
where σ c is the compressive stress at concrete strain ε c ; f c is the design value of the axial compressive strength; ε 0 is the compressive strain at the peak stress f c ; and n is a coefficient with an upper limit value of 2 when the calculated value exceeds 2.
The study employs proportional single loading, disregarding cyclic loading and the Bauschinger effect. Consequently, the multilinear isotropic hardening (MISO) model is adopted to simulate concrete’s stress–strain relationship using piecewise linear curves [29]. The MISO model can represent isotropic hardening behavior through multilinear approximations of the stress–strain curve, suitable for proportional loading scenarios and large strain analyses. Notably, the initial point of the MISO-defined stress–strain curve in ANSYS Mechanical APDL must correspond to the material’s elastic modulus. Additionally, the stress–strain curve exhibits slopes exceeding elastic modulus or negative values. In reinforced-concrete systems, steel reinforcement (typically slender elements) is assumed to be shear-independent, without composite stress considerations. Considering bond deterioration prior to rebar hardening, an idealized elastic perfectly plastic constitutive model proves appropriate for steel reinforcement. To enhance solution convergence, elastoplastic models with hardening phases can be optionally implemented. Considering steel’s identical tension–compression behavior, the bilinear isotropic hardening (BISO) model is adopted for reinforcement simulation [30]. In ANSYS Mechanical APDL, the steel constitutive relationship is defined using the tensile strength parameter from Table 1.
For nonlinear analysis of reinforced-concrete structures, user-defined failure criteria must be established, in addition to material constitutive models. Generally, the William–Warnke five-parameter failure criterion is typically adopted to simulate concrete behavior, predicting brittle failure while accounting for both cracking and crushing mechanisms [31,32]. The failure criterion for concrete under multi-axial stress states is expressed as
F f c S 0
where F is a function of the principal stresses, and S denotes the failure surface, which is a function of the principal stresses, by the following experimentally calibrated parameters (ft, fc, fcb, f1, f2). If the stress state does not satisfy Equation (2), cracking or crushing will not occur. Post-threshold satisfaction, tensile principal stresses initiate cracking, whereas compressive stresses trigger crushing. Moreover, under relatively low hydrostatic pressure conditions, the failure surface can be uniquely defined by two parameters: ft and fc. In this work, the adopted values of the tensile strength ft and compressive strength fc of the failure criterion can be chosen from Table 1. The other three parameters, respectively, adopt the default values of the William–Warnke strength model: fcb = 1.2fc, f1 = 1.45fc, f2 = 1.725fc. Therefore, the specific meanings and used values of the failure criterion parameters are shown in Table 2. These five parameters are sequentially assigned, through ANSYS TBDATA commands, to fully characterize the concrete failure criterion [31,32].

3.1.3. Load and Boundary Conditions

Since the overall prefabricated reinforced-concrete cylindrical accident oil tank is a new type of structure, the main task and technical objective of developing the new type of accident oil tank are to analyze and grasp the mechanical characteristics such as the structural stress, deformation, and cracking and failure mode, under the combined action of various loads, including the circumferential soil and water sidewall pressure, the buoyancy of the groundwater at the base of the tank, etc. It is necessary to find a structural form that can not only meet the functional requirements of the accident oil tank, but also ensure safety and durability under specific environmental load conditions. In general, the structural failure criterion is defined as concrete experiencing either tensile cracking or compressive crushing, which would compromise oil containment performance, with the corresponding load identified as the ultimate bearing capacity.
To simulate potential limit states in practical engineering applications, this study investigates the structural failure mechanisms under four combined working conditions, strictly following the Chinese design codes [20,21,22,23]: load case ① examines self-weight combined with internal hydrostatic pressure, simulating pre-backfill water testing conditions by applying an outward hydraulic pressure gradient of 9.80 kN/m2 on inner walls; load case ② evaluates self-weight and external soil pressure during the initial installation phase without backfill, imposing an inward soil pressure gradient of 18.50 kN/m2 on exterior walls; load case ③ shows normal operational conditions with a 2 m burial depth, incorporating self-weight, external soil pressure (18.50 kN/m3 inward gradient), surface surcharge from overburdened soil (37.50 kN/m2), and live loads (20.00 kN/m2) under empty containment scenarios; load case ④ assesses the worst-case groundwater interaction by combining self-weight, equivalent earth/surface loads from load case ③, and buoyancy forces (128.72 kN/m3) derived from maximum hydrostatic pressure and displaced water volume effects. These scenarios systematically cover construction, testing, operational, and extreme environmental phases, to evaluate structural resilience.
Boundary conditions are configured according to specific load cases. For load case ④, involving groundwater buoyancy effects, fixed constraints (UX = UY = UZ = 0) are applied at the top slab to simulate foundation restraint while allowing bottom slab deformation under buoyancy. Conversely, for conditions excluding groundwater buoyancy (load cases ①–③), fixed constraints are implemented at the bottom slab to represent soil support, with structural responses analyzed exclusively under superimposed loads to calculate the effect of the external load on the structure above the bottom plate.

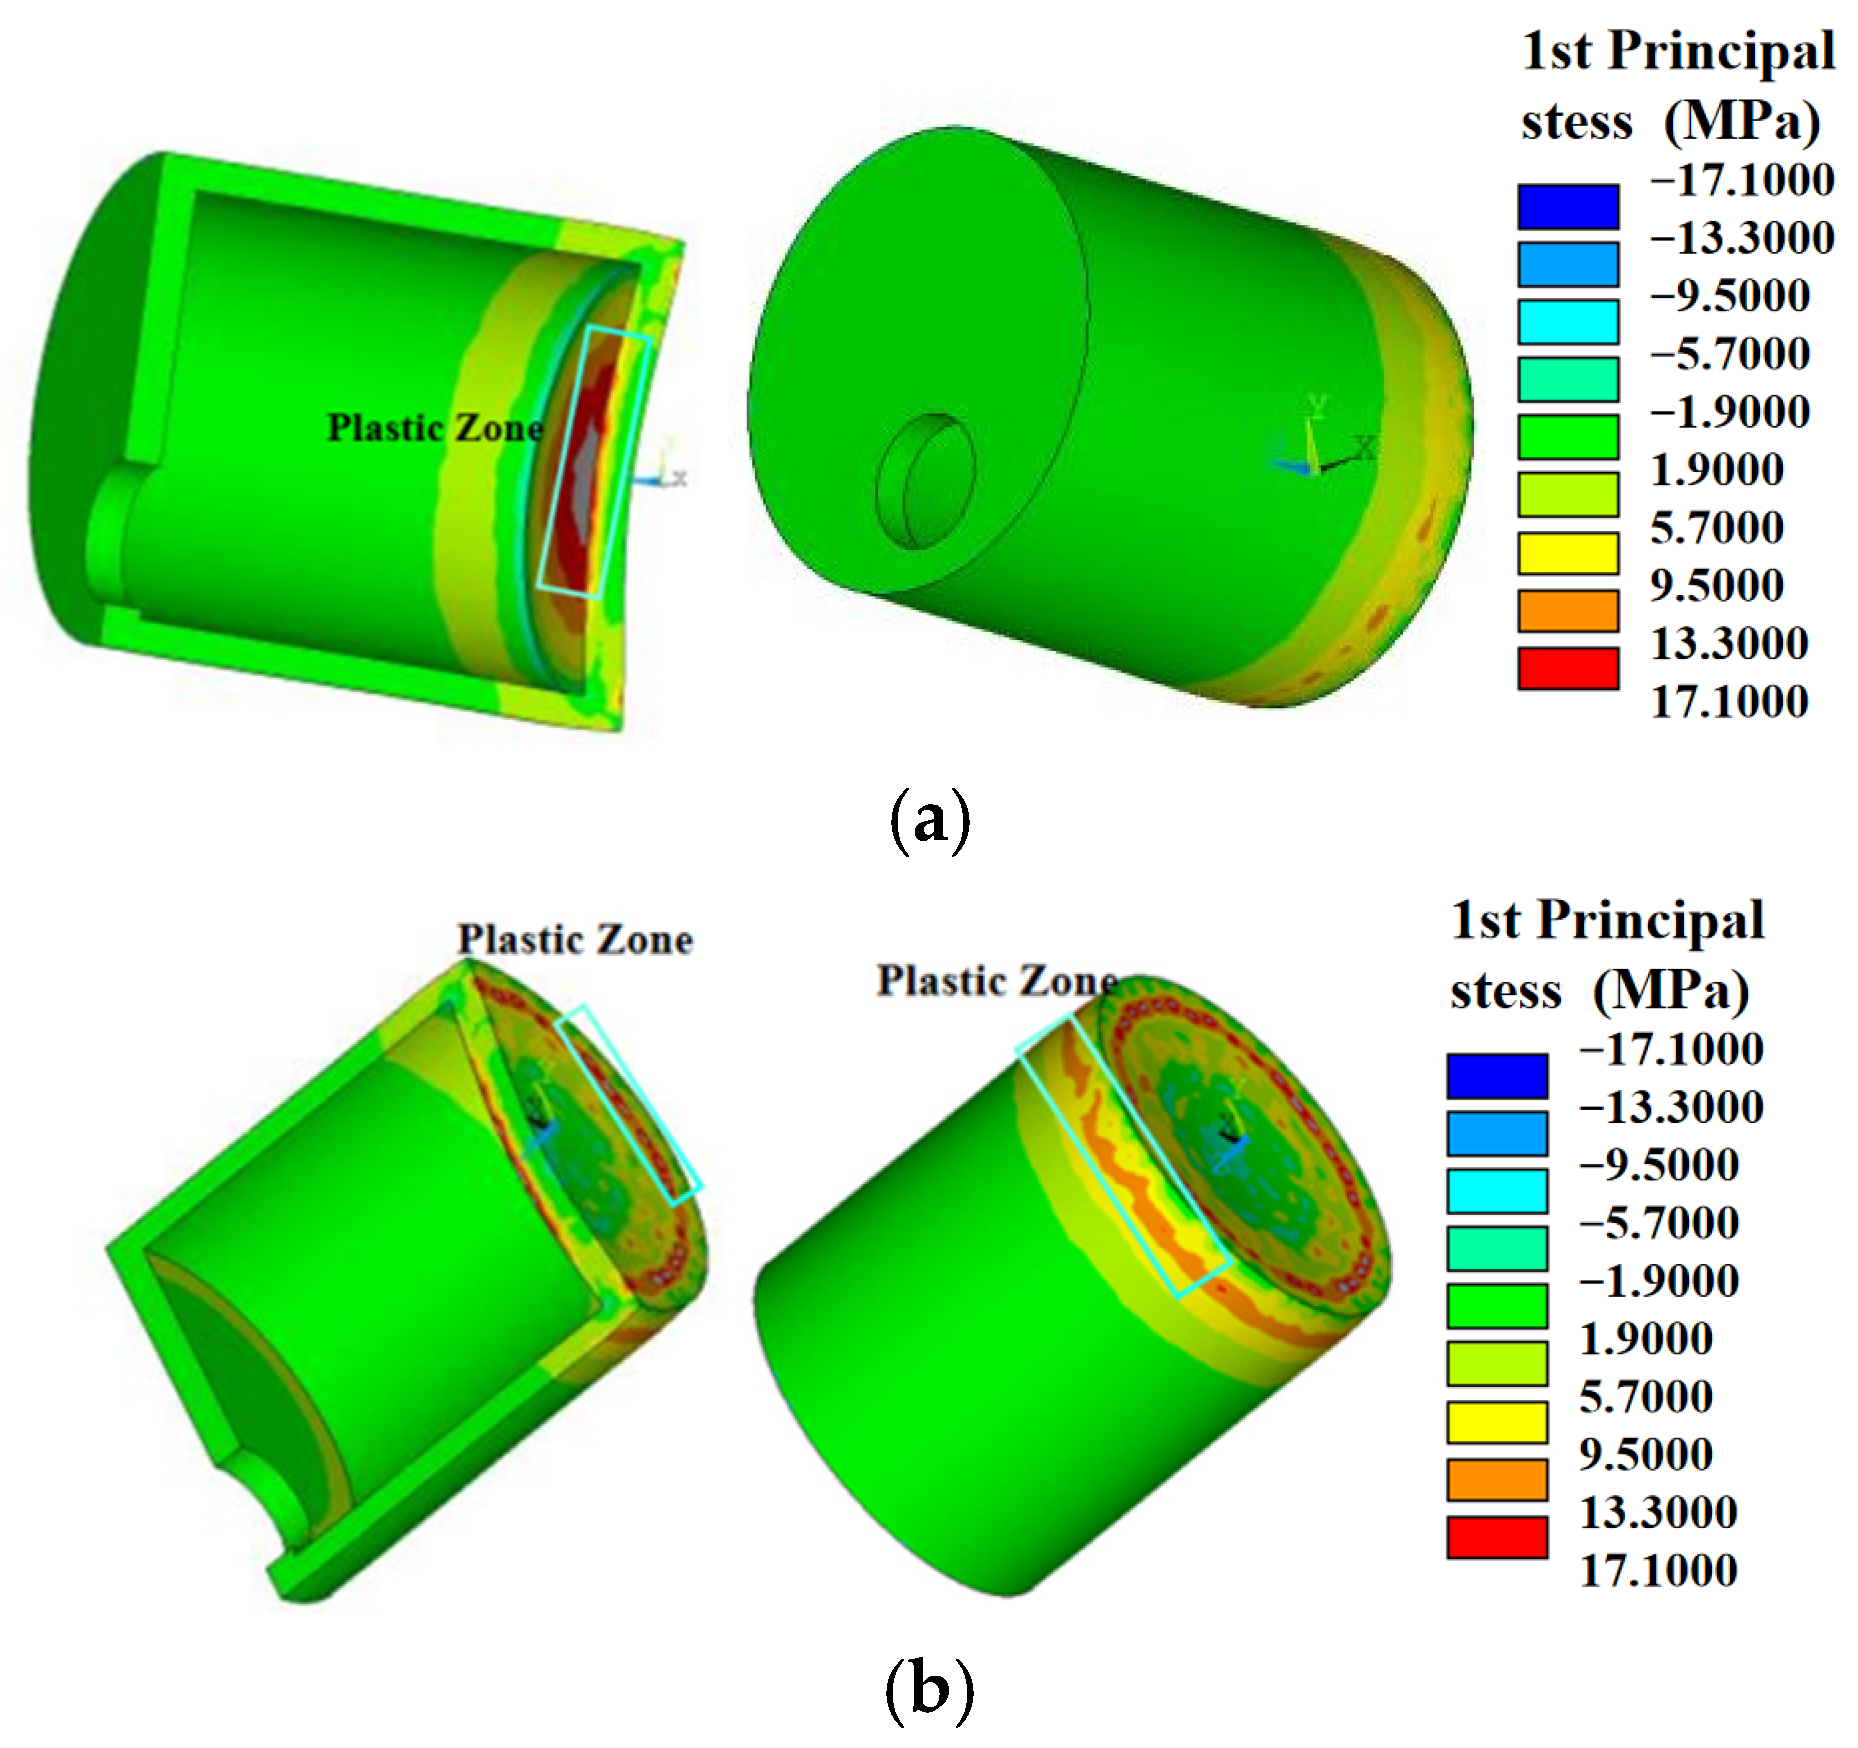
3.2. Analysis Results of Mechanical Characteristics

To investigate failure mechanisms, progressive load increments are applied across four combined working conditions. This methodology enables the identification of failure characteristics specific to each scenario and determination of the ultimate load capacity. For the accident oil tank, structural self-weight is categorized as permanent load, while hydraulic pressure, earth pressure, surcharge, and buoyancy are treated as variable loads. Consequently, the stress distributions, load–displacement evolution, and failure characteristics of the integral precast accident oil tank model under four load combinations are obtained after the finite element analysis. To critically assess containment integrity, symmetrically sectioned visualizations compare internal/external mechanical behaviors and identify concrete plastic zones compromising liquid tightness. Figure 3 delineates the progressive evolution of first principal-stress distributions within the precast concrete oil tank subjected to load case ① (self-weight + internal hydrostatic pressure) under incrementally elevated hydraulic loading. The visualization employs a dual-perspective approach: global external views illustrate macroscopic stress patterns, while symmetric cross-sections through the central longitudinal axis reveal internal stress states, particularly at the critical inner wall–baseplate junction. To isolate stress variations attributable exclusively to hydraulic loading, the invariant stress component from self-weight has been computationally excluded from all contour plots.
The stress progression in Figure 3 identifies three distinct failure thresholds, corresponding to specific pressure magnitudes. It should be noted that the value of the initial water pressure is 9.80 kN/m2. At 78.4 kN/m2 (8 times the initial water pressure), tensile stress concentration at the inner wall–baseplate interface attains 1.71 MPa, precisely equaling the tensile strength of C40 concrete. This signifies attainment of the tensile limit state and initiation of microcracking within this localized region, though no visible damage propagation occurs beyond the junction zone. Subsequent pressure elevation to 98.0 kN/m2 (10 times the initial water pressure) induces expanded tensile yielding at the interface, manifested by observable crack propagation, which confirms full utilization of the inner wall’s tensile capacity. Further intensification to 107.8 kN/m2 (11 times the initial water pressure) exceeds material limits, triggering macrocrack formation at the junction concurrent with outer-wall tensile failure—collectively indicating structural collapse. This sequential stress accumulation demonstrates that the inner wall–baseplate junction functions as the primary failure origin, due to its inherent stress concentration. Consequently, this region is designated the characteristic monitoring location, serving both as the locus of peak stress manifestation during loading progression and the initial indicator of damage evolution, critical to liquid containment integrity. Figure 4 demonstrates the displacement evolution at this characteristic point under increasing hydraulic pressures. The displacement exhibits progressive growth with load escalation, showing accelerated deformation rates beyond 5 times the initial pressure (49.0 kN/m2), where structural stiffness degradation becomes evident, culminating in a maximum displacement of 0.06 mm.
Figure 5 presents the first principal-stress nephogram of the accident oil tank under different external soil pressures in load case ②. The analysis reveals that under self-weight and initial soil pressure (18.5 kN/m2), when the external soil pressure increases to 7 times the initial value, the maximum first principal stress in the upper external wall concrete reaches the tensile strength limit of concrete (1.71 MPa). This phenomenon may be attributed to the intensified compressive stress in the lower section induced by increasing external soil pressure, resulting in tensile cracking of the upper cylindrical wall. With continued pressure escalation, the plastic zone progressively expands through the structure. The concrete at the inspection shaft entrance subsequently attains its tensile limit, indicating further tensile stress redistribution caused by intensified lower-section compression. When the external soil pressure reaches 8.8 times the initial value, both inner and outer wall concrete elements achieve the tensile strength of C40 concrete (1.71 MPa), marking structural failure initiation. Considering the predominant compressive state in the lower-tank section and the vulnerability of roof center concrete to cracking, this critical failure point is selected as the characteristic monitoring location. Figure 6 illustrates the maximum displacement evolution at this representative point, under varying soil pressures. The plot demonstrates progressive displacement amplification with pressure increments. Notably, when the internal water pressure attains 7 times the initial soil pressure (129.50 kN/m2), abrupt stiffness degradation occurs with accelerated displacement growth, ultimately reaching 0.10 mm final deformation. It should be noted that this stiffness mutation indicates significant structural performance deterioration under critical working conditions.
Figure 7 displays the first principal-stress nephogram of the accident oil tank under varying external soil pressures and top loads, in load case ③. When accounting for self-weight, external soil pressure, and roof loading, these combined actions can be collectively termed external loading, with an initial magnitude of 76.00 kN/m2. The analysis demonstrates that when the combined external loading (soil pressure and top load) reaches twice the initial value, the maximum first principal stress in the internal concrete of the roof slab attains the tensile strength limit (1.71 MPa). With continued loading increments, the external concrete surfaces of the roof slab and sections of the outer walls progressively reach their tensile limits, as the external loading increases to 7 times the initial value (532.00 kN/m2), at which point structural failure is considered to occur. Given the susceptibility to cracking in the internal roof concrete, this critical failure zone is designated as the characteristic monitoring point. Moreover, Figure 8 illustrates the maximum displacement evolution at this representative location, under varying external loads. This plot reveals a quasi-linear relationship between external loading soil pressure and top load, and structural displacement, with the deformation stiffness remaining nearly constant throughout the loading process. The ultimate displacement reaches 0.6 mm, indicating controlled structural deformation characteristics under this operational scenario, prior to failure initiation.
Figure 9 displays the first principal-stress nephogram of the accident oil tank under varying external soil pressures and buoyancy forces in load case ④. Under the combined actions of self-weight, soil pressure, and buoyancy (with constraints applied at the roof slab and buoyancy calculated as the total displaced water mass, assuming maximum groundwater level), the buoyancy force and external soil pressure are collectively termed external loading, yielding an initial magnitude of 184.72 kN/m2. The results indicate that, when simultaneously increasing external soil pressure and buoyancy to just 1.25 times the initial values (230.90 kN/m2), the internal base slab concrete attains its tensile strength limit (1.71 MPa). This premature failure likely stems from vertical upward forces exerted by buoyancy at the tank’s base, generating tensile stresses that induce cracking in the internal slab concrete. Upon reaching 1.5 times the initial external loading (277.08 kN/m2), the external base slab concrete also achieves its tensile limit, marking structural failure. Given the critical vulnerability of the base slab’s central region to cracking, this failure zone is designated as the characteristic monitoring point. Figure 10 illustrates the maximum displacement evolution at this representative location, under varying external loads. The data reveals a linear proportionality between external loading (soil pressure and buoyancy) and structural displacement, with deformation stiffness remaining essentially unchanged throughout the loading process. The ultimate displacement reaches 0.4 mm, demonstrating controlled deformation characteristics prior to failure under this operational scenario.

4. Structural Optimization of Prefabricated Composite Monolithic Accident Oil Tanks

The structural optimization of prefabricated composite monolithic accident oil tanks aims to balance structural safety and economy. Key parameters (longitudinal reinforcement ratio, thickness-to-diameter ratio, height-to-diameter ratio, and concrete-strength grade) are selected, as they govern structural stiffness/strength and exhibit strictly positive correlation with construction cost (e.g., higher values increase material costs). Multi-parameter optimization based on linear–elastic finite element analysis is implemented to minimize peak stress and displacement (ensuring structural safety), while parameter-cost dependency is leveraged for indirect cost control.

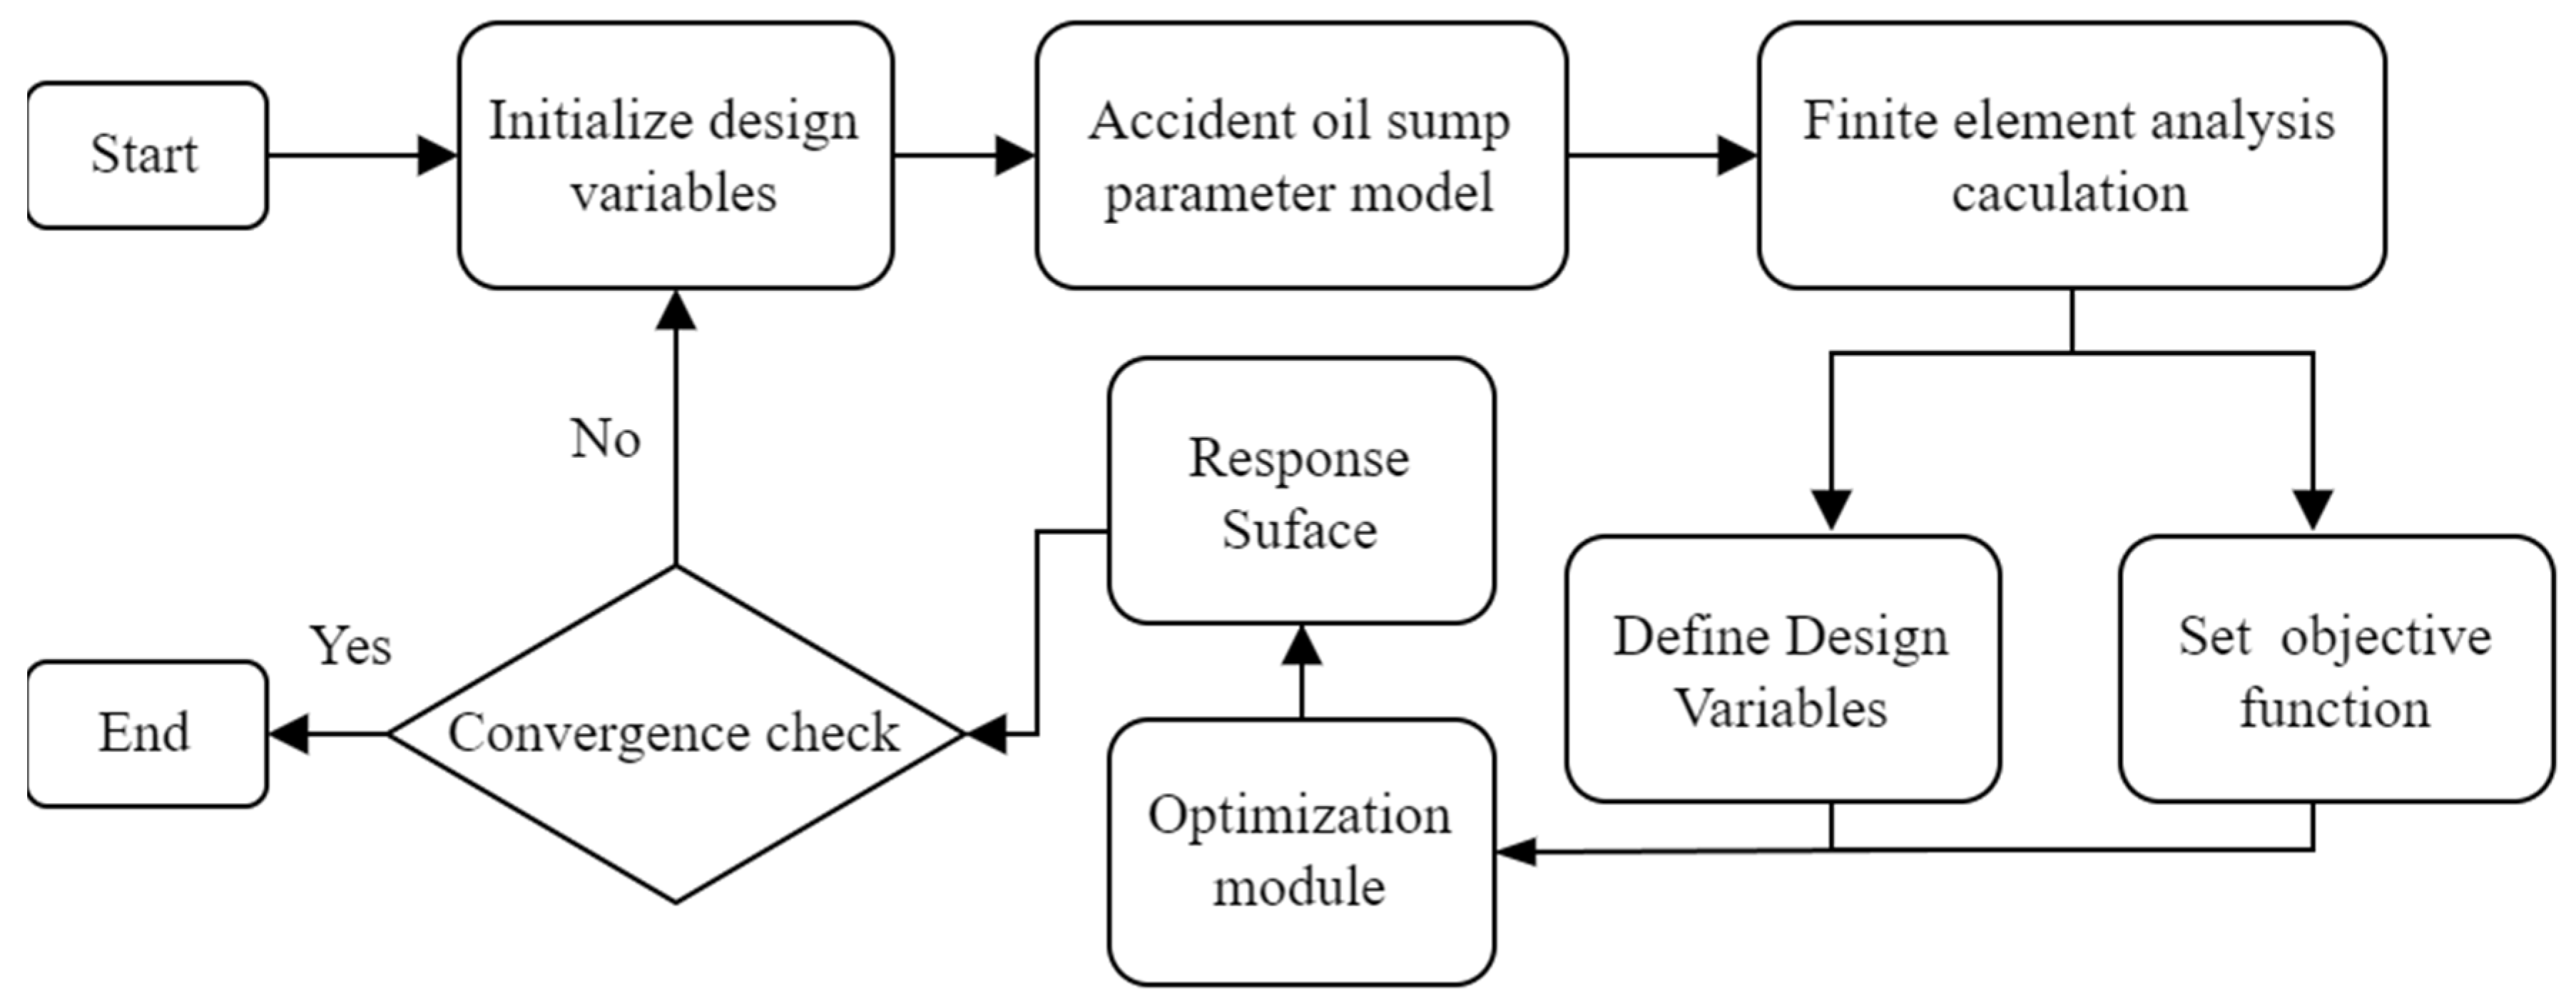
4.1. Optimized Design Process

In Ansys Classic, parametric optimization analysis is implemented through its native Design OPT module, although in versions post-Ansys 14.0 this functionality has been integrated into the Workbench platform, which exhibits significant differences from Classic in interface layout and operational workflows while maintaining identical finite element solvers. Consequently, the present multi-variable, multi-objective parametric optimization analysis is conducted within the Workbench environment. The optimization process adheres to the fundamental principle of identifying conditional extrema of an objective function under structural performance constraints. First, designating key geometric and material parameters as design variables. Second, imposing state variables to enforce critical performance requirements (e.g., maximum stress is less than allowable stress). Third, minimizing the objective function (e.g., total structural mass or compliance) within the constrained design space. Moreover, the response surface method is strategically selected to address this multi-variable constrained optimization problem, leveraging its capacity for efficient global sampling and sensitivity analysis. Therefore, the detailed optimization process can be listed as follows [33,34].
Step 1: Establishing the finite element model
Within Ansys Workbench, finite element modeling cannot be performed using APDL commands. This study employs manual modeling through the Design Modeler module, with critical structural dimensions influencing design variables parameterized in the Parameters module.
Step 2: Selection of design variables and objective function
Optimization design in Ansys Workbench requires the definition of design variables—parameters subject to modification during optimization—along with their specified value ranges. Subsequently, the objective function is established through initial finite element computation under designated load cases, referencing the baseline model parameters defined in Section 3. The maximum displacement obtained under these operational constraints serves as the optimization criterion. Fundamentally, the optimization process seeks the optimal solution for the objective function within defined variable constraints.
Step 3: Selection of optimization iteration methodology
Following the determination of design variables and objective functions, appropriate optimization methods and iteration counts are selected, based on the computational demand of the model. This strategic selection enhances optimization effectiveness while accelerating computational convergence. The optimization module within Ansys Workbench is employed to execute computations, commencing with defining value ranges for all design variables, followed by algorithm selection. The platform provides multiple optimization algorithms, including the response surface method, the Multi-Objective Genetic Algorithm (MOGA), Nonlinear Programming by Quadratic Lagrangian (NLPQL), and Mixed-Integer Sequential Quadratic Programming (MISQP) [35]. Each algorithm exhibits distinct strengths and limitations in computational efficiency and solution precision, requiring targeted selection based on specific optimization requirements. This study adopts the response surface method, which proves particularly effective for preliminary optimization stages. It rapidly identifies near-optimal solutions through systematic design space sampling, establishing robust foundations for subsequent refined optimizations.
Step 4: Dedicated optimization modules for distinct objectives
In terms of optimization procedures, first conduct direct optimization using the optimization module for each operating condition, aiming to compare the impacts of various parameters. Subsequently, perform structural response surface optimization [36], through which the optimal model and refined optimization results are obtained, based on the established response surface characteristics.
The optimization design flowchart is illustrated in Figure 11.

4.2. Optimization Variables and Methodology

The present optimization study primarily investigates the influence of variations in four key parameters on the first principal stress of the oil tank:
Reinforcement diameter: from 10 mm to 20 mm.
Thickness-to-diameter ratio: from 140/2100 to 220/2100.
Height-to-diameter ratio: from 2600/2100 to 3400/2100.
Concrete grade: form C20 to C70.
In Ansys Workbench, the optimization design process necessitates prior definition of design variables, specifically the above four key parameters. These are computationally implemented as Longitudinal reinforcement radius, Outer boundary radius of the model, Structural height, Concrete mass density, and Concrete elastic modulus. The value ranges of these variables during optimization are detailed in Table 3, with upper/lower limits determined by practical engineering specifications. The optimization criterion is defined as the first principal stress and global maximum displacement of the structure under all operational scenarios and associated boundary constraints. The optimization objectives are minimizing extreme values of principal stress and total displacement through an extremum minimization framework, targeting these response parameters. Within the Ansys Workbench environment, the response surface methodology from the Manual optimization suite is adopted. The sampling strategy is configured with a statistically significant sample size of 30 design points, followed by 10 iterative cycles, to ensure solution convergence stability.

4.3. Parametric Investigation of Structural Systems Under Multifaceted Operational Cases

This section systematically examines the ultimate equilibrium states of accident oil tanks under various operational scenarios, with particular focus on parametric influences governing static performance, employing a baseline model configured with the following: Reinforcement diameter: 14 mm, Thickness-to-diameter ratio: 160/2100, Height-to-diameter ratio: 2800/2100, and Concrete grade: C40. The investigation adopts a controlled univariate parametric analysis methodology. The four critical parameters identified– reinforcement cross-section, dimensional proportions (thickness/height-to-diameter ratios), and concrete material grade—are sequentially modified, while maintaining other variables constant. Sensitivity analysis quantified each parameter’s impact on maximum principal stress and displacement, establishing threshold values for safety compliance and low-cost design.

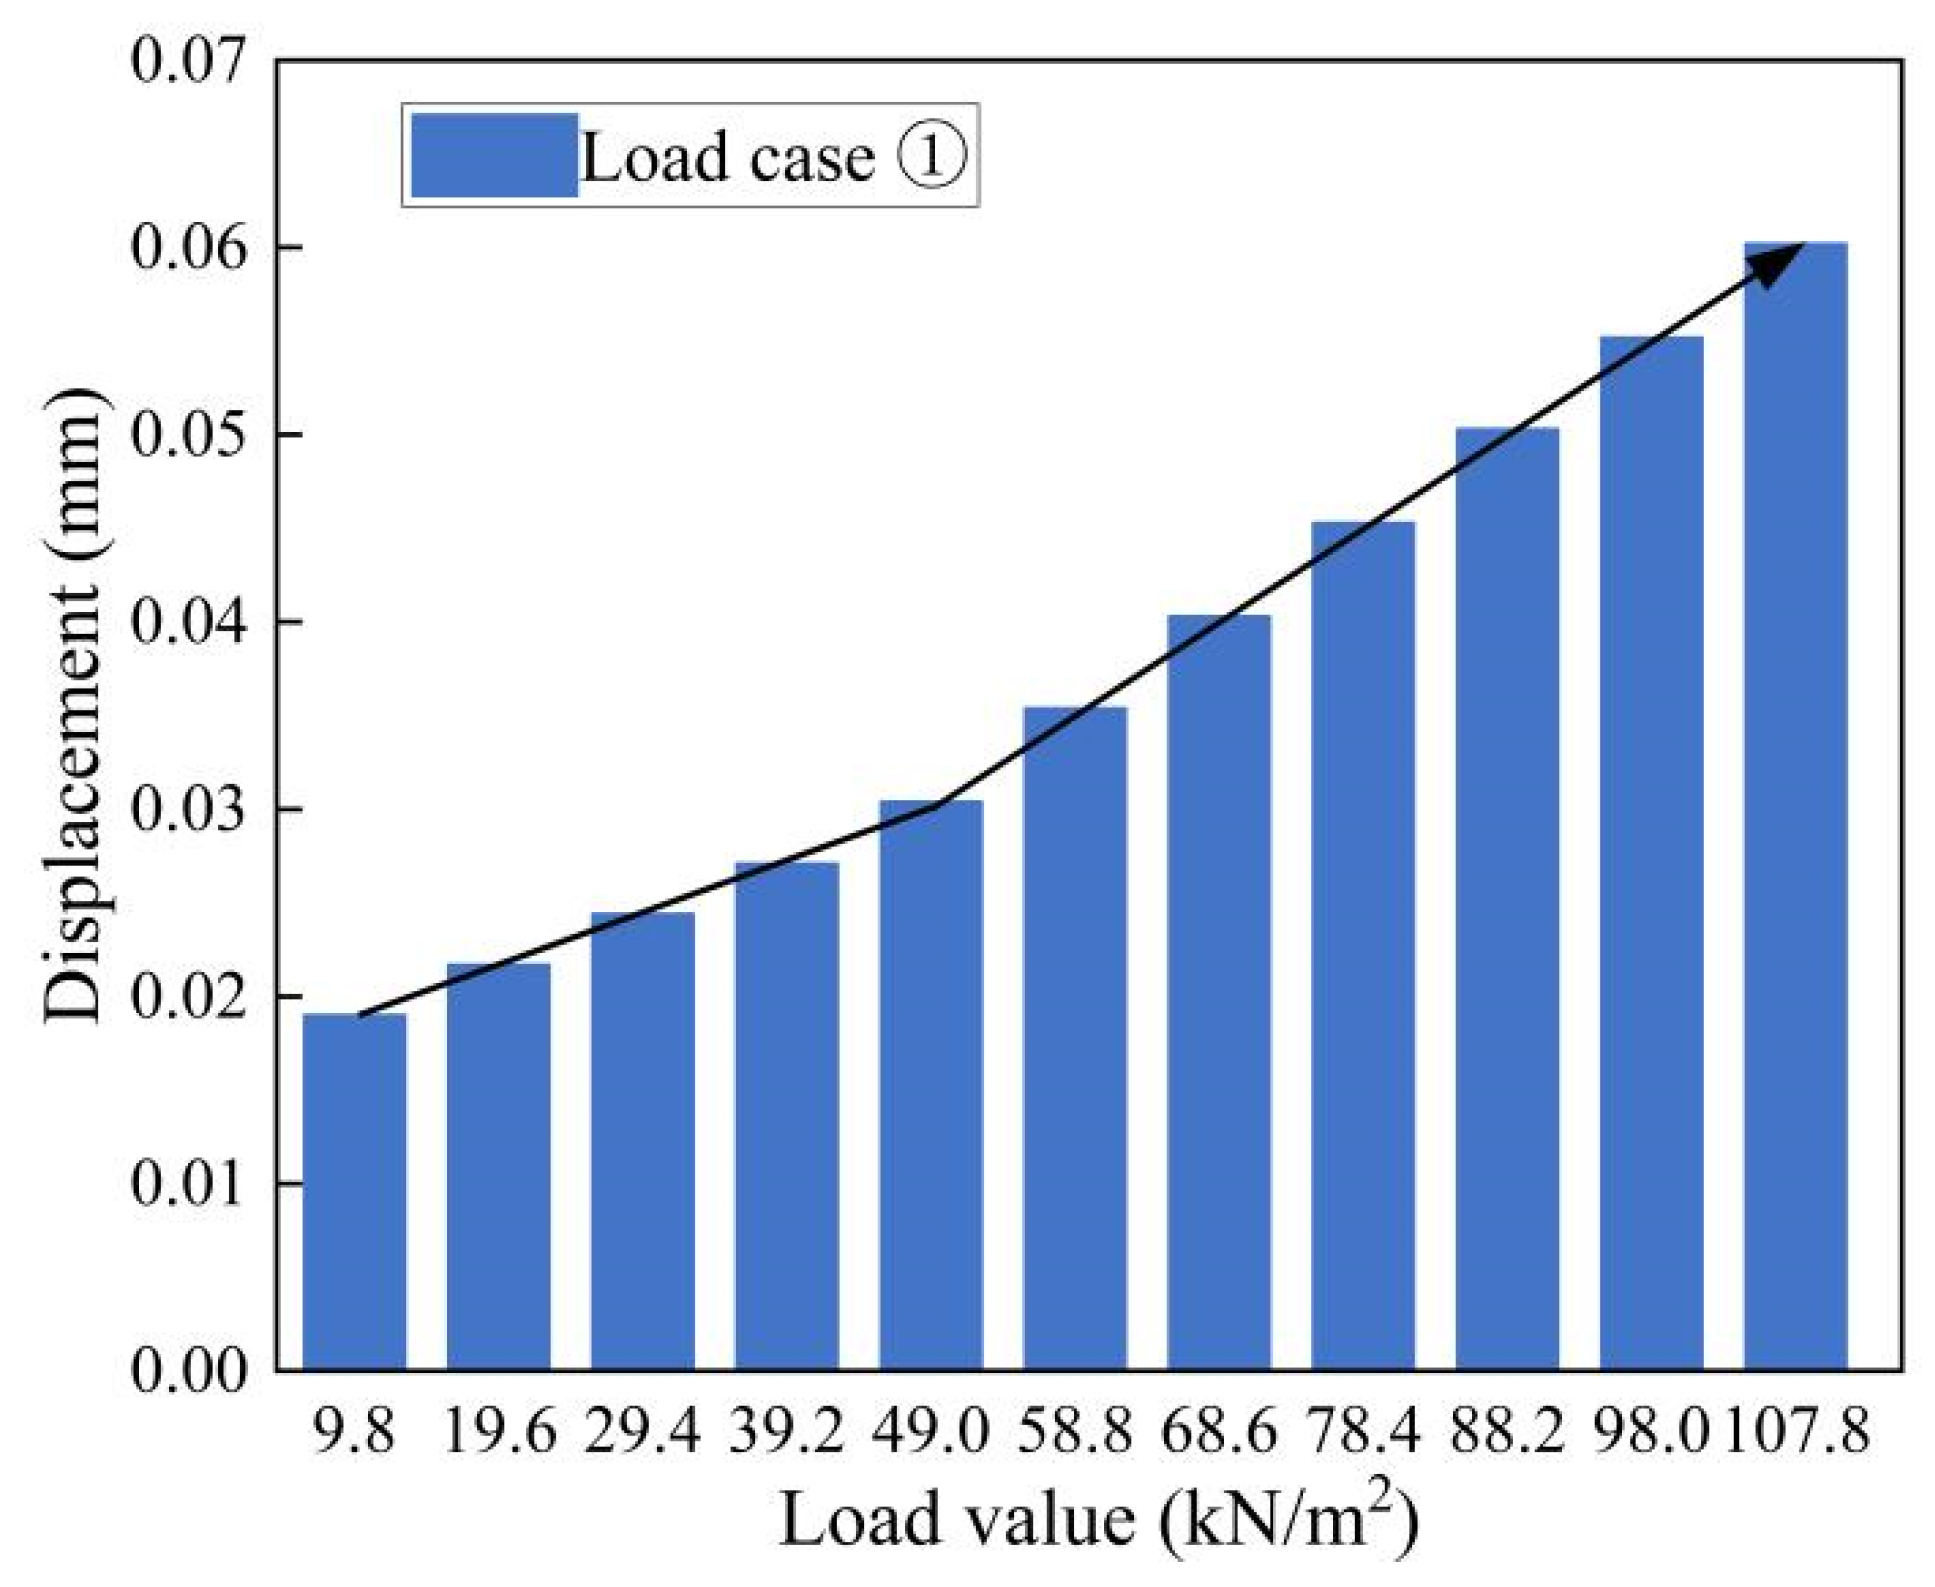
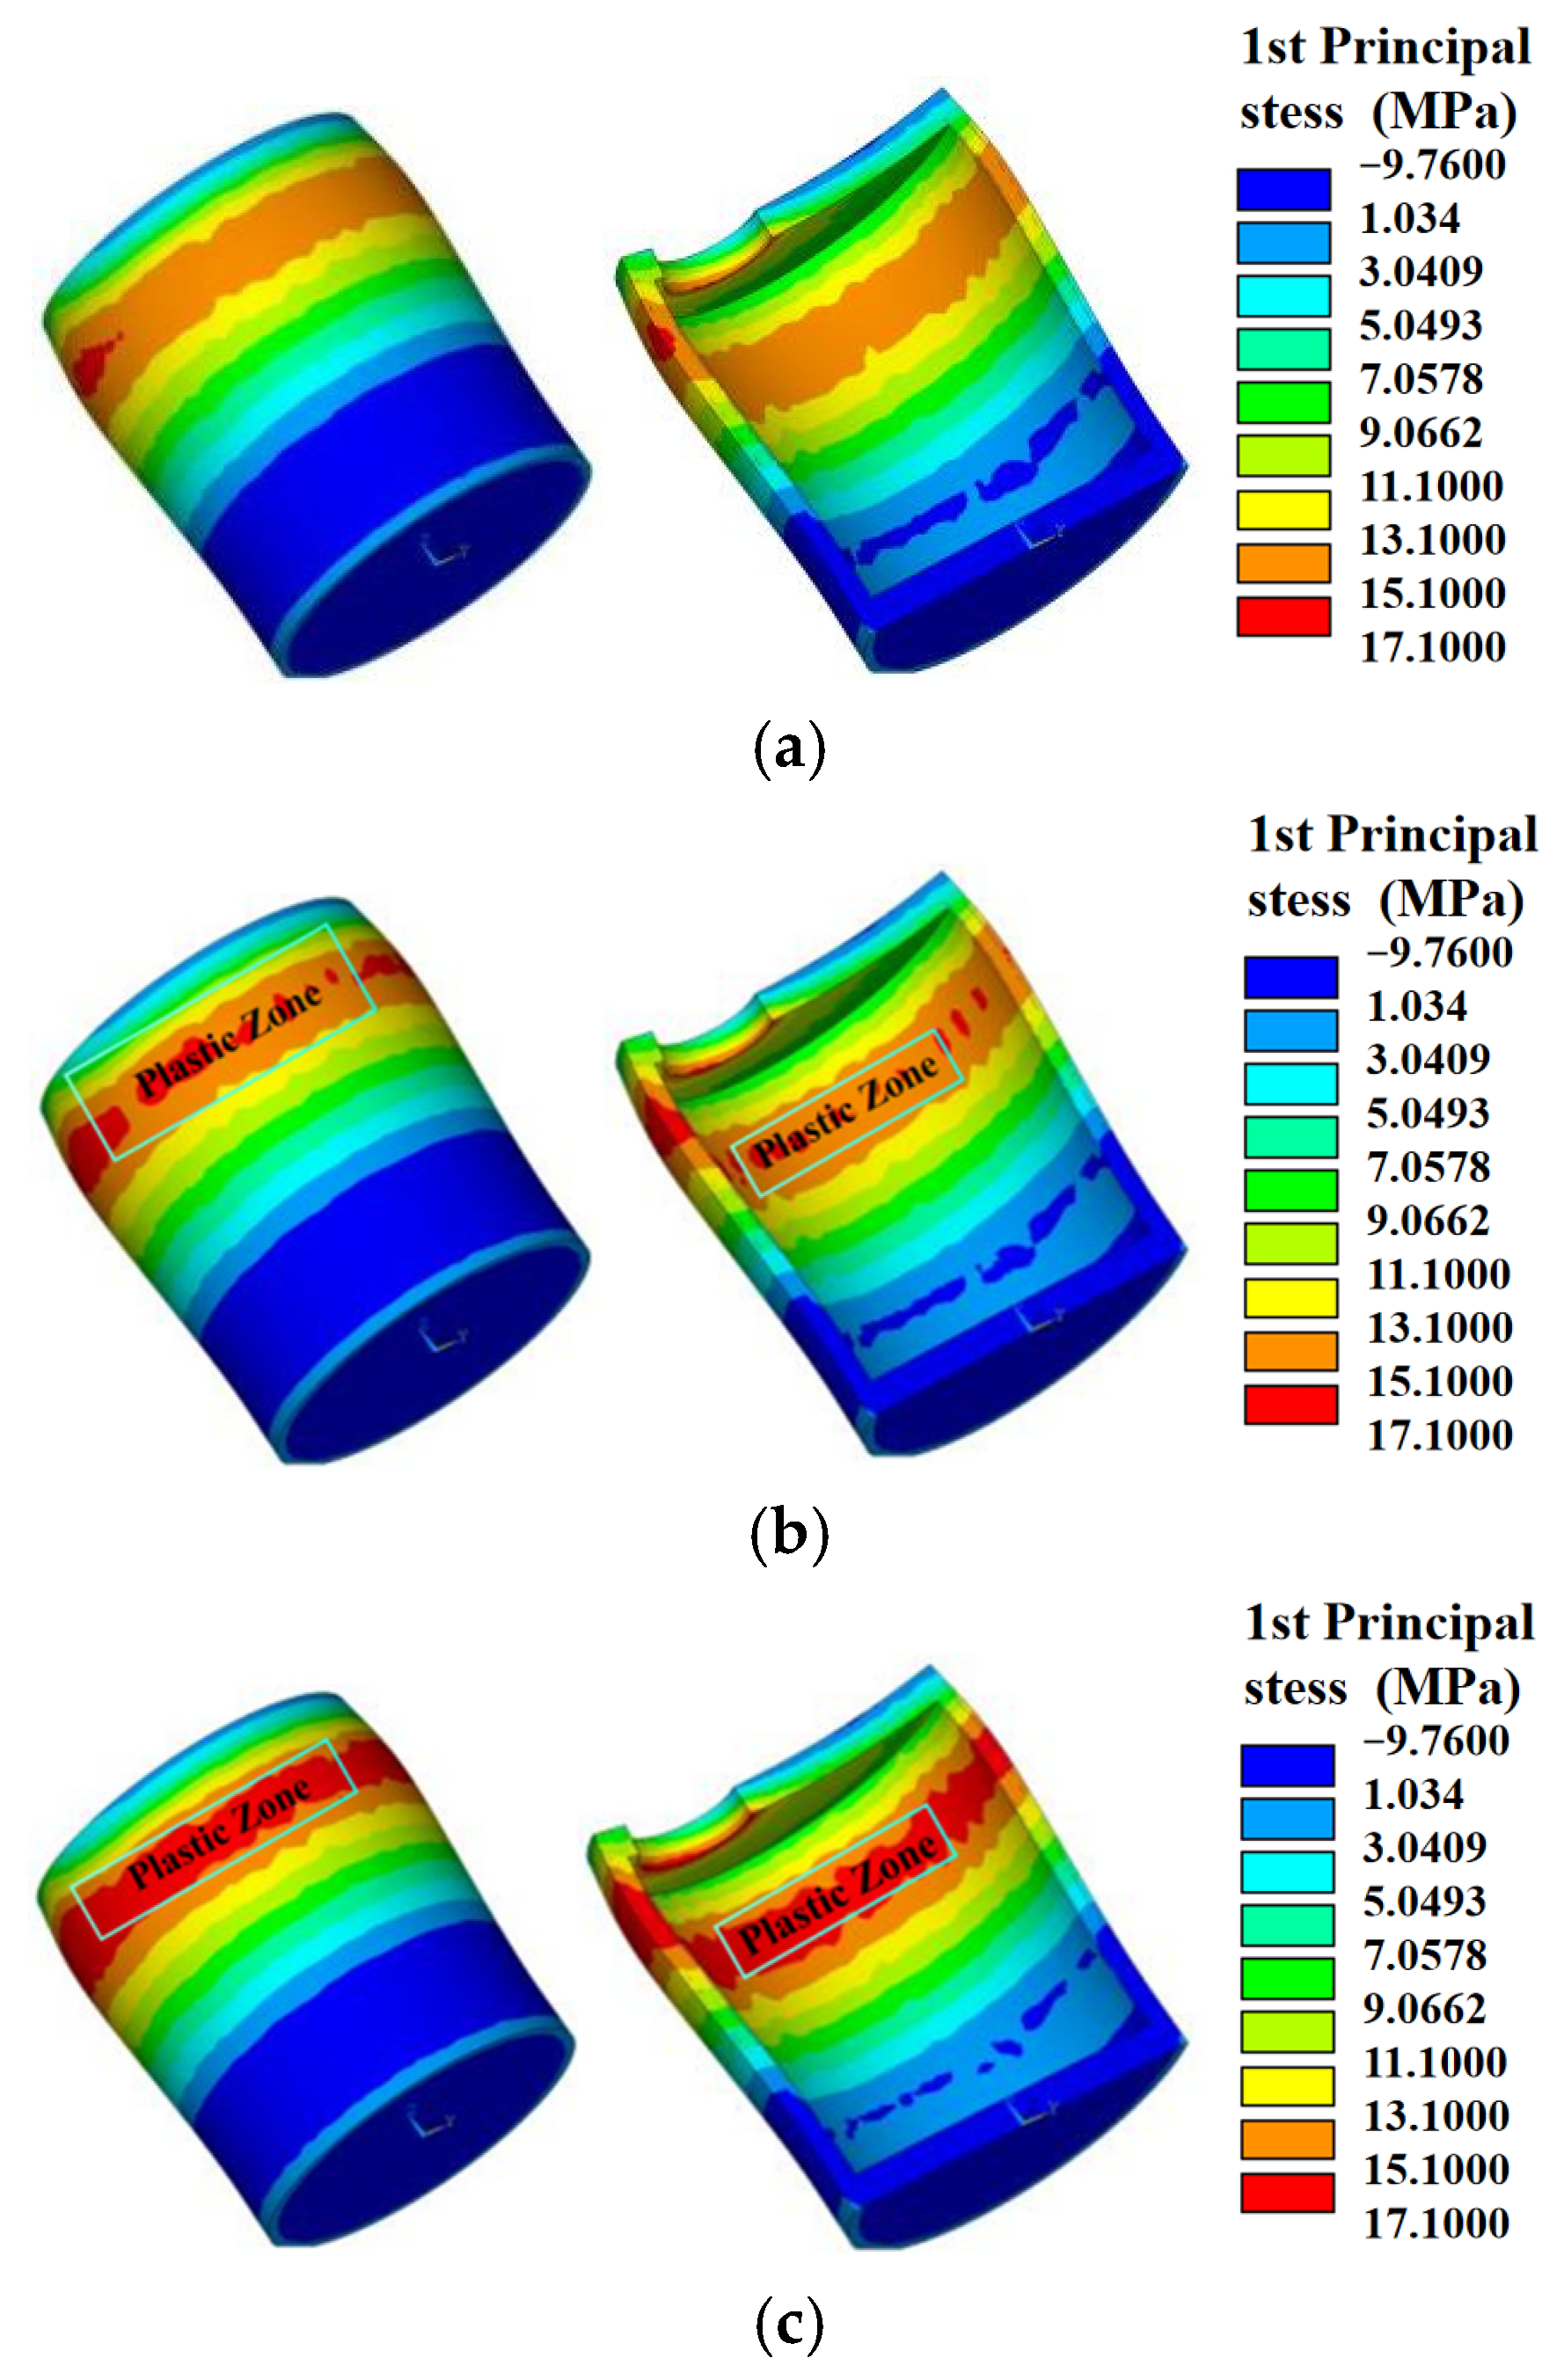
4.3.1. Load Case ①: Dead Load + Internal Hydrostatic Pressure

Through systematic parameter variation within the constrained ranges specified in Table 4, the evolving trends of maximum principal stress fields and global displacement distributions under load case ① are quantitatively captured in Figure 12 and Figure 13. Intersection points along the parametric response curves denote baseline model reference values for concrete’s critical stress states and structural deformation thresholds.
It can be observed that, under self-weight and internal water pressure, the maximum principal stress in concrete decreases with the increase in reinforcement diameter, thickness–diameter ratio, and height. Among these factors, the thickness–diameter ratio demonstrates the most significant influence. When the wall thickness reaches 220 mm, the maximum first principal stress in concrete decreases by approximately 12%, compared to the baseline model. This occurs because the structure is subjected to outward internal pressure, causing the inner-wall concrete to experience compression. Increasing the wall thickness enlarges the tensile zone area in the concrete. Conversely, the maximum principal stress in concrete continuously increases with improvements in concrete grade.
Enhancements in wall thickness and concrete grade significantly affect the overall displacement increase. When the wall thickness is 220 mm, the overall displacement decreases by about 14%, compared to the baseline model. Changes in reinforcement diameter show negligible impact on displacement, while increasing height conversely reduces displacement. This indicates that when the inner wall experiences outward compression, appropriately increasing wall thickness and improving concrete grade can effectively enhance structural stiffness.

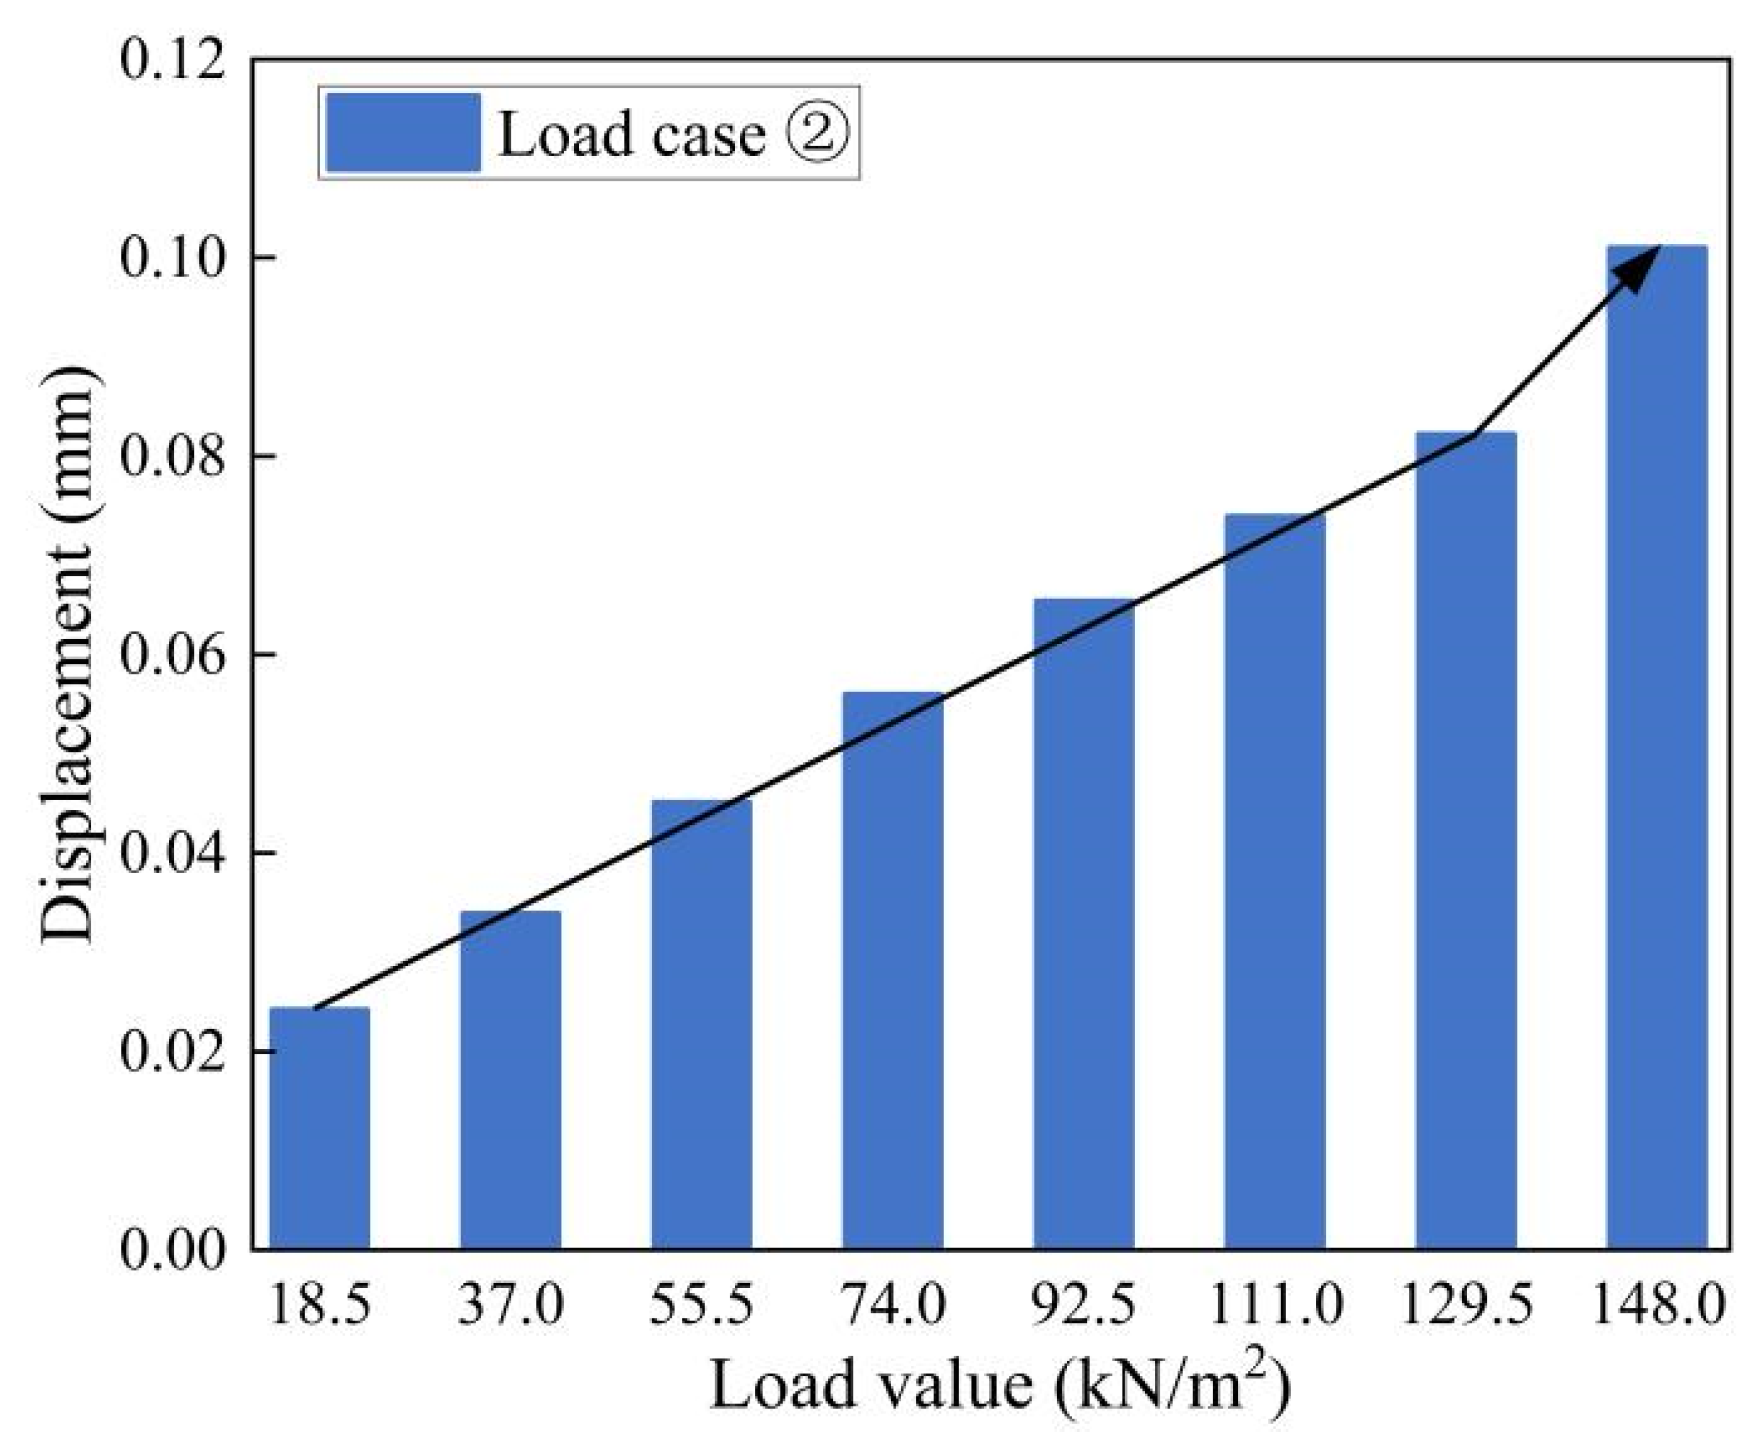
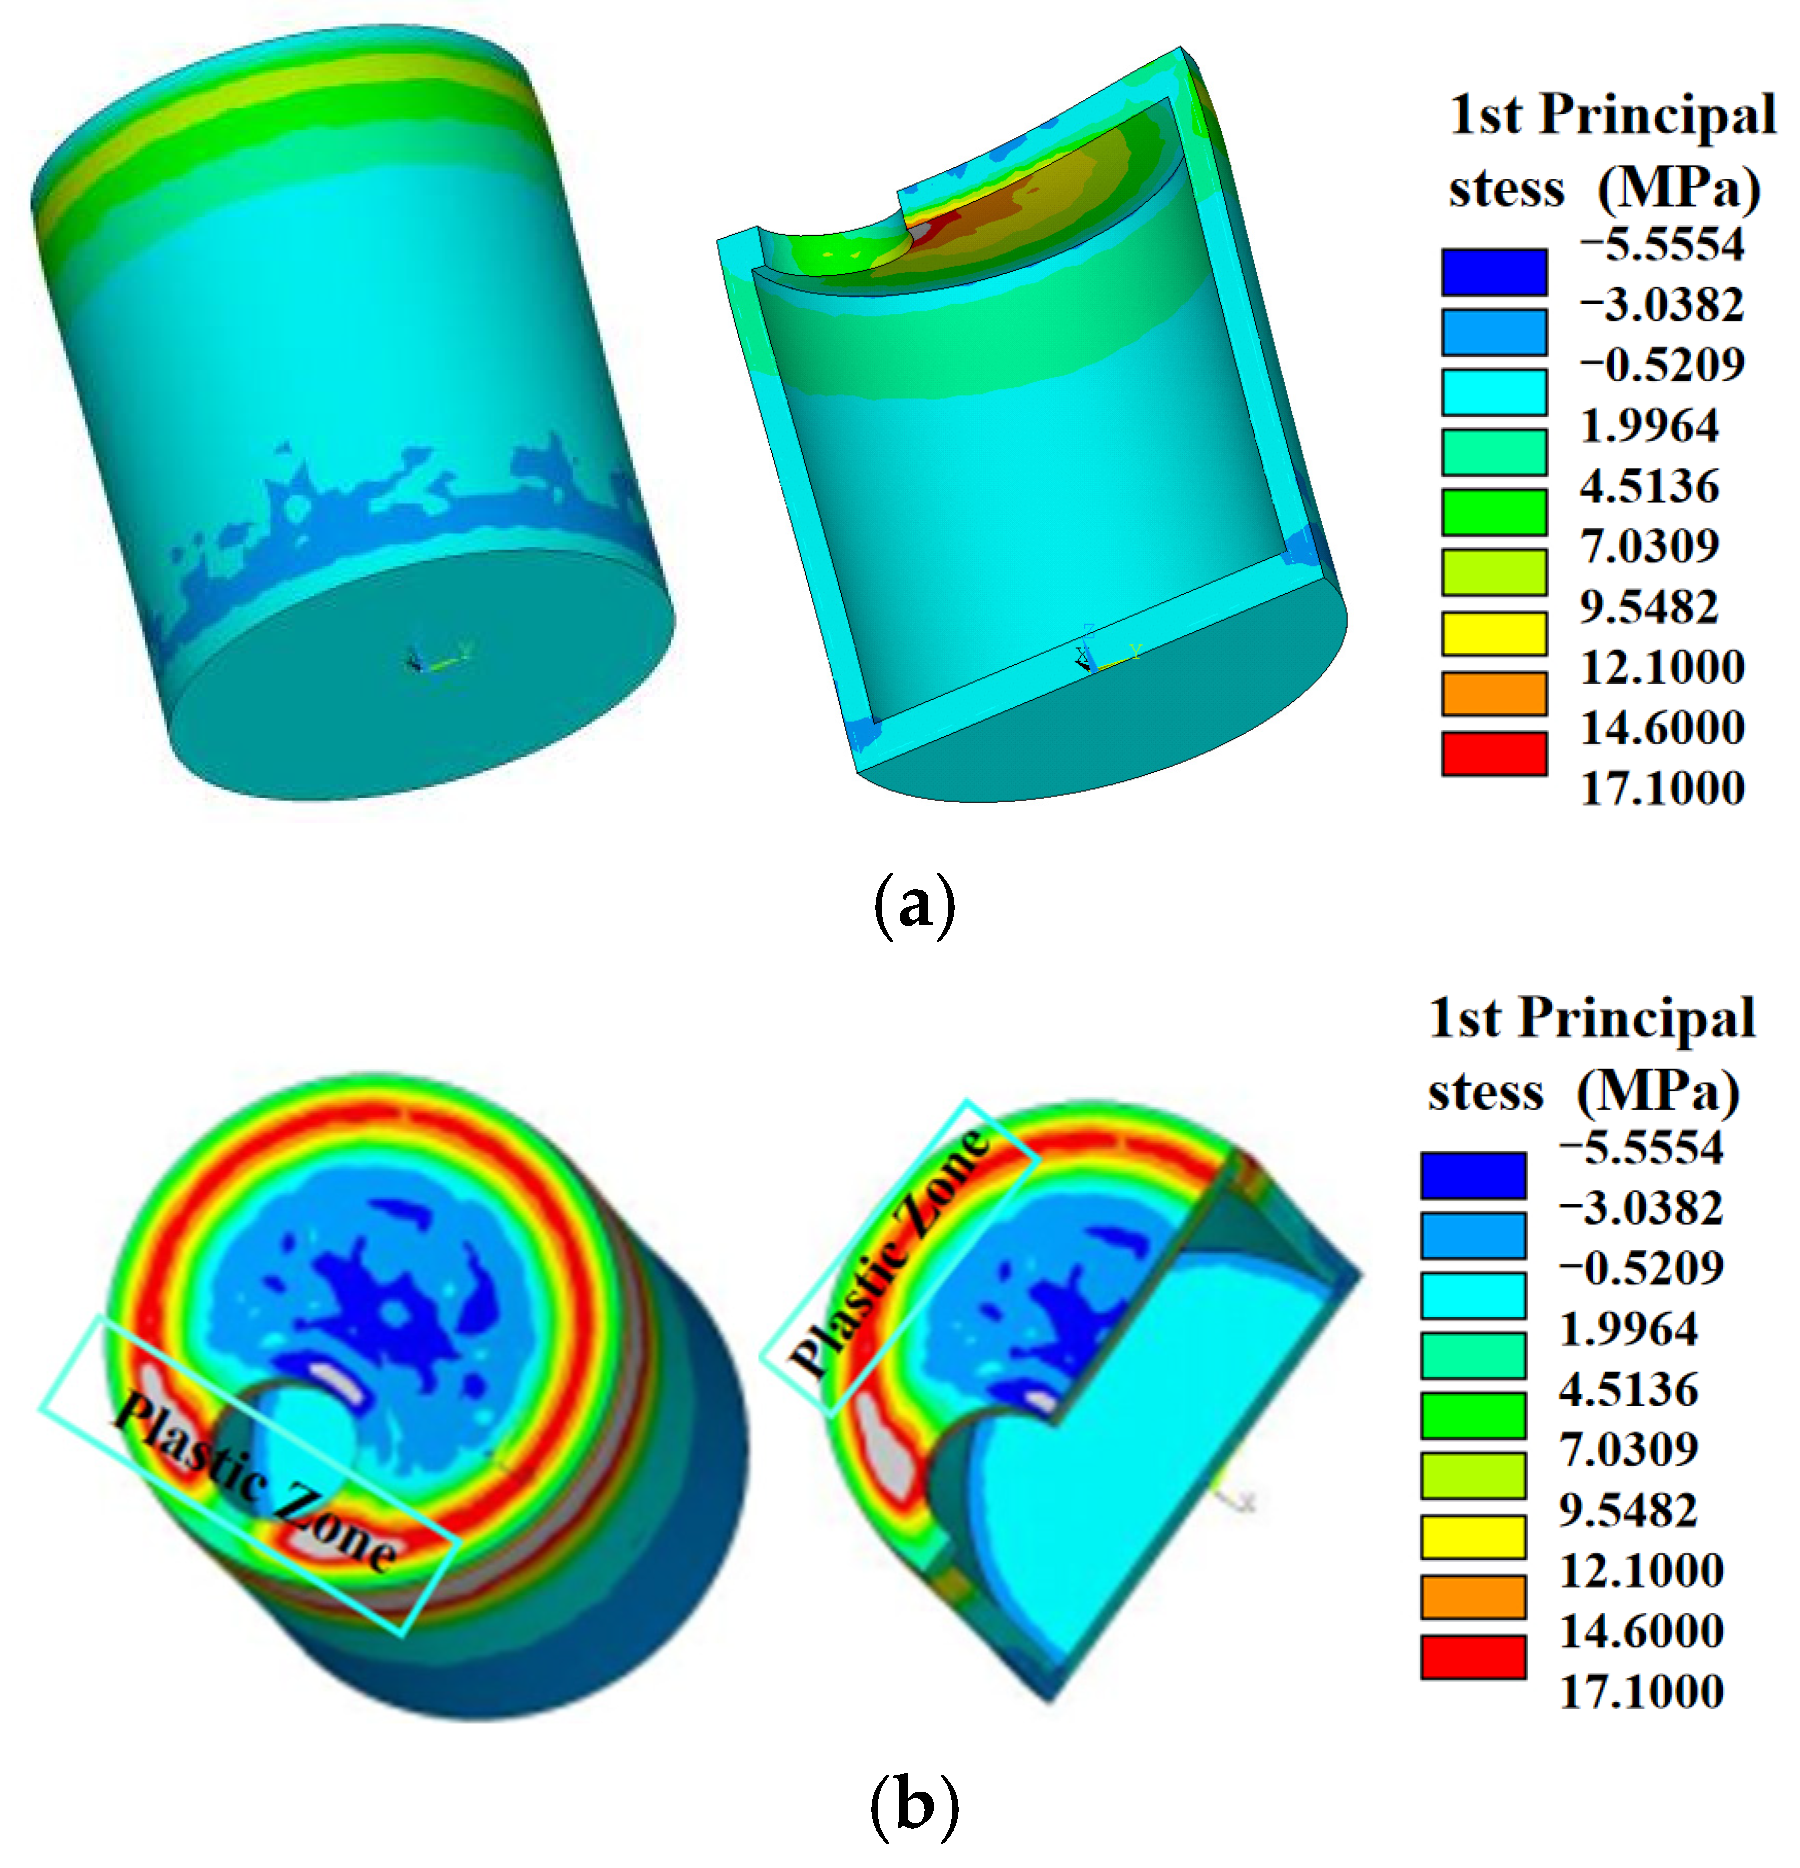
4.3.2. Load Case ②: Dead Load+ External Soil Pressure

Systematic parameter perturbation within the constrained ranges defined in Table 4 yields the evolving trends of maximum principal stress fields and global displacement distributions under load case ②, as quantitatively mapped in Figure 14 and Figure 15. Intersection nodes across parametric response curves denote baseline reference values for concrete’s critical stress states and structural deformation thresholds.
Notably, the rebar diameter and concrete-strength grade show no significant impacts on the maximum principal stress in Figure 14a. The non-monotonic trend observed in Figure 14b under load case ② may potentially stem from interactions between the geometry of the precast concrete shaft and soil mechanics principles. The initial stress increase observed at wall thicknesses between 120 mm and 140 mm may result from the expansion of concrete compression zones within the hoop-reinforced wall section. The subsequent plateau in the range of 140 mm to 160 mm wall thickness could signify a transient state of equilibrium, where enhanced radial stiffness may balance the redistribution of earth pressure, potentially maximizing the efficiency of the hoop reinforcement. The rapid increase in stress at wall thicknesses above 160 mm may reflect effects associated with increased wall thickness: excessive structural rigidity could impede stress redistribution within the surrounding soil, potentially causing internal stress concentration. Height-dependent non-monotonic behavior may manifest characteristics of the buried shaft. For shaft heights below 2600 mm, insufficient burial depth may weaken soil arching effects, leading to a mild stress reduction. At heights between 2600 mm and 3000 mm, increased structural slenderness may induce bending moments that generate tensile zones in the upper-wall sections. For shaft heights above 3000 mm, nonlinear earth pressure distribution may redistribute loads towards the shaft base, thereby releasing stresses in the upper-wall regions.
Moreover, the rebar diameter and concrete-strength grade show some impacts on the maximum displacement in Figure 15a. The increase in wall thickness demonstrates the most pronounced effect on reducing overall displacement in Figure 15b. At a wall thickness of 220 mm, the overall displacement decreases by about 23%, relative to the baseline model. In contrast, changes in height have virtually no influence on overall displacement. This indicates that, when considering external wall compression, increasing both height and wall thickness can effectively enhance structural stiffness.

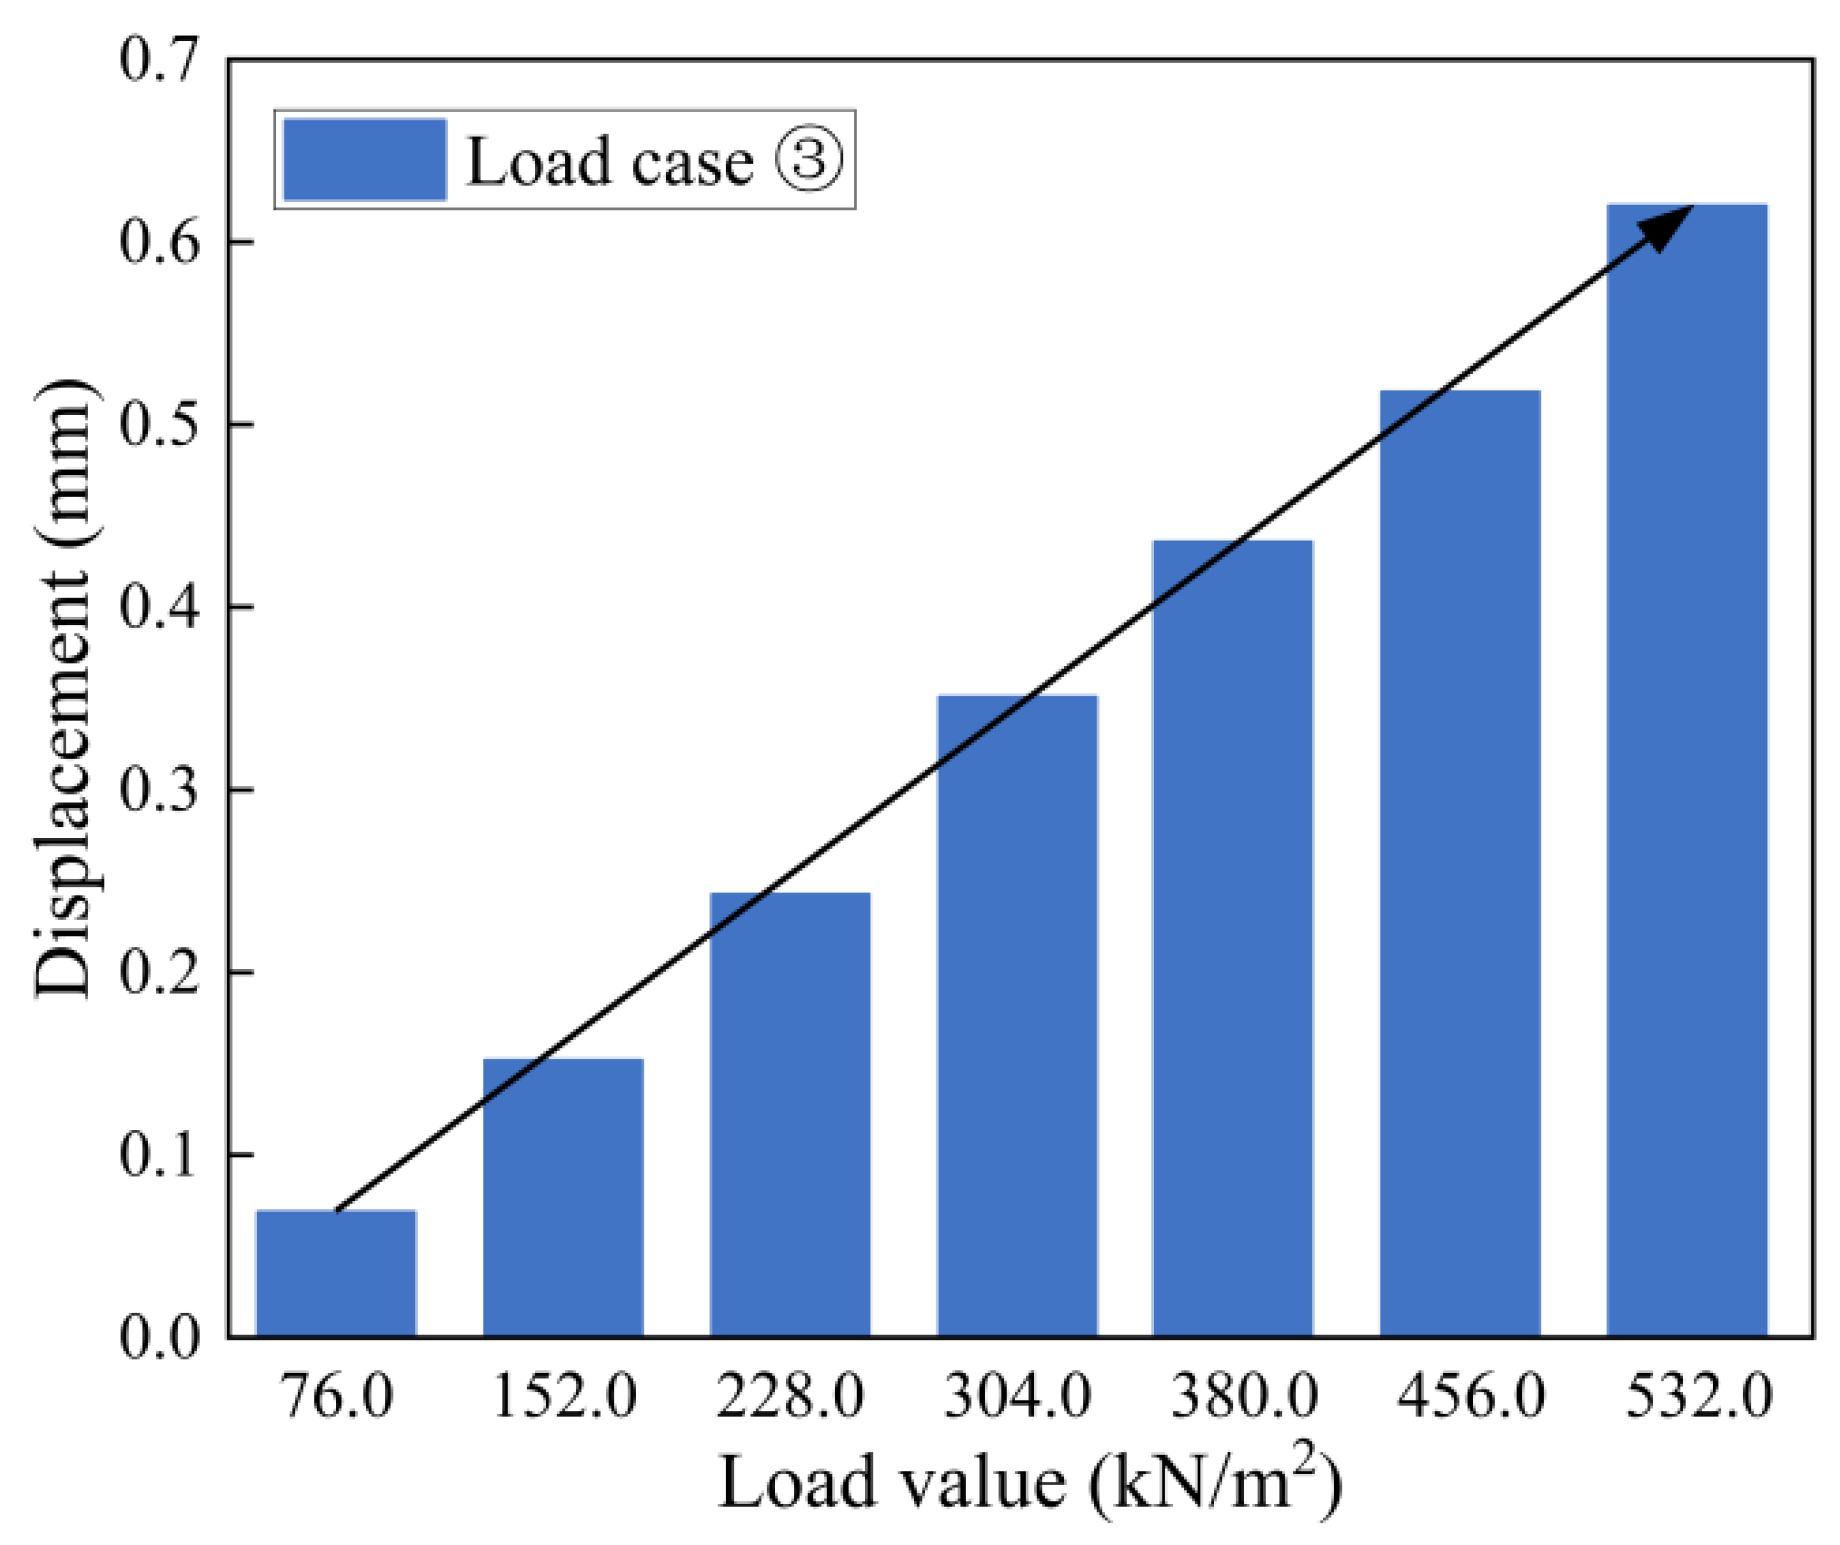
4.3.3. Load Case ③: Dead Load + External Soil Pressure + Top Load

Systematic parameter perturbation within the constrained ranges of Table 4 elucidates the evolving trends of maximum principal stress fields and global displacement distributions under load case ③, as quantitatively mapped in Figure 16 and Figure 17. Intersection nodes across parametric response curves correspond to baseline reference values for concrete’s critical stress states and structural deformation thresholds.
Under combined effects of self-weight, external earth pressure, and top loading, the reinforcement diameter and concrete grade exhibit negligible influence on the maximum principal stress in Figure 16. Similarly, wall thickness beyond 160 mm shows no significant impact on the maximum principal stress. However, the maximum principal stress in concrete increases markedly with greater height, rising by approximately 20% when the height reaches 3400 mm. The non-monotonic trend observed in Figure 16b under load case ③ may potentially arise from bending–compression coupling mechanisms. The initial stress decrease observed at wall thicknesses between 120 mm and 160 mm may result from improved flexural rigidity suppressing tensile stress development at the wall crown. The subsequent fluctuation in stress within the range of 160 mm to 200 mm wall thickness may reflect a competitive interaction between concrete stiffness enhancement and declining reinforcement efficiency associated with increased concrete cover thickness. The late-stage stress increase at wall thicknesses above 200 mm may indicate the formation of a rigid joint at the roof–wall junction, which could prevent effective load redistribution. Height-dependent effects may demonstrate critical slenderness behavior; for shaft heights below 3000 mm, minimal overturning moments may cause a slight reduction in stress, while for shaft heights above 3000 mm, amplified cantilever action may combine with top load eccentricity and deep burial depth to exponentially increase base compression stresses.
It can be found from Figure 17, that improvements in concrete grade demonstrate the most pronounced effect on reducing overall displacement, while increased height leads to greater displacement. At a height of 3400 mm, the overall displacement increases by about 15%. The results indicates that when considering top loading, increased height amplifies the structure’s embedment depth and lateral loading. In this scenario, external pressure predominantly concentrates on the lower section of the model. Meanwhile, the top loading causes outward compression in the cylindrical-wall concrete near the roof. Consequently, greater height results in progressively uneven stress distribution across the structure.

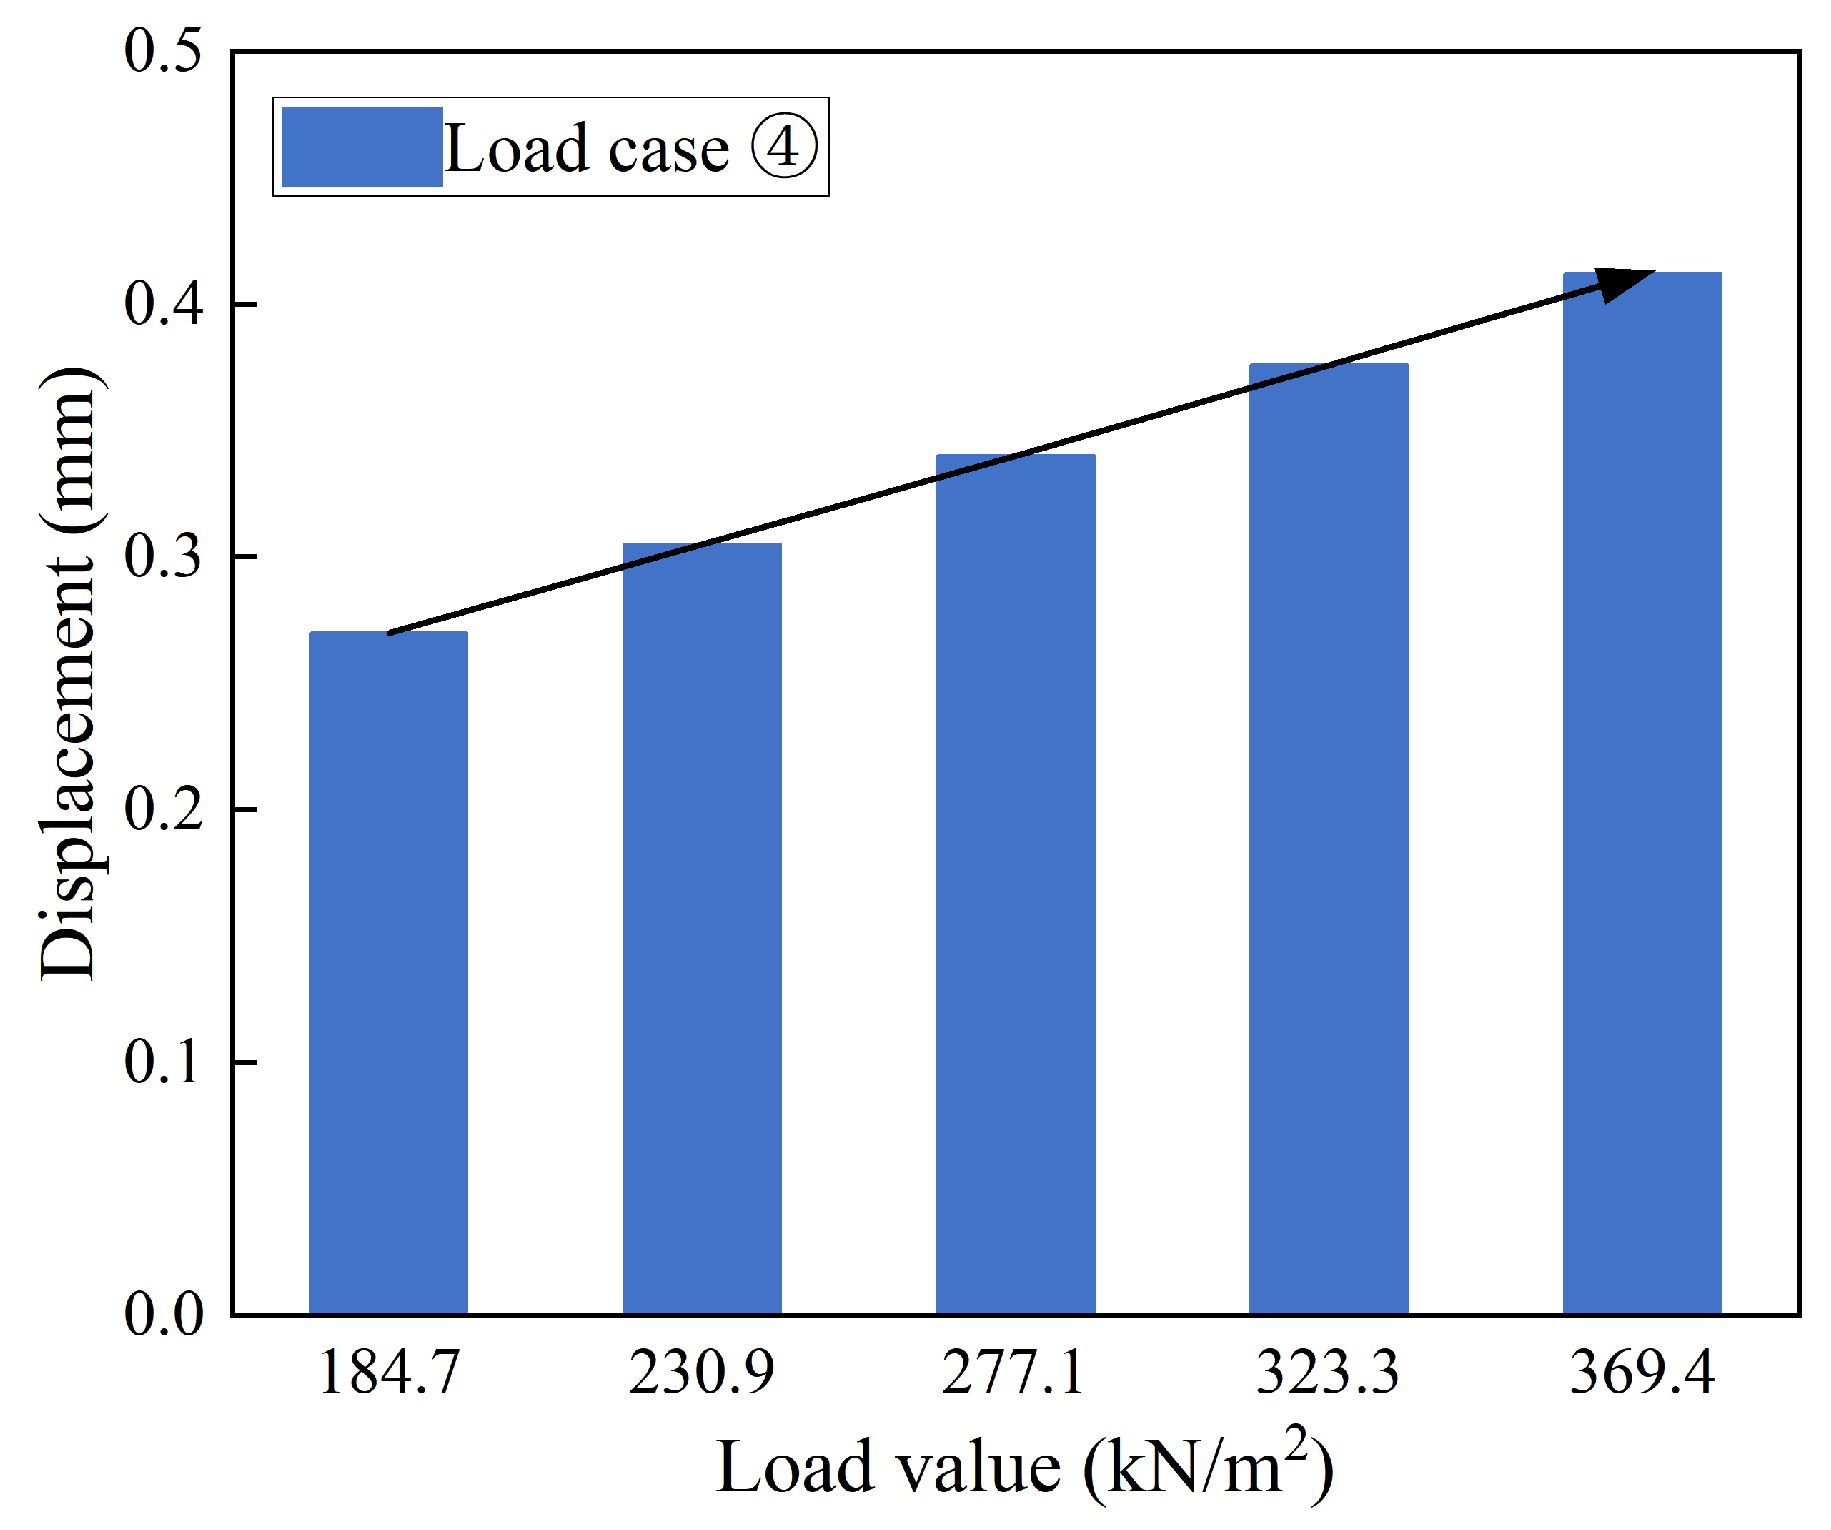
4.3.4. Load Case ④: Dead Load + External Soil Pressure + Buoyancy

Through systematic parameter variation within the constrained ranges defined in Table 4, the evolving trends of maximum principal-stress fields and global displacement distributions under load case ④ are quantitatively illustrated in Figure 18 and Figure 19. Intersection nodes across parametric response curves denote baseline reference values for concrete’s critical stress states and structural deformation thresholds.
In Figure 18, the reinforcement diameter and concrete grade also show negligible influence on the maximum principal stress under the combined effects of self-weight, external earth pressure, and buoyancy force. The less pronounced non-monotonic trend observed in Figure 18b under load case ④ may potentially be governed by buoyancy mechanics. The initial stress decrease observed at wall thicknesses between 120 mm and 160 mm may improve the anti-flotation performance at the shaft base. Subsequent stabilization in stress could reflect a vector cancellation effect, where buoyancy forces may induce wall tension while earth pressure simultaneously causes compression. The steep decline in the stress curve for shaft heights between 2400 mm and 3000 mm may embody effects related to buoyancy depth: deeper burial could enhance soil confinement while buoyancy potentially offsets base reactions, thereby converting wall stresses from tensile to compressive. Stability observed for shaft heights above 3000 mm may occur, as eccentric buoyancy moments could be counterbalanced by deep earth pressure, establishing potentially self-equilibrated stress fields characterized by localized transition zones.
It can be found from Figure 19 that improvements in reinforcement diameter, wall thickness, and concrete grade contribute to reduced overall displacement, with wall thickness demonstrating the most pronounced effect. At a wall thickness of 220 mm, the overall displacement decreases by about 14% relative to the baseline model. In contrast, height variations exhibit minimal impact on overall displacement.

4.4. Multi-Parameter Response Surface Optimization Results Under Different Load Cases

Although the direct optimization in Ansys Workbench can individually reveal the impact of each parameter on the overall load cases, it still has certain limitations, as it does not simultaneously adjust all parameters to obtain the optimal solution. Therefore, utilizing the response surface module to further derive the optimal model is the ultimate goal of structural optimization.

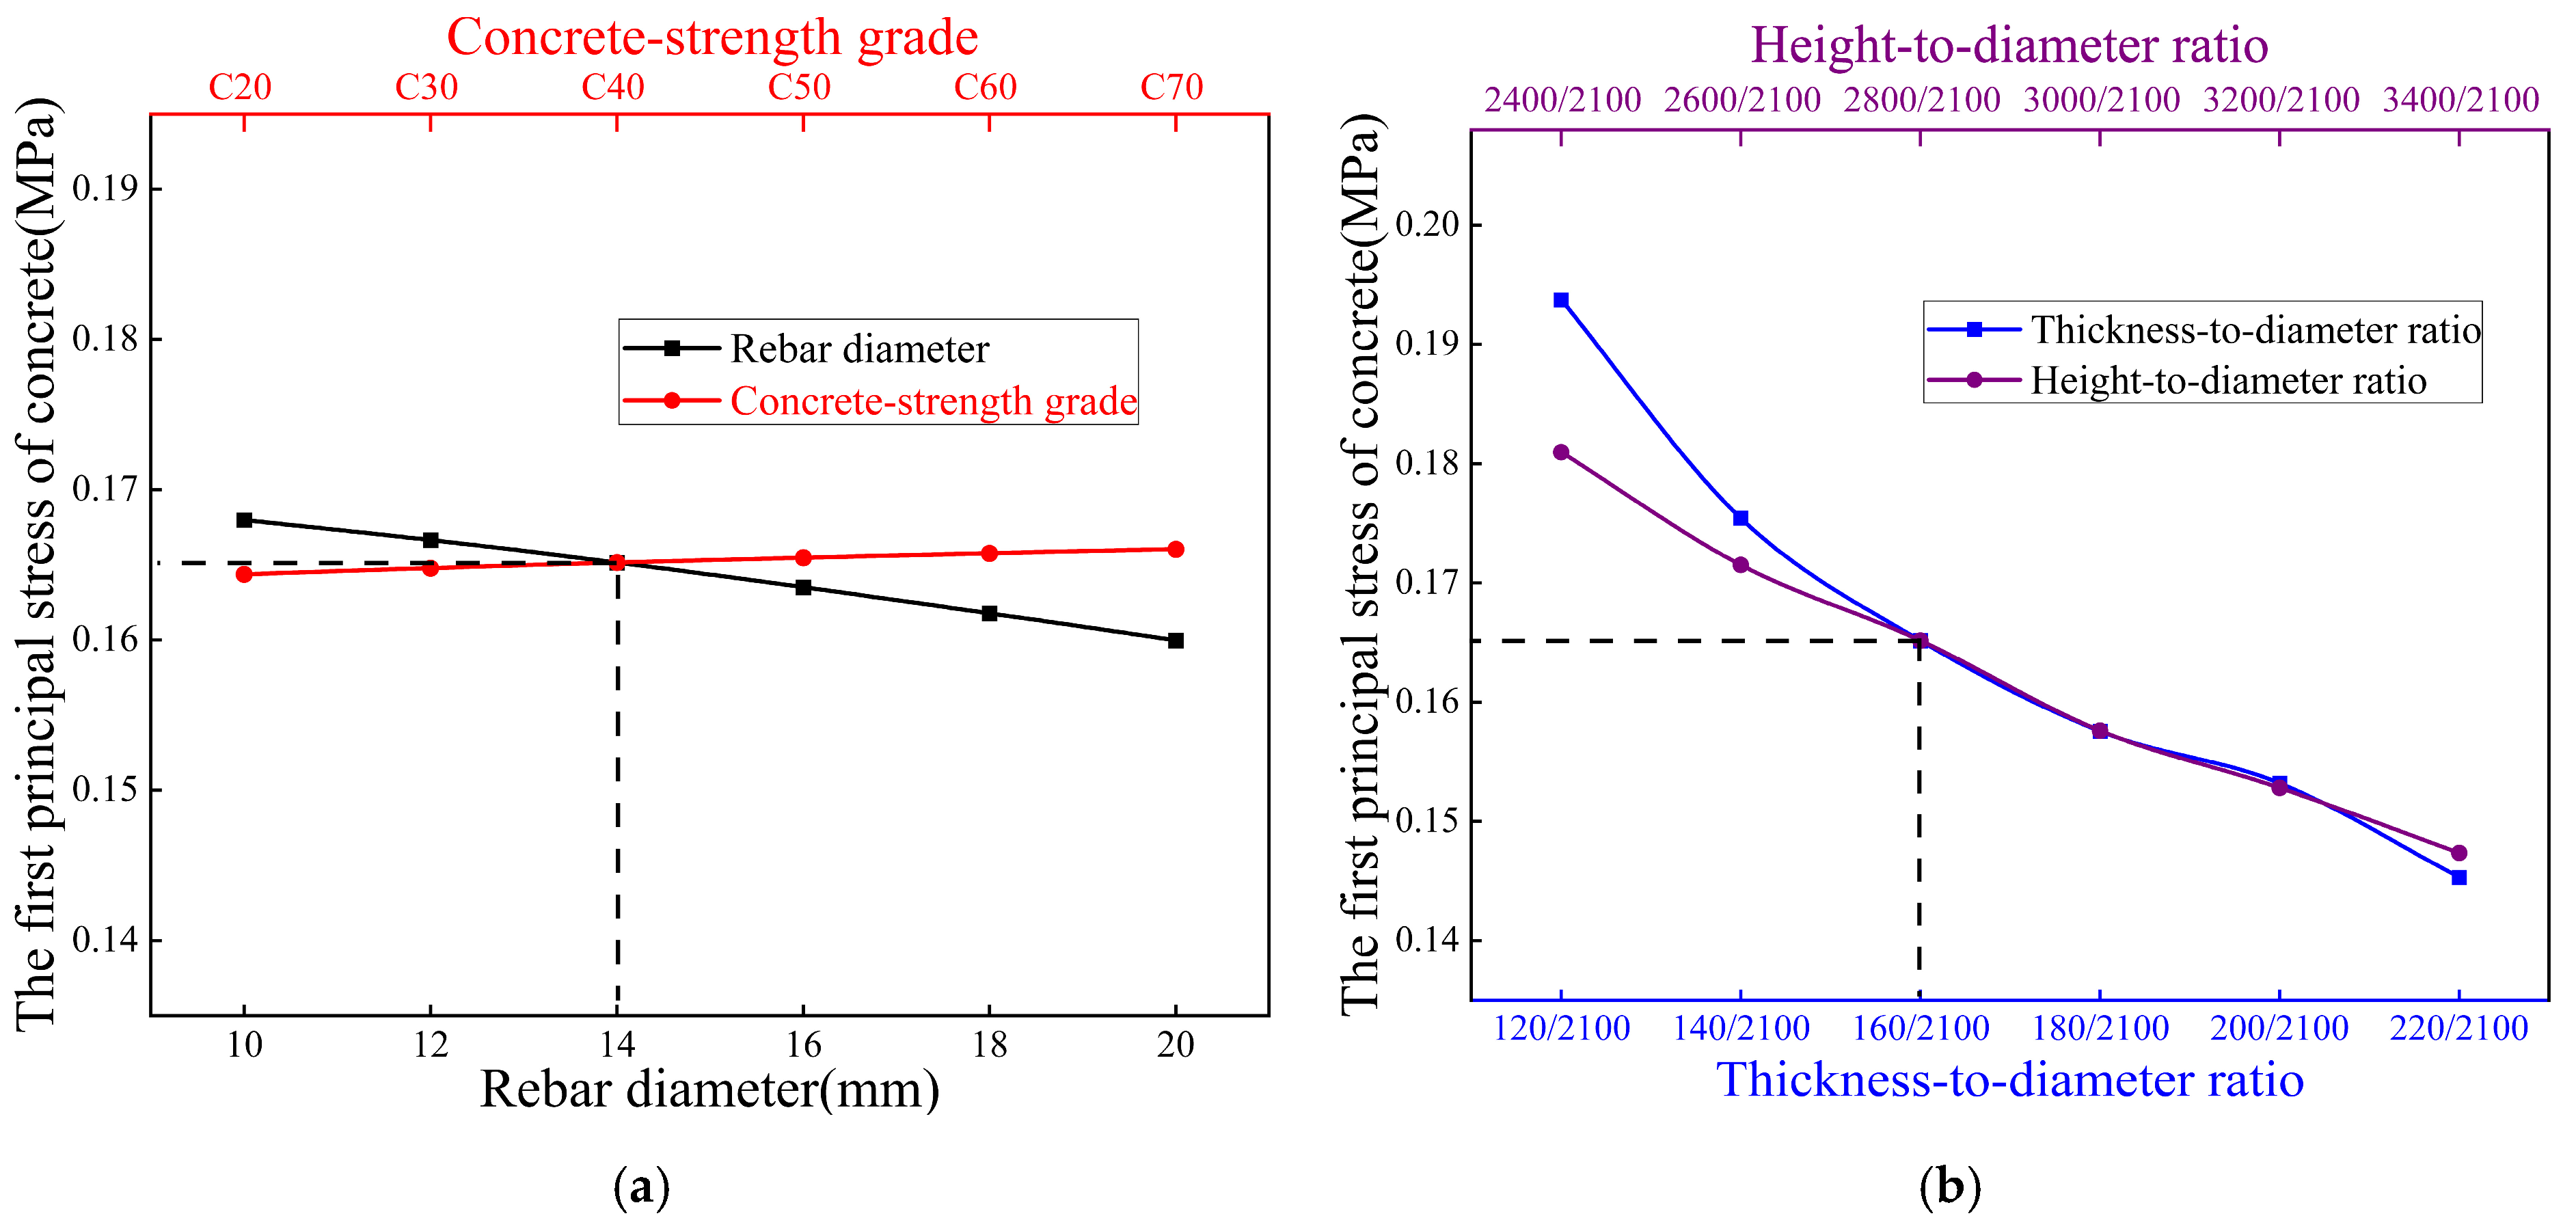
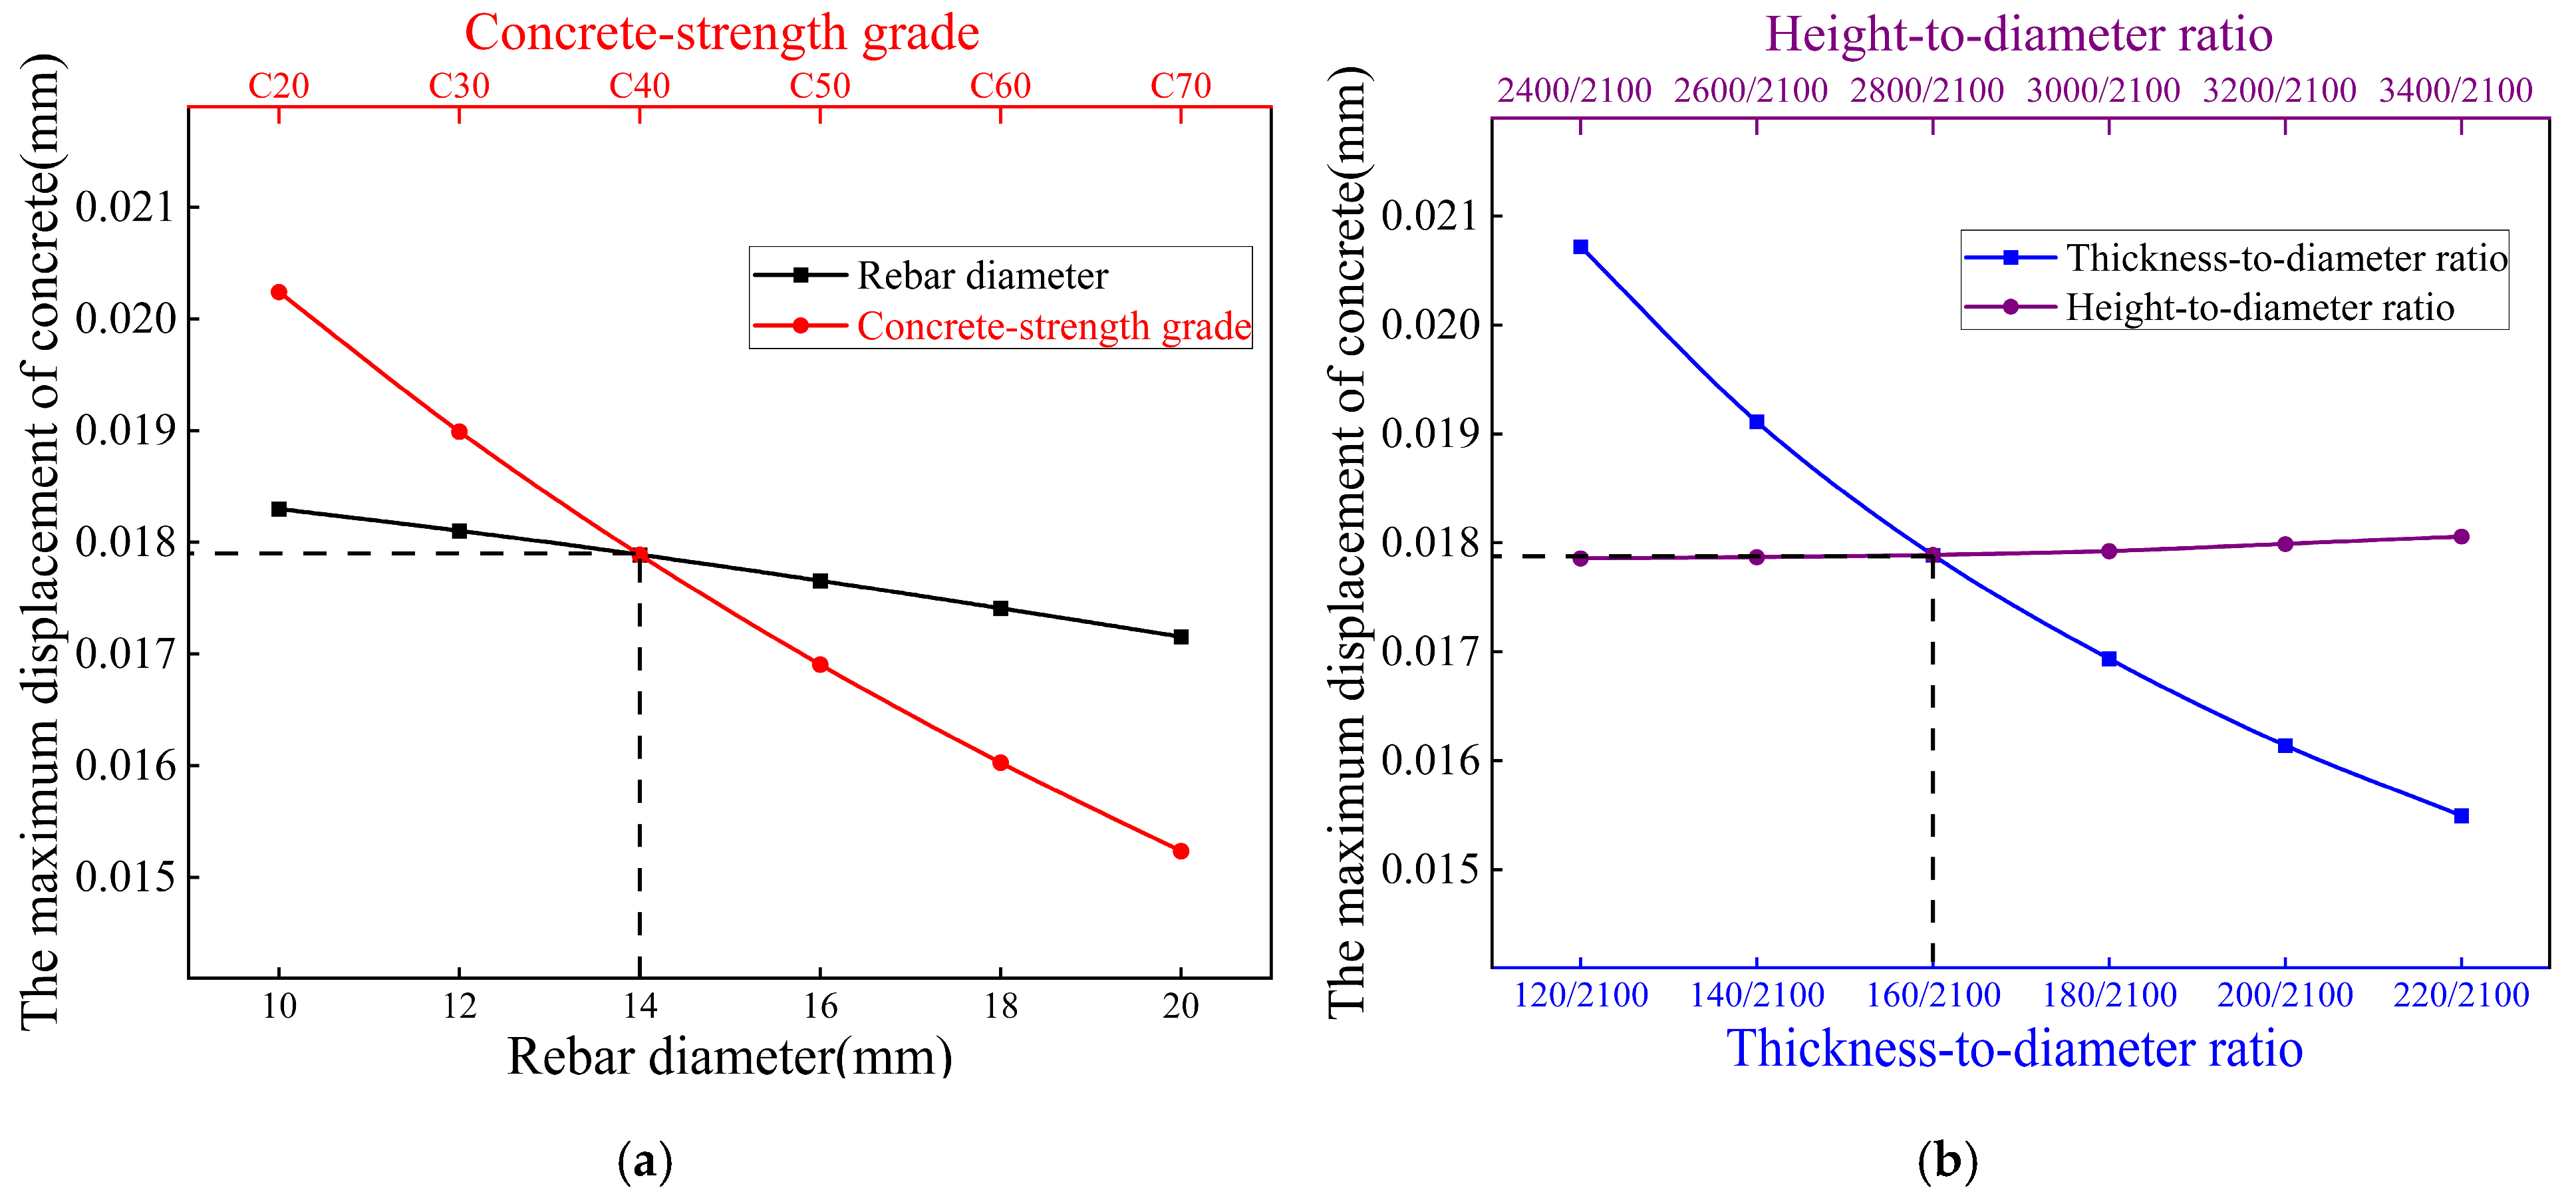
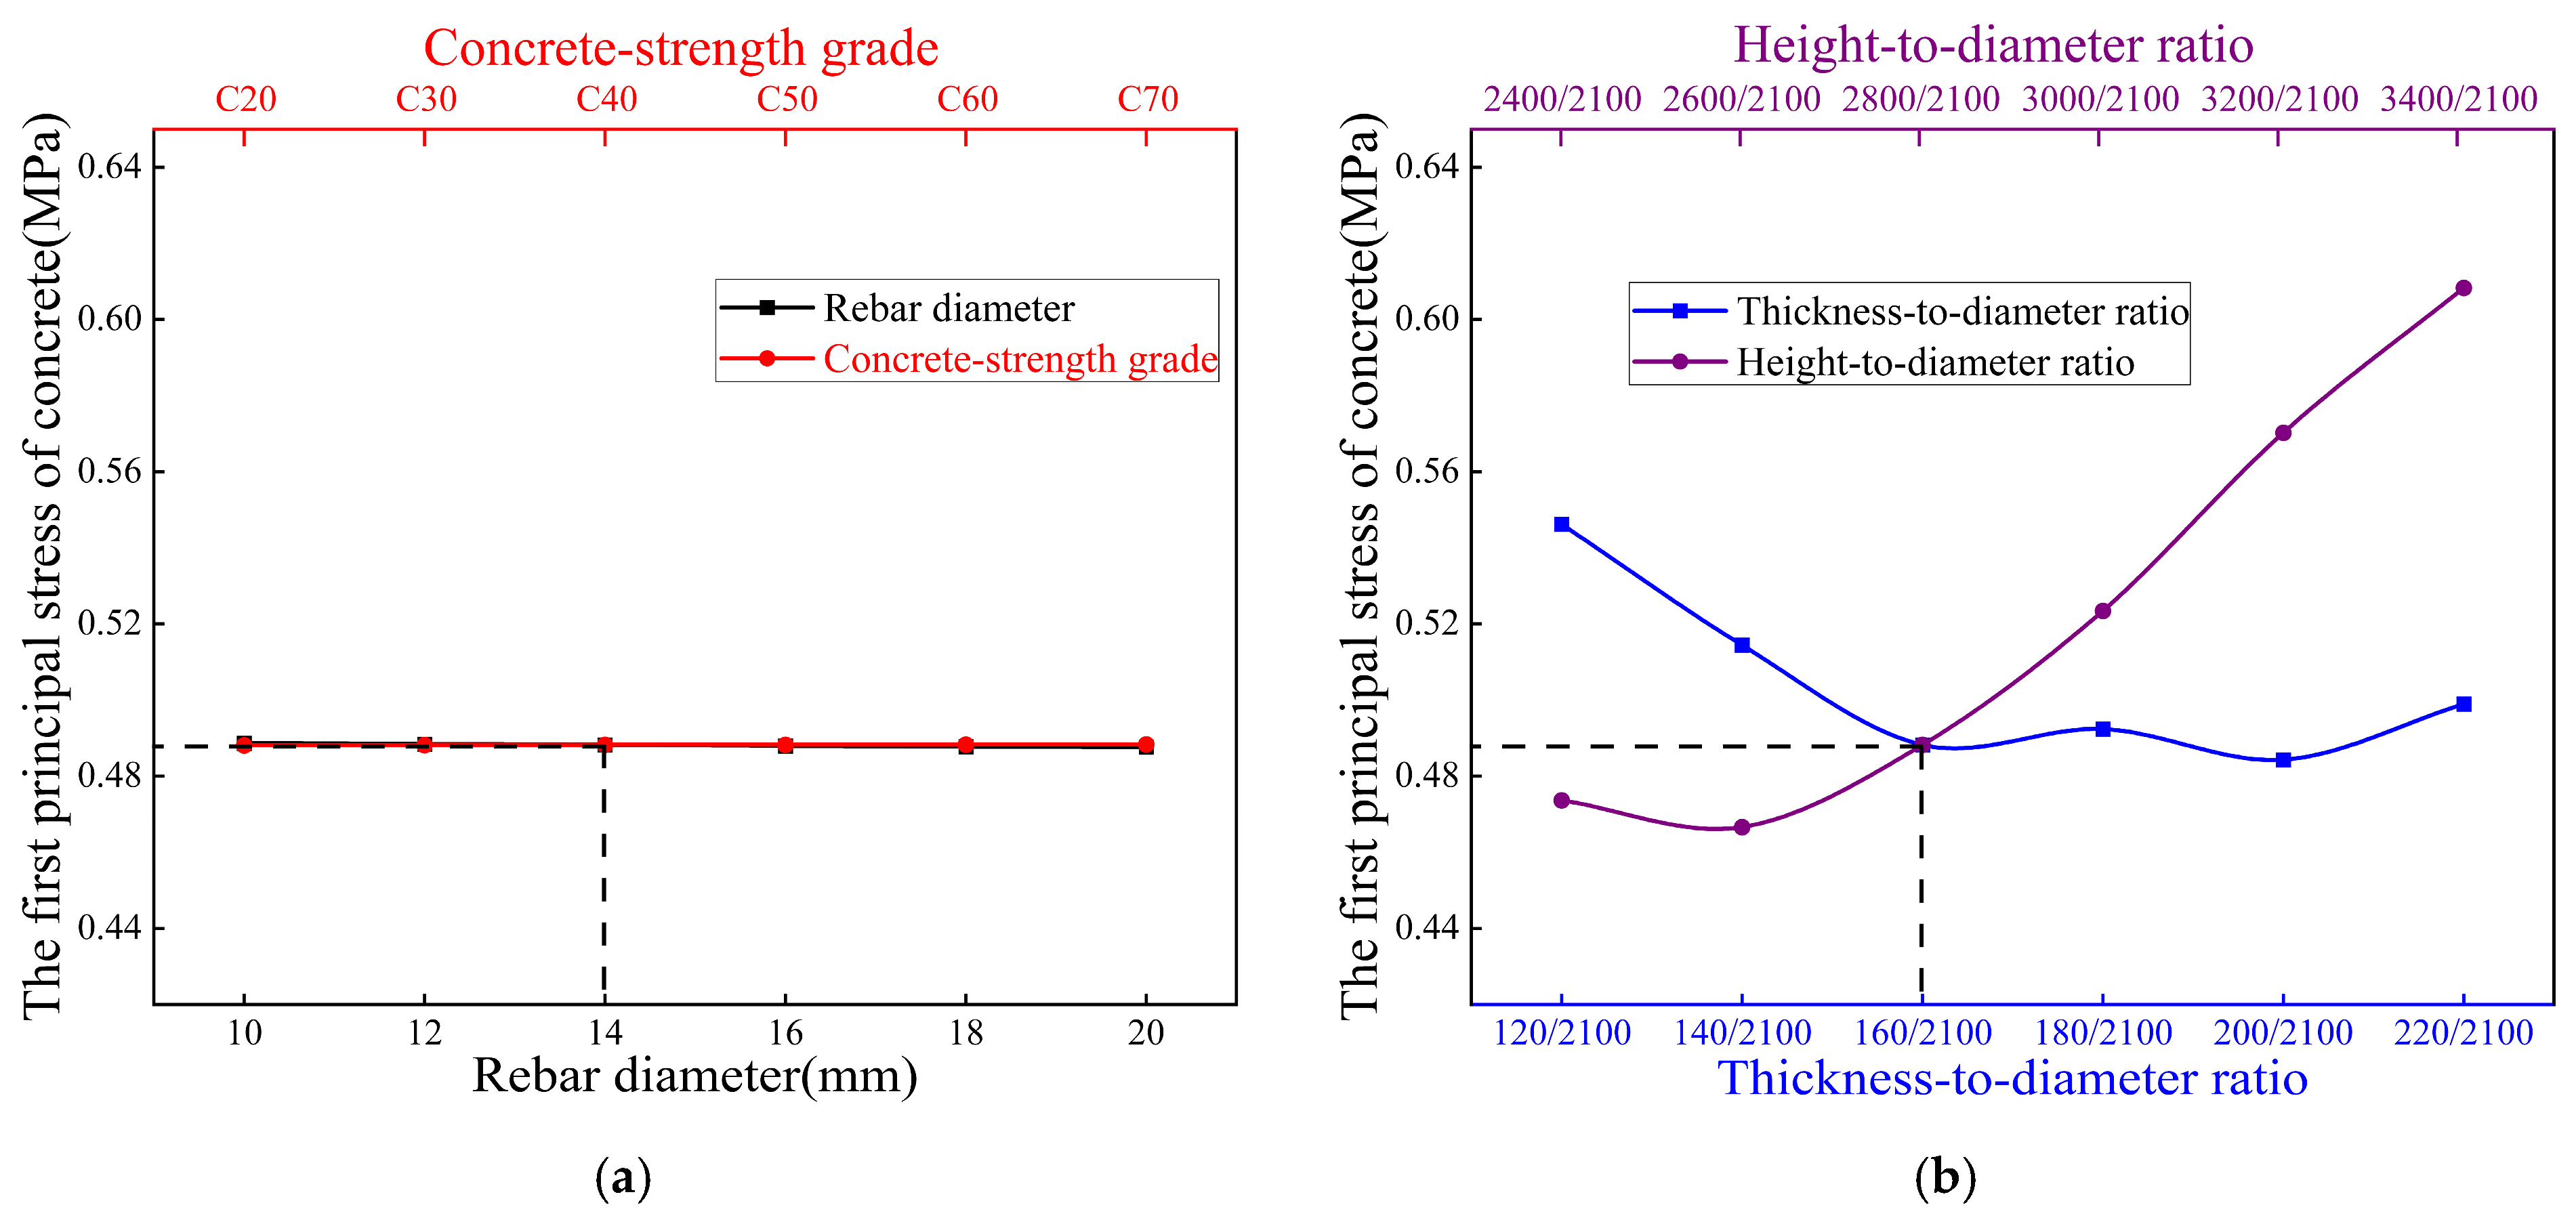
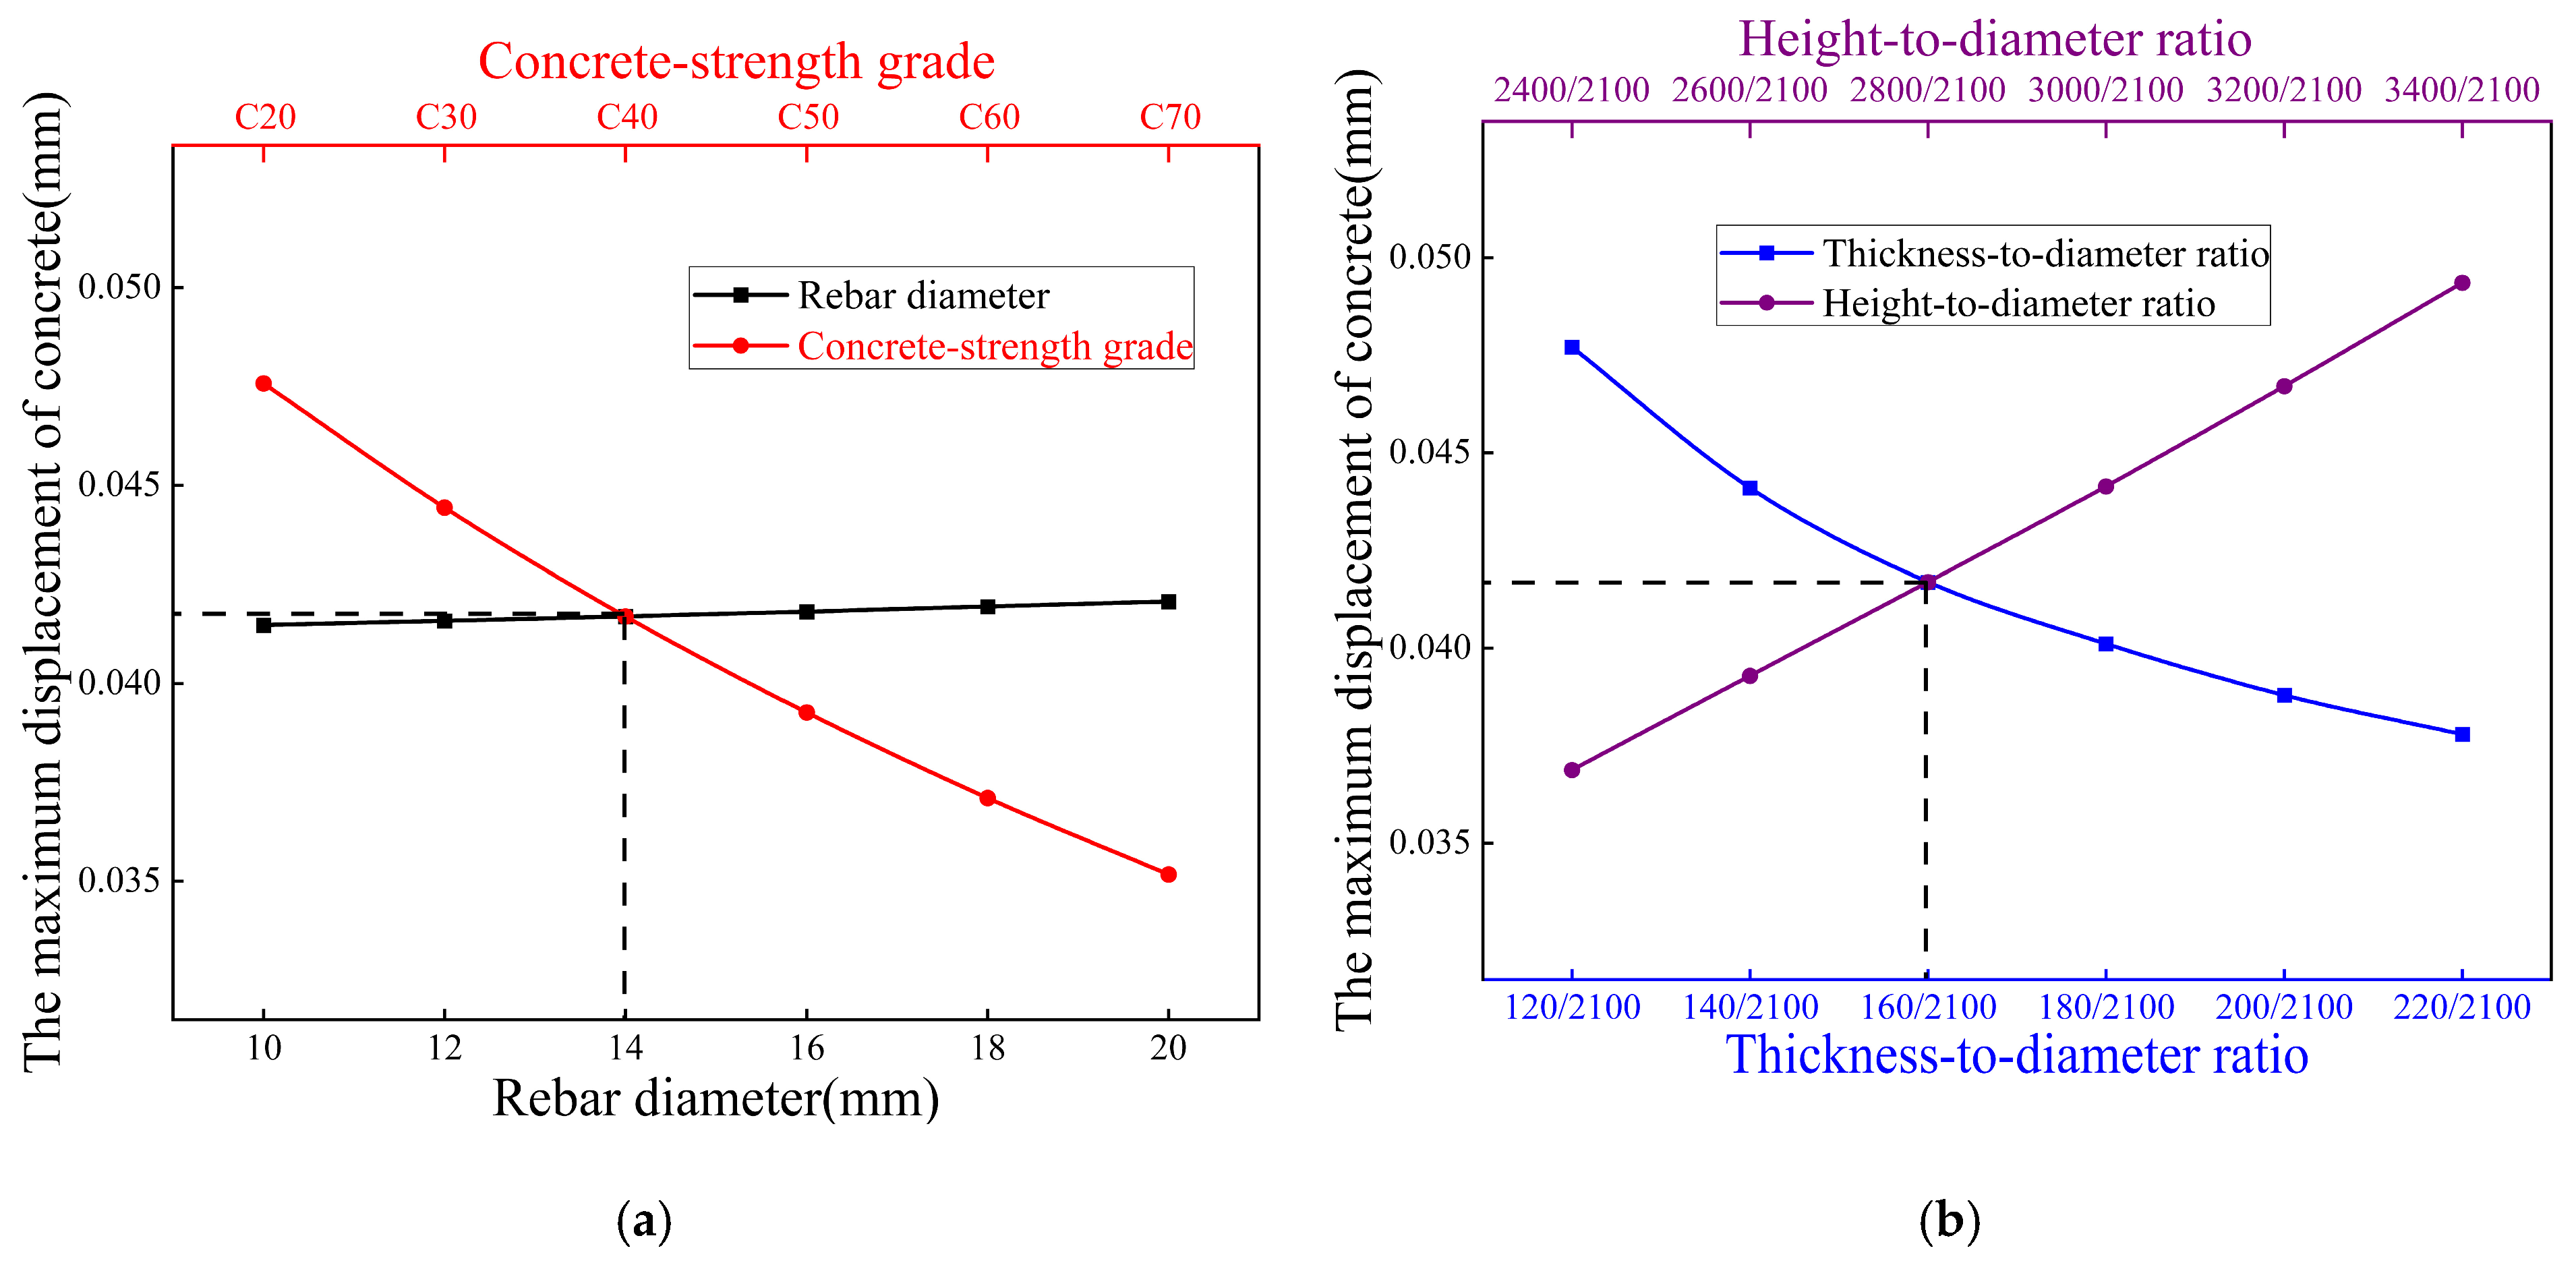
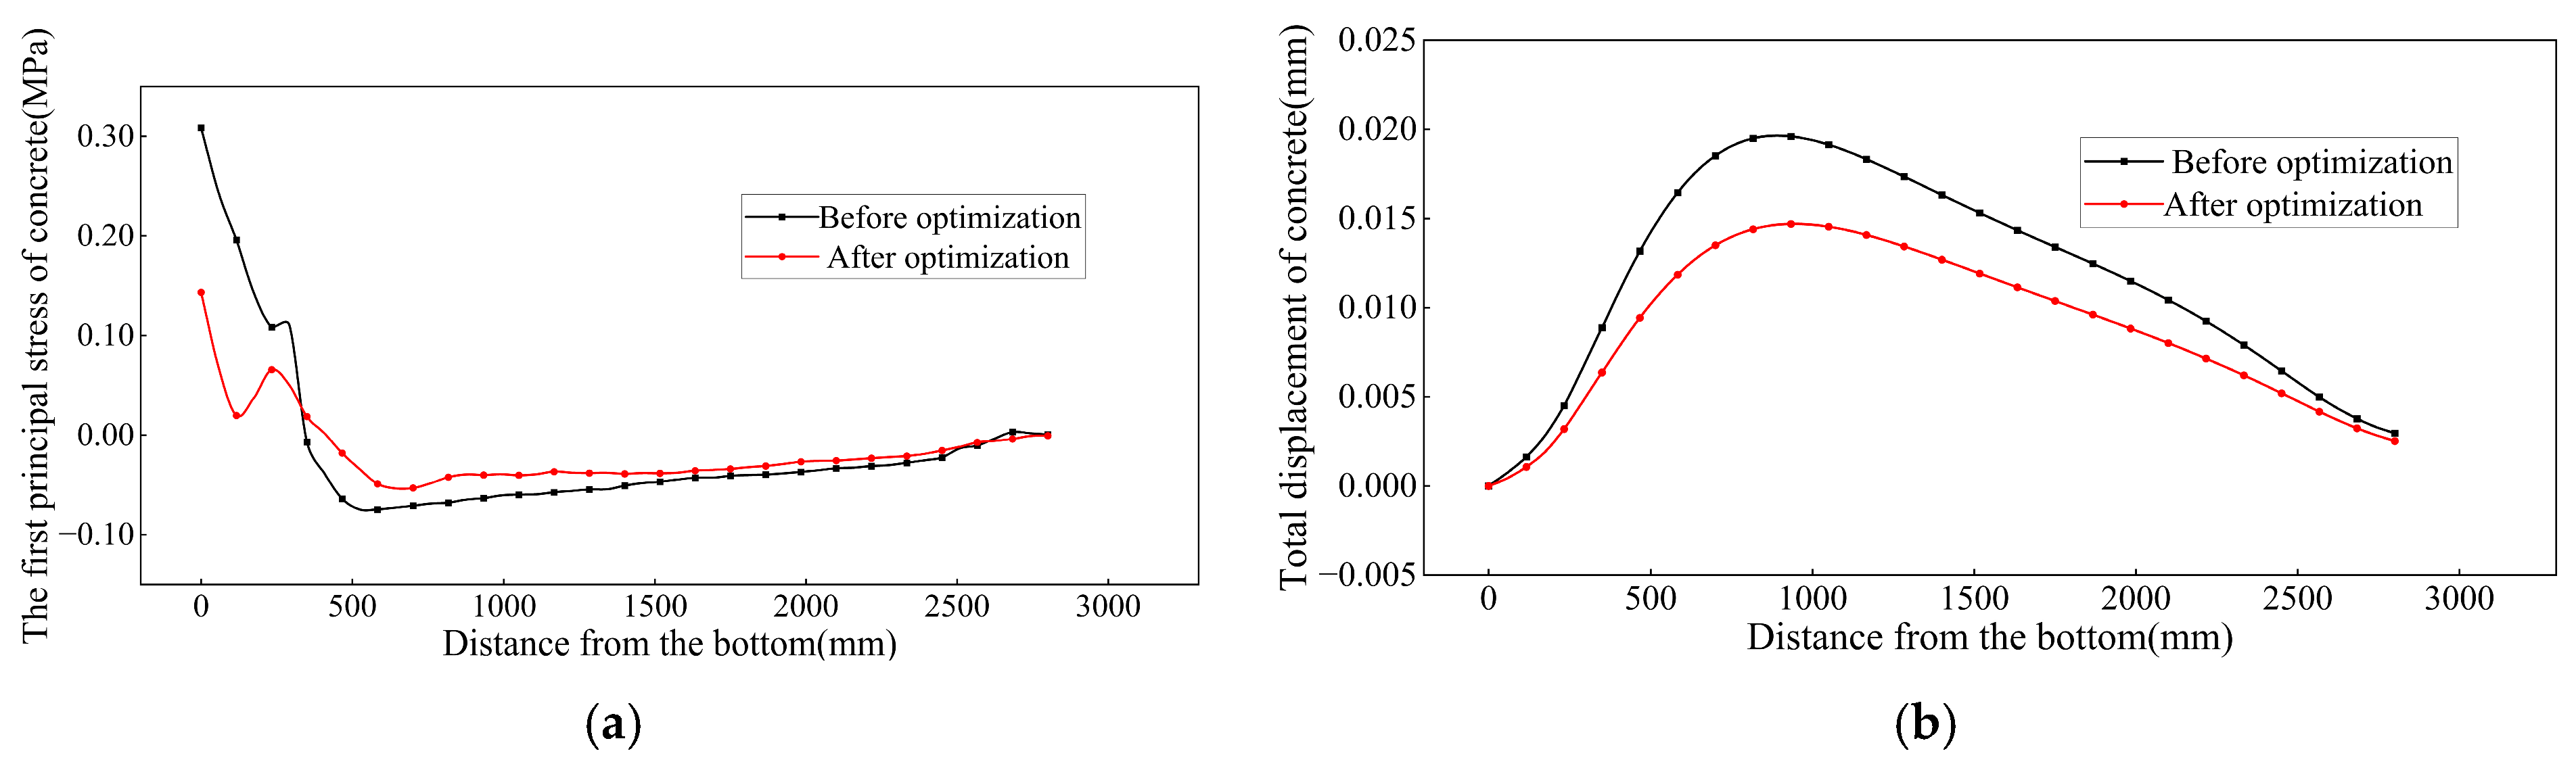
4.4.1. Case ①: Self-Weight + Internal Water Pressure

To determine the optimal structure of the accident oil tank under the combined action of self-weight and water pressure, key parameters selected in previous sections were assigned values within the ranges specified in Table 3, based on the mechanical behavior of the tank structure, to investigate their effects on the performance of the innovative design. According to the calculations in the response surface module, the optimized model can be obtained. Following the nonlinear analysis described in Section 3, potential locations of maximum stress under self-weight and water pressure are identified. A path can be defined along the inner wall to extract the first principal stress and displacement. Comparative diagrams of pre- and post-optimization results are shown in Figure 20, where the horizontal axis represents the distance from the tank base, and the vertical axis indicates the corresponding first principal stress and total displacement of each element. The optimized data comparison is summarized in Table 4.
Based on the data in Figure 20 and Table 4, the maximum principal stress on the inner wall of the tank after optimization occurs approximately 920 mm from the tank base, measuring 0.10861 MPa, which represents a 33.3% reduction compared to the pre-optimization value of 0.14474 MPa. At this location, the post-optimization displacement is 0.0042 mm, showing a 40% decrease from the pre-optimization value of 0.0059 mm. This demonstrates that the optimization strategy significantly improves the stress concentration regions.
Table 4. Comparison of data before and after optimization under load case ①.
Pre-Optimization Maximum ValuePost-Optimization Maximum ValuePre-Optimization Minimum ValuePost-Optimization Minimum Value
First principal stress on inner wall (MPa)0.140.11−0.089−0.054
Total displacement on inner wall (mm)0.00590.00426.27 × 10−54.67 × 10⁻⁵

4.4.2. Case ②: Self-Weight + External Soil Pressure

Based on the calculations in the response surface module, the optimized model can be obtained. Following the present nonlinear analysis, potential locations of maximum stress under self-weight and soil pressure are identified. A path is defined along the outer wall, to extract the first principal stress and displacement. Comparative diagrams of pre- and post-optimization results are shown in Figure 21, where the horizontal axis represents the distance from the tank base, and the vertical axis indicates the corresponding first principal stress and total displacement of each element. The optimized data comparison is summarized in Table 5. According to the data in Figure 21 and Table 5, the maximum principal stress on the outer wall of the tank after optimization occurs near the tank base, measuring 0.1434 MPa, which represents a 115% reduction compared to the pre-optimization value of 0.3085 MPa. The post-optimization displacement is observed at approximately 875 mm from the tank base, with a value of 0.0146 mm, showing a 34% decrease from the pre-optimization value of 0.0196 mm. This indicates that the optimization strategy significantly mitigates stress concentration regions.

4.4.3. Case ③: Self-Weight + External Soil Pressure + Top Load

Through calculations in the response surface module, the optimized model could be obtained. Following the described nonlinear analysis, potential locations of maximum stress under the combined loading of self-weight, external soil pressure, and top load are identified. A path could be defined along the outer wall to extract the first principal stress and displacement. Comparative diagrams of pre- and post-optimization results are shown in Figure 22, where the horizontal axis represents the distance from the tank base, and the vertical axis indicates the corresponding first principal stress and total displacement of each element. The optimized data comparison is summarized in Table 6.
As seen in Figure 22 and Table 6, the maximum principal stress on the outer wall of the tank after optimization occurs near the tank base, measuring 0.1403 MPa, which represents a 75% reduction compared to the pre-optimization value of 0.2459 MPa. The maximum total displacement post-optimization is observed at approximately 930 mm from the tank base, with a value of 0.0137 mm, showing a 41% decrease from the pre-optimization value of 0.0193 mm. This indicates that the optimization strategy significantly mitigates stress concentration regions.

4.4.4. Case ④: Self-Weight + External Soil Pressure + Buoyancy

In Section 3, potential locations of maximum stress under the combined loading of self-weight, external soil pressure, and buoyancy are identified. A path was defined along the outer wall to extract the first principal stress and displacement. Comparative diagrams of pre- and post-optimization results are shown in Figure 23, where the horizontal axis represents the distance from the tank base, and the vertical axis indicates the corresponding first principal stress and total displacement of each element. The optimized data comparison is summarized in Table 7.
According to the data in Figure 23 and Table 7, the maximum principal stress on the inner wall of the tank after optimization occurs at the tank base, measuring 0.2026 MPa, which is approximately one-third of the pre-optimization value (0.6264 MPa), indicating a 67.4% reduction. The post-optimization maximum principal stress at the tank top is 0.1518 MPa, representing an 88.1% reduction compared to the pre-optimization value of 1.2735 MPa. The maximum total displacement post-optimization is observed at approximately 800 mm from the tank base, with a value of 0.2029 mm, which shows a 50% increase compared to the pre-optimization value of 0.1351 mm. This suggests that the optimization strategy effectively mitigates stress concentration regions, though displacement control requires further validation.
Moreover, utilizing the response surface optimization module allows for the determination of sensitivities following optimization in Ansys Workbench. Sensitivities quantify the influence magnitude and trend of individual parameters on the objective function during the optimization process for a single load case. A positive sensitivity value indicates that an increase in the parameter tends to increase the objective function, while a negative value signifies the opposite. The closer the absolute value is to 100%, the greater the magnitude of influence the parameter exerts. Considering the varying operational durations of different working conditions for the novel accident oil tank in practical applications, a weighted average of the sensitivities for each parameter across these conditions is calculated. This yields the final sensitivity, which reflects, to a certain extent, the parameter’s overall influence on the tank’s performance during normal engineering service. Therefore, the resulting sensitivities are presented in Table 8. It can be found from Table 8 that concrete-strength grade is the most critical parameter for displacement control (−41.31%), though it marginally increases stress (+1.24%). The thickness–diameter ratio demonstrates substantial dual efficacy, significantly reducing both stress (−29.83%) and displacement (−36.45%). Conversely, while the height–diameter ratio effectively lowers stress (−16.10%), it slightly increases displacement (+6.19%), necessitating design trade-offs. Rebar diameter provides moderate synergistic benefits, decreasing both stress (−9.97%) and displacement (−13.46%). These differential impacts establish clear hierarchical priorities for comprehensive system optimization.
Finally, Table 9 summaries the optimized parameters (rebar diameter, thickness-to-diameter ratio, height-to-diameter ratio, concrete grade) for four different load cases. While distinct optimal solutions emerge for individual load cases, the parameters demonstrate convergent tendencies within specific ranges (e.g., thickness-to-diameter ratios cluster at 160/2100, height-to-diameter ratios at 2800/2100-3200/2100). Crucially, all listed parameters exhibit positive correlations with structural costs. To balance structural performance (stress/displacement mitigation) with economic efficiency, this work selects the lowest-cost parameter combination within the convergent range that satisfies multi-condition constraints. This methodology aligns with engineering optimization principles by delivering cost-effective solutions while maintaining the requisite structural integrity under varying operational scenarios.

5. Conclusions

This work proposes a novel integrated prefabricated accidental oil pool, and establishes its finite element model to investigate mechanical behaviors under various operational conditions. Parametric analyses with ANSYS Workbench’s response surface methodology are conducted to optimize the structural design. The following main conclusions can be drawn:
(1)
The systematic quantification of failure thresholds across four load combinations reveals fundamental vulnerability mechanisms, particularly under the different load combinations. The failure modes of the oil pool differ significantly: failure occurs when internal water pressure reaches 11 times the initial value in load case ①, 8.8 times the initial external soil pressure in load case ②, 7 times the initial external load in load case ③, and 1.5 times the initial external load in load case ④, highlighting buoyancy’s critical role in accelerating structural degradation.
(2)
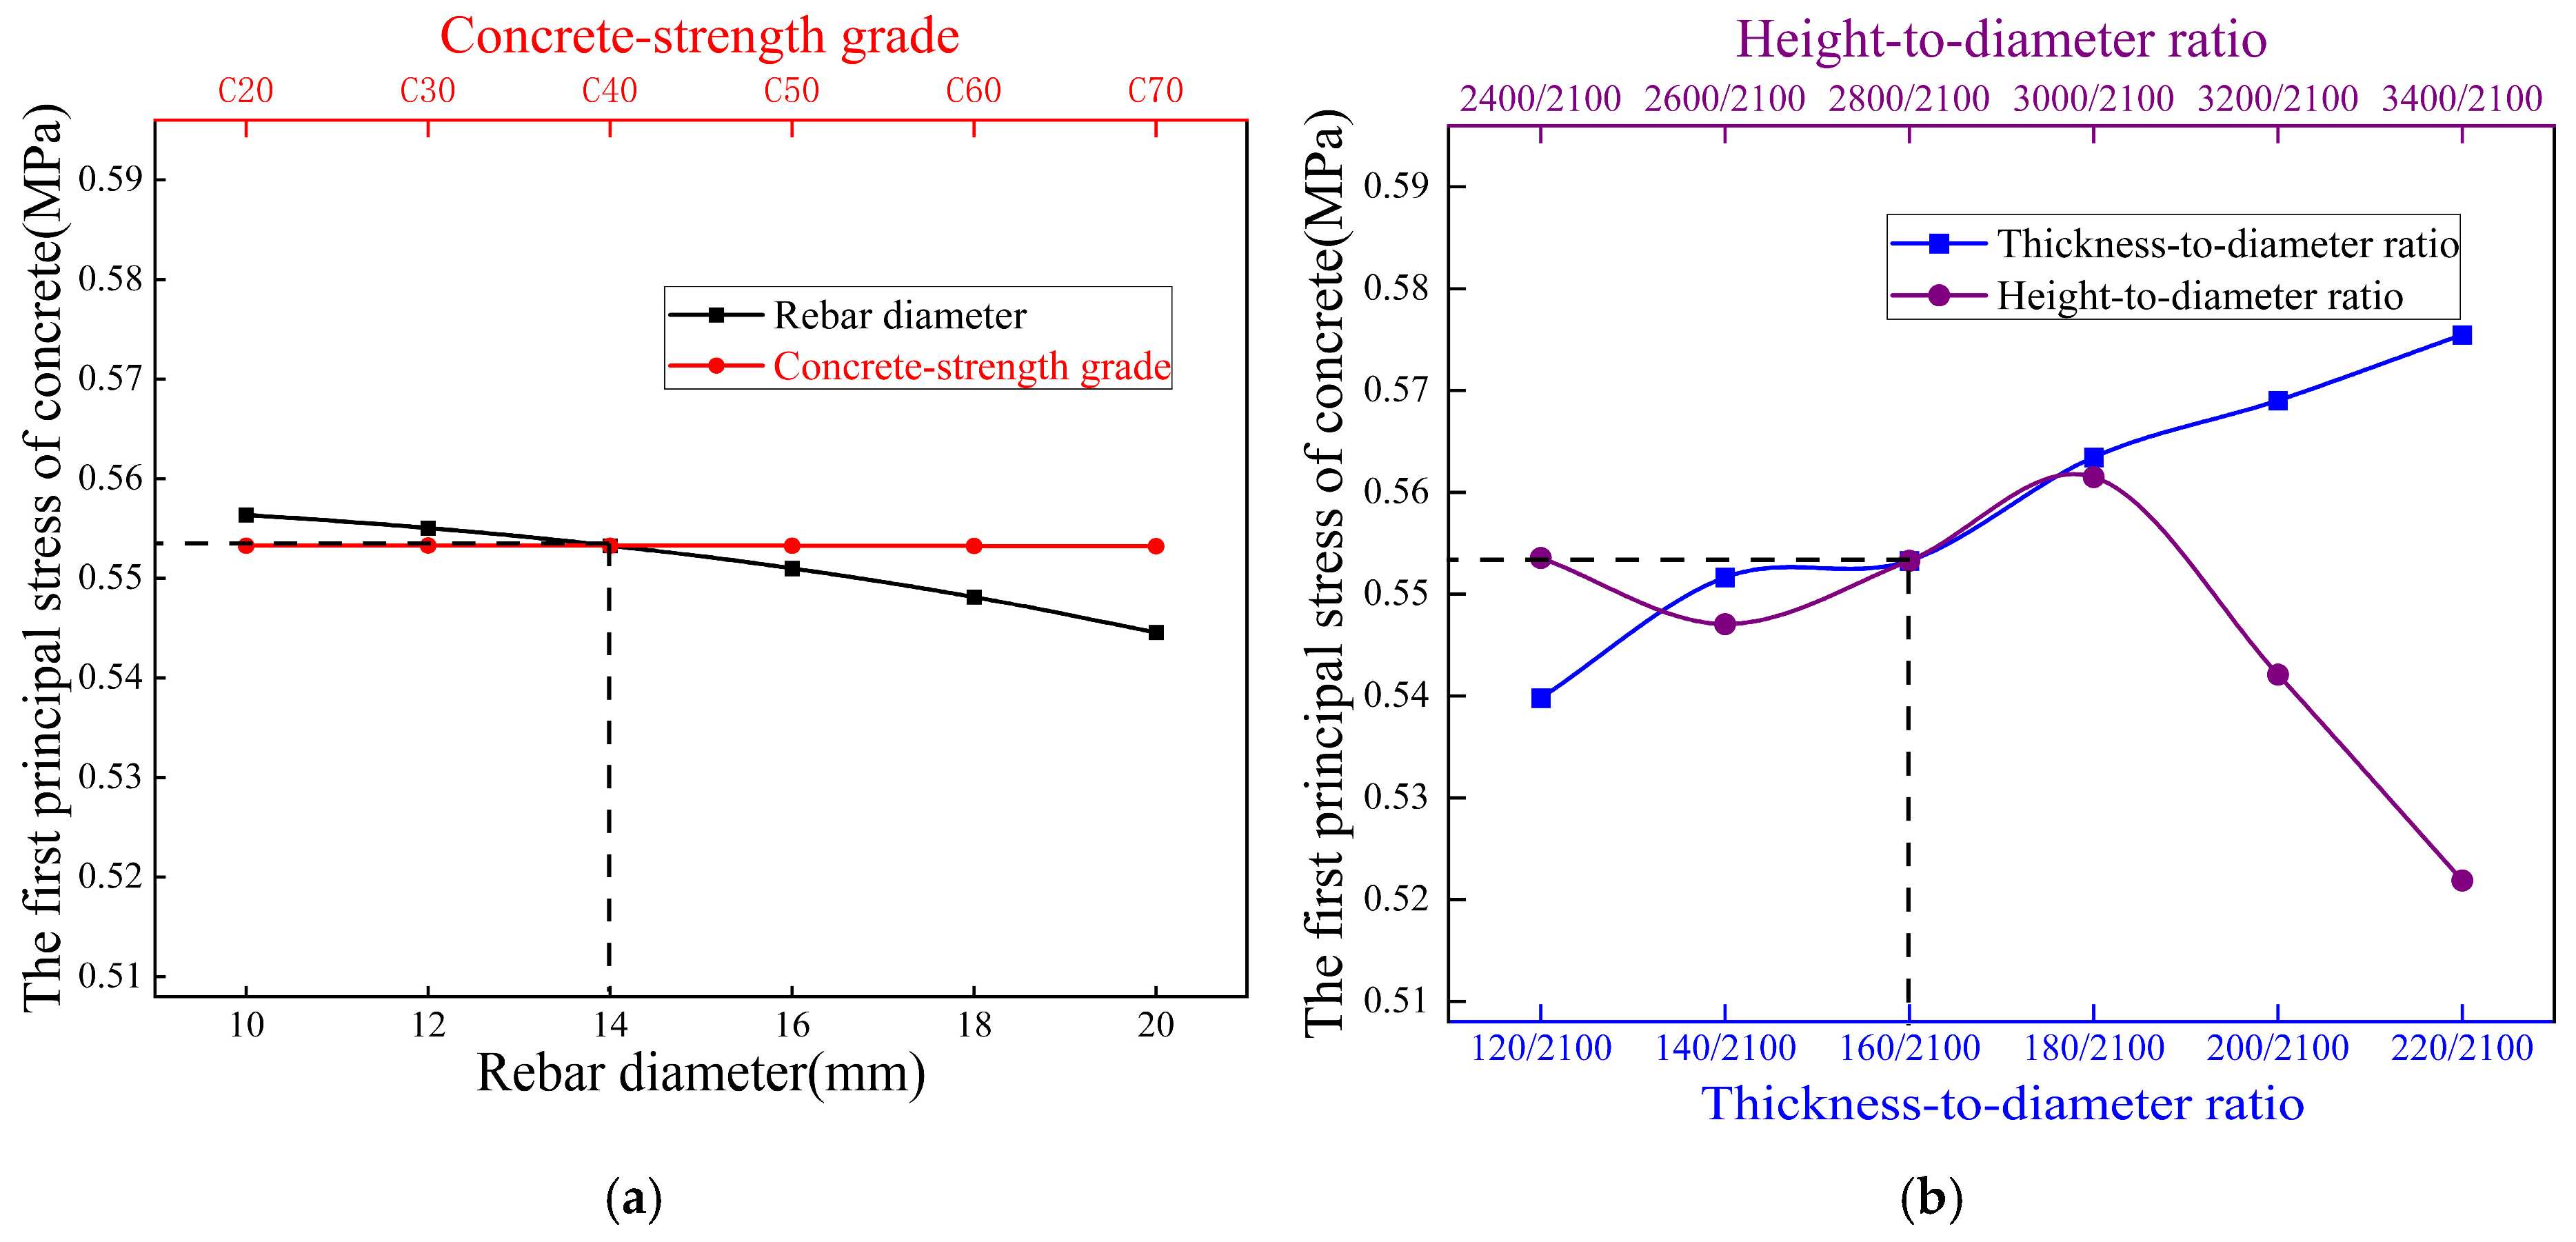
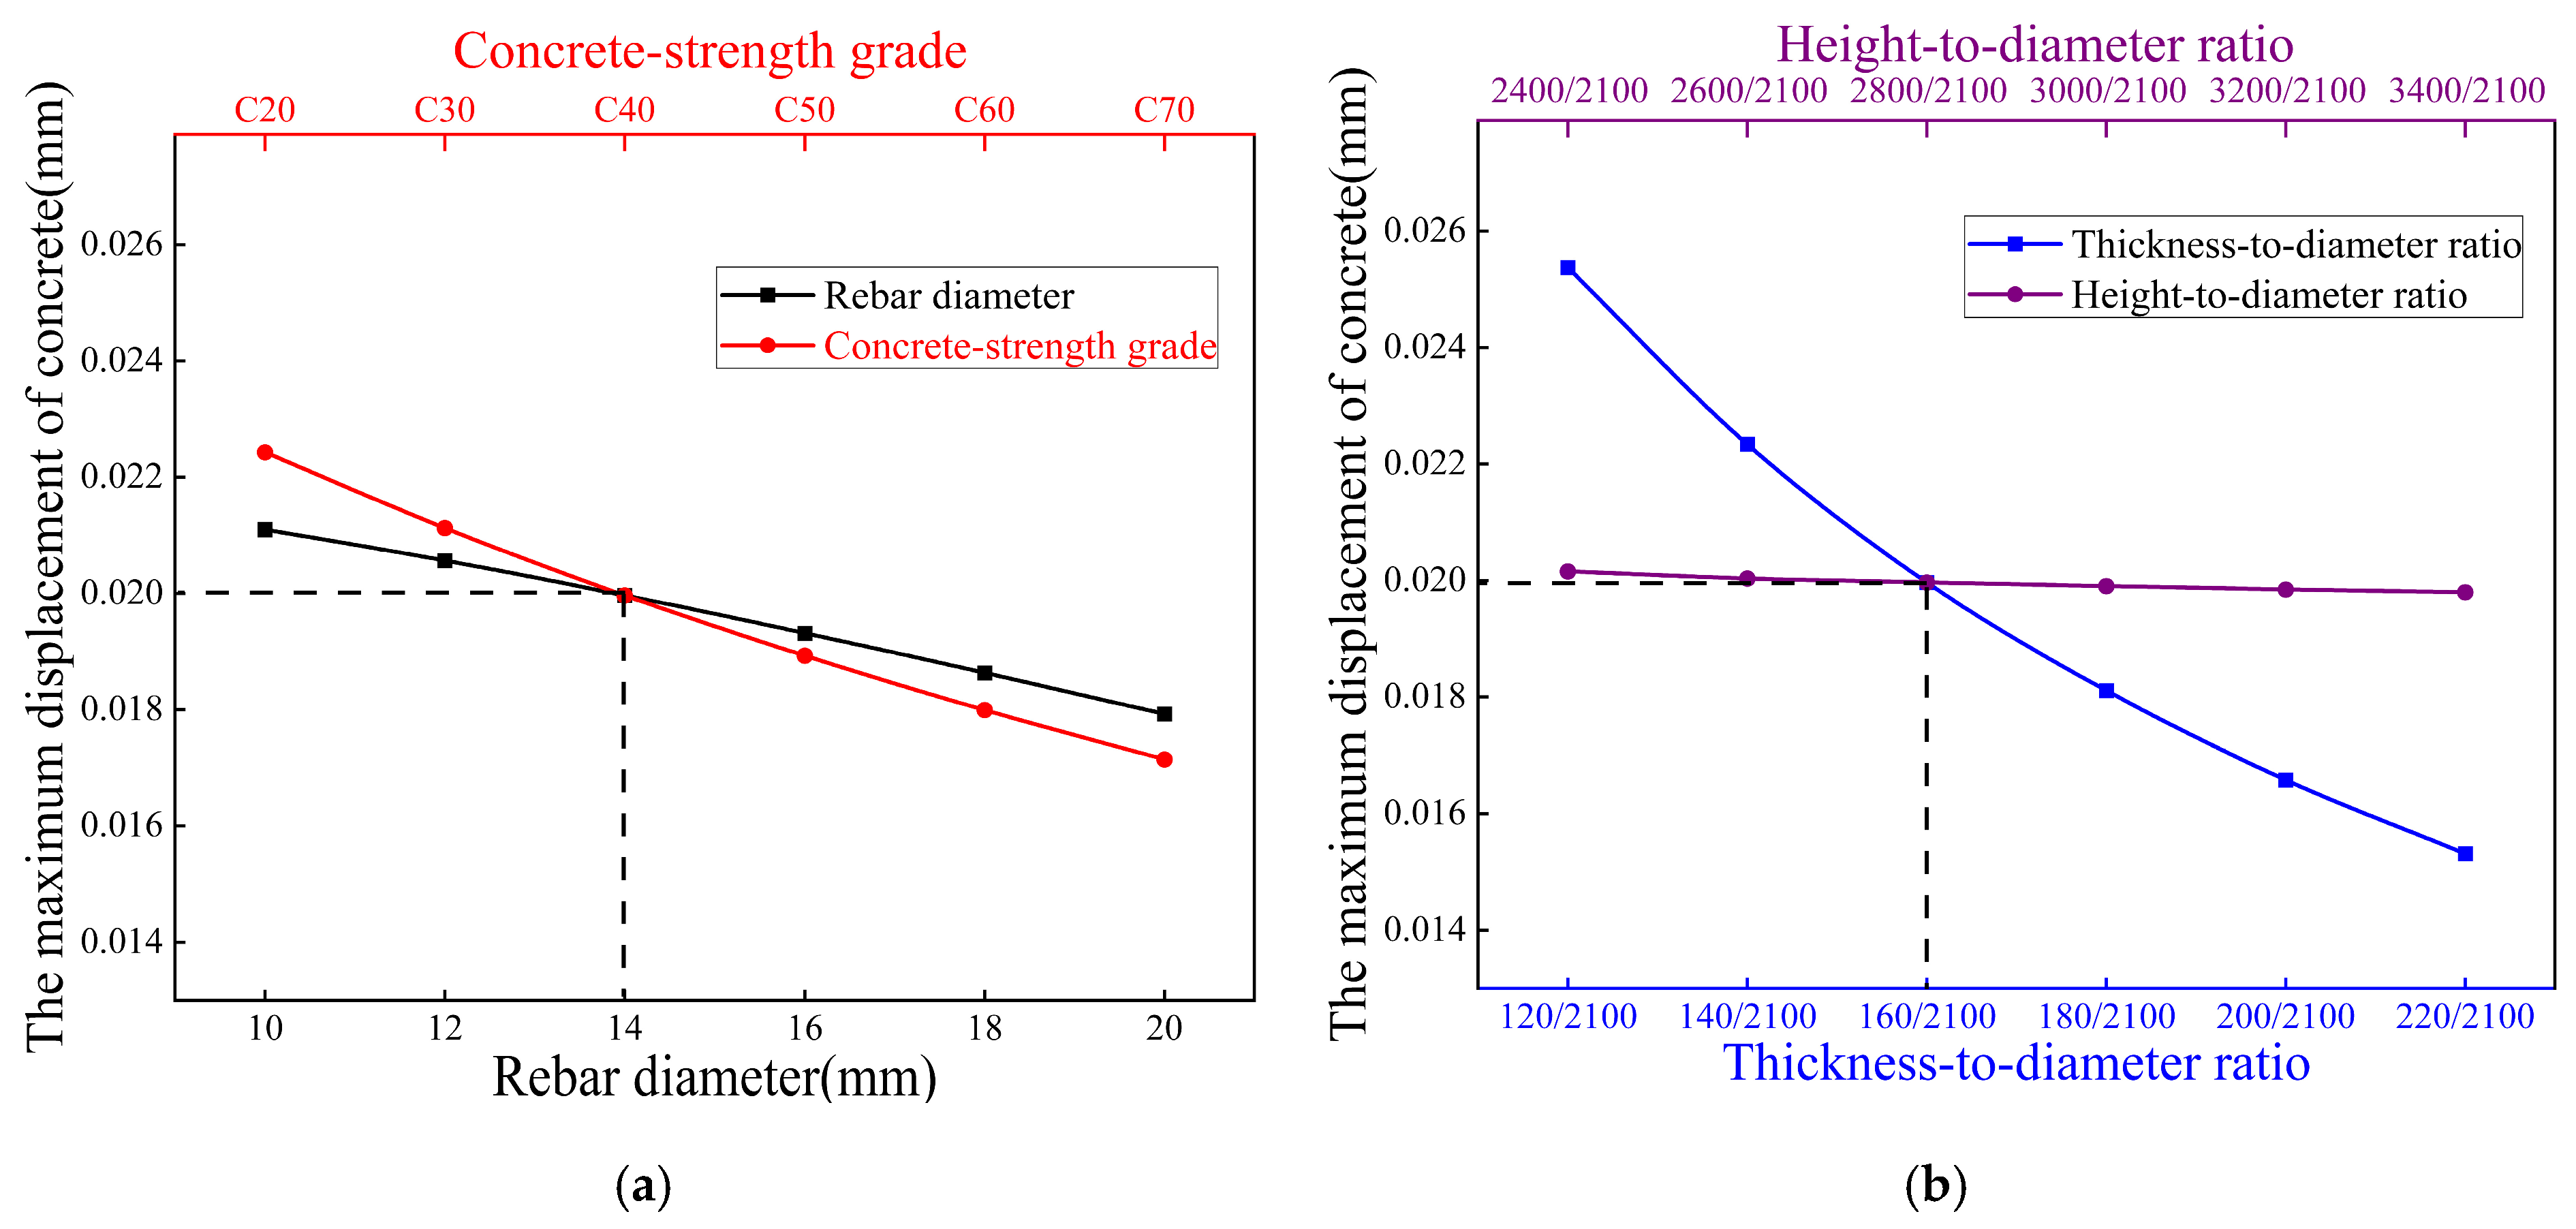
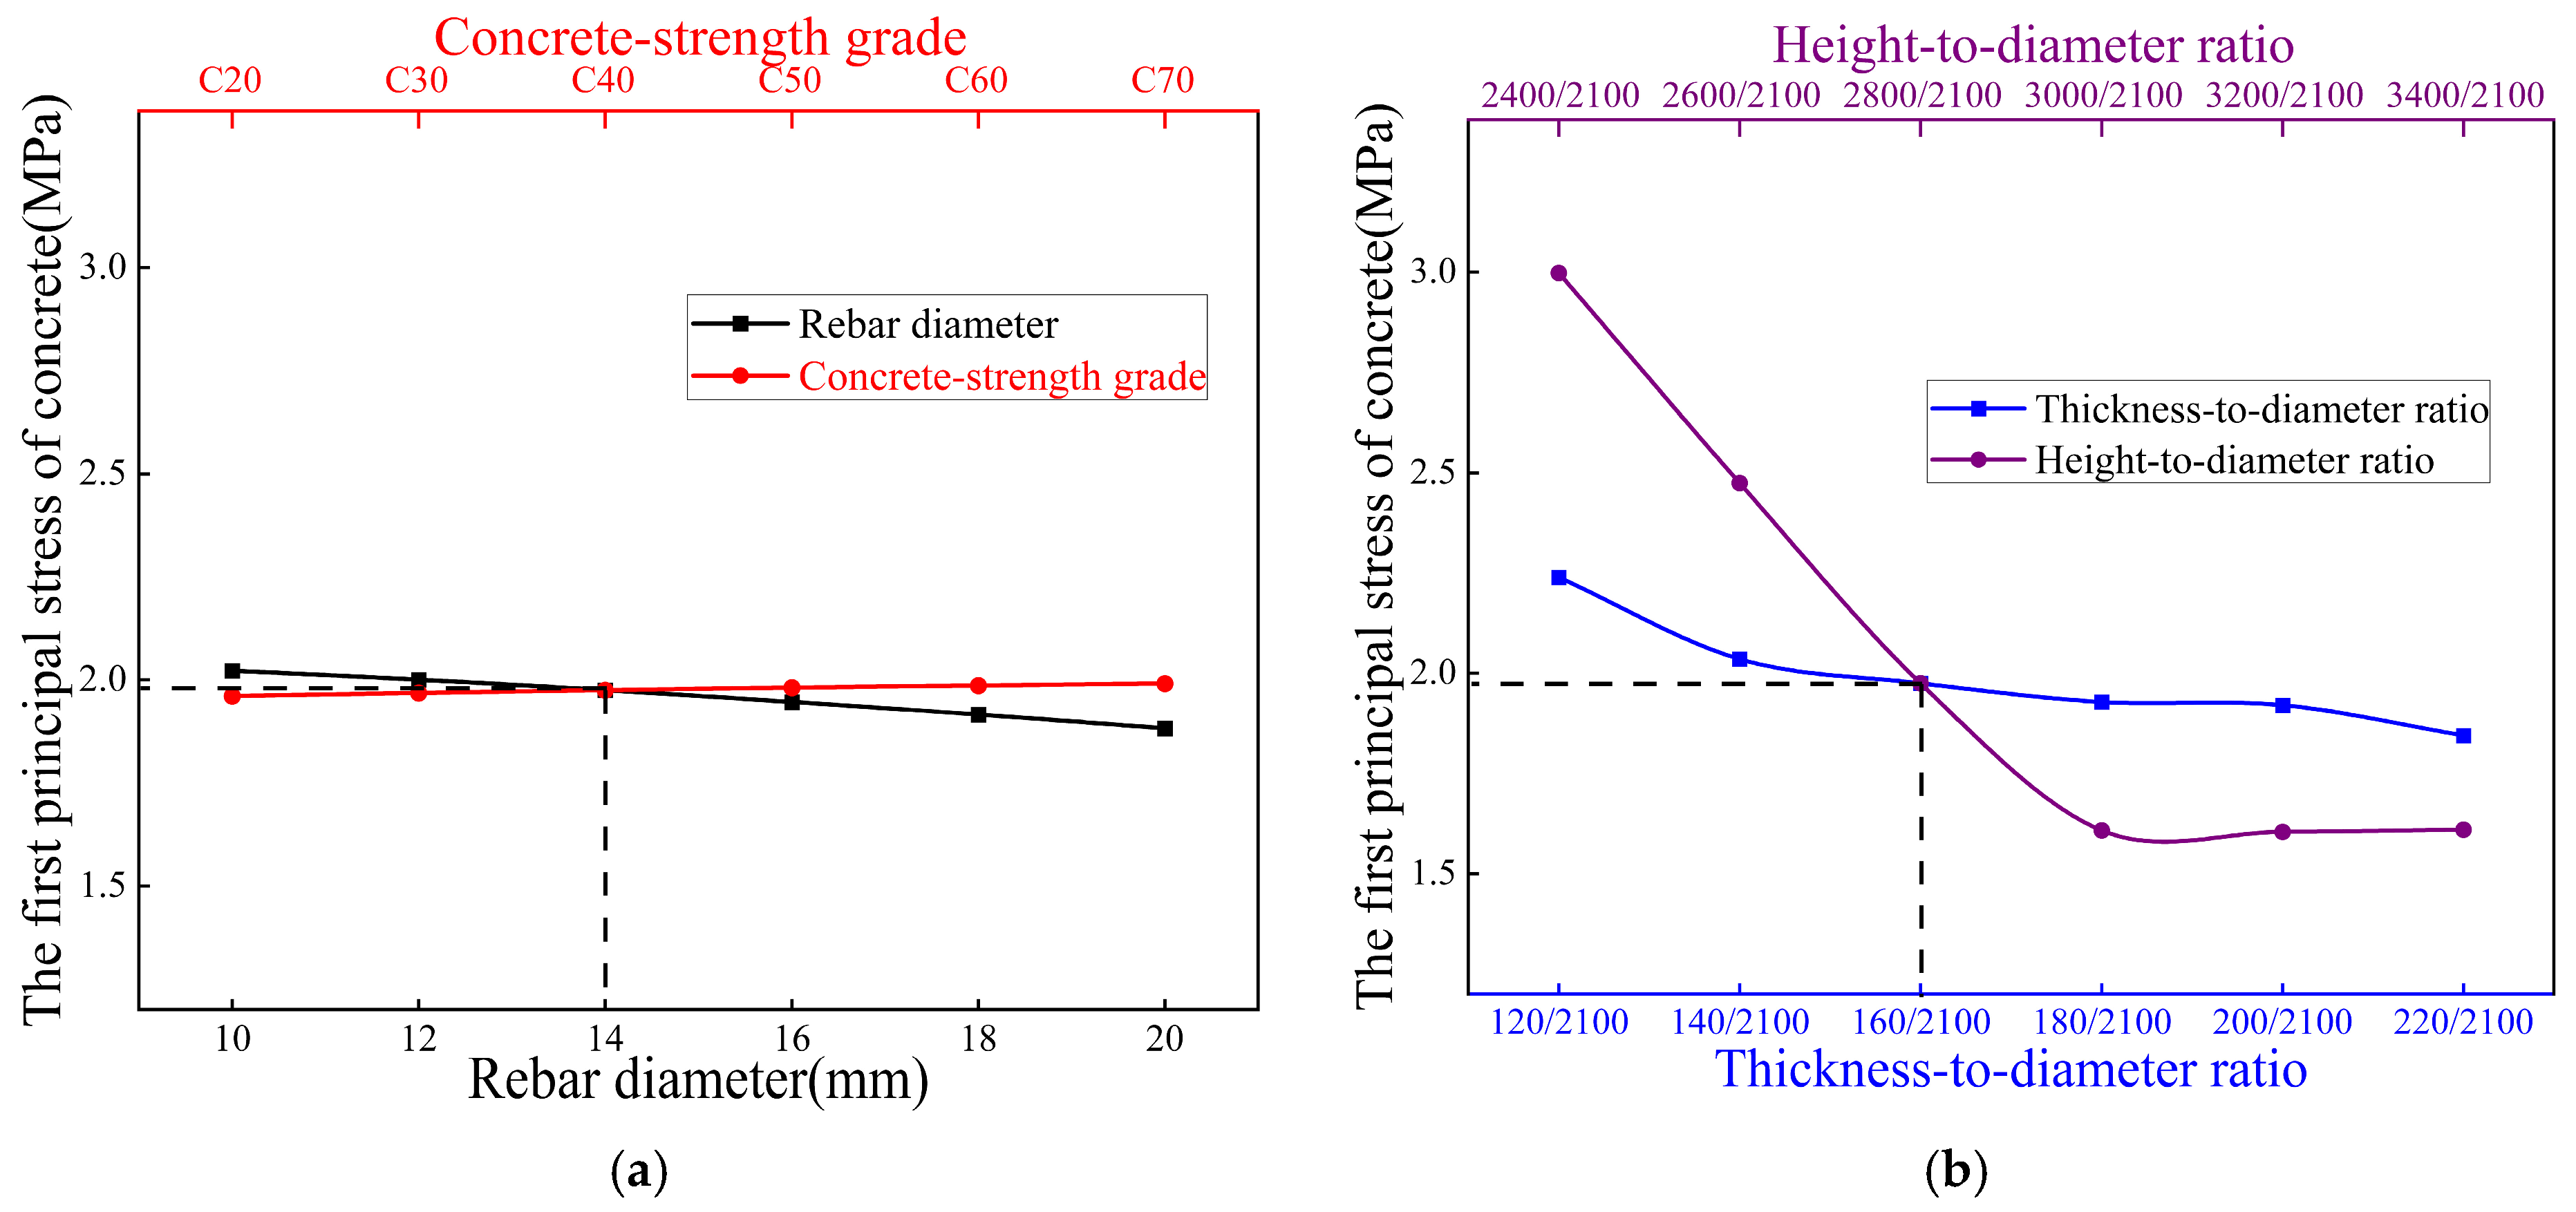
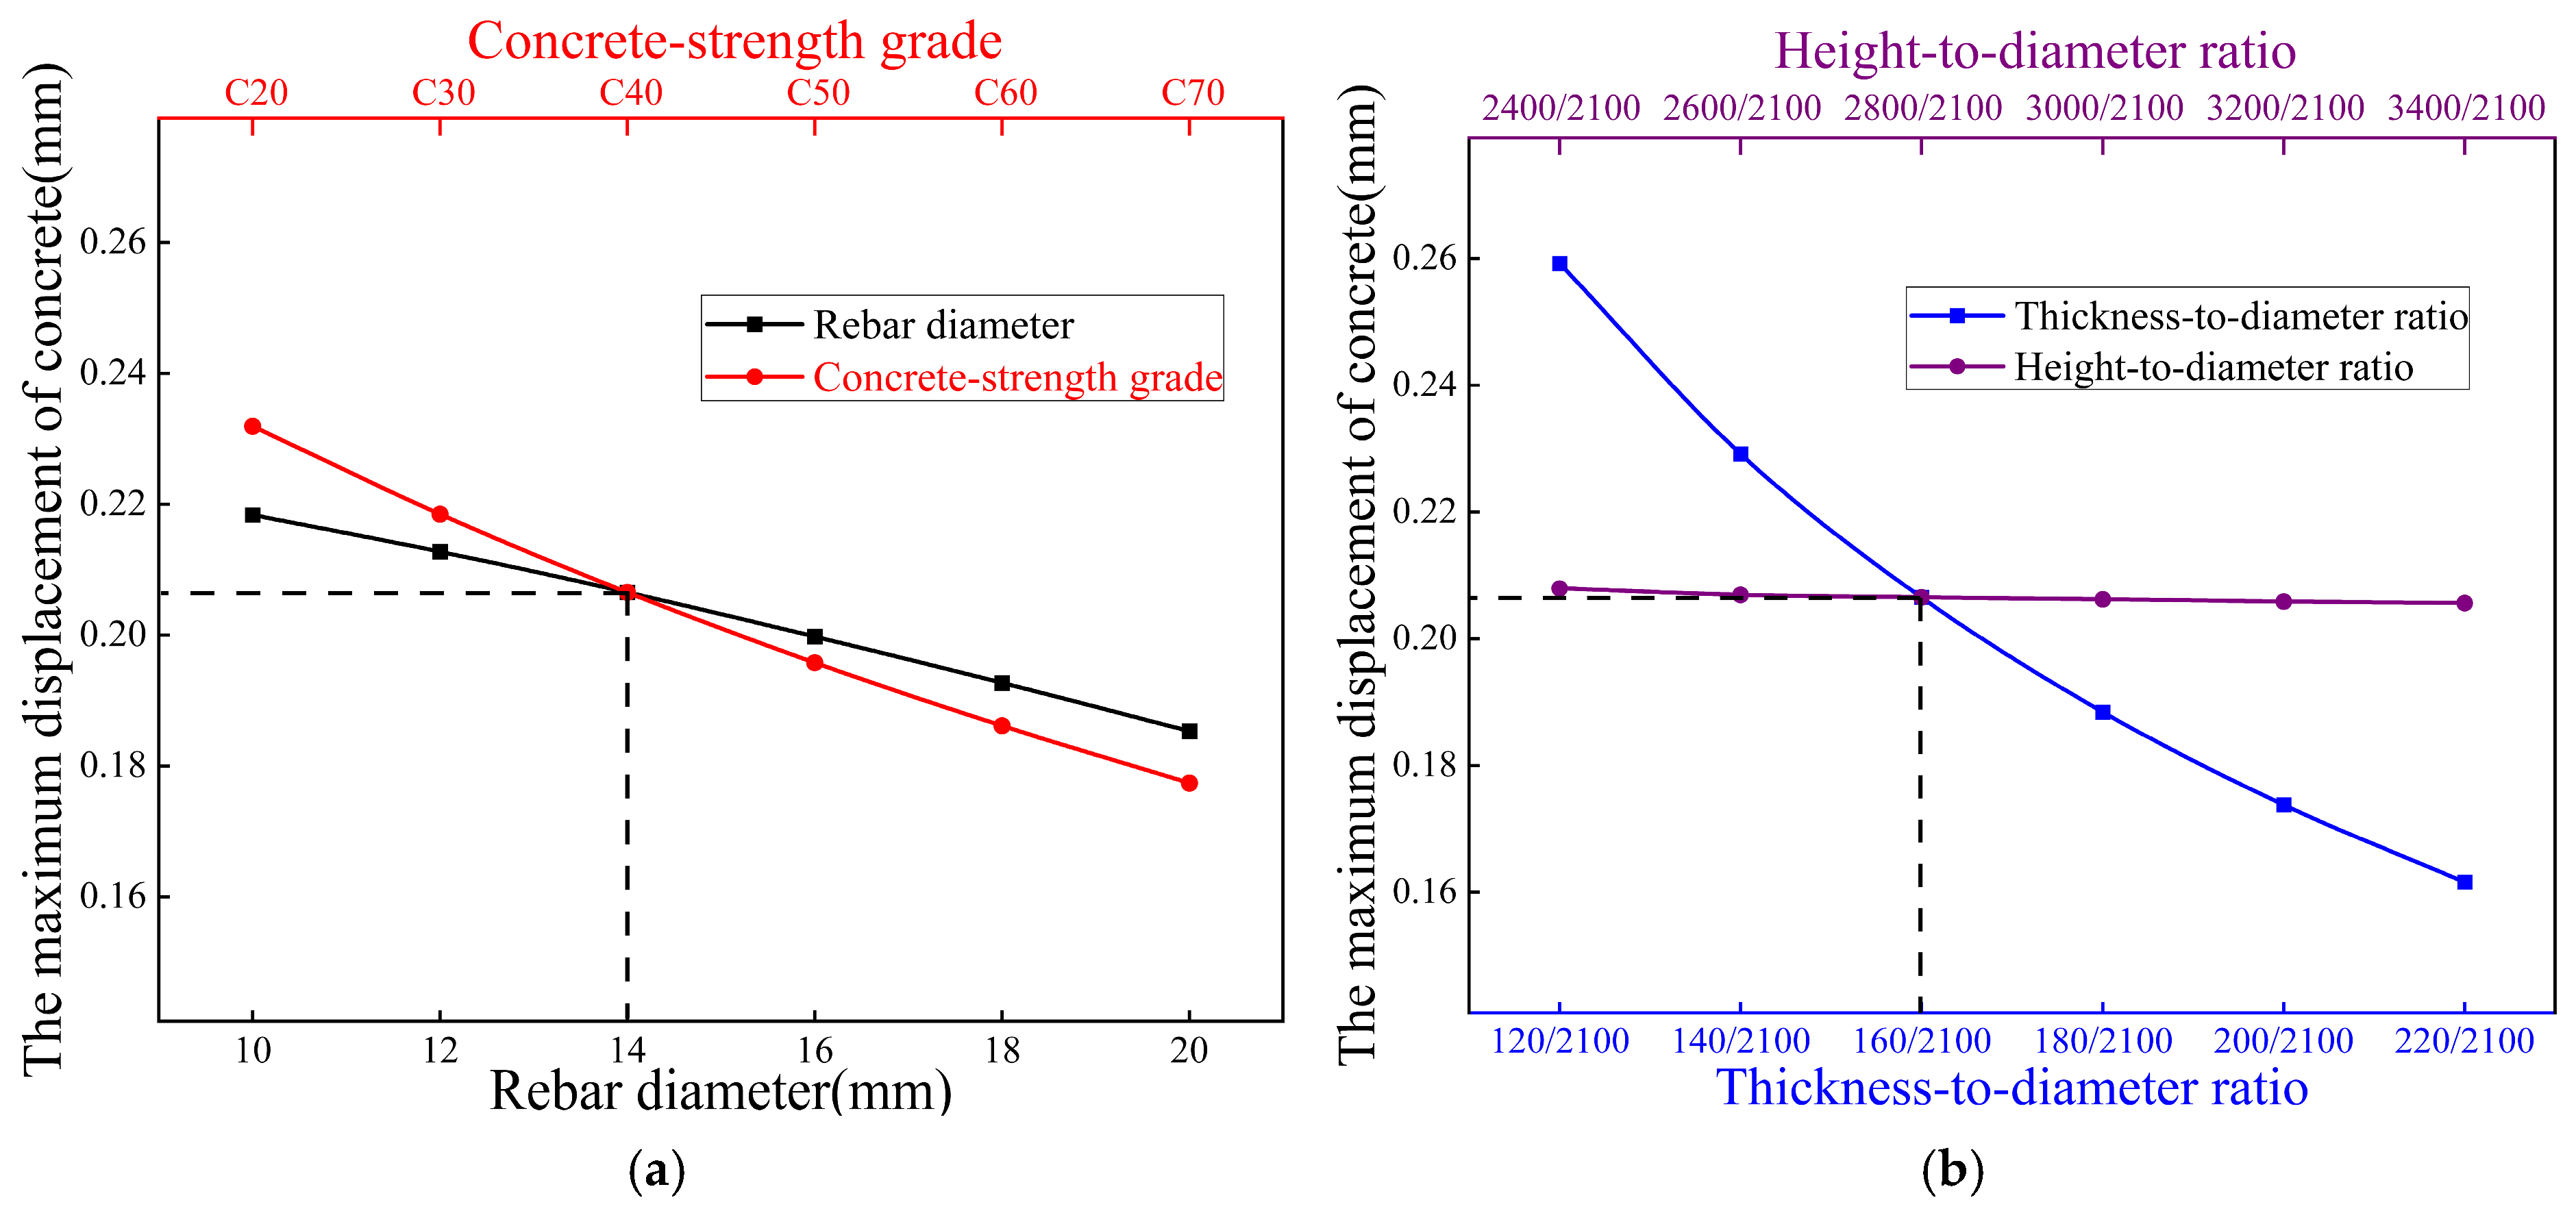
Longitudinal rebar diameter exhibits negligible influence on structural responses, demonstrating minimal impact on concrete maximum principal stress and displacement across all investigated conditions (including internal water pressure, external earth pressure, top loads, and buoyancy effects).
(3)
Thickness-to-diameter ratio governs displacement mitigation (14–23% reduction) but exerts dual stress effects, decreasing stress under internal pressure (e.g., 12% at 220 mm) while increasing it under external pressure (e.g., 4% at 220 mm), establishing its role as a displacement-control dominant parameter.
(4)
Concrete-strength grades (C30–C50) primarily serve displacement control under top loading, with limited stress influence under external pressure/buoyancy, but significant displacement reduction (e.g., 18% at C50). This contrasts with the adverse stress increase under internal pressure.
(5)
Height-to-diameter ratio induces condition-dependent stress trade-offs: reducing stress more than 18% beyond 3000 mm height under external pressure while amplifying stress more than 20% under top loads, reveals its context-sensitive optimization requirements.
(6)
Geometric parameter (thickness-to-diameter ratio, height-to-diameter ratio) optimization delivers superior efficacy over material adjustments, achieving 33–115% stress reduction at critical zones (e.g., 115% at walls, 830% at barrel tops) and 34–50% displacement mitigation. This demonstrates geometric tuning as the pivotal strategy for holistic structural enhancement. Structurally, the geometric optimization achieves measurable weight reduction, directly lowering material consumption. Logistically, standardized prefabrication offers inherent advantages in reducing on-site labor inputs and transportation volumes, due to component modularity. Combined with controlled stress levels below failure thresholds, these attributes contribute to improved technical feasibility and the life-cycle economy.
Theoretically, this study develops an integrated computational framework correlating multi-condition failure thresholds with parametric sensitivities for prefabricated oil tanks, advancing beyond conventional empirical approaches. The methodology systematically addresses land efficiency and construction complexity through its prefabricated circular design, while establishing quantifiable relationships between geometric parameters and structural performance. Practically, the derived sensitivity hierarchies and convergent optimization ranges provide actionable guidelines for balancing structural integrity with economic constraints in substation applications, directly mitigating traditional construction challenges. However, this work exhibits several limitations. Idealized soil–structure boundary conditions may compromise foundation response accuracy, while linear constitutive assumptions restrict analysis of concrete damage progression and rebar elasto-plasticity at ultimate states. The current optimization framework further omits transverse reinforcement detailing and lifecycle-cost integration. Subsequent research should establish refined soil-coupled computational models with nonlinear material frameworks, to enhance failure-mechanism prediction and develop multi-objective assessment protocols incorporating constructability and structural reliability, and ultimately validate optimized configurations through full-scale load testing.

Author Contributions

Conceptualization, X.L., C.Z. and P.W.; methodology, X.L., H.X. and Y.F.; data curation, H.X., Y.F. and X.S.; software, H.X.; validation, C.Z., H.X. and J.Z.; formal analysis, X.L., H.X. and J.Z.; investigation, X.L. and C.Z.; resources, X.L. and J.Z.; writing—original draft preparation, X.L., C.Z., H.X. and Y.F.; writing—review and editing, X.L., C.Z., H.X., X.S. and P.W.; visualization, C.Z. and X.S.; supervision, X.L. and Y.F.; project administration, X.L.; funding acquisition, C.Z. and J.Z. All authors have read and agreed to the published version of the manuscript.

Funding

This research was funded by the Guizhou Provincial Science and Technology Projects (No. 2023-207), the Knowledge Innovation Program of Wuhan Shuguang Project (No. 2023020201020436), and the Science Foundation of Wuhan Institute of Technology (No. K202222).

Data Availability Statement

The data that support the findings of this study are available from the corresponding author upon reasonable request.

Conflicts of Interest

Authors Xuan Lu, Hui Xu, Jie Zhu and Yan Feng were employed by the company Wuhan Huayuan Electric Power Design Institute Co., Ltd. The remaining authors declare that the research was conducted in the absence of any commercial or financial relationships that could be construed as a potential conflict of interest.

References

  1. Chen, W.C.; Liu, Y.D.; Gao, Y.Y.; Hu, J.Z.; Liao, Z.H.; Zhao, J. Intelligent Substation Noise Monitoring System: Design, Implementation and Evaluation. Energies 2024, 17, 3083. [Google Scholar] [CrossRef]
  2. Gong, W.; Wang, N. Study and Improvement of The Volume Availability of Transformer Accident Oil Pool. Rural Electrif. 2023, 2, 44–47. [Google Scholar]
  3. Wang, P.Y.; Ren, J.W.; Yu, M.D.; Zheng, X.Y.; Hu, H.F.; Hu, P.F. Structural Design of Fully Prefabricated Accident Oil Pool in Transformer Substation. Build. Struct. 2021, 51, 1049–1054. [Google Scholar]
  4. Uwe, Z.; Markus, H.; Claudio, D.D.; Dirk, S. Fracture and Damage Mechanics Modelling of Thin-Walled Structures—An Overview. Eng. Fract. Mech. 2009, 76, 5–43. [Google Scholar]
  5. Ma, H.; Jiao, P.; Li, H.F.; Cheng, Z.; Chen, Z.P. Buckling Analyses of Thin-Walled Cylindrical Shells Subjected to Multi-Region Localized Axial Compression: Experimental and Numerical Study. Thin-Walled Struct. 2023, 183, 110330. [Google Scholar] [CrossRef]
  6. Chen, C.; Li, Y.X.; Zhang, H.Y.; Li, Y.B.; Pan, Q.; Han, X.L. Investigation of A Renovating Process for Failure Clinched Joint to Join Thin-Walled Structures. Thin-Walled Struct. 2020, 151, 106686. [Google Scholar] [CrossRef]
  7. Liu, M.; Wang, W.X.; Wang, Y.X.; Long, Y. Study on Mechanical Properties of Pre-stressed Thin-Walled Cylinder. Mach. J. 2019, 57, 23–26. [Google Scholar]
  8. Chang, J.I.; Lin, C.-C. A Study of Storage Tank Accidents. J. Loss Prev. Process 2006, 19, 51–59. [Google Scholar] [CrossRef]
  9. Beshr, A.A.E.-W. Structural Data Analysis for Monitoring the Deformation of Oil Storage Tanks Using Geodetic Techniques. J. Surv. Eng. 2014, 140, 44–51. [Google Scholar] [CrossRef]
  10. Qu, Z.H.; Zhang, Y.; Cai, X.; Guan, J.M. Study on the Dimension Design of Rectangular Transformer Oil Containment Basins. J. Green Sci. Technol. 2022, 24, 256–258. [Google Scholar]
  11. Godoy, L.A. Buckling of Vertical Oil Storage Steel Tanks: Review of Static Buckling Studies. Thin-Walled Struct. 2016, 103, 1–21. [Google Scholar] [CrossRef]
  12. Maués, F.P.; Ferreira, M.P.; Díaz, R.A.S.; Liberati, E.A.P.; Trautwein, L.M.; Santos, J.P.B. Numerical Modelling of Flat Slabs with Different Amounts of Double-Headed Studs as Punching Shear Reinforcement. Buildings 2025, 15, 960. [Google Scholar] [CrossRef]
  13. Yang, F.; Zhao, H.; Ma, T.; Bao, Y.; Cao, K.; Li, X. Three-Dimensional Numerical Analysis of Seismic Response of Steel Frame–Core Wall Structure with Basement Considering Soil–Structure Interaction Effects. Buildings 2024, 14, 3522. [Google Scholar] [CrossRef]
  14. Hamoda, A.; Abadel, A.A.; Sennah, K.; Ahmed, M.; Zhang, X.; Emara, M. Shear Strengthening of RC Beams Incorporating Post-Tensioned Bars and Engineered Cementitious Composite Reinforced with Palm Fronds. Buildings 2024, 14, 3277. [Google Scholar] [CrossRef]
  15. Luo, S.Q.; Liu, X.H.; Fu, L.M. Experimental Study on Joint Waterproofing of U-type Stirrup Assembly Pipe Gallery. Chin. J. Undergr. Space Eng. 2021, 17, 728–732. [Google Scholar]
  16. Cheng, H. Optimal Design of Oil-Immersed Transformer Accident Oil Pool. Constr. Des. Eng. 2022, 3, 72–74. [Google Scholar]
  17. Cai, S.T.; Ren, B.T.; Wang, S.Q.; Xiao, S.; Liao, S.K. New Thoughts on the Design and Construction of The Main Transformer Accident Oil Pool in the Transformer Substation. Commun. Power Technol. 2018, 35, 234–236. [Google Scholar]
  18. Tao, C.D. Design of Emergency Oil Containment Basins for Main Transformers in Hydropower Stations. Hunan Water Conserv. Hydropower 2010, 6, 12–13. [Google Scholar]
  19. Wu, Z.; Hou, L.; Wu, S.Z.; Wu, X.G.; Liu, F.Y. The Time-to-Failure Assessment of Large Crude Oil Storage Tank Exposed to Pool Fire. Fire Saf. J. 2020, 117, 103192. [Google Scholar] [CrossRef]
  20. 22S521; Prefabricated Inspection Chambers Standard Drawings. Standards Press of China: Beijing, China, 2022.
  21. GB50229-2019; Standard for Design of Fire Protection for Fossil Fuel Power Plants and Substations. China Planning Press: Beijing, China, 2019.
  22. GB50059-2011; Code for Design of 35kV~110kV Substation. China Planning Press: Beijing, China, 2011.
  23. GB50160-2008; Fire Prevention Code of Petrochemical Enterprise Design. China Planning Press: Beijing, China, 2008.
  24. Zhao, S.H. Design of Tubular Transformer Emergency Oil Pool. Water Conserv. Hydropower News 2021, 42, 44–47. [Google Scholar]
  25. Zhang, T.; Hou, Z.M.; Chen, Q.J.; Li, X.Q.; Fang, Y.L.; Zhang, S.Y.; Sun, W. A Novel Damage Model Integrated into the Elastoplastic Constitutive Model and Numerical Simulations of Reinforced Concrete Structures Under Cyclic Loading. J. Build. Eng. 2024, 84, 108670. [Google Scholar] [CrossRef]
  26. Naser, M.Z.; Hawileh, R.A.; Abdalla, J. Modeling Strategies of Finite Element Simulation of Reinforced Concrete Beams Strengthened With FRP: A Review. J. Compos. Sci. 2021, 5, 19. [Google Scholar] [CrossRef]
  27. Meguro, K.; Tagel-Din, H. Applied Element Simulation of RC Structures Under Cyclic Loading. J. Struct. Eng. 2001, 127, 1295–1305. [Google Scholar] [CrossRef]
  28. Liu, Y.; Yang, G.S.; Qi, C.Y.; Zhang, P.; Cui, T.; Song, R. Experimental and Numerical Research on The Mechanical Properties of a Novel Prefabricated Diaphragm Wall–Beam Joint. Buildings 2025, 15, 1158. [Google Scholar] [CrossRef]
  29. Chahar, A.S.; Pal, P. Study on Various Properties of Reinforced Concrete—A Review. Mater. Today Proc. 2022, 65, 597–602. [Google Scholar] [CrossRef]
  30. Wang, Z.; Du, K.; Xie, Y.; Su, X.; Shi, Y.; Li, X.; Liu, T. Buckling Analysis of An Innovative Type of Steel-Concrete Composite Support in Tunnels. J. Constr. Steel Res. 2021, 179, 106503. [Google Scholar] [CrossRef]
  31. Fazeli, H.; Izadi Zaman Abadi, E.; Hosseini, S.J. Development of William-Warnke Failure Criteria Based on Experimental Studies of Scaled Masonry Materials. J. Struct. Constr. Eng. 2023, 9, 215–231. [Google Scholar]
  32. Xu, Z.; Li, J.; Wu, P.; Wu, C. Experimental Investigation of Triaxial Strength of Ultra-High Performance Concrete After Exposure to Elevated Temperature. Constr. Build. Mater. 2021, 295, 123689. [Google Scholar] [CrossRef]
  33. Zhou, Q.S. Parameters Analysis and Optimal Design for the Suspension Footbridge; Zhejiang University: Hangzhou, China, 2007; pp. 40–45. (In Chinese) [Google Scholar]
  34. Peng, Z.; Jia, L.; Xu, J.; Luo, K.; Pei, H. Parameter Study and Optimization of Static Performance for a Hybrid Cable-Stayed Suspension Bridge. Buildings 2024, 14, 3514. [Google Scholar] [CrossRef]
  35. Shir Ofer, M.; Emmerich, M. Multi-Objective Mixed-Integer Quadratic Models: A Study on Mathematical Programming and Evolutionary Computation. IEEE Trans. Evol. Comput. 2024, 3, 661–675. [Google Scholar]
  36. Li, Z.; Lu, D.; Gao, X. Optimization of mixture proportions by statistical experimental design using response surface method—A review. J. Build. Eng. 2021, 36, 102101. [Google Scholar] [CrossRef]
Figure 1. Schematic diagram of the traditional and novel integral precast accident oil tank. (a) Three-dimensional traditional solid structure. (b) Three-dimensional novel solid structure. (c) Internal structural configuration.
Buildings 15 02477 g001aBuildings 15 02477 g001b
Figure 2. Finite element model of the shaft chamber in the new integral precast accident oil tank. (a) Reinforcement. (b) Concrete.
Buildings 15 02477 g002
Figure 3. The first principal-stress nephogram of the integral and sectional views of the accident oil tank under different internal hydrostatic pressures of the load case ①: (a) Eight times the initial hydrostatic pressure; (b) Ten times the initial hydrostatic pressure; (c) Eleven times the initial hydrostatic pressure.
Buildings 15 02477 g003aBuildings 15 02477 g003b
Figure 4. The maximum displacement of the oil tank under different internal hydrostatic pressures of the load case ①.
Buildings 15 02477 g004
Figure 5. The first principal-stress nephogram of the integral and sectional views of the accident oil tank under different external soil pressures of the load case ②: (a) 7 times the initial soil pressure; (b) 7.5 times the initial soil pressure; (c) 8.8 times the initial soil pressure.
Buildings 15 02477 g005
Figure 6. The maximum displacement of the accident oil tank under different external soil pressures of the load case ②.
Buildings 15 02477 g006
Figure 7. The first principal-stress nephogram of the integral and sectional views of the accident oil tank under the combined external loads (earth pressure and top load) of the load case ③: (a) Two times the initial combined external load (earth pressure and top load); (b) Seven times the initial combined external load (soil pressure and top load).
Buildings 15 02477 g007
Figure 8. The maximum displacement of the accident oil tank under different combined external loads (soil pressure and top load) of the load case ③.
Buildings 15 02477 g008
Figure 9. The first principal-stress nephogram of the integral and sectional views of the accident oil tank under different combined external loads (soil pressure and buoyancy) of the load case ④: (a) 1.25 times the initial combined external load (soil pressure and buoyancy); (b) 1.5 times the initial combined external load (soil pressure and buoyancy).
Buildings 15 02477 g009
Figure 10. The maximum displacement of the accident oil tank under different combined external loads (soil pressure and buoyancy) of the load case ④.
Buildings 15 02477 g010
Figure 11. Flowchart of optimization design.
Buildings 15 02477 g011
Figure 12. Comparison of the first principal stress of concrete under load case ①: (a) different rebar diameters and concrete-strength grades; (b) different thickness-to-diameter ratios and height-to-diameter ratios.
Buildings 15 02477 g012
Figure 13. Comparison diagram of maximum displacement of concrete under load case ①: (a) different rebar diameters and concrete -strength grades; (b) different thickness-to-diameter ratios and height-to-diameter ratios.
Buildings 15 02477 g013
Figure 14. Comparison of the first principal stress of concrete under load case ②: (a) different rebar diameters and concrete-strength grades; (b) different thickness-to-diameter ratios and height-to-diameter ratios.
Buildings 15 02477 g014
Figure 15. Comparison diagram of maximum displacement of concrete under load case ②: (a) different rebar diameters and concrete-strength grades; (b) different thickness-to-diameter ratios and height-to-diameter ratios.
Buildings 15 02477 g015
Figure 16. Comparison of the first principal stress of concrete under load case ③: (a) different rebar diameters and concrete-strength grades; (b) different thickness-to-diameter ratios and height-to-diameter ratios.
Buildings 15 02477 g016
Figure 17. Comparison diagram of maximum displacement of concrete under load case ③: (a) different rebar diameters and concrete-strength grades; (b) different thickness-to-diameter ratios and height-to-diameter ratios.
Buildings 15 02477 g017
Figure 18. Comparison of the first principal stress of concrete under load case ④: (a) different rebar diameters and concrete-strength grades; (b) different thickness-to-diameter ratios and height-to-diameter ratios.
Buildings 15 02477 g018
Figure 19. Comparison diagram of maximum displacement of concrete under load case ④: (a) different rebar diameters and concrete-strength grades; (b) different thickness-to-diameter ratios and height-to-diameter ratios.
Buildings 15 02477 g019
Figure 20. Comparison of results on inner wall before and after optimization under load case ①: (a) the first principal stress; (b) total displacement.
Buildings 15 02477 g020
Figure 21. Comparison of results on inner wall before and after optimization under load case ②: (a) the first principal stress; (b) total displacement.
Buildings 15 02477 g021
Figure 22. Comparison of results on inner wall before and after optimization under load case ③: (a) the first principal stress; (b) total displacement.
Buildings 15 02477 g022
Figure 23. Comparison of results on inner wall before and after optimization under load case ④: (a) the first principal stress; (b) total displacement.
Buildings 15 02477 g023
Table 1. Material parameters of concrete and reinforcement [28,29,30].
Tensile Strength/(MPa)Compressive Strength/(MPa)Elasticity
Modulus/(MPa)
Mass
Density/(kg·m−3)
Poisson’s
Ratio
C40 grade
for concrete
1.7119.13.25 × 10425000.2
HPB400 grade
reinforced bar
3603602.0 × 10578500.3
Table 2. Definitions of the William–Warnke five-parameter failure criterion [31,32].
NotationMeaningValue (MPa)
f t Uniaxial ultimate tensile strength1.71
f c Uniaxial ultimate compressive strength17.1
f cb Isobaric biaxial compressive strength20.52
σ h a Hydrostatic pressure0
f 1 Biaxial axial compressive strength under hydrostatic pressure24.8
f 2 Uniaxial axial compressive strength under hydrostatic pressure29.5
Table 3. Range of design variable values.
Design VariableNameUnitLower BoundUpper Bound
Diameter of longitudinal reinforcement barsDiamm1020
Model wall thicknessThinmm140220
HeightHightmm26003400
Concrete elastic modulusEXMPa3.05 × 1053.65 × 105
Note: All variables are cost-positive; reducing parameter values while meeting mechanical targets directly lowers cost.
Table 5. Comparison of data before and after optimization under load case ②.
Pre-Optimization Maximum ValuePost-Optimization Maximum ValuePre-Optimization Minimum ValuePost-Optimization Minimum Value
First principal stress on outer wall (MPa)0.310.14−0.075−0.053
Total displacement on outer wall (mm)0.0200.0157.5 × 10−44.3 × 10⁻⁴
Table 6. Comparison of data before and after optimization under load case ③.
Pre-Optimization Maximum ValuePost-Optimization Maximum ValuePre-Optimization Minimum ValuePost-Optimization Minimum Value
First principal stress on outer wall (MPa)0.250.14−0.075−0.058
Total displacement on outer wall (mm)0.0190.0146.5 × 10−43.8 × 10⁻⁴
Table 7. Comparison of data before and after optimization under load case ④.
Pre-Optimization Maximum ValuePost-Optimization Maximum ValuePre-Optimization Minimum ValuePost-Optimization Minimum Value
First principal stress on outer wall (MPa)1.270.20−0.76−0.63
Total displacement on outer wall (mm)0.200.143.01 × 10−31.12 × 10⁻³
Table 8. The influencing factors of key parameters on the overall performance.
Influencing FactorsRebar DiameterThickness-to-Diameter
Ratio
Height-to-Diameter
Ratio
Concrete-Strength
Grade
Load case ①Principal stress−13.09−43.72−36.622.70
Displacement−12.39−37.652.60−47.06
Load case ②Principal stress−12.51−18.99−20.092.23
Displacement−22.87−46.53−1.80−28.66
Load case ③Principal stress−5.82−49.8856.96−2.14
Displacement1.50−24.7024.67−49.98
Load case ④Principal stress−8.45−6.75−64.632.17
Displacement−20.06−36.93−0.70−39.54
Weighted
average
Principal stress−9.97−29.83−16.101.24
Displacement−13.46−36.456.19−41.31
Table 9. Summary of the optimization design solutions under different load cases.
Load CaseRebar Diameter
(mm)
Thickness-to-Diameter
Ratio
Height-to-Diameter
Ratio
Concrete-Strength
Grade
20200/21003200/2100C60
14160/21002800/2100C50
20160/21003200/2100C70
18160/21002800/2100C60
Disclaimer/Publisher’s Note: The statements, opinions and data contained in all publications are solely those of the individual author(s) and contributor(s) and not of MDPI and/or the editor(s). MDPI and/or the editor(s) disclaim responsibility for any injury to people or property resulting from any ideas, methods, instructions or products referred to in the content.

