Abstract
Urbanization in China and the proliferation of high-rise office buildings have led to increased demand for daylighting and thermal comfort. These requirements often result in reliance on active systems, including heating, cooling, and artificial lighting, which increase energy consumption. Existing studies have often focused on individual cases or room-scale models, which makes it difficult to generalize findings to the design of various high-rise office building types. Therefore, in this study, parametric prototype building models for high-rise office buildings were developed based on surveys of completed and under-construction projects. These surveys reflected actual design practices and were used to support systematic performance evaluation and typology-level optimization. Building performance was simulated using Grasshopper and Honeybee to generate large-scale datasets, and stacking ensemble learning models were used as surrogate predictors for energy use, daylighting, and thermal comfort. Multi-objective optimization was conducted using the non-dominated sorting genetic algorithm III (NSGA-III), followed by strategy formulation. The results revealed the following: (1) the proposed prototype model establishes clear parameter ranges for geometry, envelope design, and thermal performance, offering reusable models and data; (2) the stacking ensemble model outperforms individual models, improving the coefficient of determination (R2) by 0.5–16.1%, with mean squared error (MSE) reductions of 4.4–70.6%, and mean absolute error (MAE) reductions of 2.8–45.8%; (3) space length, aspect ratio, usable area ratio, window U-value, and solar heat gain coefficient (SHGC) were identified as primary performance drivers; and (4) optimized solutions reduced energy use by 3.79–11.81% and enhanced daylighting comfort by 40.16–50.32% while maintaining thermal comfort. The proposed framework provides localized, data-driven guidance for early-stage performance optimization in high-rise office building design.
1. Introduction
1.1. Background of the Study
With China’s urbanization rate rising from 51.8% in 2011 to 65.22% in 2023 [1], the construction of high-rise office buildings has accelerated significantly. These structures, characterized by vertical spatial efficiency and compact design, have become integral to urban skylines [2]. However, their rapid proliferation has introduced substantial challenges in energy consumption and carbon emissions. According to the 2024 Report on Carbon Emissions in China’s Urban and Rural Construction Sector [3], public buildings account for 41% of national energy use (490 million tce) and carbon emissions (940 million tCO2), with demand continuing to increase. High-rise office buildings, in particular, exhibit elevated energy intensity due to increased requirements for vertical transportation, heating, ventilation, and air conditioning systems, lighting, and equipment operation, as well as heightened thermal losses due to their height. Their per-unit-area electricity consumption is reported to be up to 2.5 times that of low-rise counterparts [4,5]. Consequently, these buildings represent a critical target for energy conservation and emission reduction, forming the central focus of this study.
In practical design optimization, prioritizing energy conservation alone is inadequate. The growing emphasis on sustainable development has shifted the focus toward comprehensive building performance enhancement. As primary work environments, high-rise office buildings must not only minimize energy use but also ensure adequate daylighting and thermal comfort to support occupant well-being and productivity [6]. However, achieving thermal comfort often necessitates high air-conditioning energy, while improving daylighting through increased window-to-wall ratios can result in summer overheating and winter heat loss. These outcomes are significantly affected by factors such as building geometry, envelope thermal performance, and local climate [7,8]. Trade-offs among energy consumption, daylighting, and thermal comfort are present in high-rise office building design. The complexity and number of design variables make multi-objective optimization particularly challenging during early design stages. Therefore, establishing appropriate parameter ranges and achieving a balanced integration of multiple performance goals at this stage is a key research challenge in the pursuit of energy-efficient and comfortable high-rise office buildings.
1.2. Related Work
Building performance is typically evaluated through on-site measurements, simulation-based analyses, and, more recently, data-driven predictive models. In conventional design workflows, performance simulations are often postponed to later stages due to their high computational demands and extended processing times, limiting their effectiveness in early-stage decision-making [9]. However, prior research indicates that early design decisions exert a more substantial influence on overall building performance and offer greater cost-efficiency [10]. Consequently, integrating performance simulation and multi-objective optimization into the early design phase has emerged as a key focus in building design research, aiming to support informed trade-offs among competing performance objectives.
With the advancement of multi-objective optimization algorithms and building performance simulation tools, research on the multi-objective optimization of office building performance has progressed significantly and in greater depth [11,12]. For instance, Giouri et al. [13] utilized the Ladybug and Honeybee plugins alongside the non-dominated sorting genetic algorithm II (NSGA-II) [14] to optimize a high-rise office building in Greece. NSGA-II is an evolutionary algorithm that is widely used for solving multi-objective optimization problems through non-dominated sorting and crowding distances. Their results demonstrated a 33% reduction in annual energy consumption while enhancing indoor thermal comfort. Talaei et al. [15] optimized microalgae photobioreactor designs to balance energy use intensity (EUI) and useful daylight illuminance (UDI), demonstrating the impact of passive design parameters on both energy and daylighting performance. Luo et al. [16] applied the hypervolume estimation algorithm to perform dual-objective optimization targeting life-cycle energy use and economic cost. Baghoolizadeh et al. [17] focused on optimizing the position and size of Venetian blinds to reduce energy consumption and improve visual comfort. Additional studies have conducted multi-objective optimization for green roofs and façades in various climate zones [18], exterior shading parameters [19], and louver geometries [20]. Increasing emphasis has also been placed on the integration of double-skin façades [21], automated shading systems [22], phase-change materials [23], and photovoltaic façades [24]. These investigations underscore the importance of holistically balancing energy efficiency, daylighting, thermal comfort, and economic performance. Collectively, they have contributed to the development of methodological frameworks and decision-support tools that facilitate quantitative, visual, and practical guidance in office building design.
Although the integration of simulation and optimization algorithms has significantly contributed to building design, their high computational cost and time requirements remain key limitations [25]. To overcome these challenges, machine learning (ML) surrogate models have been introduced to approximate and replace computationally intensive simulation processes [26]. ML techniques offer not only efficient predictive capabilities but also the ability to capture complex relationships between design variables and performance outcomes, thereby supporting sensitivity analysis and improving interpretability. For example, Lin et al. [27] employed artificial neural networks to predict daylighting performance across various façade designs. Yan et al. [28] combined genetic algorithms with eXtreme gradient boosting (XGBoost) [29], which is a scalable and regularized gradient boosting framework for decision trees, to efficiently estimate daylighting and thermal performance in office buildings. Gao et al. [30] developed a stacking ensemble learning model for short-term cooling load prediction, enhancing robustness and generalizability through feature selection. Other studies [31] have integrated green building information modeling platforms with interpretable ML methods to examine the influence of design parameters on energy consumption, offering guidance for energy-efficient design. Collectively, these efforts have significantly reduced the computational burden of multi-objective optimization and introduced effective, interpretable, data-driven tools to support performance trade-offs during early-stage building design.
Building on ML surrogate models, recent studies have further advanced their integration with ensemble learning methods and multi-objective optimization algorithms to support multi-performance objective optimization during the design phase. For instance, Yang et al. [32] applied stacking ensemble learning in combination with NSGA III to optimize phase-change-material-enhanced building envelopes for a two-story residential building in Shenzhen, achieving substantial reductions in operational energy use while improving economic and carbon performance. Shen et al. [33] implemented an interpretable stacking ensemble model integrated with NSGA-III to optimize energy consumption, daylighting, and outdoor thermal comfort in the Jiangsu University Library. Zheng et al. [34] combined TRNSYS [35], which is a transient systems simulation program for modeling the dynamic performance of thermal and energy systems, with neural networks and genetic algorithms to optimize exterior wall insulation thickness in a six-story office building in China. Additionally, other studies [36] employed particle swarm optimization–support vector machine surrogate models with NSGA-III to optimize photovoltaic systems for roofs, walls, and windows in net-zero energy office buildings in Beijing. These efforts highlight the growing potential of combining ML and multi-objective optimization in enhancing the efficiency, accuracy, and practicality of performance-based building design.
While existing research has advanced multi-objective optimization in office building design and provided valuable insights for practice, two key limitations remain. First, most studies focus on the parameter space of a single project or individual room, seeking locally optimal solutions through variable fine-tuning. This narrow scope limits the ability to capture the diverse design characteristics and functional requirements of an entire building type, reducing the generalizability and practical applicability of the findings. Second, although recent work has begun integrating ensemble learning with multi-objective optimization in specific cases, systematic investigations remain lacking for high-rise office buildings, which involve high design complexity and numerous variables. To address these gaps, a parametric prototype model should be developed based on real survey data to represent the typical design space of high-rise office buildings. This would enable a more comprehensive evaluation of the applicability and effectiveness of ML surrogate models and multi-objective optimization algorithms within complex design parameter settings. Such an approach would offer scientific support and practical guidance for early-stage, location-specific, multi-performance optimization of high-rise office buildings in cold climates.
1.3. Aims and Originality
In summary, to meet the multi-objective optimization demands of energy consumption, daylighting, and thermal comfort during the early design stage of high-rise office buildings, this study proposes a localized optimization methodology tailored to the design characteristics of this building type. Drawing on actual project survey data and statistical analysis from Shandong Province, China, representative design parameter ranges are systematically defined to reflect regional and typological specificity. By integrating building performance simulation, ML surrogate models, multi-objective optimization algorithms, and entropy-weighted TOPSIS-based decision-making, the study aims to develop an efficient and generalizable framework to support trade-off decisions among multiple performance objectives. The main objectives and innovations of this study are outlined as follows:
- This study first defines representative design parameter ranges for high-rise office buildings through actual project surveys and statistical analysis. Parametric prototype building models are then developed to reflect the practical design space, providing a scientific foundation for subsequent performance simulation and optimization efforts. These models and datasets are designed to be reusable for future research and practical applications.
- Large-scale datasets are generated through building performance simulations, and stacking ensemble learning is employed to construct multi-performance prediction models. These models are integrated with the NSGA-III algorithm to achieve multi-objective optimization of energy consumption, daylighting, and thermal comfort in the early design stages.
- Using high-rise buildings in Shandong Province as a case study, optimized parameter ranges are extracted from the Pareto front (the set of non-dominated solutions that represents the optimal trade-offs among conflicting objectives) [37], and design recommendations are proposed. This provides localized guidance for performance optimization in cold climates, supporting informed decision-making for early-stage high-rise office building design.
The remainder of this paper is structured as follows. Section 2 outlines the research methodology, including the investigation and definition of design parameter ranges, the selection of performance simulation indicators, the process of dataset generation, the development of ML surrogate models, and the implementation of multi-objective optimization. Section 3 details the application of the proposed approach to high-rise office buildings in Shandong Province, presenting the survey results and the modeling process of the parametric prototype building. Section 4 and Section 5 discuss the performance prediction outcomes, analyze the influence of design variables on building performance, present the results of the multi-objective optimization, and propose corresponding design strategies. Finally, Section 6 concludes the study and suggests directions for future research.
2. Methods
2.1. Overview of the Workflow
The research framework of this study is illustrated in Figure 1. This framework is designed to enable multi-objective performance prediction and optimization of energy use, daylighting, and thermal comfort for high-rise office buildings at the early design stage. The workflow consists of five main steps. First, representative design parameter ranges are established based on on-site case surveys, design drawings, and a comprehensive literature review. Second, parametric prototype building models covering the defined design space are developed using the Rhino and Grasshopper platforms. Third, building performance simulations are conducted to evaluate EUI, UDI, and predicted mean vote (PMV). These simulations utilize Latin hypercube sampling in conjunction with the Ladybug and Honeybee plugins, generating a robust and diverse sample database. In the fourth step, a stacking ensemble learning prediction model is constructed by integrating multiple ML algorithms. The model’s accuracy is validated, and Shapley Additive Explanation (SHAP) analysis is used to interpret the influence of key design parameters on performance outcomes. Finally, the NSGA-III algorithm is employed to derive a Pareto front of optimal solutions, followed by the application of the entropy-weighted TOPSIS method for multi-criteria decision-making. This ranking and analysis process supports the identification of effective design strategies under competing performance objectives. The specific methodologies and processes involved in each step are detailed in the following sections.
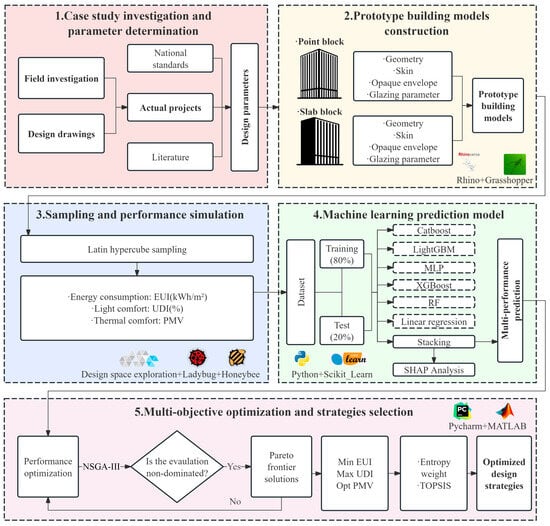
Figure 1.
Overview of research framework.
2.2. Investigation and Definition of Design Parameter Ranges
To ensure the rationality, representativeness, and applicability of the design parameter ranges used in multi-objective optimization, this study defines the design parameter space for high-rise office buildings through actual project surveys and statistical analysis. Key references include prior research on building performance optimization design [19,28,33,34], relevant design codes, and practical engineering experience. Based on these sources, critical parameters were identified and grouped into three main categories. This first category includes building geometric parameters, such as building form, orientation, space length, aspect ratio, space height, number of floors, and the usable area ratio of standard floors. The second category covers skin design parameters, specifically window-to-wall ratio (WWR), external shading width, and external shading spacing. The third category focuses on envelope thermal performance parameters, including the U-values of exterior walls, roofs, and windows, along with the solar heat gain coefficient (SHGC) of windows. These parameters are recognized as having a substantial influence on energy use, daylighting performance, and indoor thermal comfort, making them essential variables for early-stage multi-objective optimization in high-rise office building design.
After identifying the key parameters for investigation, a systematic survey was conducted on both existing and under-construction high-rise office building projects. Design drawings were collected, and on-site measurements were performed to ensure that the parameter ranges were realistic and broadly applicable. A total of 110 diverse projects were selected as samples, encompassing a range of design stages, construction timelines, building scales, and compliance standards. This selection aimed to capture the variability and characteristics of current design practices. Statistical analysis of the collected data was then used to define reasonable value ranges for the primary design parameters. This approach was intended to address the limitations associated with relying on parameter ranges derived from a single project or room, thereby improving the representativeness, reliability, and applicability of the defined parameter space for multi-objective optimization research.
It is important to note that the parameter ranges defined in this study are not solely based on idealized values prescribed by design codes but are derived from statistical analysis of data collected across multiple real-world projects. This ensures that the selected ranges reflect realistic and feasible design choices commonly adopted in current high-rise office building practice. By grounding the parameter space in actual survey data, the approach remains closely aligned with engineering applications, offering a scientifically robust and practically relevant input foundation for subsequent building performance prediction and multi-objective optimization. As a result, the optimization process is constrained within realistic bounds, enhancing the reliability, generalizability, and practical applicability of the research outcomes.
Based on the statistically derived parameter ranges, a parametric prototype building model was developed using the Grasshopper plugin within the Rhino platform. This model enables automated generation and flexible adjustment of high-rise office building forms, establishing a robust foundation for subsequent sample generation and multi-objective optimization analysis. The detailed statistical findings from the case study survey, along with the development and validation of the parametric prototype building model, are presented in Section 3.
2.3. Building Performance Simulation Indicators and Dataset Generation
The design and construction of high-rise office buildings increasingly prioritize not only energy efficiency but also indoor environmental objectives. Accordingly, building performance must be evaluated through a multi-objective lens. In this study, energy consumption and light-thermal comfort are simulated using the open-source tools Ladybug 1.80 and Honeybee 1.80 within the Grasshopper environment. These tools, which have been extensively validated and widely adopted [38], utilize EnergyPlus for energy use and thermal comfort simulations, and the Radiance engine for daylighting analysis, ensuring the accuracy and reliability of the performance evaluation.
In this study, EUI is adopted as the performance indicator for evaluating building energy consumption [39]. EUI is defined as the ratio of total building energy consumption to the total floor area, reflecting energy use per unit area. Total energy consumption primarily results from maintaining indoor environmental conditions and meeting functional demands, encompassing four components: air-conditioning systems, heating, lighting, and electrical equipment. The calculation is expressed in Equation (1):
where ,,,, and represent the total building, heating, cooling, lighting, and equipment energy consumption, respectively, expressed in kWh/.
UDI is adopted in this study as the metric for evaluating daylight performance, as it is widely recognized for assessing indoor visual comfort [40]. UDI quantifies the proportion of time that indoor horizontal illuminance falls within a defined comfort range, reflecting its suitability for occupant visual needs. It has been increasingly applied in international research and practice in recent years. In this study, the visual comfort daylight illuminance range for high-rise office buildings is set to 450–2000 lux based on the Standard for Daylighting Design of Buildings (GB 50033-2013) [41], and the UDI is calculated using Equations (2) and (3) [42]:
where represents the illuminance at the i-th point in the room, measured in lux; indicates time, measured in hours (h); and denotes a weighting factor dependent on .
Thermal comfort is defined as a psychological state in which individuals perceive satisfaction with the surrounding thermal environment, influenced by factors, such as activity level, clothing insulation, mean radiant temperature, air temperature, and air velocity [43]. In this study, PMV is used as the evaluation metric for indoor thermal comfort in high-rise office buildings. Originally developed by Fanger, PMV quantifies thermal sensation based on human thermal balance principles and combines both physiological and psychological responses [44]. It integrates multiple influencing parameters to provide a systematic and quantitative assessment of indoor thermal conditions. Following the ISO 7730 standard, the PMV index is calculated according to Equation (4) [45]:
where is the metabolic rate of the human body (in W/m2), is the rate of mechanical work (in W/m2), is the air temperature (in °C), is the mean radiant temperature (in °C), is the water vapor pressure in ambient air (in Pa), is the clothing area factor, is the mean temperature of the outer surface of a clothed human body (in °C), and is the convective heat transfer coefficient (in W/(m2·K)).
Following the completion of performance simulations, the generated combinations of design parameters are used as the dataset for training and evaluating ML models. Therefore, the selection of an appropriate sampling method is essential to ensure sample diversity and model accuracy. Latin hypercube sampling [46], a stratified sampling technique, is employed for this purpose. LHS ensures uniform and independent distribution of samples across each parameter range, enabling comprehensive coverage of the multi-dimensional design space while minimizing the total number of samples required. In this study, LHS is implemented using the design space exploration (DSE) [47] plugin within the Grasshopper platform.
2.4. Machine Learning Prediction Model Development and Evaluation
2.4.1. Stacking Ensemble Learning Method
Ensemble learning involves constructing multiple base ML models and optimizing their combination to address specific prediction tasks. Compared to traditional single models, ensemble approaches offer notable improvements in prediction accuracy and robustness. Based on their optimization strategies and inter-model relationships, ensemble methods are typically classified into three categories: Bagging, which reduces variance through bootstrap sampling, Boosting, which iteratively adjusts weights to improve accuracy on difficult samples, and Stacking, which enhances performance by combining models in a hierarchical structure [48,49]. In this study, a Stacking ensemble learning model (Figure 2) is adopted to improve the predictive accuracy and generalizability of performance evaluations for high-rise office buildings.
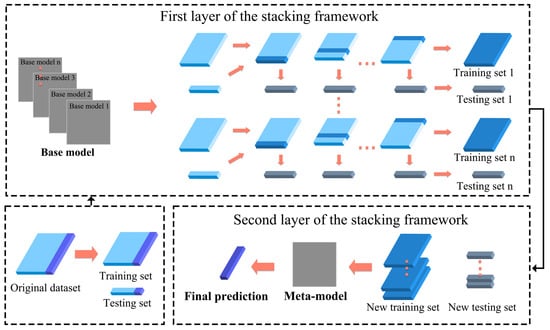
Figure 2.
Structure of the Stacking mode: Multiple ML algorithms are used as base models and a meta-model. Base model predictions obtained via cross-validation are input into the meta-model for final prediction.
In the modeling process, several ML algorithms were selected as base learners, including categorical boosting (CatBoost) [50], multilayer perceptron (MLP) [51], light gradient boosting model (LightGBM) [52], eXtreme gradient boosting (XGBoost) [53], and random forest (RF) [54]. These base learners were independently trained using a training set divided into four subsets, allowing each model to effectively capture patterns and features within the data. The prediction outputs from the base learners were then passed to a second-layer linear regression model, which acted as the meta-learner. This model combined the base predictions through weighted averaging to minimize the overall prediction error. To reduce the risk of overfitting in the meta-learner and improve generalization, grid search and five-fold cross-validation techniques [55] were applied during training. The final prediction results were generated from the optimized output of the meta-learner.
Additionally, model performance was assessed using three standard metrics: the coefficient of determination (R2), mean squared error (MSE), and mean absolute error (MAE). These metrics quantify the predictive accuracy and goodness of fit on the test set. The corresponding formulas are given in Equations (5)–(7) [56]:
where denotes the actual values, denotes the predicted values, denotes the mean of the actual values, and denotes the number of samples.
In this study, all of the samples were randomly divided into a training set (80%) and a testing set (20%) [57]. This division ensured that the testing set data were completely excluded from model training and cross-validation. Model generalization refers to the ability to adapt and perform well for unseen data, meaning that the model can maintain good predictive performance for datasets beyond the training set, including testing sets, validation sets, and real-world application scenarios [58]. To evaluate the generalization ability, each model was assessed utilizing an independent testing set [59], ensuring that the reported performance metrics (R2, MSE, MAE) accurately reflected the predictive capability of the models on new data and provided a fair basis for comparison. Typically, R2 is used to measure the goodness of fit of a model, with values ranging from negative to positive. Values closer to one indicate a better fit. The MSE and the MAE are the mean squared error and mean absolute error, respectively, both ranging from [0, +∞) with smaller values indicating a lower prediction error [60]. Previous studies have shown that in building performance prediction research, R2 ≥ 0.90 is generally considered to indicate high predictive accuracy [61,62].
2.4.2. Explaining the Model Using SHAP Values
When handling complex multi-objective coupled computational models involving multidimensional design parameters, this study faces a typical “black box” system. Although constructing surrogate models can enrich the dataset of solutions, it does not reduce the complexity of the models. Therefore, an interpretability analysis of the design parameters is crucial for understanding the impact of each parameter on output performance.
SHAP values, rooted in cooperative game theory, offer a robust method for interpreting ML models [63]. SHAP quantifies the marginal contribution of each input feature to a model’s prediction, revealing the relative importance of variables. This approach enables the identification of key influential parameters, detection of outliers and feature interactions, and enhances the interpretability of the model behavior. The mathematical formulation of SHAP values is presented in Equations (8) and (9) [64]:
where ∈ [0, 1], represents the number of features, denotes a constant, indicates the complete set of features, and signifies the input values in subset .
By considering all the possible feature combinations, we can quantify the specific contribution of each feature to the prediction outcome of the model, gain a deeper understanding of the decision-making process, and provide a solid foundation for the interpretability of model predictions.
2.5. Multi-Objective Optimization
Genetic algorithms, inspired by biological evolution, are widely applied to complex optimization problems. Originally introduced by Holland [65], these algorithms simulate evolutionary processes through iterative selection, crossover, and mutation to approach optimal solutions. This study employs NSGA-III [66], which is specifically developed for multi-objective optimization. By incorporating reference points to guide the search, NSGA-III demonstrates improved performance over NSGA-II in terms of maintaining solution diversity and enhancing convergence [67]. Its ability to efficiently navigate high-dimensional design spaces makes it particularly effective for building performance optimization, enabling the generation of representative non-dominated solution sets to support informed architectural decision-making.
In this study, multi-objective optimization is performed using Equation (10) to enhance overall building performance. Three performance indicators are simultaneously considered: (1) minimization of EUI, defined as f1(X) = EUI(X), where EUI reflects the energy consumption per unit area, to improve energy efficiency; (2) maximization of daylight illuminance, represented as f2(X) = −UDI(X), where UDI is maximized but transformed to −UDI(X) to align with the minimization framework; (3) optimization of indoor thermal comfort, expressed as f3(X) = ∣PMV(X), with the main of minimizing the absolute PMV value to maintain thermal neutrality, where X denotes the vector of design variables. Accordingly, the multi-objective optimization problem is defined as Equation (10):
In practical implementation, the multi-objective optimization was conducted on the PyCharm (version 2024.1.6) platform, with algorithmic configurations established based on recommendations from the relevant literature [68]. The detailed optimization settings and the baseline values used for building performance optimization are presented in Table 1.

Table 1.
Optimization algorithm parameters and baseline building values.
2.6. Entropy-TOPSIS Method
In multi-objective optimization, trade-offs among objectives typically yield a Pareto-optimal solution rather than a single optimum. Selecting the most appropriate solution from this set becomes a key challenge in practical applications.
The entropy-weighted TOPSIS method provides an effective evaluation and ranking approach by combining the entropy, which is used to objectively assign weights to performance indicators based on their information entropy, with the TOPSIS technique [69], which ranks alternatives by calculating their relative closeness to an ideal solution and distance from a negative-ideal one. This integrated method enables a comprehensive and unbiased selection from the optimization results. The specific computational steps and mathematical formulations of the entropy-weighted TOPSIS method are described below [70]:
- Ⅰ.
- Determining indicator weights using the entropy weighting method
Each evaluation indicator is normalized, and the proportional contribution of each alternative to a given indicator is calculated. The entropy value for each indicator is then determined using the information entropy formula given in Equation (11):
where denotes the number of optimization solutions, represents a constant typically taken as , and indicates the information entropy of the -th indicator. A higher entropy value implies lower variability in the indicator’s values across the alternatives, indicating that the indicator provides less discriminatory power and should therefore be assigned a lower weight.
- Ⅱ.
- Calculating the coefficient of variation
A larger coefficient of variation indicates greater discriminative ability of the j-th indicator, warranting a higher assigned weight. The final weights for each indicator are computed using Equation (13):
where denotes the weight of the -th evaluation indicator, and represents the total number of evaluation indicators.
- Ⅲ.
- Optimal solution selection using the TOPSIS method
After determining the weights for each indicator, the weighted decision matrix is constructed and normalized using Equation (14):
where represents the value of the -th alternative on the -th indicator, denotes the total number of alternatives, and indicates the normalized indicator value.
Next, the positive and the negative ideal solutions are identified, corresponding, respectively, to the optimal and least favorable values for each indicator. Euclidean distance is employed to compute the distances and , as represented through Equations (15) and (16):
Finally, the relative closeness of each alternative is computed using Equation (17):
where ranges from 0 to 1, with values closer to 1 indicating superior alternatives.
By applying the entropy-weighted TOPSIS method, this study objectively weights and ranks alternatives within the Pareto set, enabling comprehensive multi-indicator evaluation and supporting early-stage multi-objective decision-making.
3. Application
3.1. Research Scope and Survey Targets
This study investigates early-stage design optimization of high-rise office buildings in cold regions, focusing on two representative cities in Shandong Province, China, Linyi (35°05′ N, 118°35′ E) and Jinan (36°40′ N, 117°02′ E). Both cities experience a temperate monsoon climate and fall within the cold region classification of China’s climatic zoning, marked by cold winters and hot summers. Consequently, building designs must be optimized to ensure adequate thermal insulation in winter and effective heat resistance in summer.
To enhance the representativeness and generalizability of the parameter ranges, completed and under-construction high-rise office buildings designed between 2018 and 2024 were selected as survey samples. These cases span various design standards, stages, and scales, capturing the diversity of contemporary design practices. Under the Unified Standard for Civil Building Design (GB 50352-2019) [71] and the Code for Fire Protection in Building Design (GB 50016-2014) [72], high-rise office buildings are defined as structures exceeding 24 m in height or comprising seven or more stories.
Design information for 110 high-rise office building projects in Jinan and Linyi was obtained through on-site surveys, collection of design drawings, and parameter statistics. The samples were diverse and geographically distributed, effectively capturing current design characteristics. This dataset provided a robust and representative basis for defining parameter ranges and constructing the parametric prototype building model for subsequent analysis.
3.2. Survey Results and Statistical Analysis of Design Parameters
To define the plan typology and parameter ranges of high-rise office buildings, a statistical analysis was performed based on survey data from 110 actual projects in Jinan and Linyi. The analysis revealed that 92.7% of the buildings adopted square or rectangular floor plans, highlighting the regional preference for compact and space-efficient layouts. Accordingly, this study focused on these two dominant plan forms and further categorized them into point and slab types.
Buildings with a long-to-short side ratio exceeding 2:1 were classified as slab types; otherwise, they were considered point-type. Based on this criterion, the dataset included 48 point-type and 54 slab-type buildings, reflecting the predominant design trends and spatial distribution within the study area.
Key design parameters, including geometric dimensions, floor height, WWR, and the thermal performance of external walls and roofs, were statistically analyzed. Figure 3 and Figure 4 illustrate the parameter distributions of the point-type and slab-type high-rise office buildings. In the figures, each blue dot represents an observed value from a surveyed project. To facilitate the determination of the reference benchmarks for subsequent multi-objective optimization, the surveyed data were processed to a uniform level of precision, and the occurrence frequency of each parameter within the sample was statistically analyzed. The most frequently occurring value (mode) was selected as the benchmark, which reflected the parameter value that was the most commonly adopted in actual design practice. The modes are indicated by red dots, while the dashed lines denote the observed maximum and minimum values. These findings reflect the typical design characteristics of high-rise office buildings in the study region and offer a scientific foundation for constructing the parametric prototype model and defining the design space in later stages. Detailed data and supporting information are available in the Supplementary Materials.
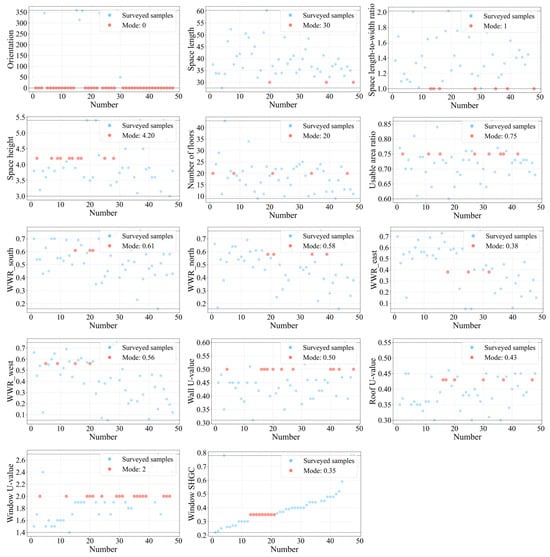
Figure 3.
Statistical analysis of design parameters for point-type high-rise office buildings: black dotted lines represent the observed maximum and minimum values.
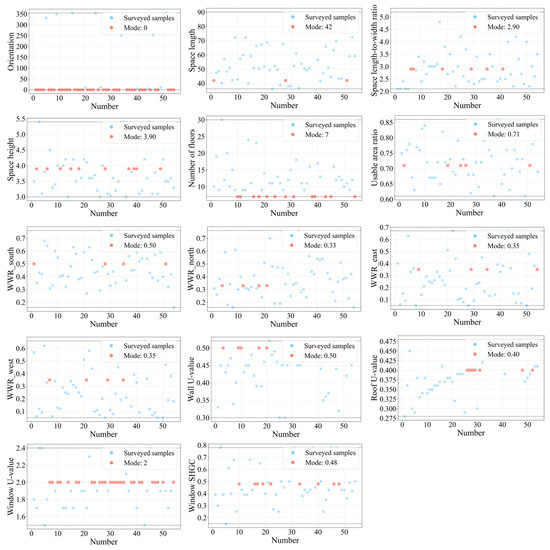
Figure 4.
Statistical analysis of design parameters for slab-type high-rise office buildings: black dotted lines represent the observed maximum and minimum values.
3.3. Parametric Prototype Building Model Design Parameter Settings
To facilitate early-stage multi-objective optimization for high-rise office buildings in cold regions, parametric prototype models were developed based on the preceding survey and statistical analysis. These models abstract and simplify key design features of existing projects, forming a flexible and scalable digital design tool that supports building performance simulation and subsequent optimization.
The parametric prototype was developed using Grasshopper in Rhino and includes models for both point-type and slab-type high-rise office buildings (Figure 5). Design parameters were established based on statistical analyses of surveyed samples from Jinan and Linyi, with parameter ranges defined by the observed minimum and maximum values to reflect actual design practices. The baseline model was set using the most frequently occurring parameter values. Key design parameters and their ranges are summarized in Table 2 and Table 3. For simplicity and simulation efficiency, each standard floor was divided into two functional zones: a peripheral office area and a central auxiliary area. All parameters were controlled via sliders in Grasshopper, allowing for flexible adjustments and real-time 3D model updates.
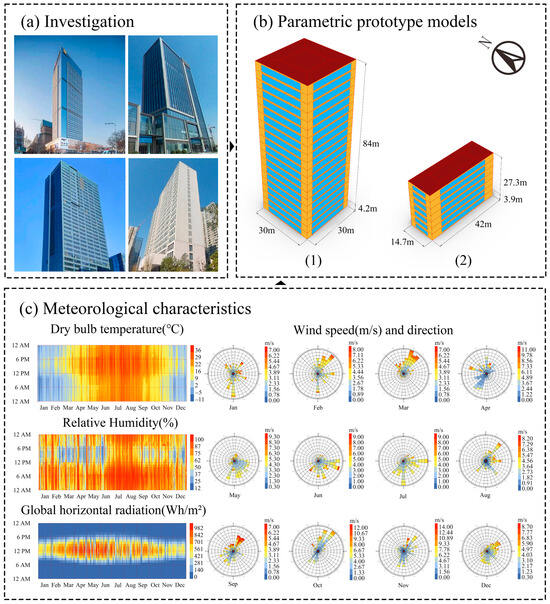
Figure 5.
Parametric prototype models and climate data setup: (1) point-type, (2) slab-type high-rise office buildings.
Table 2.
Design parameter ranges for point-type office buildings.
Table 3.
Summary of design parameters for slab block office buildings.
3.4. Building Performance Model Setup
To enable multi-objective performance analysis within the defined design parameter space, building performance simulation models were developed based on the parametric prototypes. All simulations employed the typical meteorological year climate file for Linyi (Figure 5c) to ensure all samples were evaluated under consistent climate conditions, thereby maintaining result comparability.
Design parameter combinations were generated using the Latin hypercube sampling method, implemented through the DSE plugin in Grasshopper. To balance sampling uniformity and computational efficiency, 2500 design samples were created for each of the point-type and slab-type parameter spaces, yielding a total of 5000 samples for subsequent building performance simulations and ML model training.
The open-source Ladybug 1.80 and Honeybee 1.80 plugins were employed in this study, utilizing the EnergyPlus and Radiance engines to simulate energy consumption, thermal comfort, and daylighting performance. EUI, UDI, and PMV were adopted to assess energy efficiency, daylighting quality, and thermal comfort, respectively. The definitions and calculation methods for these indicators are detailed in Section 2.
To ensure the rationality of simulation input settings, this study followed the General Code for Building Energy Conservation and Renewable Energy Utilization (GB 55015-2021) [73] and incorporated characteristics observed in the survey data. The building was divided into two primary functional zones: office and auxiliary areas. Parameter settings for occupant density, lighting power density, equipment power density, setpoint temperature, and fresh air volume for each zone are provided in Table 4.
Table 4.
Zoning parameter settings.
Daylighting simulation parameters were set based on the Standard for Daylighting Design of Buildings (GB 50033-2013) [41], with the UDI comfort range defined as 450–2000 lux. Visible light reflectance values were specified as 0.75 for ceilings, 0.6 for walls, and 0.3 for floors, while window visible light transmittance was set to 0.6. Illuminance sensors were arranged in a 1 m × 1 m grid at a height of 0.75 m. Thermal comfort simulation parameters were defined according to the Standard for Evaluation of Indoor Thermal and Humid Environment of Civil Buildings (GB/T 50785-2012) [74], with a human metabolic rate of 1.2 met and clothing insulation values of 0.5 clo for summer and 1.0 clo for winter.
3.5. Model Validation
The parametric prototype model that is developed in this study is based on the statistical analysis and abstraction of actual design parameters from high-rise office building projects in Shandong Province, aiming to represent the typical parameter space observed in regional practice. As the model does not correspond to a specific project, direct validation using measured energy data is not feasible. Instead, energy consumption statistics from comparable office buildings in China were employed as reference benchmarks. The rationality and feasibility of the defined parameter range and simulation outcomes were evaluated by comparing the distribution of simulated EUI with literature-reported values.
Chen et al. [75] surveyed 37 commercial office buildings in Shandong Province in 2016, reporting annual EUIs ranging from 30 to 80 kWh/m2, with an average of 72.14 kWh/m2. Zhu et al. [76] analyzed 71 government office buildings in Beijing in 2021, reporting an average annual EUI of 76.8 kWh/m2 among the 41 samples with completed data. Li et al. [77] conducted a nationwide survey of 453 large office buildings across 24 provinces in China in 2022, showing that 66.4% had EUIs below 80 kWh/m2. For buildings completed after 2016, values primarily ranged from 65 to 100 kWh/m2, with an average of 98.3 kWh/m2 observed in cold regions.
The distribution of simulated sample annual EUIs was visually compared with literature-based statistics. Boxplot comparisons illustrate that reported values from previous studies primarily fall within the range of 30–100 kWh/m2, consistent with the distribution of simulation results from the parametric prototype model (Figure 6). This alignment supports the validity and practical applicability of the simulation approach and model, confirming the reasonableness of the defined input parameter space and generated outputs.
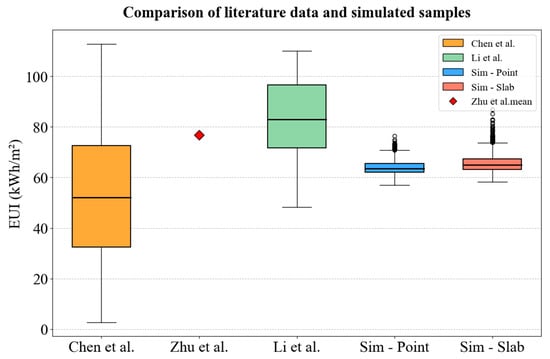
Figure 6.
Comparison of simulated energy use distributions with literature-reported ranges from Chen et al. [75], Zhu et al. [76], and Li et al. [77].
4. Results
4.1. Analysis of the BPS Dataset
Figure 7 illustrates the distribution of the data derived from 5000 samples obtained from performance simulations of high-rise office buildings, encompassing key metrics, such as EUI, UDI, and PMV. The findings reveal that the distribution trends for point-type and slab-type high-rise office buildings are similar. Specifically, the average values of EUI, UDI, and PMV for point-type high-rise office buildings are 63.96 kWh/m2, 47.67%, and −0.20, respectively, whereas for slab-type high-rise office buildings, these values are 65.60 kWh/m2, 42.46%, and −0.04, respectively. Compared to the baseline building, the average EUI exhibited a reduction of 3.31% in point-type high-rise office buildings, whereas slab-type high-rise office buildings experienced a marginal decline of 0.03%. Regarding the UDI, point-type high-rise office buildings demonstrated a 6.19% increase, while slab-type high-rise office buildings saw a reduction of 1.71%. In terms of PMV, the average values for point-type and slab-type high-rise office buildings surpassed those of the baseline building by 0.127 and 0.077, respectively. Overall, point-type buildings outperform slab-type high-rise office buildings in terms of average EUI and UDI but perform slightly worse in terms of PMV. The dataset provides a well-balanced distribution of the three performance indicators while ensuring representativeness across different building forms.
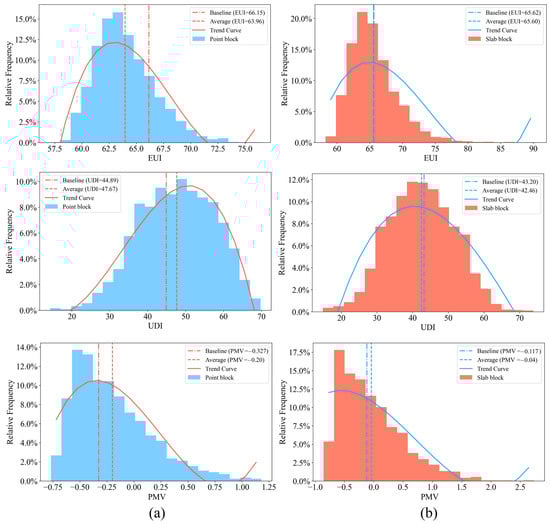
Figure 7.
Performance data distribution for point-type (a) and slab-type (b) buildings.
Figure 8 illustrates the findings of a correlation analysis examining the relationship between design parameters of high-rise office buildings and their performance, as represented by a Pearson correlation coefficient matrix. The EUI of both point-type and slab-type high-rise office buildings demonstrates a strong negative correlation with space length, as indicated by coefficients of −0.60 and −0.56, respectively. Demonstrating a strong positive correlation with space height (0.44, 0.38), the ratio of usable area within a standard floor (0.36, 0.31), and the length-to-width ratio of a given space (0.29, 0.42), the findings indicate that elongating a space is likely to yield greater energy savings. Conversely, an increase in space height, the ratio of usable space within a standard floor, and the ratio of a space’s length to its width may contribute to higher energy consumption. Additionally, in high-rise office buildings of both point-type and slab-type designs, the UDI demonstrates a strong positive correlation with the ratio of usable area on a standard floor (0.88, 0.80). This observation suggests that as the ratio of usable space increases, the efficiency of natural light utilization improves, thereby enhancing UDI. In terms of PMV, a significant positive correlation is observed with the window solar heat gain coefficient (SHGC) registering 0.77 and 0.80 values. A higher SHGC for windows facilitates increased solar heat penetration into the building’s interior in cold climate conditions. Most design parameters, however, exhibit weak or no correlation with performance metrics, highlighting the complex nonlinear interactions among variables. These results support the application of ML regression models to facilitate performance evaluation and informed decision-making during the early design stage.
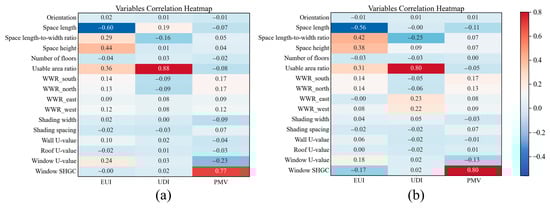
Figure 8.
Correlation analysis: (a) point-type buildings, (b) slab-type buildings.
4.2. Training and Evaluation of the Stacking Ensemble Learning Model
A stacking ensemble model, described in Section 2.4, was constructed by integrating multiple base learners using a linear regression meta-learner for feature reconstruction and model fusion. Five-fold cross-validation was applied for hyperparameter tuning. The model was trained on 80% of the dataset and tested on the remaining 20% to predict EUI, UDI, and PMV.
Table 5 presents the hyperparameter settings, predictive performance, and computational times for each ML model. The stacking model consistently outperforms the individual base learners and the linear regression meta-learner in terms of R2, MSE, and MAE, indicating superior fitting accuracy and reduced prediction error.
Table 5.
Hyperparameter settings and performance evaluation of ML models.
Compared with the average performance of individual base learners, the stacking ensemble learning model exhibits consistently superior predictive capability across all three evaluation metrics: R2, MSE, and MAE. Specifically, R2 improvements range from 0.5% to 16.1%, MSE reductions from 4.4% to 70.6%, and MAE reductions from 2.8% to 45.8%. These results demonstrate that the stacking model effectively synthesizes the strengths of diverse base learners, substantially improving prediction accuracy and robustness across multiple tasks.
In terms of computational costs, significant differences were observed among the models during the hyperparameter tuning stage (grid search time) and the final training stage (train time). MLP required the longest tuning time (16.6896 s) and a training time of 9.2089 s. LightGBM took 10.9386 s of time for tuning but only 0.0677 s for training. CatBoost exhibited a relatively balanced performance, with a tuning time of 4.3785 s and a training time of 0.2148 s. XGBoost had short tuning and training times (1.1488 s and 0.0730 s, respectively). RF had a moderate tuning time (4.7104 s) but a relatively high training time (1.9994 s). Linear Regression had the lowest times in both stages (0.2123 s and 0.0027 s). By contrast, the stacking ensemble model did not undergo additional tuning (grid search time = 0 s) and required 9.6822 s for final training. Although its training time was higher than the times of the single models, this time remained acceptable in the early design stage.
In summary, the stacking ensemble model achieved effective predictions for energy use, daylighting, and thermal comfort for high-rise office buildings through multi-model integration and feature reconstruction, while maintaining a controllable computational cost. Its higher R2 values demonstrate stronger fitting capability, while the substantial reductions in the MSE and MAE values indicate lower prediction errors and good generalization performance. The predicted values (Figure 9) for EUI, UDI, and PMV are closely aligned with the regression line for both point-type and slab-type buildings, confirming the model’s ability to capture complex nonlinear relationships and avoid systematic bias. These results highlight its practical value for early-stage design performance prediction.
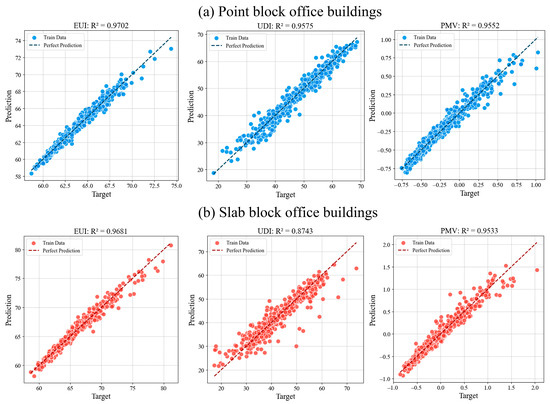
Figure 9.
Performance prediction results of the stacking ensemble learning model.
4.3. SHAP Value Interpretation Results
To support localized multi-objective optimization in the early design stage of high-rise office buildings in cold regions, SHAP analysis was applied to interpret the impact of design parameters on predicted EUI, UDI, and PMV. The SHAP results for these three performance indicators are illustrated in Figure 10 and Figure 11.
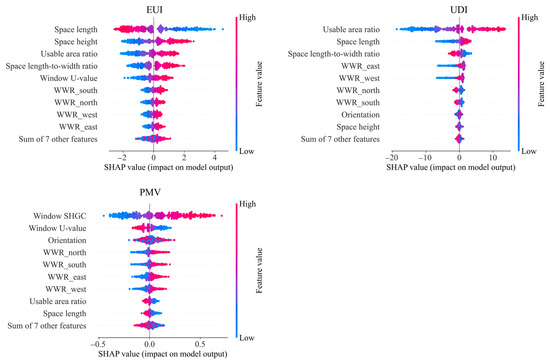
Figure 10.
SHAP analysis of three performance objectives for point-type high-rise office buildings.
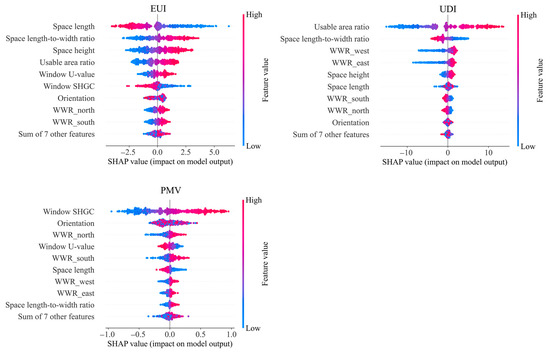
Figure 11.
SHAP analysis of three performance objectives for slab-type high-rise office buildings.
The SHAP analysis for point-type high-rise office buildings identifies space length, spatial height, standard floor usable area ratio, aspect ratio, and window U-value as the top five parameters affecting energy use. Longer space length contributes to lower energy consumption, while reduced spatial height, smaller usable area ratio, and lower aspect ratio also help optimize energy performance. For daylighting, key influencing parameters include the standard floor usable area ratio, space length, aspect ratio, and east and west WWR. Higher usable area ratios, longer space lengths, and increased east–west window areas enhance indoor daylight availability, though a high aspect ratio can reduce daylight uniformity. Thermal comfort is primarily influenced by window SHGC, window U-value, building orientation, and the north-facing WWR. Greater SHGC, lower U-values, and larger north-facing window areas promote wintertime solar heat gain, thereby improving indoor thermal comfort.
For slab-type high-rise office buildings, the SHAP analysis identifies space length, aspect ratio, spatial height, standard floor usable area ratio, and window U-value as the top five parameters affecting energy use. A longer space length contributes to energy savings, whereas greater aspect ratio, spatial height, and usable area ratio tend to increase energy consumption. In terms of daylighting comfort, the most influential parameters are the standard floor usable area ratio, aspect ratio, east and west WWRs, and spatial height. Improved daylighting is associated with a higher usable area ratio and spatial height, while a lower aspect ratio supports better daylight distribution. Thermal comfort is primarily influenced by SHGC, building orientation, north-facing WWR, window U-value, and south-facing WWR. Greater SHGC values and larger north-facing window areas increase winter solar heat gains, while lower window U-values improve the thermal insulation of the envelope, enhancing indoor comfort in cold climates.
A comparative analysis of SHAP results for point-type and slab-type high-rise office buildings revealed that, among the 16 design parameters, space length, aspect ratio, and standard floor usable area ratio consistently exert a significant influence on both energy use and daylighting comfort. Window U-value and SHGC were identified as the principal factors affecting thermal comfort, ranking highly in both building types.
To support multi-objective optimization of energy performance, daylighting, and thermal comfort in cold-region high-rise office buildings, specific parameter adjustments should be prioritized during the early design stage. Space length and aspect ratio should be carefully regulated to reduce energy demand while maintaining functional efficiency and promoting uniform daylight distribution. The standard floor usable area ratio should be optimized to prevent excessive energy use while enhancing natural daylighting under functional constraints. Window U-value, SHGC, and building orientation should be adjusted to improve winter solar gains and indoor thermal comfort through appropriate envelope performance and orientation strategies. Regarding WWR design, emphasis should be placed on balancing north–south WWRs to optimize thermal performance and minimize heat loss, whereas east–west ratios should be moderated to reduce glare and improve daylight uniformity.
In conclusion, the SHAP-based interpretation of multi-performance predictions identified the most influential design parameters and their respective directional impacts, offering targeted and region-specific design guidance for the early-stage optimization of energy use, daylighting, and thermal comfort in high-rise office buildings.
4.4. Multi-Objective Optimization Results
4.4.1. Pareto-Front Solution Set and Optimization Design Range
To address the multi-objective coupling of energy use, daylighting, and thermal comfort in high-rise office building design, a stacking ensemble learning prediction model was integrated with the NSGA-III multi-objective evolutionary algorithm to perform iterative performance optimization. Representative extreme solutions from the Pareto-optimal solution set are presented in Table 6, allowing for a comparison with baseline performance and illustrating the trade-offs and characteristics associated with different optimization objectives.
Table 6.
Performance metrics of extreme solutions in the Pareto-optimal solution set.
For point-type high-rise office buildings, minimizing EUI (55.25 kWh/m2) results in a low UDI of 34.27%, suggesting that excessive focus on energy efficiency may reduce WWR and compromise natural daylighting. In contrast, maximizing UDI (68.26%) improves daylight availability but increases solar heat gains, leading to higher energy use (EUI of 67.71 kWh/m2). When optimizing for thermal comfort (PMV of −0.008), a balance between daylighting and solar gains is required, yielding a moderate UDI of 45.73%. These results highlight that multi-objective optimization in building design involves complex trade-offs among conflicting performance goals.
Based on the Pareto-optimal solution set, recommended design parameter ranges were identified for point-type high-rise office buildings under the trade-offs among energy use, daylighting, and thermal comfort (Figure 12). The optimal geometric parameters include building orientation between 9° and 167°, space length from 54.50 m and 58.52 m, plan aspect ratio between 1.00 and 1.10, space height from 3.10 m and 3.30 m, number of floors between 27 and 34, and standard floor usable area ratio between 0.69 and 0.84. Recommended façade design parameters include a south-facing WWR of 0.28–0.62, north-facing 0.24–0.50, east-facing 0.11–0.41, and west-facing 0.16–0.40. Shading device width should range from 0.20 m to 0.40 m, with spacing between 2.27 m and 3.90 m. For envelope thermal properties, wall U-values are advised to fall between 0.34 and 0.39, roof U-value between 0.32 and 0.43, window U-value between 1.48 and 1.60, and window SHGC between 0.35 and 0.75. Compared to the baseline, optimal solutions generally favor increased space length and reduced space height; lower north- and west-facing window ratios; use of shading devices to enhance daylighting; and improved envelope insulation through reduced U-values, contributing to better energy performance and thermal comfort.
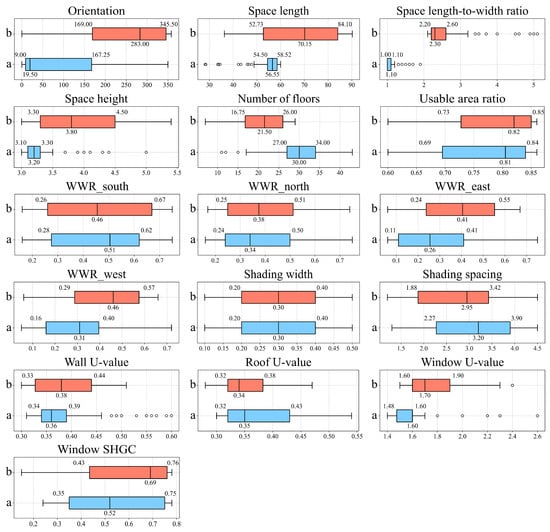
Figure 12.
Optimized design parameter ranges for high-rise office buildings: (a) Point-type, (b) Slab-type.
For slab-type high-rise office buildings, the Pareto-optimal solution set suggests that the geometric design parameters should fall within the following ranges: building orientation from 169 to 345°, space length between 52.73 and 84.10 m, plan aspect ratio from 2.20 to 2.60, space height between 3.30 and 4.50 m, number of floors from 17 to 26, and standard floor usable area ratio from 0.73 to 0.85. Recommended façade parameters include a south-facing WWR of 0.26–0.67, north-facing 0.25–0.51, east-facing 0.24–0.55, and west-facing 0.29–0.57. Shading devices are advised to have widths of 0.20–0.40 m and spacing between 1.88 m and 3.42 m. For envelope thermal performance, optimal wall U-values range from 0.33 to 0.44, roof U-values from 0.32 to 0.38, window U-values from 1.60 to 1.90, and window SHGC from 0.43 to 0.76. Compared to the baseline design, the optimized solutions tend to adopt longer space lengths, increased floor counts, and higher usable area ratios. Shading elements are more precisely integrated to improve daylight control, and lower U-values are used for walls, roofs, and windows to enhance thermal insulation and overall performance.
The above analysis, based on the Pareto-optimal solution set, provides clear guidance on key parameter adjustment directions and recommended value ranges for the multi-objective optimization of high-rise office buildings. These findings offer practical design references and strategic insights to support decision-making in the early design stage, particularly for buildings in cold climates.
4.4.2. Optimal Solutions Based on the Entropy-Weighted TOPSIS Method
After extracting design variable sets from the Pareto front, the entropy weighting method was employed to objectively assign weights to the three performance indicators, facilitating comprehensive evaluation and selection among multi-objective optimization results. For point-type high-rise buildings (Table 7), UDI received the highest weight (57.658%), followed by PMV (25.833%) and EUI (16.509%). Similarly, in slab-type buildings, UDI held the highest weight (53.56%), with PMV and EUI assigned weights of 35.07% and 11.369%, respectively.
Table 7.
Entropy-based weights for decision-making in multi-objective optimization.
This weight distribution reflects both the entropy and variability characteristics of each performance indicator within the Pareto set, highlighting differences in optimization sensitivity across the design parameter space. As the core metric of daylighting performance, UDI demonstrated the highest dispersion and discriminative capacity, resulting in the greatest weight. This indicates that daylighting performance is highly sensitive to parameter adjustments and represents a primary direction for differentiated optimization. Conversely, the lower weight assigned to EUI suggests that energy consumption outcomes are more clustered and less responsive to variation within the current parameter ranges, indicating limited optimization potential. This implies that enhancing energy performance further will require an expanded design parameter space, incorporation of additional variables, or adoption of more diverse design strategies.
Based on the derived weights, the TOPSIS method was applied to rank the Pareto-optimal solutions, identifying the top three optimized configurations for both point-type and slab-type high-rise office buildings. To facilitate interpretation and support design decisions, these recommended solutions were visualized using parallel coordinate plots and schematic diagrams (Figure 13). In the plots, the labels p1 to p3 represent the selected point-type solutions, while the labels s1 to s3 correspond to the selected slab-type solutions.
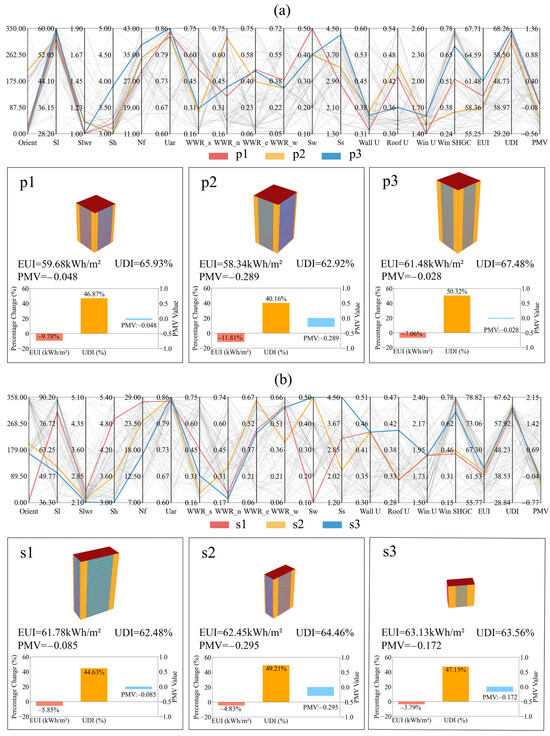
Figure 13.
Pareto solution set and decision analysis: (a) Point-type buildings, (b) Slab-type buildings.
The highest-ranked point-type high-rise office building solution features the following key parameters: a building orientation of 20° east of south, space length of 56.7 m, plan aspect ratio of 1.0, floor height of 3.2 m, 30 floors, and a standard floor usable area ratio of 0.85. WWRs are 0.52 (south), 0.37 (north), 0.48 (east), and 0.39 (west). Shading devices have a width of 0.5 m and a spacing of 2.8 m. Envelope thermal properties include a wall U-value of 0.32 W/(m2·K), roof U-value of 0.43 W/(m2·K), window U-value of 1.4 W/(m2·K), and SHGC of 0.52. Compared to the baseline, this configuration reduces energy use by 7.06–11.81%, improves daylighting comfort by 40.16–50.32%, and maintains thermal comfort within acceptable limits.
For the highest-ranked slab-type high-rise office building solution, the recommended design parameters are building orientation of 4° east of south, space length of 82.4 m, plan aspect ratio of 2.4, floor height of 4.9 m, 28 floors, and a standard floor usable area ratio of 0.85. WWRs are 0.46 (south), 0.22 (north), 0.48 (east), and 0.61 (west). Shading devices have a width of 0.1 m and a spacing of 3.2 m. Envelope performance values are: wall U-value of 0.44 W/(m2·K), roof U-value of 0.32 W/(m2·K), window U-value of 1.9 W/(m2·K), and SHGC of 0.44. Compared to the baseline, this configuration reduces energy by 3.79–5.85%, improves daylighting comfort by 44.63–49.21%, and maintains thermal comfort within acceptable limits.
Overall, the optimized solutions identified through the entropy-weighted TOPSIS method exhibited superior comprehensive performance across energy use, daylighting comfort, and thermal comfort indicators compared to baseline buildings. These outcomes validate the effectiveness of the proposed multi-objective optimization framework and offer practical guidance for early-stage design optimization of high-rise office buildings in cold regions.
5. Discussion
5.1. Research Contributions and Design Implications
This study proposes an integrated optimization framework to address trade-offs among energy use, daylighting, and thermal comfort in the early design phase of high-rise office buildings in cold regions. The framework incorporates case surveys, parametric prototype modeling, ML-based surrogate models, multi-objective optimization, and entropy-weighted TOPSIS decision-making. In contrast to prior studies that typically focused on individual projects or room-scale analyses [32,33,34], this work involved a comprehensive survey and statistical analysis of 110 completed and ongoing high-rise office buildings in Shandong Province. Based on this, key design variable ranges were systematically defined, and parametric prototype models were developed to represent the actual design space. This approach enhances the representativeness of model inputs and the generalizability of findings, while supporting the reusability of both models and data for future applications.
High-accuracy prediction models for multiple performance indicators were developed using the stacking ensemble learning method. SHAP value analysis was employed to elucidate the influence mechanisms of key design variables on high-rise office building performance. Compared to the study by Gao et al. [30], the proposed approach not only demonstrated superior predictive accuracy in multi-performance prediction tasks related to energy use and light-thermal comfort but also provided interpretability by identifying critical influencing factors and their underlying mechanisms.
Given the complex influence of design variables on high-rise office building performance, single-variable analysis may overlook interactive effects. To address this, SHAP interaction analysis was conducted to examine how pairs of key variables jointly affect prediction outcomes. For each performance indicator, the two most influential variables were selected.
For EUI prediction in point-type buildings, low EUI values are more likely when space length ranges from 40 m to 60 m and interacts with increased space height (Figure 14). For UDI prediction, a standard floor usable area ratio between 0.75 and 0.86, combined with shorter space length, results in a stronger positive impact on daylighting performance. For PMV, thermal comfort improves most significantly when the window SHGC lies between 0.50 and 0.78 and interacts with lower window U-values.
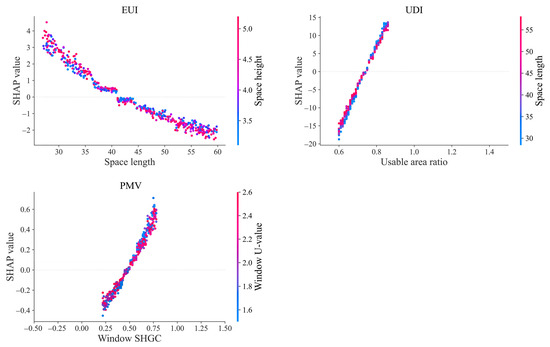
Figure 14.
SHAP interaction analysis of the top two features for each performance target in the point-type buildings.
For slab-type high-rise office buildings, low EUI predictions are more likely when space lengths range from 60 m to 90.2 m and interact with lower plan aspect ratios (Figure 15). For UDI prediction, the standard floor usable area ratio between 0.75 and 0.86, combined with smaller plan aspect ratios, yields a strong positive influence on daylighting performance. For PMV prediction, thermal comfort is notably improved when the window SHGC ranges from 0.5 to 0.78 and interacts with smaller south-west orientation angles. These interaction effects reveal how specific variable combinations influence performance, offering valuable guidance for high-rise building design optimization.
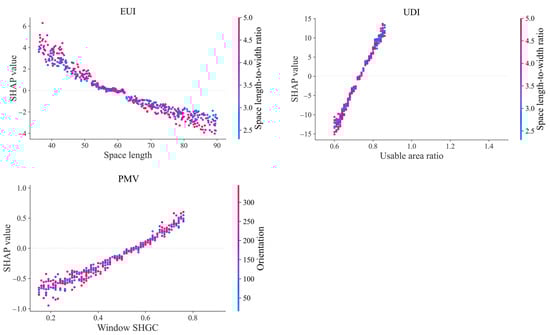
Figure 15.
SHAP interaction analysis of the top two features for each performance target in the slab-type buildings.
The NSGA-III algorithm was employed to generate a Pareto-optimal solution set, and the entropy-weighted TOPSIS method was used for multi-criteria ranking to facilitate optimal solution selection across multiple performance objectives. The optimization results show that appropriate adjustments to geometric configurations, skin design elements, and envelope thermal properties can effectively reduce energy consumption while preserving indoor comfort, contributing to healthy, efficient, and high-quality office environments. The proposed framework is not limited to high-rise office buildings; it also offers a transferable approach for early-stage multi-objective design optimization of other building types, such as residential [78], commercial [79], and campus buildings [80], thereby supporting the advancement of green, low-carbon, and high-performance integrated building design.
5.2. Limitations and Future Work
Despite this having achieved positive results, certain limitations remain and should be addressed in future work. With a focus on high-rise office buildings in the cold climate of Shandong Province, China, the parameterized prototype models and optimization strategies developed in this study had a degree of regional representativeness. However, taking Linyi and Jinan as examples, both of which are located in the cold temperate monsoon climate zone, meteorological observations still revealed differences in the temperature distribution, humidity, wind speed, and solar radiation, which may influence the optimal design parameter ranges and the extent of performance improvement predicted by the optimization framework. A unified typical meteorological year dataset was used for the simulation to extract general design optimization patterns for cold regions. However, for cities with significant climatic differences, the applicability of the framework requires further validation. Future research could incorporate climatic variations as an analytical variable within the optimization framework, using cross-climate or cross-city comparisons to reveal the impact on optimal design parameters and performance gains.
In addition, the dataset for this study mainly covered a single building type, high-rise office buildings. Future studies could include more diverse building types, such as residential, commercial, and educational buildings, to expand the model’s applicability. To further enhance the robustness and adaptability of the framework, in future work, systematic ablation studies and fine-tuning could also be conducted by incrementally adding or removing individual base learners, input features, or optimization framework components. This could be combined with hyperparameter tuning to analyze the contribution of each element to overall performance improvement, thereby refining the model’s structure and predictive accuracy.
Moreover, the design parameter ranges used in this study were based on existing and under-construction projects. As building codes and design requirements evolve, it will be necessary to regularly update the model inputs to maintain representativeness. Additionally, the framework could be further integrated with sustainable design technologies, such as photovoltaic system integration, natural ventilation, and intelligent control strategies, to achieve the synergistic optimization of energy efficiency and environmental sustainability.
6. Conclusions
In this study, parametric prototype building models were developed for high-rise office buildings in cold regions, based on real-world design practices. These models provide a generalized and reusable foundation for performance-based design optimization, integrating simulation, stacking ensemble learning, and multi-objective optimization to balance energy use, daylighting, and thermal comfort in the early design stage. The proposed optimization process and strategies provide localized theoretical support and practical guidance, demonstrating strong potential for broader application. The main conclusions are as follows:
- Based on on-site surveys and design drawing analyses of high-rise office buildings in Shandong Province, in this study, key design parameters were systematically collected and analyzed to develop parametric prototype building models that met regional design practice needs. The model clearly defined reasonable value ranges for key parameters such as building geometric features, envelope design, and envelope thermal performance, and it provided supporting information and data in the Supplementary Materials to offer a reusable data foundation for other researchers in building design optimization studies.
- The stacking ensemble learning model outperformed individual models in predicting multiple performance indicators, achieving improvements in R2 ranging from 0.5% to 16.1%, reductions in MSE between 4.4% and 70.6%, and decreases in MAE from 2.8% to 45.8%.
- SHAP interpretability analysis identified space length, aspect ratio, and standard floor usable area ratio as primary factors affecting energy use and daylighting comfort, while window U-value and SHGC were found to be the most influential on thermal comfort, parameters that should be prioritized in design considerations.
- Compared to baseline buildings, the optimized point-type high-rise office building solutions achieved EUI reductions of 7.06–11.81%, UDI improvements of 40.16–50.32% and maintained thermal comfort within acceptable limits. For slab-type buildings, EUI decreased by 3.79–5.85%, UDI improved by 44.63–49.21%, and thermal comfort indicators remained within a reasonable range.
- By analyzing the distribution of design variable parameters in the Pareto front solution set, reasonable optimized parameter range characteristics for point-type and slab-type high-rise office buildings were identified in this study. Based on the entropy-weighted TOPSIS method, the solutions were comprehensively ranked and selected, providing recommendations for a practical parameter range and optimized solutions to achieve multi-objective performance balance in the early design stage.
Supplementary Materials
The following supporting information can be downloaded at: https://www.mdpi.com/article/10.3390/buildings15173071/s1: Table S1: The statistical data of the surveyed buildings.
Author Contributions
Conceptualization, H.Z.; methodology, H.Z.; software, H.Z.; validation, H.Z. and Z.Z.; formal analysis, H.Z.; investigation, Z.Z.; resources, Z.Z.; data curation, H.Z.; writing—original draft preparation, H.Z.; writing—review and editing, H.Z. and Z.Z.; visualization, H.Z.; supervision, Z.Z.; project administration, Z.Z.; funding acquisition, Z.Z. All authors have read and agreed to the published version of the manuscript.
Funding
This research was funded by the National Natural Science Foundation of China Project (No. 51608370).
Data Availability Statement
The data are contained within the article or the Supplementary Materials.
Conflicts of Interest
The authors declare that there are no conflicts of interest.
Abbreviations
The following abbreviations are used in this manuscript:
| EUI | Energy use intensity |
| UDI | Useful daylight illuminance |
| PMV | Predicted mean vote |
| U-value | Thermal transmittance |
| SHGC | Solar heat gain coefficient |
| WWR | Window-to-wall ratio |
| BPS | Building performance simulation |
| GA | Genetic algorithms |
| NSGA-II | Non-dominated sorting genetic algorithm II |
| NSGA-III | Non-dominated sorting genetic algorithm III |
| ML | Machine learning |
| DSE | Design space exploration |
| SHAP | Shapley Additive Explanation |
| LightGBM | Light gradient boosting model |
| XGBoost | eXtreme Gradient Boosting |
| RF | Random forest |
| CatBoost | Categorical boosting |
| MLP | Multilayer perceptron |
| R2 | Coefficient of determination |
| MSE | Mean squared error |
| MAE | Mean absolute error |
| LHS | Latin hypercube sampling |
References
- National Bureau of Statistics of China. China Statistical Yearbook. Available online: http://www.stats.gov.cn/sj/ndsj/ (accessed on 16 February 2025).
- Mostafavi, F.; Tahsildoost, M.; Zomorodian, Z. Energy efficiency and carbon emission in high-rise buildings: A review (2005–2020). Build. Environ. 2021, 206, 108329. [Google Scholar] [CrossRef]
- China Building Energy Conservation Association. Research Report on Carbon Emissions in China’s Urban and Rural Construction Sector (2024 Edition); China Building Energy Conservation Association: Beijing, China, 2025; Available online: https://www.cabee.org/site/content/25289.html (accessed on 1 March 2025).
- Anand, P.; Deb, C.; Yan, K.; Yang, J.; Cheong, D.; Sekhar, C. Occupancy-based energy consumption modelling using machine learning algorithms for institutional buildings. Energy Build. 2021, 252, 111478. [Google Scholar] [CrossRef]
- Steadman, P. High-Rise Building Much More Energy Intensive than Low-Rise. Available online: https://phys.org/news/2017-06-high-rise-energy-intensive-low-rise.html (accessed on 22 March 2025).
- Douglas, I.P.; Murnane, E.L.; Bencharit, L.Z.; Altaf, B.; Costa, J.M.d.R.; Yang, J.; Ackerson, M.; Srivastava, C.; Cooper, M.; Douglas, K.; et al. Physical workplaces and human well-being: A mixed-methods study to quantify the effects of materials, windows, and representation on biobehavioral outcomes. Build. Environ. 2022, 224, 109516. [Google Scholar] [CrossRef]
- Pezeshki, Z.; Soleimani, A.; Darabi, A. Application of BEM and using BIM database for BEM: A review. J. Build. Eng. 2019, 23, 1–17. [Google Scholar] [CrossRef]
- Kheiri, F. A review on optimization methods applied in energy-efficient building geometry and envelope design. Renew. Sustain. Energy Rev. 2018, 92, 897–920. [Google Scholar] [CrossRef]
- Zhang, R.; Xu, X.; Zhai, P.; Liu, K.; Kong, L.; Wang, W. Agile and integrated workflow proposal for optimising energy use, solar and wind energy potential, and structural stability of high-rise buildings in early design decisions. Energy Build. 2023, 300, 113692. [Google Scholar] [CrossRef]
- Bracht, M.K.; Melo, A.P.; Lamberts, R. A metamodel for building information modeling-building energy modeling integration in early design stage. Autom. Constr. 2021, 121, 103422. [Google Scholar] [CrossRef]
- Lin, B.; Chen, H.; Liu, Y.; He, Q.; Li, Z. A preference-based multi-objective building performance optimization method for early design stage. Build. Simul. 2020, 14, 477–494. [Google Scholar] [CrossRef]
- Zhang, H.; Cui, Y.; Cai, H.; Chen, Z. Optimization and prediction of office building shading devices for energy, daylight, and view consideration using genetic and BO-LGBM algorithms. Energy Build. 2024, 324, 114939. [Google Scholar] [CrossRef]
- Giouri, E.D.; Tenpierik, M.; Turrin, M. Zero energy potential of a high-rise office building in a Mediterranean climate: Using multi-objective optimization to understand the impact of design decisions towards zero-energy high-rise buildings. Energy Build. 2020, 209, 109666. [Google Scholar] [CrossRef]
- Verma, S.; Pant, M.; Snasel, V. A Comprehensive Review on NSGA-II for Multi-Objective Combinatorial Optimization Problems. IEEE Access 2021, 9, 57757–57791. [Google Scholar] [CrossRef]
- Talaei, M.; Mahdavinejad, M.; Azari, R.; Prieto, A.; Sangin, H. Multi-objective optimization of building-integrated microalgae photobioreactors for energy and daylighting performance. J. Build. Eng. 2021, 42, 102832. [Google Scholar] [CrossRef]
- Luo, Z.; Lu, Y.; Cang, Y.; Yang, L. Study on dual-objective optimization method of life cycle energy consumption and economy of office building based on HypE genetic algorithm. Energy Build. 2022, 256, 111749. [Google Scholar] [CrossRef]
- Baghoolizadeh, M.; Rostamzadeh-Renani, M.; Rostamzadeh-Renani, R.; Toghraie, D. Multi-objective optimization of Venetian blinds in office buildings to reduce electricity consumption and improve visual and thermal comfort by NSGA-II. Energy Build. 2023, 278, 112639. [Google Scholar] [CrossRef]
- Guo, R.; Min, Y.; Gao, Y.; Chen, X.; Shi, H.; Liu, C.; Zhuang, C. Unlocking energy and economic benefits of integrated green envelopes in office building retrofits. Build. Environ. 2024, 261, 111747. [Google Scholar] [CrossRef]
- Ao, J.; Du, C.; Bellamy, L.; Li, B. Integration of thermal-daylighting climate subzones and energy efficiency design optimization for office buildings. J. Build. Eng. 2025, 99, 111669. [Google Scholar] [CrossRef]
- Kangazian, A. Multi-objective optimization of horizontal louver systems with flat, single-curvature, and double-curvature profiles to enhance daylighting, glare control, and energy consumption in office buildings. Solar Energy 2025, 285, 113135. [Google Scholar] [CrossRef]
- Aeinfar, S.; Serteser, N. Parametric study of energy optimization and airflow management in high-rise buildings with double-skin façade using a genetic algorithm and CFD. J. Build. Eng. 2025, 105, 112441. [Google Scholar] [CrossRef]
- liu, P.; Hussein, A.A.; Alizadeh, A.a.; Baghoolizadeh, M.; Yan, G.; Zargari pour, M.; Alkhalifah, T. Multi-objective optimization of office building envelopes properties and Venetian blinds using NSGA-II to save energy consumption and enhance thermal and visual comfort. Case Stud. Therm. Eng. 2024, 64, 105484. [Google Scholar] [CrossRef]
- Long, X.; Jin, Q.; Yu, Z. Multi-objective optimization of PCM-integrated thermochromic glazing to enhance the thermal and daylighting performance. Appl. Therm. Eng. 2025, 266, 125661. [Google Scholar] [CrossRef]
- Luo, D.; Xie, J.; Wu, J.; Liu, J.; Wu, H.; Huang, J. Energy performance and optimization of PV vacuum glazing for high-rise office buildings integrating energy storage with time-of-use arranged grid output management. Renew. Energy 2025, 254, 123677. [Google Scholar] [CrossRef]
- Lu, S.; Luo, Y.; Gao, W.; Lin, B. Supporting early-stage design decisions with building performance optimisation: Findings from a design experiment. J. Build. Eng. 2024, 82, 108298. [Google Scholar] [CrossRef]
- Al Mindeel, T.; Spentzou, E.; Eftekhari, M. Energy, thermal comfort, and indoor air quality: Multi-objective optimization review. Renew. Sustain. Energy Rev. 2024, 202, 114682. [Google Scholar] [CrossRef]
- Lin, C.-H.; Tsay, Y.-S. A metamodel based on intermediary features for daylight performance prediction of façade design. Build. Environ. 2021, 206, 108371. [Google Scholar] [CrossRef]
- Yan, H.; Yan, K.; Ji, G. Optimization and prediction in the early design stage of office buildings using genetic and XGBoost algorithms. Build. Environ. 2022, 218, 109081. [Google Scholar] [CrossRef]
- Chen, T.; Guestrin, C. XGBoost. In Proceedings of the 22nd ACM SIGKDD International Conference on Knowledge Discovery and Data Mining, San Francisco, CA, USA, 13–17 August 2016; pp. 785–794. [Google Scholar]
- Gao, W.; Huang, X.; Lin, M.; Jia, J.; Tian, Z. Short-Term Cooling Load Prediction for Office Buildings Based on Feature Selection Scheme and Stacking Ensemble Model. Eng. Comput. 2022, 39, 2003–2029. [Google Scholar] [CrossRef]
- Nguyen, N.-M.; Cao, M.-T. Energy use intensity analysis of office buildings using green BIM-integrated Interpretable machine learning. J. Build. Eng. 2025, 108, 112760. [Google Scholar] [CrossRef]
- Yang, H.; Xu, Z.; Shi, Y.; Tang, W.; Liu, C.; Yunusa-Kaltungo, A.; Cui, H. Multi-objective optimization designs of phase change material-enhanced building using the integration of the Stacking model and NSGA-III algorithm. J. Energy Storage 2023, 68, 107807. [Google Scholar] [CrossRef]
- Shen, Y.; Hu, Y.; Cheng, K.; Yan, H.; Cai, K.; Hua, J.; Fei, X.; Wang, Q. Utilizing interpretable stacking ensemble learning and NSGA-III for the prediction and optimisation of building photo-thermal environment and energy consumption. Build. Simul. 2024, 17, 819–838. [Google Scholar] [CrossRef]
- Zheng, Z.; Xiao, J.; Yang, Y.; Xu, F.; Zhou, J.; Liu, H. Optimization of exterior wall insulation in office buildings based on wall orientation: Economic, energy and carbon saving potential in China. Energy 2024, 290, 130300. [Google Scholar] [CrossRef]
- TRNSYS. Transient System Simulation Tool, Version 18. Available online: https://www.trnsys.com/ (accessed on 17 August 2025).
- Kang, Y.; Cui, Y.; Zhang, D.; Xu, W.; Pang, F.; Lu, S.; Wu, J.; Zhao, Y.; Mao, R. Comprehensive photovoltaic system in roofs, opaque walls, and windows toward zero-energy buildings utilizing multi-objective optimization. J. Build. Eng. 2025, 104, 112320. [Google Scholar] [CrossRef]
- Messac, A.; Ismail-Yahaya, A.; Mattson, C.A. The normalized normal constraint method for generating the Pareto frontier. Struct. Multidiscip. Optim. 2003, 25, 86–98. [Google Scholar] [CrossRef]
- Aguilar-Carrasco, M.T.; Díaz-Borrego, J.; Acosta, I.; Campano, M.Á.; Domínguez-Amarillo, S. Validation of lighting parametric workflow tools of Ladybug and Solemma using CIE test cases. J. Build. Eng. 2023, 64, 105608. [Google Scholar] [CrossRef]
- Deng, H.; Fannon, D.; Eckelman, M.J. Predictive modeling for US commercial building energy use: A comparison of existing statistical and machine learning algorithms using CBECS microdata. Energy Build. 2018, 163, 34–43. [Google Scholar] [CrossRef]
- David, M.; Donn, M.; Garde, F.; Lenoir, A. Assessment of the thermal and visual efficiency of solar shades. Build. Environ. 2011, 46, 1489–1496. [Google Scholar] [CrossRef]
- GB 50033-2013; Standard for Daylighting Design of Buildings. China Architecture & Building Press: Beijing, China, 2013.
- Sun, Y.; Liu, D.; Flor, J.-F.; Shank, K.; Baig, H.; Wilson, R.; Liu, H.; Sundaram, S.; Mallick, T.K.; Wu, Y. Analysis of the daylight performance of window integrated photovoltaics systems. Renew. Energy 2020, 145, 153–163. [Google Scholar] [CrossRef]
- Zhang, S.; He, W.; Chen, D.; Chu, J.; Fan, H.; Duan, X. Thermal comfort analysis based on PMV/PPD in cabins of manned submersibles. Build. Environ. 2019, 148, 668–676. [Google Scholar] [CrossRef]
- Fanger, P.O. Thermal Comfort; Danish Technical Press: Copenhagen, Denmark, 1970. [Google Scholar]
- Biswas, B.K.; Ishii, K.; Watanabe, Y.; Li, J.; Tan, Y.; Dempoya, A.; Lee, S.-I.; Iwamura, T.; Konoshita, S.; Wakabayashi, H. Predicting individual variability in thermal sensation, PMV predictions, and local skin temperature differences using infrared thermography. Build. Environ. 2025, 269, 112477. [Google Scholar] [CrossRef]
- McKay, M.D.; Beckman, R.J.; Conover, W.J. A Comparison of Three Methods for Selecting Values of Input Variables in the Analysis of Output from a Computer Code. Technometrics 2000, 42, 55–61. [Google Scholar] [CrossRef]
- Digital Structures at MIT. Design Space Exploration (DSE): A Suite of Open-Source Grasshopper Tools. Available online: https://www.food4rhino.com/en/app/design-space-exploration (accessed on 25 March 2025).
- Zhou, Z.-H. Ensemble Methods: Foundations and Algorithms; CRC Press: Boca Raton, FL, USA, 2012. [Google Scholar]
- Wolpert, D.H. Stacked Generalization. Neural Netw. 1992, 5, 241–259. [Google Scholar] [CrossRef]
- Hancock, J.T.; Khoshgoftaar, T.M. CatBoost for big data: An interdisciplinary review. J. Big Data 2020, 7, 94. [Google Scholar] [CrossRef] [PubMed]
- Geyer, P.; Singaravel, S. Component-based machine learning for performance prediction in building design. Appl. Energy 2018, 228, 1439–1453. [Google Scholar] [CrossRef]
- Sun, X.; Liu, M.; Sima, Z. A Novel Cryptocurrency Price Trend Forecasting Model Based on LightGBM. Financ. Res. Lett. 2020, 32, 101084. [Google Scholar] [CrossRef]
- Fan, J.; Wang, X.; Wu, L.; Zhou, H.; Zhang, F.; Yu, X.; Lu, X.; Xiang, Y. Comparison of Support Vector Machine and Extreme Gradient Boosting for predicting daily global solar radiation using temperature and precipitation in humid subtropical climates: A case study in China. Energy Convers. Manag. 2018, 164, 102–111. [Google Scholar] [CrossRef]
- Breiman, L. Random Forests. Mach. Learn. 2001, 45, 5–32. [Google Scholar] [CrossRef]
- Yao, L.; Cai, M.; Chen, Y.; Shen, C.; Shi, L.; Guo, Y. Prediction of antiepileptic drug treatment outcomes of patients with newly diagnosed epilepsy by machine learning. Epilepsy Behav. 2019, 96, 92–97. [Google Scholar] [CrossRef]
- Chen, Z.; Cui, Y.; Zheng, H.; Ning, Q. Optimization and prediction of energy consumption, light and thermal comfort in teaching building atriums using NSGA-II and machine learning. J. Build. Eng. 2024, 86, 108687. [Google Scholar] [CrossRef]
- Etemad, A.; Shafaat, A.; Bahman, A.M. Data-Driven Performance Analysis of a Residential Building Applying Artificial Neural Network (ANN) and Multi-Objective Genetic Algorithm (GA). Build. Environ. 2022, 225, 109633. [Google Scholar] [CrossRef]
- Barbiero, P.; Squillero, G.; Tonda, A. Modeling Generalization in Machine Learning: A Methodological and Computational Study. arXiv 2020, arXiv:2006.15680. [Google Scholar]
- Han, Y.; Shen, L.; Sun, C. Developing a parametric morphable annual daylight prediction model with improved generalization capability for the early stages of office building design. Build. Environ. 2021, 200, 107932. [Google Scholar] [CrossRef]
- Yan, H.; Ji, G.; Yan, K. Data-driven prediction and optimization of residential building performance in Singapore considering the impact of climate change. Build. Environ. 2022, 226, 109735. [Google Scholar] [CrossRef]
- Liu, Q.; Chen, Y.; Liu, Y.; Lei, Y.; Wang, Y.; Hu, P. A review and guide on selecting and optimizing machine learning algorithms for daylight prediction. Build. Environ. 2023, 244, 110822. [Google Scholar] [CrossRef]
- Han, Z.; Liu, G.; Zhang, L.; Li, X.; Yuan, Y. Developing a dual-modal surrogate model training framework for building performance prediction in early design stage. Energy Build. 2025, 329, 115307. [Google Scholar] [CrossRef]
- Zheng, G.; Zhang, Y.; Yue, X.; Li, K. Interpretable prediction of thermal sensation for elderly people based on data sampling, machine learning and SHapley Additive exPlanations (SHAP). Build. Environ. 2023, 242, 110602. [Google Scholar] [CrossRef]
- Ye, M.; Li, L.; Yoo, D.-Y.; Li, H.; Zhou, C.; Shao, X. Prediction of shear strength in UHPC beams using machine learning-based models and SHAP interpretation. Constr. Build. Mater. 2023, 408, 133752. [Google Scholar] [CrossRef]
- Katoch, S.; Chauhan, S.S.; Kumar, V. A Review on Genetic Algorithm: Past, Present, and Future. Multimed. Tools Appl. 2021, 80, 8091–8126. [Google Scholar] [CrossRef]
- Deb, K.; Jain, H. An Evolutionary Many-Objective Optimization Algorithm Using Reference-Point-Based Nondominated Sorting Approach, Part I: Solving Problems with Box Constraints. IEEE Trans. Evol. Comput. 2013, 18, 577–601. [Google Scholar] [CrossRef]
- Razmi, A.; Rahbar, M.; Bemanian, M. PCA-ANN integrated NSGA-III framework for dormitory building design optimization: Energy efficiency, daylight, and thermal comfort. Appl. Energy 2022, 305, 117828. [Google Scholar] [CrossRef]
- Rosso, F.; Ciancio, V.; Dell’Olmo, J.; Salata, F. Multi-objective optimization of building retrofit in the Mediterranean climate by means of genetic algorithm application. Energy Build. 2020, 216, 109945. [Google Scholar] [CrossRef]
- Yu, S.; An, Y.; Shi, C.; Wang, A. Multi-objective hierarchical strategy for university dorm renovation in severe cold areas. J. Build. Eng. 2024, 91, 109660. [Google Scholar] [CrossRef]
- Chen, Z.; Cui, Y.; Song, D.; Zheng, H.; Ding, X.; Yang, H. Data-driven Approach of Academic Building-integrated Photovoltaic System Based on Carbon Emission, Energy Payback Time and Comfort: Considering Climate Change. Build. Environ. 2025, 270, 112489. [Google Scholar] [CrossRef]
- GB 50352-2019; Standard for Unified Design of Civil Buildings. China Architecture & Building Press: Beijing, China, 2019.
- GB 50016-2014; Code of Design on Building Fire Protection and Prevention. China Architecture & Building Press: Beijing, China, 2014.
- GB 55015-2021; General Code for Energy Efficiency and Utilization of Renewable Energy in Buildings. China Architecture & Building Press: Beijing, China, 2021.
- GB/T 50785-2012; Evaluation Standard for Indoor Thermal and Humidity Environment of Civil Buildings. China Architecture & Building Press: Beijing, China, 2016.
- Chen, X.; Li, Y. Survey and Analysis of Energy Consumption in Commercial Office Buildings. Build. Energy Effic. 2016, 44, 73–75. (In Chinese) [Google Scholar]
- Zhu, X.; Liu, S.; Zhang, S.; Ye, S. Investigation on the Current Situation of Air Conditioning Systems and Analysis of Energy-Saving Renovation Potential in Office Buildings in Beijing. Archit. Technol. 2024, 55, 1693–1696. (In Chinese) [Google Scholar]
- Li, L.; Chen, Z.; Cao, Y.; Wei, Z.; Qi, Z.; Song, Y. Statistical Analysis of Energy Consumption Characteristics of Large Office Buildings. Constr. Technol. 2022, Z1, 31–35. (In Chinese) [Google Scholar]
- Liu, R.; Wang, G.; Deng, Q. Multi-objective optimization of rural residential envelopes in cold regions of China based on performance and economic efficiency. Case Stud. Therm. Eng. 2024, 61, 104937. [Google Scholar] [CrossRef]
- Foroughi, R.; Asadi, S.; Khazaeli, S. On the optimization of energy efficient fenestration for small commercial buildings in the United States. J. Clean. Prod. 2021, 283, 124604. [Google Scholar] [CrossRef]
- Xu, Y.; Zhang, G.; Yan, C.; Wang, G.; Jiang, Y.; Zhao, K. A two-stage multi-objective optimization method for envelope and energy generation systems of primary and secondary school teaching buildings in China. Build. Environ. 2021, 204, 108142. [Google Scholar] [CrossRef]


Disclaimer/Publisher’s Note: The statements, opinions and data contained in all publications are solely those of the individual author(s) and contributor(s) and not of MDPI and/or the editor(s). MDPI and/or the editor(s) disclaim responsibility for any injury to people or property resulting from any ideas, methods, instructions or products referred to in the content. |
© 2025 by the authors. Licensee MDPI, Basel, Switzerland. This article is an open access article distributed under the terms and conditions of the Creative Commons Attribution (CC BY) license (https://creativecommons.org/licenses/by/4.0/).