Article

Recycling Marble Waste from Afghan Mining Sites as a Replacement for Cement and Sand

1
Department of Civil and Industrial Construction, Kabul Polytechnic University, Kabul 1001, Afghanistan
2
L2MGC, Department of Civil Engineering, University de Cergy-Paris, 95000 Cergy-Pontoise, France
3
ICube, Department of Civil Engineering, INSA Strasbourg University, 67000 Strasbourg, France
*
Author to whom correspondence should be addressed.
Buildings 2025, 15(2), 164; https://doi.org/10.3390/buildings15020164
Submission received: 10 December 2024 / Revised: 27 December 2024 / Accepted: 4 January 2025 / Published: 8 January 2025

Abstract

:
The marble industry in Afghanistan generates significant waste due to a lack of skilled labor and advanced machinery, which is often discarded in landfills. Previous studies suggest that marble waste can be utilized in construction, particularly in cement-based structures. This research investigates using marble waste in concrete as a replacement for cement and sand to address environmental concerns and promote sustainability. A comparative study replaced marble waste with a calcareous filler from Omya SAS. The marble waste, collected from a mining site in Nangarhar, Afghanistan, consisted of 29% particles smaller than 63 μm and 71% sand particles. The waste marble (WM) was added to concrete as a replacement for cement and sand at 3.5%, 4%, and 4.5% by volume. Limestone filler (LF) replaced only cement in the concrete mix. The reference concrete mix aimed for a C25/30 strength. The results showed slight improvements in concrete workability with increasing waste marble content. The optimal WM dosage was 4%, which led to a 9% reduction in compressive strength and a 7% drop in splitting tensile strength. However, this dosage reduced concrete density, improving transfer properties and resulting in cheaper, lighter concrete. The 4% WM dosage corresponds to 7.5% cement and 12% sand replacement.

1. Introduction

Afghanistan has extensive sources of dimensional rocks, such as marble and granite, which can be supplied and exported to the Middle East and other Asian countries. There is a wide variety of marble in Afghanistan, currently extracted from quarries in the provinces of Badakhshan, Balkh, Bamiyan, Helmand, Herat, Kabul, Kandahar, Logar, Faryab, Wardak, Nangarhar, Paktia, Parwan, and Samangan. However, the Afghan marble industry has suffered from a severe lack of investment and limited access to international markets due to the ongoing conflict over the past three decades. According to the U.S. Geological Survey, the total volume of marble reserves is estimated at around 1.3 billion tons, with a potential value of approximately USD 150 billion [1]. Investment in standard extraction methods could result in reduced waste production, higher-quality quarries, and increased benefits. Generally, mining activities produce an enormous amount of waste, and this phenomenon is particularly noticeable in the marble industry, where both solid waste and sludge containing marble dust are generated [2].
The generation of waste occurs throughout the mining process, from the initial stages to the production of final products. The quantity of waste is estimated to be about 50% of the minerals mined [3]. Moreover, according to F. J. Aukour (2009), processing one ton of marble stone produces almost one ton of sludge, which consists of 70% water and 30% marble powder [4]. Due to the non-degradable nature of marble waste, its accumulation directly results in serious environmental problems and challenges. If this continues, it could pose a significant threat to human health and the physical, chemical, and biological elements of the environment. Therefore, the reuse and recycling of waste materials have been strongly emphasized to utilize these wastes by producing new products or valorizing them as admixtures or substitutes in the concrete industry. This would help make natural resources more efficient, reduce the cost of produced elements, and protect the environment from waste accumulation. According to evidence from previous research, there are two forms of processing waste from natural stones. The first is solid waste, generated during quarrying in solid form, and the second is waste generated during processing, in a semi-liquid form, known as marble slurry [4,5,6]. The amount of waste generated depends on several factors. According to A. Rana et al. (2016), the overall amount of waste produced from processing marble blocks and slabs varies depending on factors such as the type of saw, cutting method, and marble type [7]. This waste typically accounts for 30–50% of the total processing volume.
A report on the commercial utilization of marble slurry in Rajasthan (India) [8] stated that nearly 70% of this valuable mineral resource is wasted due to mining, processing, and polishing. Many studies have been conducted on the utilization of waste marble in the mortar and concrete industry to reduce the overall cost of cementitious structures and manage the waste effectively. For instance, M. Majeed et al. (2021) evaluated some properties of concrete by partially replacing cement with marble slurry at 0%, 5%, 10%, and 15% by mass of cement [9]. The obtained results showed that due to the highwater absorption of the marble powder, which resulted in the cement particles’ insolation, the concrete workability decreased. Furthermore, all of the concrete’s properties, including compressive strength and UPV, increased up to 10% waste marble powder (WMP) replacement. This was due to the finer particles of WMP constructing a denser structure beyond the 10% replacement level, resulting in an insufficient quantity of cement, decreasing the concrete’s physical properties. In the same context, S. S. Hafiz et al. (2019) studied the effects of partial cement replacement with marble waste powder with different dosages (from 0% to 20%) by cement weight on various properties of concrete [10]. The optimum percentage for replacing marble powder with cement, which can increase the concrete’s strength and play a significant role in defining its properties, was highlighted as 10%. Similarly, waste marble was utilized as cement replacement in mortars by K. Vardhan et al. (2015) to explore the mechanical properties and microstructural analysis of cement mortar [11]. The obtained results indicated that up to 10% of marble powder can be used as cement replacement with no negative impact on the mechanical properties. Furthermore, M. R. Rafi et al. (2021) utilized dried waste marble slurry as a cement replacement by weight (0%, 5%, 10%, 15%, 20% & 25%) in conventional mortars [12]. The study’s outcome indicated that the optimal usage of dried waste marble slurry maintained workability, developed strength, and produced cheaper cement mortars, obtained at 12.6%. Many similar studies have revealed the same optimal dosage range for concrete and mortar production. This study also focuses on the valorization of marble waste, collected directly from a mining site in the form of mixed solid powder and aggregate, for use in concrete production. The aim of this approach is to reduce cement usage and produce lighter, more cost-effective concrete.

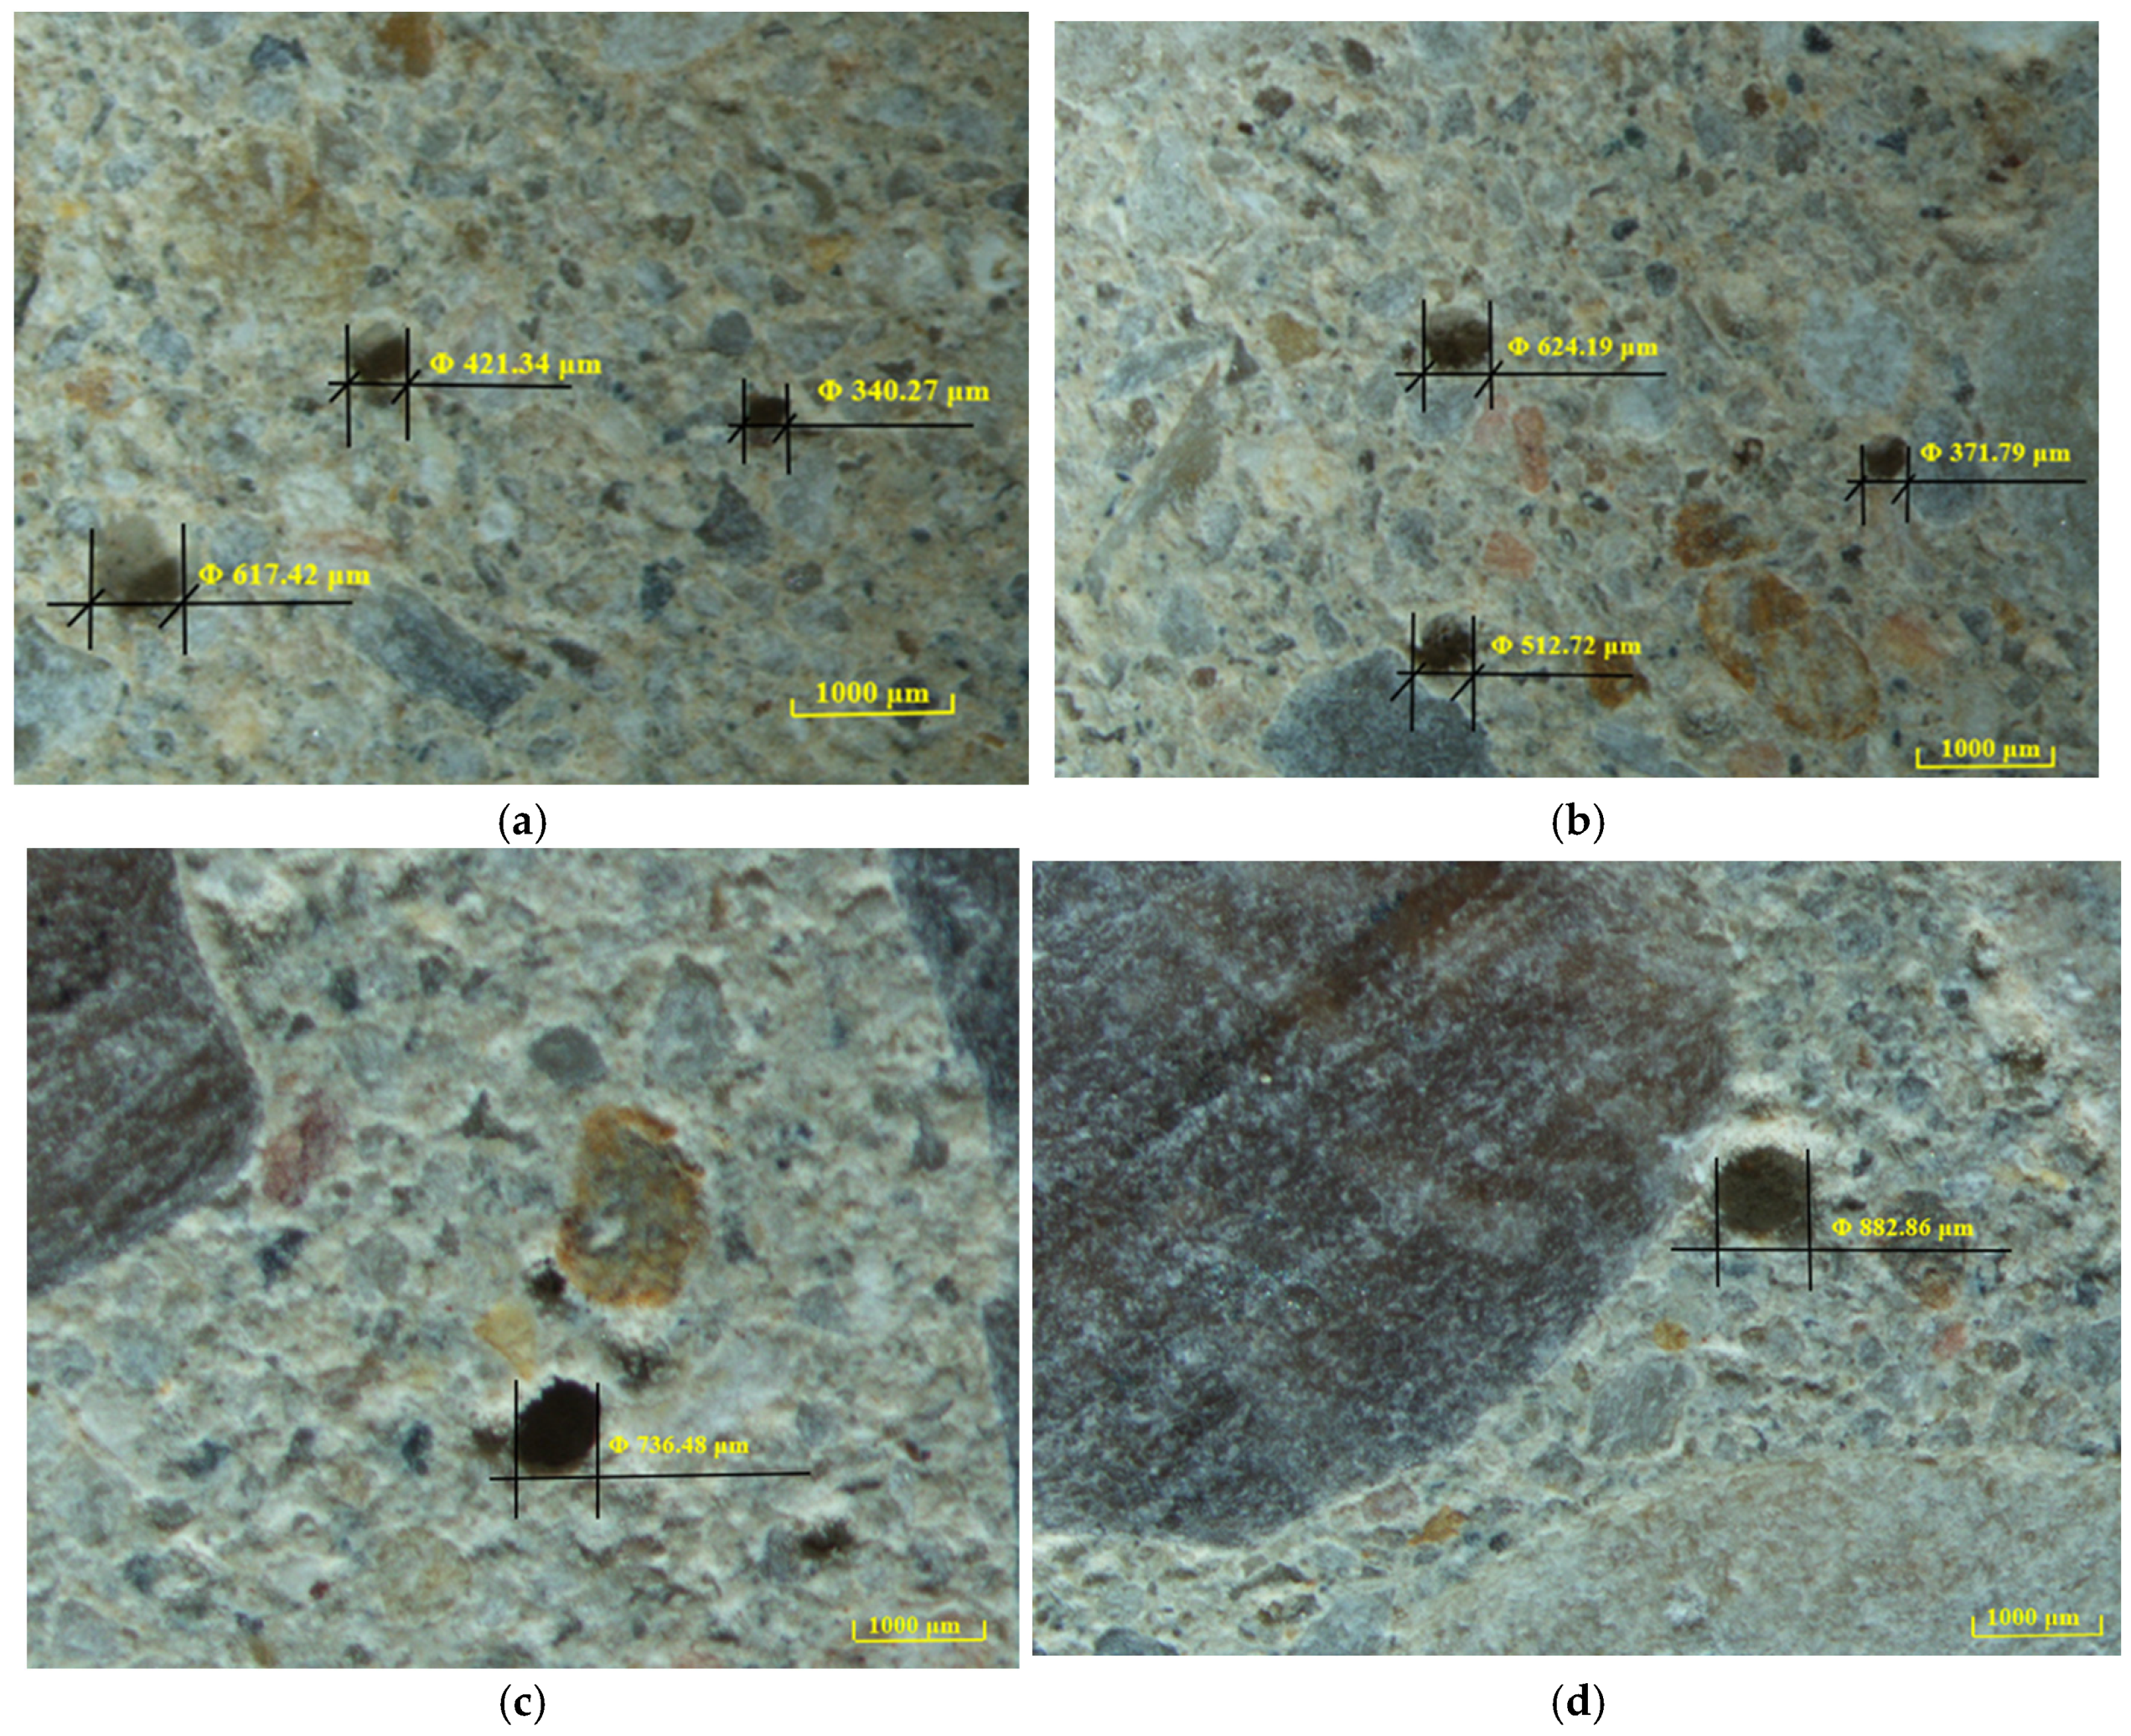
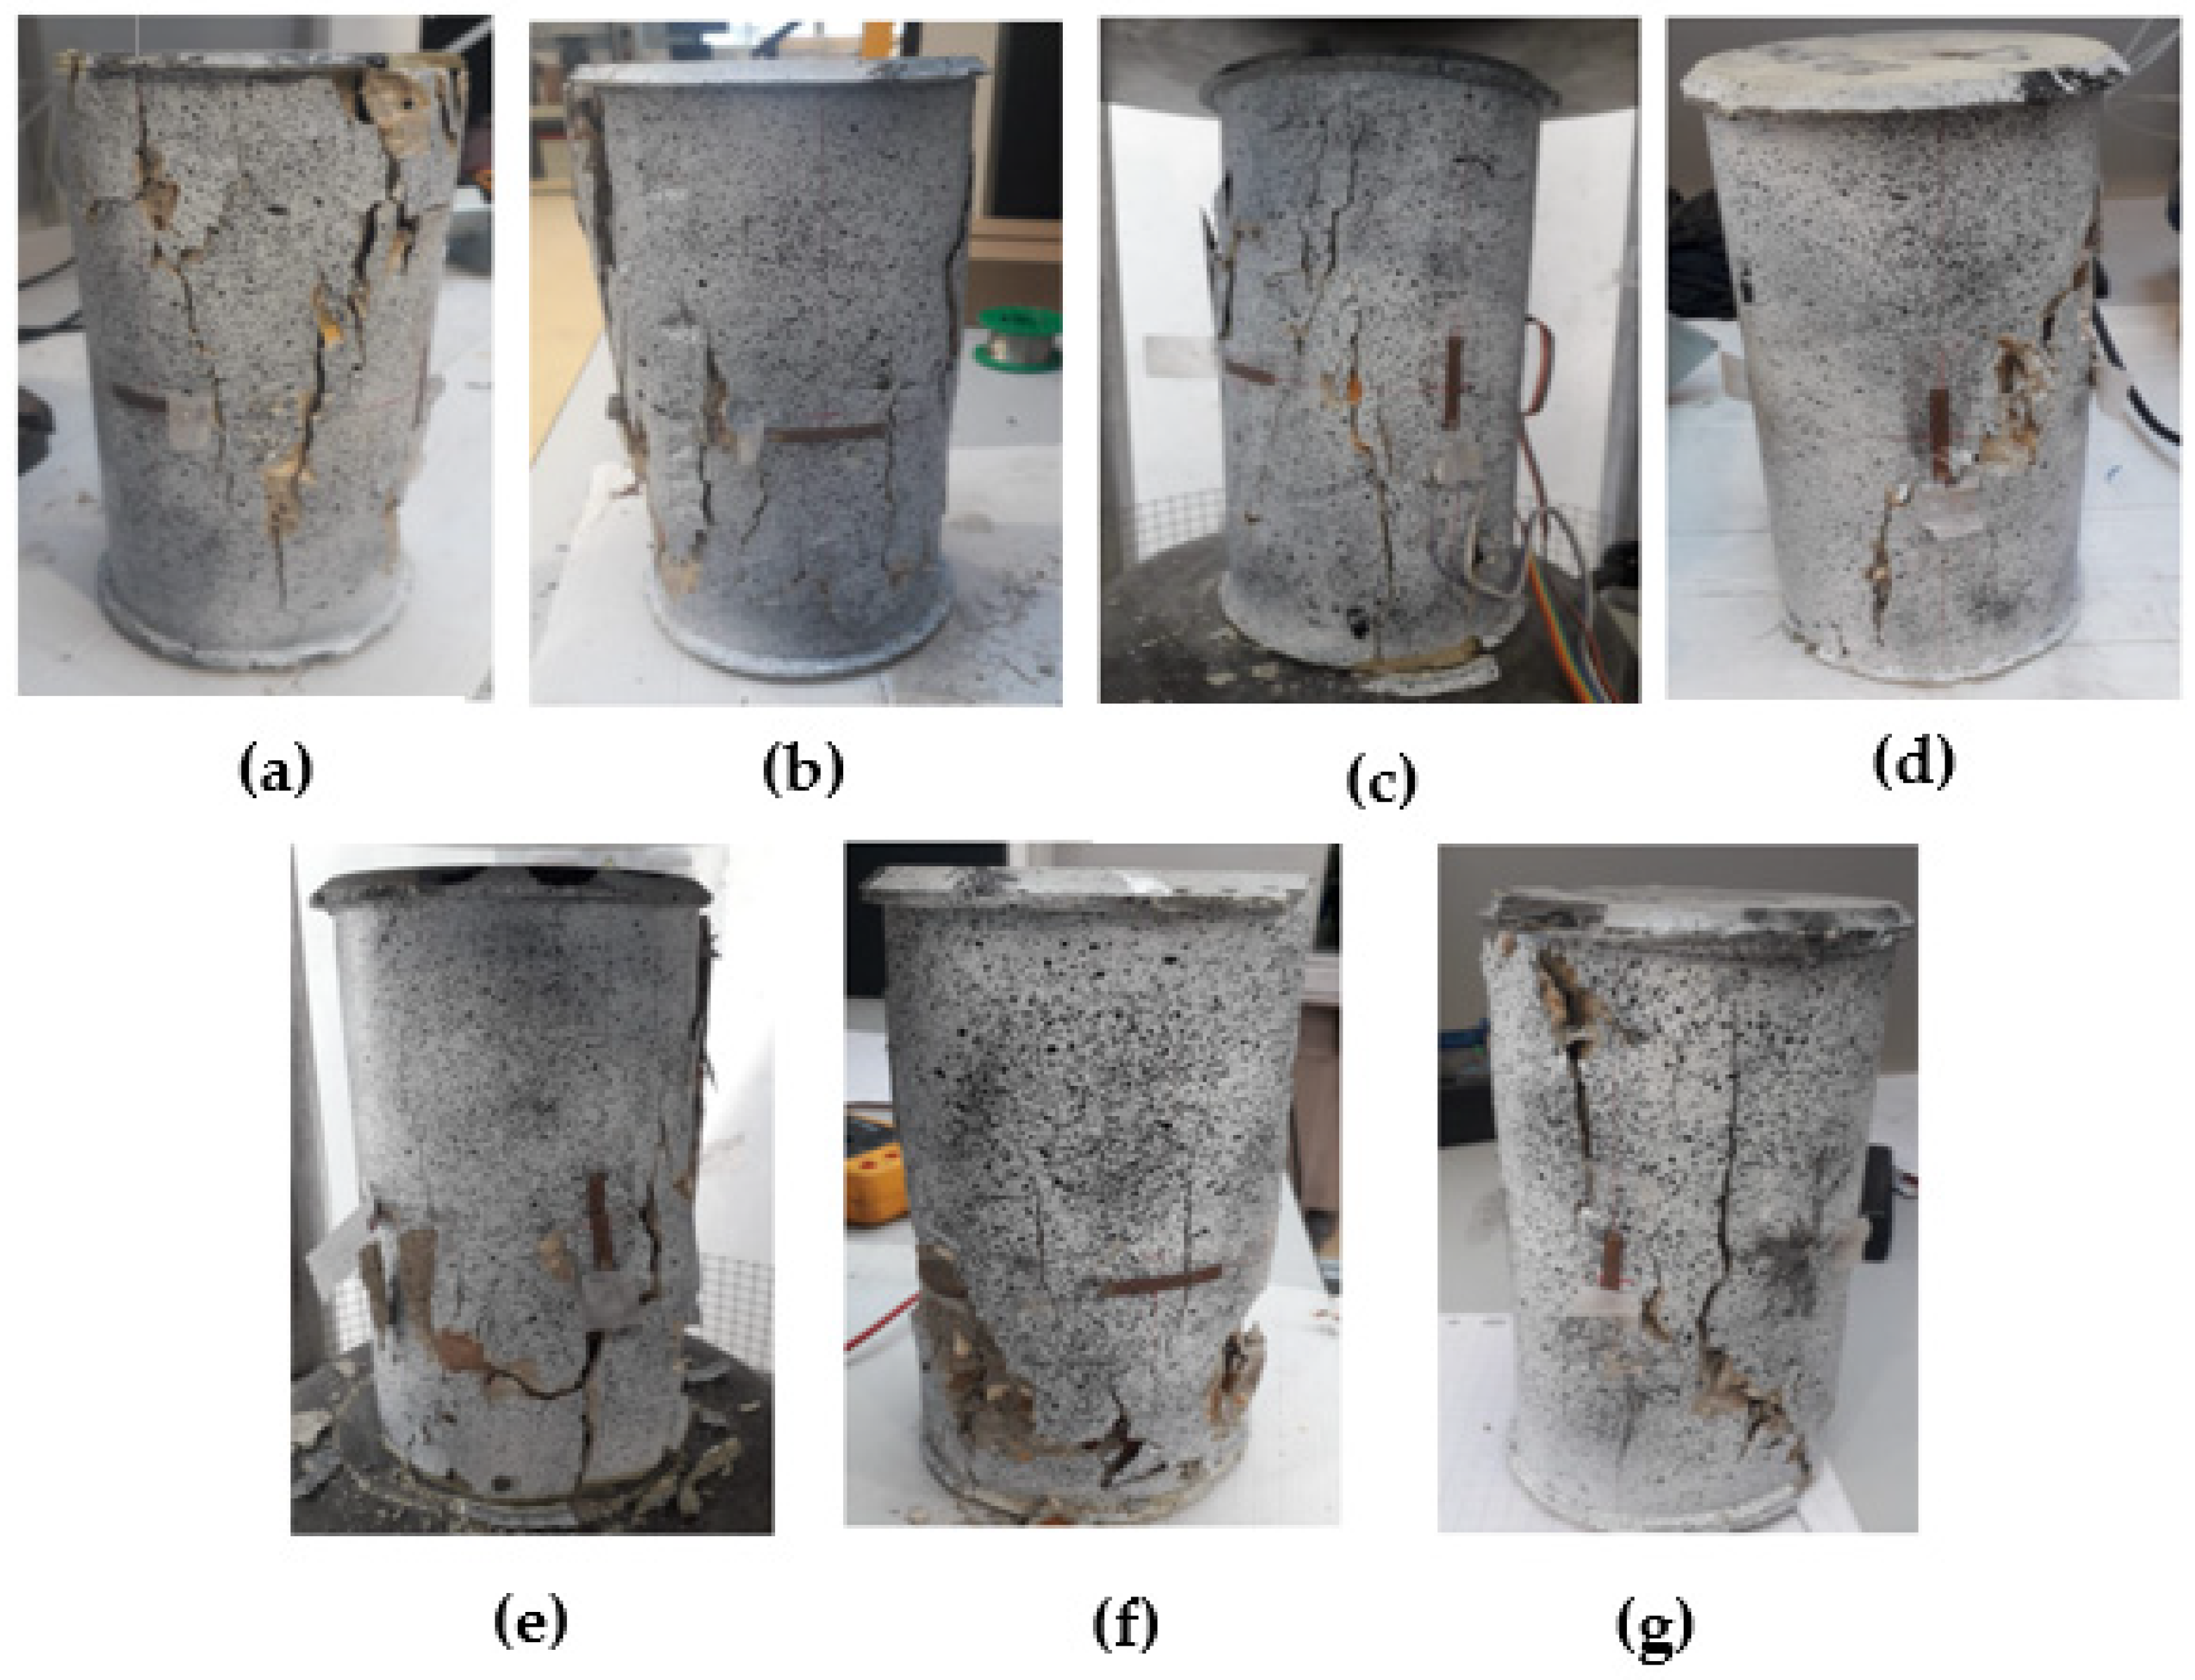
2. Materials and Methods
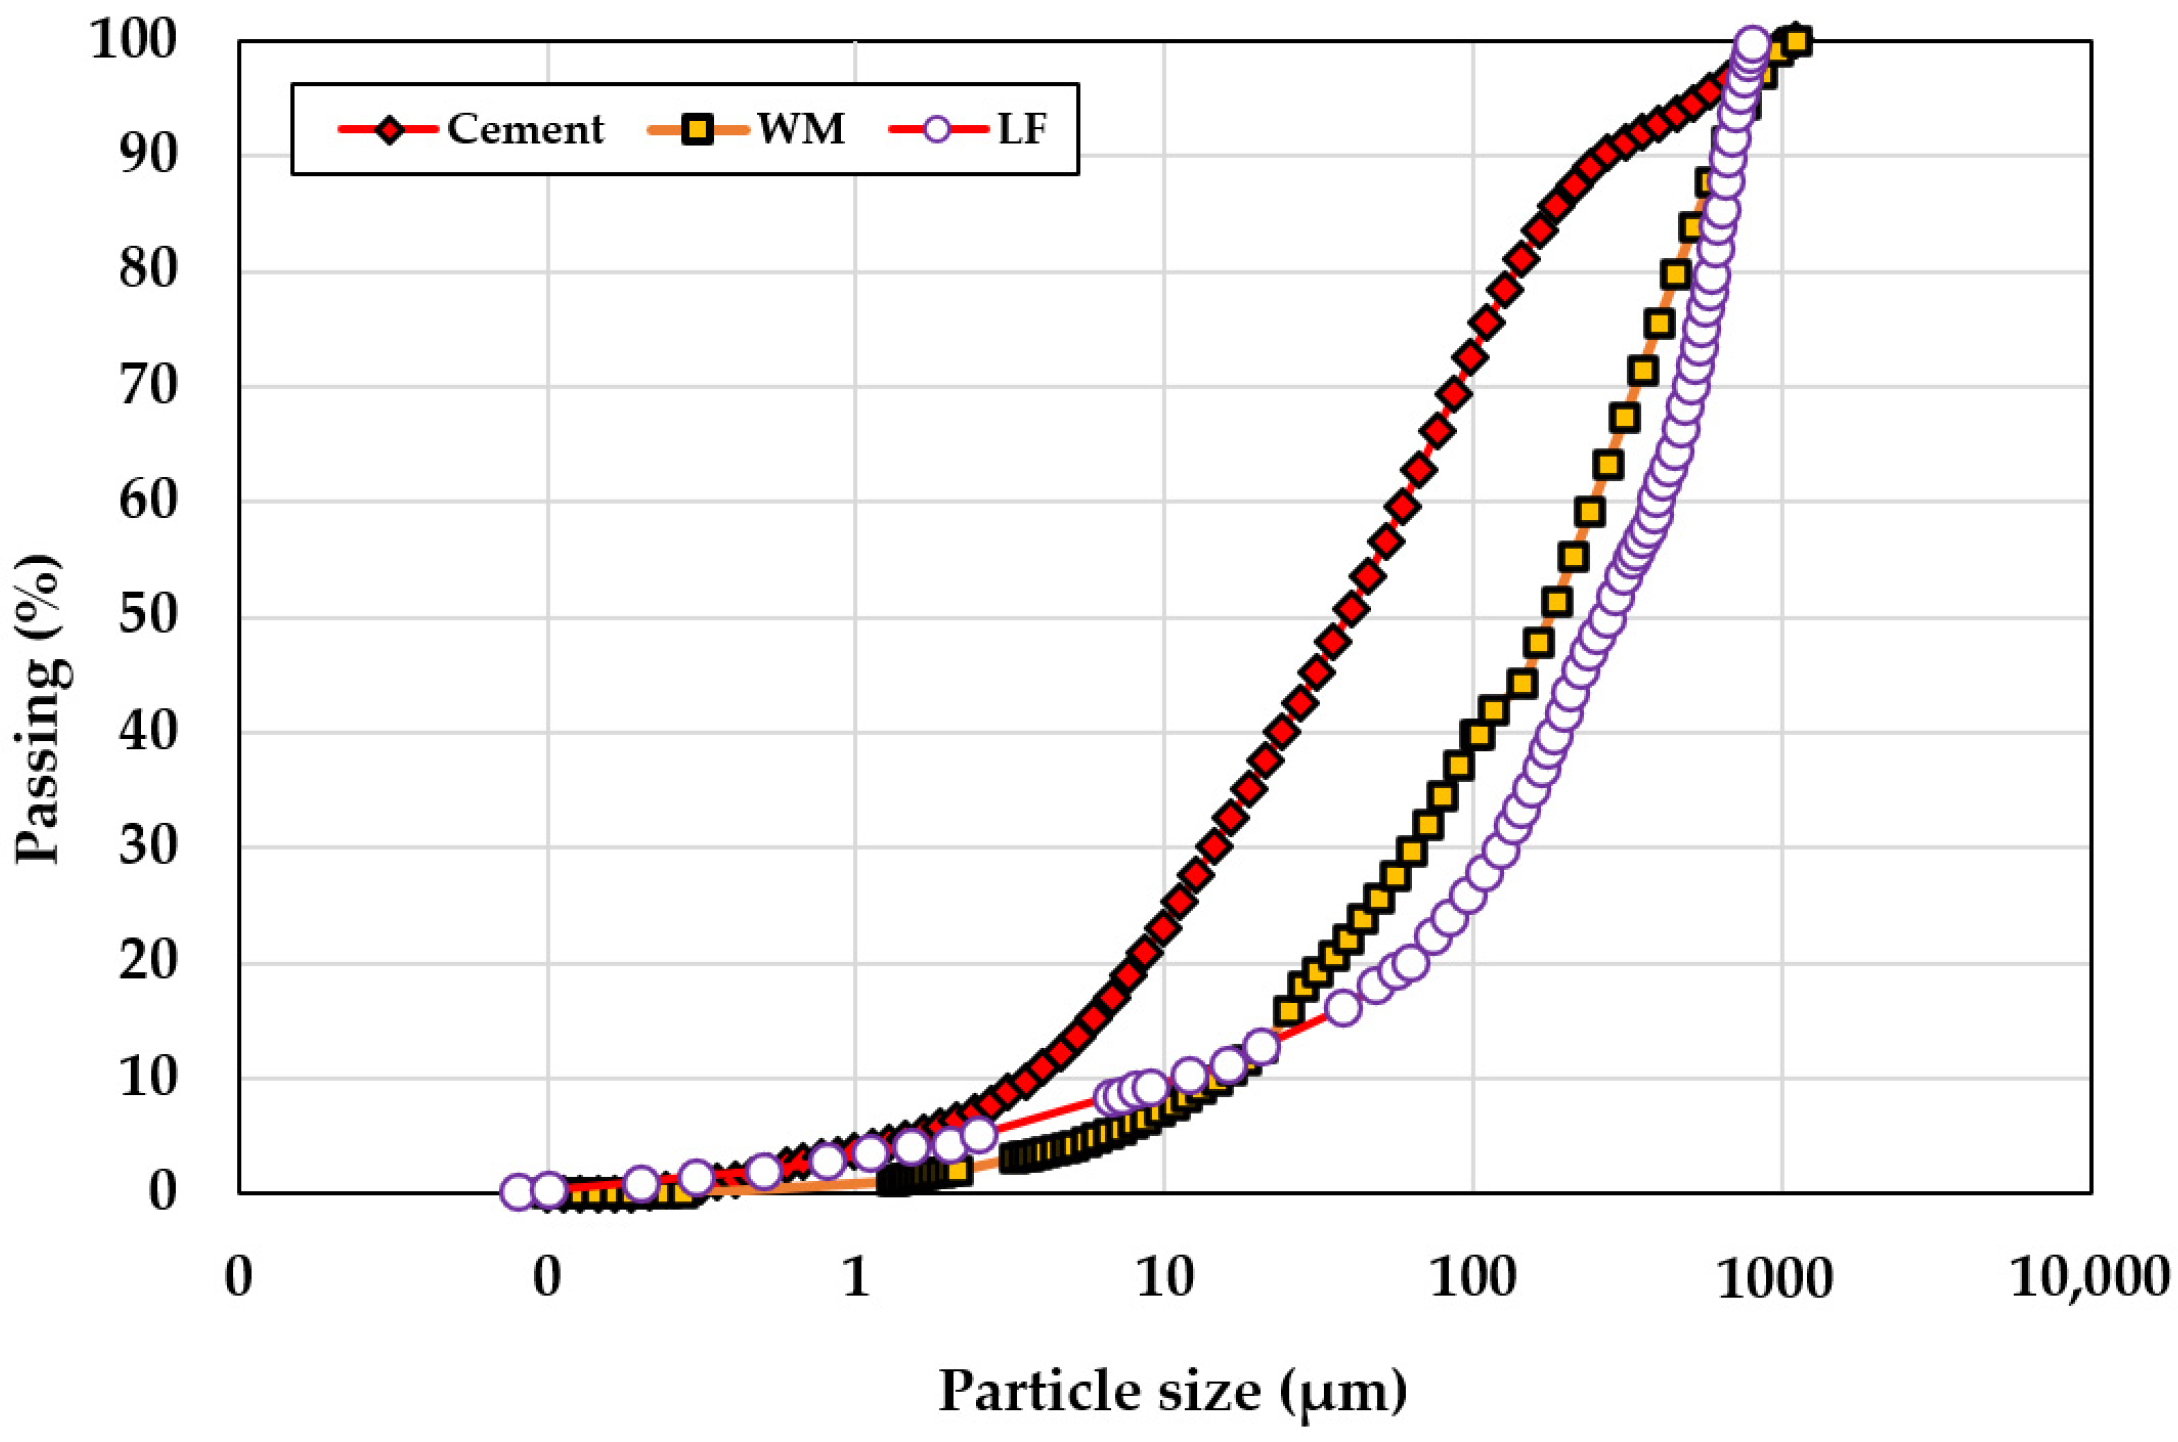
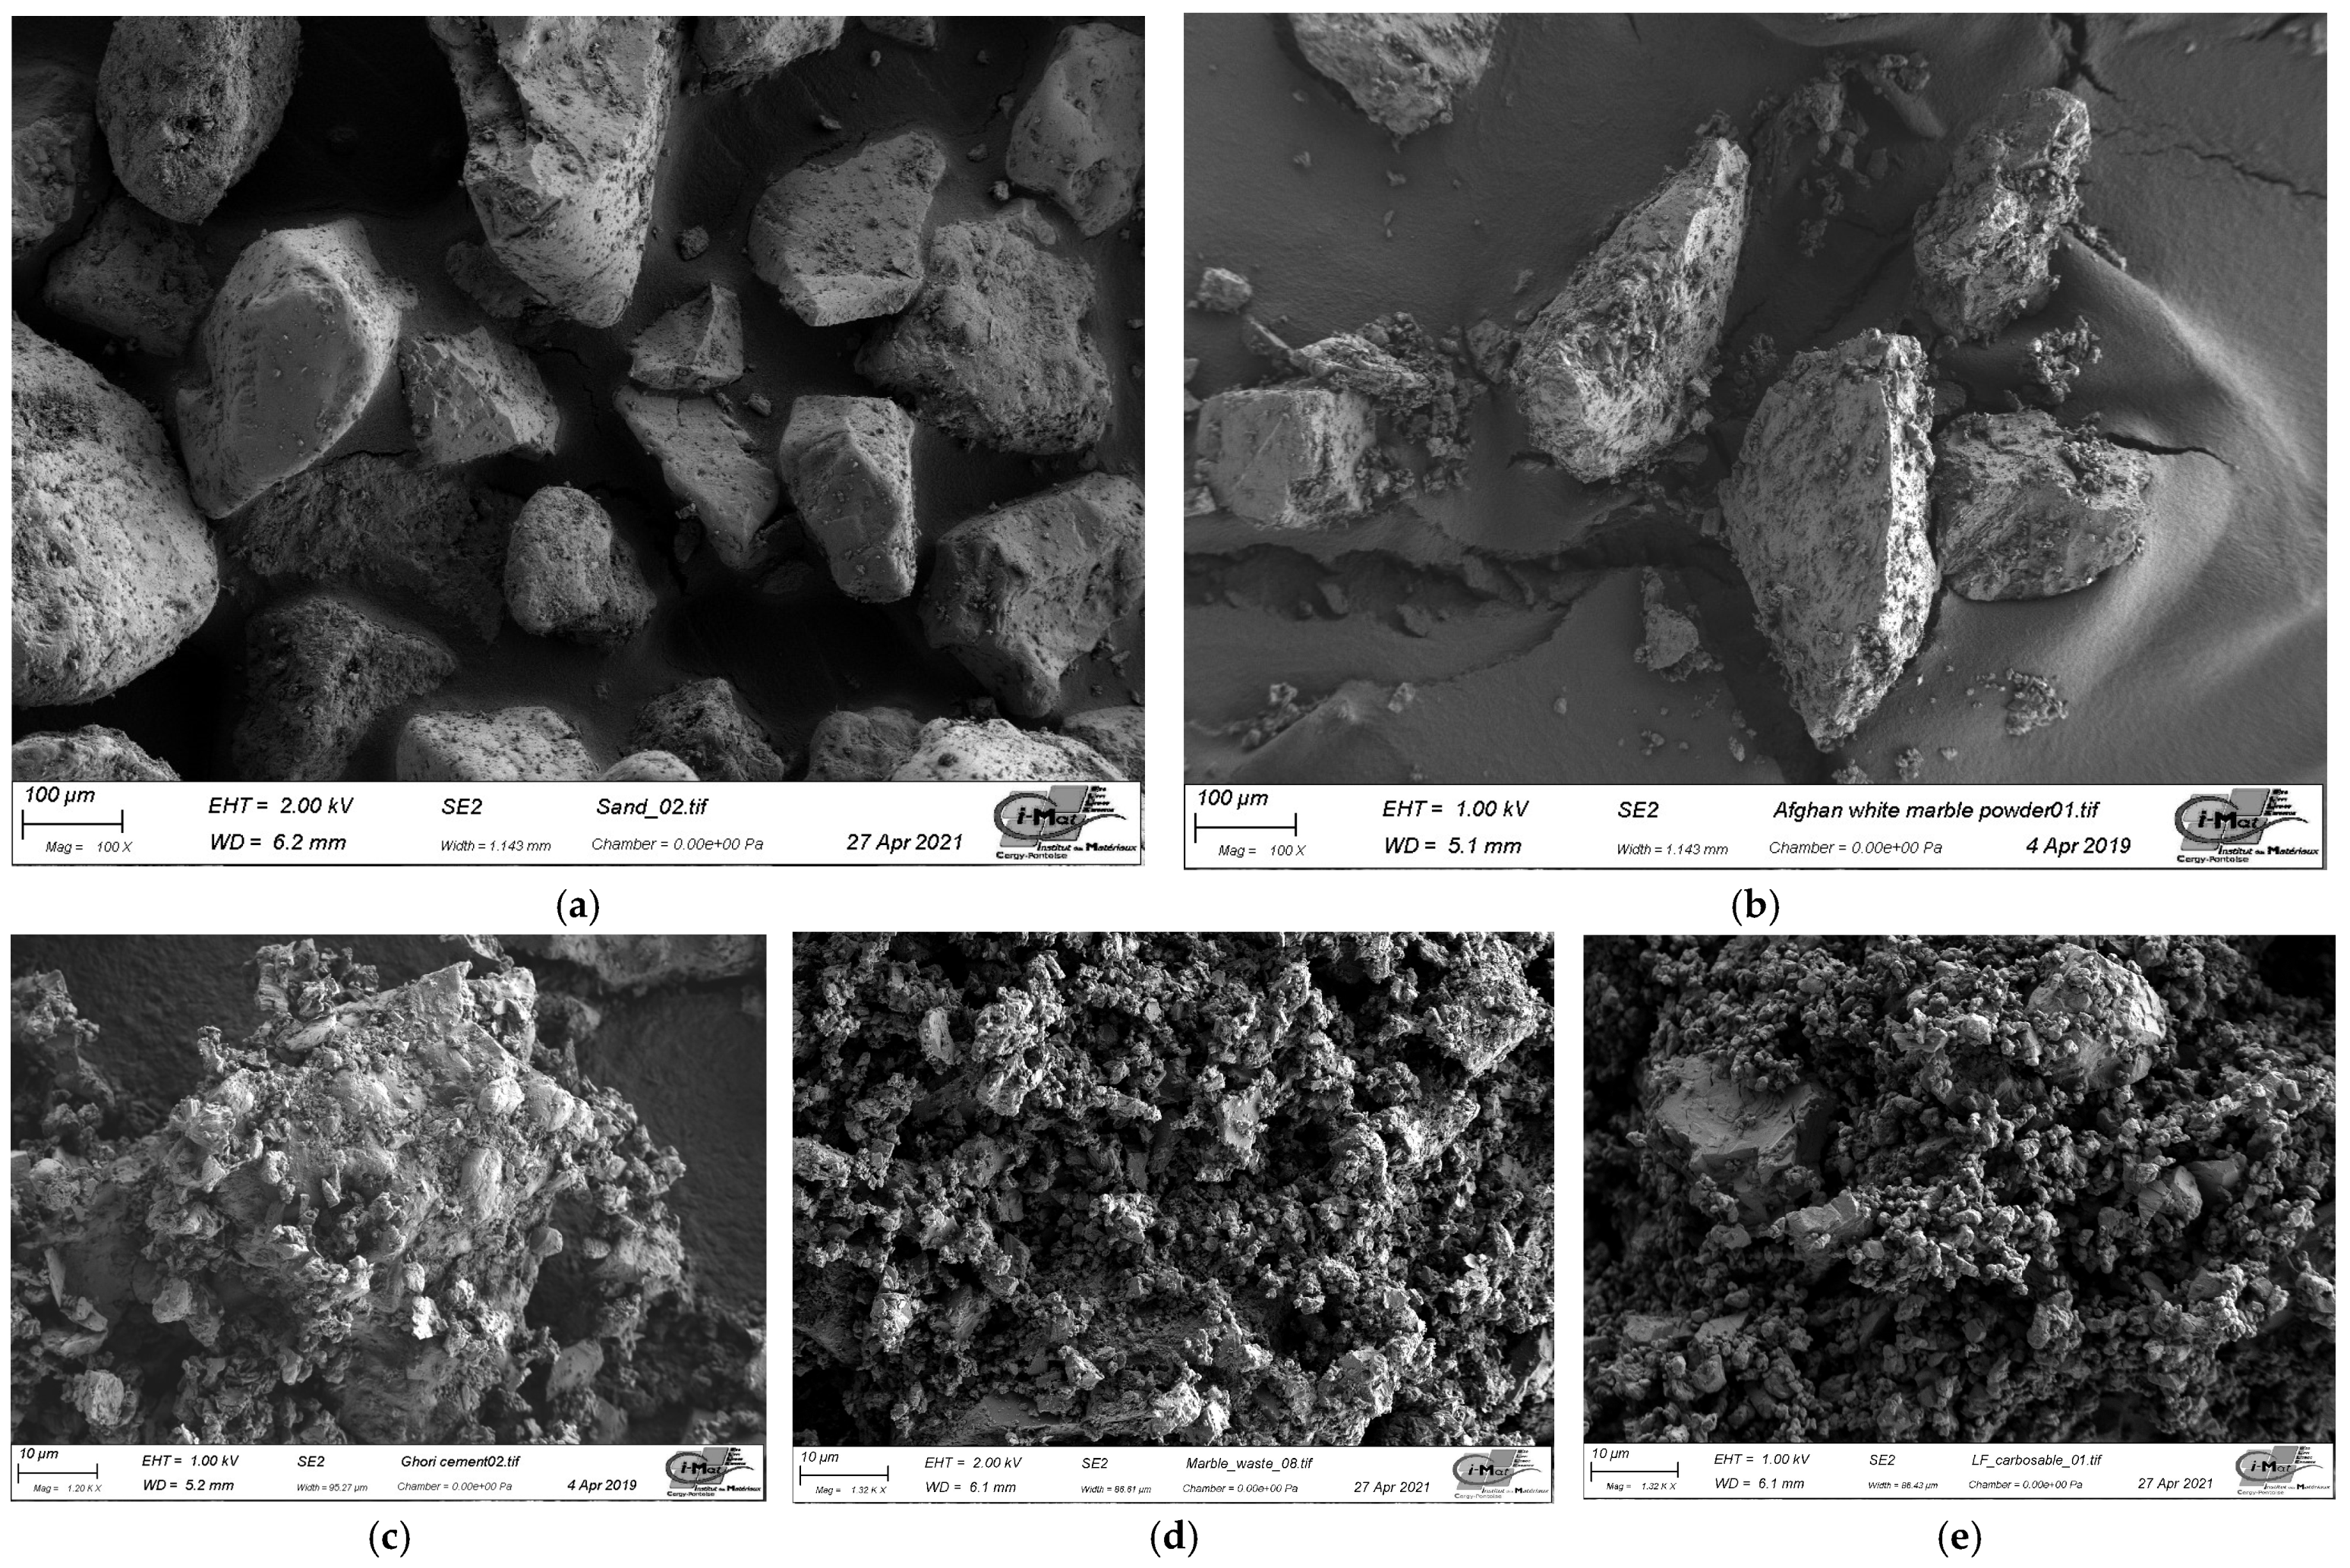
2.1. Materials

2.1.1. Cement

Ordinary Portland cement, branded GHORI, available in Kabul-Afghanistan, was used for the concrete mixes. Its particle size distribution is shown in Figure 1. The initial and final setting times of the cement were determined according to the standard NF EN 196-3 [13], and the results are presented in Table 1, along with its other physical properties.

2.1.2. Waste Marble

The waste marble was directly collected from a mining site located in Nangarhar, an eastern province of Afghanistan. The particle size distribution of the waste marble was determined using the laser diffraction method with a Mastersizer 3000 instrument produced by Malvern, Worcestershire-UK. The waste marble consisted of 29% fine particles with a particle size of less than 63 μm, while the remaining 71% were sand-sized particles. Fine waste marble (FWM) and sand waste marble (SWM) were used as replacements for cement and sand in the concrete mix by volume, respectively. Figure 1 illustrates the particle size distribution of the waste marble (WM), along with the particle size distribution of the cement and limestone filler (LF) used in this study.

2.1.3. Limestone Filler

The calcareous filler/limestone filler from Omya SAS is a fine, naturally sourced 95% calcium carbonate (CaCO3) material that is widely utilized in industries such as construction, paint, and plastics owing to its attributes like high whiteness, low abrasiveness, and superior dispersion properties. Limestone filler (CARBOSABLE-AU), certified to ISO 9001 [13] and supplied by OMYA France, with a specific gravity of 2.7 g/cm3 and a specific surface area of 3000 cm2/g, was used to replace the same amount of cement as fine waste marble (FWM).

2.1.4. Aggregates

Natural sand (0/4) and natural gravel (6.3/20) were used as aggregates in the preparation of the concrete mixes with and without waste marble and limestone filler. The fineness modulus of natural sand was calculated as 2.6 ± 0.1 according to standard NF EN 12620+A1 (2008) [14].

2.1.5. Chemical Composition

X-ray fluorescence (XRF) spectroscopy was used to quantify the chemical elements in both the cement and marble powder. The chemical composition results of the GHORI cement and waste marble powder (WMP), along with the physical properties of these raw materials, are listed in Table 1 below.
Table 1. Physical properties and chemical composition of cement and fine waste marble.
ComponentsChemical Composition (%)Physical Properties
GHORI CementWaste MarblePropertiesCementWaste MarbleLimestone Fillers
SiO217.632.18Specific gravity (g/cm2)2.9042.702.70
Al2O34.8920.53
Fe2O32.0160.04Specific surface area (cm2/g)250038943000
MgO1.3273.394
CaO63.4451.21Consistency (%)0.280--
Na2O1.3740.536Initial and final setting times (mins)97--
SO34.2150.054186--

2.1.6. Superplasticizer

An MC-Power Flow 3140-type superplasticizer, produced by MC-Bauchemie in Münster, Germany, certified according to standard ILNAS-EN (2012) [15], was used to produce C25/30 resistance-class concrete. The superplasticizer comprised 35% dry extract and 65% water.

2.2. Research Methodology

2.2.1. Concrete Formulation
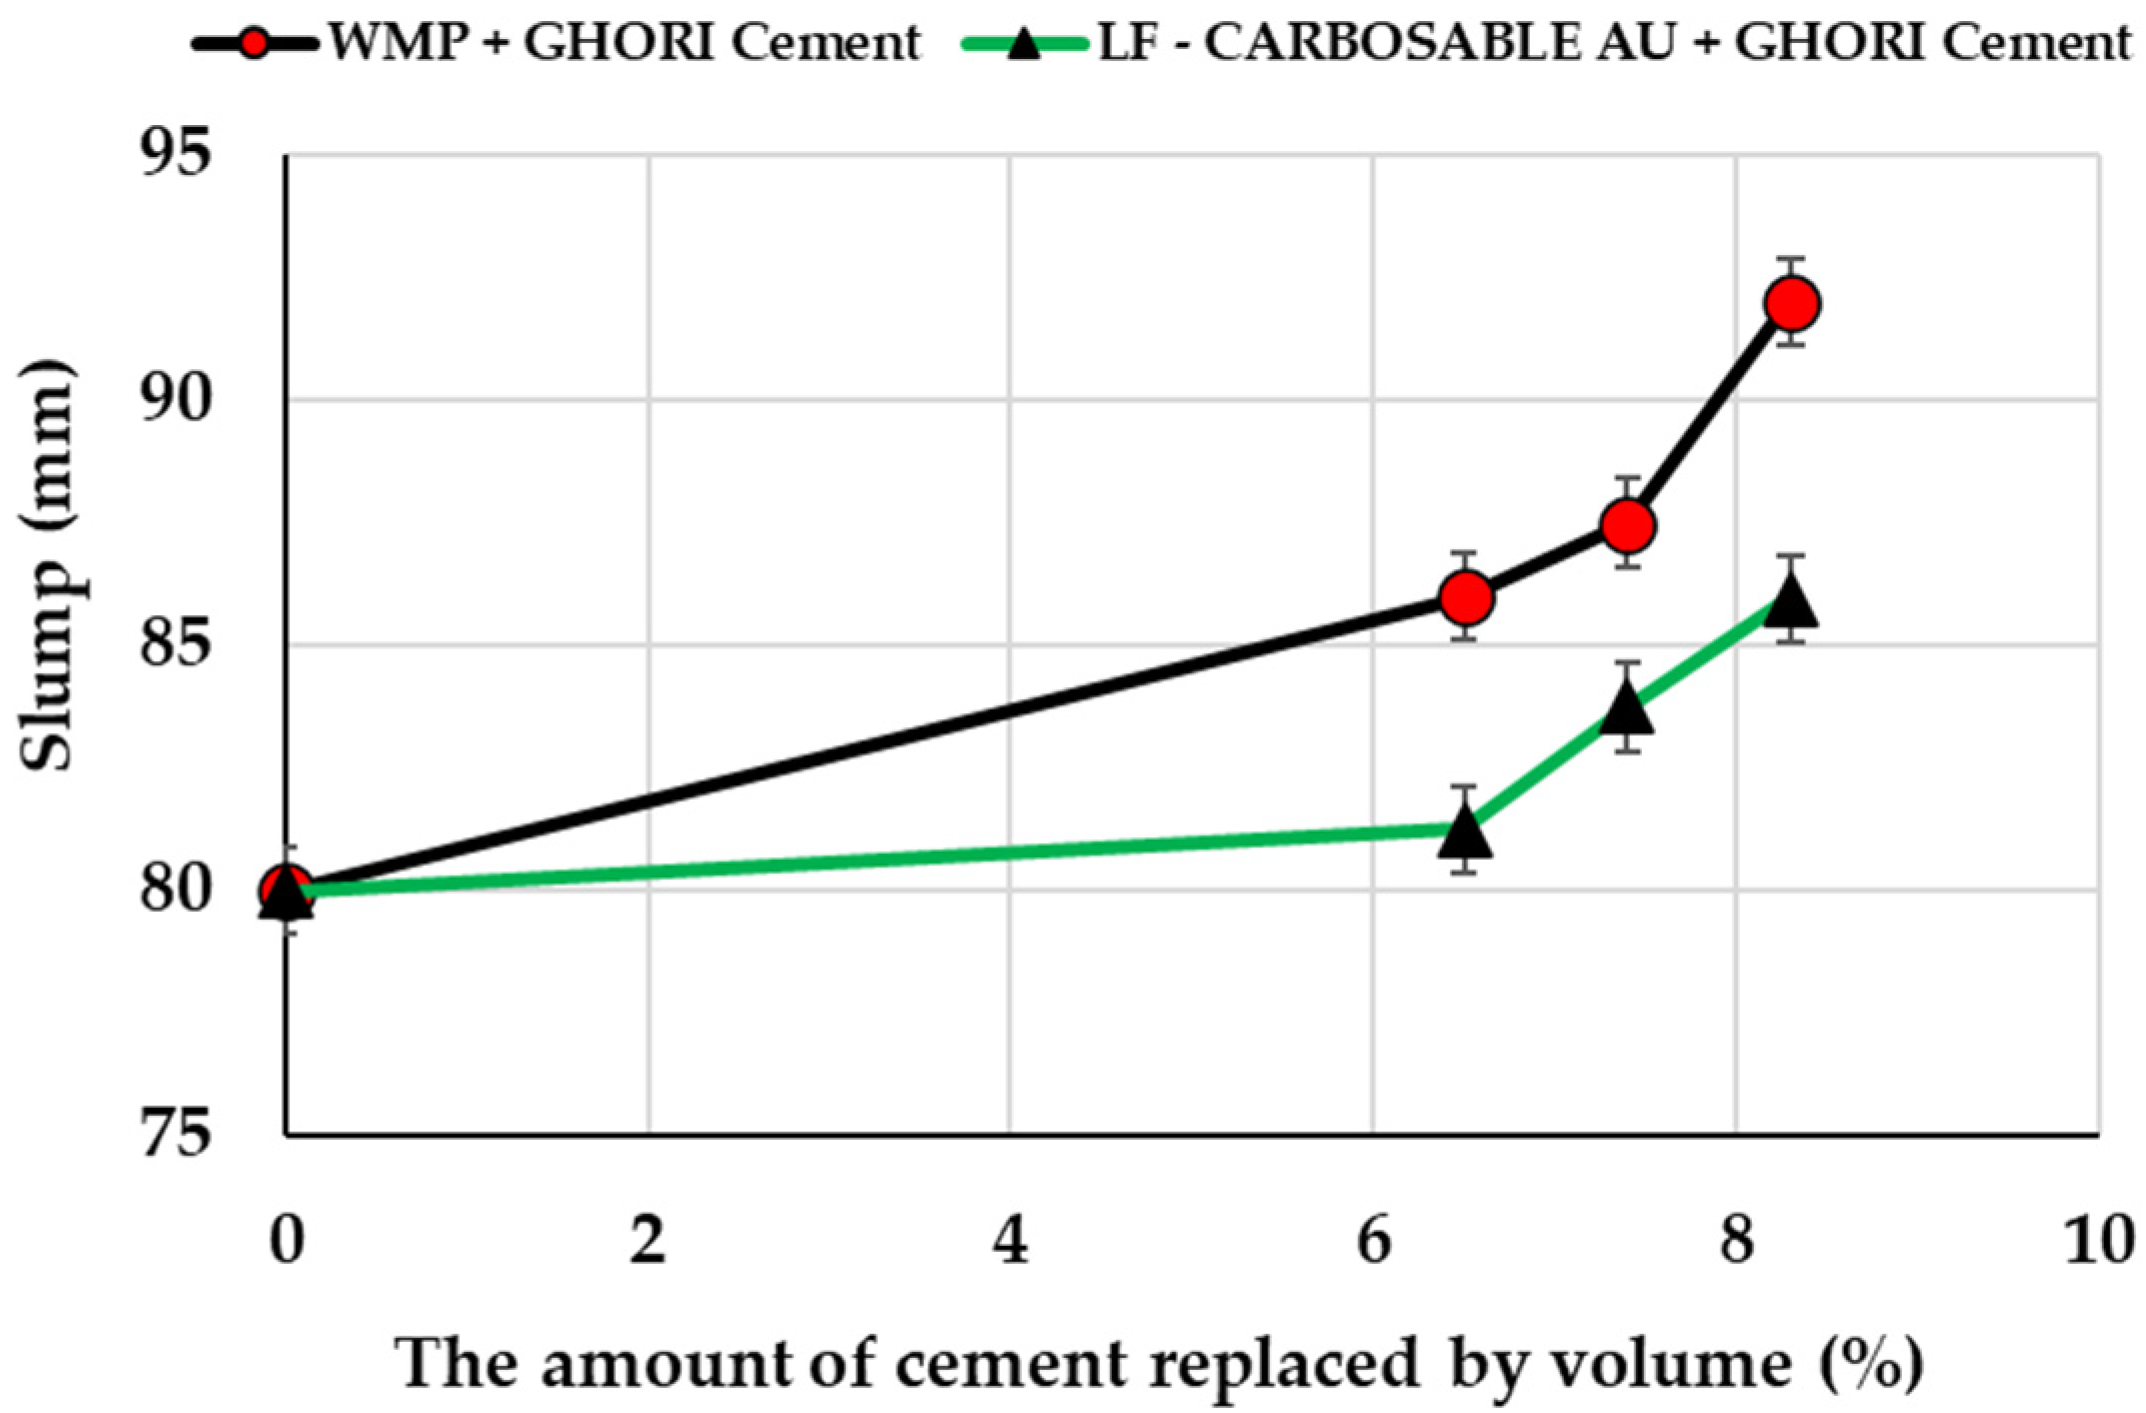
Concrete with a C25/30 strength class and XC1 exposure class was designed based on ACI standards [16].
Seven concrete formulations, differing in their ratios of fine waste marble (FWM), sand waste marble (SWM), and limestone fillers (LF) were designed as reference concrete (ref, with no additives); concrete with three dosages of waste marble (WM): 3.5% WM, 4% WM, and 4.5% WM by volume of overall mix; and concrete with three dosages of limestone filler: 1% LF, 1.2% LF, and 1.3% LF by volume of the mix (Table 2).
As the specific gravity of calcareous fillers is almost the same as that of fine waste marble (FWM), we replaced it by 6.5%, 7.4%, and 8.3% by volume of cement. The derived concrete formulations were also designed as 1% LF, 1.2% LF, and 1.3% LF, where 1%, 1.2%, and 1.3% are the dosages of limestone filler by the overall volume of concrete mix.

2.2.2. Workability

The Abrams cone slump test was utilized, as prescribed by the 12350-2 [17] standard. The test involved introducing fresh concrete into a tapered mold in three layers (with a base diameter of 200 mm, an upper diameter of 100 mm, and a height of 300 mm). Each layer was compacted with 25 pitting strokes using a rod with a diameter of 16 mm. Once the mold was filled, it was slowly removed, and the consistency was assessed based on the slump, h, which is the difference between the height of the cone and the highest point of the sagged concrete. The consistency class of the concretes formulated in this study was classified as S2.
The mini cone test was also conducted for the cement paste according to the NF EN 196-1 standard [18]. A mini cone with a diameter of 70 mm at the top, 80 mm at the bottom, and a height of 40 mm was used. This test indicated the minimum water volume required to disperse the powder grains and allow the flow. Furthermore, it indicated the minimum water volume required to disperse the powder grains and allow for flow. The test involved varying the volume of water (“Vw”) for a given volume of powder (“Vp”) and measuring the average diameter of the spread (“D average”). The evolution of the ratio against the relative flow area of the binder varied linearly and was calculated using Equations (1) and (2).
In Equation (2), α is the minimum water dosage required to fluidize the powder, while β measures the powder’s ability to spread by increasing the water dosage.
Γ = D a v e r a g e D o 2 1
V W V P = α Γ + β

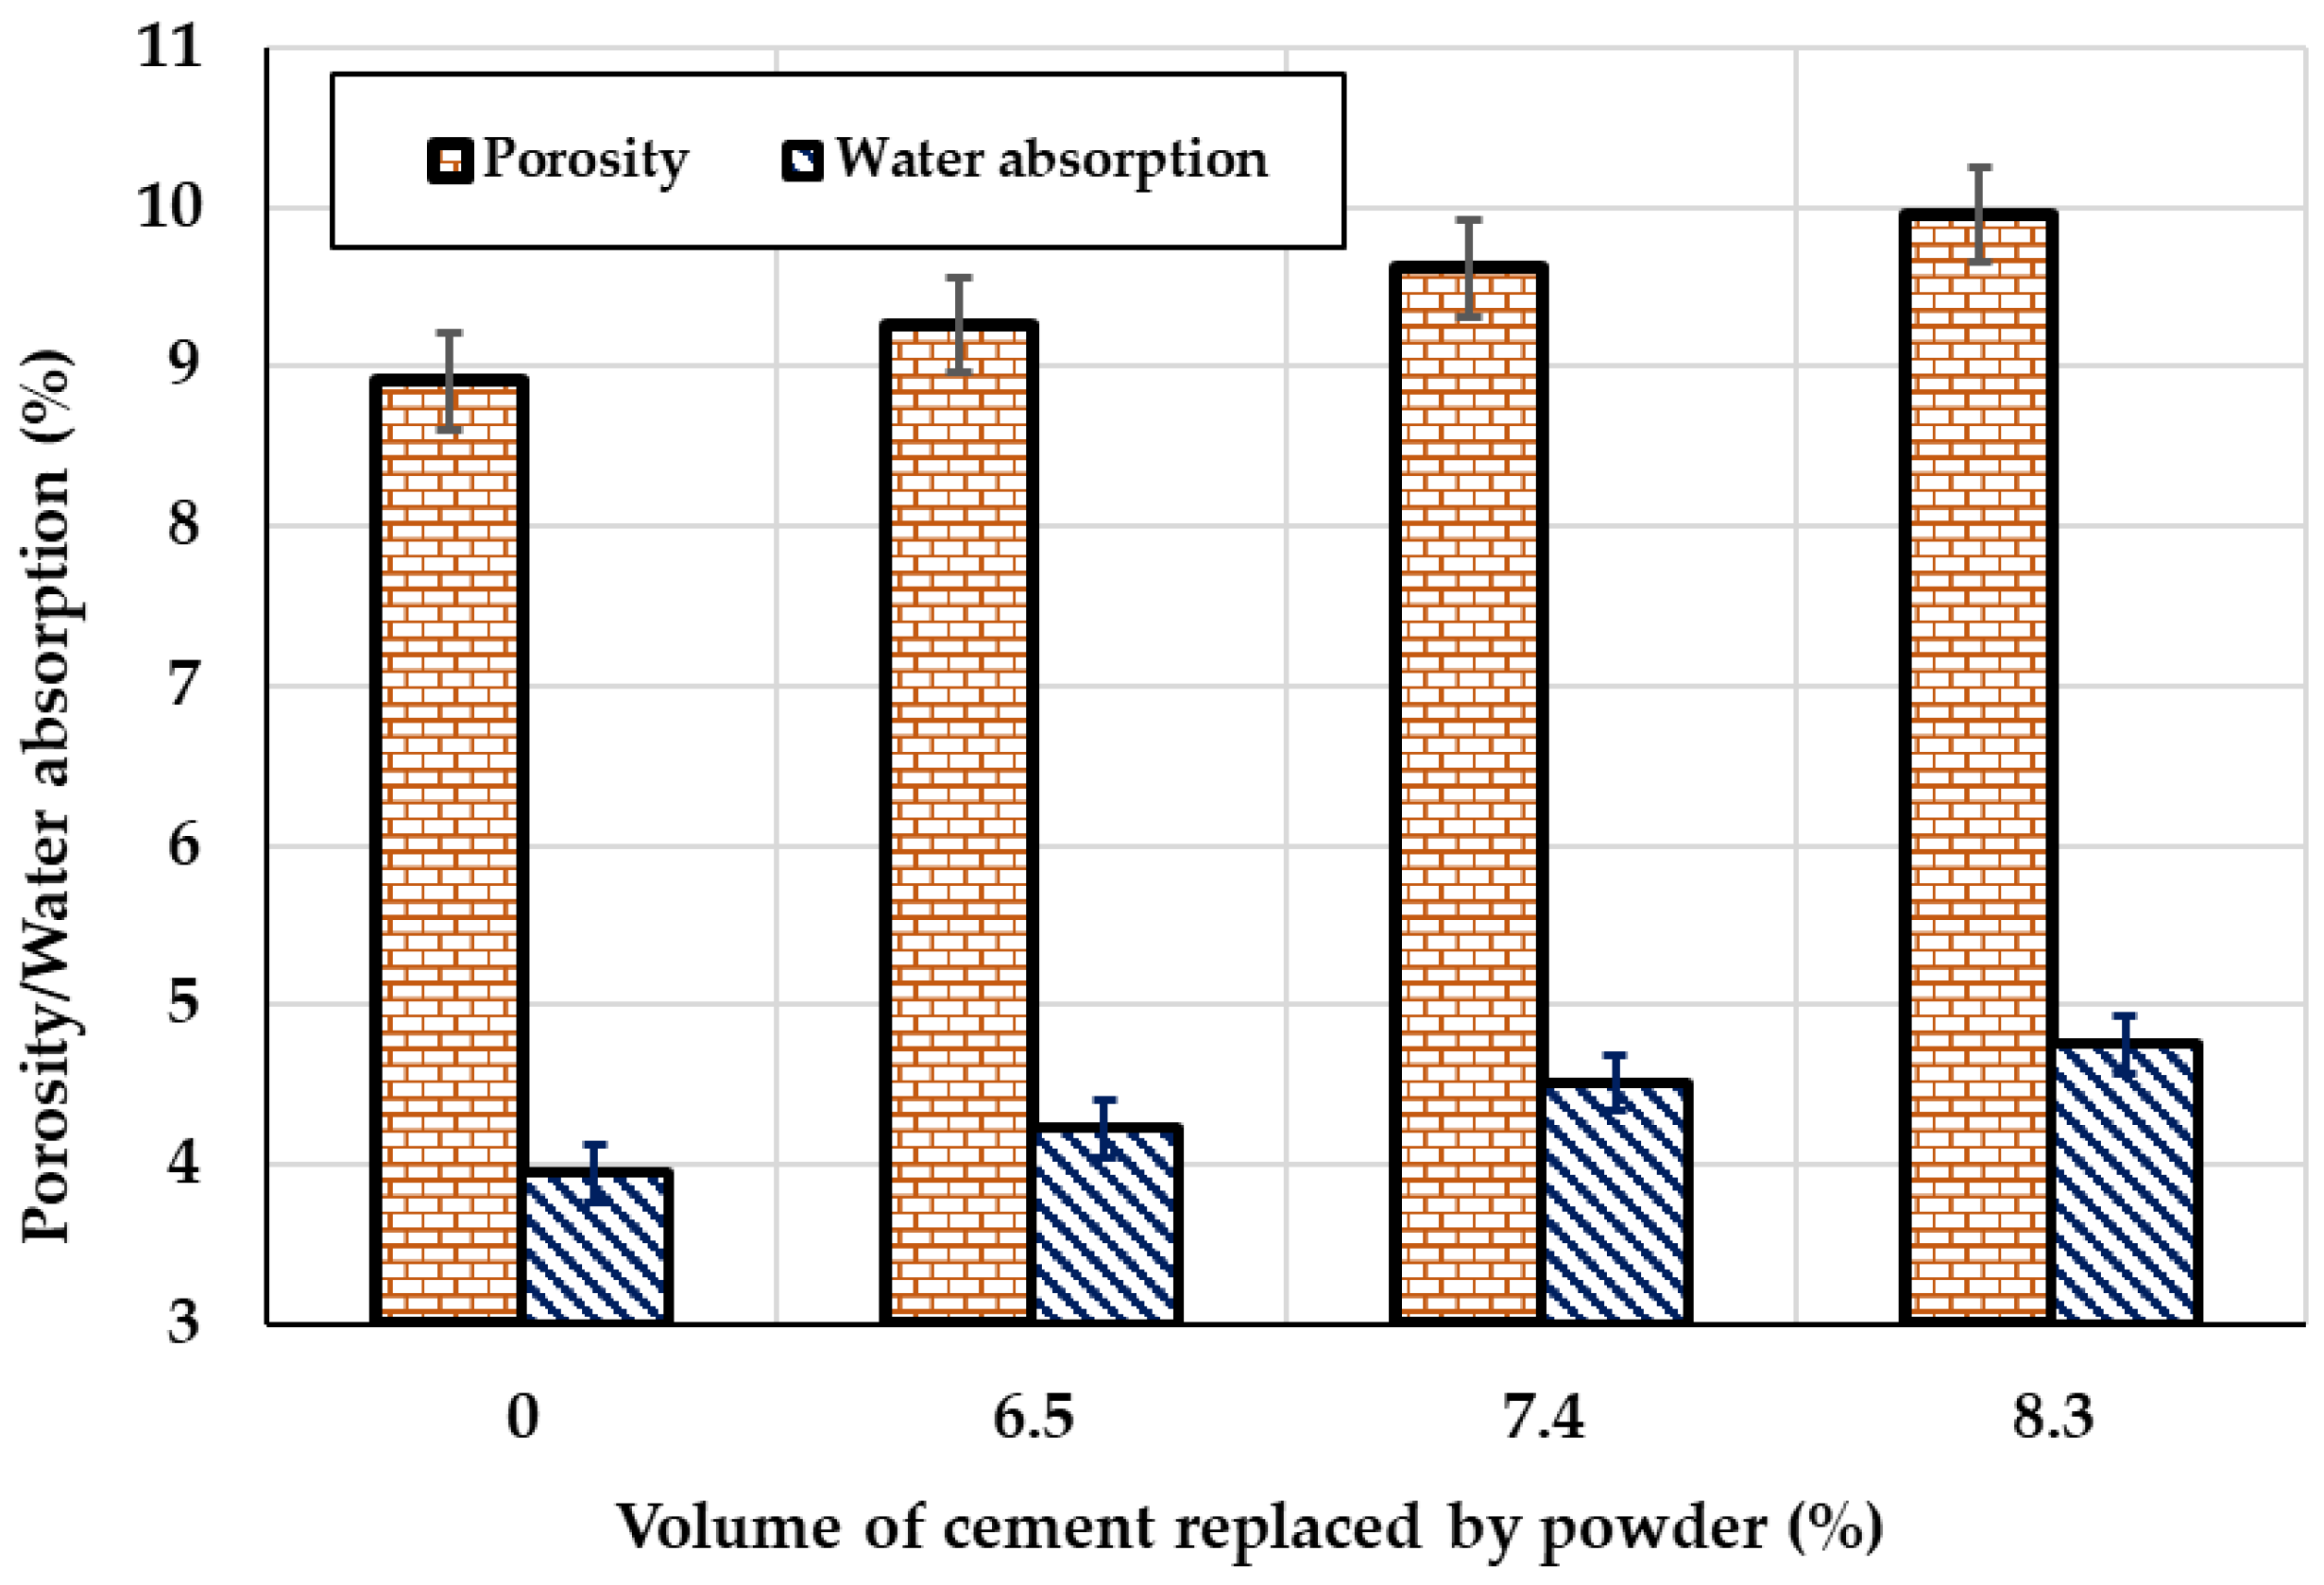
2.2.3. Density and Porosity Accessible to Water

The water absorption and porosity of the concrete samples were tested using a vacuum water-saturation machine in accordance with the French standard [19]. The measurements were performed on (Φ150 × 50 mm) discs cut from (Φ150 × 300 mm) cylindrical specimens using a saw. The samples were placed under a vacuum for 4 h at a pressure of 25 mbar, after which they were immersed in water at this pressure for 24 h. After 24 h, the resulting mass was measured via hydrostatic weighing, and the dry mass was determined by drying the samples at a temperature of 105 ± 5 °C for a duration sufficient to achieve a constant mass (with a difference of no more than 0.05% between two successive weight measurements performed 24 h apart).

2.2.4. Gas Permeability

The air permeability was measured using an IFSTTAR CEMBUREAU permeability meter, produced by France, following XP 18-463 [20] and Darcy’s law. Darcy’s law assumes laminar flow, which is smooth and non-turbulent and is applicable to the movement of incompressible, Newtonian fluids (fluids with a consistent viscosity). This principle is commonly used in fields like hydrogeology, petroleum engineering, and chemical engineering to analyze how fluids move through porous materials such as soils and rocks. The apparent permeability (KAPP) was calculated using the steady-state Darcy equation:
K A p p   m 2 = 2 μ Q L P a t m A   ( P e 2 P a t m 2 )
where µ is the dynamic viscosity of nitrogen (1.76 × 10⁵ Pas), Q is the flow rate of the fluid (volume per unit time, (m3/s)), L is the thickness of the sample (m), Patm is the atmospheric pressure (1.01 × 10⁵ Pa), A is the cross-sectional area of the test piece (m2), and Pe is the applied pressure (Pa). The apparent permeability varied linearly as a function of the inverse of the mean pressure using Equation (3). Equation (5) was also used for the determination of the intrinsic permeability of the material.
P m = P e + P a t m 2
K A p p = K i n t   1 + β P m  

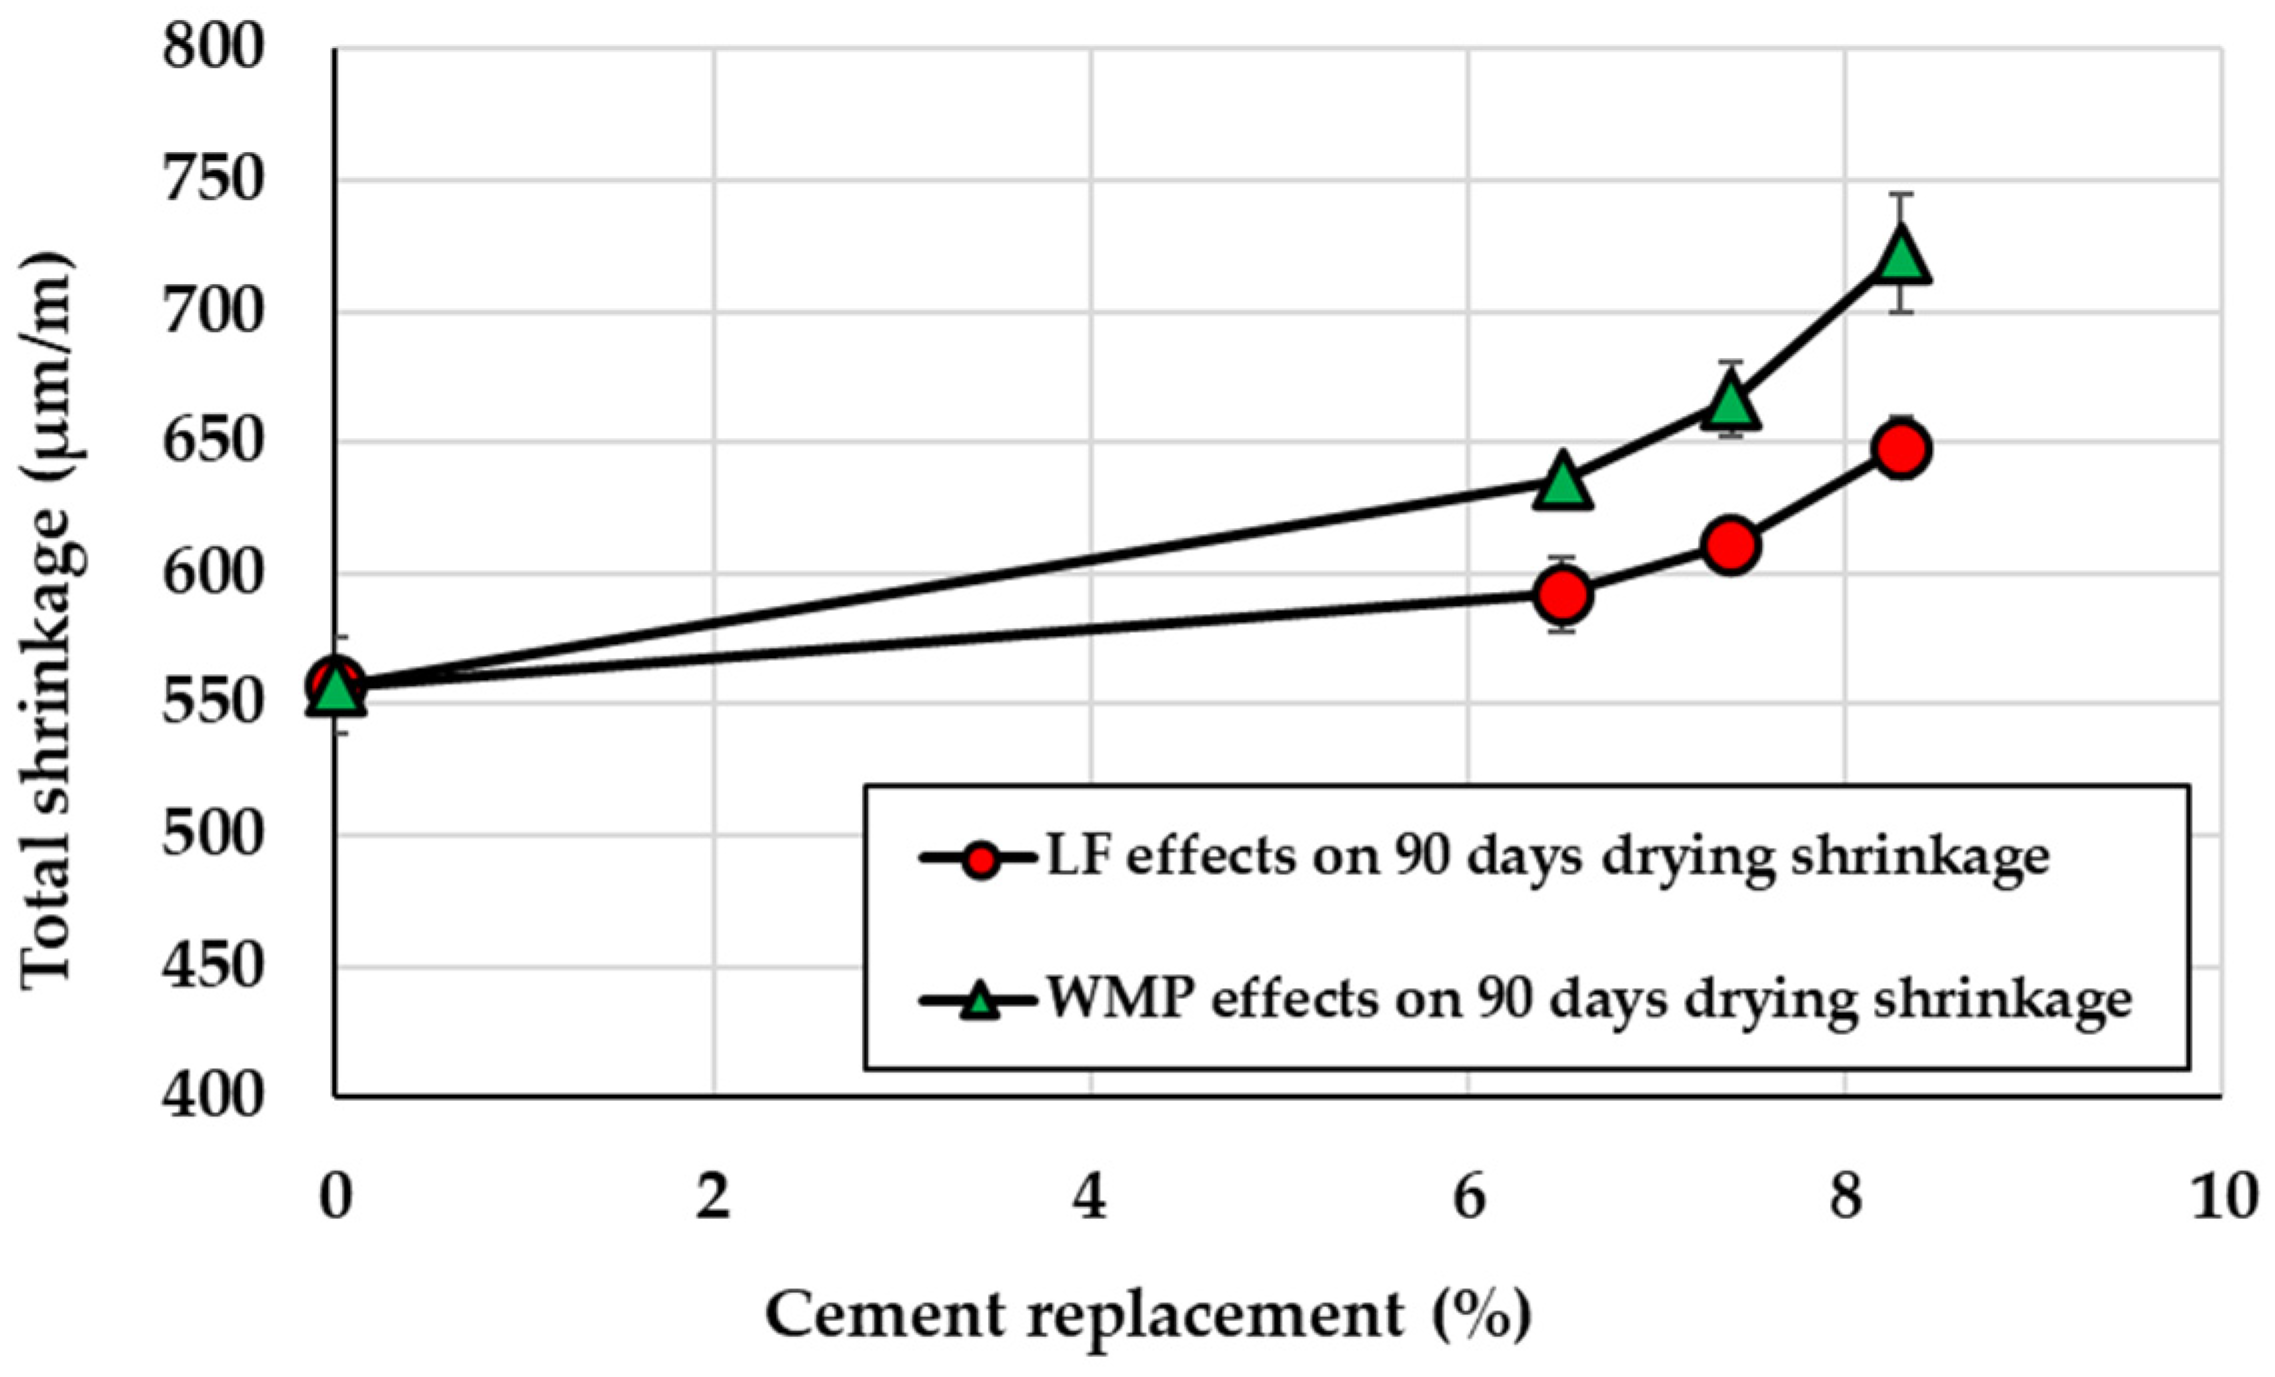
2.2.5. Drying Shrinkage

The total shrinkage (or swelling) of the concrete was measured on (100 × 100 × 500) mm prismatic specimens under controlled conditions of 20 °C and 50% humidity according to the ASTM C426-16 [21] standard. The specimens were made using metal molds that allowed for the attachment of deformation pads on both sides of the specimen. Demolding was carried out 24 h after casting, and shrinkage measurements were taken up to 90 days. Three samples were tested for each formulation to ensure the reliability of the results. The measurement of concrete shrinkage was performed using a metal support for placing the specimen, a digital comparator with 0.001 mm precision, and a metal calibration rod.

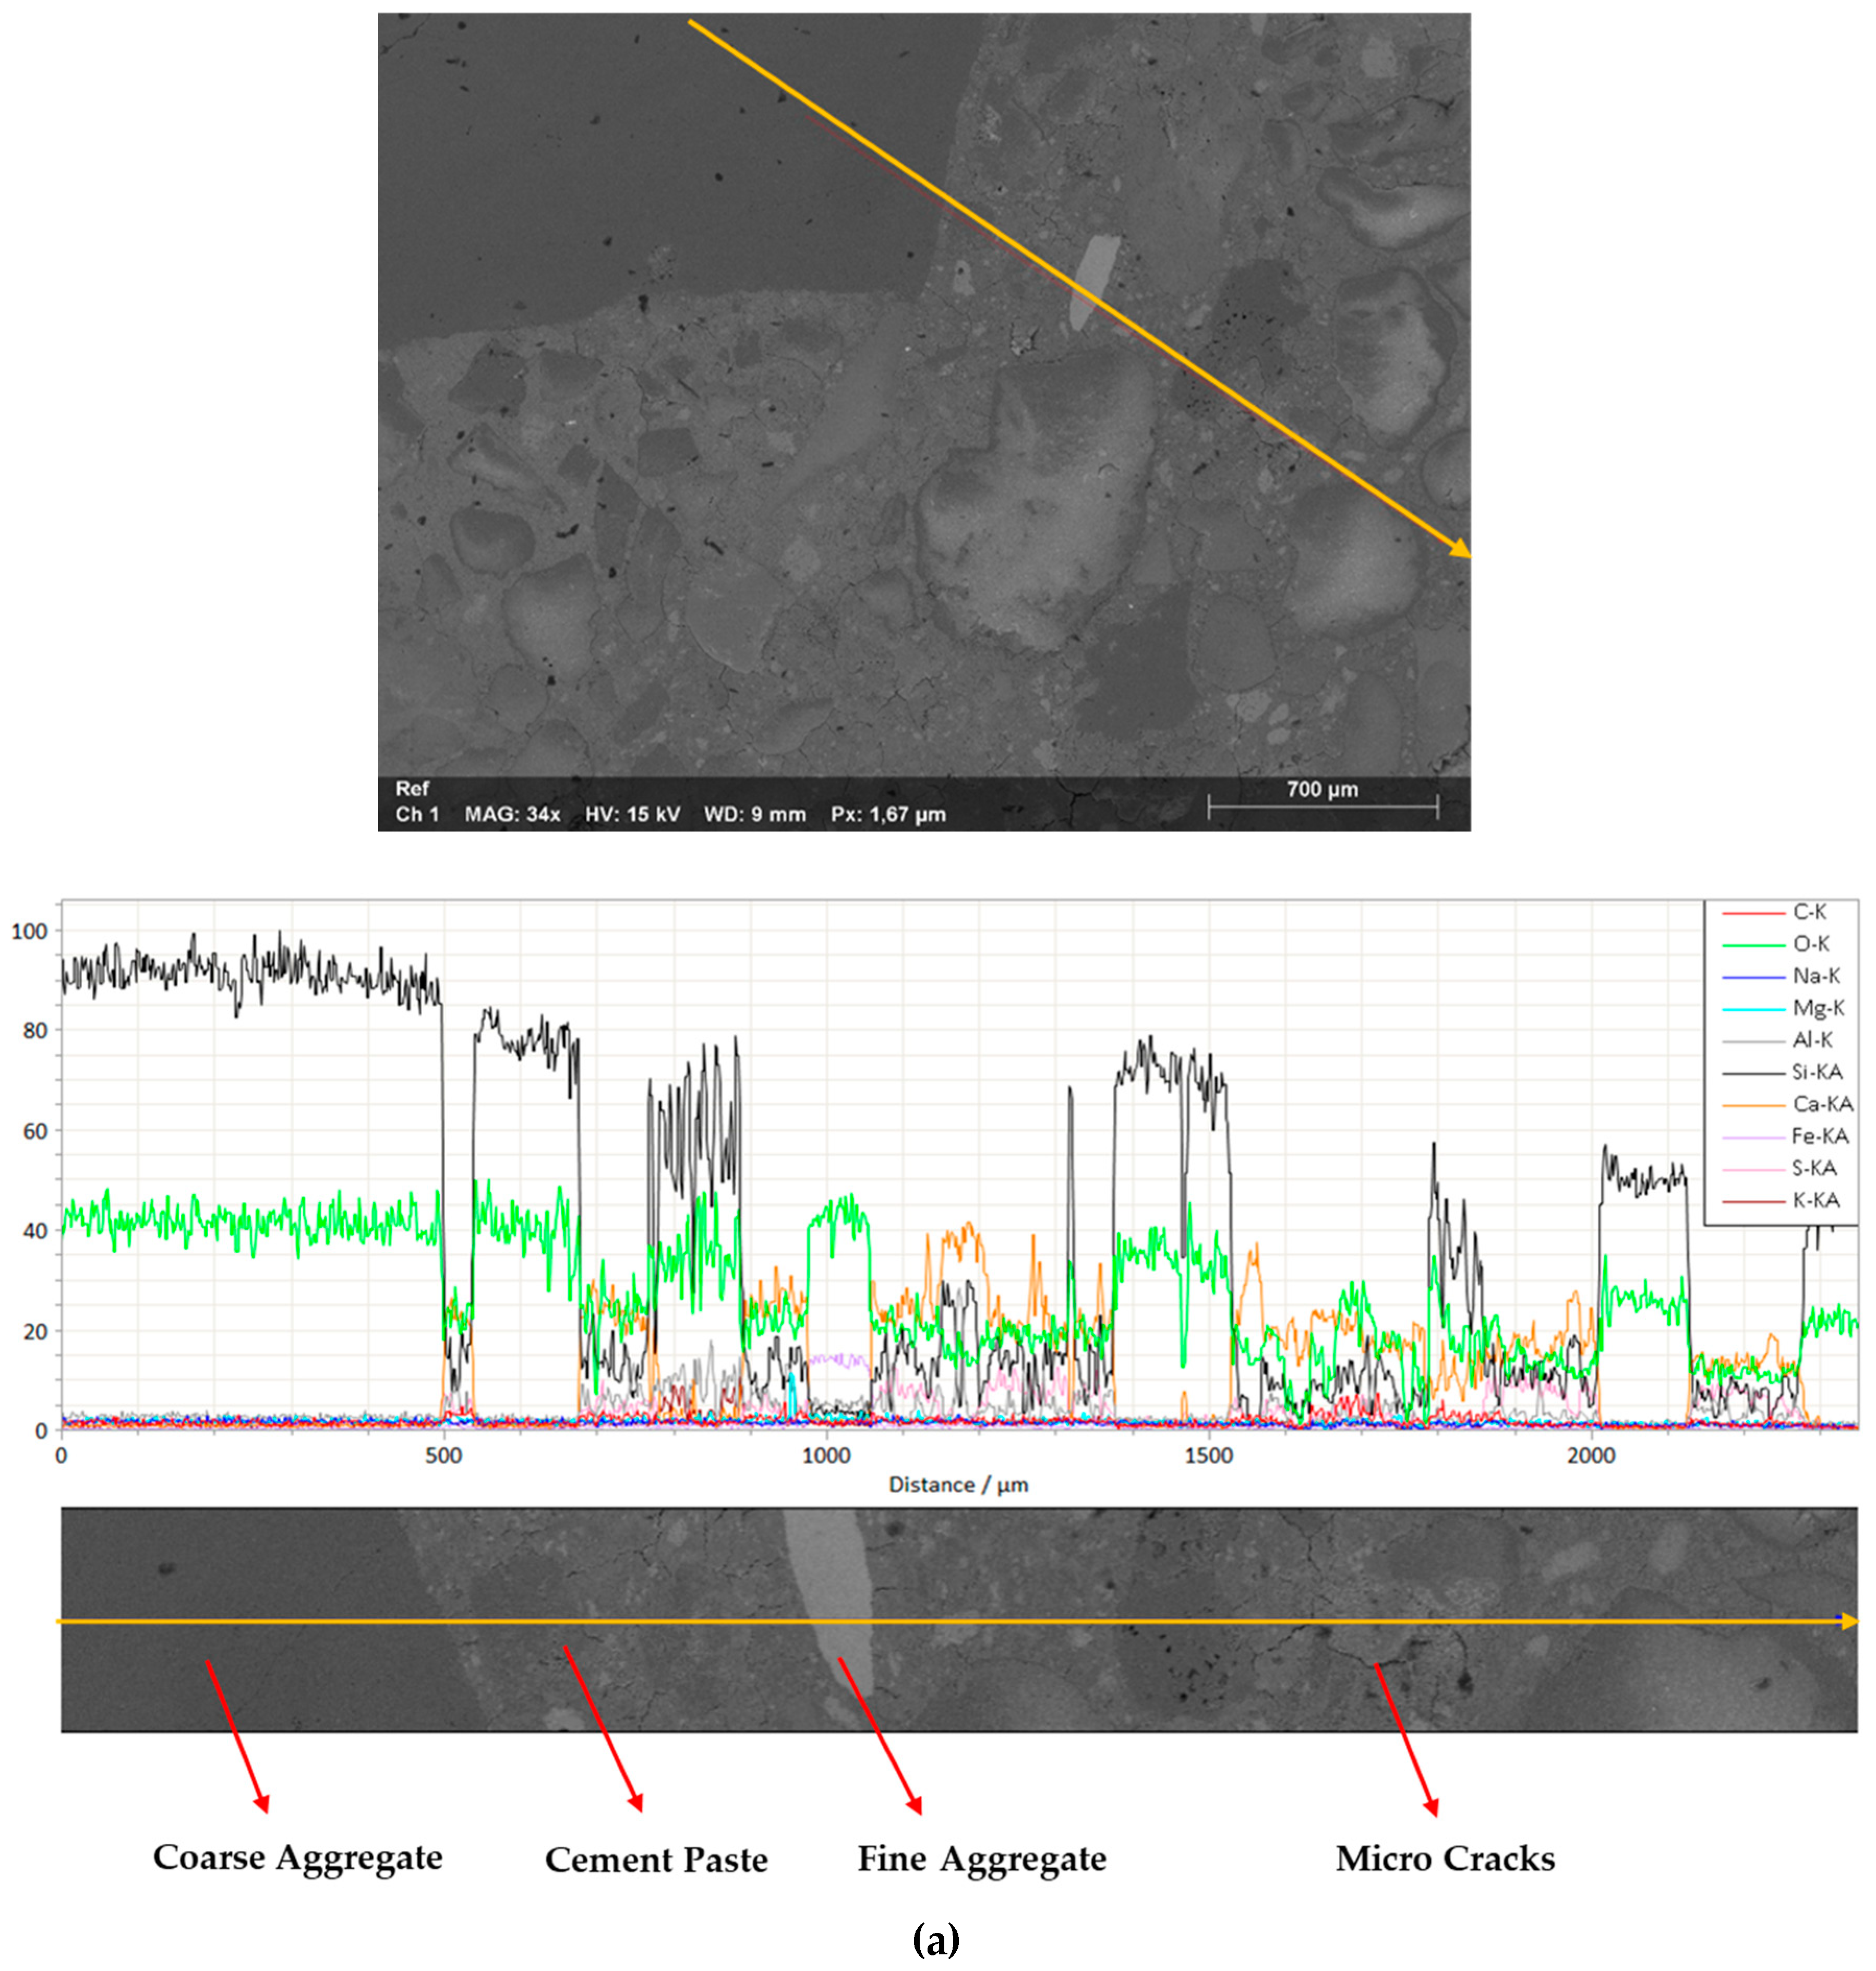
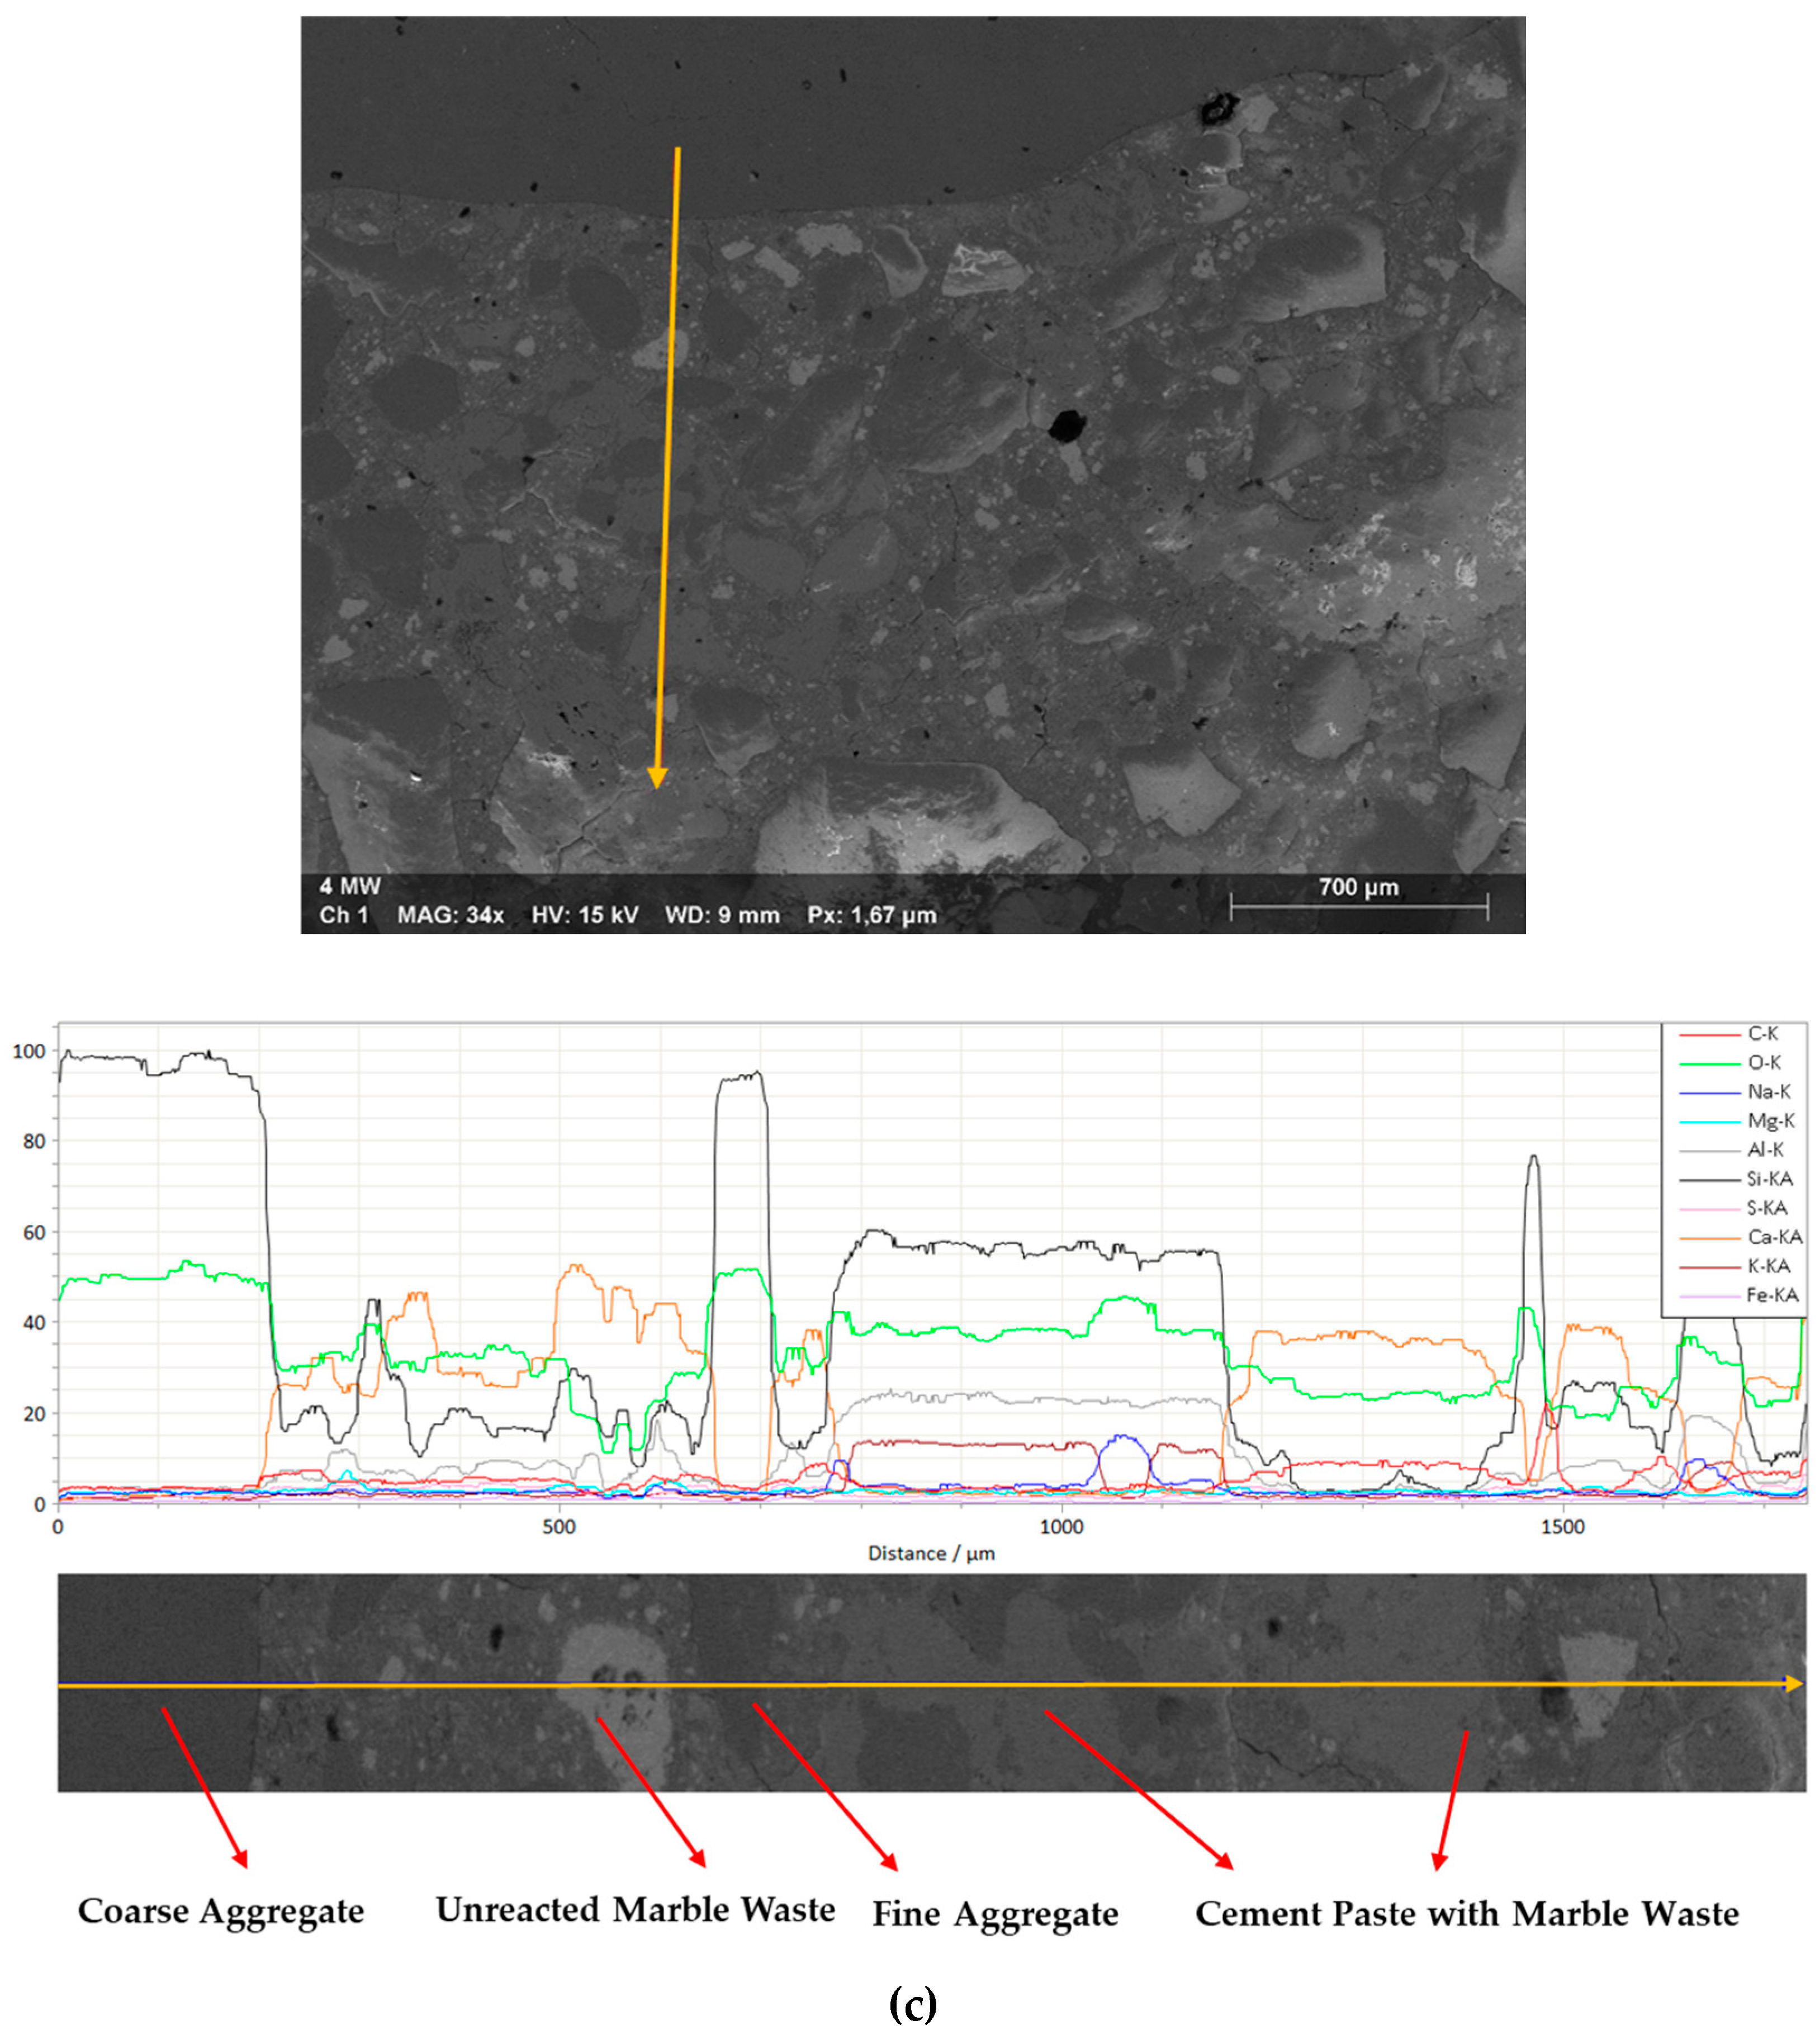
2.2.6. Microstructural Analysis and State of the Paste–Aggregate Interface

Microstructural analyses were conducted using a microscopy and analysis platform using a ZEISS Gemini SEM 300 SEM coupled with EDX, produced by Carl Zeiss AG, Germany. To ensure the samples had flat surfaces, they were resin-impregnated, demolded after 24 h, and polished using a MeteServ 250 polisher, produced by Struers, Denmark. Nickel (Ni) metallization was applied to all the samples to prevent electron overload on the surfaces.
Additionally, an SMZ800 Nikon optical microscope, produced by Nikon Corporation, Tokyo, Japan, was used to investigate the concrete’s surface topography. This device provided valuable information about the concrete’s texture, such as its porosity, and allowed for the measurement of pore diameter and quantity. The microscope was connected to an LCD for operating and saving high-resolution images. Furthermore, the system was capable of zooming from 1× to 6.3×.

2.2.7. Compressive and Splitting Tensile Strengths

Compressive strength testing of the various concrete samples was conducted using 11 × 22 cm cylindrical specimens and a hydraulic press with a capacity of 3500 kN (SCHENCK), manufactured by SCHENCK Process, Darmstadt, Germany, at a loading speed of 0.5 MPa/s in accordance with the NF EN 12390-3 [15] standard. To ensure the reliability of the tests, the specimens were first surfaced with surfacing mortar certified to ISO-9001. This mortar was heated to 180 °C for liquefaction in an oil bath (MAGMAX-3R brand) produced by Labtech International, Bangkok, Thailand. Hot sulfur type B was poured onto the surface of the square, and the sample was placed vertically.
In addition to the strain data provided by the SCHENCK compressive strength machine, strain gauges (30 mm in both horizontal and vertical directions) were attached to the concrete samples. Moreover, Digital Image Correlation (DIC) technology was used to analyze the strain results in the concrete sample using GOM 2020 correlation software.
The tensile strength by splitting was also determined according to the NF EN 12390-6 [22] standard using 11 × 22 cm cylindrical specimens with a loading speed of 0.05 MPa/s. The test involved compressing the cylindrical sample between two press platens placed horizontally in a metal frame to stabilize the specimens during loading. The tensile strength (fctm, sp) was calculated based on the maximum load at the failure of the cylinder (Equation (6)):
f c t m , s p = 2 F π D L
where D and L represent the diameter and length of the specimen, respectively.

2.2.8. Ultrasonic Pulse Velocity (UPV) of Concrete

This test was performed according to the procedure for ultrasonic testing outlined in ASTM C597-09 [23]. The PUNDI7-CNSFARNELL equipment, distributed by Farnell, Leeds, UK, was used. It included a pulse generation circuit consisting of an electronic circuit for generating pulses and a transducer that converted the electronic pulse into a mechanical pulse with an oscillation frequency ranging from 40 kHz to 50 kHz. Additionally, a pulse reception circuit that effectively received the signal was utilized. Equation (7) was used to calculate the UPV of the concrete samples:
V = h t
where (V) is the velocity pulse (km/s), (h) is the depth of the sample (mm, m, km), and (t) is the time (s).

3. Results and Discussion

3.1. Effects of Waste Marble and Limestone Filler Addition on the Physical Properties of Concrete

3.1.1. Workability

The incorporation of waste marble (as both cement and sand replacement) and limestone filler as partial replacements for cement in the concrete appeared to have a beneficial effect on its workability. As the replacement ratio increased, the slump increased (Figure 2), while the water-to-binder ratio remained constant across all mixtures.
Fundamentally, two factors contributed to the increase in workability. First, as the amount of waste marble powder (WMP) increased with the increased cement replacement ratio, the water-to-cement (W/C) ratio also increased. Since the water demand for the WMP replacing the cement was lower than the water demand for the cement, the overall water requirement to lubricate the particles decreased, and the extra water made the concrete mix more flowable. Second, the surface of the marble sand, which replaced the natural sand (as shown in Figure 3), was flatter than that of natural sand. This helped to reduce friction forces and allowed the particles to flow more freely.
Similar results have been reported by A. K. Sharma et al. [24], where waste marble dust was used as a partial replacement for both cement and fine aggregate in concrete, with replacement levels of 0%, 5%, 10%, and 15% for both. In both cases, the slump increased with the addition of marble dust, though the increase in slump was more significant when the sand was replaced with marble waste compared to when the cement was replaced. Similarly, the results of experimental work on concrete with partial replacement of cement by waste marble powder [9] explained that the fineness of the powder plays a crucial role in workability. The researchers noted that the WMP particles had an average fineness of 1.5 m2/g, while the cement had an average fineness of 0.225 m2/g. Since WMP particles have a higher specific surface area, they consume more water. Consequently, the water demand for the cement was lower for lubrication, which resulted in a decrease in its workability.
To test the above hypothesis, the mini-cone test was introduced for identifying correlations with the concrete flow slump. This simple flow spread test, based on the work of Okamura, H. and Ouchi, M [25], was performed on powders. Although this test was originally designed to investigate suitable binders for conventional concrete, it can be utilized for assessing binders for other types of concrete. The evolution of the ratio is plotted against the relative flow area of the binder varying linearly, as shown in Figure 4 and Figure 5. The values of the parameters with correlations with the concrete slump is summarized in Table 3.
The amount of water required to cause the paste to flow was significantly higher for the cement paste than for the WMP paste. Moreover, it appeared that the amount of water needed to achieve a given relative spread was more significant for the cement than for the WMP due to the chemical reaction and hydration process of the cement. The experimental results obtained were in good agreement with those reported in the literature [26].

3.1.2. Dry Density

Three tests were conducted, and the average results are presented in Figure 6. The results for the dry density of the concrete samples indicate that the reference concrete sample had the highest dry density compared to those containing waste marble as a replacement for cement and sand. It is evident that the dry density decreased gradually as the amount of waste marble increased and the cement content decreased. For instance, the average dry density for the reference concrete with no waste marble replacement was 2215.4 kg/m3, while the average dry density for samples containing 3.5%, 4%, and 4.5% waste marble were 2138.6 kg/m3, 2083.8 kg/m3, and 2070.5 kg/m3, respectively. These results align with the research conducted by N. Bheel et al. [27].
The reduction in the dry density of the concrete samples containing waste marble compared to the reference concrete was not significant. The highest reduction in the hardened density was observed for the concrete with 4.5% valorized waste marble by volume of overall concrete mix, which consisted of 8.3% cement replacement and 13.2% sand replacement by volume. The recorded density reduction was 6.5%, which is not substantial when compared to the reference samples. Although the reduction in hardened density was modest, as noted by R. Rodrigues et al. [28], this decrease was attributed to the lower specific gravity of waste marble powder compared to cement.
Evaluating the results from this research, two factors contribute to the reduction in the dry density of the concrete samples containing waste marble. First, the density of GHORI cement is 7% higher than that of waste marble powder; thus, as the amount of cement decreases, the dry density of the concrete specimens also decreases. Second, as the amount of waste marble increases, the air content also rises, leading to a further reduction in the dry density of the concrete specimens. As a result of the reduction in hardened density, lightweight concrete is produced, which positively influences transfer properties and reduces the overall weight of the concrete structures.

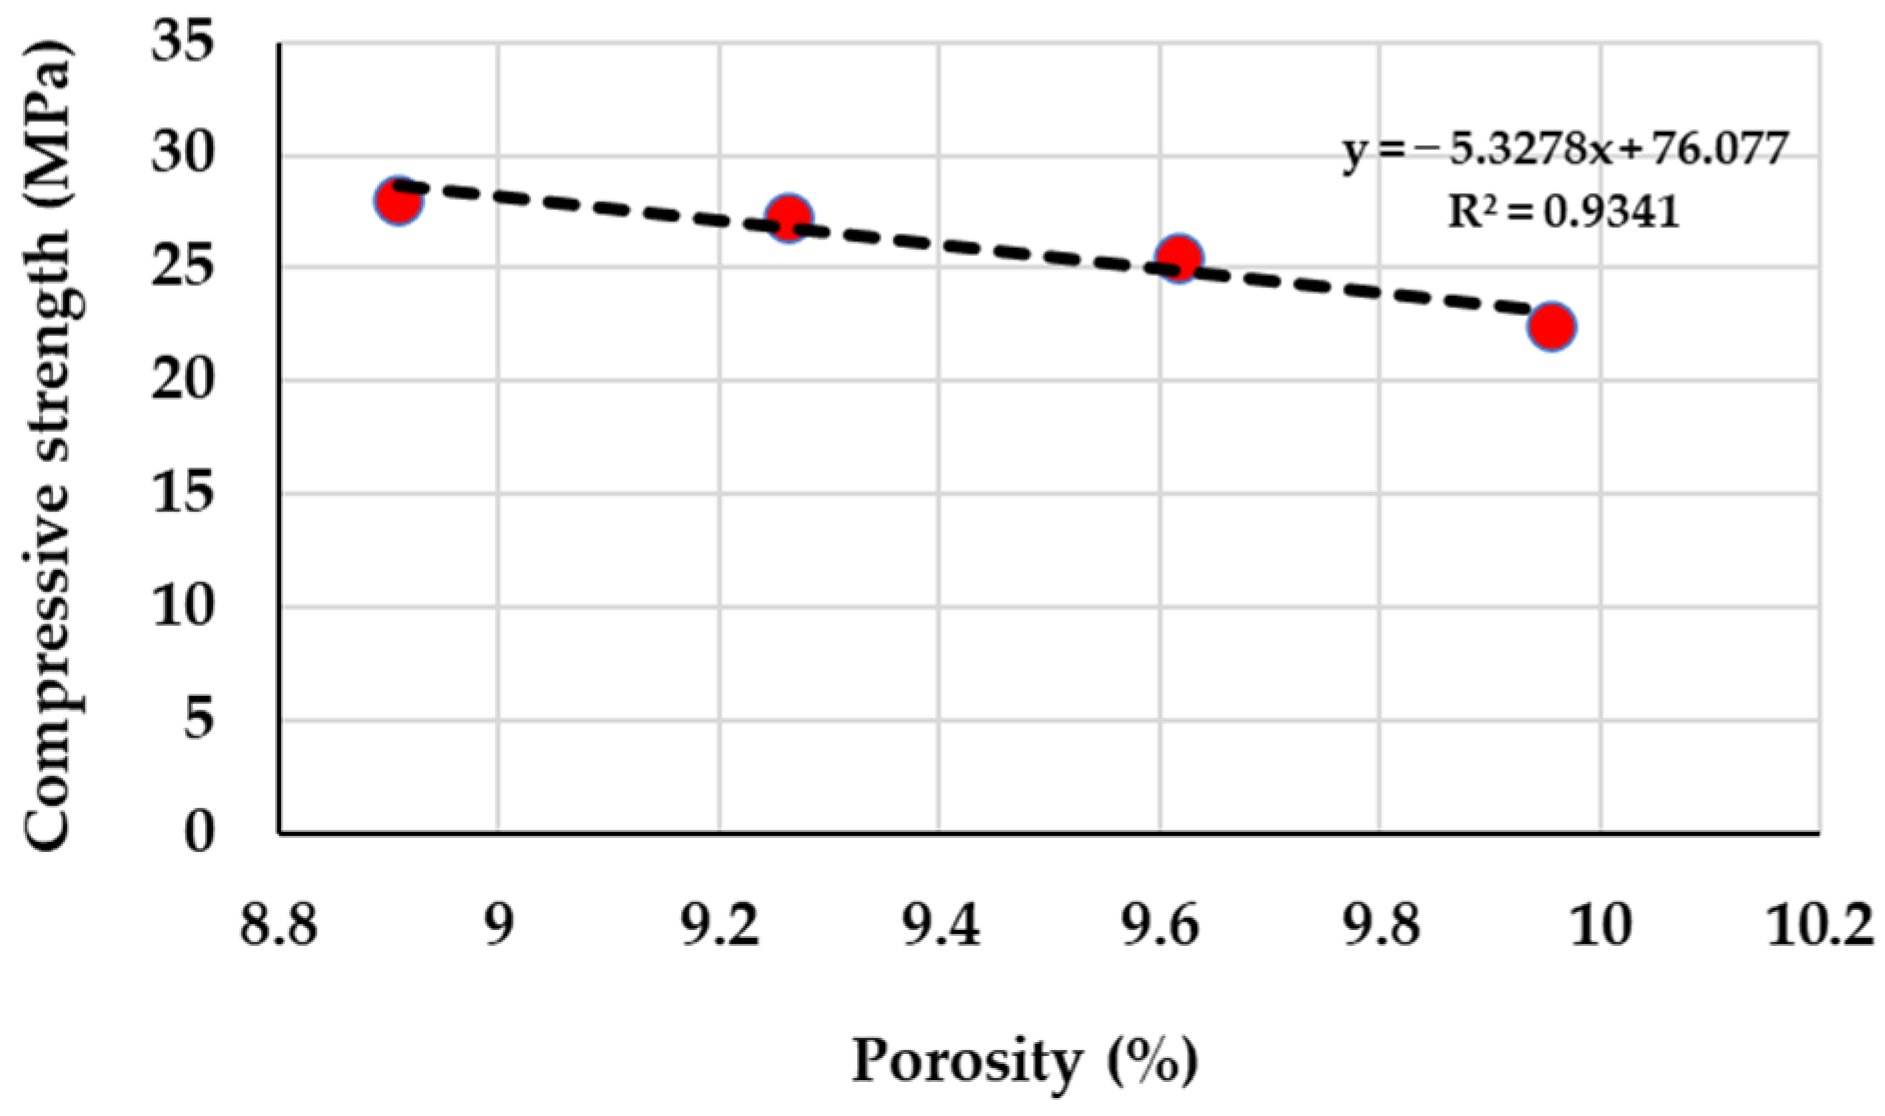
3.1.3. Water Absorption and Porosity

The results for the water absorption coefficient and porosity at 24 h are shown in Figure 7. An increase in the cement replacement ratio with WMP leads to a slight rise in both the water absorption coefficient and porosity. The porosity values for the concrete specimens containing 0%, 6.5%, 7.4%, and 8.3% WMP were 8.9%, 9.3%, 9.6%, and 9.9%, respectively. Based on these results, the change in porosity was minimal. For instance, when 4.5% marble waste was incorporated by volume, replacing 8.3% cement and 13.2% sand, there was an 11.8% increase in porosity compared to the reference specimen.
Similarly, the water absorption coefficient increased with the higher incorporation of WMP. The greatest increase in the water absorption coefficient was observed in the concrete specimen with 8.3% cement replacement using WMP, showing a 17.0% increase compared to the reference concrete. It is important to note that the water-to-binder (W/B) ratio was constant for all mixtures, while the water dosage in the water-to-cement (W/C) ratio increased as the replacement ratio increased. This is because water absorption is generally related to the structure and size of the pores, particularly in the aggregate interface zone [29]. The increase in porosity was attributed to the lower density of WMP compared to cement. On the other hand, the water demand of cement was higher than that of WMP, while the W/B ratio remained constant for all the mixes. Therefore, the excess water from the marble waste, which replaced the cement, resulted in increased porosity. Additionally, the water absorption of the marble waste that replaced the sand in the concrete is higher than that of natural sand, which could have also contributed to the improved water absorption of the concrete samples.
To further analyze the porosity results and the concrete pore structure and availability of cracks, Scanning Electron Microscopy (SEM) was applied to the concrete samples. The digital images in Figure 8 confirm the concrete porosity results obtained using the vacuum method. The images show that as the WMP incorporation ratio increased and the cement dosage decreased, the concrete structure developed a weaker network. Since cement plays a crucial role as a binder and a pozzolanic material, replacing it with a significant amount of non-pozzolanic materials, such as waste marble powder, results in a weaker network. Therefore, comparing the morphology of the reference concrete sample (Figure 8b) with that of the 4.5% WM concrete sample (Figure 8h), we can observe that the 4.5% WM sample has a weaker network with more pores compared to the reference concrete.
Furthermore, the micro-filler effect is another influential factor that positively impacts the concrete’s porosity and water absorption coefficient properties. N. Djebri et al. [30] investigated the effects of using waste marble dust (WMD) as fine sand on the mechanical properties of concrete by replacing fine sand (passing through a 0.25 mm sieve) with WMD at proportions of 0%, 25%, 50%, and 100% by weight. The results showed that 100% replacement of sand with WMD, due to its filler effect, had a very positive impact on all of the concrete’s properties, with the highest reduction in porosity observed at the 100% replacement dosage. It appears that waste marble as a sand replacement is more effective than as a cement replacement. The results of previous studies regarding the water absorption coefficient show that the water absorption coefficient increases with the utilization of waste marble. For example, the valorization of 10% waste marble as a cement replacement led to increased water absorption compared to reference concrete. Likewise, similar observations were reported by [31,32].

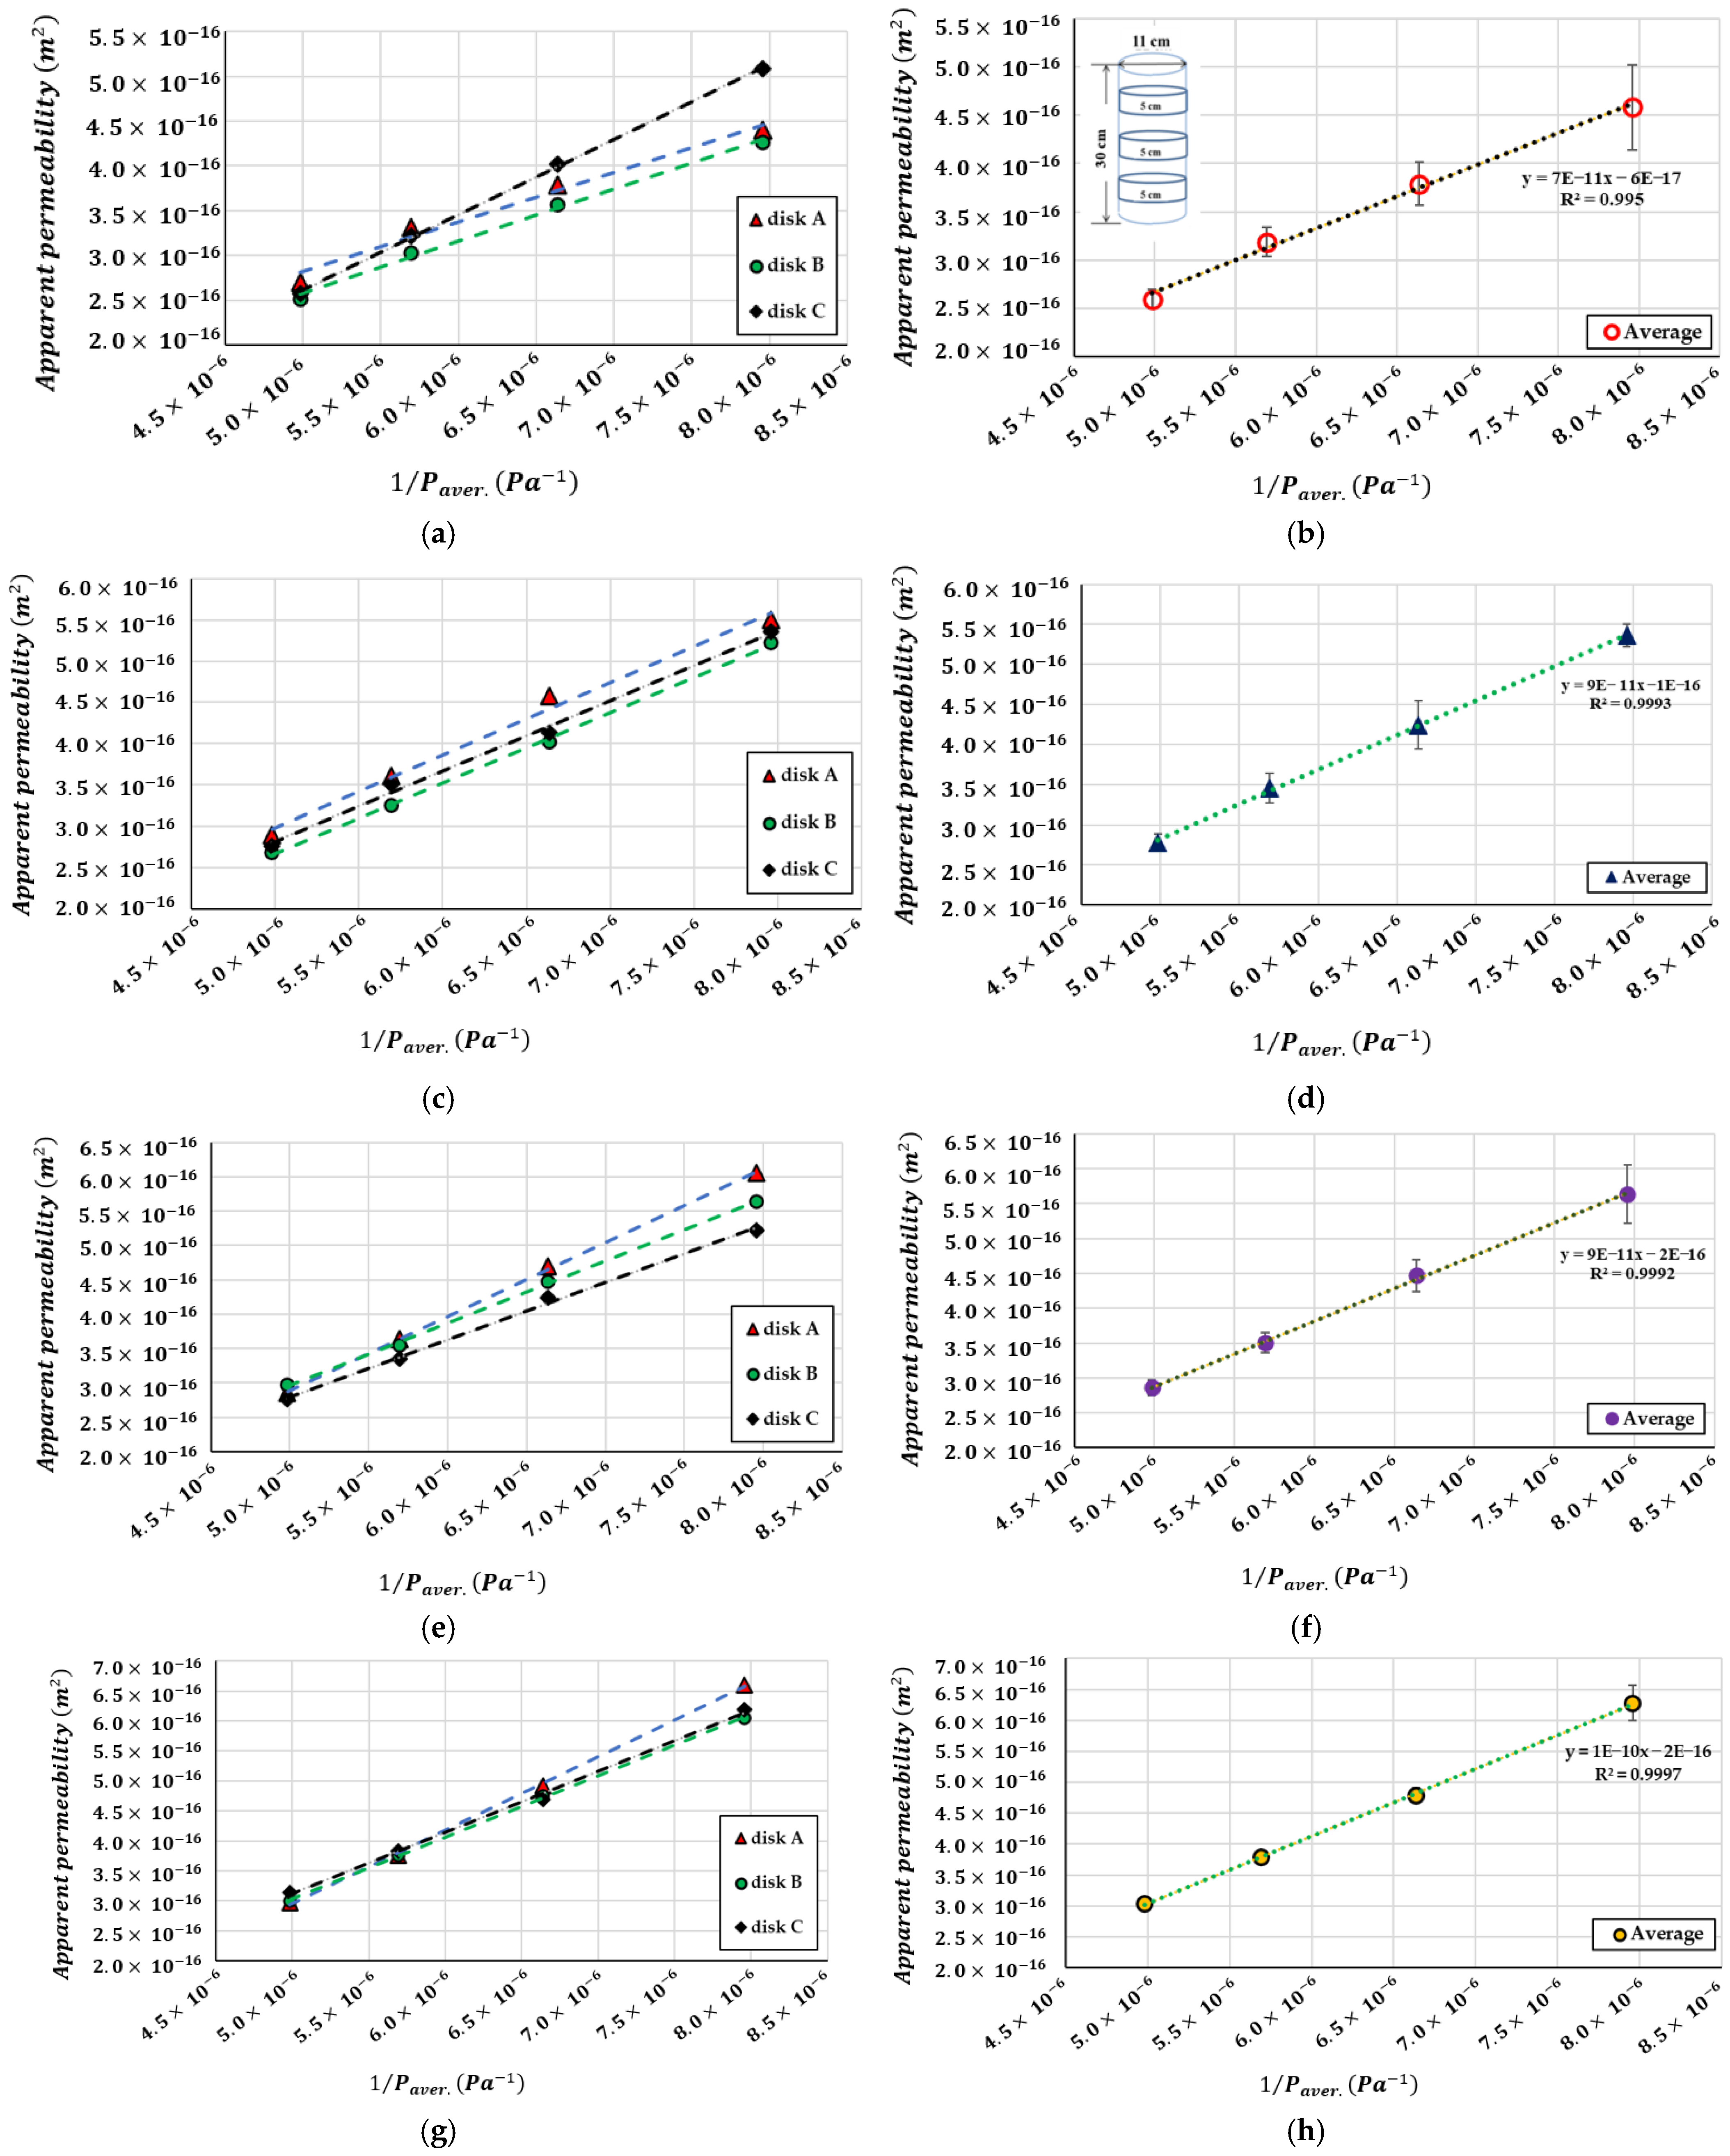
3.1.4. Gas Permeability

Gas (nitrogen) permeability measurements were carried out on three discs of Φ150 × 50 mm. The discs were obtained by sawing cylindrical specimens (Φ150 × 300 mm) after curing for 28 days in water maintained at 20 °C. The discs were then dried in a ventilated oven maintained at T = 80 °C. After 21 days, the discs were placed in a desiccator for 48 h before conducting the permeability measurements. The measurements were performed using four different inlet pressures: Pe = 1.5 bar, 2 bar, 2.5 bar, and 3 bar.
Interconnected capillary macropores are mainly responsible for the permeability of concrete. In contrast, the micropores and mesopores present in the CSH gel contribute less to permeability due to their smaller size. Isolated open pores are not very significant in terms of water transfer. However, when combined with cracks, they can affect the resistance of concrete to environmental attacks (gas diffusion, freeze/thaw, etc.). The connectivity of the pores and the tortuosity of the pore network are the primary factors that govern the permeability of cement matrices.
The apparent permeability decreases as the average pressure of the gas in the sample increases. It varies linearly as a function of the inverse of the mean pressure, as illustrated schematically in Figure 9. The point of intersection between this line and the y-axis allows for the determination of the intrinsic permeability of the material.
Figure 10 shows the apparent permeability results obtained for each disc of the concrete C25/30 series. It can be noted that the permeability is slightly higher for the discs taken from the top part of the cylinder. The higher surface permeabilities are attributed to slight bleeding, without the presence of surface cracks. The formation of a water film on the surface of the fresh concrete promotes the development of a hardened concrete skin at high W/C ratios due to the water brought in via surface penetration during testing. Similar observations have been reported in the literature. Permeability depends on the applied pressure, the degree of saturation of the material, and the porosity [33,34].
The mean values of apparent permeability were calculated based on the results obtained for the three discs (Figure 10a), which are reported in Figure 10b. It can be observed that:
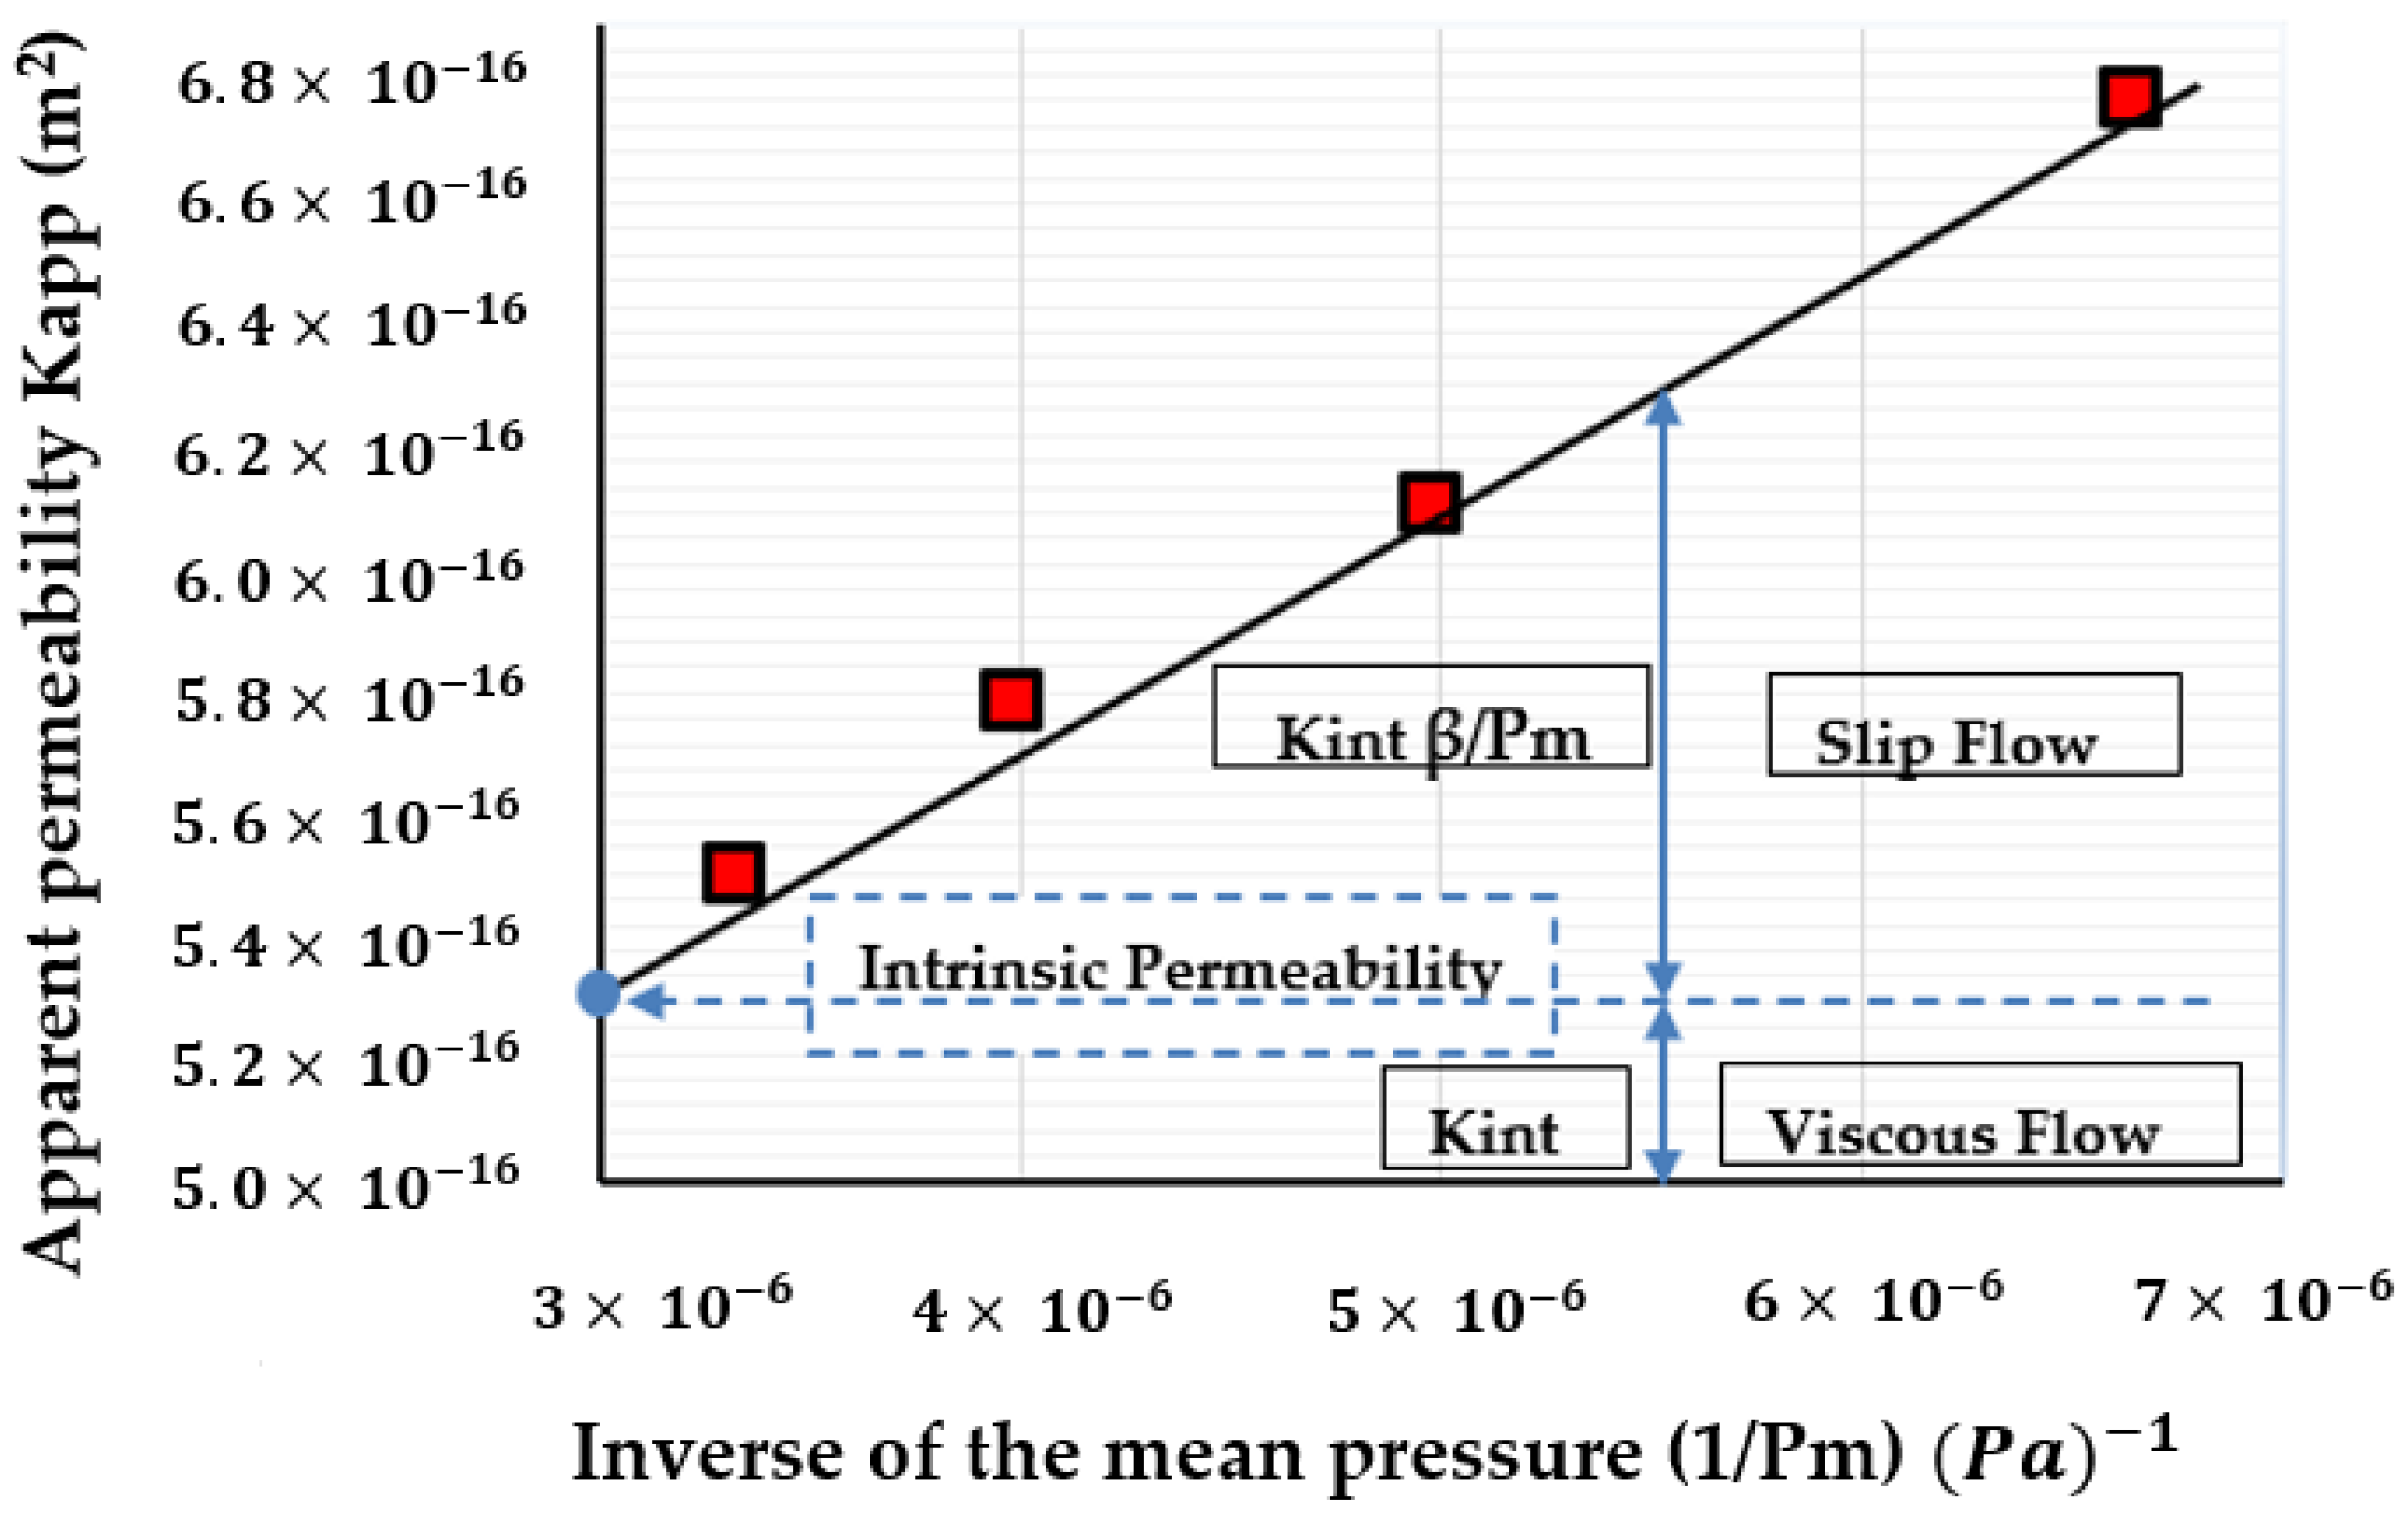
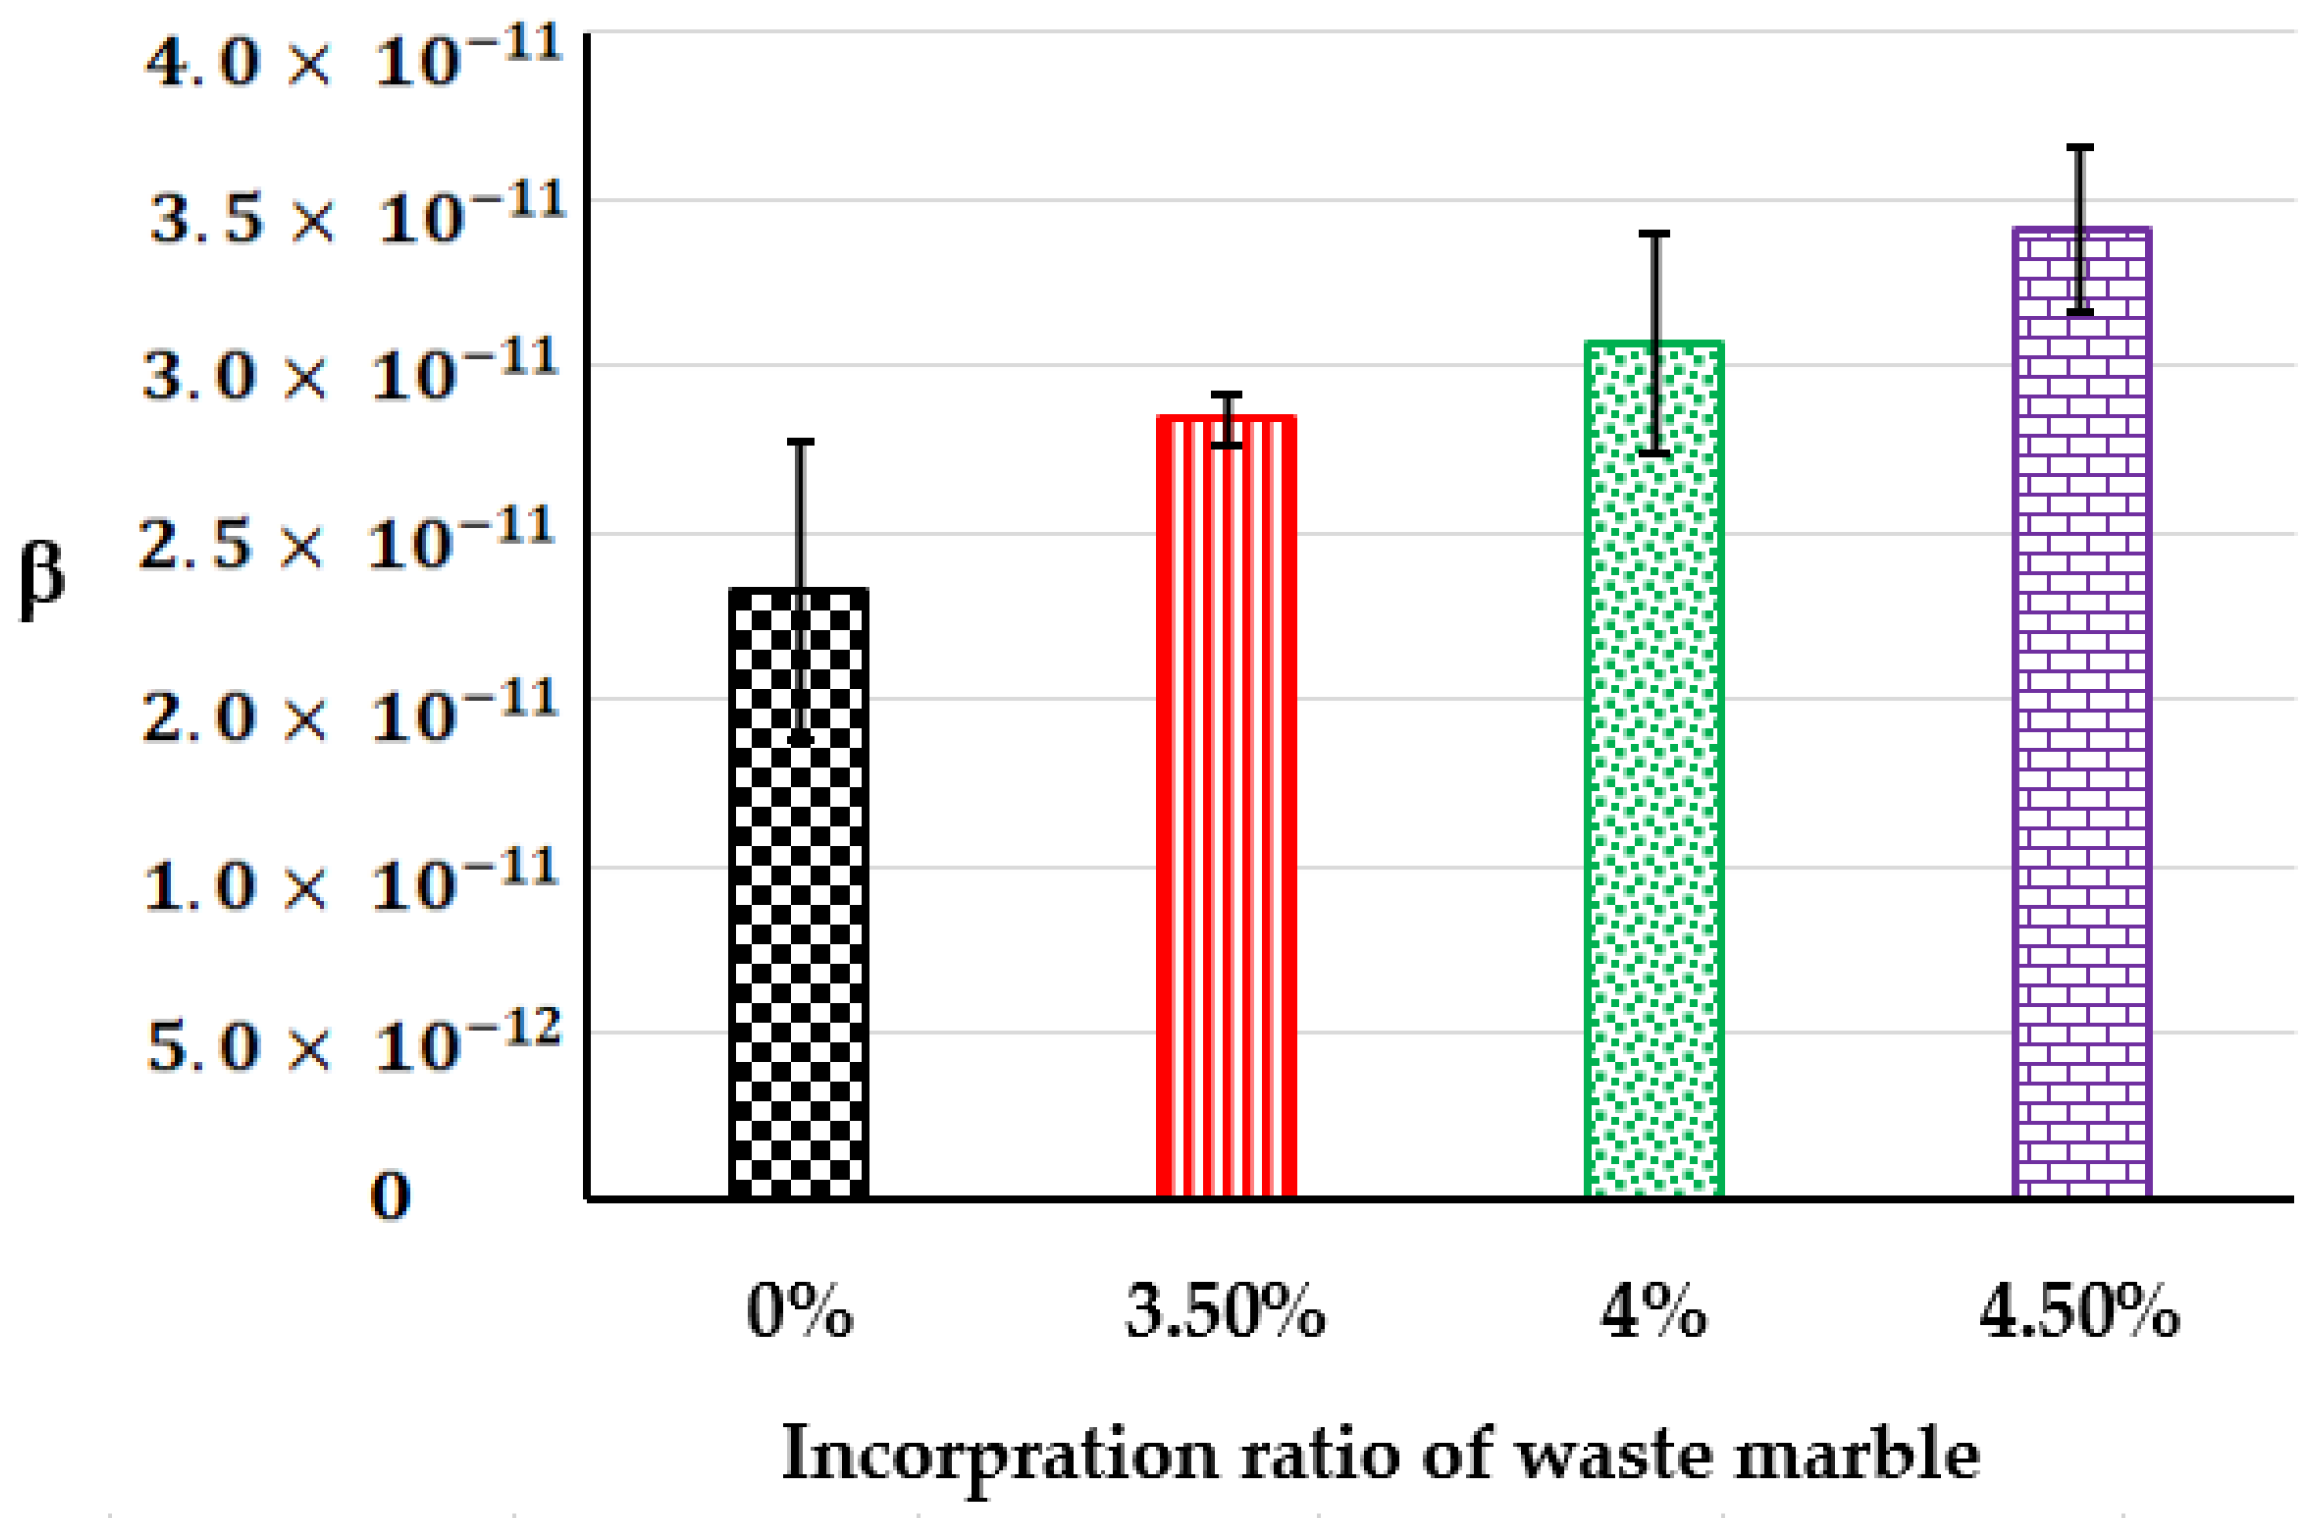
  • The Klingenberg coefficient varied. Some authors associate it with the average pore diameter, suggesting that its reduction may reflect a decrease in the size of the pores. Indeed, ref. [35] related the Klingenberg coefficient to the mean pore diameter by considering the viscosity of the gas, β = 32 3 π 2 π μ c r R T M , where μ is the viscosity of the gas, R is the ideal gas constant, T is the absolute temperature, c is a constant close to 1, and M is the molecular mass of the gas. Other studies have shown that the Klingenberg coefficient strongly depends on the degree of saturation of the concrete [33]. The results obtained in this study are attributed to the utilization of marble waste.
  • The experimental values of the intrinsic permeability, Kint, determined using the Klingenberg method, are illustrated in Figure 11. It can be seen that the intrinsic permeability is affected by the introduction of waste marble (Figure 11). Kint increases with incorporation rates above 4% waste marble, but the change is not significant compared to the reference.
The effects of the curing conditions on the β coefficient are illustrated in Figure 12. The high values of the β coefficient for the reference concrete indicate the presence of smaller pores compared to those in the waste marble valorized concrete.
Since the β coefficient is related to the number and size of the pores, it is essential to closely examine the pore size and number for each concrete specimen. Therefore, optical microscopy (Figure 13) was used to analyze concrete porosity through digital image microscopic analysis. The images obtained in Figure 13 show that the size of the voids increased as the valorization dosage of the WM increased. Based on the microscopic images of each sample, the size of the pores and the total surface area of the pores within the specimens were estimated. The results are shown in Figure 14a,b, respectively.
As shown in Figure 14, the valorization of waste marble has a negative impact on the size of the pores. It appears that as the waste marble dosage increases, the size of the pores also becomes larger. On the other hand, the increase in the dosage of waste marble as a cement replacement cannot fully function as a binder like cement. Therefore, the waste marble particles, due to their finer size compared to cement, fill the structural gaps and micro-voids, which weakens the paste network. As a result, pores are generated in the concrete structure, disrupting the interconnection of solid bonds within the cement paste.
It is clear that, since marble waste does not function as Portland cement or a fully pozzolanic material, the incorporation of waste marble, especially as a cement replacement, increases the interconnectivity of the pore network and reduces its tortuosity, resulting in more porous or lightweight concrete.

3.1.5. Drying Shrinkage

The evolution of shrinkage in reference concrete, along with WM and LF, over 90 days is shown in Figure 15a,b. It can be seen that the shrinkage deformation of concrete with WM and LF is higher, primarily compared to the reference concrete. This observation, which agrees with the literature results, is mainly due to drying shrinkage related to the evaporation of water. A large amount of free water available in the pores of WM and LF concrete, resulting from the increased W/C ratio, explains the higher shrinkage compared to the reference mix design. Furthermore, it can be highlighted that the shrinkage of the concretes is most significant at an early age, gradually stabilizing over time. Shrinkage occurred more rapidly in the first 28 days, then the shrinkage rate slowed down until 90 days.
A similar trend was reported in previous work by Sardinha et al. [36], which substituted cement by volume with very fine marble sludge (0%, 5%, 10%, and 20%) in structural concrete with a high-performance superplasticizer. On the other hand, the shrinkage of the OPC concrete became more stable after 28 days, unlike the WM and LF concretes, which continued to increase slightly despite the stabilization of mass loss. This phenomenon is explained by the fact that the endogenous shrinkage of WM and LF concretes is greater than that of OPC concretes and continues to increase even after the total evaporation of water.
A comparison graph was plotted to evaluate the shrinkage trend of both classes of concretes with WM and LF after 90 days (Figure 16). The drying shrinkage values of the samples prepared with GHORI cement and waste marble valorization ranged from 557 × 10−6 to 722 × 10−6, while the concrete samples with LF ranged from 557 × 10−6 to 648 × 10−6 after 90 days of curing in a controlled environment. The obtained results show that due to the high fineness and high water demand of LF, the concrete samples containing LF as a partial cement replacement exhibited less shrinkage than those with WM as a partial cement replacement. Drying shrinkage is directly related to optimum particle packing. This issue was addressed in the drying shrinkage assessment of self-compacting high-strength concrete in the work of R. Choudhary et al. [37]. They observed that the incorporation of WMS as a partial cement replacement in self-compaction concrete (SCC), particularly at a 10% replacement rate, reduced drying shrinkage. However, higher replacement rates (20% and 30%) led to an increase in the rate of permeable voids, resulting in higher water retention and, consequently, increased shrinkage after drying.
Moreover, the percentage of voids is another influential factor in higher drying shrinkage [38]. Therefore, due to interconnected permeable voids, the shrinkage gradually increased with higher percentages of WM and LF. With an 8.3% cement replacement incorporation ratio, the drying shrinkage increased by 29.6% for WM concrete and 16.3% for LF concrete compared to the reference concrete. This was attributed to an increase in porosity by 11.8% for the samples containing WM.

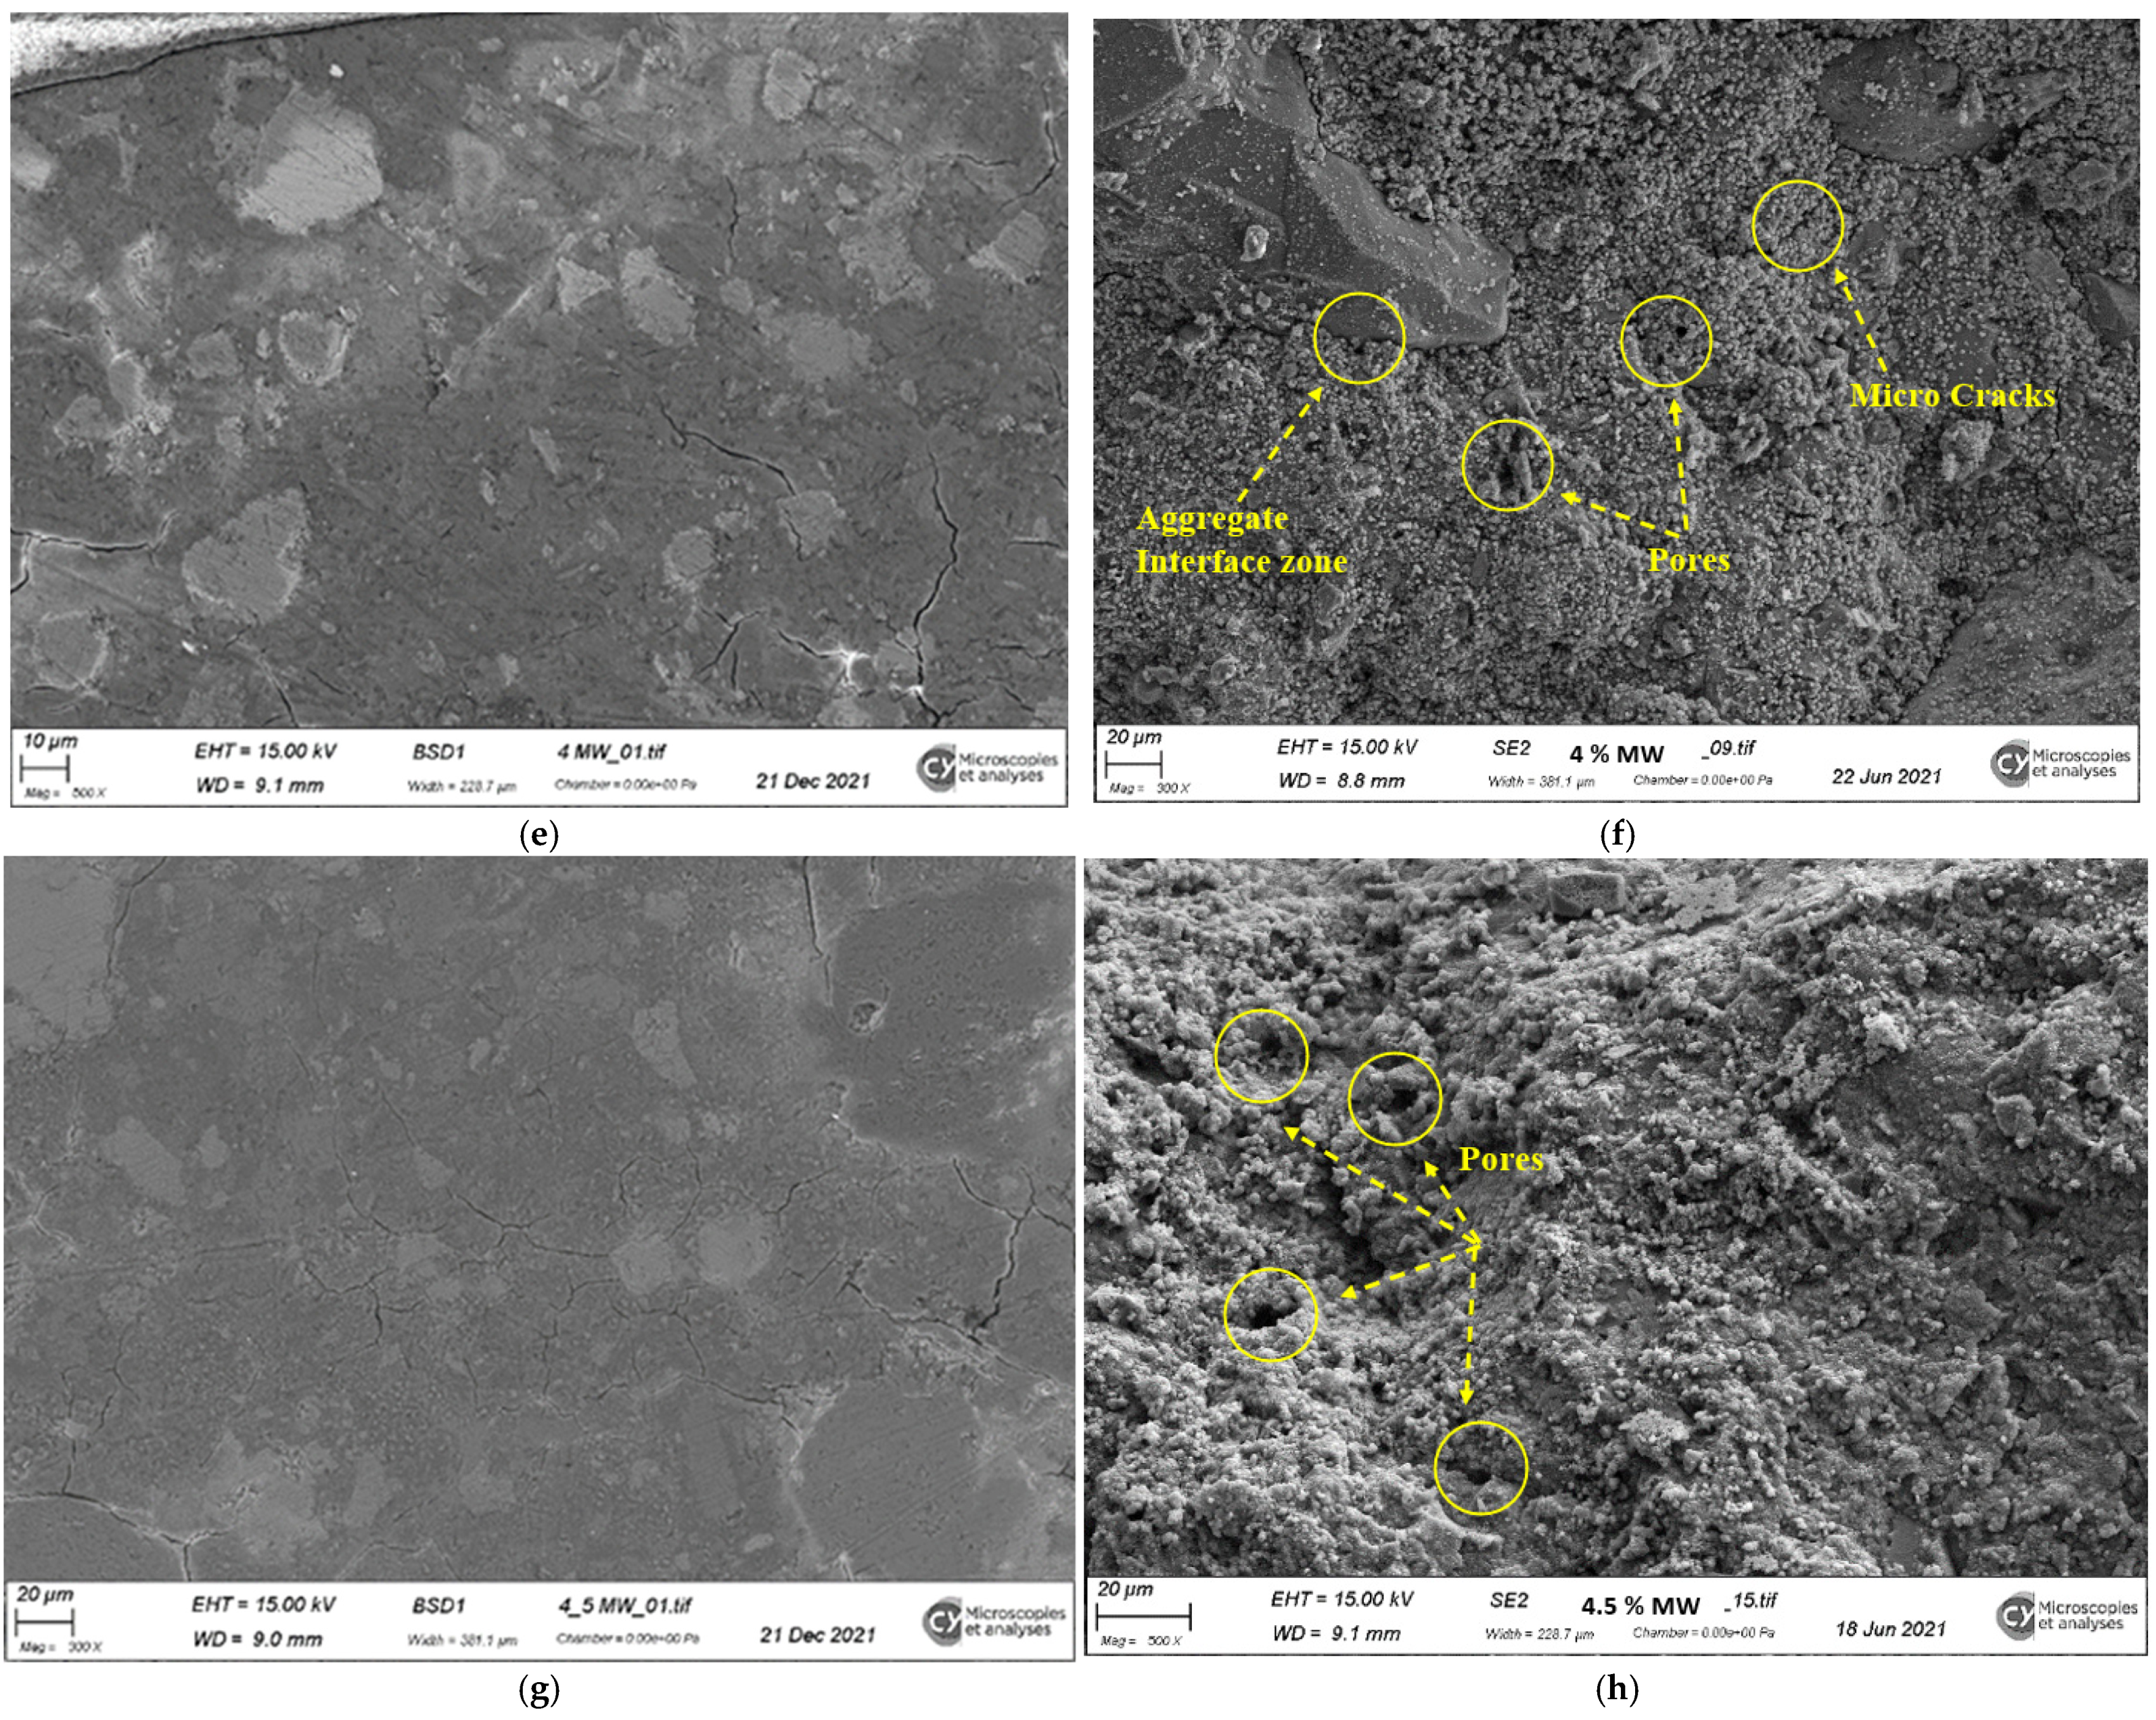
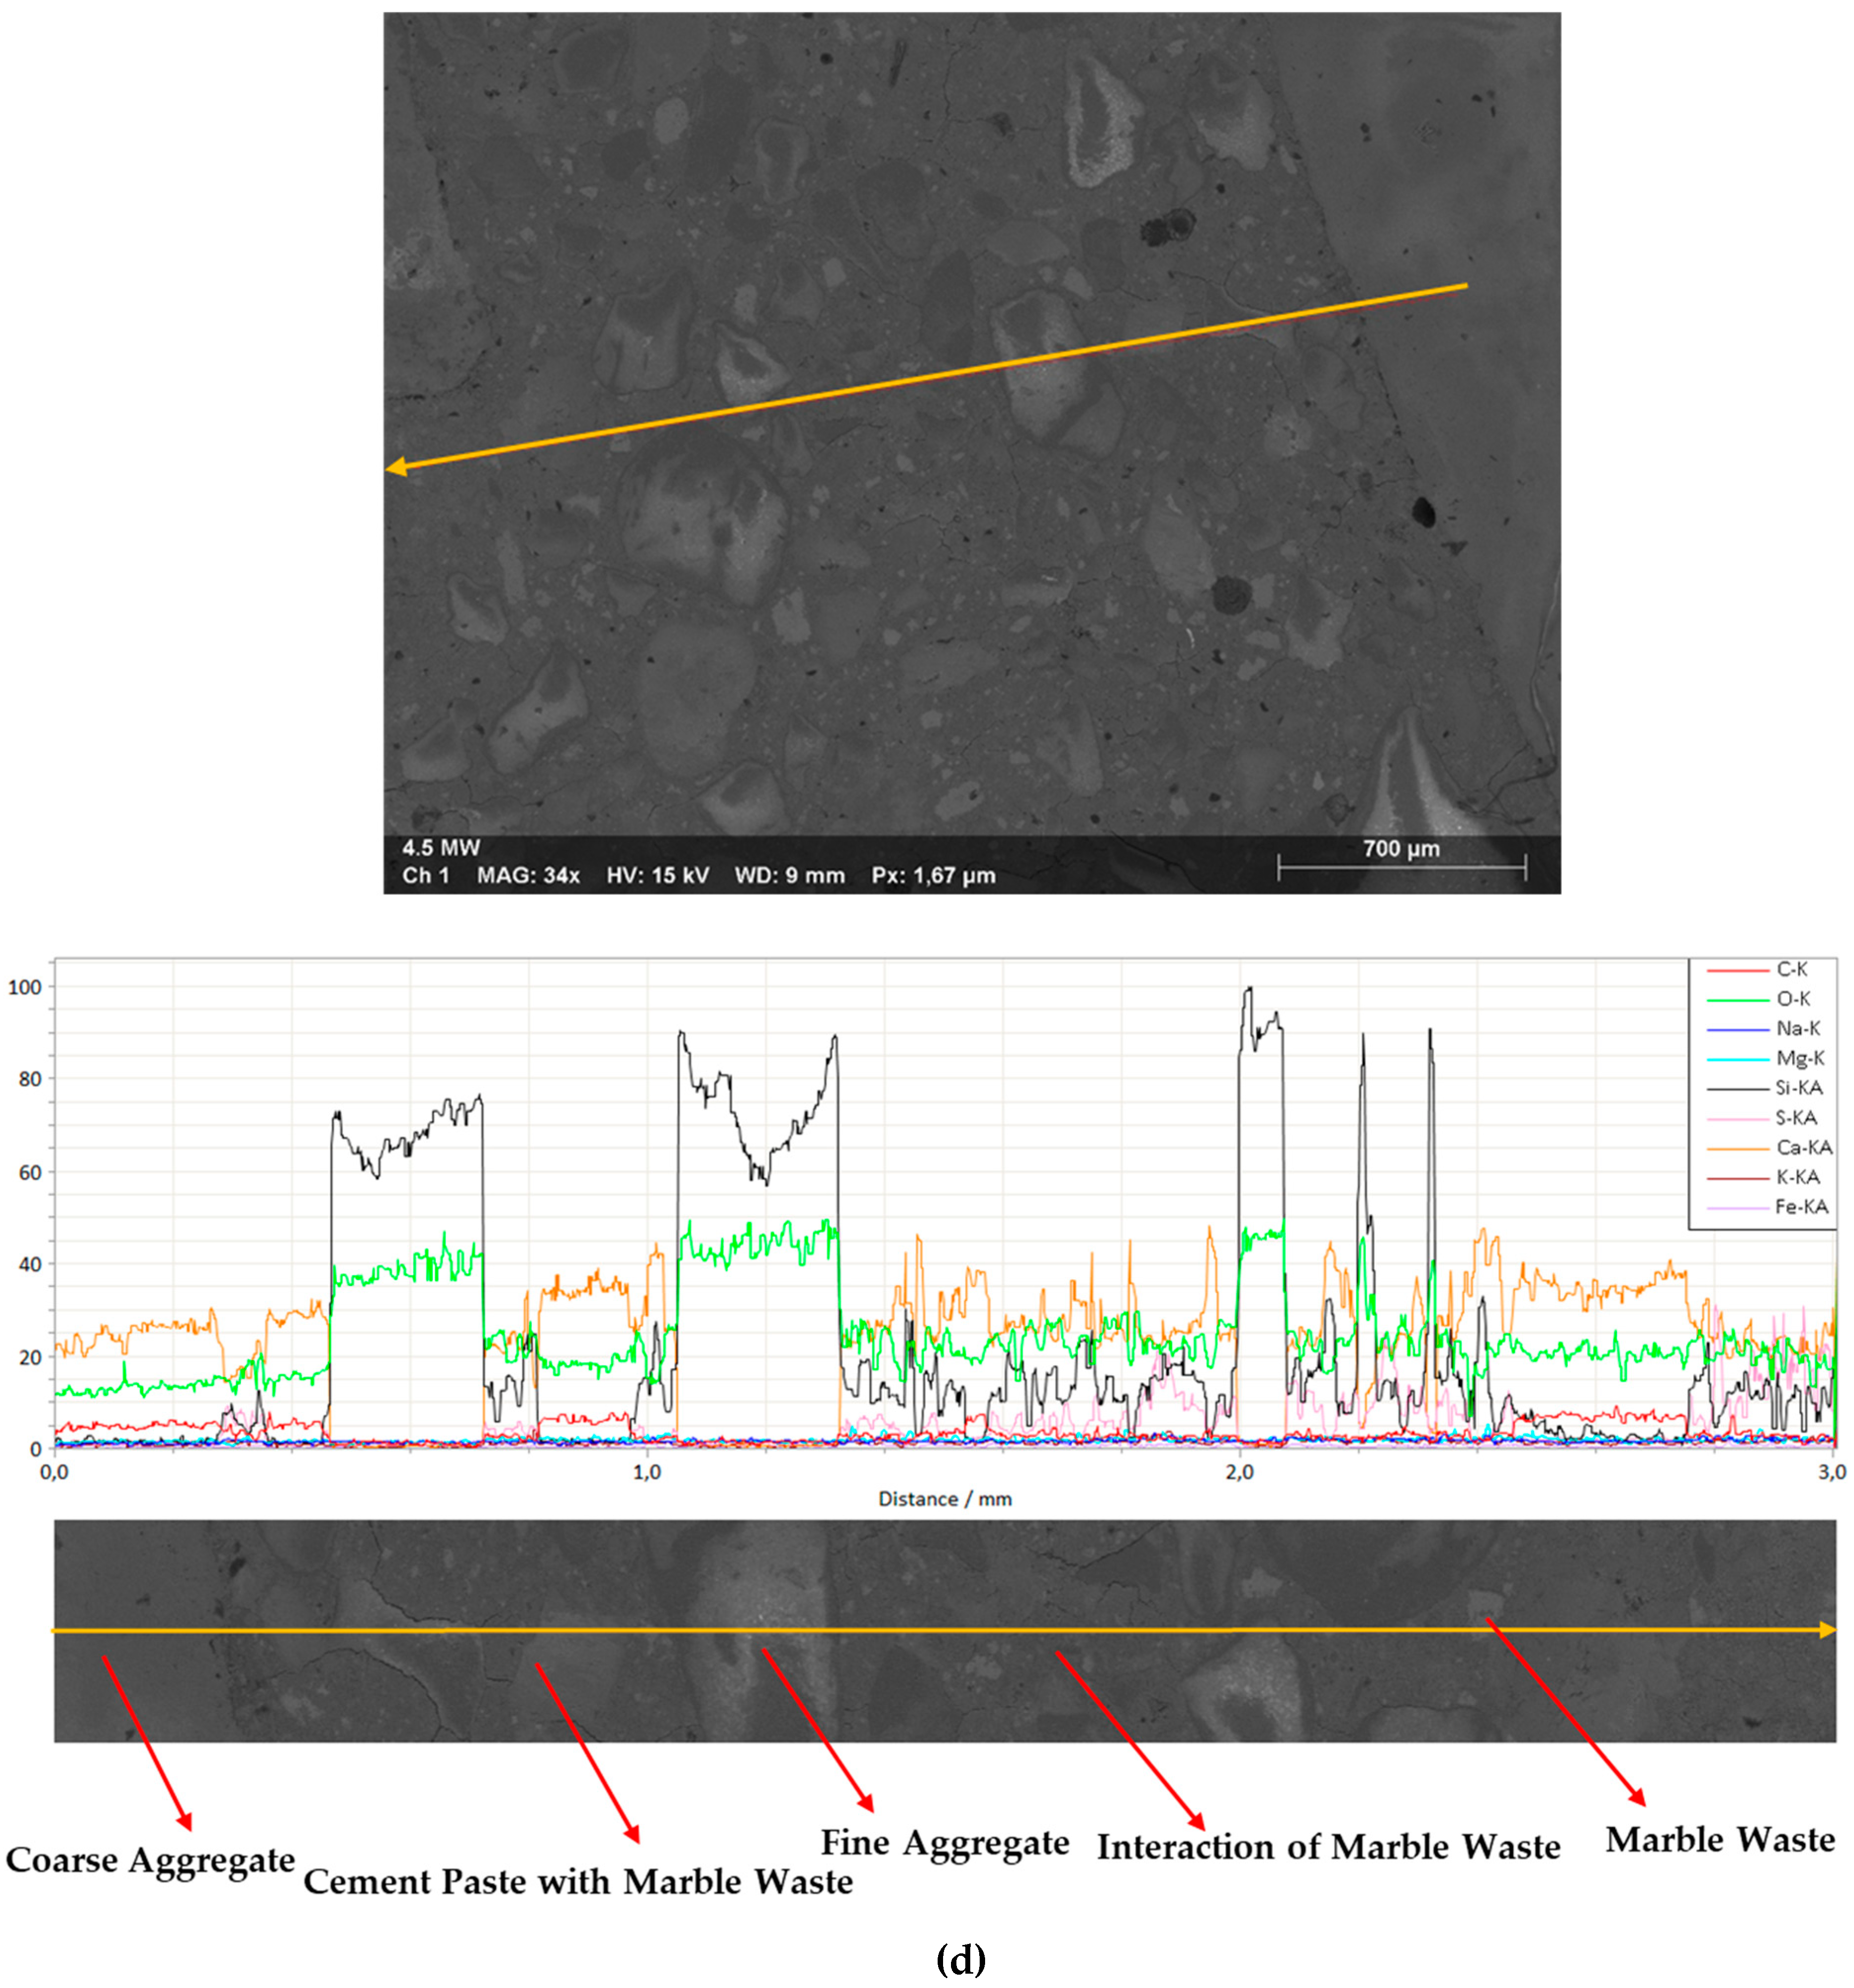
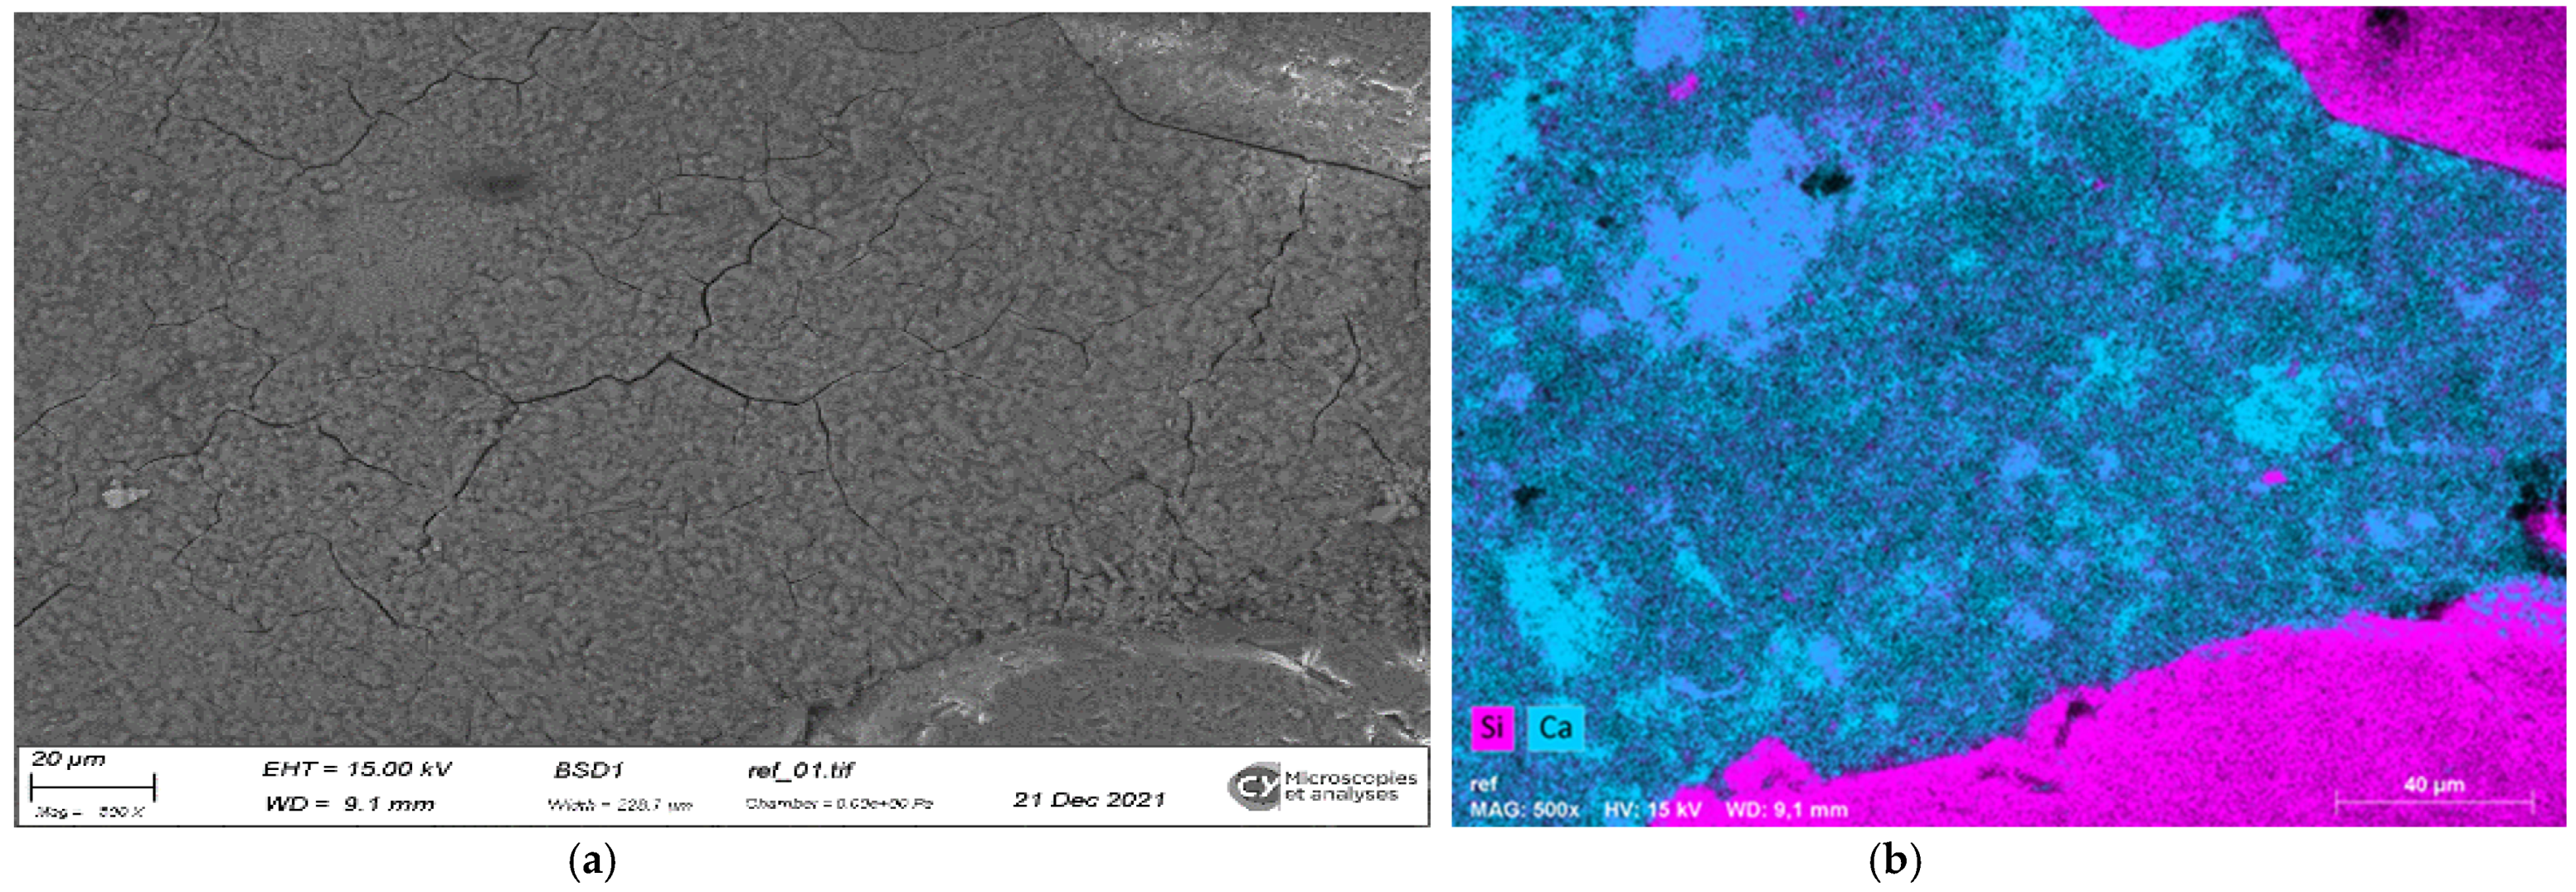
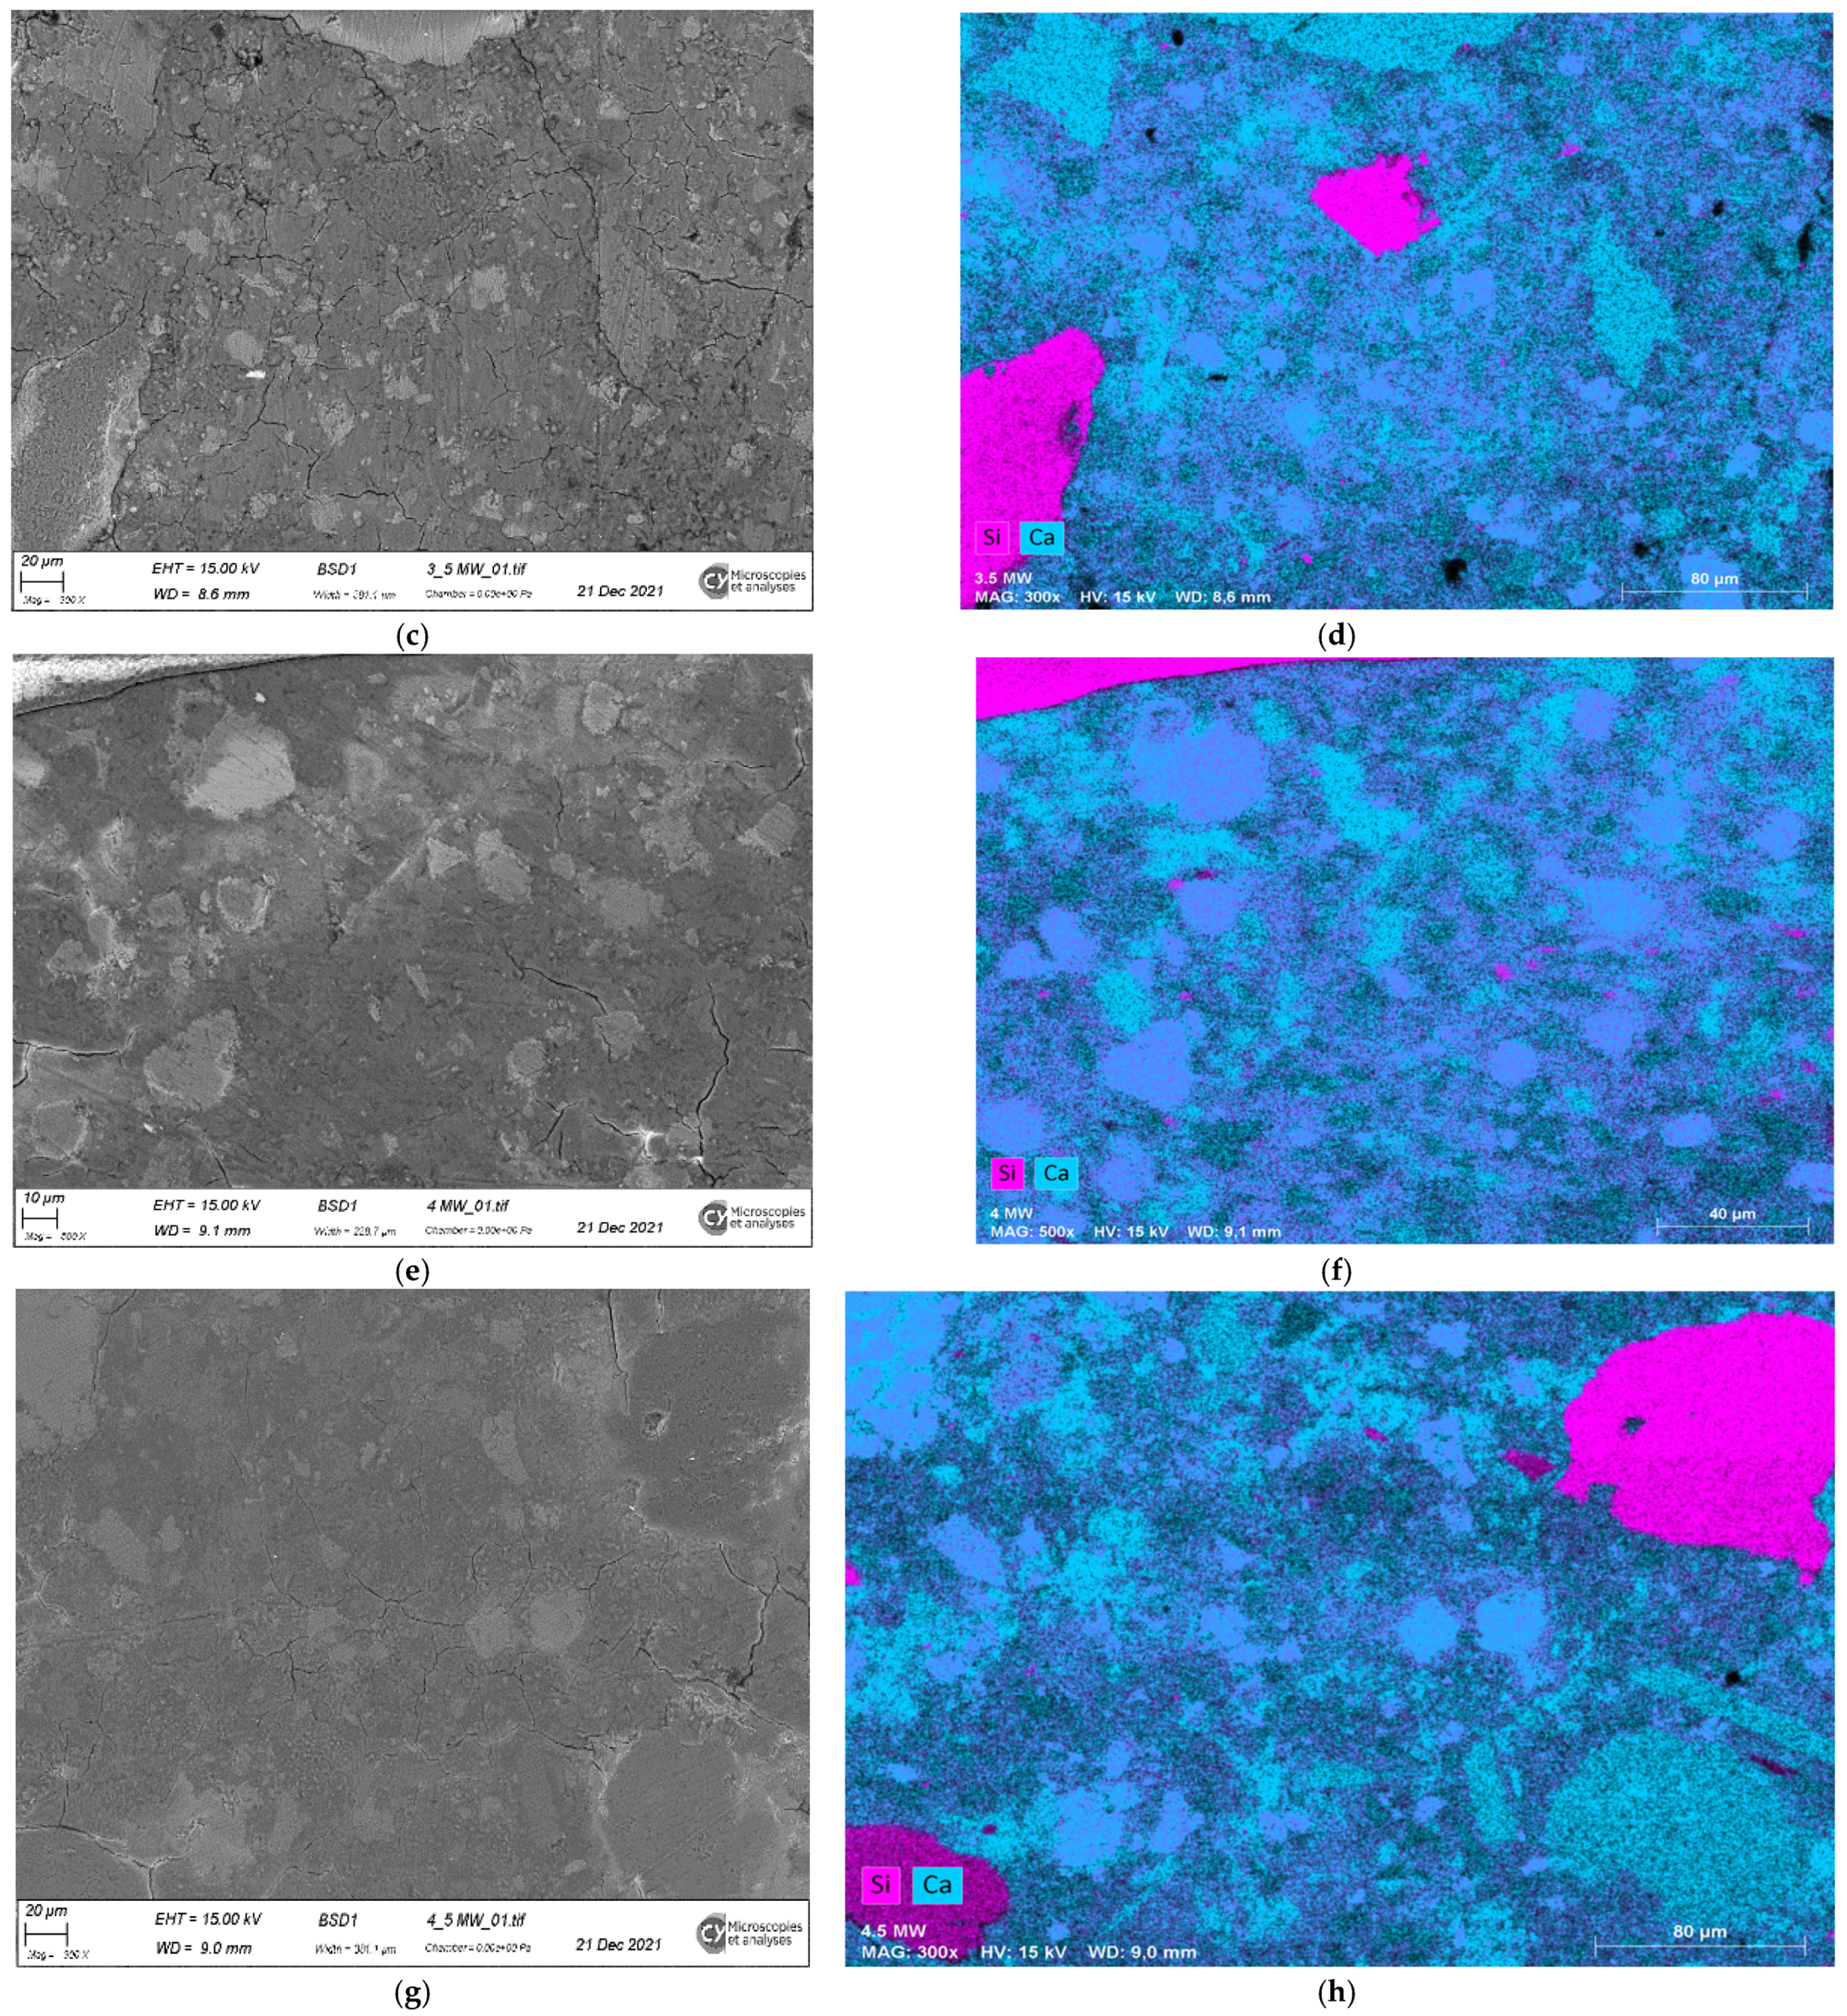
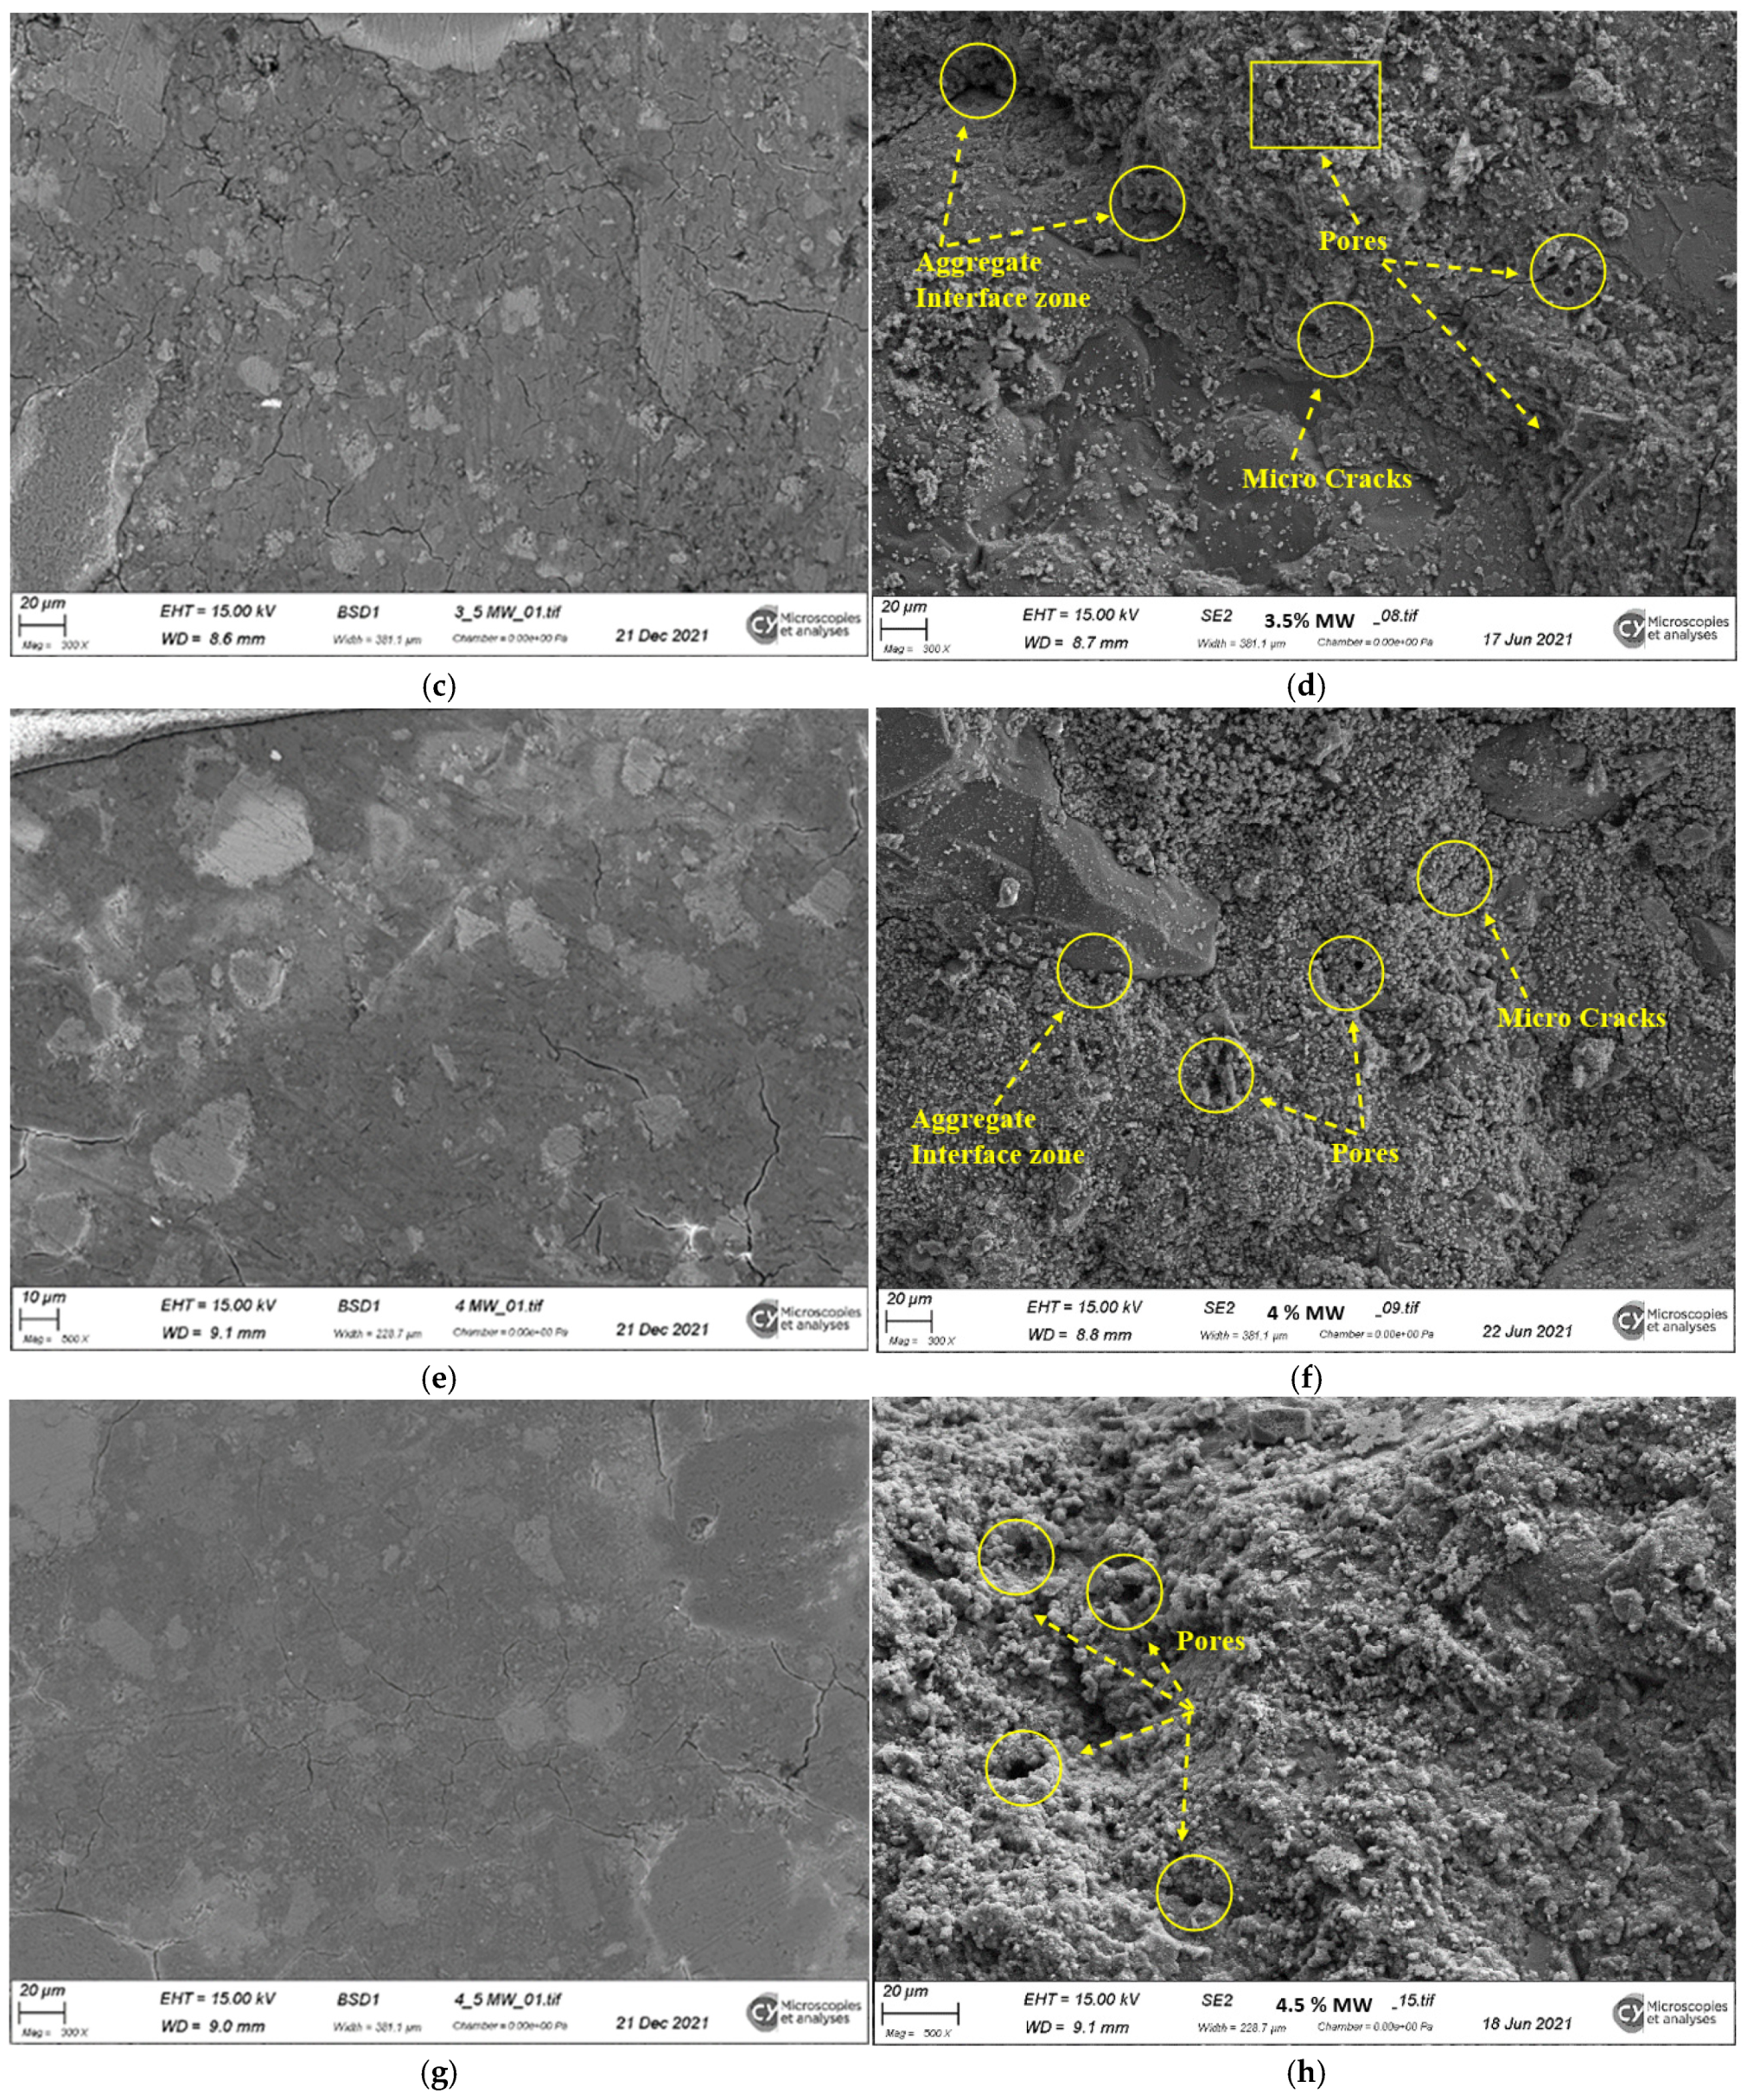
3.1.6. Microstructural Analysis and State of the Paste–Aggregate Interface

To better understand the quality of the interfaces between the cement paste and aggregates, as well as between the cement paste and marble waste, SEM observations were made, coupled with EDX chemical analysis. High-resolution images of the concrete showing its surface topography and morphology analysis for all types of concrete samples, along with the spectra of the EDX analysis of different zones, are presented in Figure 17.
Image analysis revealed a prominent interfacial transition zone (ITZ) between the cementitious matrix and the aggregates, as well as between the cement paste and marble waste. This zone appeared as a delicate transition, less than 50 μm thick, and was primarily composed of siliceous elements. Moreover, the EDX chemical analysis showed a concentration of silica (SiO2) at the edge of the ITZ and within it.
Additionally, the SEM images showed no extensive network of cracks, except for some micro-cracks in the marble waste matrix, likely caused by the evaporation of free water and entrapped air. Similar findings were reported by authors [37], where micrograph images showed that the valorization of marble slurry powder in high-strength self-consolidating concrete mixes improved the ITZ, and no significant cracks were observed. However, with high replacement doses, the mechanical strength decreased due to the reduction in cement content. This was also reported by M. J. Munir et al. [39] in microscopic images of mortar bars containing waste marble powder. Furthermore, the EDX analysis revealed the presence of white marble sand particles, which are often found in cementitious structures containing marble powder and typically represent the crystalline portion of the raw material. On the other hand, no waste marble particles were detected, confirming the chemical reaction with the cement paste in all the mixtures. The EDX spectrum indicated a high-quality mixing method, ensuring homogenization. Additionally, a good ITZ between the cement paste and aggregates was clearly visible.
Additionally, based on the EDX, the morphology mapping showed that, along with other common chemical elements, the presence of Si and Ca was significantly higher compared to other elements. Figure 18 shows that, since the chemical composition of the marble waste contained a substantial amount of Ca and some Si, this contribution indicated that with increased valorization of WM, the presence of these elements becomes more pronounced.

3.2. Effects of Waste Marble Valorization on Concrete’s Mechanical Properties

The mechanical properties of concrete C25/30, both with and without marble waste and limestone fillers, were determined through measurements of compressive strength, tensile strength by splitting, installation of strain gauges, and the application of Digital Image Correlation (DIC) techniques for strain measurements. The overall objective was to modify the design formulation for the targeted concrete, evaluate the impact of incorporating waste marble on the mechanical characteristics (such as compressive strength, tensile strength, etc.), verify the expressions established in Eurocode2., [40], and establish relationships between mechanical properties, physical properties, and transfer properties.
The ultimate goal was to predict the behavior of the concrete in compression, both with and without waste marble, by establishing the relationships between its mechanical properties and physical characteristics in order to derive the expression for the stress–strain curve (Figure 19). The relationships established in EC2 for non-linear structural analysis apply to the concrete specimens tested in compression.
Before beginning the analysis of the mechanical properties of the concrete samples in this study, we will present the strength tables as defined in EC2 (Table 4) and see the parameters for our targeted concrete with C25/30 strength.

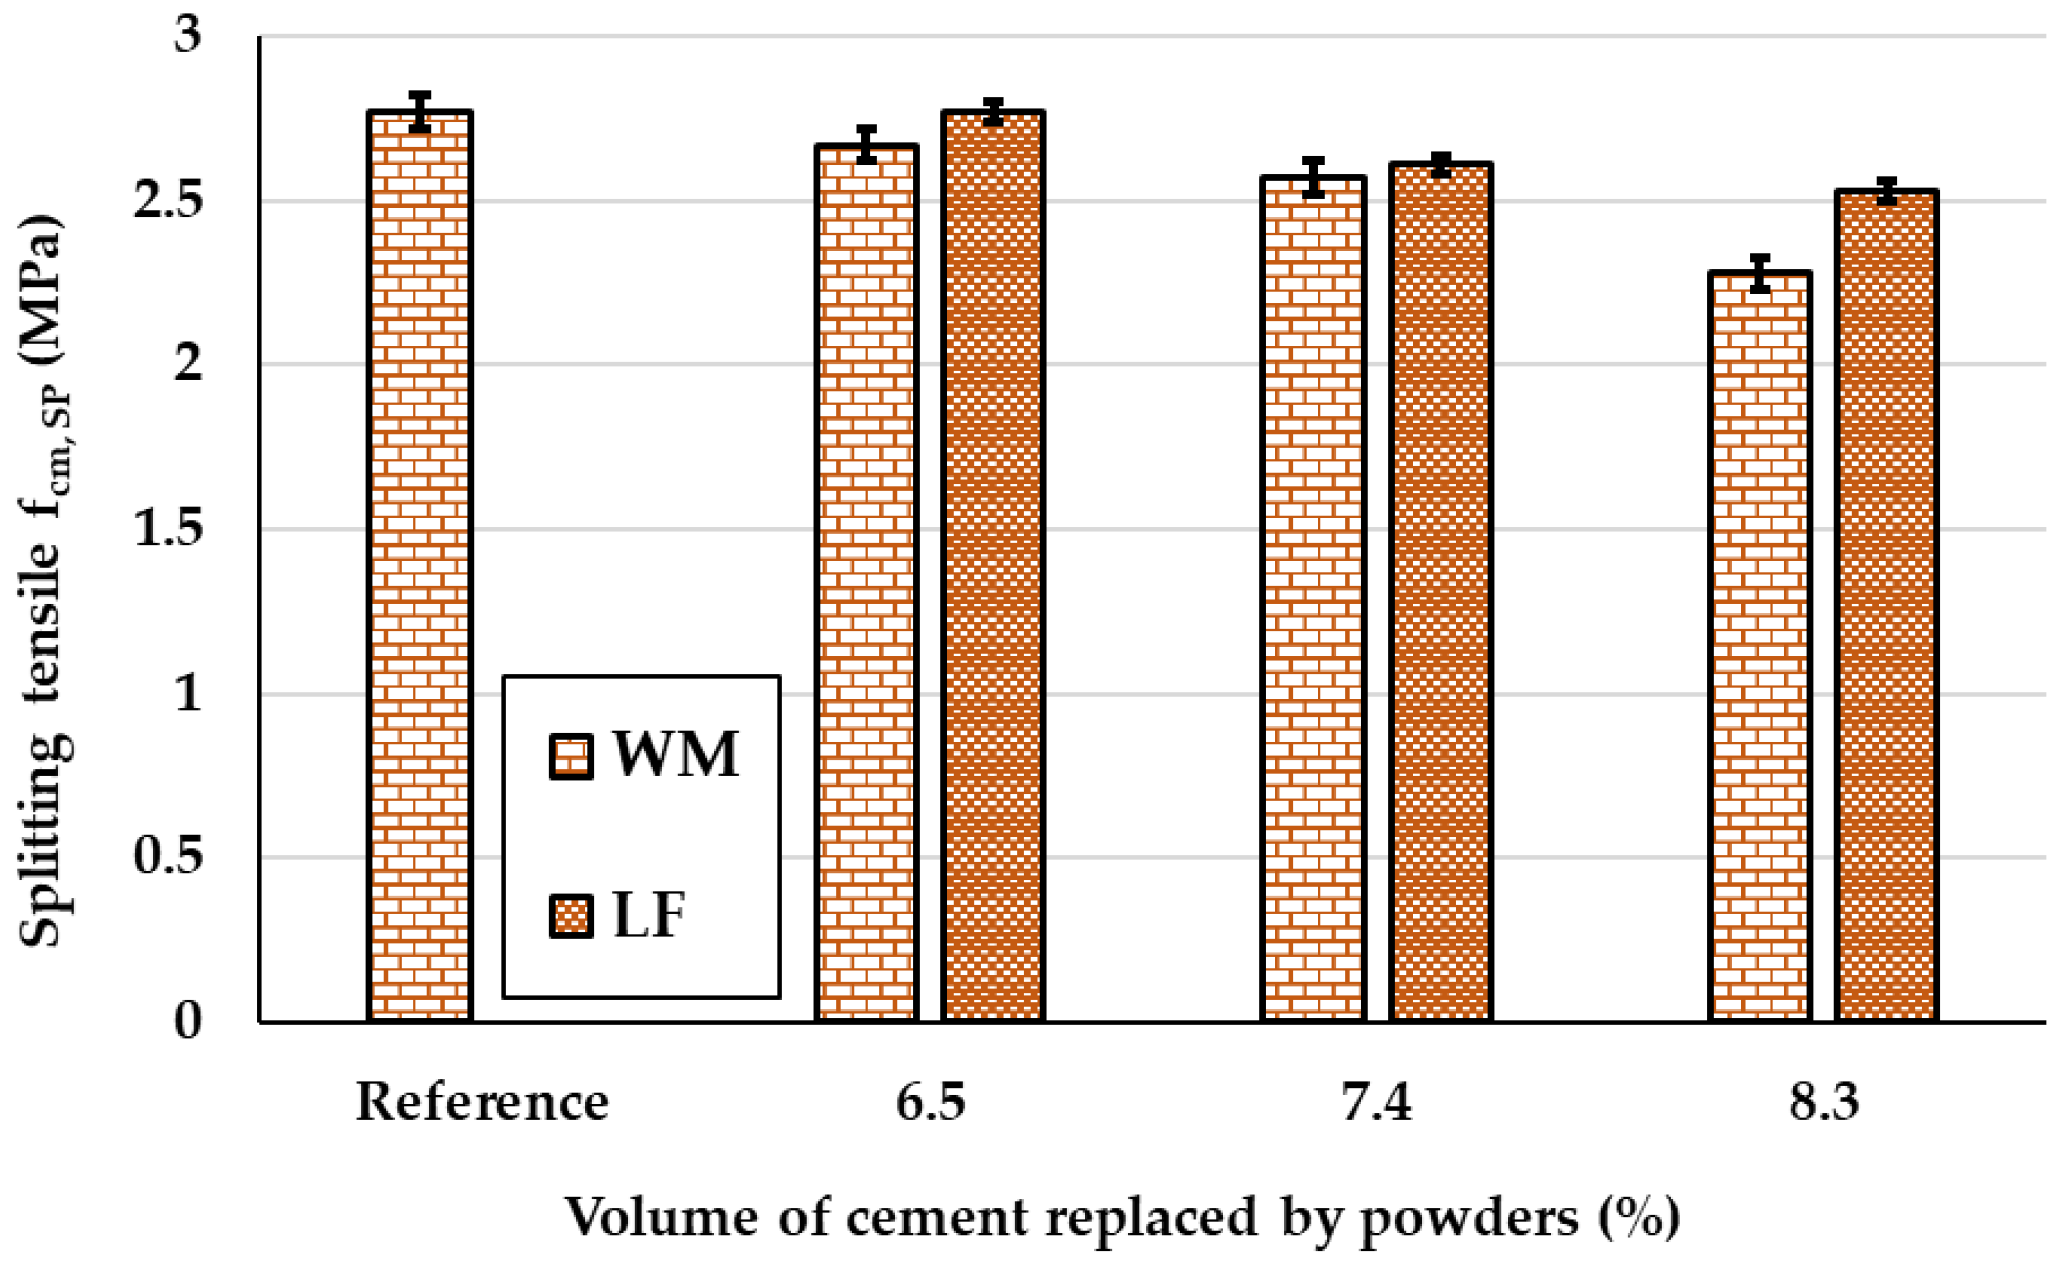
3.2.1. Compressive and Splitting Tensile Strengths

Uniaxial compression and splitting tensile tests were conducted on cylindrical test specimens (Φ 110 × 220 mm) after 28 days of curing. The experimental results are presented in Figure 20 and Figure 21, respectively. Each bar in the graph represents the average test results for three specimens. It can be observed that both the compressive strength and splitting tensile strength of the samples decreased slightly as the incorporation rate of waste marble powder (WMP) and limestone filler increased. The compressive strength values for samples containing (0%, 6.5%, 7.4%, and 8.3%) WMP were (28.1, 27.22, 25.46, and 22.46) MPa, respectively. Based on these values, the maximum reduction in compressive strength, a 20% decrease compared to the reference concrete, was observed for the sample containing 8.3% WMP as a cement replacement by volume, resulting in a compressive strength of 22.46 MPa.
Meanwhile, the maximum reduction for samples containing limestone filler (LF) as a cement replacement was recorded at 25.2 MPa for the sample containing 8.3% LF as a cement replacement by volume, which represents a 10.3% reduction compared to the reference concrete. However, due to the high fineness and micro-filler properties of the limestone filler, the strength reduction in the specimens with limestone filler was less pronounced compared to those with waste marble powder.
This modification in porosity affects the pore structure and the formation of cracks. Scanning Electron Microscopy (SEM) confirmed that as the amount of cement was reduced and the concrete became more porous, resulting in weaker compressive and splitting tensile strengths (Figure 22).
As observed in Figure 20, up to an incorporation ratio of 8.3%, the compressive strength did not show significant changes compared to the targeted compressive strength of C25/30. A similar observation was made by researchers [41] in a study titled “Effect of Marble Slurry as a Partial Substitution of Ordinary Portland Cement in Lean Concrete Mixes”. The authors used marble slurry as a partial substitute for ordinary Portland cement at 10%, 20%, 30%, and 40% in lean concrete mixes with an average target compressive strength of 20 MPa. Their findings showed that up to a 10% cement replacement, the compressive strength results were similar to the reference concrete. However, beyond that point, the compressive strength decreased with increasing waste marble dosages due to the reduced availability of calcium compounds necessary for hydration and strength development.
Moreover, the splitting tensile strength of the concrete specimens followed the same trend as the compressive strength. The average value of the splitting tensile strength for the control mix was 2.77 MPa, while the reduction in splitting tensile strength for samples containing 6.5%, 7.4%, and 8.3% WMP was recorded as 3.6%, 7.2%, and 17.7%, respectively, compared to the control mix. Meanwhile, the reduction in splitting tensile strength for specimens containing LF at 6.5%, 7.4%, and 8.3% was recorded as 0%, 5.8%, and 8.7%, respectively, compared to the reference concrete.
The gradual reduction in strength observed in this research is attributed to the reduction in cement content and the increased water/cement (W/C) ratio (Figure 23). Additionally, the correlation between compressive strength and porosity (Figure 24) shows a linear relationship, highlighting that the valorization of waste marble gradually impacts both porosity and strength.

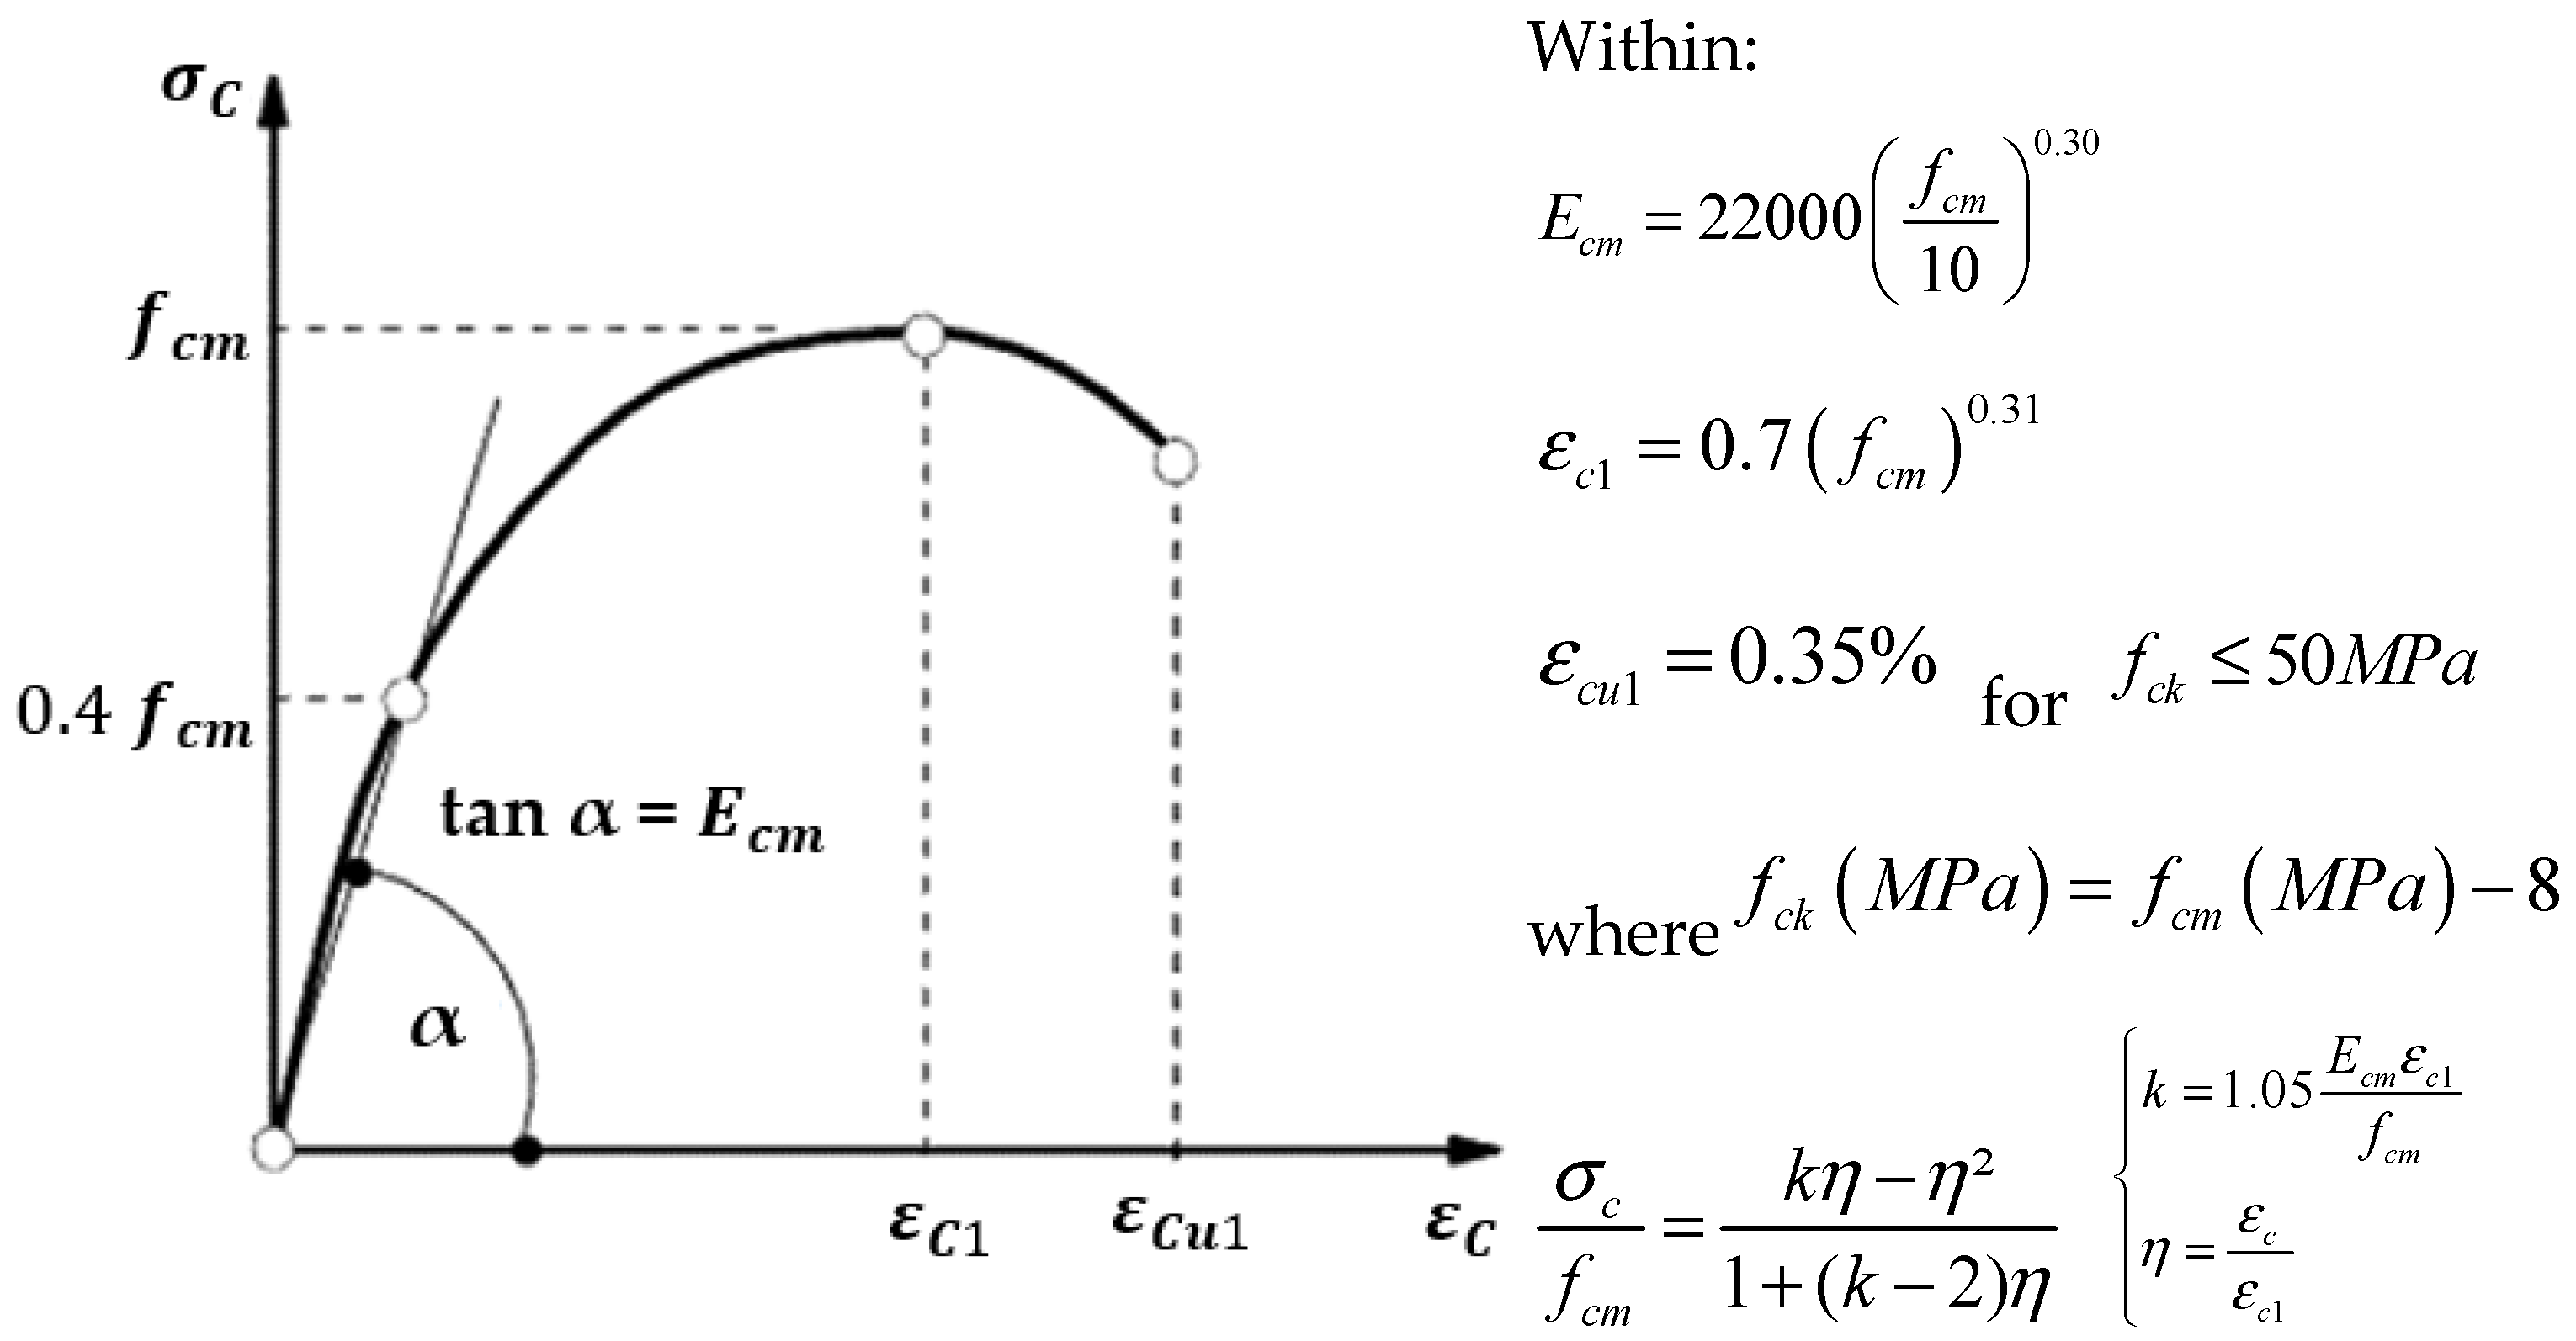
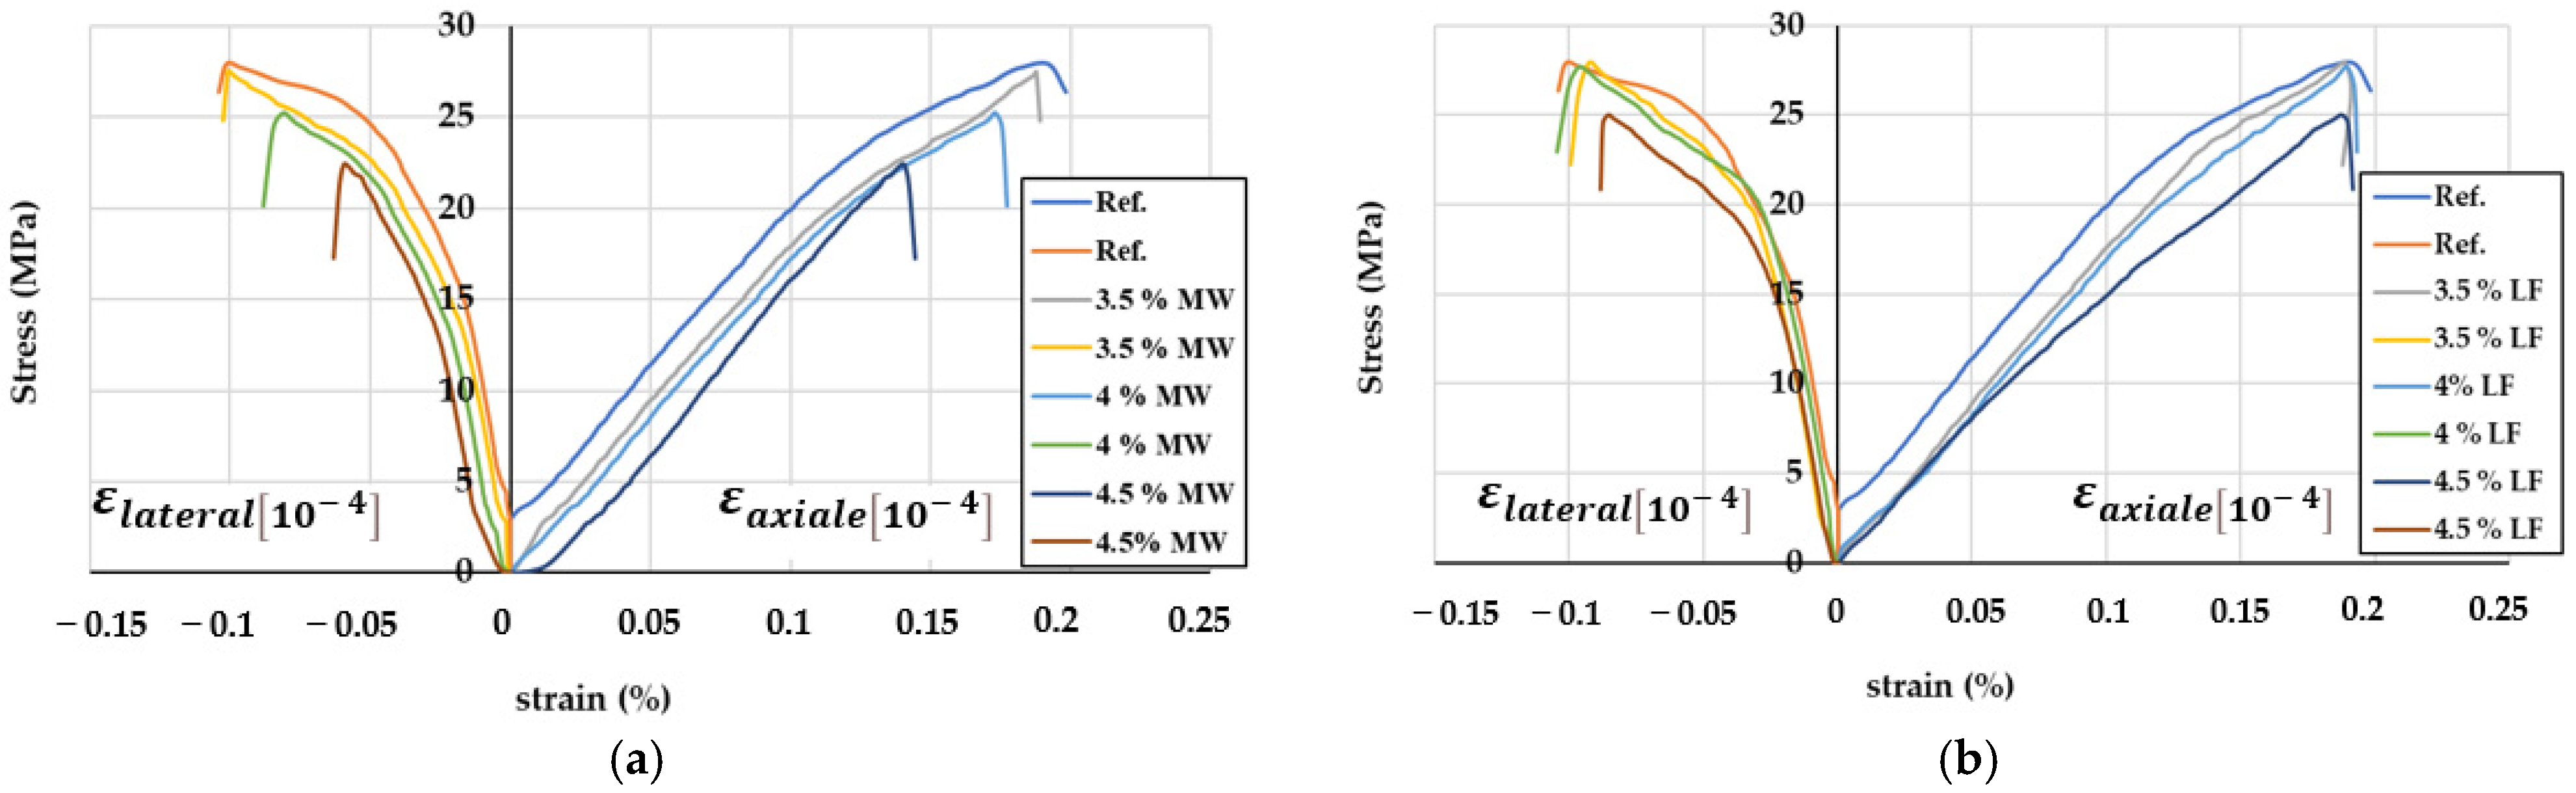
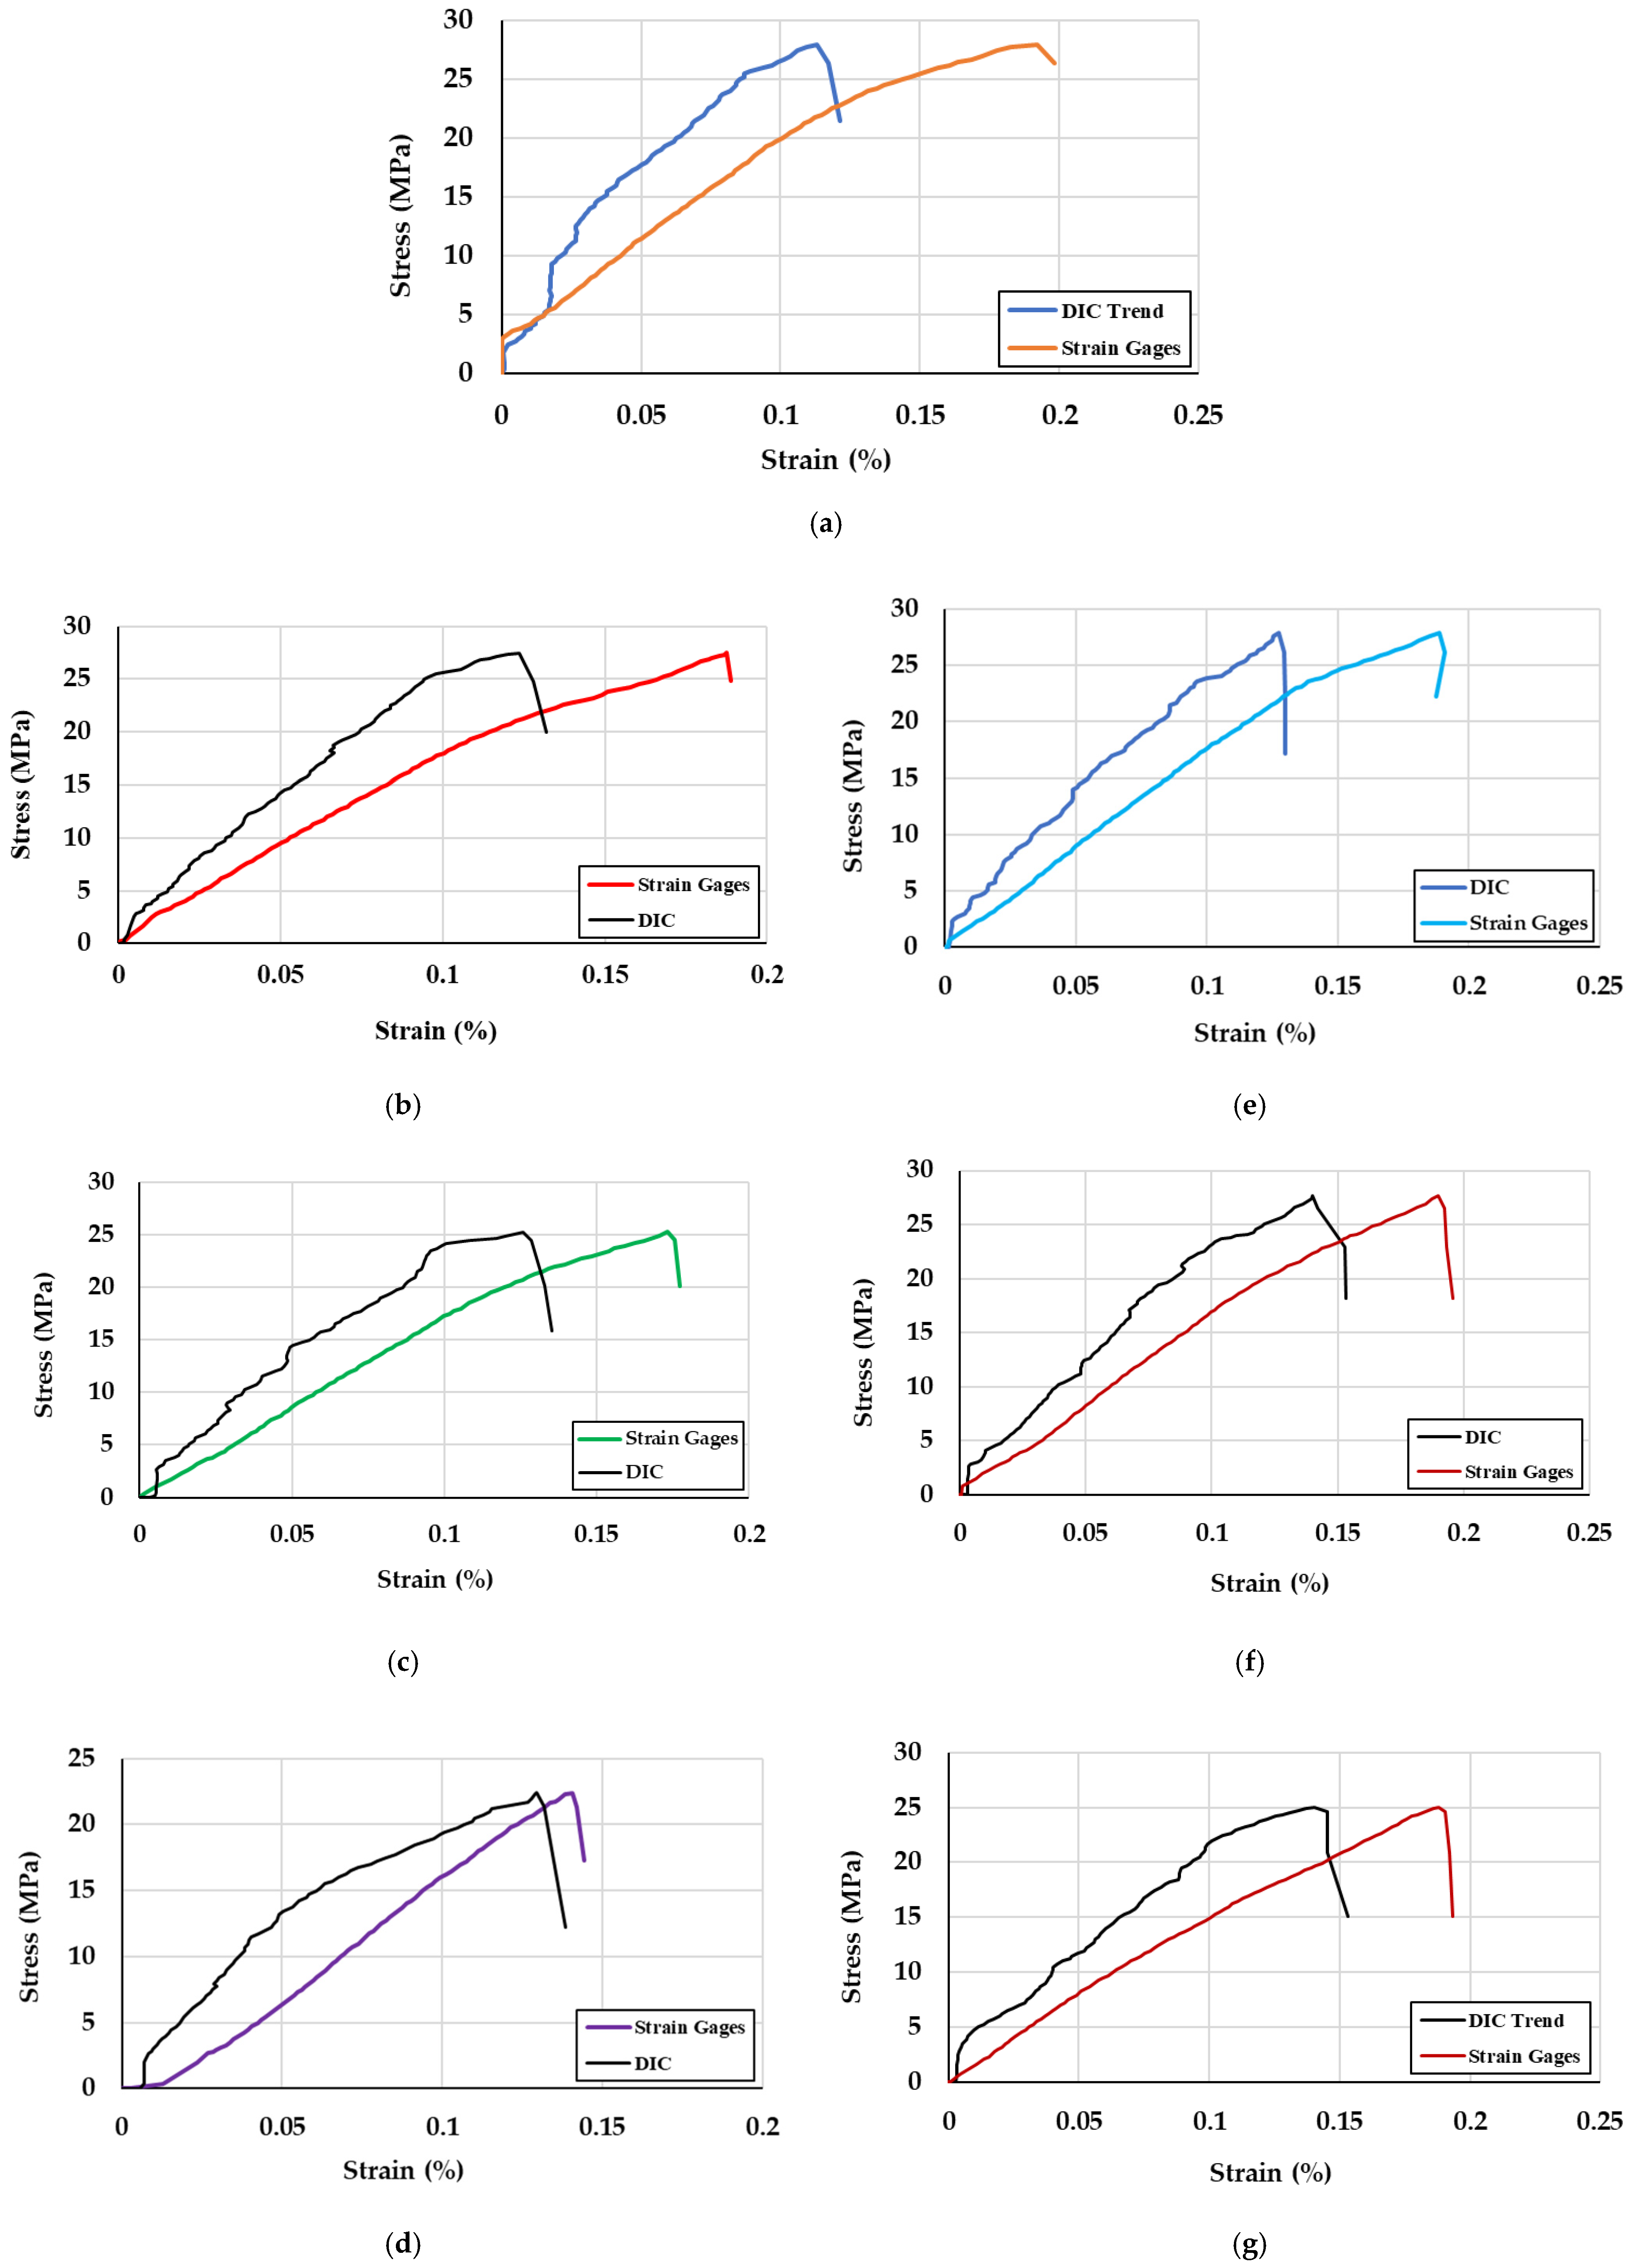
3.2.2. Stress–Strain Correlation

Considering the appearance of the stress–deformation curves of the concrete, it appears that both the reference samples and those with the valorization of WM and LF exhibited similar behaviors under uniaxial compression. However, the stress values at the peak for the reference concrete were higher than those for the concrete samples valorized with WM and LF, although they exhibited similar deformations (Figure 25). Therefore, the valorization of waste marble powder as both a cement and sand replacement did not have a significant impact on the displacement of the samples compared to the reference concrete samples without waste valorization.
Similarly, in Figure 26, strain gauges were used in both the axial and lateral directions to measure the deformation accurately.
Based on the failure patterns presented in Figure 27, for all the tested samples, it appears that the failure shapes of the concrete samples differed from the reference concrete sample. The failure mode of the reference sample was conical, occurring in the top zone due to cross-diagonal cracks with slight opening widths. In contrast, the failure mode of the 3.5% and 4% WM valorized concrete samples was characterized by main longitudinal cracks running from the top to the bottom of the sample. The failure of the 4.5% WM valorized concrete was caused by a diagonal fracture, with no cracking through the ends. Furthermore, the failure patterns of the 6.5% LF and 7.4% LF concrete samples were similar to the reference sample, exhibiting a conical shape. The 8.3% LF concrete sample, however, exhibited an ill-formed cone with vertical cracks running through the top of the sample. Observations of the tested samples showed that none of them broke into small fragments; this suggests that the concrete was homogenously mixed and well-bonded, breaking without separating from the paste. These findings highlight that the designed concrete mixes possessed good mechanical resistance.
Furthermore, Digital Image Correlation (DIC) techniques were applied as an advanced method for strain measurements (Figure 28). The strain measurement results obtained using the DIC method were compared to those from the strain gauges. The summarized results of both methods, along with the displacement values obtained from the compression machine, are shown in Table 5. Graphically, the trends of both the strain gauge and DIC method data are illustrated in Figure 29. Both curves follow a similar displacement pattern, although the maximum strain measured using the DIC method was lower than the maximum strains obtained from the strain gauge curves. This demonstrates the accuracy of the DIC method for measuring strain in concrete samples.

3.2.3. Young’s Modulus of Elasticity and Poisson’s Ratio

Young’s modulus of elasticity and Poisson’s ratio were determined by conducting uniaxial compression tests supported by axial and lateral strain gauges after 28 days. These parameters allow for the analysis of the elastic behavior of materials under static loading conditions and help to track the evolution of their damage. The obtained results for Young’s modulus of elasticity and Poisson’s ratio are summarized for all types of concrete in Table 6.
The static modulus of elasticity (E) in GPa is defined according to Hooke’s law as the constant relating the applied compressive strength (σ) in Pascals (Pa) and the elastic deformation generated by the material (ε) in μm/m (10−6) or mm/m (10−3).
σ = E static × ε
Poisson’s ratio (ν) characterizes the expansion of materials perpendicular to the direction of the applied stress and is obtained using the following relationship:
ν = ε l a t e r a l ε a x i a l
Young’s modulus of elasticity and Poisson’s ratio are determined from the stress–strain curve generated by the strain gauges for each type of concrete (Figure 30). The modulus of elasticity and Poisson’s ratio are specified by analyzing the linear portion of the curve as follows:
The obtained results, tabulated in Table 6 for all types of concrete, are consistent with Eurocode2., [40], as the modulus of elasticity is directly proportional to the quality of the concrete and its compressive strength. Based on the experiments, as the compressive strength increased, the modulus of elasticity also increased, indicating improved concrete quality. This relationship was noted in the work of A. Khodabakhshian et al. [42]. The correlation between compressive strength and modulus of elasticity (Figure 31) showed that both the modulus of elasticity and compressive strength slightly decreased with the increase in the valorization of WM. However, this reduction was not significant, and the obtained results align with the research by R. Rodrigues et al. [28].
The findings by V. Nežerka et al. [43] indicate that the reduction in the modulus of elasticity of cement paste is associated with an increase in the valorization ratio of marble powder due to the increased porosity of the structure. The reason for the reduction in the modulus of elasticity is discussed in the context of utilizing marble powder as a fine aggregate in mortar mixes, as shown in the work of K. Kabeer and A. Vayas, [44]. Therefore, based on both the experimental results and those in the literature, it can be concluded that using more than 10% waste marble can reduce the modulus of elasticity and negatively impact the concrete’s quality.

3.2.4. Ultrasonic Pulse Velocity (UPV) of Concrete

The effects of Ultrasonic Pulse Velocity (UPV) due to the incorporation of waste marble as a partial substitution for cement and sand, as well as the valorization of LF as a cement replacement, is shown in Figure 32. Based on the results, the UPV of all concrete mixes ranged from 4.12 to 4.16 km/s, indicating excellent concrete quality. The results suggest that the incorporation of waste marble does not significantly affect the UPV until the waste marble content reaches 4.5%. The graph in Figure 32 shows a slight decrease in UPV, which gradually occurs with the reduction in cement and the increase in marble waste. This gradual decrease is explained by R. Rodrigues et al. [28], who noted that the hydraulicity of cement is much higher than that of industrial marble waste, which enhances the concrete’s compactness.
When comparing the two concrete classes valorized with WM and LF, it can be seen that the valorization of LF, due to its higher fineness, is more effective than that of marble waste in concrete samples after 28 days (Figure 32). The 28-day UPV results for concrete with the optimal use of 4.5% valorized marble waste show a reduction in UPV of less than 1%. This suggests that the inclusion of marble waste and limestone filler as cement replacements does not significantly affect concrete quality at this dosage. A similar slight reduction was observed in the work of A. Aliabdo et al. [45].
Generally, the UPV decreases with an increasing incorporation ratio of marble powder waste and has a direct relationship with compressive strength, as UPV increases with improved compressive strength. This trend was also observed by refs. [9,31,46], among others. However, some authors [36,41,47] found that with an increase in the dosage of waste marble, the UPV increased. They attributed this to the high fineness of marble waste, which acts as a micro-filler, improving the compactness of the concrete.

4. Eco-Environmental Analysis

Cement, being a primary construction material globally, not only contributes significantly to CO2 emissions but is also an expensive component in concrete production. As a result, scientists and researchers are increasingly focused on finding alternative solutions to mitigate these impacts, such as partial substitution of cement with other binders, powders, the use of waste materials, or carbon capture technologies. This study specifically investigated the utilization and recycling of waste marble as a cement replacement in the concrete industry, offering several eco-environmental benefits, which we outline briefly.
First, the reduction of waste: the marble industry generates large amounts of waste, much of which ends up in landfills. By incorporating this waste into concrete production, the disposal burden is reduced, helping to minimize landfill use. Second, lower carbon footprint: cement production is highly energy-intensive and is a major source of CO2 emissions. Replacing a portion of cement with marble waste reduces the carbon footprint of concrete production, as processing marble waste requires less energy compared to cement. Third, the conservation of natural resources: using marble waste in concrete reduces the need for raw materials such as natural aggregates and cement, helping to conserve resources and reduce the environmental impact of material extraction and processing.
Additionally, there is the energy savings factor: processing marble waste is less energy-intensive than cement production, leading to energy savings and less environmental degradation from energy consumption. Finally, replacing cement with marble waste reduces the density of concrete, producing lightweight material that lowers the transportation costs and energy consumption associated with moving heavy materials.
The additional goal of this study was to evaluate the economic benefits of using waste marble in concrete. To estimate the savings, we considered the use of the optimal dosage of 8% waste marble powder (WMP) as a cement replacement by volume. In the reference concrete formulation (C25/30), 455 kg of cement is used per cubic meter, while the concrete mix with 4% waste marble contains 423 kg of cement, which corresponds to an 8% reduction in cement content. Therefore, the difference of 455 kg − 423 kg = 32 kg of cement can be saved per cubic meter.
To calculate the cost savings, we consider the price of a 50 kg bag of GHORI cement is approximately USD 7 in the Afghan market. Therefore, 32 kg of cement would result in a savings of approximately USD 4.50 per cubic meter. These savings could significantly contribute to the national economy, especially in large-scale construction projects, while also providing environmental benefits. However, the economic impact may vary by region, depending on the chemical composition and fineness of the waste marble powder. It is important to note that, when comparing the two materials (WM and LF) used as cement substitutes, waste marble from mining sites or the stone processing industry can be obtained for free. However, limestone fillers are not available for free, as a 25 kg bag costs approximately USD 40 on the global market.
Therefore, replacing cement with waste marble not only minimizes environmental impact but also provides economic benefits, especially in regions close to marble quarries. In summary, incorporating waste marble into concrete production supports sustainability by reducing waste, conserving resources, decreasing emissions, and enhancing material efficiency, all of which contribute to more eco-friendly construction methods.
Finally, to summarize the findings of this investigation, we create a graph in which each line depicts the rise and decrease in concrete quality as a result of partially replacing cement with waste marble powder (Figure 33).

5. Conclusions

Considering the results and findings, this research draws the following conclusions:
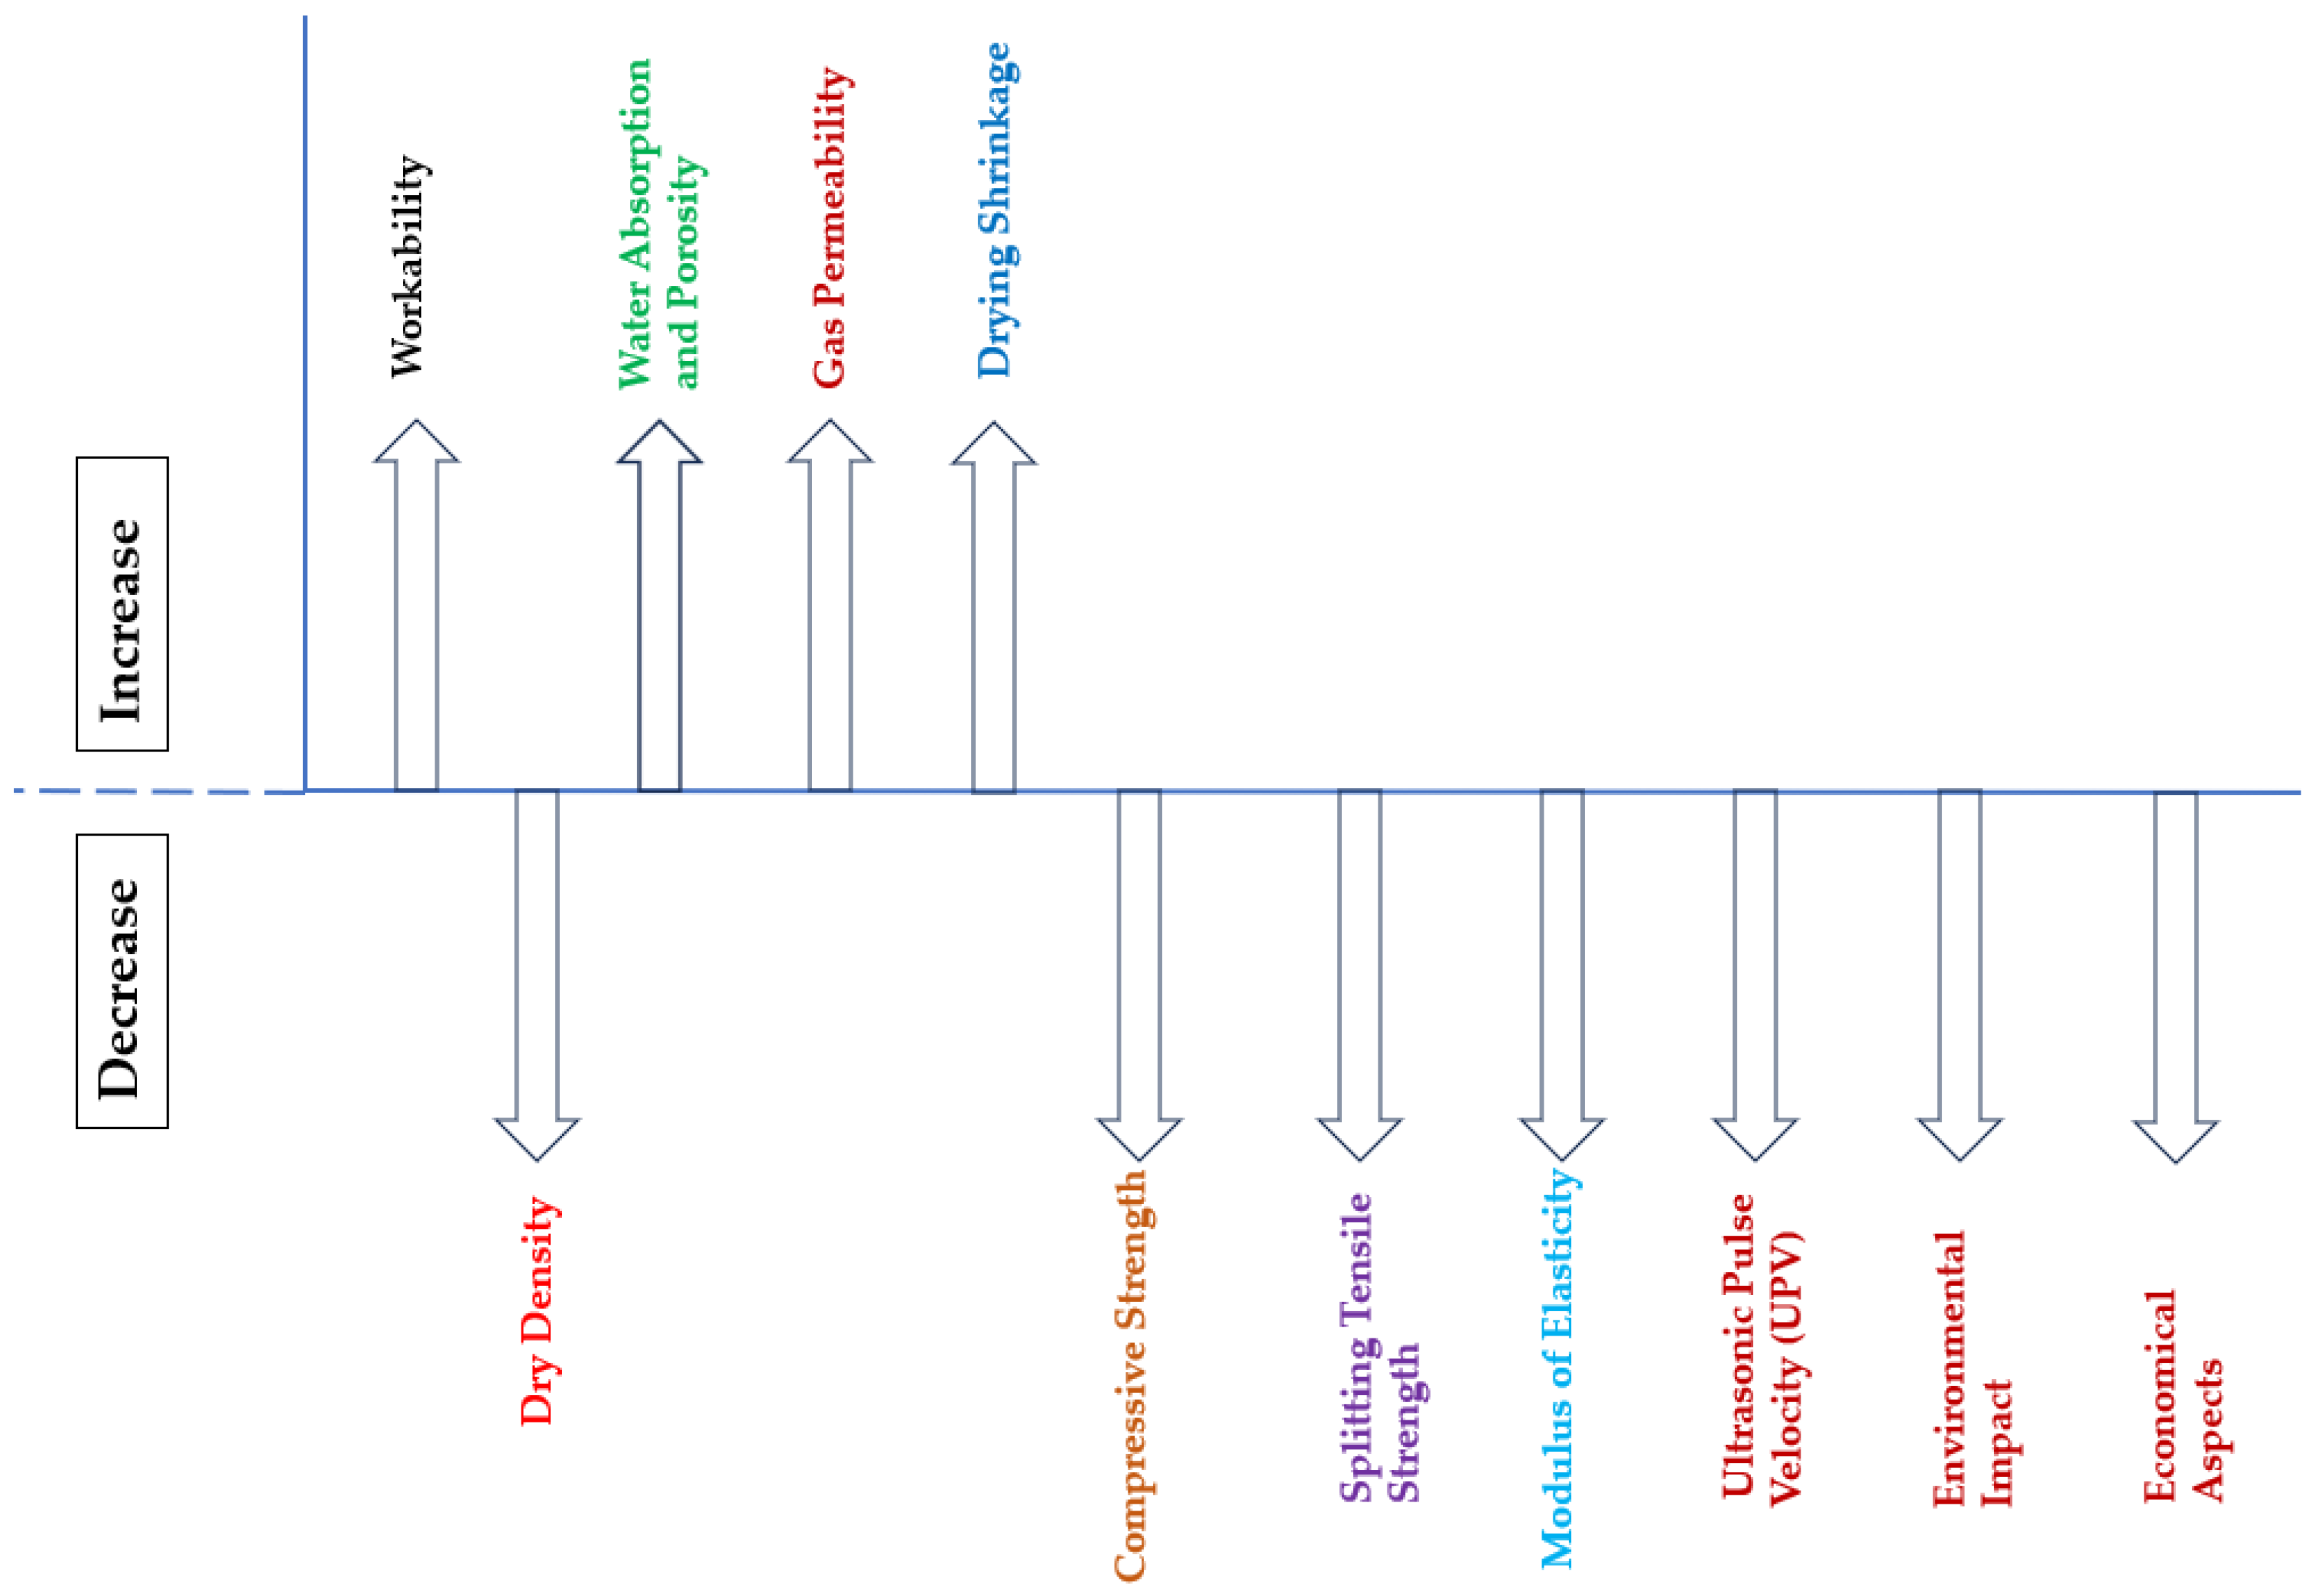
  • The investigation reveals that using waste marble (WM) as a cement replacement for better utilization and influence depends on three essential factors for application in concrete production. First, the chemical composition affects the mechanical behavior and durability of concrete over time. Second, the grain size positively influences concrete workability. Finally, the water demand is related to the water absorption of the marble itself. It can be observed that the smaller the marble waste particles and the more similar the chemical composition is to cement, the higher the replacement dosage that can be effectively applied. However, considering the higher hydraulicity of cement and its pozzolanic properties, more than a 10% replacement dosage of cement can significantly impact the rheological behavior and reduce the mechanical and durability properties of the concrete.
  • Both WM and limestone filler (LF) can be utilized at specific dosages (8–10% by volume of cement and 4% by volume of the overall concrete mix) to maintain the same properties as reference OPC concrete. Further increases in cement reduction negatively impact the concrete’s properties.
  • The use of mining site waste marble (MSWM) as a replacement for cement and sand reduced dry density, resulting in lightweight and cost-effective concrete.
  • Workability improved with the application of both WM and LF as cement replacements because the water demand and specific gravity of both powders are lower than that of OPC.
  • The water absorption coefficient and porosity of concrete samples containing WM gradually increased with the increase in WM dosage due to changes in pore structure.
  • The results of applying Digital Image Correlation (DIC) techniques for strain measurements were consistent with the strain measurements collected from the strain gauges, showing excellent agreement.
  • As the incorporation dosage of waste increased, the mechanical properties decreased due to the reduction in cement content and increased porosity.
  • The mechanical properties did not change significantly until a specific dosage, with 8% cement and 13% sand replacement by waste marble. Similarly, when LF was used for up to 8% cement replacement, the variation in mechanical properties was minimal. Due to the high fineness and micro-filler properties of limestone filler, the strength reduction in the specimens with limestone filler was less pronounced compared to those with waste marble powder.
  • Gas permeability gradually increased for both concrete specimens containing WM and LF due to the increase in porosity values.
  • Utilizing waste marble in mortar/concrete production helps to create a safer environment by reducing waste, benefiting both human and plant life.
  • Finally, based on the results of various experiments, the correlations between cementitious mixtures and concrete properties demonstrate good accuracy. This means that certain properties of such types of mortar/concrete can be predicted based on other behaviors. Additionally, the trends in the research results were compared with the work of other researchers to refine the accuracy of the conducted study.

Author Contributions

Methodology, formal analysis, and validation, E.G.; investigation, software, and writing, M.R.R. and S.O.; resources and visualization, A.F.; supervision, E.G. and A.F. All authors have read and agreed to the published version of the manuscript.

Funding

This research received no external funding.

Institutional Review Board Statement

Not applicable.

Informed Consent Statement

Not applicable.

Data Availability Statement

The data presented in this research are available upon request from the corresponding author.

Acknowledgments

The authors thank the technical team of the L2MGC and the KPU, COUSTURE, CRISTOFOL, CHAUMONT, and WASSERMANN, for their help and their valuable advice and training. Moreover, the authors sincerely appreciate the technical support and raw material contributions of M. Pascal “Gonnon”, of OMYA France.

Conflicts of Interest

The authors declare no conflicts of interest.

References

  1. Ministry of Mining and Petroleum of Afghanistan. Series Price of Marble in Afghanistan, Kabul, Afghanistan. 2019. Available online: https://momp.gov.af/sites/default/files/momp_-_investment_opportunities_-_extractive_industry_afghanistan-min.pdf (accessed on 27 December 2024).
  2. Shirule, P.A.; Rahman, A.; Gupta, R.D. Partial Replacement of Cement With Marble Dust Powder. Int. J. Adv. Eng. Res. Stud. 2012, 1, 2249. [Google Scholar]
  3. Aruntas, H.Y.; Gürü, M.; Dayı, M.D.; Tekin, I. Utilization of waste marble dust as an additive in cement production. Mater. Des. 2010, 31, 4039–4042. [Google Scholar] [CrossRef]
  4. Aukour, F.J. Incorporation of marble sludge in industrial building eco-blocks or cement bricks formulation. Jordan J. Civ. Eng. 2009, 3, 58–65. [Google Scholar]
  5. Rajgor, M.B.; Patel, N.C.; Pitroda, P.J. A Study on marble waste management: Opportunities and challenges in current age for making value. In Proceedings of the National Conference CRDCE13, Vasad, India, 20–21 December 2013; pp. 1–9. [Google Scholar]
  6. Almeida, N.; Branco, F.; Santos, J.R. Recycling of stone slurry in industrial activities: Application to concrete mixtures. Build. Environ. 2007, 42, 810–819. [Google Scholar] [CrossRef]
  7. Rana, A.; Kalla, P.; Verma, H.K.; Mohnot, J.K. Recycling of dimensional stone waste in concrete: A review. J. Clean. Prod. 2016, 6, 1–59. [Google Scholar] [CrossRef]
  8. MSME Development Institute. Status Report on Commercial Utilization of Marble Slurry in Rajasthan; Government of India: Jaipur, India, 2008. [Google Scholar]
  9. Majeed, M.; Khitab, A.; Anwar, W.; Bilal, R.; Khan, N. Evaluation of Concrete with Partial Replacement of Cement by Waste Marble Evaluation of Concrete with Partial Replacement of Cement by Waste Marble Powder. Civ. Eng. J. 2021, 7, 59–70. [Google Scholar] [CrossRef]
  10. Hafiz, S.S.; Malhotra, E.S.; Singh, E.T. Experimental Analysis of Addition of Marble Waste Dust Powder Partially Replacing Cement. Int. Res. J. Eng. Technol. 2019, 6, 487–491. [Google Scholar]
  11. Vardhan, K.; Goyal, S.; Siddique, R.; Singh, M. Mechanical properties and microstructural analysis of cement mortar incorporating marble powder as partial replacement of cement. Constr. Build. Mater. 2015, 96, 615–621. [Google Scholar] [CrossRef]
  12. Rafi, M.R.; Omary, S.; Ghorbel, E.; Faqiri, A. Cement Reduction and Strength Development_compressed.pdf. In Advances in Materials, Mechanics and Manufacturing II; Springer International Publishing: Berlin/Heidelberg, Germany, 2021; pp. 11–21. [Google Scholar]
  13. NF EN 196-3; Méthodes D’Essais des Ciments—Partie 3: Détermination du Temps de Prise et de la Stabilité. AFNOR: Paris, France, 2009.
  14. NF EN 12620+A1; Aggregates for Concrete. Afnor, Saga Web: Paris, France, 2008.
  15. ILNAS-EN 12390-3; Essais pour Béton Durci—Partie 3: Résistance à la Compression des Éprouvettes. Afnor, Saga Web: Paris, France, 2012.
  16. ACI 211; Standard Practice for Selecting Proportions for Normal, Heavyweight, and Mass Concrete. American Concrete Institute: Farmington Hills, MI, USA, 2002.
  17. NF EN 12350-2; Tests for Fresh Concrete—Part 2: Slump Test. AFNOR: Paris, France, 2012.
  18. NF EN 196-1; Cement Test Methods—Part 1: Determination of Strengths. Afnor, Saga Web: Paris, France, 2016.
  19. NF P18-459; Concrete—Testing Porosity and Density. AFNOR: Paris, France, 2010; p. 11.
  20. XP 18-463; Concrete—Gas Permeability Test on Hardened Concrete. AFNOR: Paris, France, 2011.
  21. ASTM C426-16; Standard Test Method for Linear Drying Shrinkage of Concrete Masonry Units. ASTM International: West Conshohocken, PA, USA, 2016. Available online: https://www.astm.org/Standards/C426.htm (accessed on 27 December 2024).
  22. NF EN 12390-6; Tests for Hardened Concrete—Part 6: Determination of Tensile Strength by Splitting Test Specimens. AFNOR: Paris, France, 2012.
  23. ASTM C597-09; Standard Test Method for Pulse Velocity Through Concrete. ASTM International: West Conshohocken, PA, USA, 2009. Available online: https://www.astm.org/Standards/C597.htm (accessed on 27 December 2024).
  24. Sharma, A.K.; Mishra, N.; Gupta, S. Waste Marble Dust As a Partial Replacement of Cement and Fine. J. Crit. Rev. 2019, 6, 2633–2639. [Google Scholar]
  25. Okamura, H.; Ouchi, M. Self Compacting Concrete—Research Paper; Elsevier: Amsterdam, The Netherlands, 2014; pp. 1–34. [Google Scholar]
  26. Brouwers, H.J.H.; Radix, H. Self-Compacting Concrete: Theoretical and experimental study. Cem. Concr. Res. 2005, 35, 2116–2136. [Google Scholar] [CrossRef]
  27. Bheel, N.; Kalhoro, K.A.; Memon, T.A.; Lashari, Z.-Z.; Soomro, M.A.; Memon, U.A. Use of Marble Powder and Tile Powder as Cementitious Materials in Concrete. Eng. Technol. Appl. Sci. Res. 2020, 10, 5448–5451. [Google Scholar] [CrossRef]
  28. Rodrigues, R.; De Brito, J.; Sardinha, M. Mechanical properties of structural concrete containing very fine aggregates from marble cutting sludge. Constr. Build. Mater. 2015, 77, 349–356. [Google Scholar] [CrossRef]
  29. Vardhan, K.; Siddique, R.; Goyal, S. Strength, permeation and micro-structural characteristics of concrete incorporating waste marble. Constr. Build. Mater. 2019, 203, 45–55. [Google Scholar] [CrossRef]
  30. Djebri, N.; Rahmouni, Z.E.; Belagraa, L. Experimental Investigation on the Effect of Marble Powder on the Performance of Self-Compacting Concrete (SCC). Min. Sci. 2017, 24, 183–194. [Google Scholar] [CrossRef]
  31. Khodabakhshian, A.; de Brito, J.; Ghalehnovi, M.; Asadi Shamsabadi, E. Durability performance of structural concrete containing silica fume and marble industry waste powder. Constr. Build. Mater. 2018, 170, 42–60. [Google Scholar] [CrossRef]
  32. Boukhelkhal, A.; Azzouz, L.; Benabed, B.; Belaïdi, A. Strength and durability of low-impact environmental self-compacting concrete incorporating waste marble powder. Build. Mater. Struct. 2017, 4, 31–41. [Google Scholar] [CrossRef]
  33. Kameche, Z.E.-A.; Ghomari, F.; Khelidj, A.; Choinska, M. Relative permeability as an indicator of durability: Influence of the hydric state of the concrete and the size of the specimens. In Proceedings of the Rencontres Universitaires de Génie Civil, Chambéry, France, 6–8 June 2012. [Google Scholar]
  34. Rabehi, M. Apport à la Caractérisation de la Porosité Ouverte du Béton D’Enrobage par L’Utilisation des Tests D’Absorption Capillaire. Master’s Thesis, Université Mohamed Khider Biskra, Biskra, Algeria, 2014. [Google Scholar]
  35. Rose, W.D. Permeability and gas slippage phenomena. In Drilling and Production Practices; Am. Pet. Inst.: Washington, DC, USA, 1984; pp. 209–217. [Google Scholar]
  36. Sardinha, M.; de Brito, J.; Rodrigues, R. Durability properties of structural concrete containing very fine aggregates of marble sludge. Constr. Build. Mater. 2016, 119, 45–52. [Google Scholar] [CrossRef]
  37. Choudhary, R.; Gupta, R.; Nagar, R.; Jain, A. Mechanical and abrasion resistance performance of silica fume, marble slurry powder, and fly ash amalgamated high strength self-consolidating concrete. Constr. Build. Mater. 2021, 269, 121282. [Google Scholar] [CrossRef]
  38. Choudhary, R.; Gupta, R.; Nagar, R. Impact on fresh, mechanical, and microstructural properties of high strength self-compacting concrete by marble cutting slurry waste, fly ash, and silica fume. Constr. Build. Mater. 2020, 239, 117888. [Google Scholar] [CrossRef]
  39. Munir, M.J.; Kazmi, S.M.S.; Wu, Y.-F. Efficiency of waste marble powder in controlling alkali—Silica reaction of concrete: A sustainable approach. Constr. Build. Mater. 2017, 154, 590–599. [Google Scholar] [CrossRef]
  40. Eurocode2. Design of concrete structures_Part 1-1 General rules and rules for buildings. In Design of Concrete Structures_Part 1-1 General Rules and Rules for Buildings; AFNOR: Paris, France, 2004.
  41. Parmar, S.; Das, S.K. Effect of marble slurry as a partial substitution of ordinary Portland cement in lean concrete mixes. Struct. Concr. 2021, 22, E514–E527. [Google Scholar] [CrossRef]
  42. Khodabakhshian, A.; de Brito, J.; Ghalehnovi, M.; Asadi Shamsabadi, E. Mechanical, environmental and economic performance of structural concrete containing silica fume and marble industry waste powder. Constr. Build. Mater. 2018, 169, 237–251. [Google Scholar] [CrossRef]
  43. Nežerka, V.; Hrbek, V.; Somr, M.; Tesárek, P.; Fládr, J.; Prošek, Z. Micromechanical characterization and modeling of cement pastes containing waste marble powder. J. Clean. Prod. 2018, 195, 1081–1090. [Google Scholar] [CrossRef]
  44. Kabeer, K.I.S.A.; Vyas, A.K. Utilization of marble powder as fine aggregate in mortar mixes. Constr. Build. Mater. 2018, 165, 321–332. [Google Scholar] [CrossRef]
  45. Aliabdo, A.A.; Abd Elmoaty, A.E.M.; Auda, E.M. Re-use of waste marble dust in the production of cement and concrete. Constr. Build. Mater. 2014, 50, 28–41. [Google Scholar] [CrossRef]
  46. Singh, M.; Srivastava, A.; Bhunia, D. An investigation on effect of partial replacement of cement by waste marble slurry. Constr. Build. Mater. 2017, 134, 471–488. [Google Scholar] [CrossRef]
  47. Demirel, B. The effect of the using waste marble dust as fine sand on the mechanical properties of the concrete. Int. J. Phys. Sci. 2010, 5, 1372–1380. [Google Scholar] [CrossRef]
Figure 1. Practical size distribution of raw materials.
Buildings 15 00164 g001
Figure 2. Concrete slump flow as function of WMP and LF amount.
Buildings 15 00164 g002
Figure 3. SEM images of raw materials at the same zooming degrees. (a) Natural sand, (b) Marble sand (c) GHORI cement, (d) Marble powder, (e) Limestone filler.
Buildings 15 00164 g003
Figure 4. Evolution of the relative spread as a function of (VW/VP) for cement + WM, where (VW) is the volume of water and VP is the volume of powder.
Buildings 15 00164 g004
Figure 5. Evolution of the relative spread as a function of (VW/VP) for cement + LF, where (VW) is the volume of water, VP is the volume of powder, and LF is limestone filler.
Buildings 15 00164 g005
Figure 6. Average hardened density of concrete specimens at 28 days of age versus WM incorporation ratio.
Buildings 15 00164 g006
Figure 7. Porosity and water absorption of concrete samples with and without WMP.
Buildings 15 00164 g007
Figure 8. SEM digital images of concrete specimens with and without WM. (a) Reference concrete sample surface topography, (b) reference concrete sample profile morphology, (c) 3.5% WM concrete sample surface topography, (d) 3.5% WM concrete sample profile morphology, (e) 4% WM concrete sample surface topography, (f) 4 % WM concrete sample profile morphology, (g) 4.5% WM concrete sample surface topography, (h) 4.5% WM concrete sample profile morphology.
Buildings 15 00164 g008aBuildings 15 00164 g008b
Figure 9. Diagram illustrating the evolution of the apparent permeability (KApp) as a function of the inverse of the mean pressure (Pm), where (β) is the Klingenberg coefficient and (Kint) is the intrinsic permeability.
Buildings 15 00164 g009
Figure 10. Apparent permeability (KApp) obtained using the Klingenberg equation and determination of the intrinsic permeability (Kint). (a) Apparent permeability of reference concrete for three samples, (b) average of three samples’ apparent permeability for the reference concrete, (c) apparent permeability of 3.5% WM valorized concrete for three samples, (d) average of three samples’ apparent permeability for the 3.5% WM valorized concrete, (e) apparent permeability of 4% WM valorized concrete for three samples, (f) average of three samples’ apparent permeability for the 4% WM valorized concrete, (g) apparent permeability of 4.5% WM valorized concrete for three samples, (h) average of three samples’ apparent permeability for the 4.5% WM valorized concrete.
Buildings 15 00164 g010
Figure 11. (a) Evolution of intrinsic permeability for concrete formulations with and without marble waste. (b) Intrinsic permeability as a function of different W/C ratios.
Buildings 15 00164 g011
Figure 12. Effects of curing conditions on the Klingenberg coefficients of the different concretes studied (28 days).
Buildings 15 00164 g012
Figure 13. Concrete pore digital microscopic images. (a) Reference concrete sample; (b) 3.5% WM valorized concrete sample; (c) 4% WM valorized concrete sample; (d) 4.5% WM valorized concrete sample.
Buildings 15 00164 g013
Figure 14. (a) Pore diameter size within concrete specimens. (b) Total pore area in 176.6 cm2 concrete surface cross-section as function of total waste marble incorporation ratio.
Buildings 15 00164 g014
Figure 15. (a) Evolution of the shrinkage of WM concretes as a function of time; (b) evolution of the shrinkage of LF concretes as a function of time.
Buildings 15 00164 g015
Figure 16. Cement reduction effects on drying shrinkage of WM and LF concretes.
Buildings 15 00164 g016
Figure 17. SEM coupled with an EDX: (a) reference concrete; (b) 3.5%WM valorized concrete; (c) 4% WM valorized concrete; (d) 4.5% WM valorized concrete at higher magnification. The yellow arrows indicate the direction of the cross-section for the explanation of the materials appearing on the concrete surface.
Buildings 15 00164 g017aBuildings 15 00164 g017bBuildings 15 00164 g017cBuildings 15 00164 g017d
Figure 18. Concrete sample SEM images with EDX mapping at higher magnification. (a) Reference concrete sample’s surface topography; (b) reference concrete sample’s morphology; (c) 3.5% WM valorized concrete sample’s surface topography; (d) 3.5% WM valorized concrete sample’s morphology; (e) 4% WM valorized concrete sample’s surface topography; (f) 4% WM valorized concrete sample’s morphology; (g) 4.5% WM valorized concrete sample’s surface topography; (h) 4.5% WM valorized concrete sample’s morphology.
Buildings 15 00164 g018aBuildings 15 00164 g018b
Figure 19. The stress–strain relationship for the non-linear structural analysis of concrete in compression [40].
Buildings 15 00164 g019
Figure 20. Compressive strength of concrete specimens.
Buildings 15 00164 g020
Figure 21. Splitting tensile strength of concrete specimens.
Buildings 15 00164 g021
Figure 22. SEM digital images of concrete specimens with and without WM. (a) Reference concrete sample’s surface topography; (b) reference concrete sample’s profile morphology; (c) 3.5% WM valorized concrete sample’s surface topography; (d) 3.5% WM valorized concrete sample’s profile morphology; (e) 4% WM valorized concrete sample’s surface topography; (f) 4% WM valorized concrete sample’s profile morphology; (g) 4.5% WM valorized concrete sample’s surface topography; (h) 4.5% WM valorized concrete sample’s profile morphology.
Buildings 15 00164 g022aBuildings 15 00164 g022b
Figure 23. W/C ratio effects on the compressive strength of concrete samples.
Buildings 15 00164 g023
Figure 24. Porosity effects on the compressive strength of WM valorized concrete samples.
Buildings 15 00164 g024
Figure 25. Correlation between stress and strain. (a) Concrete samples with cement replaced by WMP. (b) Concrete samples with cement replaced by LF.
Buildings 15 00164 g025
Figure 26. Correlation between stress and strain utilizing stain gauges. (a) WM valorized concrete; (b) LF valorized concrete.
Buildings 15 00164 g026
Figure 27. Failure patterns of concrete samples under quasi-static uniaxial compression testing. (a) Reference concrete sample; (b) concrete sample with 3.5% WM; (c) concrete sample with 4% WM; (d) concrete sample with 4.5% WM; (e) concrete sample with 6.5% LF; (f) concrete sample with 7.4% LF; (g) concrete sample with 8.3% LF.
Buildings 15 00164 g027
Figure 28. Digital Image Correlation (DIC) techniques for strain measurements. (a) WM valorized concrete; (b) LF valorized concrete.
Buildings 15 00164 g028
Figure 29. Strain measurement comparison via DIC application and strain gauges. (a) Reference concrete sample; (b) 3.5% WM concrete sample; (c) 4% WM concrete sample; (d) 4.5% WM concrete sample; (e) 6.5% LF concrete sample; (f) 7.4% LF concrete sample; (g) 8.3% LF concrete sample.
Buildings 15 00164 g029
Figure 30. Stress–strain curve of concrete samples for the determination of the modulus of elasticity.
Buildings 15 00164 g030
Figure 31. Correlation between the modulus of elasticity and compressive strength of specimens after 28 days.
Buildings 15 00164 g031
Figure 32. UPV of concrete specimens as a function of valorized WM and LF.
Buildings 15 00164 g032
Figure 33. Summary of concrete characteristic trends as a result of cement replacement with marble powder.
Buildings 15 00164 g033
Table 2. Proportion of concrete components for reference and specimens containing WM and LF.
Components (Kg/m3)Density
(Kg/m3)
Mixes Code
Ref.1% LF 1.2% LF 1.3% LF 3.5% WM4% WM4.5% WM
Total marble waste/fillers (Kg)027.8131.7835.7692.52105.74118.95
FWM-LF/cement (%) in volume274006.57.48.36.57.48.3
SWM/aggregates in volume (%)2604000010.311.713.2
GHORI cement (Kg)2904454.5426.69422.72418.74426.69422.72418.74
Water (Kg)1000200199.98199.98199.98199.98199.98199.98
Fine waste marble “FWM”—LF (Kg)2740027.8131.7835.7627.8131.7835.76
Sand waste marble “SWM” (Kg)2604000064.7173.9583.20
Coarse natural aggregate 6.3/20 (Kg)27401028.71028.71028.71028.71028.71028.71028.7
Fine natural aggregate 0/4 (Kg)2580623.24623.24623.24623.24556.85547.54538.23
Super plasticizer (%)11502.272.132.112.092.132.112.09
Approximate air content (%)2.52.52.52.52.52.52.5
Ratio (W/B)0.440.440.440.440.440.440.44
Table 3. The correlation between concrete slump and the mini-cone flow of the mixed paste.
Type of PasteSb (m2/kg)αPβPVW/VP = αpГ + βPConcrete MixSlump
(mm)
GHORI cement2500.5450.799Y = 0.0546X + 0.799Reference 80
GHORI cement + 3% WMP254.170.0540.794y = 0.0545X + 0.79356.5% WMP86
GHORI cement + 6% WMP258.340.0540.786y = 0.0545X + 0.78627.4% WMP87.5
GHORI cement + 9% WMP262.510.0530.768y = 0.0535X + 0.76818.3% WMP92
GHORI cement + 3% LF251.50.0540.796y = 0.0545X + 0.79656.5% WMP81.3
GHORI cement + 6% LF2530.0540.789y = 0.0537X + 0.78957.4% WMP83.8
GHORI cement + 9% LF254.50.0510.784y = 0.0515X + 0.78378.3% WMP85.9
Table 4. Mechanical properties defined in Euro-codes [40].
Concrete ClassesC12/16C16/20C20/25C25/30C30/37C35/45C40/50C45/55C50/60C55/67C60/75C70/85C80/95C90/105
Characteristic resistance to compression on cylinder, fck1216202530354045505560708090
Characteristic resistance to compression on targeted cylinder, fcm2024283338434853586368788898
Characteristic resistance to compression on cube, fck-cube16202530374550556067758595105
Characteristic compressive strength on targeted cube, fcm-cube263035404755606570778595105115
Axial tensile strength, fctm1.61.92.22.62.93.23.53.84.14.24.44.64.85.0
Tensile strength by splitting, fctm, sp1.72.12.52.83.23.63.94.24.54.74.85.15.45.6
Flexural strength, fck-fl2.42.93.33.84.34.85.35.76.16.36.56.97.37.6
The red frame across from C25/30 resistance-class concrete in the above table illustrate the targeted characteristics for the design concrete in this research.
Table 5. Maximum displacement achieved for maximum stress using different methods.
Mixed CodeMaximum Stress (MPa)Compression Machine (mm)Strain Gauges mm/mm ε (%)Digital Image Correlation ε (%)
Ref.28.11.2860.1980.112
3.5% WM27.221.3180.1890.123
4% WM25.461.3070.1730.128
4.5% WM22.4651.3430.40450.097
6.5% LF27.9751.2360.1890.127
7.4% LF27.781.2650.1890.14
8.3% LF25.211.1590.1880.14
Table 6. Young’s modulus of elasticity and Poisson’s ratio of the concrete samples.
Mixed CodeMaximum Strength (MPa)Poisson’s RatioYoung’s Modulus Elasticity (MPa)
Ref.28.100.22728.3
3.5% WM27.220.22928.0
4% WM25.460.2327.8
4.5% WM22.470.25525.7
1% LF27.980.22328.2
1.2% LF27.780.22428.0
1.3% LF25.210.22627.4
Disclaimer/Publisher’s Note: The statements, opinions and data contained in all publications are solely those of the individual author(s) and contributor(s) and not of MDPI and/or the editor(s). MDPI and/or the editor(s) disclaim responsibility for any injury to people or property resulting from any ideas, methods, instructions or products referred to in the content.

