Abstract
Most studies on human–structure interactions have focused on vertical coupling, which refers to the interaction between human bodies and structures in the vertical direction. This study, however, analyzes horizontal coupling. Several experiments on mass–structure and human–structure systems were conducted, and two horizontal-coupling human–structure models are proposed. The experimental results indicate that a stationary human body should not be regarded as a simple mass. As the number of individuals increases, the horizontal self-resonance frequency gradually decreases by approximately 0.2–0.3 Hz, whereas the damping ratio increases. Based on experimental data and horizontal human–structure models, the horizontal frequency ranges of the human body are found to be 0.236–3.748 Hz for front–back motion and 0.194–5.32 Hz for left–right motion. It is proposed that the single-human model and experimental results be extended to crowd–structure interactions.
1. Introduction
With the development of modern architecture, the self-resonant frequency of structures has decreased, leading to increasingly significant human–structure interactions, which can induce severe structural resonance failure [1]. However, due to the complexity of the human body, studying human–structure systems remains an arduous task.
Scholars have primarily focused on the vertical interactions between human and structural systems. Griffin et al. [2] initially analyzed the vertical vibration characteristics of the human body through numerical simulation, establishing a finite element model. The human body vibration frequency was found to be 5–7 Hz. T. Ji [3,4,5], Qingwen Zhang [6,7], and Ding Zhou and Hai Wang [8,9] conducted extensive studies on vertical human models, including two-mass single-degree-of-freedom discrete human models, two-degrees-of-freedom discrete human models, and continuously distributed human models. These theoretical and experimental studies provide significant insights. Yongpu Li developed a four-rigid-body biped walking model [10], while Shoutao Li proposed a 3-DOF human–structure interaction system [11]. Zhihao Wang introduced a widely applicable standing occupant model for analyzing vertical human–structure interactions [12]. Compared with traditional models, these improved models demonstrate enhanced accuracy and applicability. Scholars such as Jianying Chen [13], Hai Wang [9], and Haoxiang He [14] have also established a vertical-coupling system for human–structure models and analyzed the dynamic characteristics of the coupling. Van Nimmen [15] found that for the low-frequency dynamic behavior of footbridges (<6 Hz), the HSI significantly increases the effective damping ratio compared to the inherent damping ratio of an empty structure. In addition, the detailed moving-crowd model can often be approximated by a time-invariant crowd–structure model. Furthermore, the influence of inter- and intra-person variability in step frequency decreases as the impact of the HSI increases. G. Piccardo and K. Van Nimmen [16,17] provide a statistical analysis method for evaluating predicted structural behavior and response. K. Van Nimmen [17] further demonstrated that the HSI effects are most significant under resonant loading, similar to the behavior of a tuned mass damper.
Bassoli [18] analyzed the HSI’s effects on the structural response using linear random dynamics, indicating that the maximum dynamic response of the footbridge can be evaluated through an analytical formulation of the load and the frequency response function (FRF) of a coupled crowd–structure system. The most prominent effect he reported was the increased effective damping ratio, which reduces the structural response. Shahabpoor [19] proposed a novel approach to vibration serviceability assessment (VSA) based on the actual level of vibration experienced by each pedestrian, rather than the typical maximum vibration response at a fixed point. Ahmadi [20] conducted a sensitivity analysis on pedestrian parameters, demonstrating significant effects of pedestrian damping, frequency, and weight, while dynamic load factors and step length had minimal effects.
In summary, research on human–structure interaction has predominantly focused on vertical coupling, whereas horizontal coupling remains underexplored, particularly in experimental contexts. However, structural failure occasioned by horizontal resonance, especially in temporary structures, poses significant risks. Therefore, this study systematically analyzes the horizontal coupling of human–structure systems. Several human–structure experiments were conducted, followed by the development and analysis of two horizontal self-resonant coupling models. The horizontal self-resonant frequency of the human body is estimated, providing reference data for engineering design.
2. Human–Structure Interaction Test
2.1. Test Rig
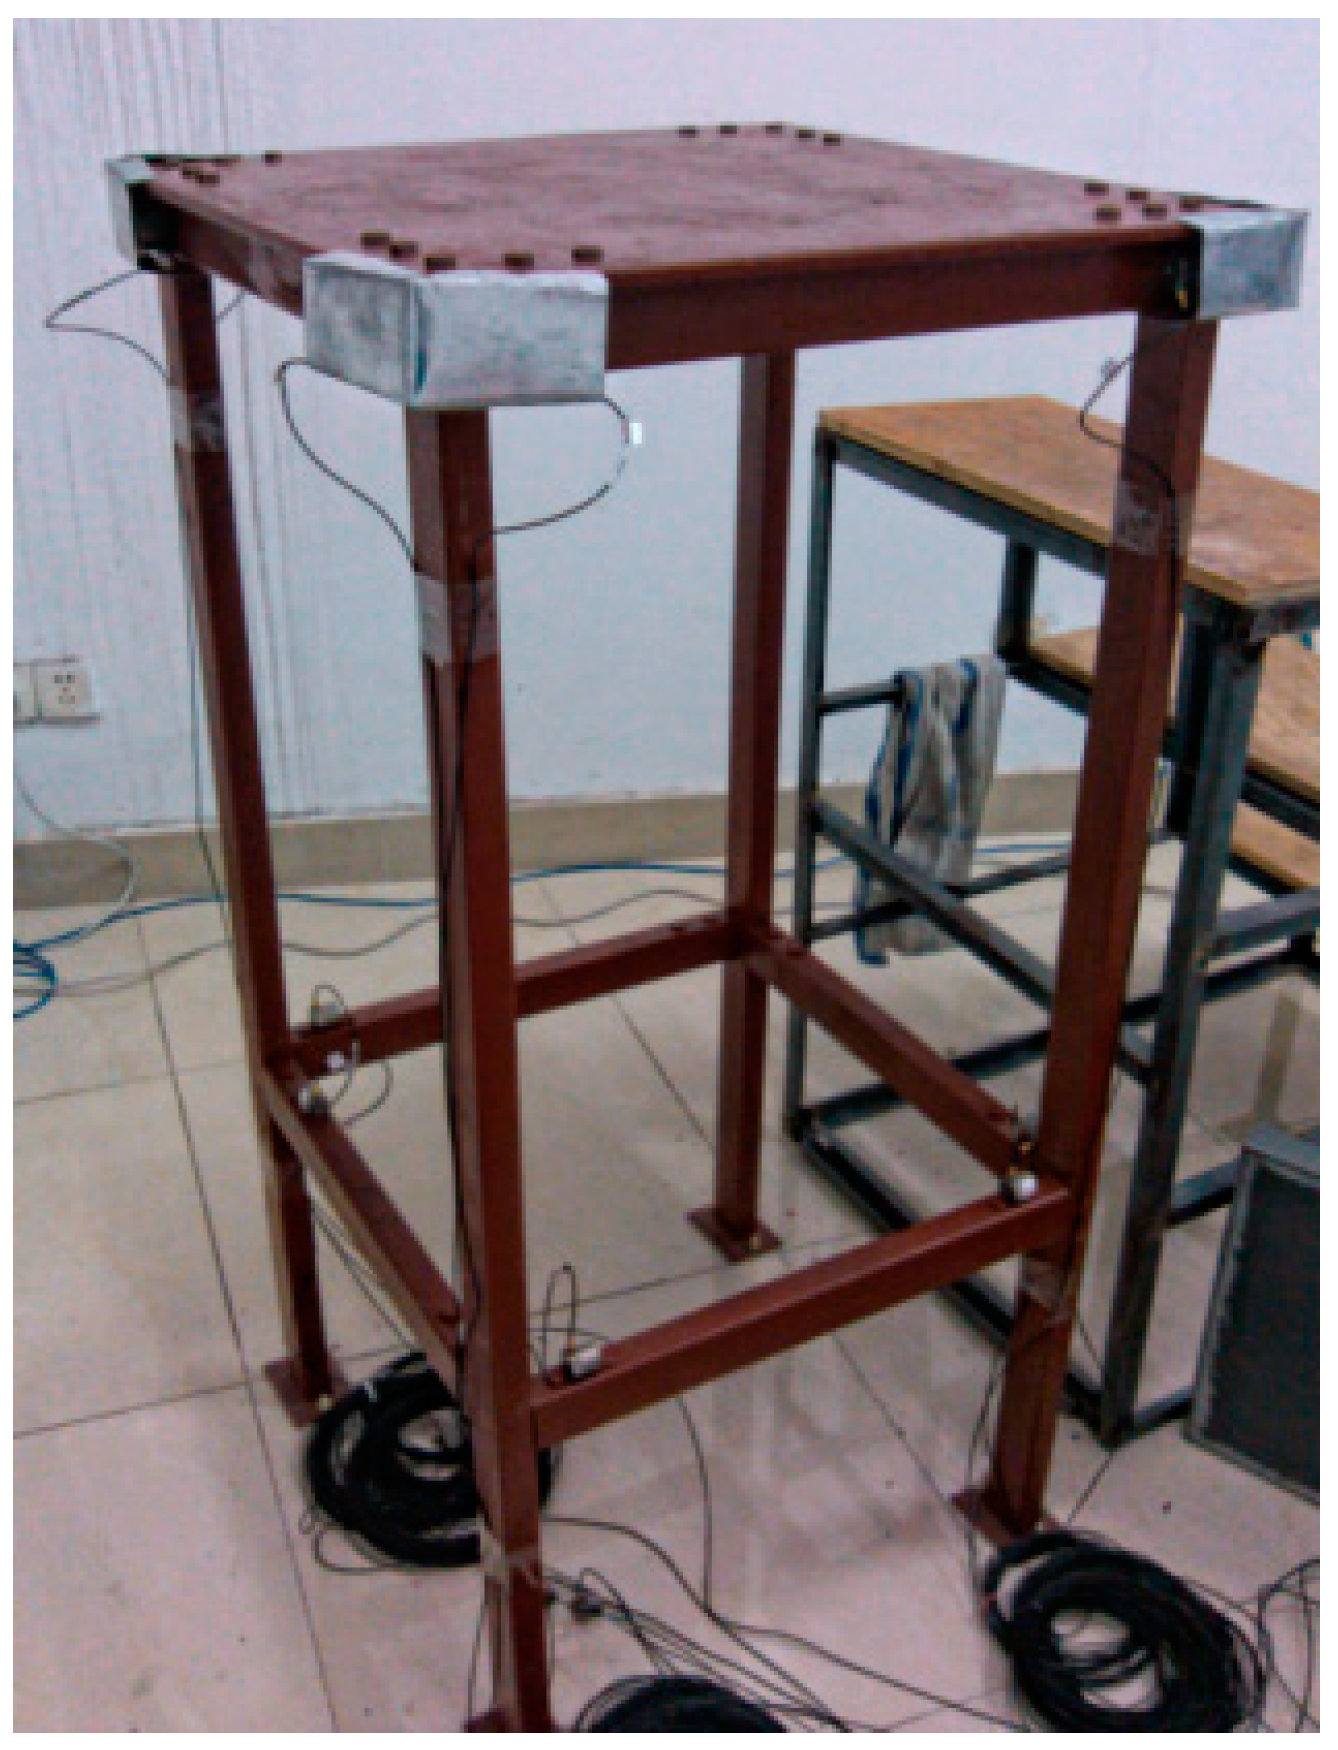
The experimental model, depicted in Figure 1, includes a Q345 steel frame with a height of 1.21 m. The steel beams are hollow cuboids measuring with a thickness of 2 mm. Bolt anchorage is utilized for support. The top steel plate has dimensions of and a thickness of 10 mm. The steel column, also hollow, measures with a height of 1.2 m and a thickness of 2 mm. For clarity, the short side of the column tube’s cross-section is defined as the X-direction, the long edge as the Y-direction, and the vertical direction as the Z-direction.

Figure 1.
Test rig.
The experiment adopts the Danish B&K pulse™ multi-channel analysis system 3560D for data collection and analysis. Four B&K 4381 accelerometers are utilized to acquire acceleration signals with a B&K 2692 amplifier controlling the signal size. The measuring points are positioned on the upper cross-beam along the platform’s diagonal plane.
2.2. Modal Test of the Empty Steel Frame
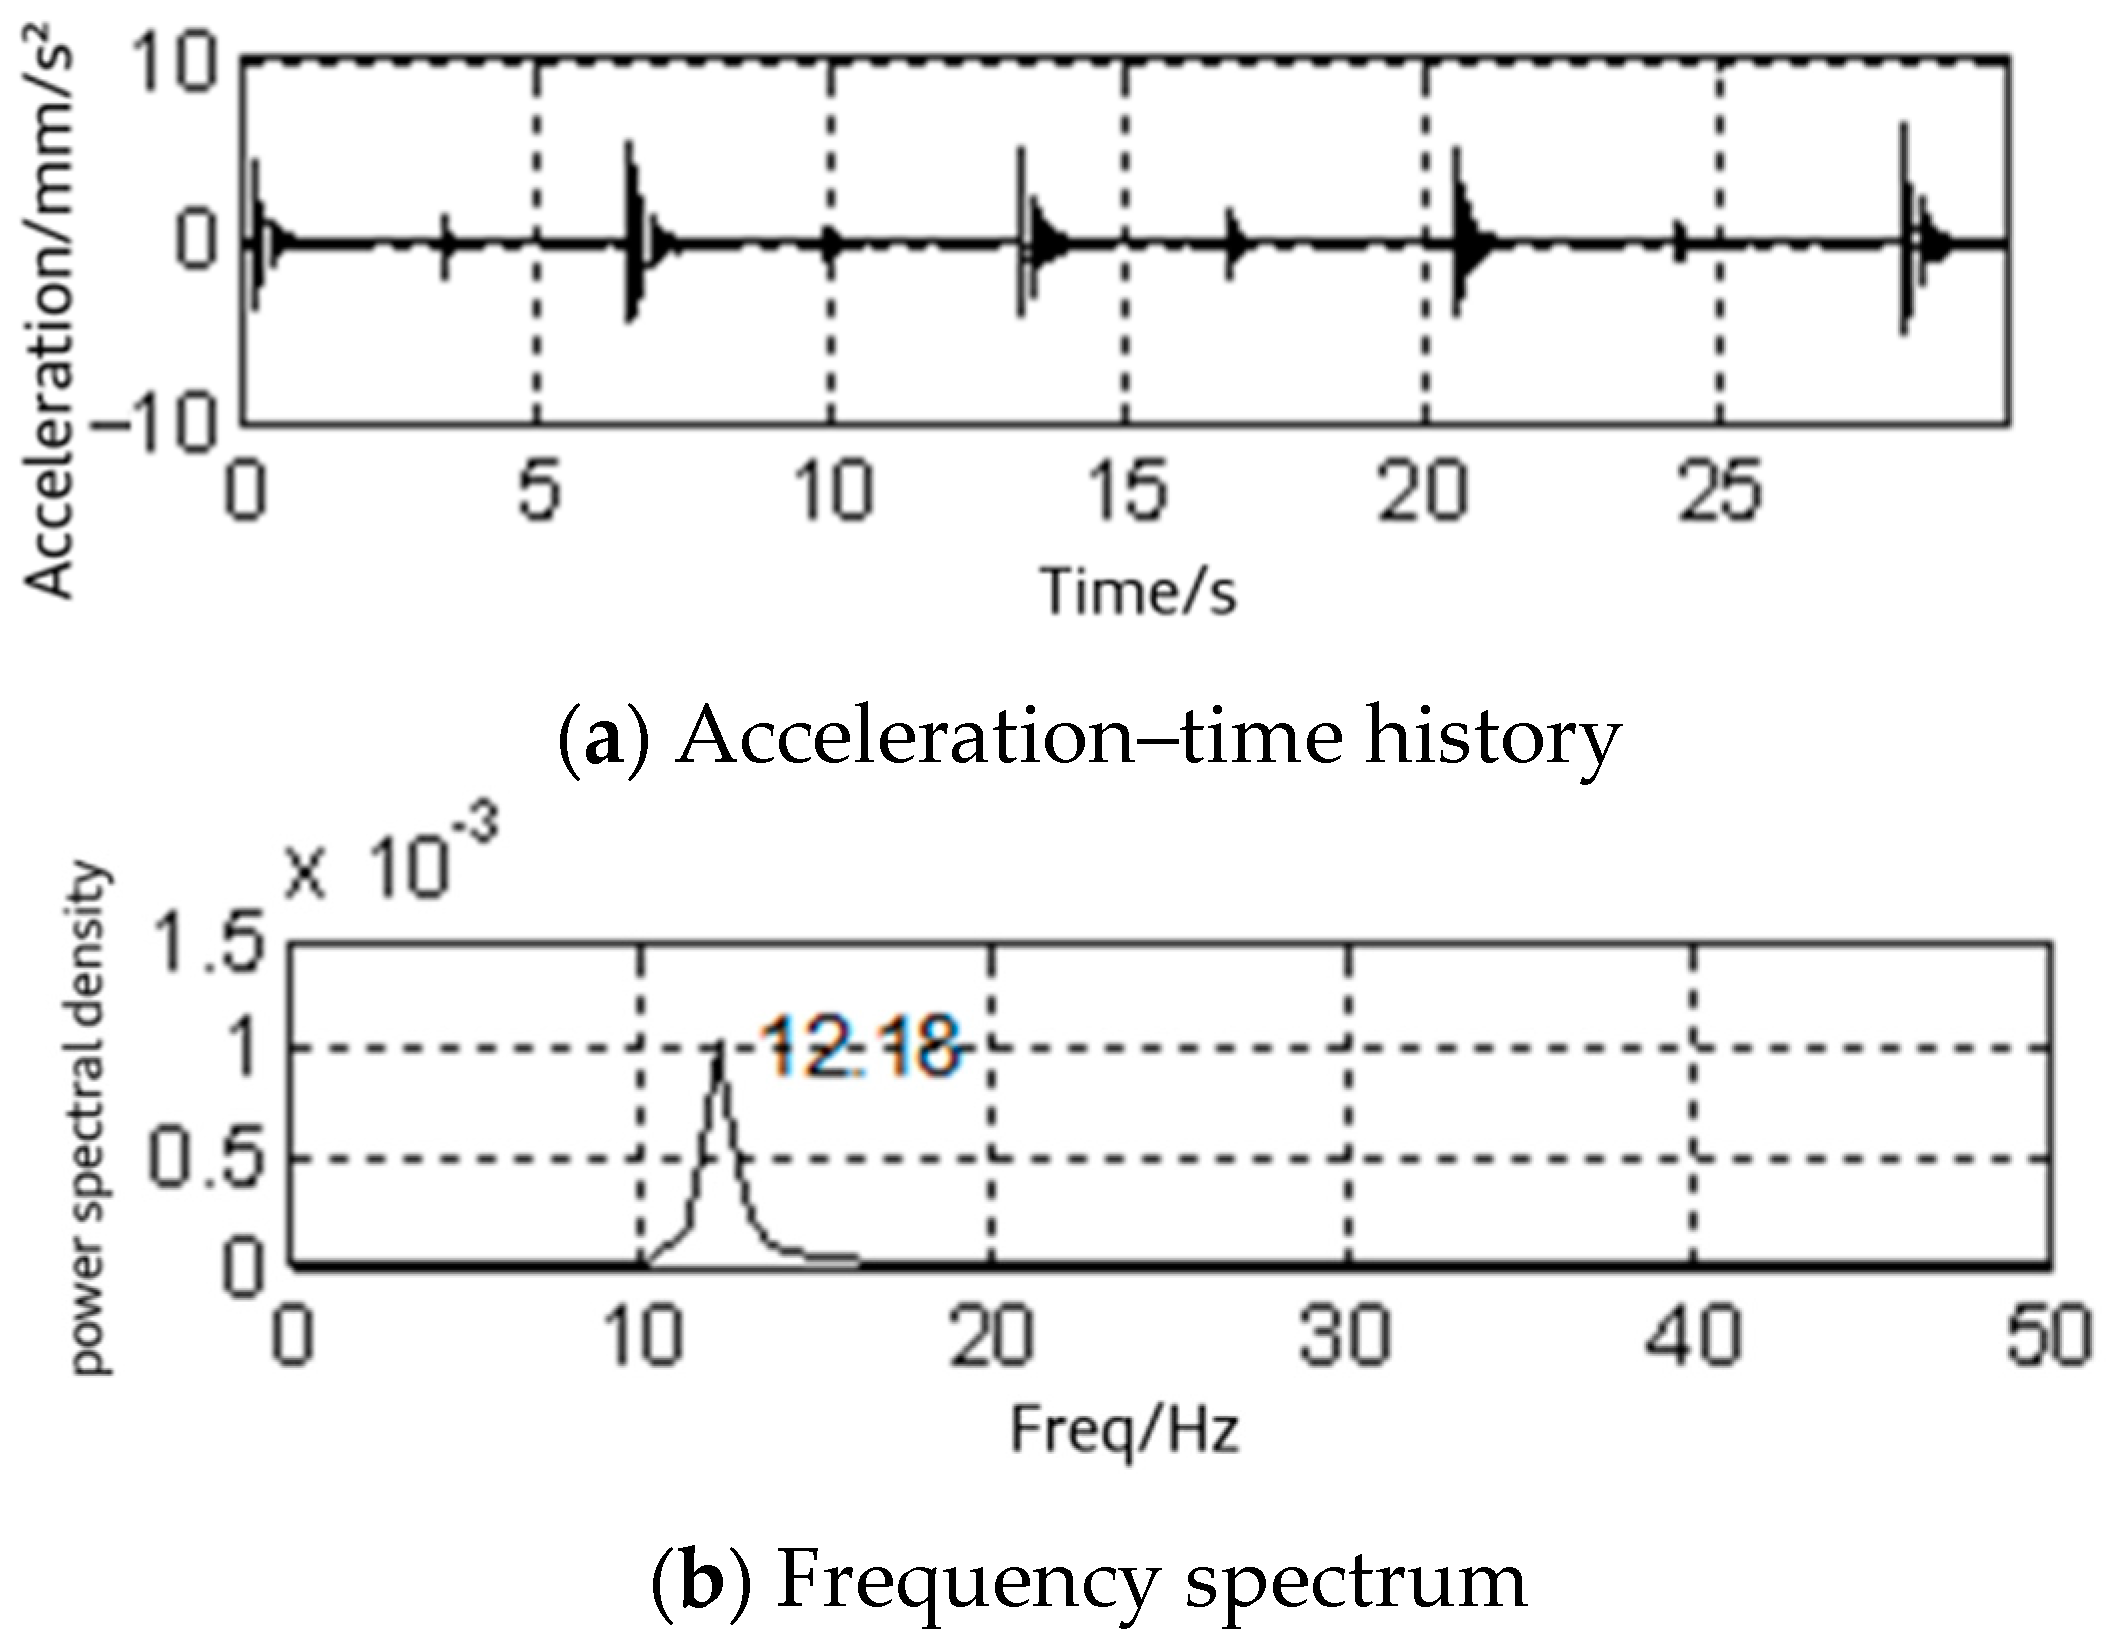
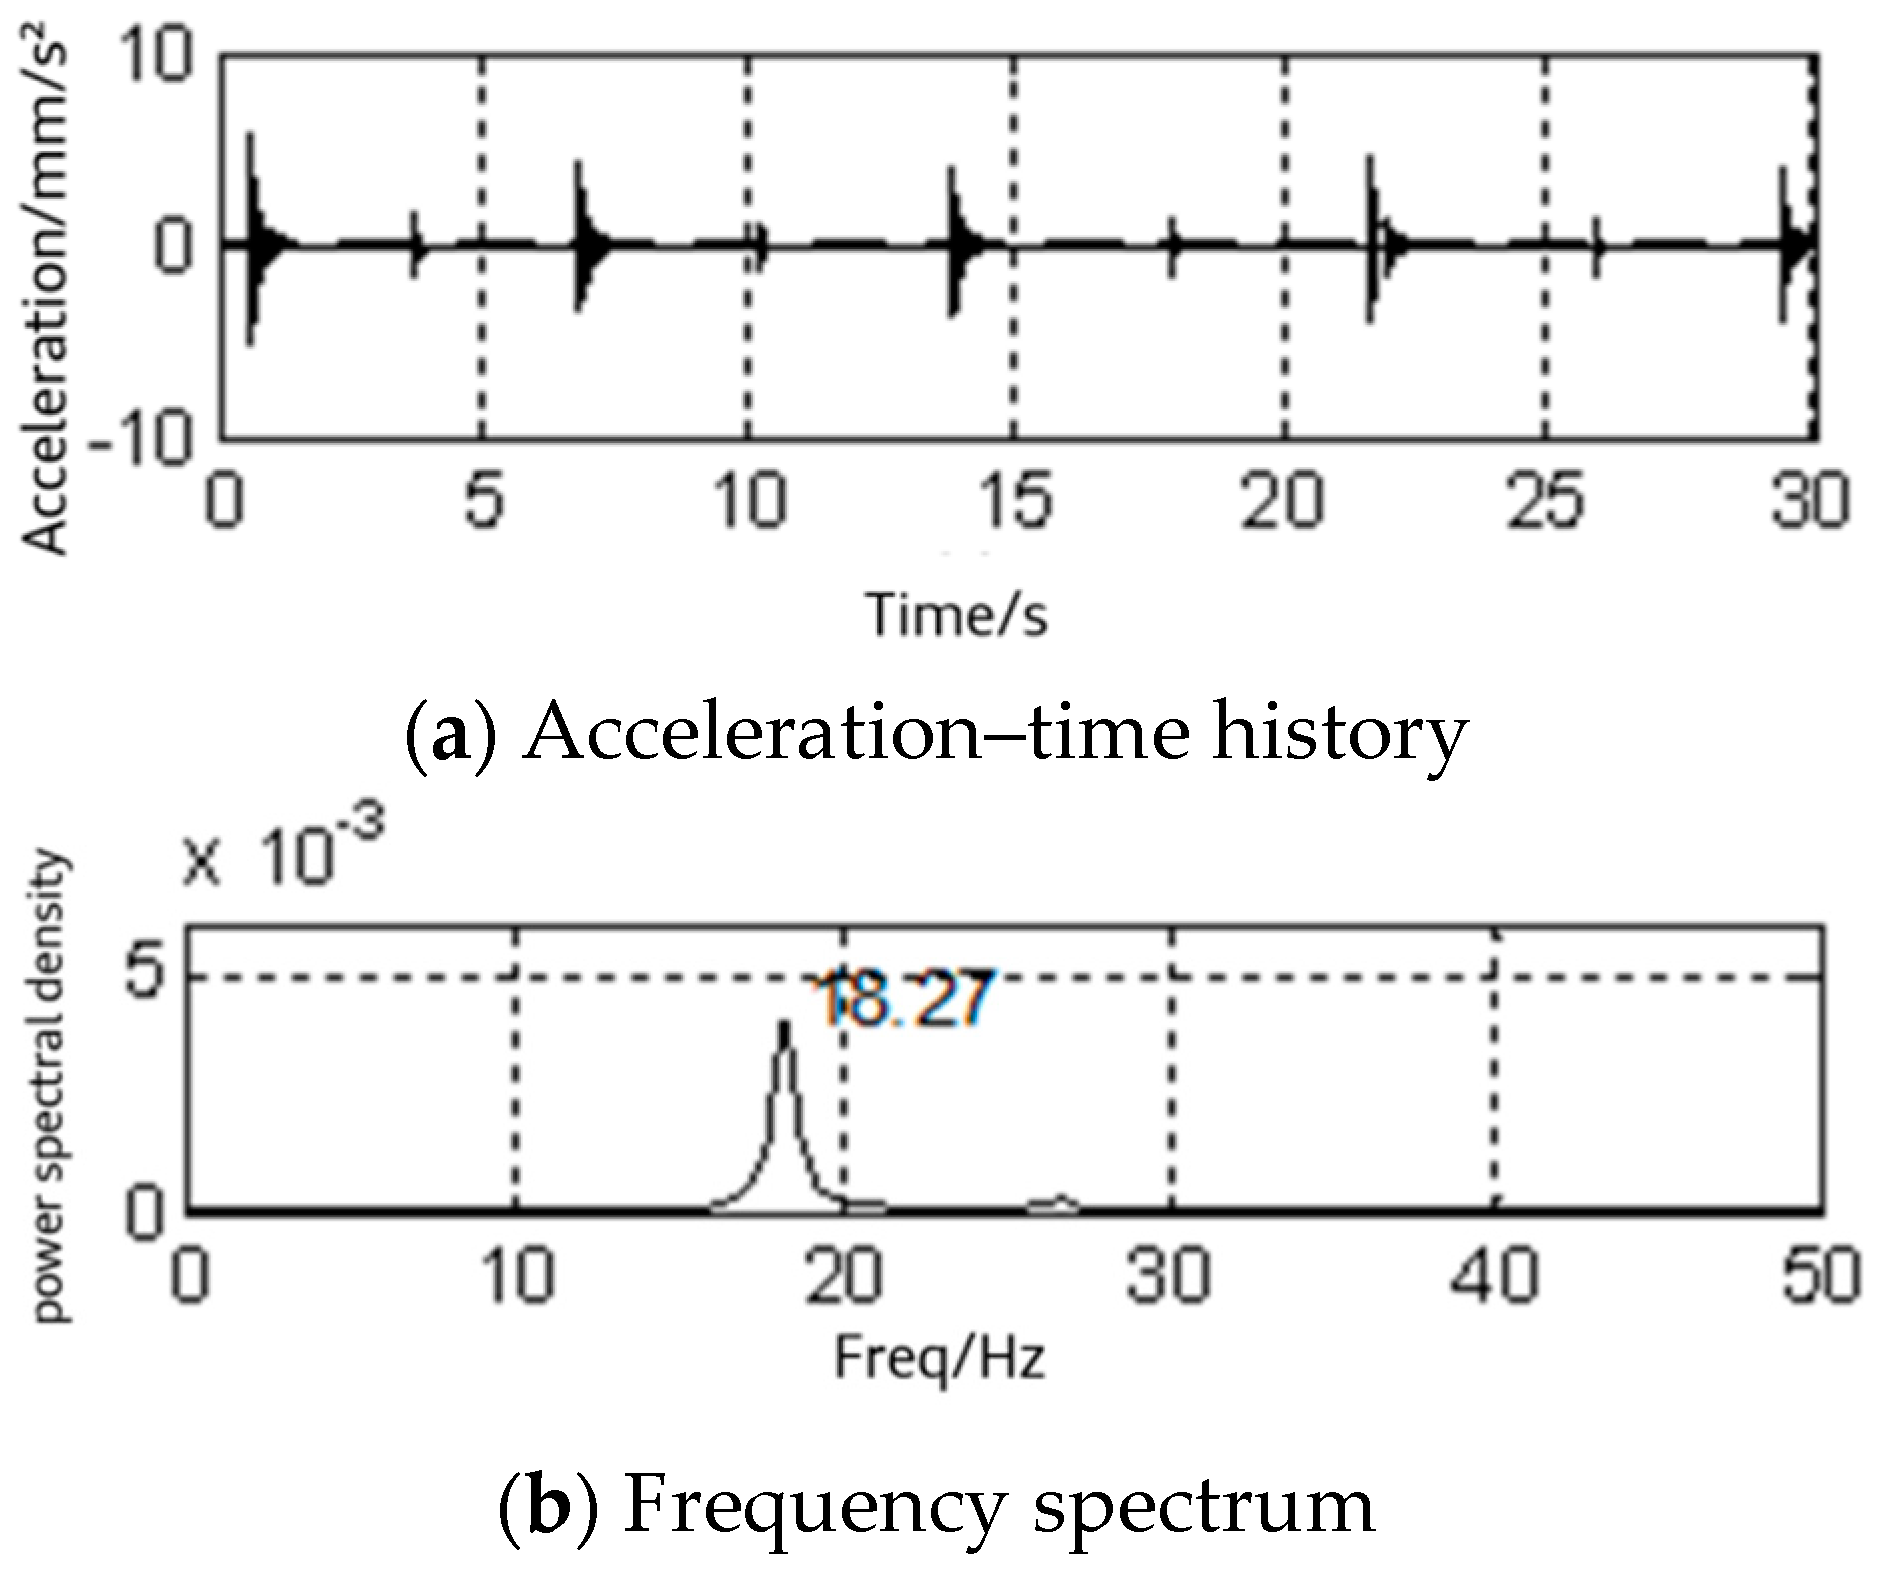
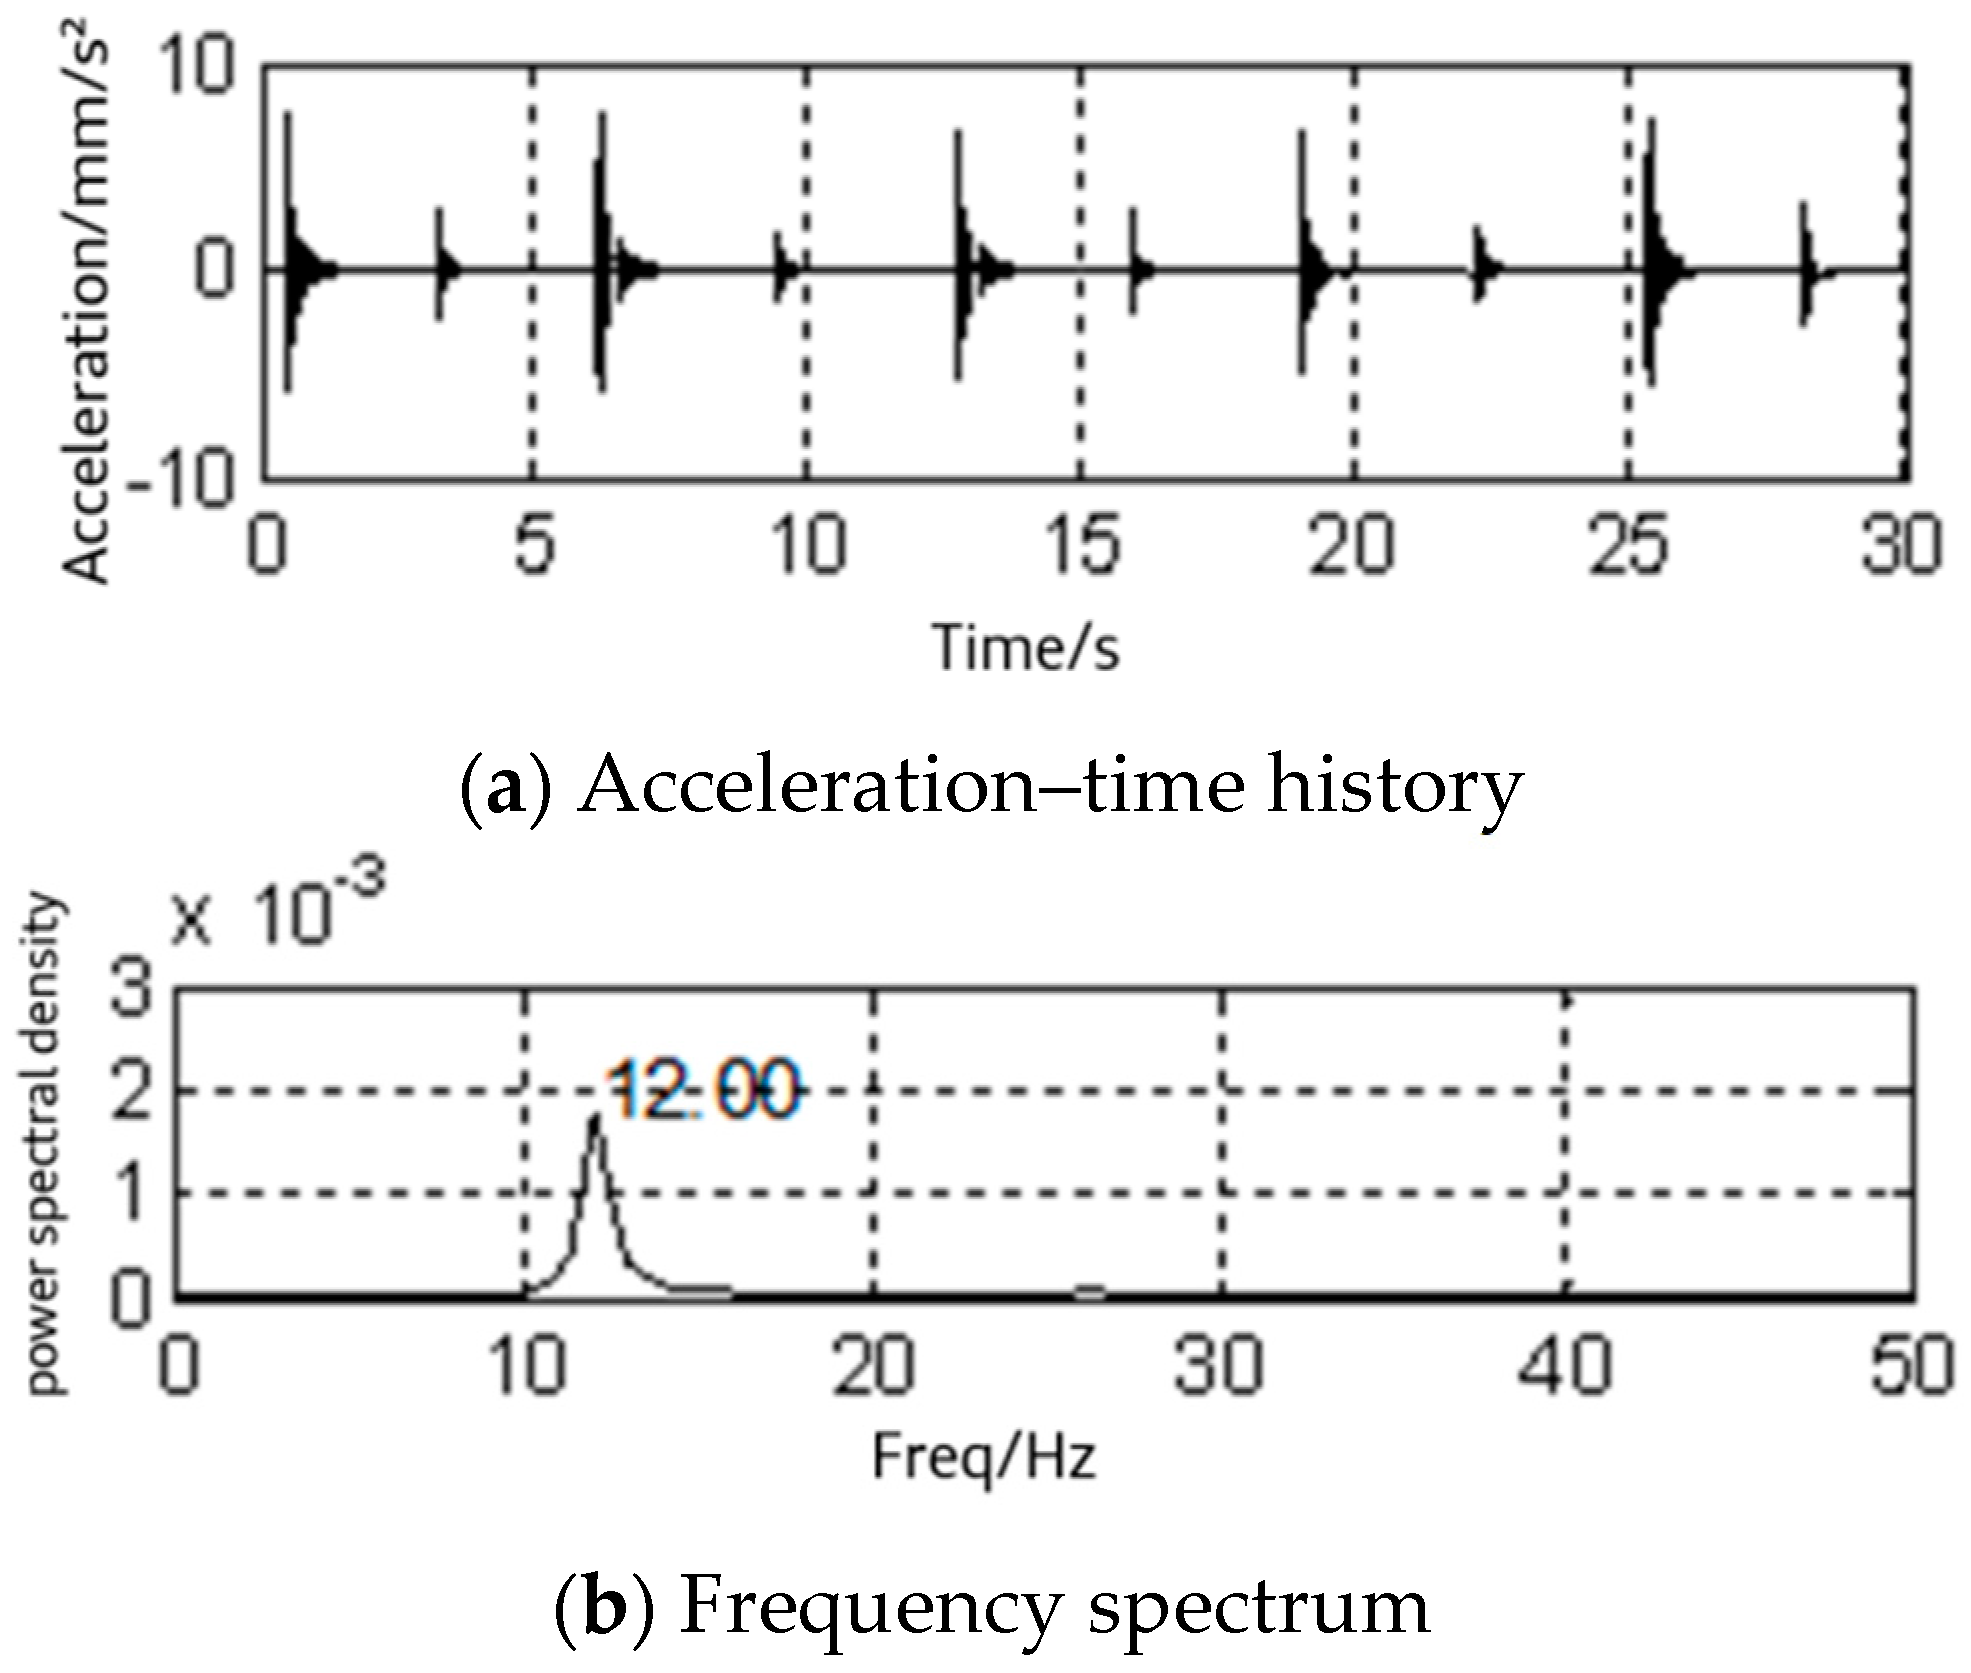
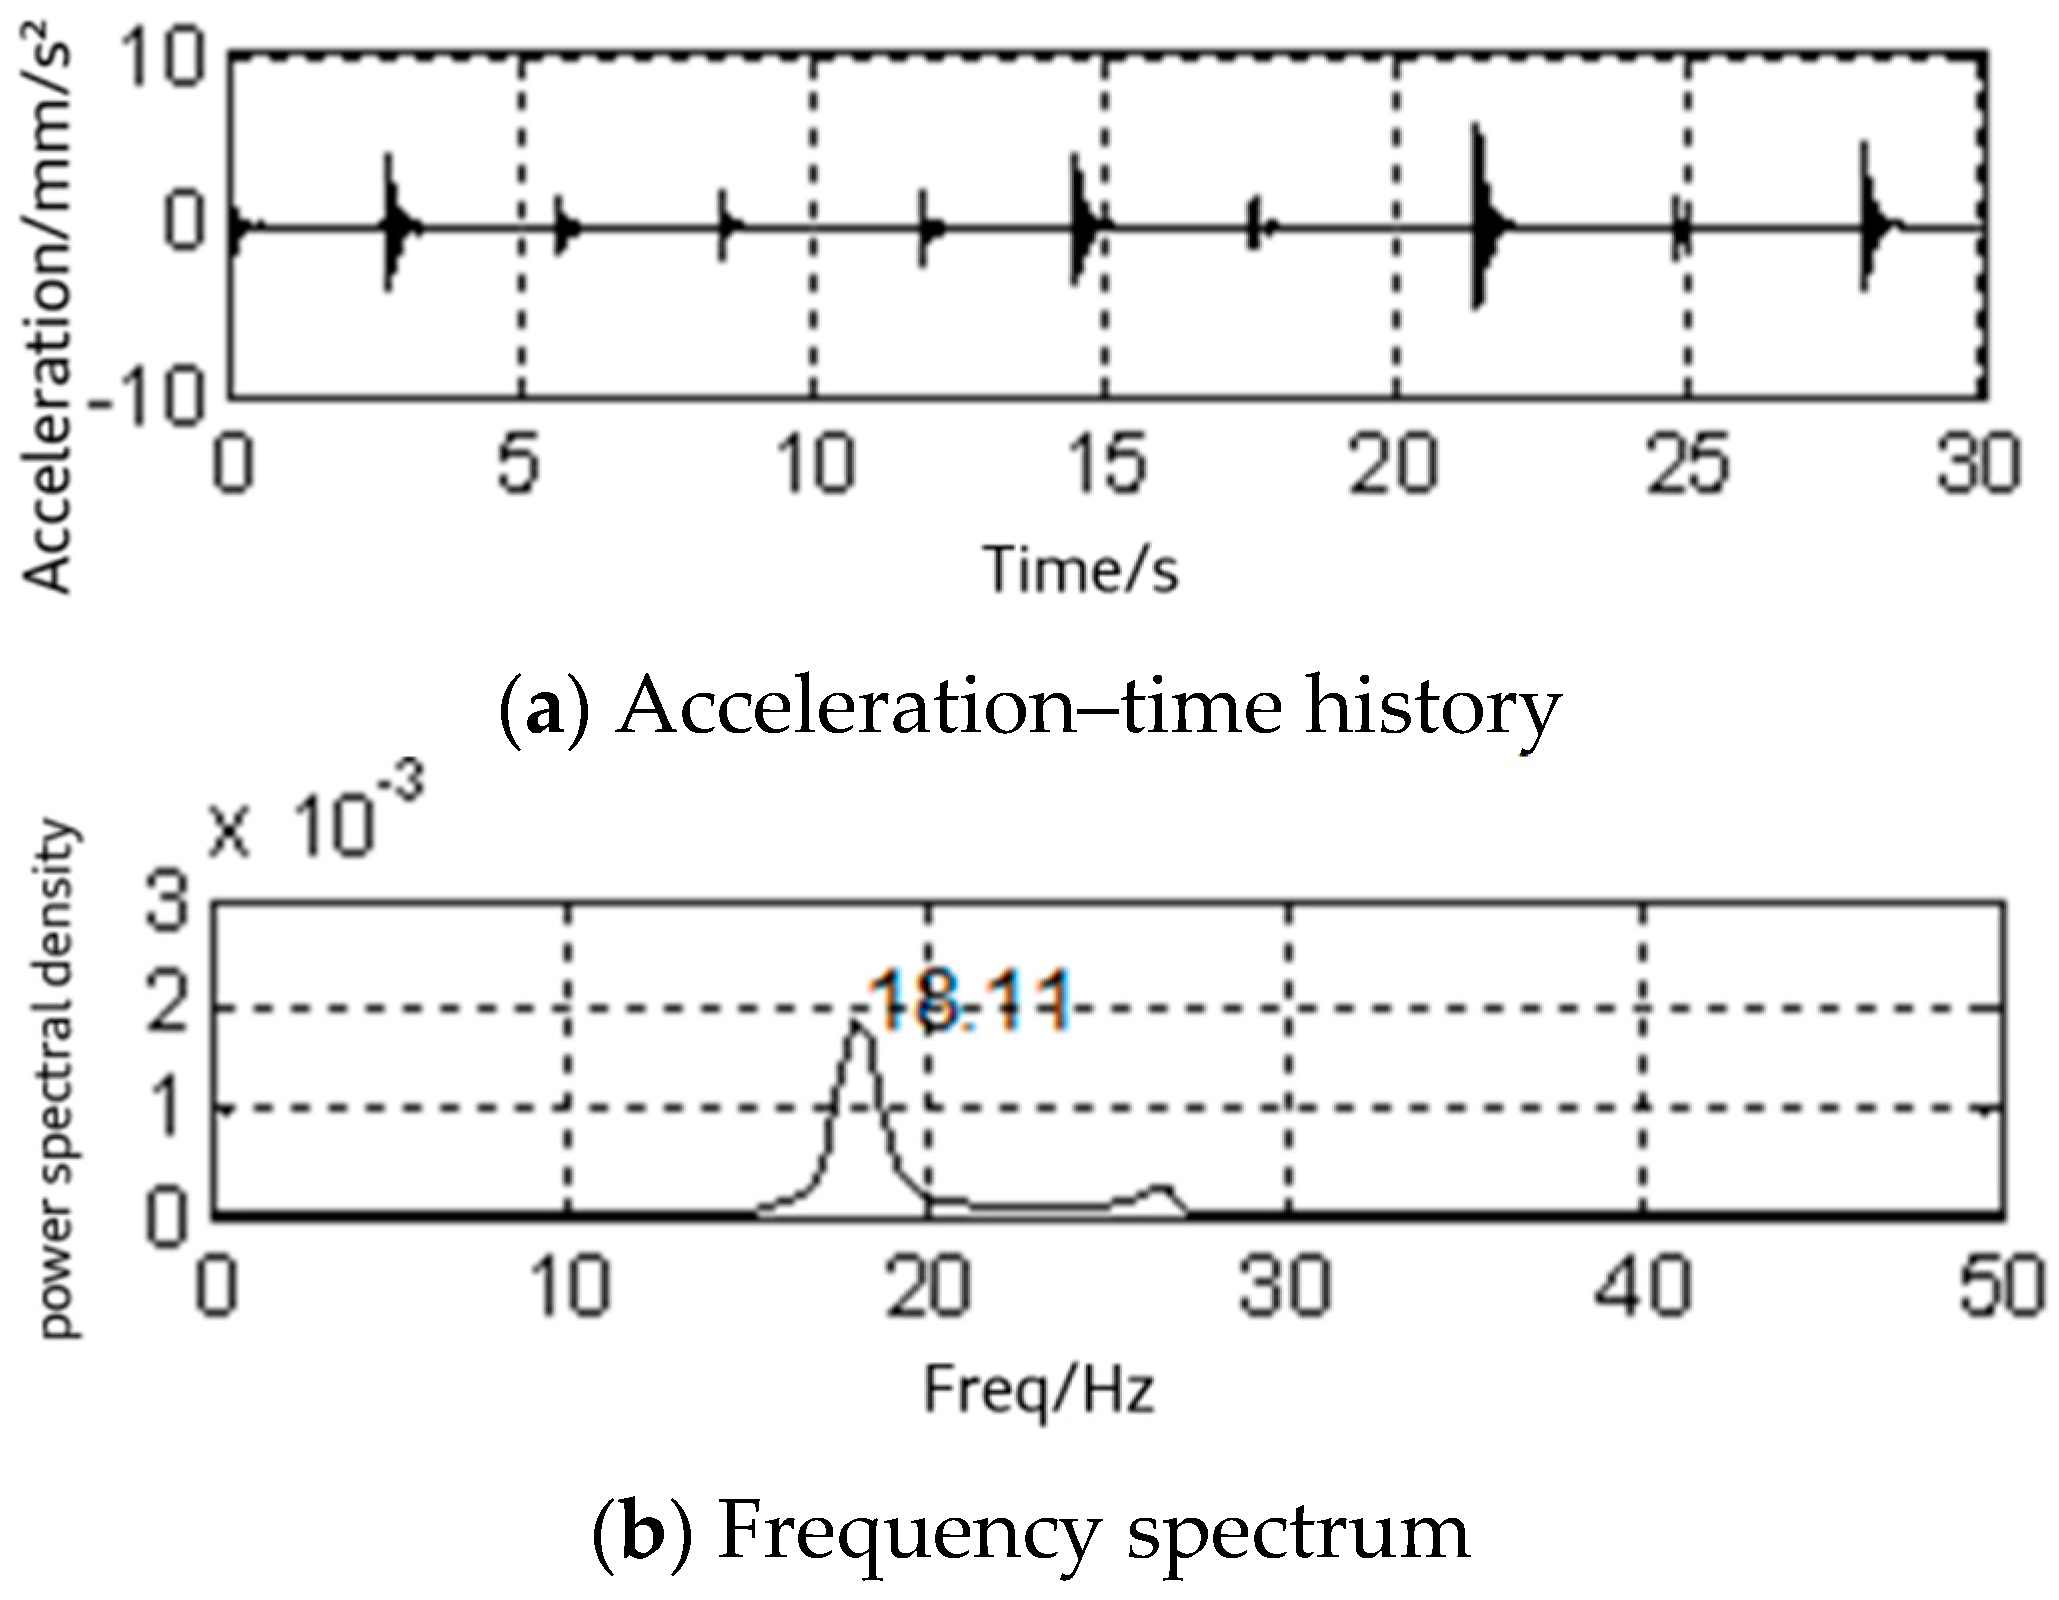
A free vibration test method was adopted, where the steel frame was tapped in the X- and Y-directions using a rubber hammer (continuing to tap when vibrations are not visible to the naked eye). Data collection lasted for 30 s, and only data from measuring points 1 and 2 are presented. Since the acceleration recorded at each measuring point is subjected to a corresponding self-power spectrum, the obtained structural resonance frequency value remains constant. For the empty platform structure, Figure 2a,b depict the time history curves of the acceleration in the X-direction and the self-power spectrum corresponding to the acceleration acquired by one of the free vibrations. Figure 3a,b depict the time history curves of the acceleration in the Y-direction and the self-power spectrum corresponding to the acceleration acquired by one of the free vibrations. The finite element model of the empty steel frame is presented in Figure 4. The first two mode frequencies of the empty steel frame platform are illustrated in Table 1. The first frequency is horizontal vibration in the X-direction and the second frequency is the horizontal vibration in the Y-direction.
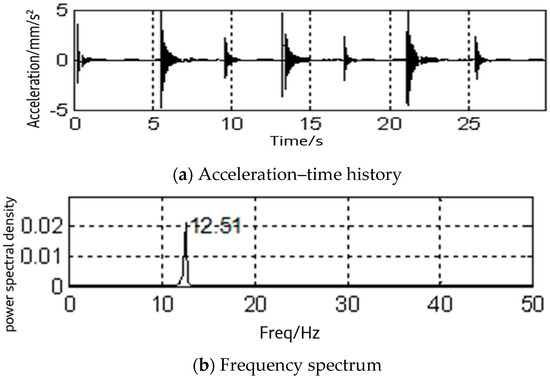
Figure 2.
X-direction.
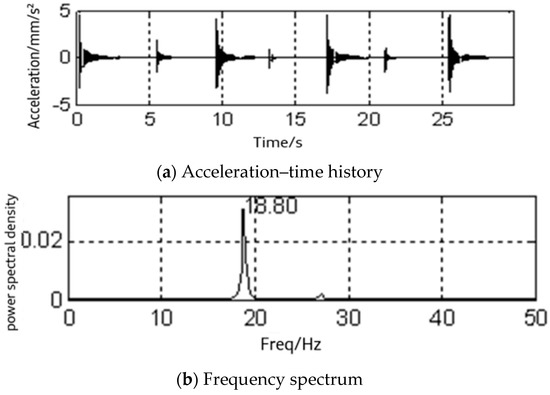
Figure 3.
Y-direction.

Figure 4.
The finite element model of a steel frame structure.

Table 1.
Horizontal modes of an empty steel frame platform.
2.3. Research on Mass–Structure Systems
First, the free vibration test of the empty platform structure was performed. The results indicate that the first horizontal mode of the platform structure is the x-direction, the frequency is 12.54 Hz, and the damping ratio is 1.242%. The second horizontal mode is the y-direction, the frequency is 18.72 Hz, and the damping ratio is 1.099%. Meanwhile, the influence of mass on the horizontal vibration characteristics of the platform structure was tested and analyzed by continuously loading the mass on the platform structure. The mass block is a concrete block. Concrete mass blocks weighing 15 kg (M1), 29.2 kg (M2), 42.8 kg (M3), 56.2 kg (M4), 68.9 kg (M5), and 83.9 kg (M6), respectively, were sequentially loaded onto the platform. Table 1 lists the first two horizontal frequency values and damping ratios for the mass–platform system under six loads. The first horizontal modal mass of the platform structure is 36.04 kg, the modal stiffness is 223,521, and the modal damping is 70.5; contrastingly, the second horizontal modal mass is 35.48 kg, the modal stiffness is 490,362, and the modal damping is 84.2.
Meanwhile, based on the test data of the empty platform structure, the platform structure is simplified into a single-degree-of-freedom system that considers two directions. The mass block is attached as mass to a single-degree-of-freedom system, and the first and second horizontal natural frequencies of different mass-block–structure systems are calculated in Table 2. As illustrated in Figure 5, the measured values of horizontal natural frequencies in both directions are in good agreement with the simulated values. To determine whether the human body can be utilized as a mass, it is attached to the single-degree-of-freedom structure system as a mass for calculation.
Table 2.
The modal changes of different mass–structure systems.
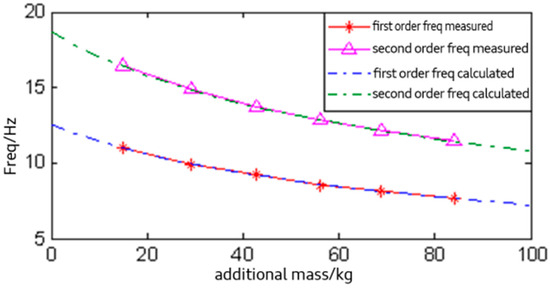
Figure 5.
The frequency changes of a mass–structure system.
Table 3 depicts the measured values and calculated values of the human–structure system in two horizontal directions. The table indicates that the measured and calculated values of the first horizontal natural frequencies of the single-person–structure system exhibit an error of 29.64%, which is much larger than the 0.23% error exhibited by the M3–structure system with similar mass.
Table 3.
Comparing the experimental and theoretical frequencies.
Compared with the first and second horizontal natural frequencies of the platform structure, the measured natural frequency of the single-person–structure system decreased marginally, the first decreased by 0.58 Hz, and the second decreased by 0.68 Hz, which is considerably less than the measured reduction value of the M3–structure system with similar mass.
The comprehensive comparison indicates that the static human influence on a structure’s horizontal vibration characteristics cannot be simply regarded as a mass.
2.4. Dynamic Test of a Human–Steel Frame Platform in the Horizontal Direction
The human–structure system is tested as illustrated in Figure 6. When testing the horizontal vibration characteristics of the human–structure system in the X-direction, the tester stands facing the X-direction. When testing the horizontal vibration characteristics of the human–structure system in the Y-direction, the tester stands facing the Y-direction, and the test method is the same as that of the empty structure. A total of six individuals participated in the test, and each was assigned a letter between A and F. Figure 7a,b depict the time history of the horizontal X-direction acceleration of the human–structure system and the self-power spectrum corresponding to the acceleration acquired by one of the free vibrations when the tester D (weight 53.5 kg) stands facing the x-direction. Figure 8a,b illustrate the time history of the horizontal Y-direction acceleration of the human–structure system and the self-power spectrum corresponding to the acceleration acquired by one of the free vibrations when the tester stands facing the Y-direction.
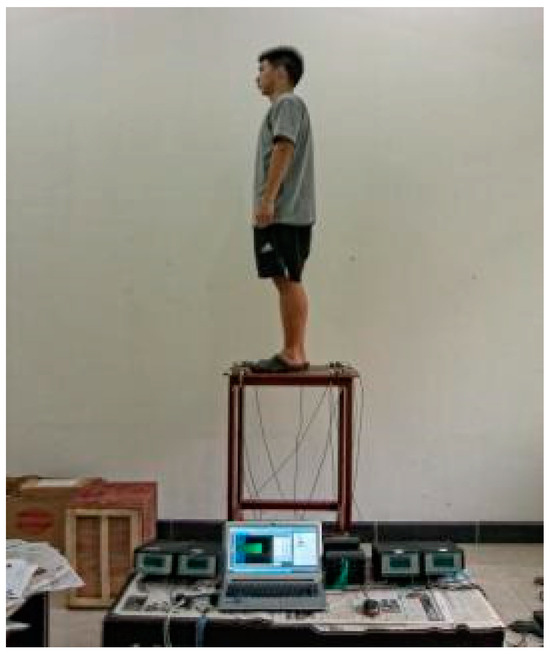
Figure 6.
Tester B standing on the structure.

Figure 7.
Vibration characteristics (X-direction, tester D).
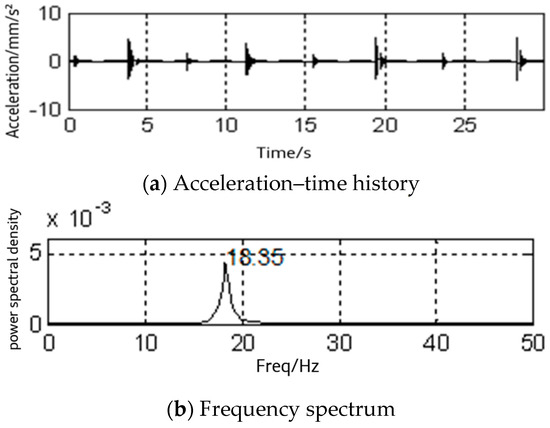
Figure 8.
Vibration characteristics (Y-direction, tester D).
Figure 9a,b depict the time history of the horizontal X-direction acceleration of the human–structure system and the self-power spectrum corresponding to the acceleration acquired by one of the free vibrations when tester C (weight: 65.1 kg) stands facing the X-direction; Figure 10a,b illustrate the time history of the horizontal Y-direction acceleration of the human–structure system and the self-power spectrum corresponding to the acceleration acquired by one of the free vibrations when tester C stands facing the Y-direction.
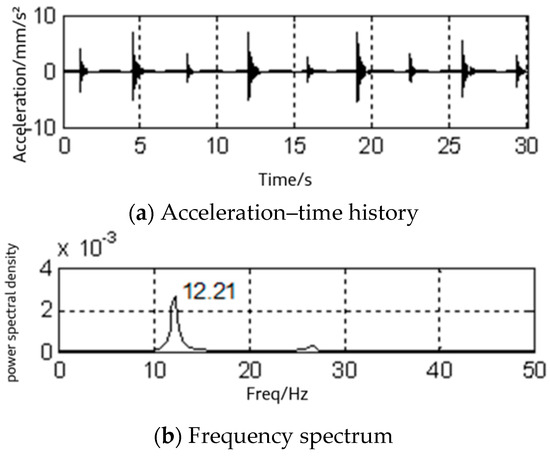
Figure 9.
Vibration characteristics (X-direction, tester C).
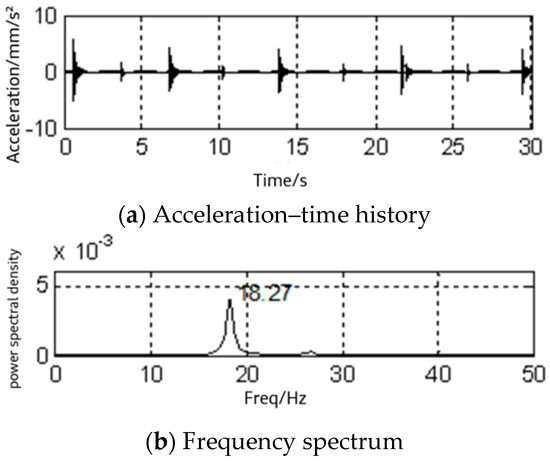
Figure 10.
Vibration characteristics (Y-direction, tester C).
Figure 11a,b depict the time history of the horizontal X-direction acceleration of the human–structure system and the self-power spectrum corresponding to the acceleration acquired by one of the free vibrations when tester F (weight: 79.2 kg) stands facing the X- direction. Figure 12a,b illustrate the time history of the horizontal Y-direction acceleration of the human–structure system and the self-power spectrum corresponding to the acceleration acquired by one of the free vibrations when tester F stands facing the Y-direction. Table 4 depicts the measured first modal frequency fx1 of the human–steel-frame platform system in the X-direction when the human stands facing the Y-direction, and the first modal frequency fy1 of the human–steel frame platform system in the Y-direction when the human stands facing the Y-direction.
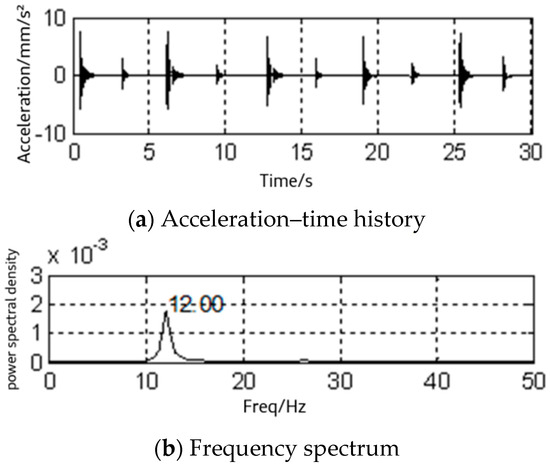
Figure 11.
Vibration characteristics (X-direction, tester F).
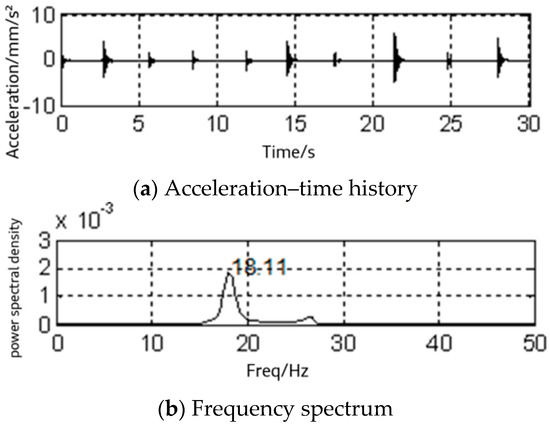
Figure 12.
Vibration characteristics (Y-direction, tester F).
Table 4.
The modal frequency of the human–structure system in the horizontal directions.
By comparing Table 1 and Table 3, it can be noted that the natural frequency of the whole human–structure system decreases slightly when the human’s feet are stationary on the platform compared to the empty platform structure. By comparing Table 2 and Table 3, it is found that the modal frequency of the mass–platform system decreases significantly, indicating that the human body exerts mixed effects on the dynamic performance of the platform structure. This is because it is a highly damped, flexible body that can consciously control vibrations; the human body is connected to various rotatable joints and is not rigidly connected to the structure in the horizontal direction. Therefore, the role of the human body in the structural system cannot be simply regarded as a mass block equal to its own weight.
2.5. Experimental Studies on Multi-Person-Structure Systems
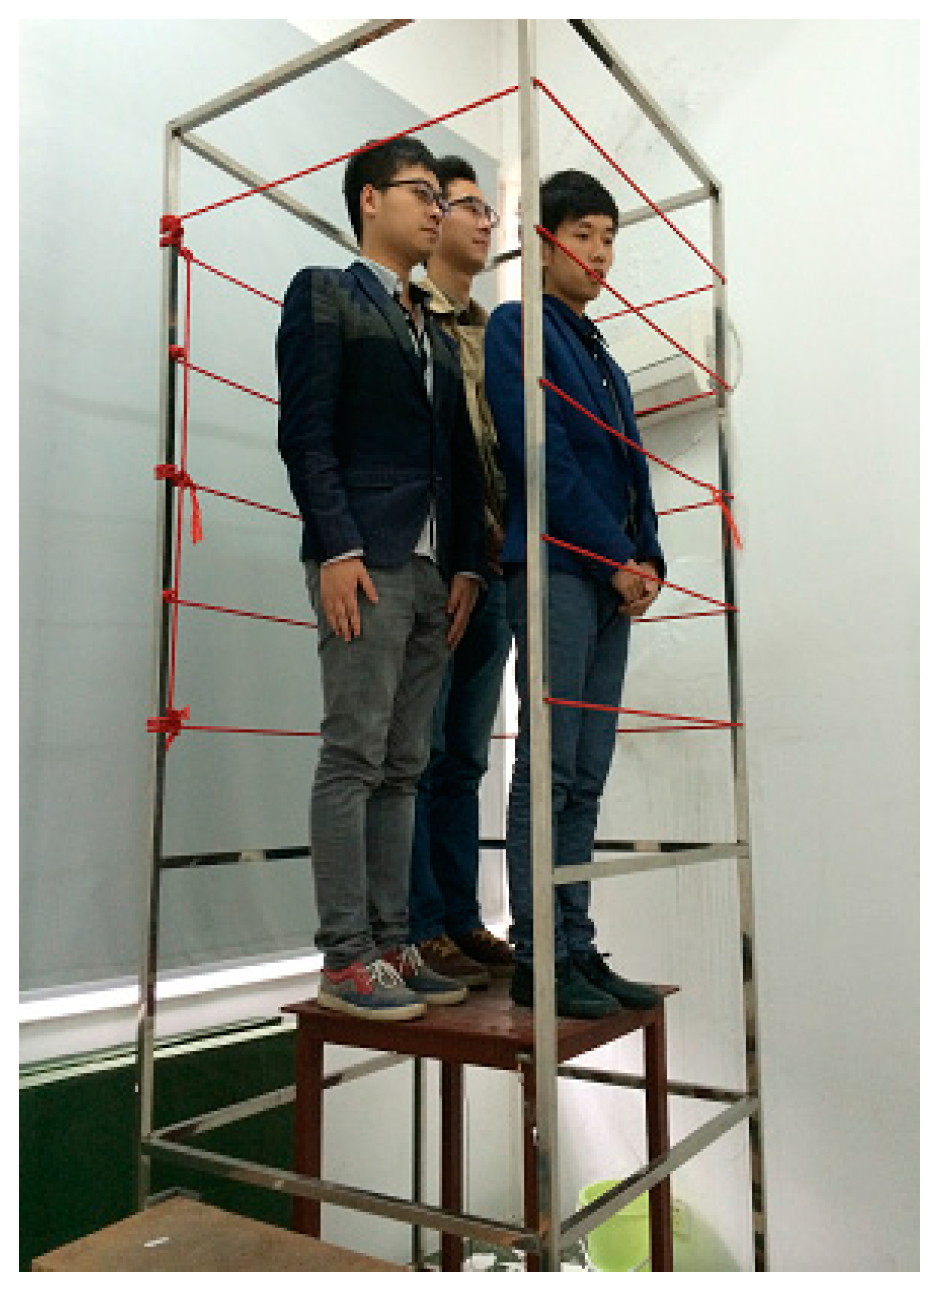
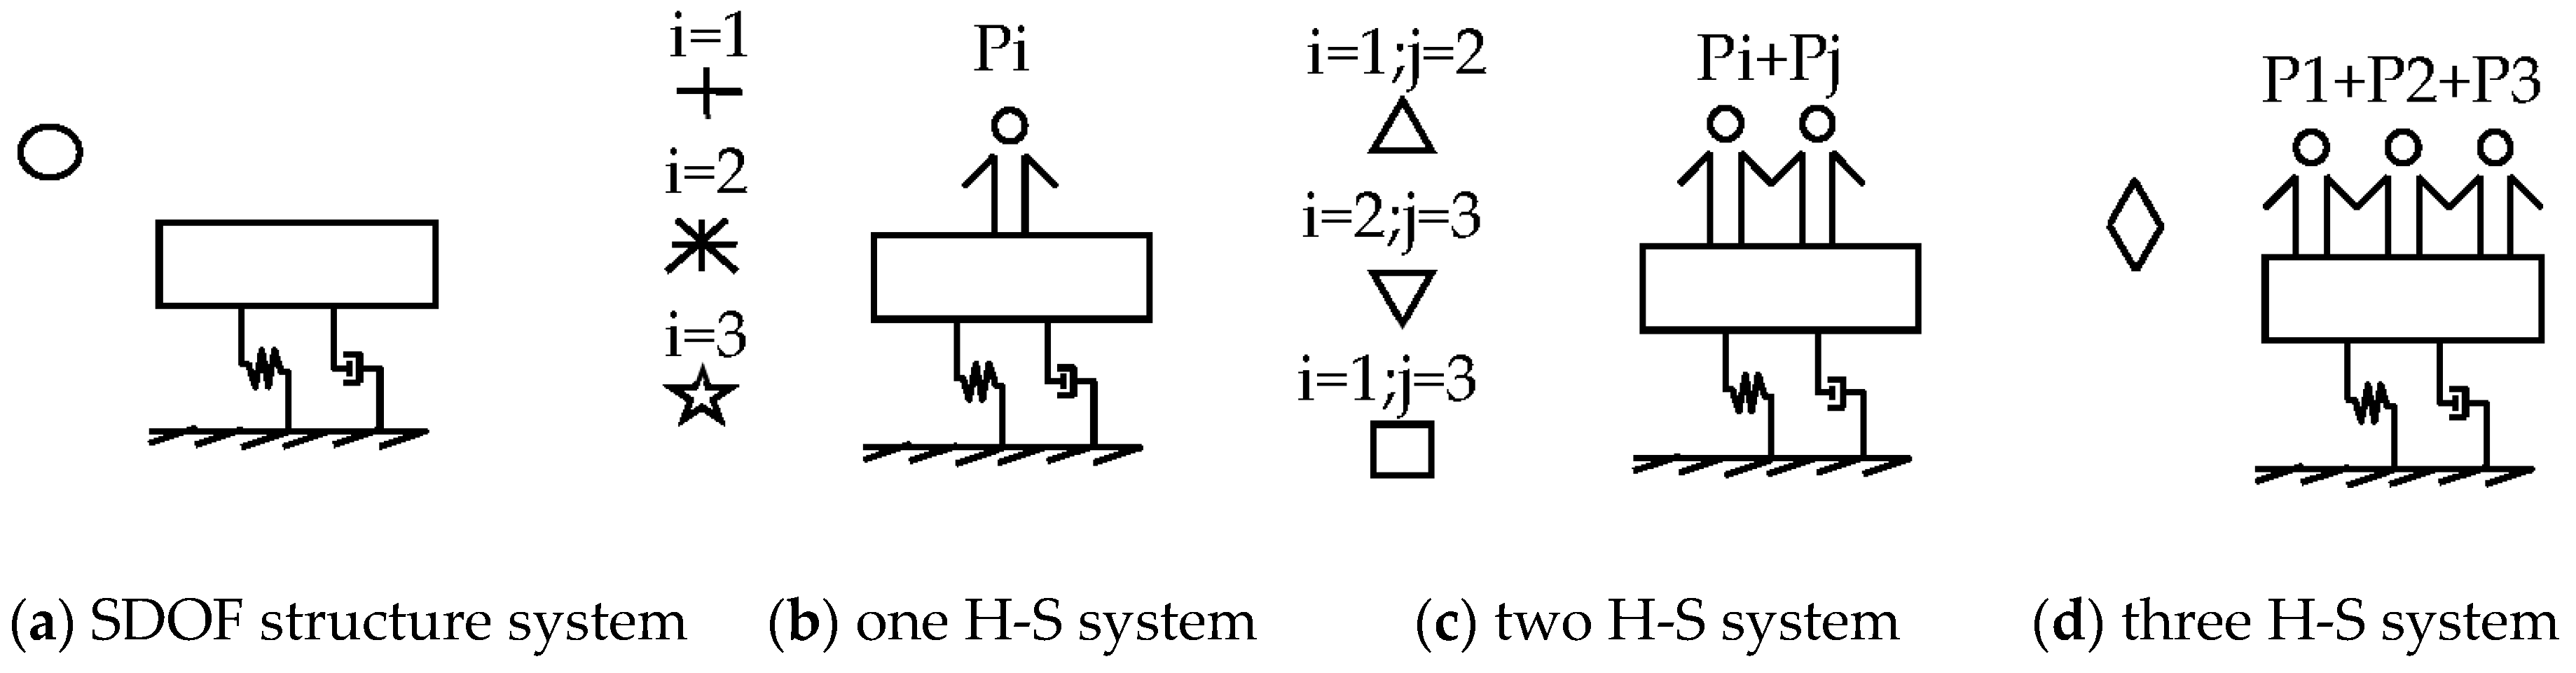
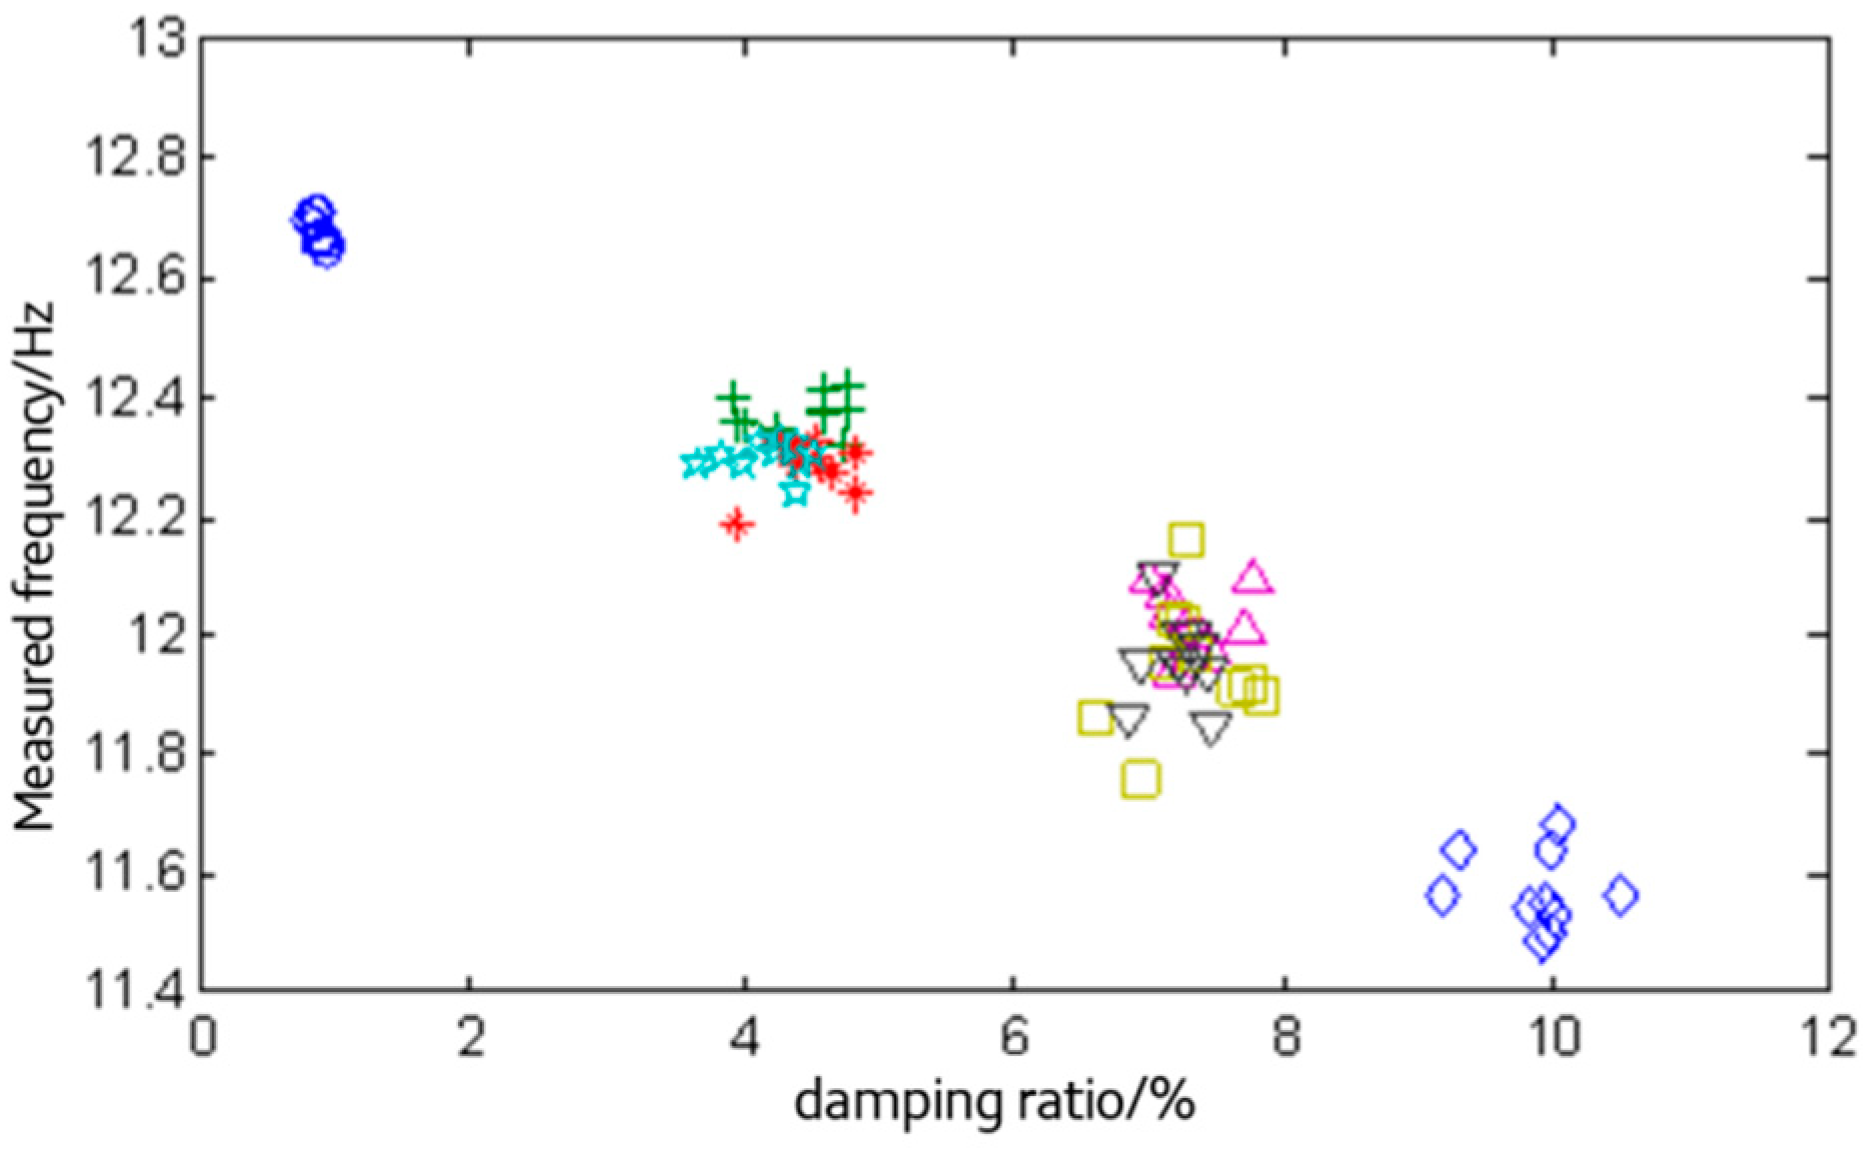
The horizontal vibration characteristics of a human–structure system that incorporates three individuals (P1, P2, and P3) were studied. In the experiment, the human bodies were standing in the X-direction, as depicted in Figure 13. Figure 14 illustrates a schematic diagram of a platform structure, a single-person–structure system, a double-person–structure system, and a three-person–structure system, corresponding to (a) to (d) in Figure 14. Figure 15 depicts the distribution of the horizontal free vibration frequencies and damping ratios from four different system tests. From the figure, it can be concluded that with the increase in the number of individuals standing on the platform structure, the frequency exhibited a gradual but marginal decrease, and the downward decrease value was approximately 0.2–0.3 Hz, and the damping ratio exhibited an apparent increase, indicating that the human body exerts an apparent damping effect on the structure. Thus, the horizontal static coupling system models (A and B) for a single structure are proposed, as illustrated in Figure 16 and Figure 17.
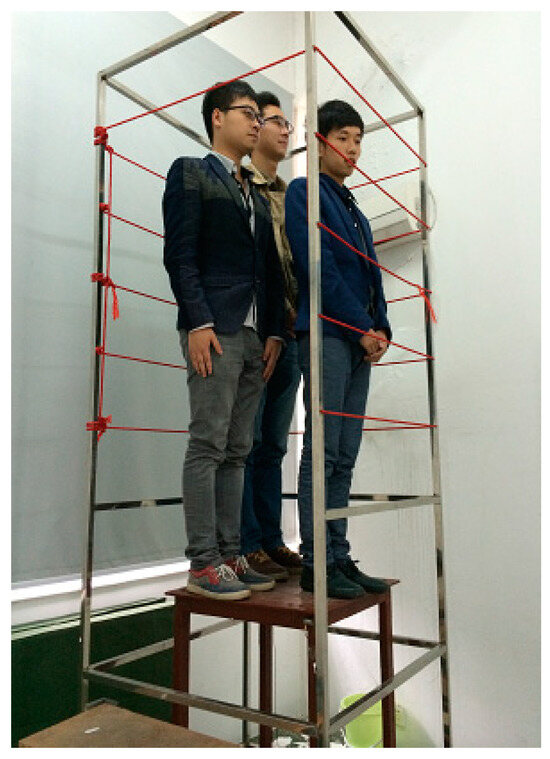
Figure 13.
Human–structure test model.

Figure 14.
The SDOF structure system and H–S systems.

Figure 15.
Relationships between the frequencies and damping ratios.
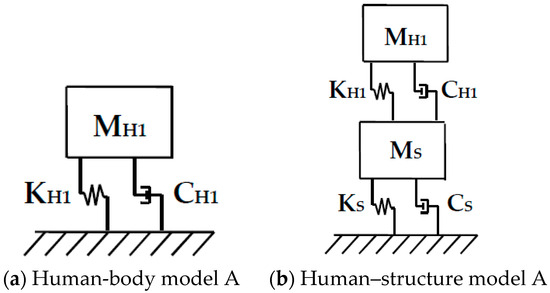
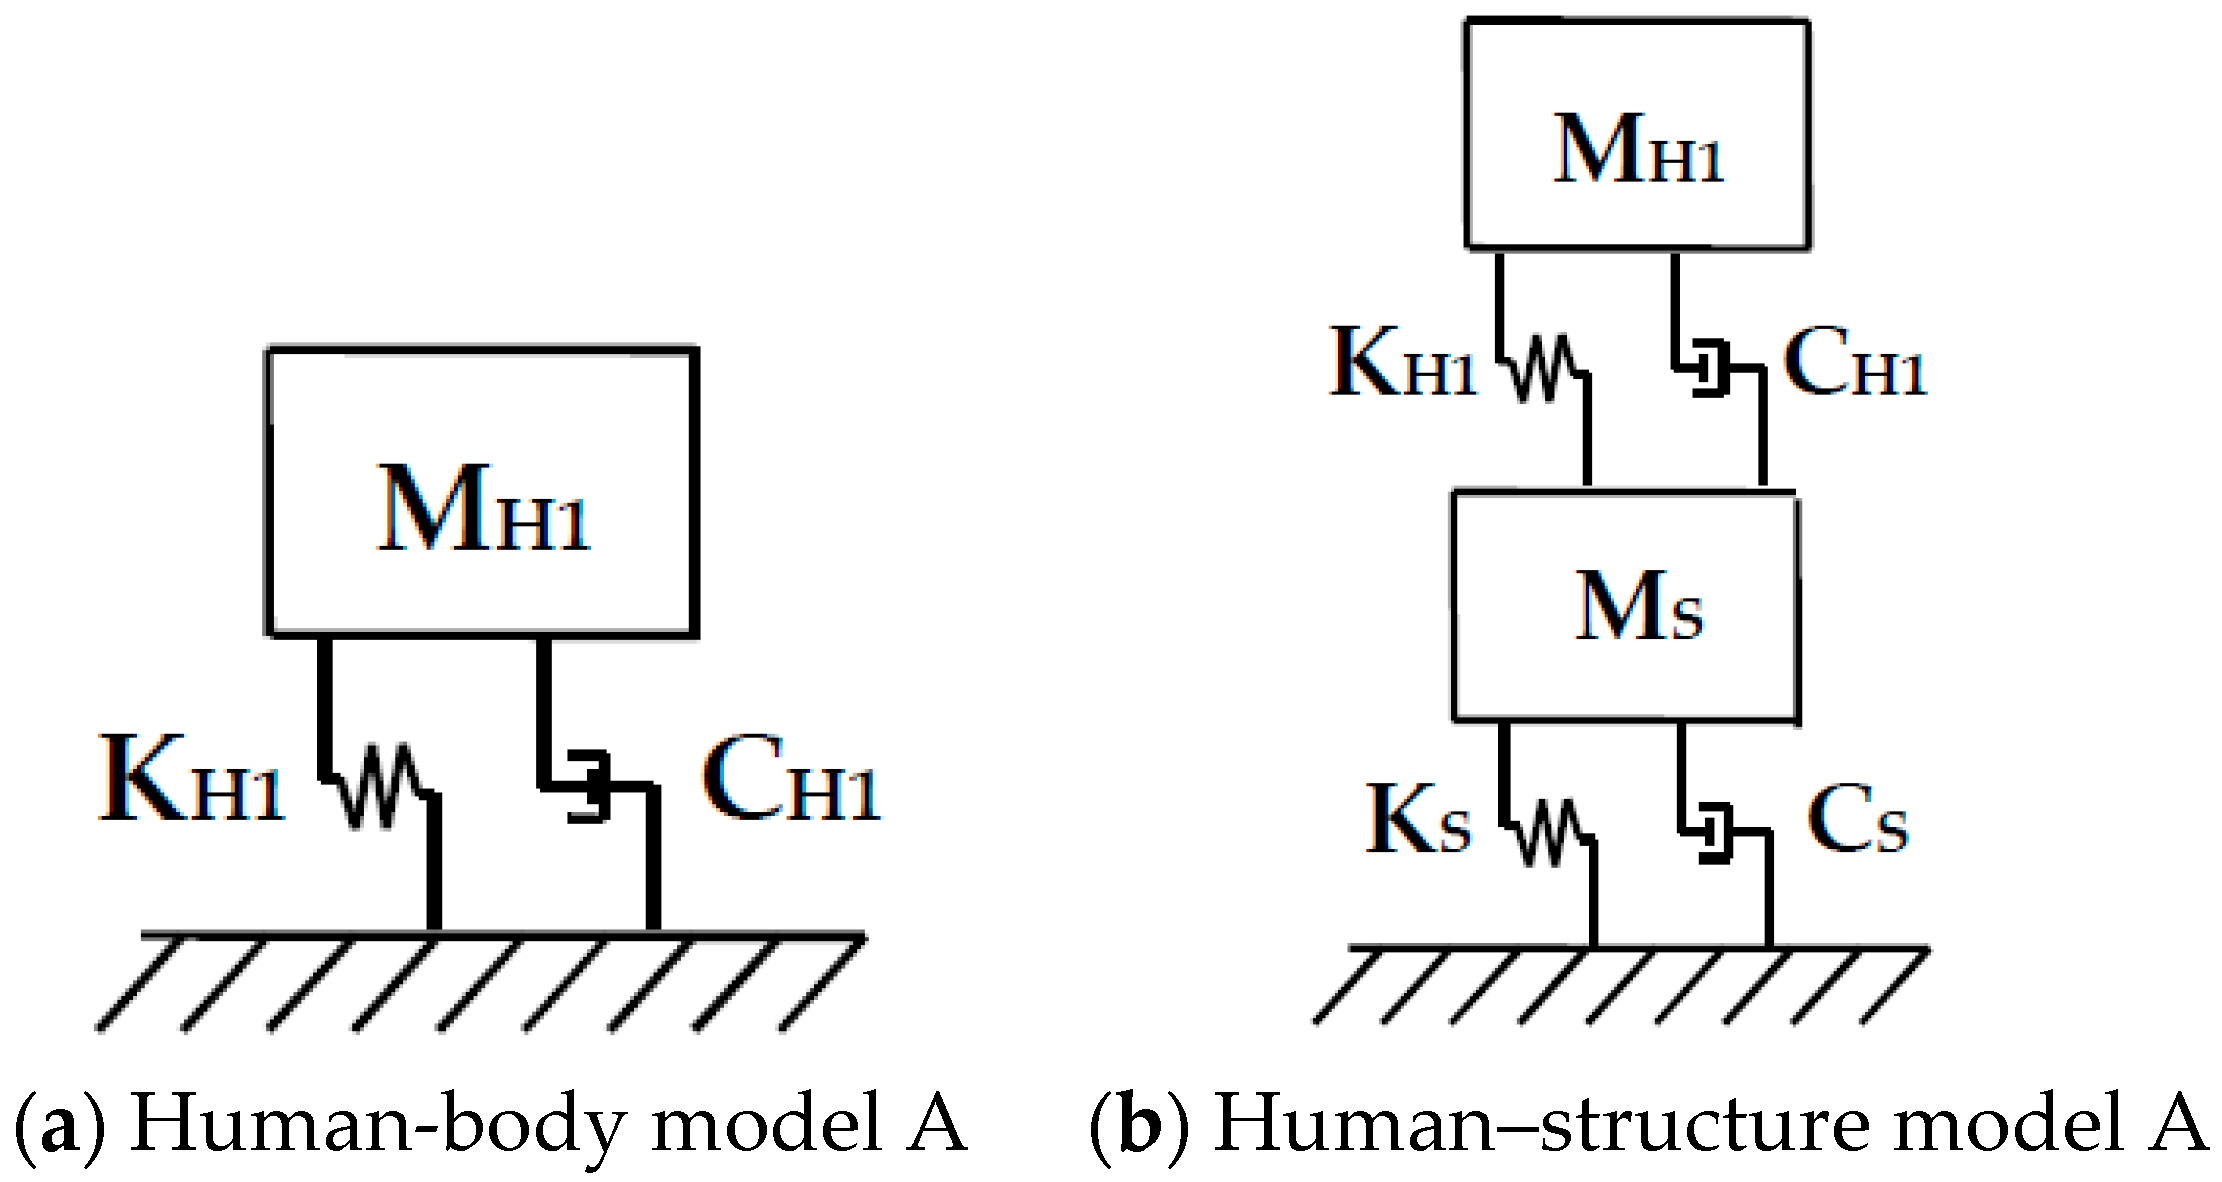
Figure 16.
Human–structure model A.
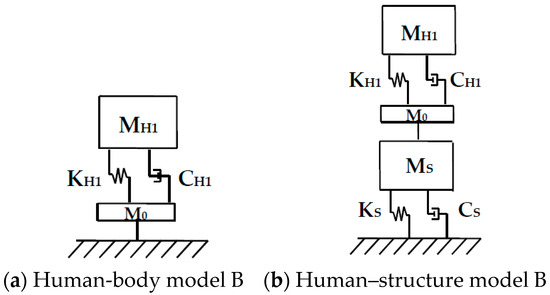
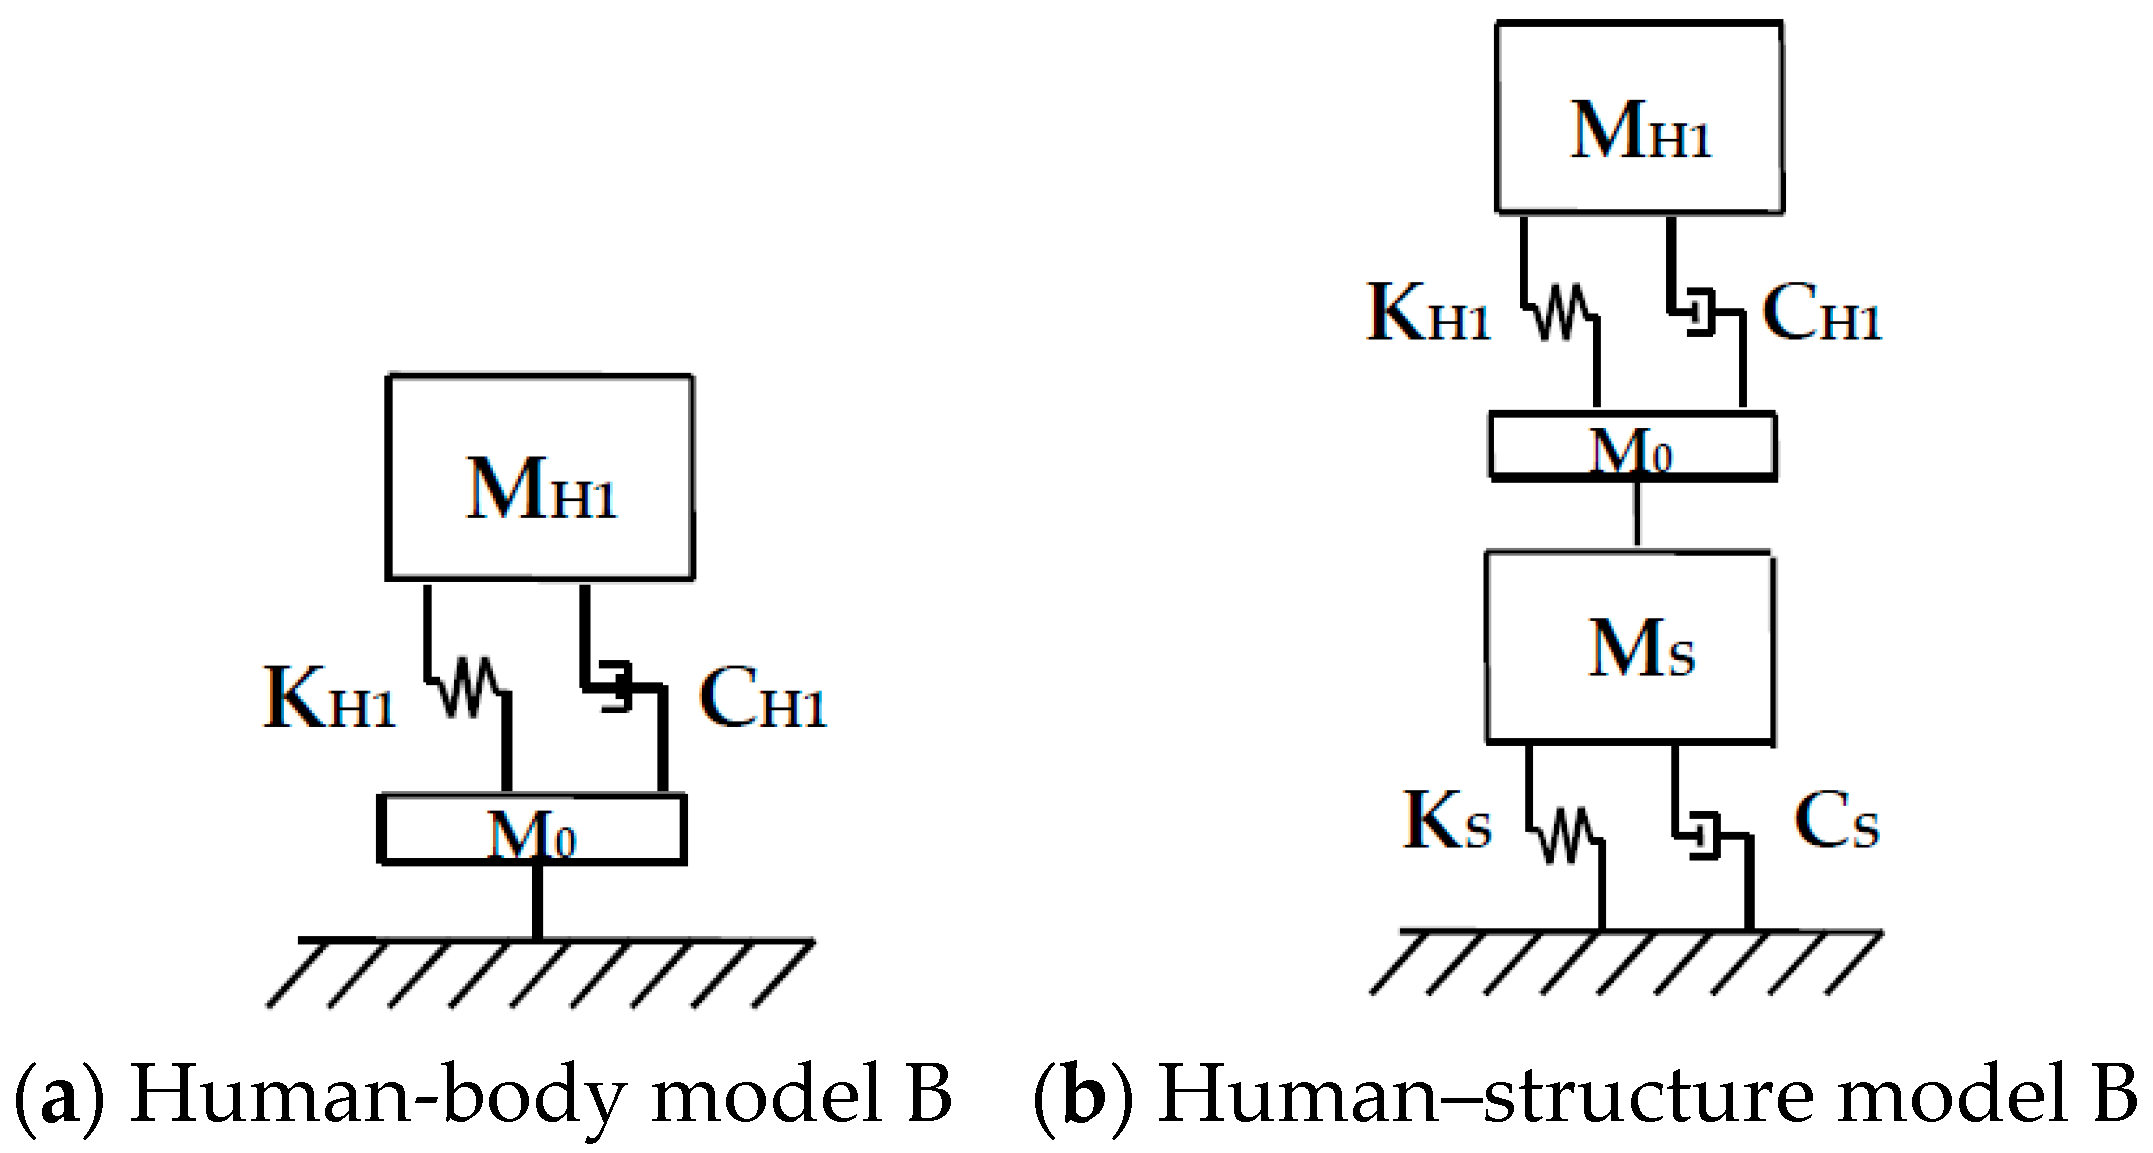
Figure 17.
Human–structure model B.
It should also be noted that (1) because of the complexity of the human body, the measured data are more dispersed, as well as (2) because the horizontal natural frequency of the experimental platform structure is considerably larger than the horizontal natural frequency of the human body [21]. The measured structural frequency is the second frequency of the single-person–structure system, which approximates the horizontal natural frequency of the platform structure; additionally, the first frequency of the single-person–structure system cannot be directly measured from the platform structure, and the frequency is more approximate to the horizontal natural frequency of the human body.
3. Effect of the Human Body on Structural Damping
The average damping values are summarized in Figure 6. The damping ratio of the first mode of the human–structure system is significantly larger than that of the hollow structure’s fundamental mode. Additionally, the damping ratio increases notably with an increase in the number of individuals on the structure. Forward and backward movements contribute more to damping than left and right movements. As the structure’s fundamental frequency increases, the modal damping ratio of the human (left–right)–structure system initially decreases and subsequently increases. In contrast, the modal damping ratio of the human (fore-and-aft)–structure system fluctuates with limited amplitude, showing a relationship with the structure’s fundamental frequency. The horizontal vibration results for the varying structural mass provide further insights. When the stiffness and mass are altered, the fundamental frequency changes only slightly, and dynamic tests on the same individual reveal that the damping ratio decreases as the structural vibration mode’s mass increases.
4. Human–Structure System Model
A horizontal model of a human body and structure is established using a single-degree-of-freedom–mass–spring-damping system. Figure 16 illustrates human-body model A, comprising a damped single-degree-of-freedom system consisting of a platform and a human body model. Meanwhile, consistent with the concept of human rigid mass [11], a mass is added to the human–structure interface, the displacement of which is the same as that of the mass–structure interface. Human-body model B, shown in Figure 17, includes a rigid mass added to the human–structure interface, ensuring the same displacement at the interface.
4.1. Static Horizontal Couple Motion Equations of Human-Structure System
The human–structure system model A is as follows:
The human–structure system model B is as follows:
where .
Ms is the horizontal modal mass of a platform structure; Cs is the horizontal modal damping of a platform structure; Ks is the horizontal modal stiffness of a platform structure; fs is the horizontal frequency of a platform structure; ξS is the horizontal damping ratio of a platform structure; MH1 is the human body horizontal modal mass; CH1 is the human body horizontal modal damping; KH1 is the human body horizontal modal stiffness; fH is the human body horizontal frequency; ξS is the human body horizontal damping ratio; and M0 is the rigid mass of human body.
4.2. Research on Human–Structure System Model
The ratios of the first and second horizontal frequencies to the structure’s horizontal natural frequency are derived from the undamped characteristic equation.
The human–structure system model A is as follows:
The human–structure system model B is as follows:
where ; ; ; ; is the total mass of a human body; e is the ratio of the rigid mass of the human body to the total mass of a human body; η is the ratio of the mass of a human body to the structure’s horizontal modal mass; γ is the ratio of the horizontal modal mass of a human body to the structure’s horizontal modal mass; β is the ratio of the natural frequency of a human body to the structure’s natural frequency (fH/fS); and f1 and f2 are the first and second frequencies of the human–structure system.
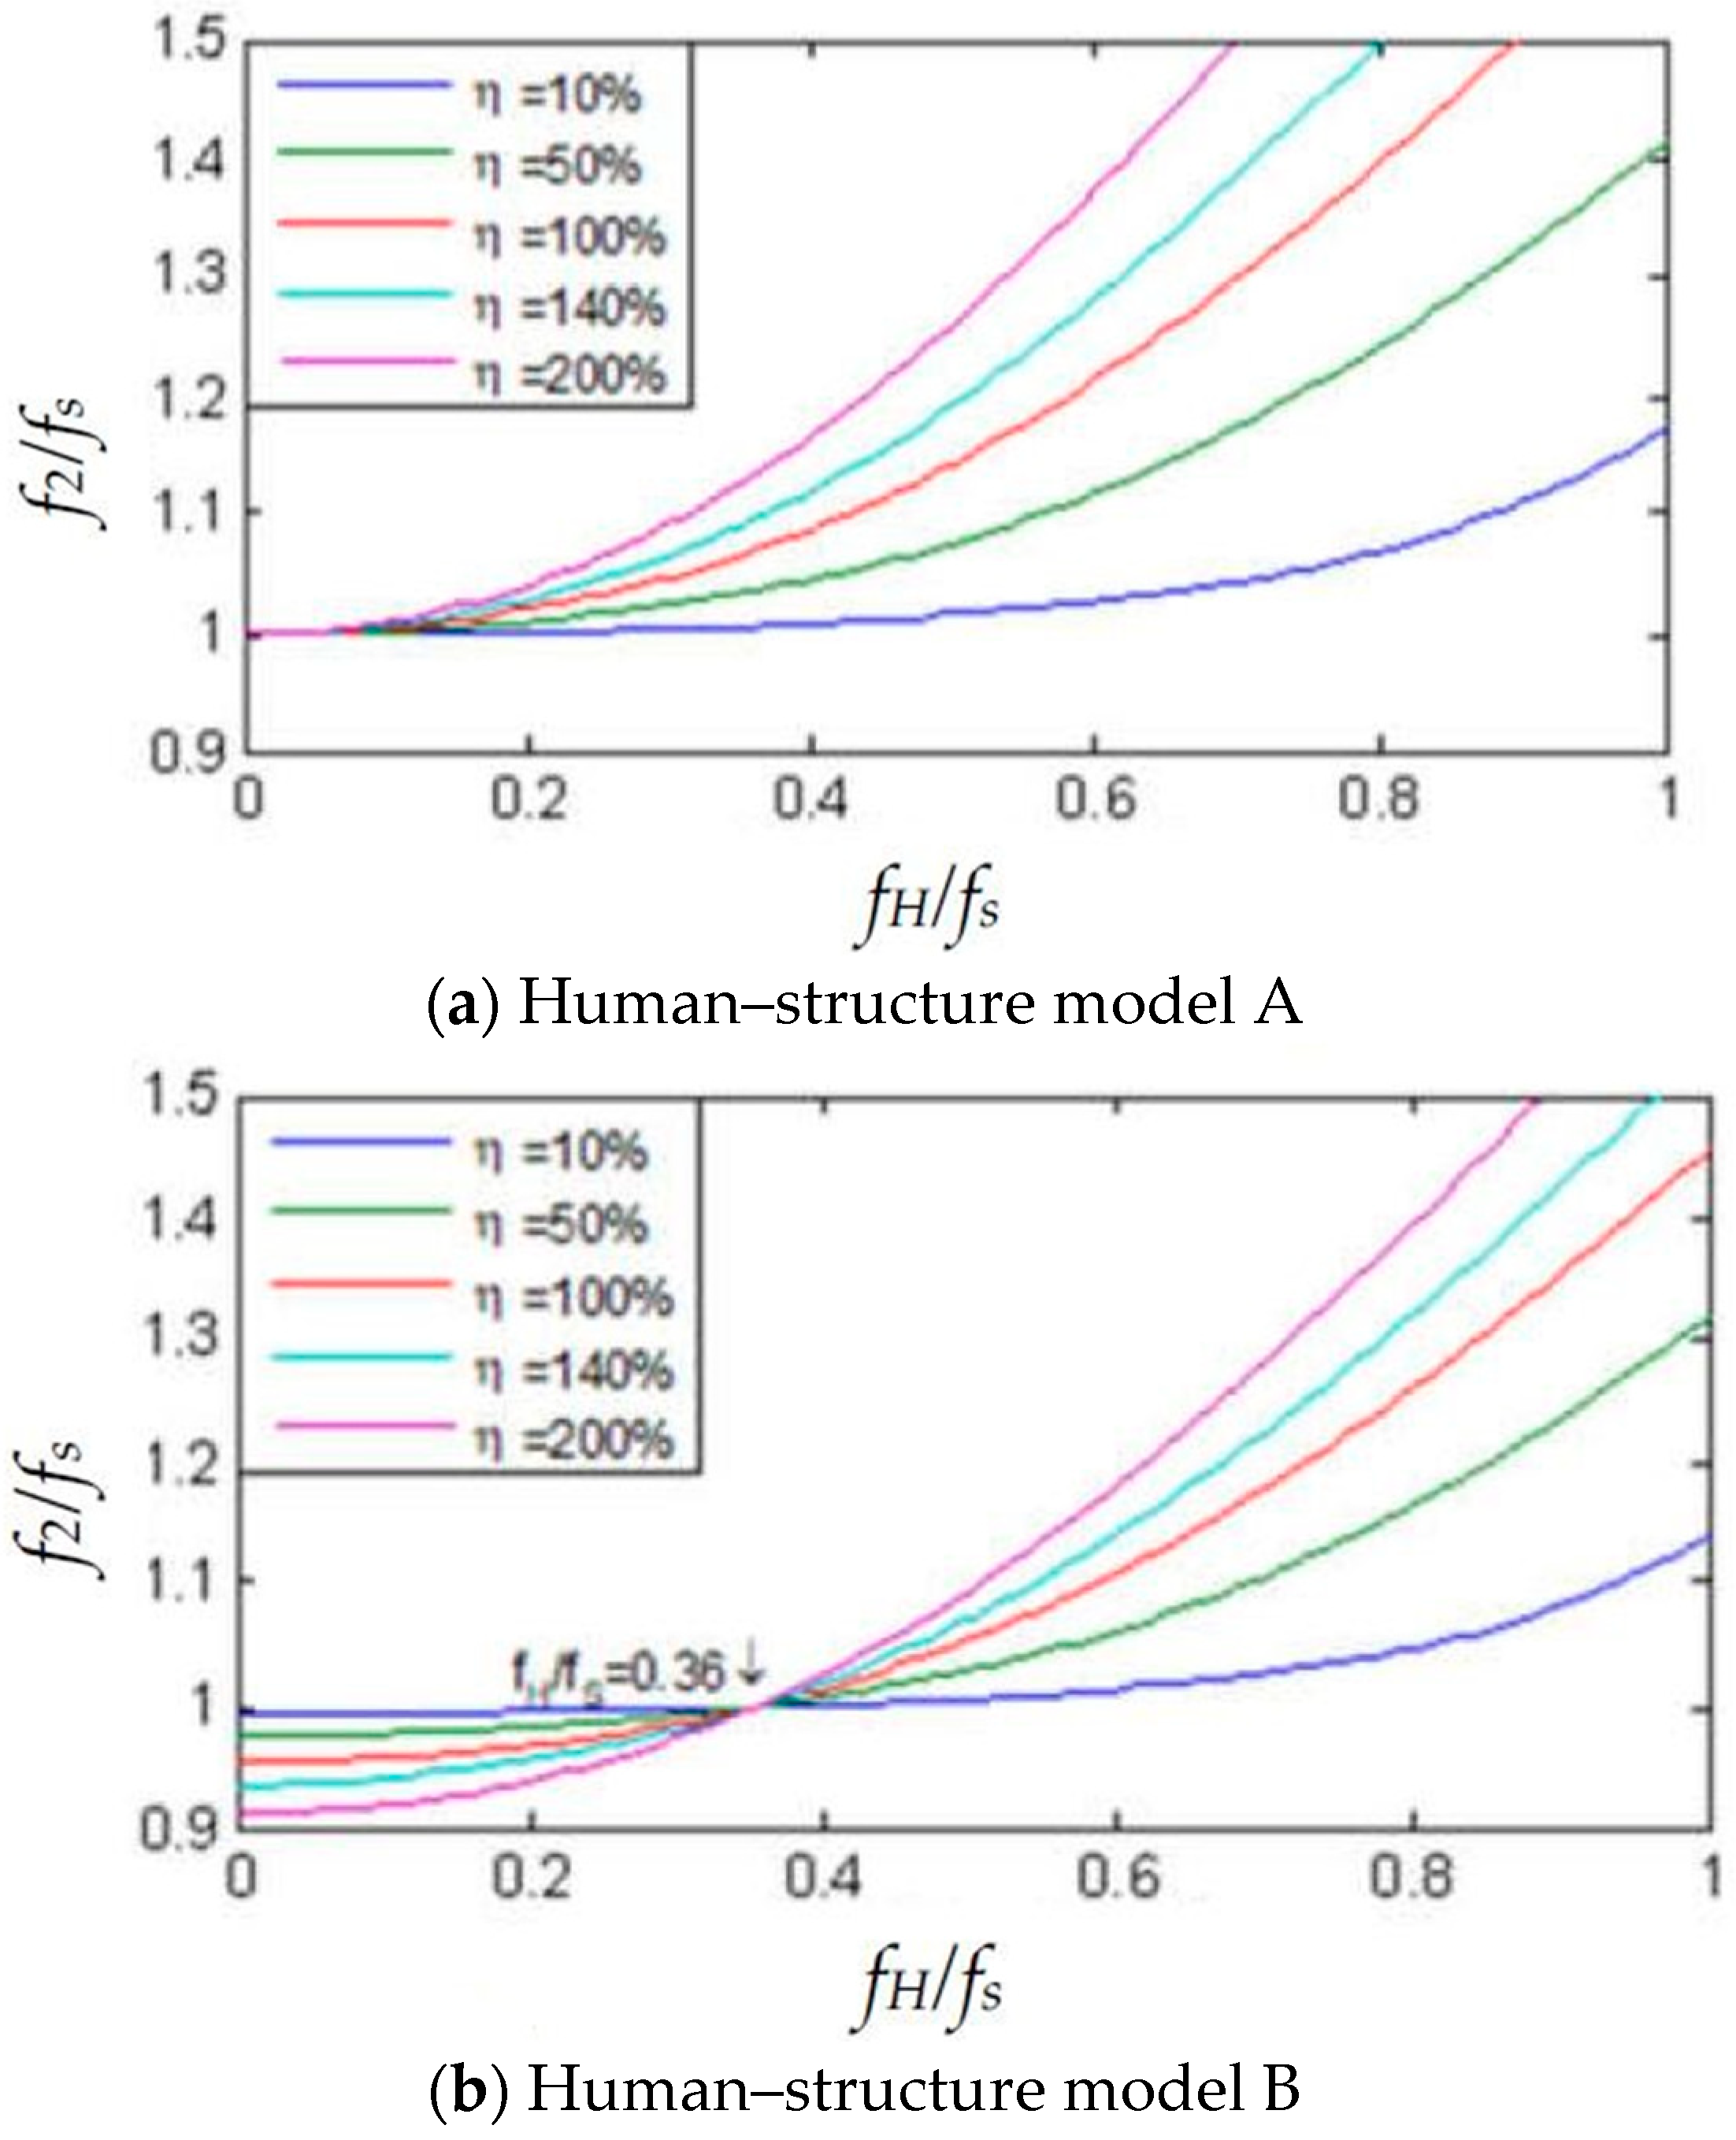
Figure 18 presents the relationships between the second horizontal natural frequencies and β of the human–structure system model A and the human–structure system model B when η is 10%, 50%, 100%, 140%, and 200%.
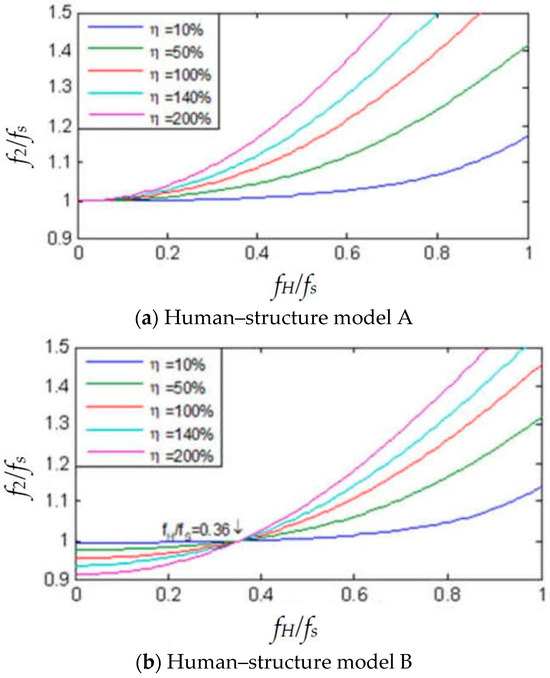
Figure 18.
Relationships between f2/fs and fH/fS for the human–structure systems.
From Figure 18a, it is concluded that when η is constant, f2/fS increases with fH/fS. In addition, f2/fS is always greater than 1. It is indicated that the second frequency of the human–structure model A is larger than the structure frequency and increases with the human body mass. The second human–structure model increases with the increase in the human body mass.
Figure 18b indicates that f2/fS increases with an increase in fH/fS when η is constant; however, f2/fS is less than 1 when fH/fS is less than 0.36. When η = 10% and fH/fS < 0.36, f2/fS approximates 1, and when η > 10% and fH/fS < 0.360, 9 < f2/fS < 1. It is indicated that with the increase in the human body mass and when fH/fs < 0.36, the second frequency of the human–structure model B is less than the structure’s first frequency. The experimental results indicate that the frequency of a 67.3 kg human standing platform is 12.11 Hz, which is less than the first frequency of 12.54 Hz, and 0.9 < 12.11/12.54 = 0.966 < 1. Compared with the human–structural system model A, the human–structural system model B is more consistent with the measured phenomenon; thus, the human–structural system model B is more reasonable.
In summary, the human body rigid mass on the human–structure system’s horizontal natural frequency is considerably affected. Although the phenomenon of a human–structure system’s natural frequency reduction is occasioned by the human body rigid mass, human body damping can potentially exert a certain effect [4]. To determine the dominant factor, further research is necessary.
4.3. Horizontal Frequency Range of Human Bod
The human body horizontal frequency formula from Formula (4) is as follows:
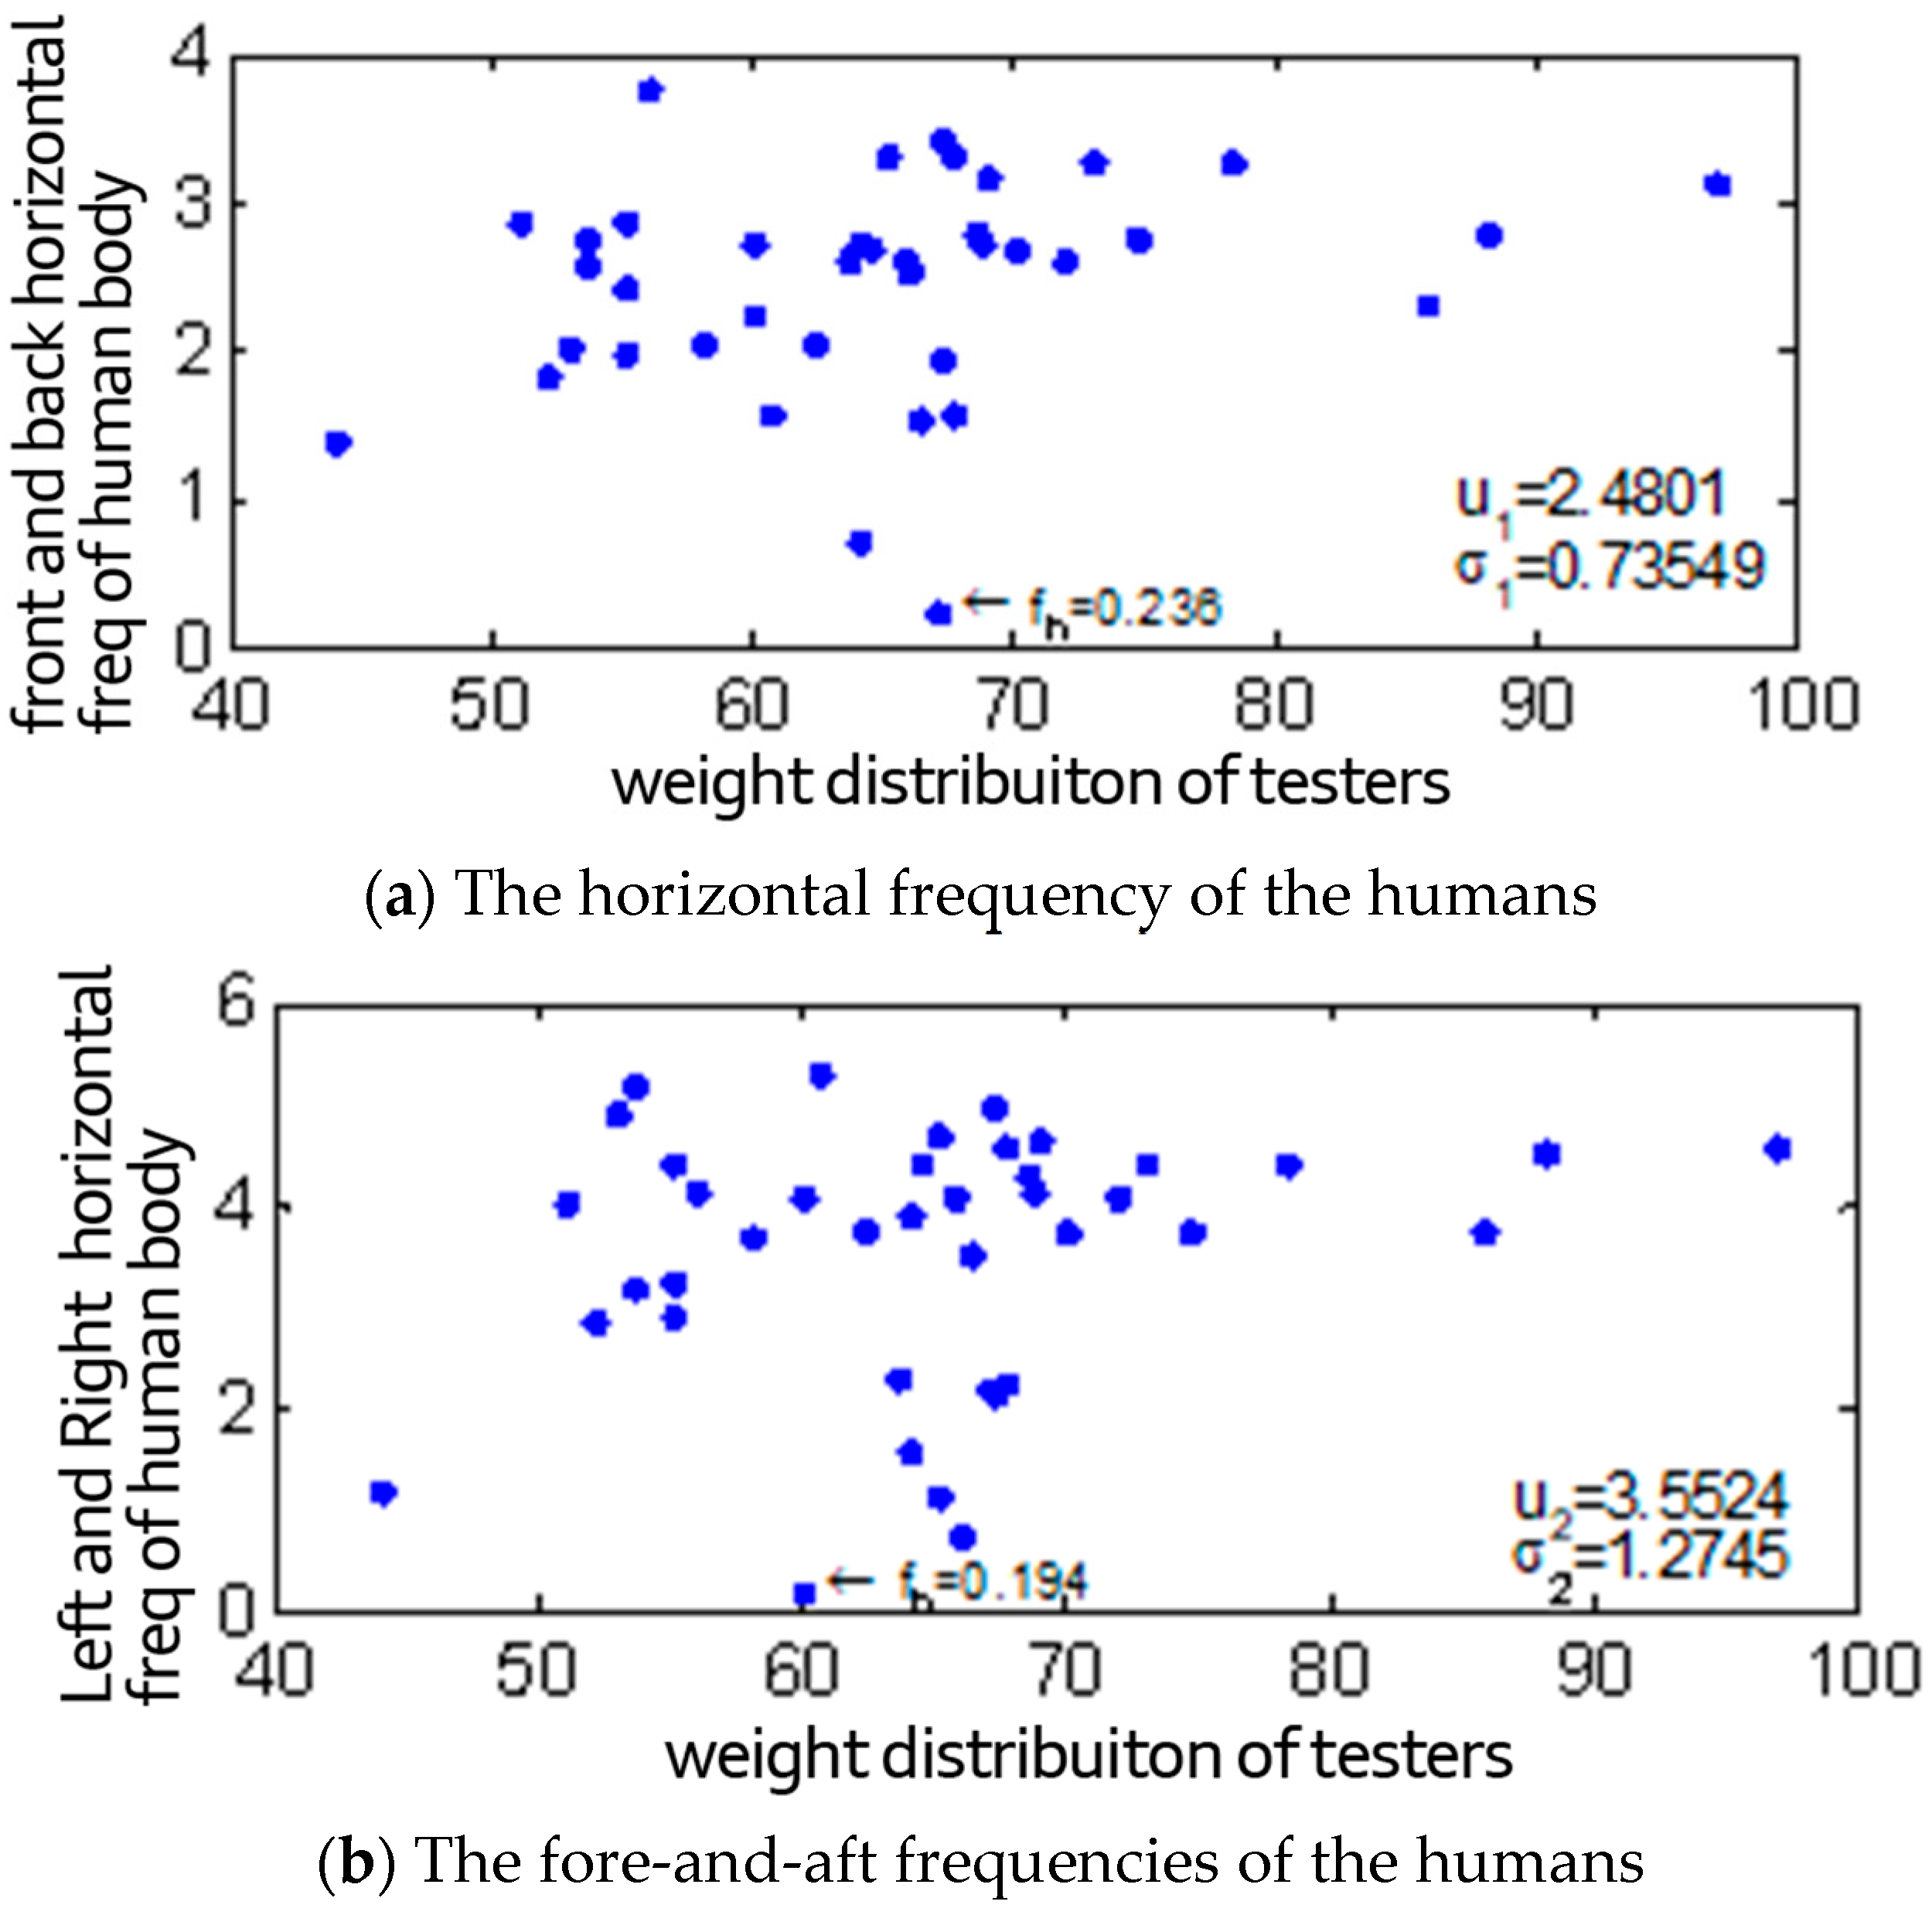
The natural frequencies of the human–structure system were measured when 40 individuals were standing in the X-direction. The ages of the test personnel were between 24 and 30; the male–female ratio was 4:1; and the weight was between 44 and 97 kg, which is typical of middle-aged and young individuals in China. In addition, e was set to 10% [20]. The horizontal frequency of the human body is calculated as per Formula (5). Figure 19 depicts the horizontal forward–backward and left–right natural frequencies of 40 individuals. The human body horizontal forward and backward minimum frequency value was 0.236 Hz, the maximum frequency value was 3.748 Hz, and the average value was 2.48 Hz. The human body horizontal left and right frequency to the minimum frequency value was 0.194 Hz, the minimum frequency value was 5.32 Hz, and the average value was 3.55 Hz.

Figure 19.
The horizontal frequencies of the humans (40 humans).
Matsumoto et al. [21] performed a human body horizontal frequency test on 12 individuals; they noted that the human body horizontal forward and backward frequency was approximately 0.125 Hz, and the human body horizontal left and right frequency was approximately 0.5 Hz. Because of the complexity of the human body, Matsumoto et al.’s test is in an exploratory stage. Herein, there is a certain difference between the value of the human horizontal frequency obtained by an indirect test and the value directly measured by Y. Matsumoto.
In summary, by combining experimentation and theory, we can ascertain that the human body horizontal forward and backward frequency range is 0.236–3.748 Hz, and the human body horizontal left and right frequency range is 0.194–5.32 Hz. Because of the difference in factors, such as height and weight, there is a difference in the horizontal frequencies of a human body.
5. Conclusions
This study presents two horizontal human–structure models (A and B). The experimental results demonstrate that human bodies cannot be modeled simply as static masses in horizontal vibration studies. Increasing the number of individuals reduces the horizontal self-resonance frequency by approximately 0.2–0.3 Hz while increasing the damping. Model B, which incorporates human rigid mass, was validated as more accurate than Model A. The observed horizontal frequency ranges were 0.236–3.748 Hz (forward–backward) and 0.194–5.32 Hz (left–right). These findings contribute to improved analysis of human–structure interactions, particularly in lightweight, slender structures, and provide a foundation for extending single-human models to crowd–structure interaction analysis.
Author Contributions
Data curation, L.W.; Writing—original draft, X.C.; Writing—review & editing, Y.L.; Supervision, M.Y. All authors have read and agreed to the published version of the manuscript.
Funding
This project was supported by the Guangzhou Basic Research Program (grant number: 2023A03J0084), 111 Project (grant number: D21021), Municipal Science and Technology Planning Project of Guangzhou (grant number: 20212200004), and school-level teaching and research projects of Guangxi Polytechnic of Construction (grant number: 2023ZDA01).
Data Availability Statement
The original contributions presented in the study are included in the article, further inquiries can be directed to the corresponding author.
Acknowledgments
The authors would like to express their gratitude to the units for their financial support.
Conflicts of Interest
The authors declare no conflict of interest.
References
- IFENG. The Auditorium Collapsed at Faye Wong Concert, 17 February 2012. IFENG. Available online: http://yue.ifeng.com/news/detail_2012_03/03/12942865_0.shtml (accessed on 3 March 2012).
- Griffin, M.J. Handbook of Human Vibration; Academic Press: Cambridge, MA, USA, 2012. [Google Scholar]
- Ji, T.; Bell, A. Seeing and Touching Structural Concepts; CRC Press: Boca Raton, FL, USA, 2018. [Google Scholar]
- Ji, T.; Ellis, B.R. A continuous model for the vertical vibration of the human body in a standing position. In Proceedings of the UK Informal Group Meeting on Human Response to Vibration, Silsoe, UK, 18–20 September 1995; pp. 18–20. [Google Scholar]
- Ji, T.; Zhou, D.; Zhang, Q. Models of a standing human body in vertical vibration. Proc. Inst. Civ. Eng.-Struct. Build. 2013, 166, 367–378. [Google Scholar] [CrossRef]
- Zhang, Q.Z. Models of a Standing Human Body in Structural Vibration. Ph.D. Thesis, The University of Manchester, Manchester, UK, 2013. [Google Scholar]
- Zhang, Q.; Ji, T. Representation of a standing body in the vertical vibration. In Proceedings of the 45th UK Conference on Human Response to Vibration, Gosport, UK, 6–8 September 2010. [Google Scholar]
- Zhou, D.; Ji, T. Free vibration of rectangular plates with attached discrete sprung masses. J. Vib. Shock 2012, 19, 101–118. [Google Scholar] [CrossRef]
- Hai, W.; Ding, Z. Modeling of the dynamic interaction of human occpupants and beam. Eng. Mech. 2010, 27, 14-020. [Google Scholar]
- Li, Y. Multi-Rigid Human Body Model in Human–Structure Interaction System. Ph.D. Dissertation, Wuhan University of Technology, Wuhan, China, 2021. [Google Scholar]
- Li, S.; Ren, M.; Zhang, Z.; Xu, M. Vertical-structure interaction system theoretical model study. J. Vib. Shock 2019, 38, 174–179+220. (In Chinese) [Google Scholar]
- Wang, Z. Comparisons of vertical dynamic characteristics of single standing occupant-simply supported beam interaction systems with three kinds of models. J. Vib. Shock 2020, 33, 952–960. [Google Scholar]
- Chen, J.-Y.; Fang, Z.-C. Study on modeling of human occupants-structure dynamic interaction. J. Vib. Shock 2007, 26, 10–13. [Google Scholar]
- He, H.; Yan, W.; Zhang, A.; Zhuo, W. Human–structure dynamic interaction and comfort evaluation in vertical ambient vibration. J. Vib. Eng. 2008, 21, 446–451. [Google Scholar]
- Van Nimmen, K.; Lombaert, G.; De Roeck, G.; Van den Broeck, P. The impact of vertical human–structure interaction on the response of footbridges to pedestrian excitation. J. Sound Vib. 2017, 402, 104–121. [Google Scholar] [CrossRef]
- Piccardo, G.; Tubino, F. Equivalent spectral model and maximum dynamic response for the serviceability analysis of footbridges. Eng. Struct. 2012, 40, 445–456. [Google Scholar] [CrossRef]
- Van Nimmen, K.; Verbeke, P.; Lombaert, G.; De Roeck, G.; Van den Broeck, P. Numerical and Experimental Evaluation of the Dynamic Performance of a Footbridge with Tuned Mass Dampers. J. Bridge Eng. 2016, 21, C4016001. [Google Scholar] [CrossRef]
- Bassoli, E.; Van Nimmen, K.; Vincenzi, L.; Van den Broeck, P. A spectral load model for pedestrian excitation including vertical human–structure interaction. Eng. Struct. 2018, 156, 537–547. [Google Scholar] [CrossRef]
- Shahabpoor, E.; Pavic, A.; Racic, V. Structural vibration serviceability: New design framework featuring human–structure interaction. Eng. Struct. 2017, 136, 295–311. [Google Scholar] [CrossRef]
- Ahmadi, E.; Caprani, C.C.; Heidarpour, A. An equivalent moving force model for consideration of human–structure interaction. Appl. Math. Model. 2017, 51, 526–545. [Google Scholar] [CrossRef]
- Matsumoto, Y.; Griffin, M.J. The horizontal apparent mass of the standing human body. J. Sound Vib. 2011, 330, 3284–3297. [Google Scholar] [CrossRef]


Disclaimer/Publisher’s Note: The statements, opinions and data contained in all publications are solely those of the individual author(s) and contributor(s) and not of MDPI and/or the editor(s). MDPI and/or the editor(s) disclaim responsibility for any injury to people or property resulting from any ideas, methods, instructions or products referred to in the content. |
© 2025 by the authors. Licensee MDPI, Basel, Switzerland. This article is an open access article distributed under the terms and conditions of the Creative Commons Attribution (CC BY) license (https://creativecommons.org/licenses/by/4.0/).