Article

Analysis of the Influence of Incorporating Different Thermal-Insulating Materials into the Sub-Ballast Layers

1
Department of Railway Engineering and Track Management, University of Žilina, Univerzitná 8215/1, 010 26 Žilina, Slovakia
2
Department of Mobile Machinery and Railway Transport, Vilnius Gediminas Technical University, 10223 Vilnius, Lithuania
3
Department of Transport Engineering, Vilniaus Kolegija Higher Education Institution, 08105 Vilnius, Lithuania
*
Author to whom correspondence should be addressed.
Buildings 2025, 15(2), 239; https://doi.org/10.3390/buildings15020239
Submission received: 6 December 2024 / Revised: 4 January 2025 / Accepted: 8 January 2025 / Published: 15 January 2025
(This article belongs to the Section Building Materials, and Repair & Renovation)

Abstract

:
Adverse climatic conditions, particularly excessive water and frost, necessitate the design of thick protective sub-ballast layers when dealing with frost-susceptible subgrade surfaces, especially when using standard natural materials (crushed aggregate or gravel–sand). Given the current preference for conserving natural construction materials and promoting sustainable development in the dimensioning of sub-ballast layers, it is advisable to incorporate various thermal insulation, composite, or suitable recycled materials in their design. Therefore, the paper analyses the impact of incorporating different thermal insulation materials (including extruded polystyrene, Liapor, Liapor concrete, and composite foam concrete) into sub-ballast layers. As part of the experimental research, these modified sub-ballast layers were constructed on a real scale in the outdoor environment of the University of Žilina (UNIZA) campus. They were subsequently compared in terms of their thermal resistance to climatic loads. The research results demonstrate that extruded polystyrene provides the optimal thermal insulation effect in modified sub-ballast layers, which was subsequently used in the numerical modelling of railway track structure freezing under different climatic loads.

1. Introduction

A frequent cause of railway track geometry defects, aside from operational influences [1], is an inappropriate design composition of the track structure, particularly the sub-ballast layers. In this context, the subgrade surface—the weakest structural component—plays a decisive role, especially in the conventional ballasted superstructure. The presence of fine-grained materials (Slovakia) that are susceptible to frost and not highly resistant to deformation, combined with insufficient protection against freezing and traffic loads, creates conditions that lead to faults and defects in the railway track structure. Each railway line must be evaluated for both traffic (static and dynamic) and non-traffic (climatic) loads. When assessing the railway track structure (sub-ballast layers) in terms of non-traffic loads, the effects of water and frost are critical in determining track quality. For frost action, it is essential that the design of the sub-ballast layers provides adequate thermal resistance. This ensures that during the winter period, or when the railway track structure is exposed to freezing conditions, the zero isotherm does not reach the frost-susceptible subgrade surface.
The thermal resistance of sub-ballast layers primarily depends on the thickness and the thermal conductivity coefficient (λ) of their individual structural layers. When thermal insulation materials with a thermal conductivity coefficient λ < 0.4 W·m−1·K−1 (e.g., expanded or extruded polystyrene, polyurethane, Liapor, foam glass, composite foam concrete) are applied in sub-ballast layers, it is possible to reduce the thickness of these layers compared to constructions that use only standard natural materials (e.g., crushed aggregate or gravel–sand). The construction market currently offers a variety of thermal insulation materials with different compositions and properties. In technically and ecologically advanced countries, there is a strong emphasis on sustainable development and conserving natural resources. This has led to the use of recycled resources (e.g., foam glass production) and foam-forming substances (e.g., composite foam concrete) in the production of building materials and thermal insulation materials.
The formation of track geometry faults is significantly influenced by uneven track settlement, which primarily results from the presence of fine-grained materials in the subgrade surface when exposed to water and frost. Issues related to water presence in porous materials and the processes of freezing and thawing are discussed in publications [2,3,4,5]. Research on the factors influencing uneven track settlement and methods for its mitigation can be found in publications [6,7,8].
The resistance of the railway track structure to applied climatic loads (especially frost action) primarily depends on the physical [9] and thermal insulation properties of the materials used in its individual structural layers [10,11]. In designing sub-ballast layers in areas with adverse climatic conditions (particularly those with a high frost index), it is necessary to conserve natural resources by reducing the use of standard construction materials (gravel–sand or crushed aggregate) and replacing them with materials that demonstrate better thermal insulation and, if necessary, deformation properties [12,13,14,15,16,17,18,19,20,21,22,23]. Experience with the application of expanded polystyrene (EPS), specifically EPS geofoam, in railway track construction is discussed in ref. [24]. Various embankment stabilisation techniques in permafrost areas and methods for applying extruded polystyrene (XPS) in sub-ballast layers, particularly at the sub-ballast upper surface, are detailed in refs. [25,26].
The effect of incorporating expanded clay aggregate (LECA) into pavement structural layers, and its comparison with extruded polystyrene, is examined in ref. [27]. The application of artificial aggregates—LECA (from extruded clay) and GLASOPOR (from waste glass)—in the structural layers of railway tracks, and their benefits for protecting against track freezing, are discussed in ref. [28]. The use of a composite layer of foam concrete in pavement structures for frost protection is explored in refs. [29,30]. Additionally, the application of foam concrete composite layers in the structural composition of railway tracks and their resistance to dynamic loads imposed by moving trains are detailed in ref. [31].
The paper aims to compare the effects of different embedded thermal insulation materials (extruded polystyrene, expanded clay aggregate—Liapor, Liapor concrete, composite foam concrete) on the railway track structure freezing. For this purpose, the DRETM (Department of Railway Engineering and Track Management) test stand (Figure 1)—Sector A was constructed, where each measurement profile represents a different material composition of the sub-ballast layers (standard—without thermal insulation material or modified—with built-in thermal insulation material) [32]. In addition to Sector A, the test stand includes Sector B and Sector C, which allow the assessment of the designed modified compositions of the sub-ballast layers [33], as well as other designed structures in terms of the applied static loads [34]. Sector B allows for static load testing on individual layers of the modified railway track structure constructed on real subgrade and under real climatic conditions. Sector C includes a steel container located within a closed shelter, enabling the testing of various geotechnical characteristics even in adverse weather conditions. These sectors of the DRETM test stand are used in the department’s research to address other issues related to the design of structural layers of the railway track bed, although they are not directly related to the topic discussed in the paper. They are mentioned here only because they are visible in the following figures.
The following chapters of this paper detail the material compositions of individual measurement profiles (MP), evaluate the climatic parameters identified experimentally to date, determine the most effective material composition for enhancing the resistance of sub-ballast layers to frost, and present the numerical modelling of the specified material composition. This includes modifications to account for significantly more adverse climatic conditions, such as higher frost indices or increased frequency and intensity of frost periods.

2. Materials and Methods

The construction of individual measurement profiles for the test stand, representing various structural compositions and thermal resistances of the track, was conducted at a 1:1 scale (Figure 1) and started in 2012. The DRETM test stand was constructed in the outdoor area of the UNIZA campus, the workplace of the authors of this paper (with the last author having been on a long-term internship at the institution). In response to a request from the Railways of the Slovak Republic to revise and update the design methodology for dimensioning the structural layers of the railway track bed—outlined in their legislative document [35]—and to address the decreasing intensity of winter periods (in terms of both frost index values and snowfall quantities), the decision was made to construct the test stand directly on the UNIZA campus. This choice also enabled the testing of a wide range of constructions and thermal insulation materials under controlled conditions.
This decision stemmed not only from the avoidance of constructing test sections on various operational railway tracks across Slovakia—which would have incurred significant financial costs and operational restrictions, including the need for track closures—but also from the climatically advantageous location of Žilina. The city, and thus the UNIZA campus, is favourably positioned in terms of the design frost index (approximately 480 °C, day), within the range of 250 °C, day to 750 °C, day considered across Slovakia. Consequently, the campus represents a mid-range location regarding winter intensity in the country.
The need to test multiple constructions under varying winter conditions (frost intensity as indicated by the frost index and snowfall quantities) and to simultaneously obtain relevant input parameters for the thermal regime of railway track structures—including the influence of snow cover on track bed freezing—made the establishment of the test stand the ideal solution. The choice of location was also driven by the requirement to embed various thermal insulation materials and a significant number of measuring sensors (for temperature and humidity measurements) into the individual structures—something unfeasible on operational railway tracks.
Additionally, most of the thermal insulation materials tested had not yet been applied or experimentally evaluated on Slovak railway tracks. Moisture monitoring using the TDR method was initially conducted daily, later weekly, and during winter periods, the influence of snow cover was also observed, with snow being removed from certain measuring profiles as needed. Constructing the test stand outside the UNIZA campus would have been prohibitively time-consuming and costly for the scope of the research.
The measured data were further supplemented with climate data from the Slovak Hydrometeorological Institute (SHI), providing real-world climate load parameters for use in numerical modelling. This approach expanded the scope of numerical modelling to include both less and more extreme winter conditions recorded in Slovakia. It is anticipated that this combination of data acquisition methods will ensure the collection of relevant input data for numerical modelling and facilitate their generalization to other climatic environments where railway tracks are situated.
The research aimed to compare the standard structural composition of the sub-ballast layers (measurement profile no. 1—with a protective layer of crushed aggregate, measurement profile no. 2—without a protective layer) with a modified construction that includes a built-in thermal insulation layer (measurement profiles no. 3, 4, 6, and 7). Additionally, the research examined the impact of railway track alignment (embankment—measurement profiles no. 1–4 versus cutting—measurement profiles no. 5–7). Figure 2 illustrates the actual configuration of the test stand during the winter period, including the markings of the individual measurement profiles.

2.1. Measuring Equipment and Method of Evaluating Measured Data

In terms of experimental monitoring of the effects of non-transport loads (climatic loads) on the railway track structure, identical measuring elements were incorporated into all measurement profiles. These elements allow non-destructive monitoring of moisture and temperature variations in individual sub-ballast layers, specifically for detecting freezing in the railway track structure.
Moisture measurement of the individual structural layers of the measurement profiles was implemented using time domain reflectometry (TDR), specifically with a Trime-Pico T3/IPH44 moisture probe connected to the HD2 reading device (Figure 3, left photo). Temperature measurements in the different parts of the structure were carried out using ground resistance temperature sensors, Pt1000 (Figure 3, second photo from the left). Temperature data are collected continuously (every 30 min) by connecting the temperature sensors to a data logger housed in a distributor (Figure 3, third photo from the left).
At the same time, temperature and relative moisture measurements (for subsequent evaluation of the climatic characteristics of individual winter seasons) were conducted using the Comet T3419 sensor, placed 2.0 m above the ground surface in a professional thermometer screen (Figure 3, right photo). Experimental moisture monitoring using the TDR method could not be carried out in all structural layers of the measurement profiles due to the nature of the embedded materials. This included cases where the structural layer thickness was less than 150 mm (such as all thermal insulation materials) or where the material contained a large proportion of air gaps (such as the ballast bed). This method was primarily used to determine the moisture content of the subgrade of the measurement profiles, consisting of clay with river gravel admixture, and for the structural layers consisting of 0/31.5 mm or 0/63 mm crushed aggregate.
Measurements using the TDR method were conducted every two weeks throughout the year and more frequently during periods of exceptional rainfall, at the beginning and end of the winter season, or during the winter season if there was a thaw. The materials measured by the TDR method did not demonstrate significant changes in moisture content during the year (experimentally measured data are reported in several publications [36]). The measured values will be used as input parameters for the numerical modelling (see Section 3.2). To determine the moisture content of the other embedded materials of the measurement profiles (ballast bed, thermal insulation materials), the standard laboratory method (drying the test material in a drying oven) was used.
The most significant climatic characteristic to monitor is air temperature. As part of the evaluation of climatic characteristics, it is necessary to determine the following:
  • The mean daily air temperature θs in °C, where θ7, θ14 and θ21 denote the air temperatures measured at 7:00, 14:00 and 21:00 o’clock GMT at a height of 2.0 m above the ground surface;
    θ s = θ 7 + θ 14 + 2 · θ 21 4
  • The average annual air temperature θm in °C;
    θ m = i = 1 365 θ s 365
  • Air frost index IF in °C, day (sum of mean daily air temperatures θs of the frost period);
    I F = t b t f θ s
In the Slovak Republic, the air frost index IF is most frequently used for determining the structural and material composition of railway tracks. This index influences the thermal regime and the assessment of sub-ballast layers in terms of protecting the frost-susceptible subgrade surface from frost effects.
The thermal regime of the structural layers of the railway track is defined as the gradual change in the thermal state of the individual layers and the subgrade of the railway track structure. This change depends on the intensity of applied solar radiation (which causes variations in air temperature throughout the day or year) and the effects of frost. A critical parameter for dimensioning the structural layers of the railway track to withstand adverse frost conditions is the frost depth DF. The following relation, according to [35], is used for its calculation:
D F = 0.045 · I F
However, during the evaluation of the experimental measurements, the frost depth DF of the railway structure was determined by interpolating the temperatures between the two nearest thermometers, which were spaced 150 mm apart within the measurement profiles around the area of interest. This interpolation was performed in the region where the 0-isotherm was located.
The efficiency of the entire designed railway track structure, including the ballast bed and sub-ballast layers, specifically from the perspective of protecting the frost-susceptible subgrade surface from the adverse effects of frost, can be expressed in terms of the thermal resistance R (m2·K·W−1). Thermal resistance increases with greater structural thickness of the individual layers ti (m) and decreases with their lower thermal conductivity coefficients λ (W·m−1·K−1). The total thermal resistance of the multilayer track bed can be calculated using the following relation:
R = i = 1 n t i λ i
Track bed structures with a higher thermal resistance value R demonstrate superior thermal insulation properties and more effectively protect the frost-susceptible subgrade surface from the adverse effects of frost [35].

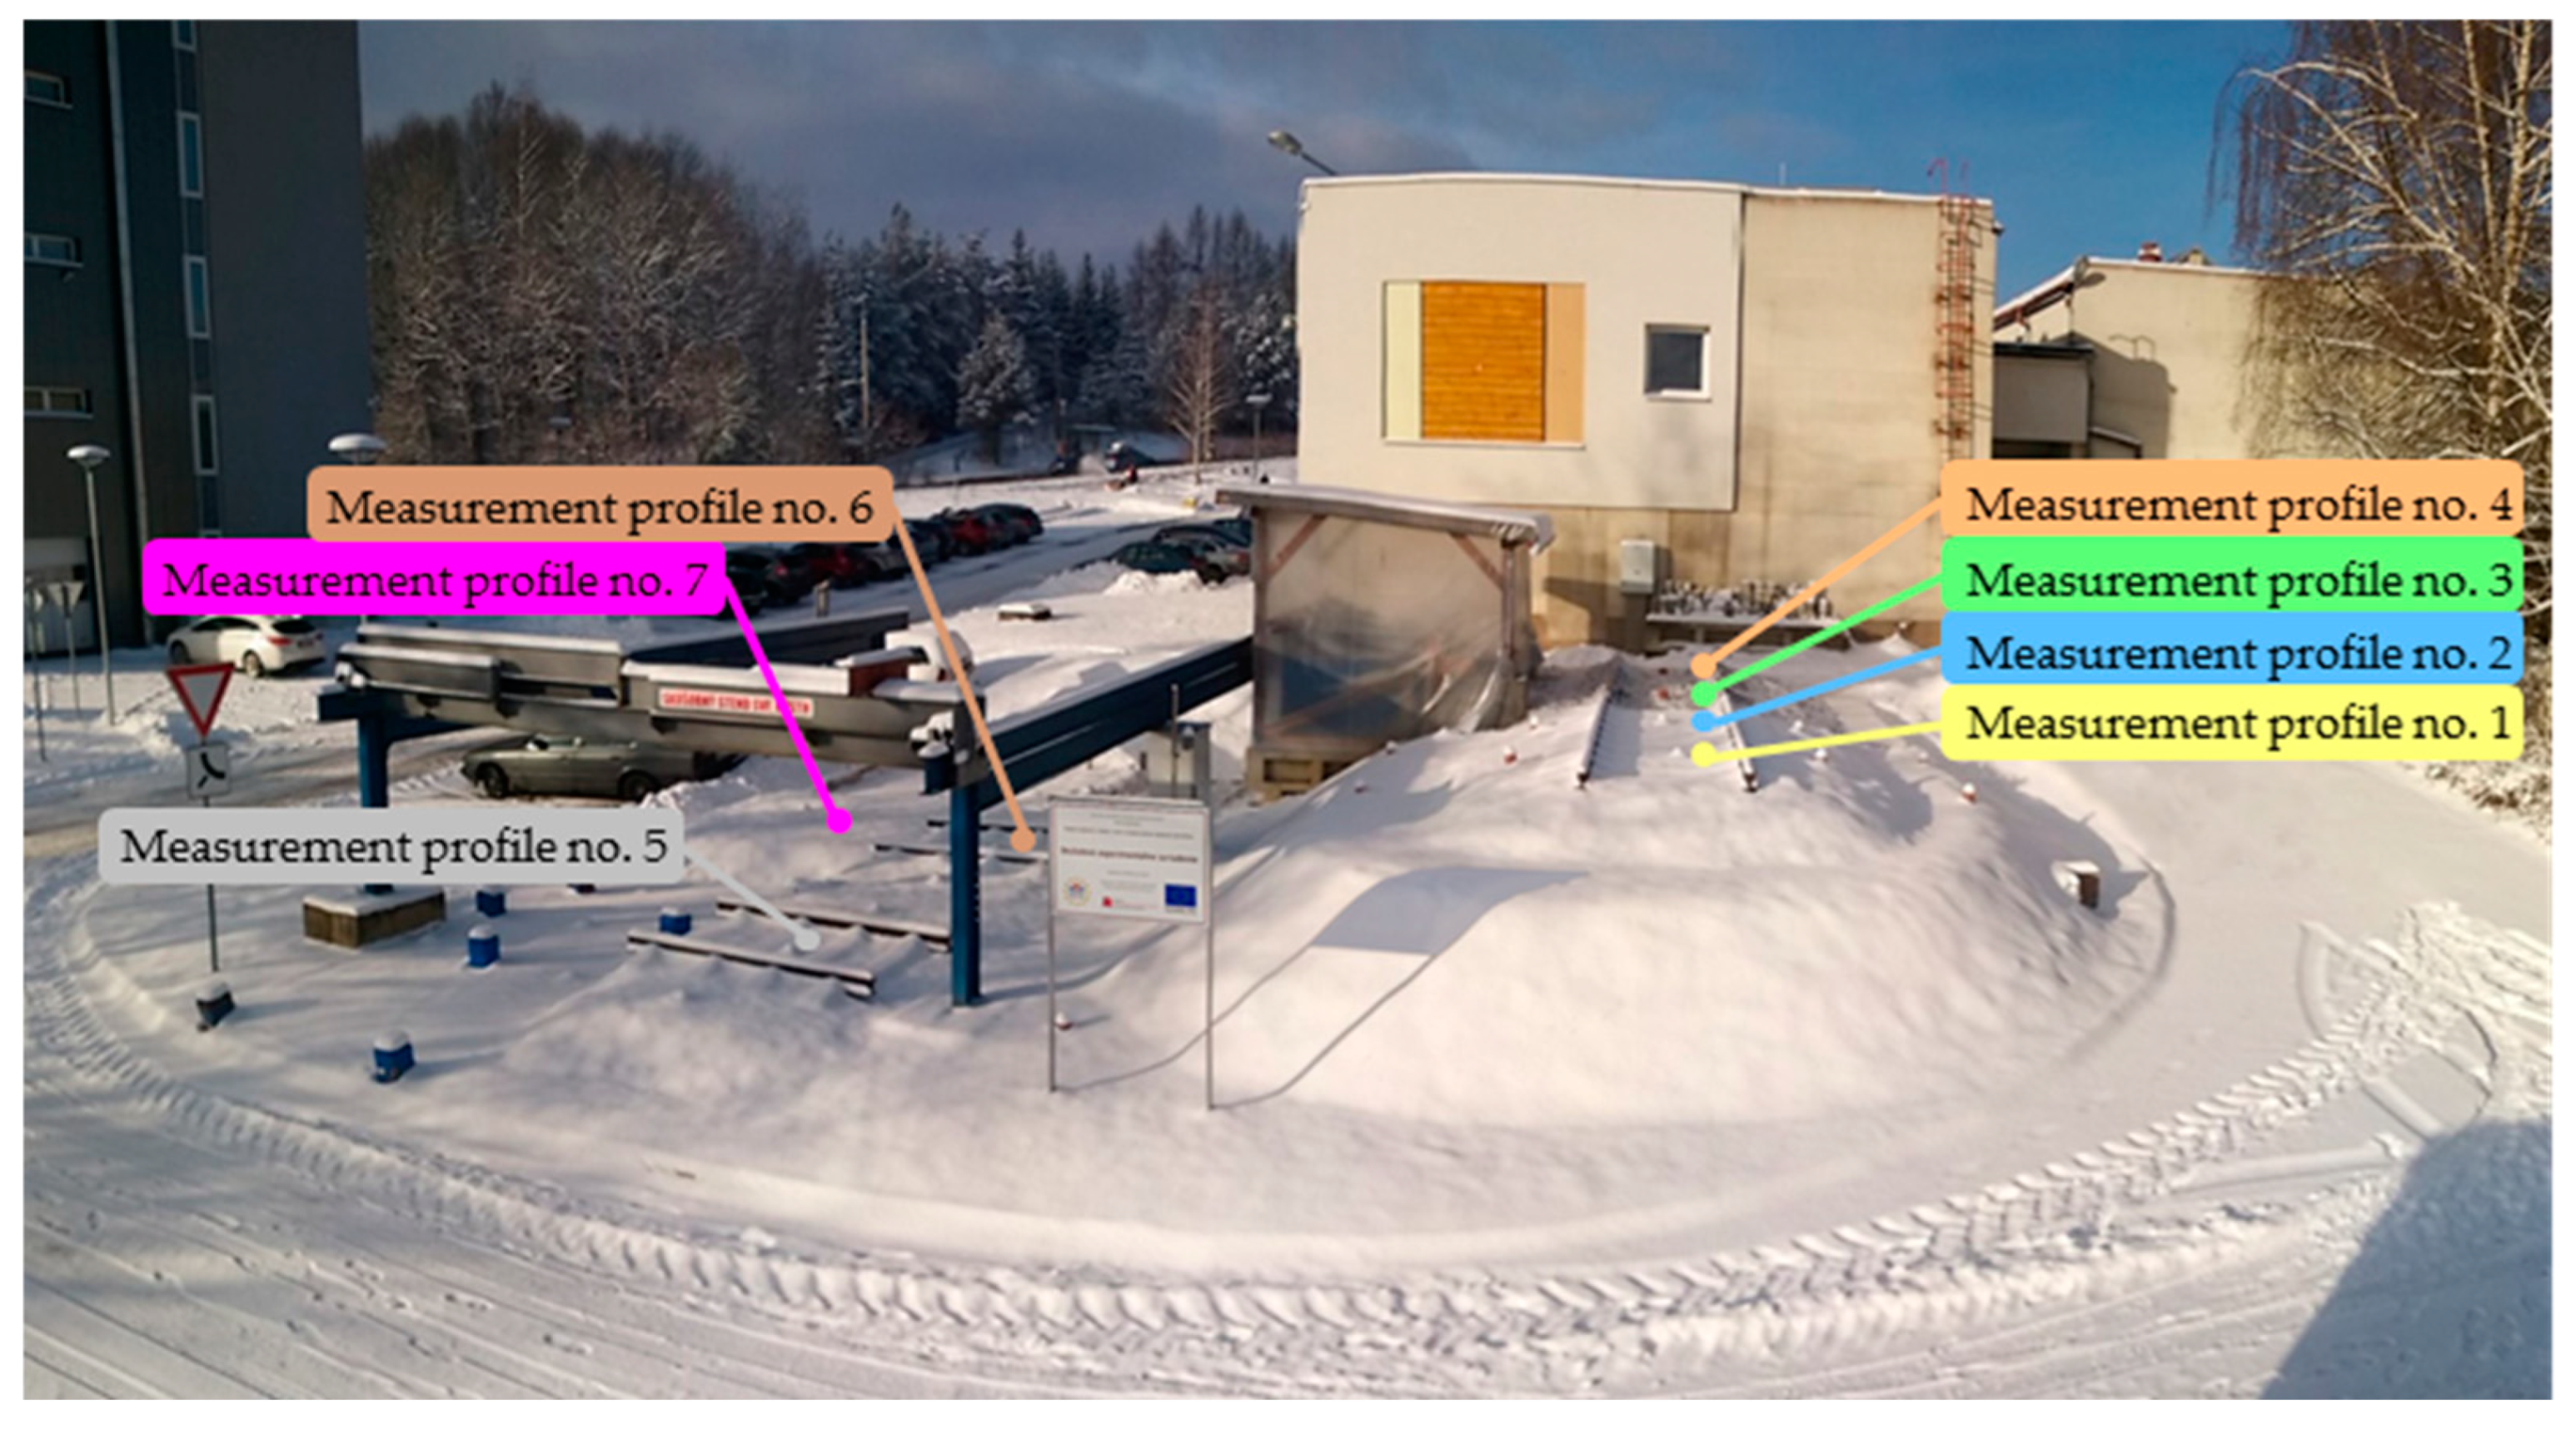
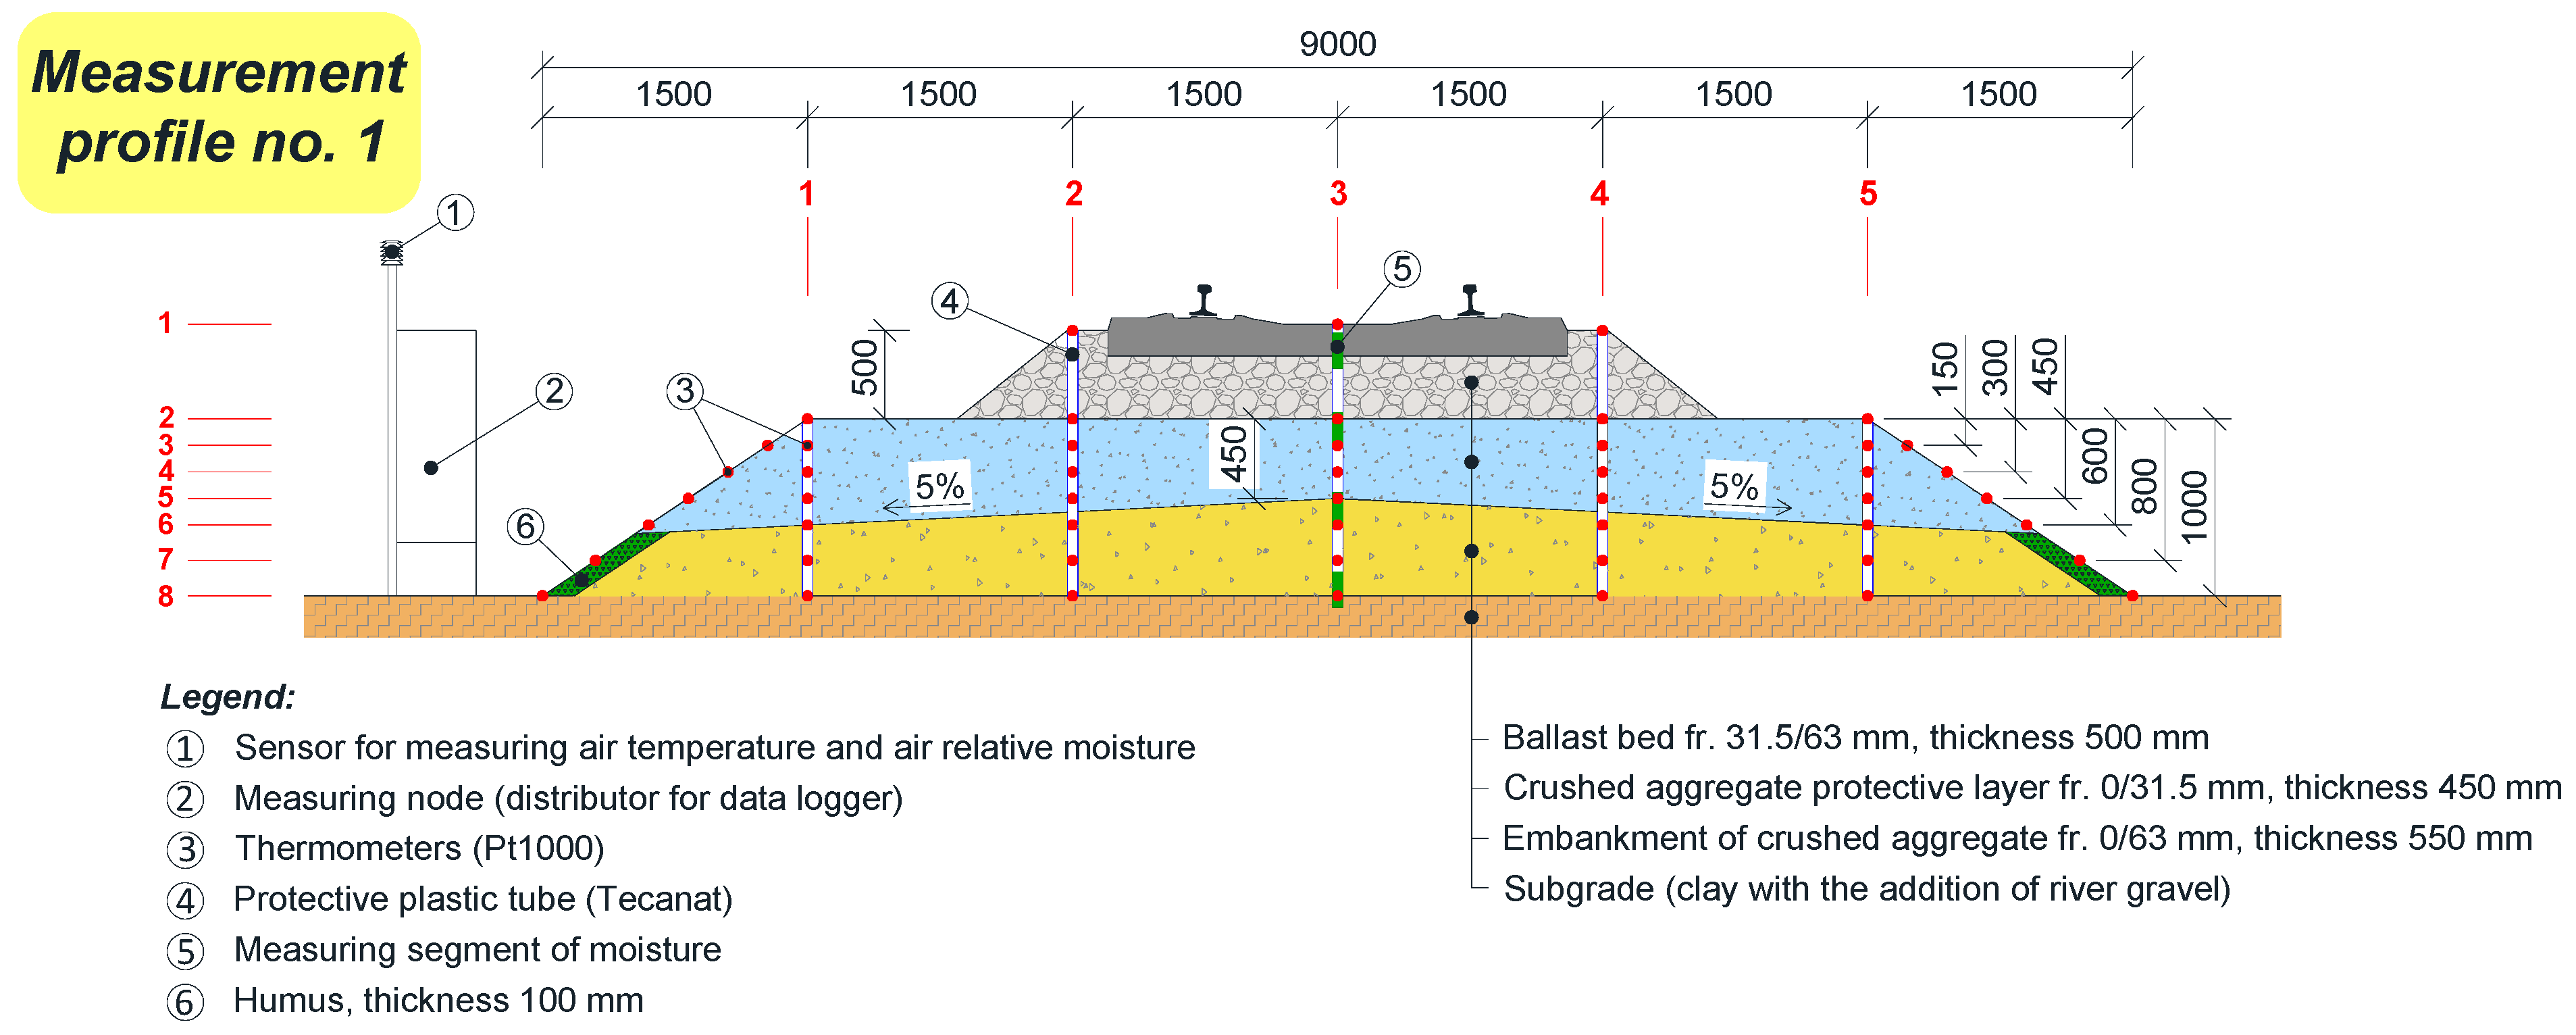
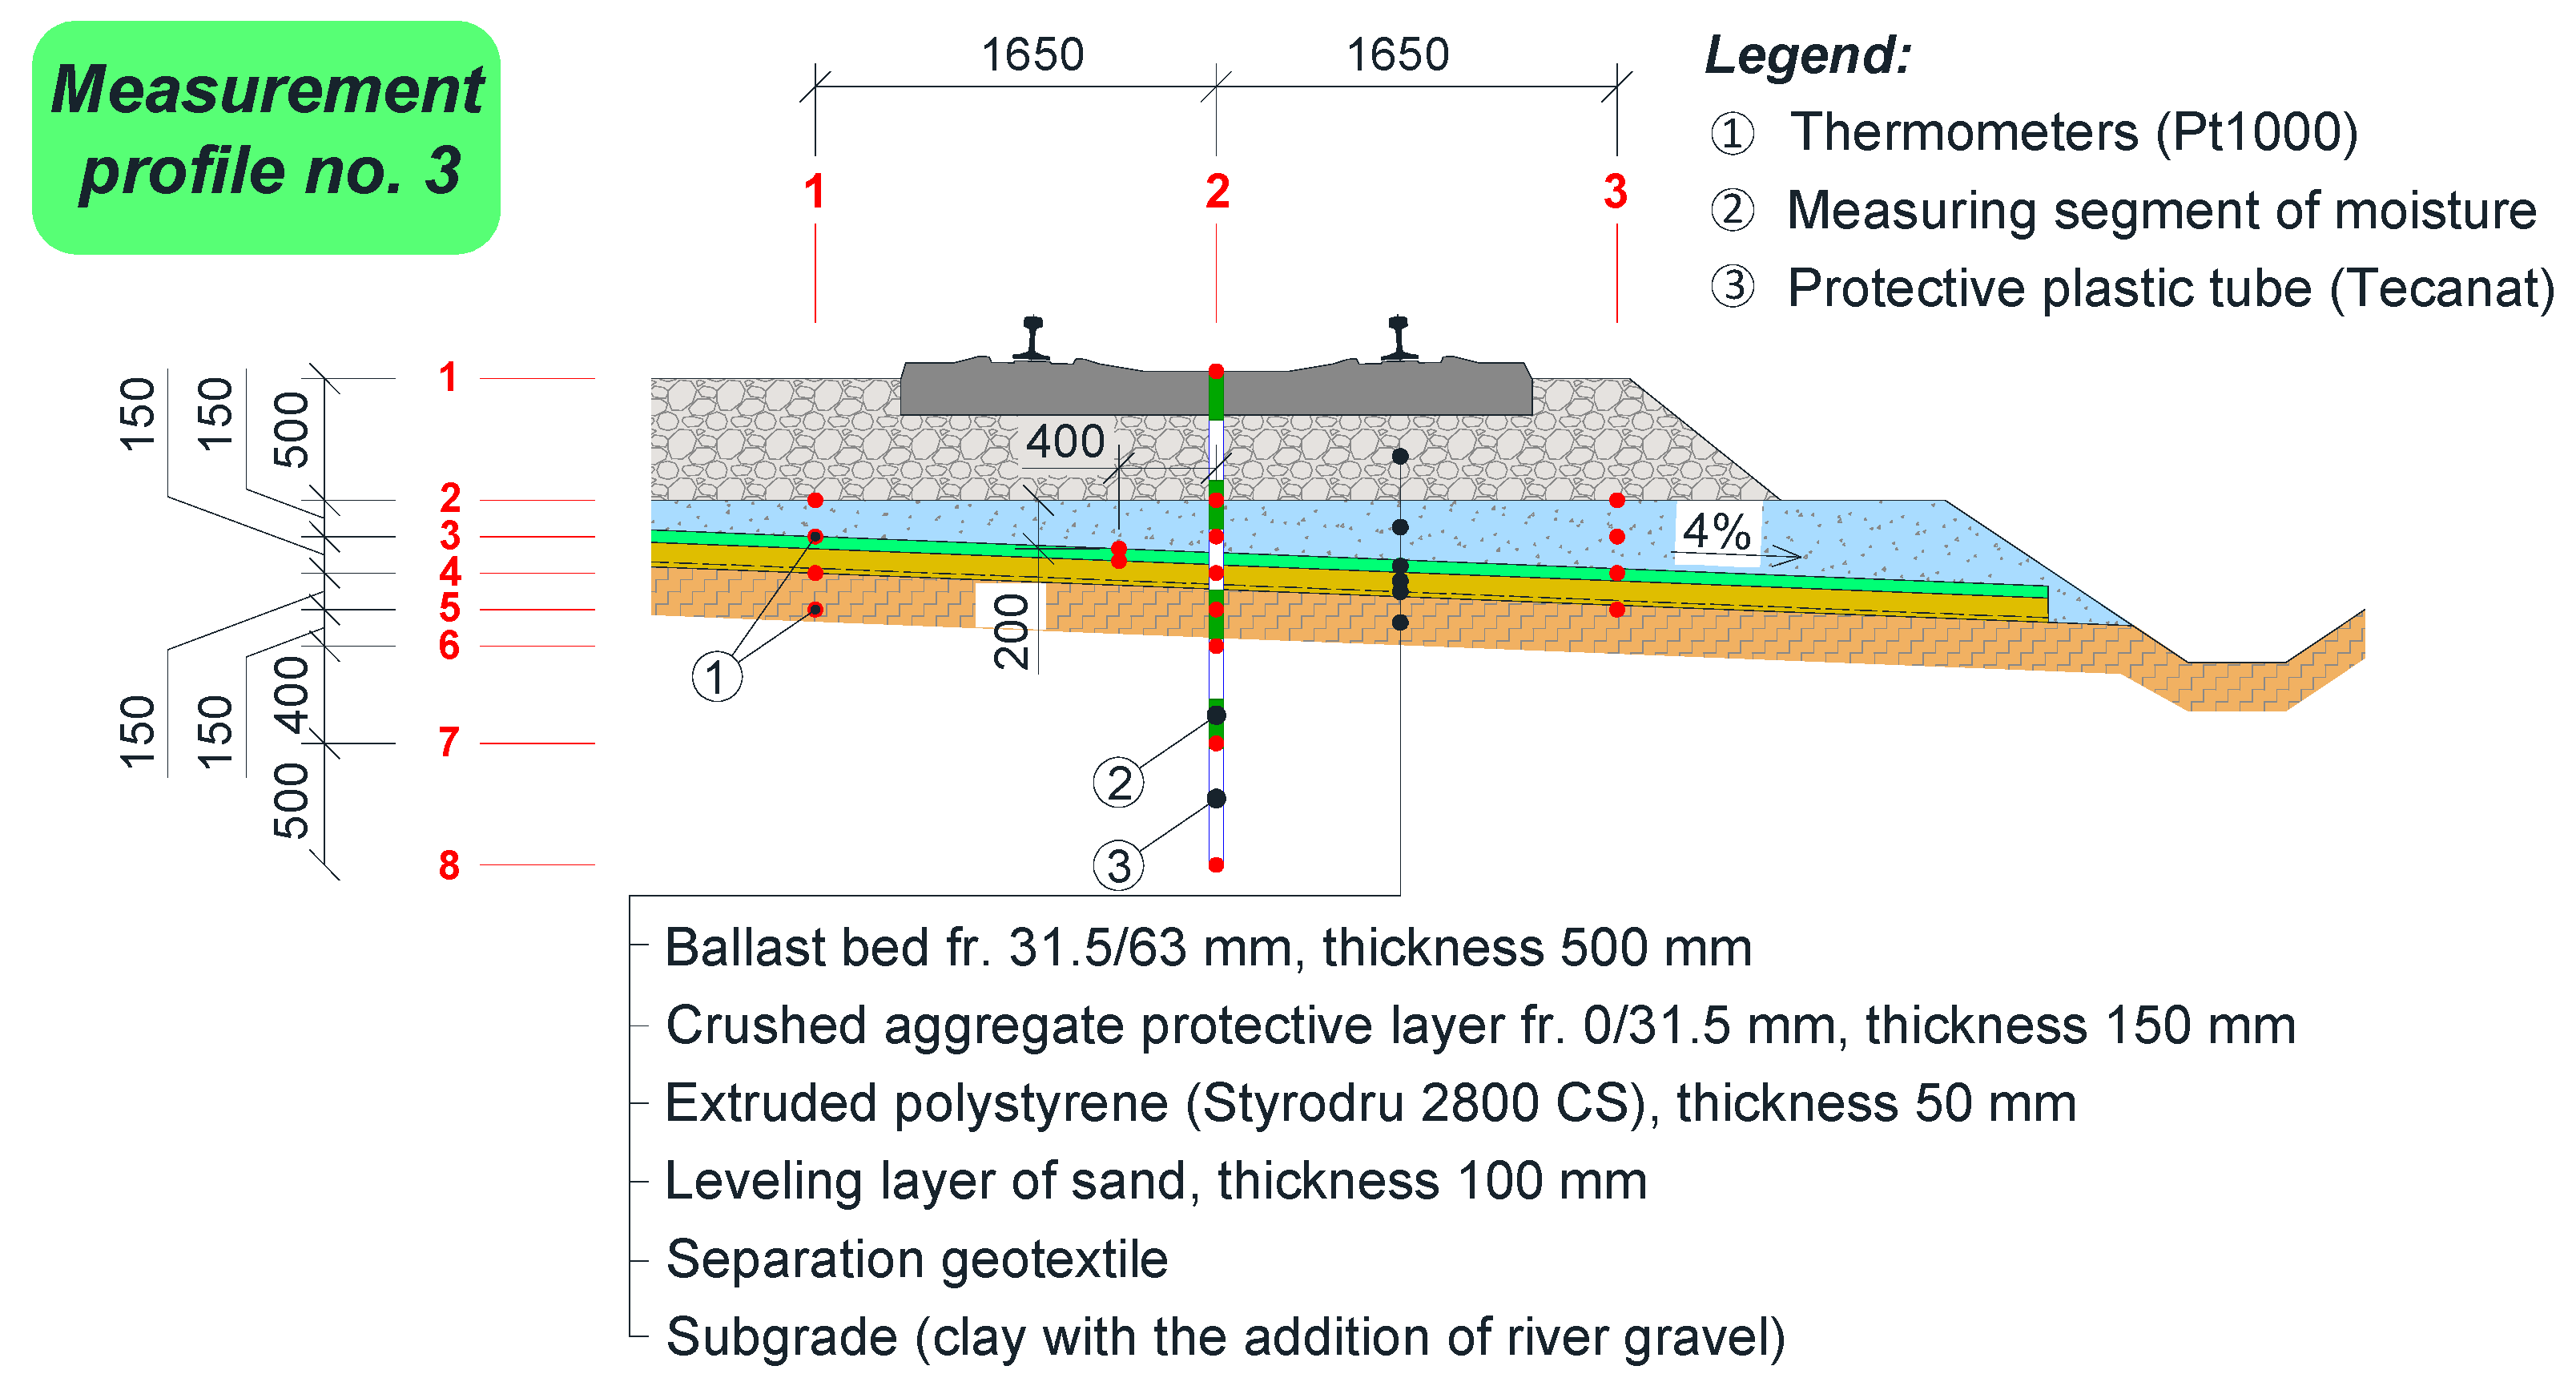
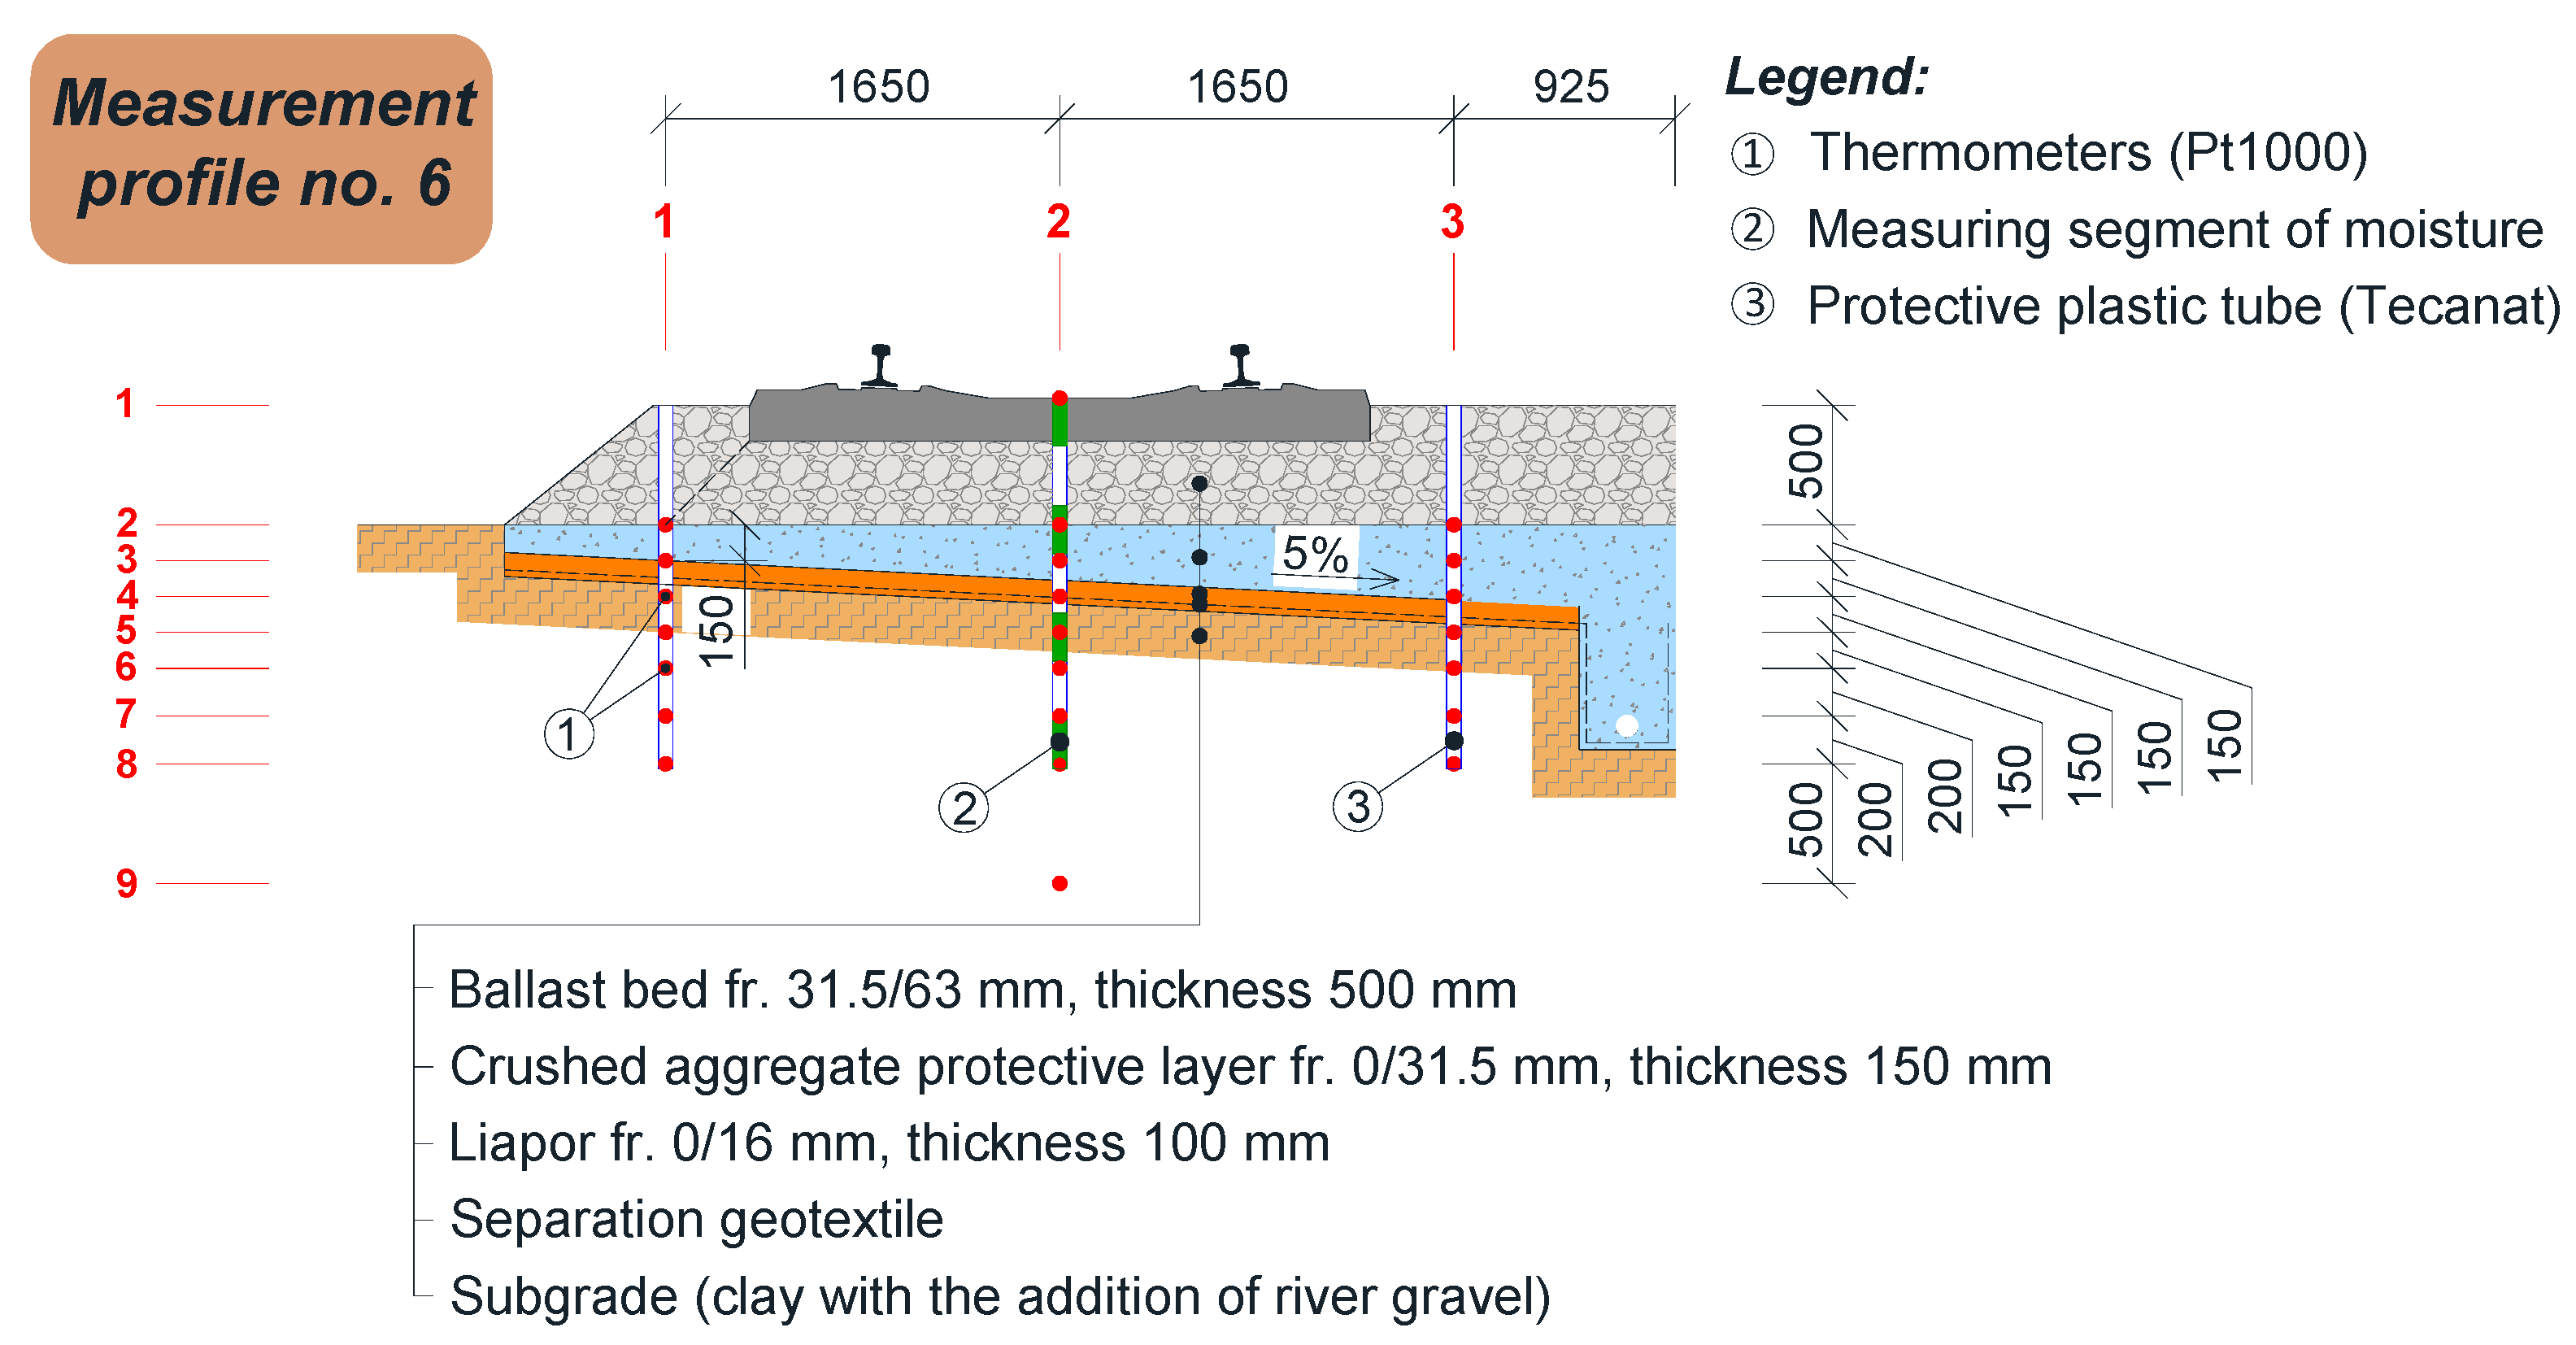
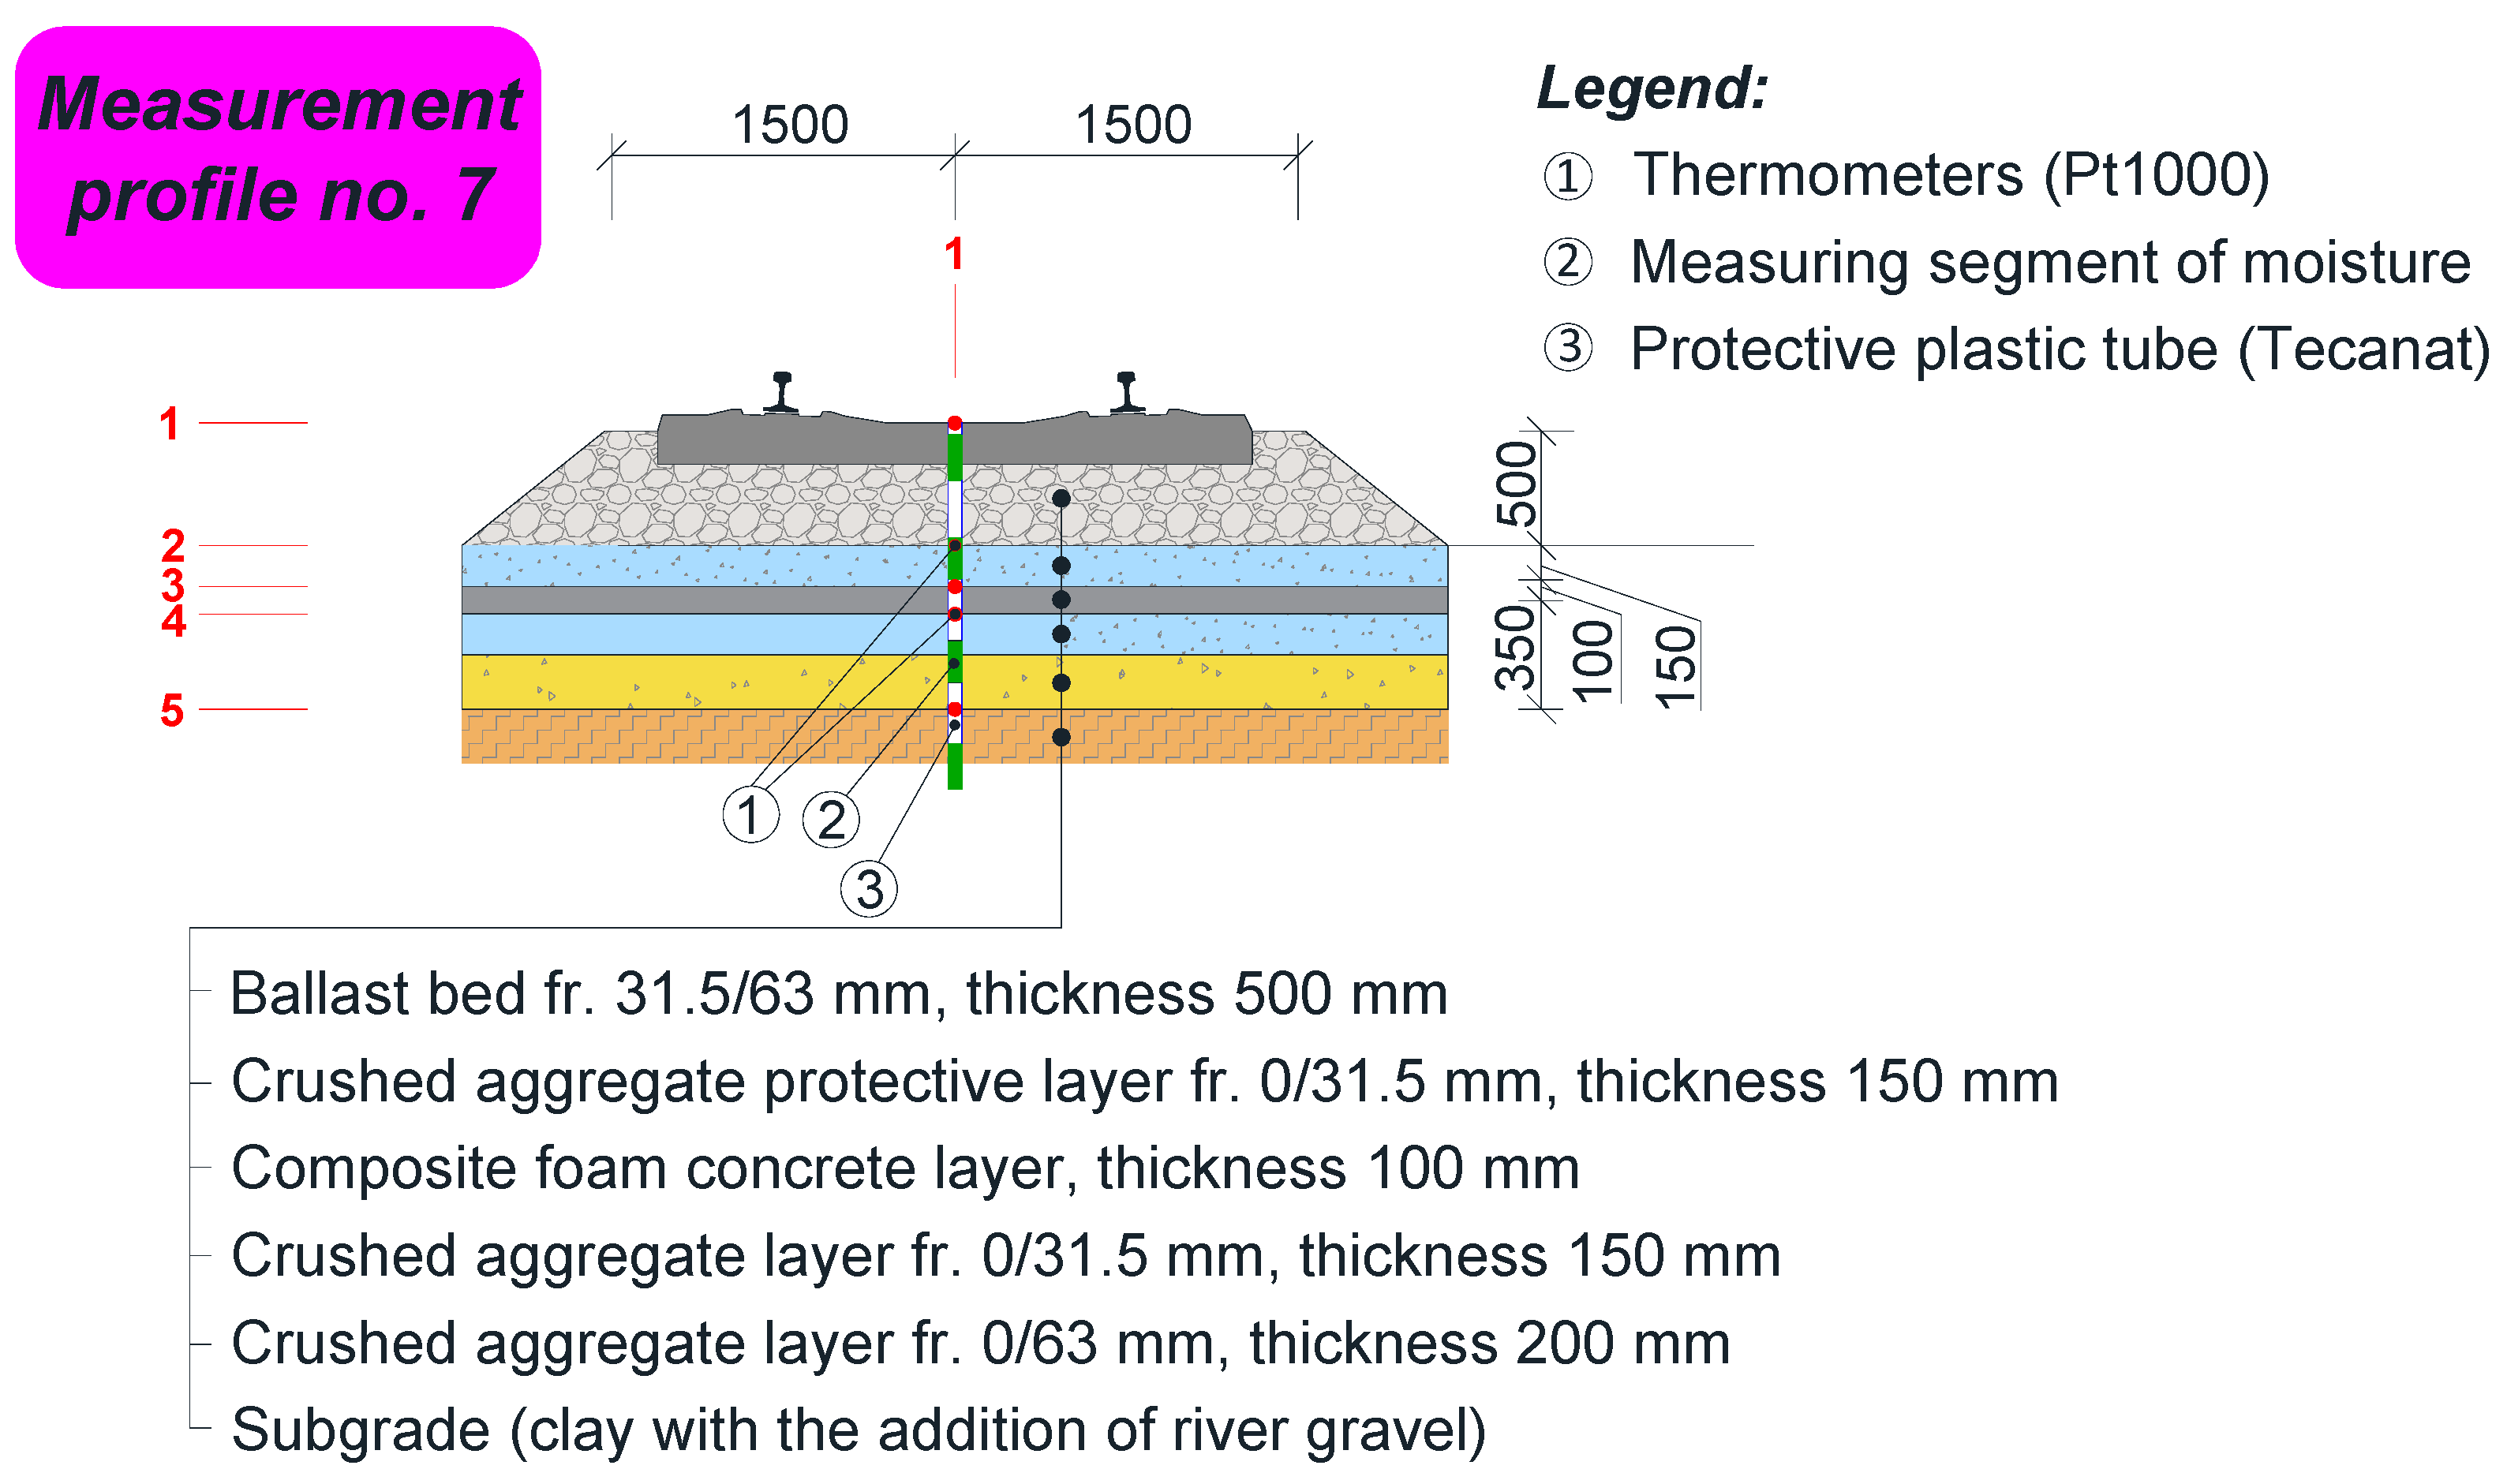
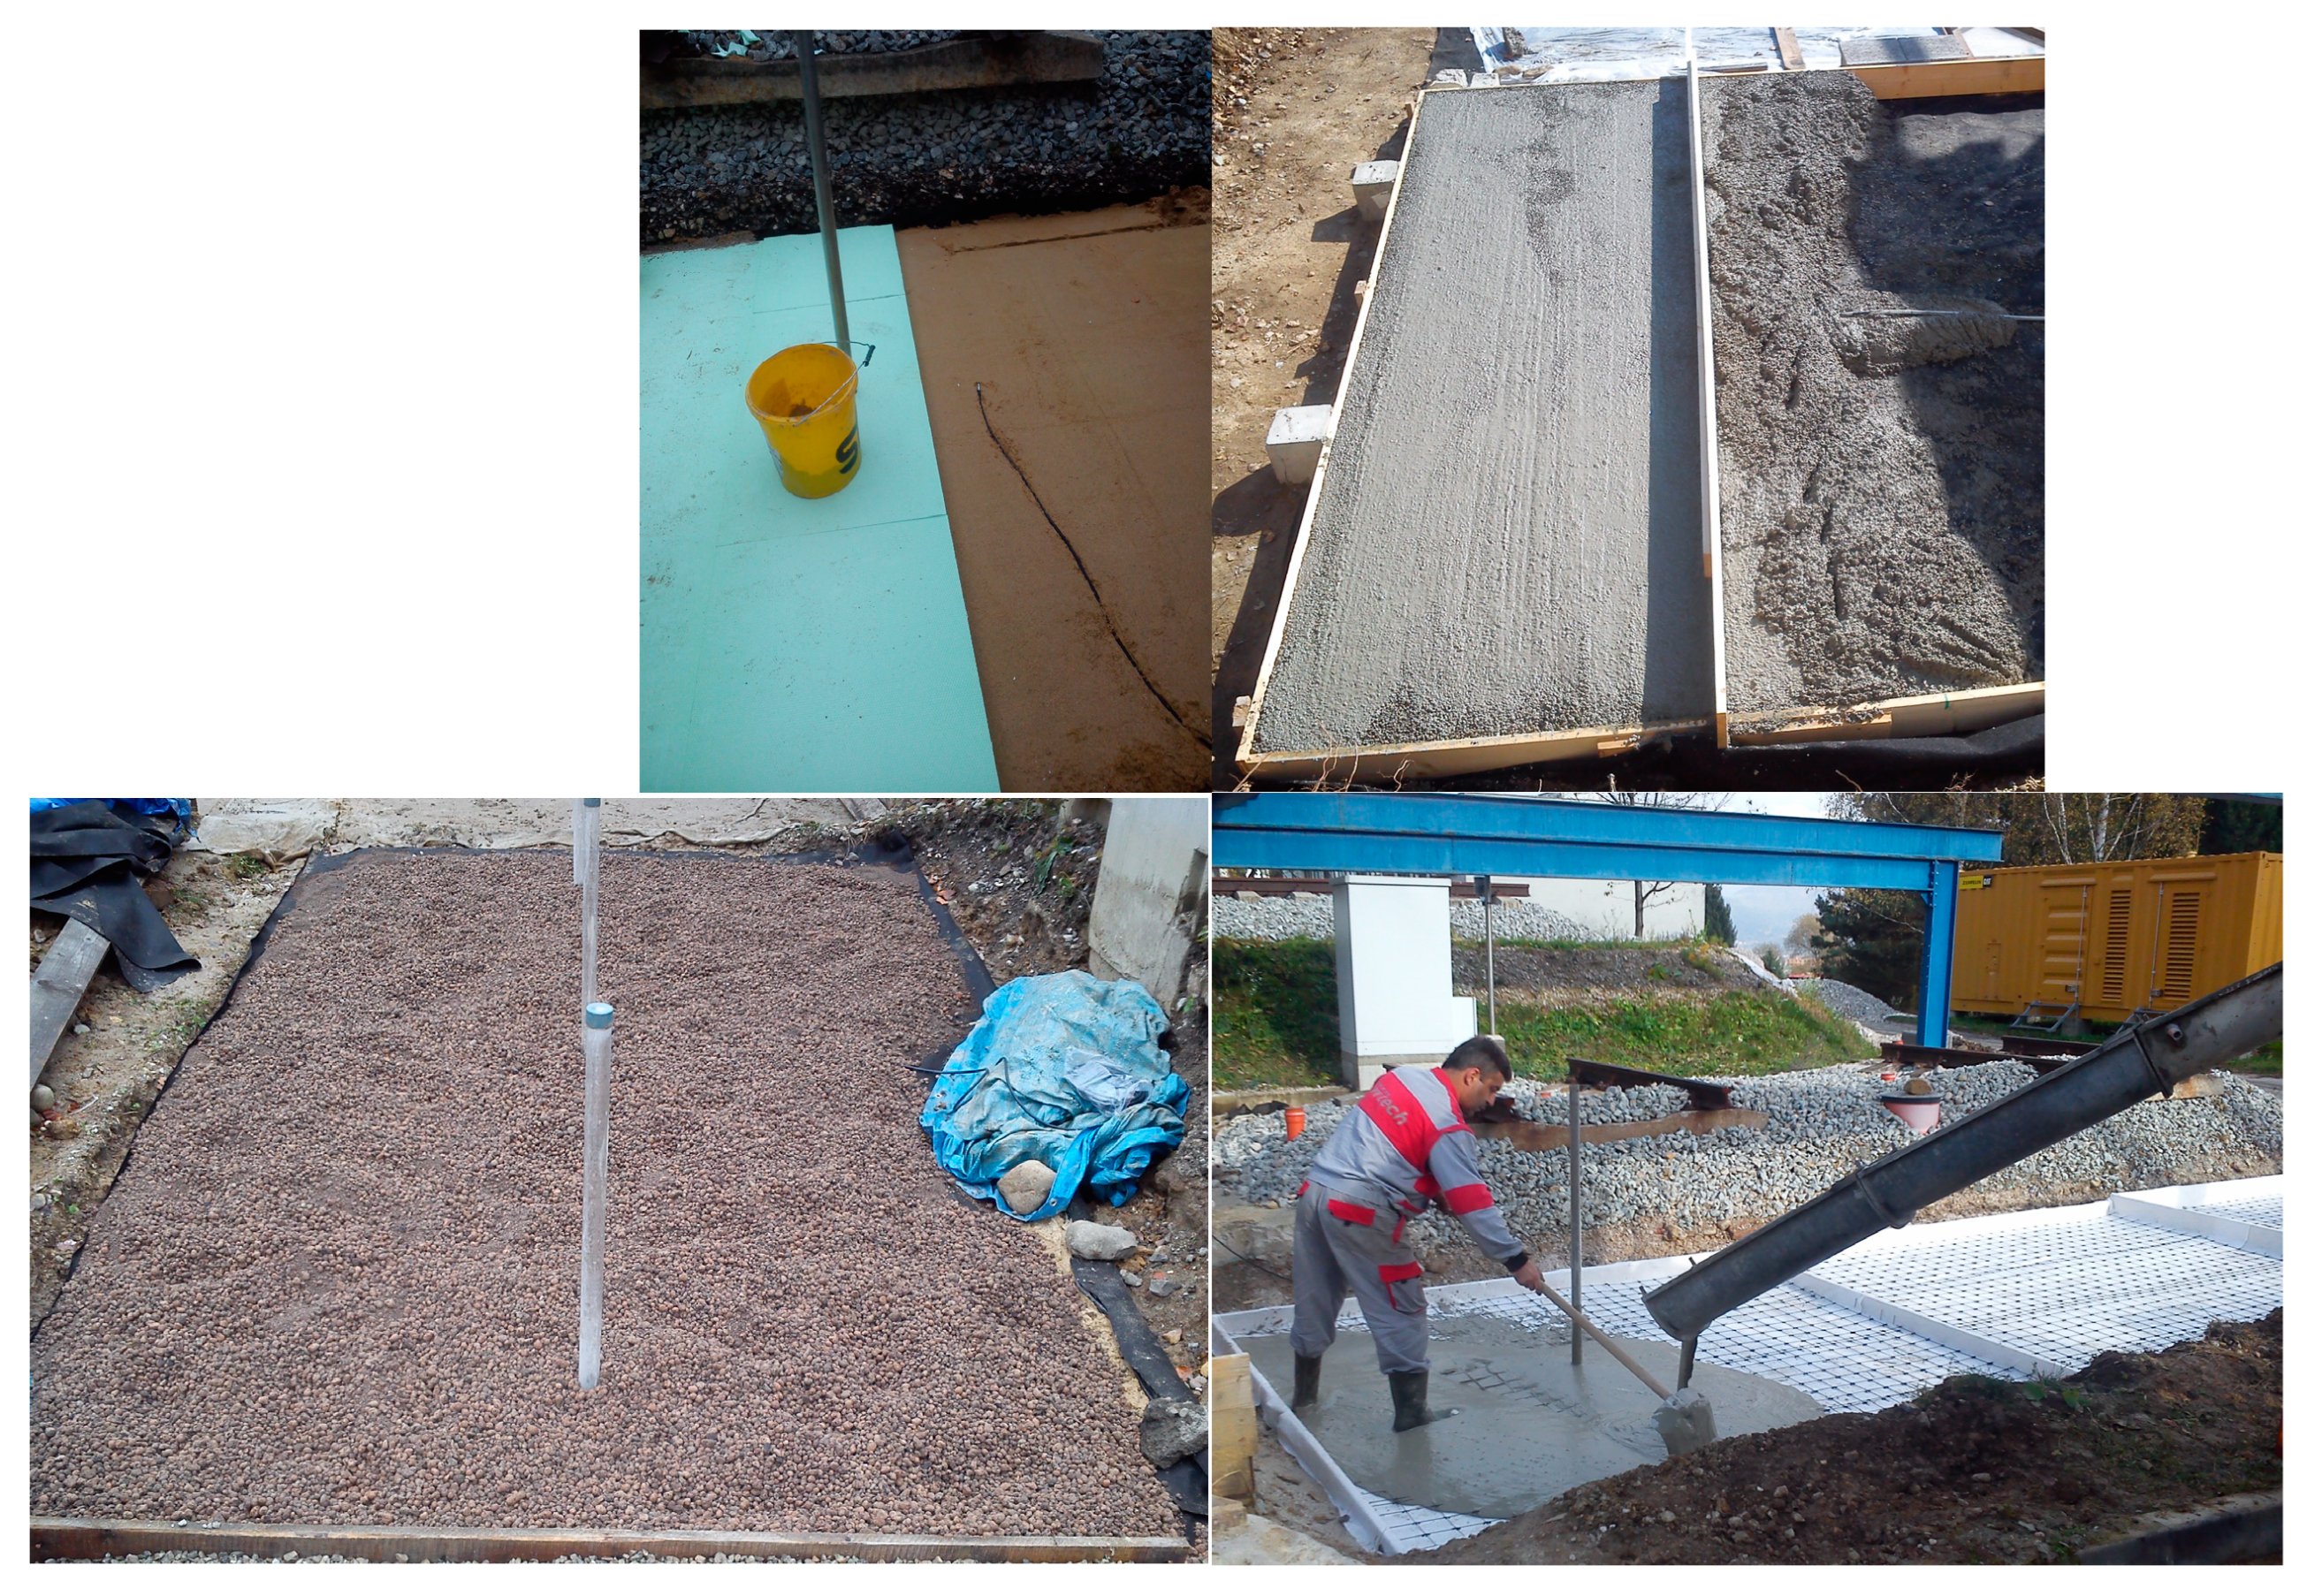
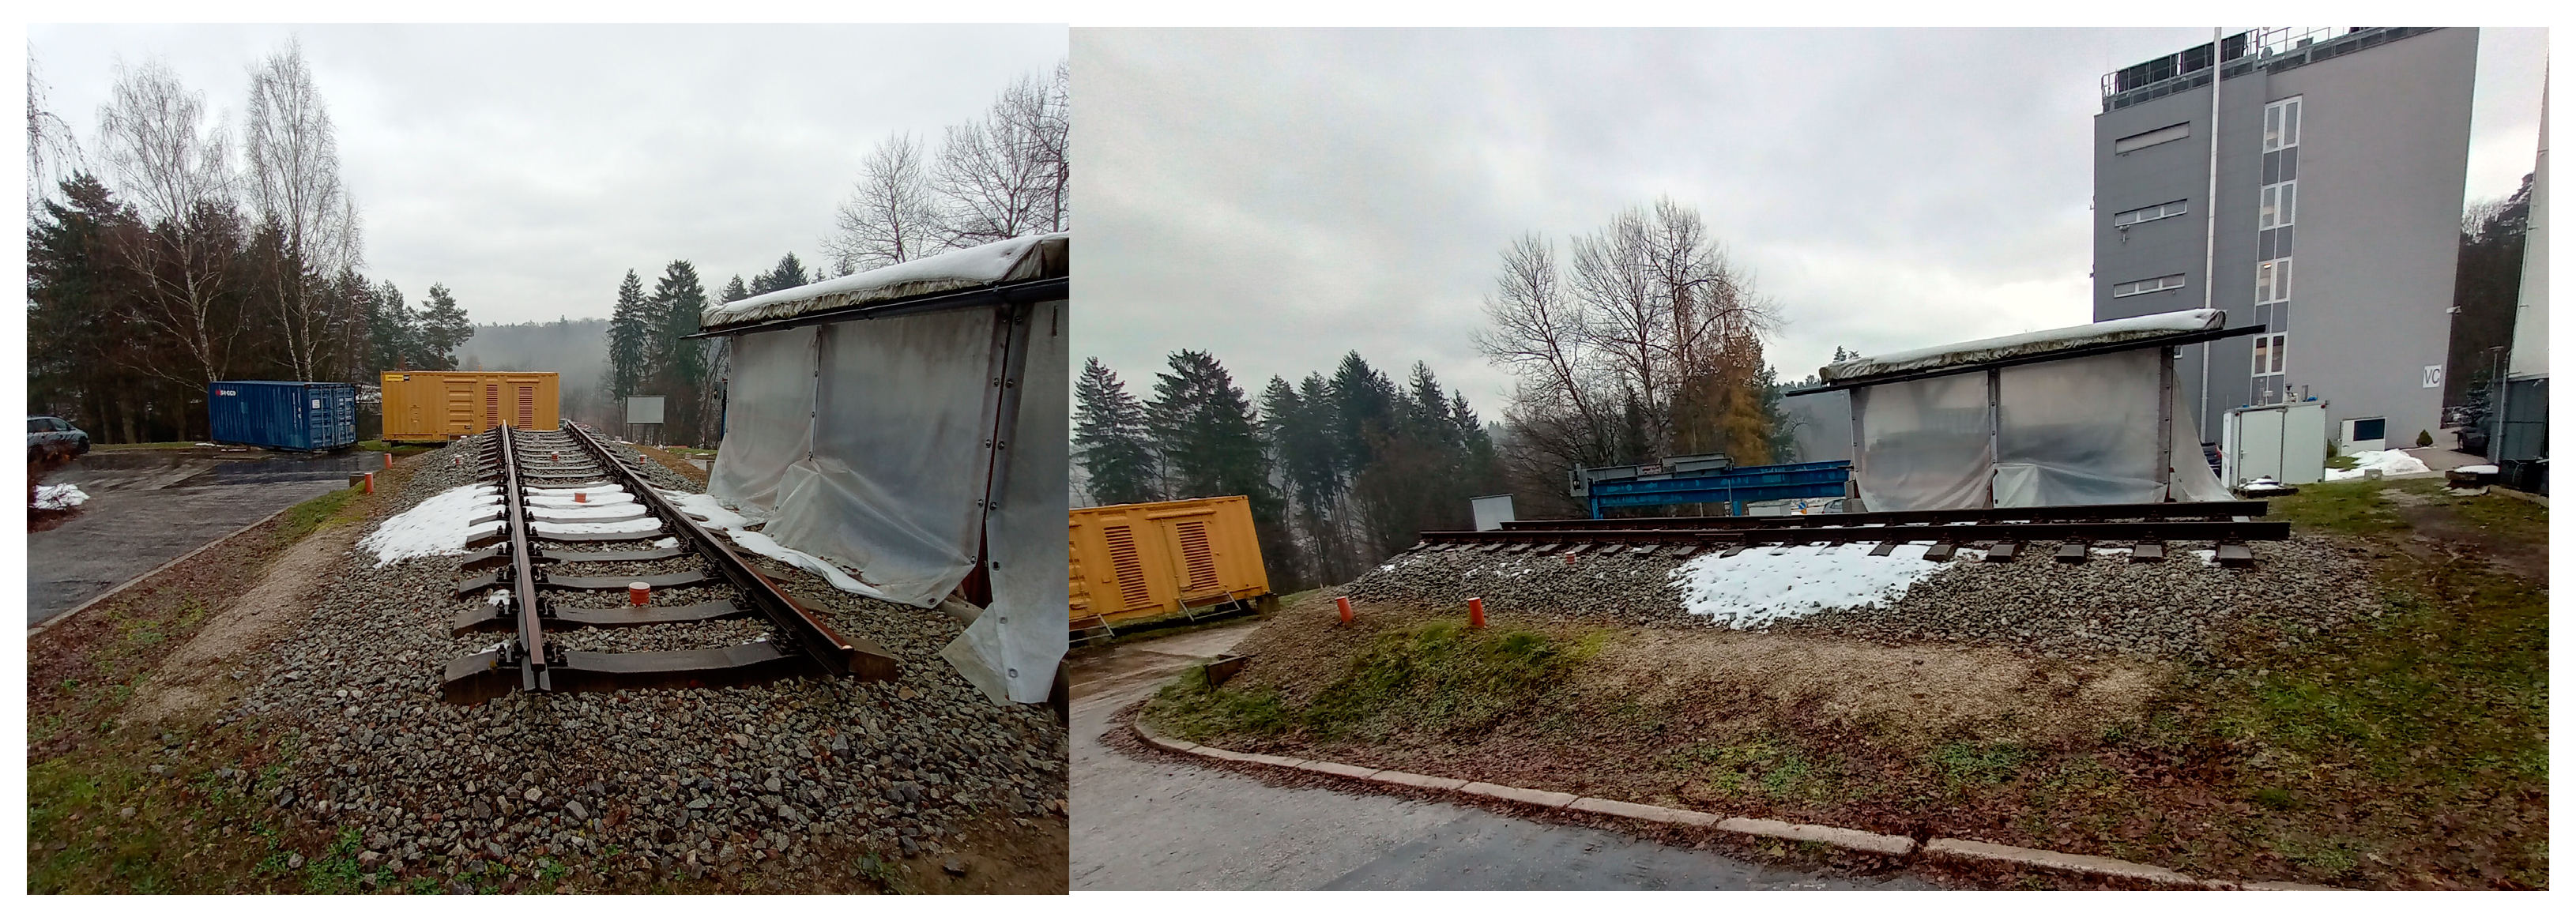
2.2. Characteristics of Individual Measurement Profiles of the Test Stand

Figure 4 depicts a cross-section of measurement profile no. 1 (MP1), which characterises the standard material composition of the railway track in the Slovak Republic. The railway track structure is constructed on a low embankment built of crushed aggregate fr. 0/63 mm. Protection of the subgrade surface against frost is ensured by a protective layer of crushed aggregate fr. 0/31.5 mm. The thickness of the protective layer (tpl = 0.45 m) was over dimensioned with respect to the design of the air frost index for the area of the test stand (Žilina), which is IFD = 480 °C, day.
The MP1 incorporates a total of 50 Pt1000 resistive temperature sensors (indicated by red rings in Figure 4) distributed across 8 horizontal levels and 5 vertical rows, as well as on the slopes of the embankment. Moisture measurement can be conducted at 5 locations characterised by the incorporation of TECANAT moisture probe protection tubes (indicated by blue rectangles in Figure 4 and Figure 5 vertical rows). Moisture measurement of the embankment subgrade can be implemented using a retrofitted protection tube at the foot of the embankment. The resistance thermometers are offset in the longitudinal direction by approximately 300 mm with respect to the plastic protection tubes of the moisture probe to avoid mutual interference during measurement. MP2 differs from MP1 in that it does not include a protective layer of crushed aggregate with a fraction size of 0/31.5 mm (it consists solely of an embankment body constructed from crushed aggregate with a fraction size of 0/63 mm). As it does not include any embedded thermal insulation material, and its thermal regime parameters and climatic characteristics were comparable to those of MP1, it is not detailed further in this article.
In 2018, the model of the railway track in the embankment (measurement profiles no. 1 and 2) was extended to include measurement profile no. 3 (Figure 5) and measurement profile no. 4 (Figure 6). In measurement profile no. 3, part of the protective layer of 0/31.5 mm crushed aggregate (300 mm thick) was replaced with 50 mm of extruded polystyrene (XPS), placed on a 100 mm thick levelling layer of sand.
A total of 18 Pt1000 resistance thermometers (indicated by red rings in Figure 5) are installed in measurement profile no. 3 (hereafter MP3). They are arranged in 8 horizontal levels, 3 vertical rows, and on both the top and bottom surfaces of the extruded polystyrene plate (hereafter XPS). Moisture measurement using the TDR method can only be conducted along the axis of the measurement profile (blue rectangle in Figure 5—vertical row 2).
In measurement profile no. 4 (MP4), part of the protective layer of 0/31.5 mm crushed aggregate (300 mm thick) was replaced by a 150 mm thick layer of Liapor concrete (a concrete layer compacted with lightweight expanded clay aggregate). Like MP3, MP4 incorporates a total of 18 resistance thermometers (indicated by red rings in Figure 6), arranged in 8 horizontal levels, 3 vertical rows, and on both the top and bottom surfaces of the Liapor concrete. Moisture measurement using the TDR method can only be conducted along the axis of the measurement profile (blue rectangle in Figure 6—vertical row 2).
Measurement profile no. 5 (MP5) is not detailed in this article because it does not include any embedded thermal insulation material. It was constructed solely to study the impact of different railway track alignments in the terrain, with MP5 being constructed in a cut.
Construction of measurement profile no. 6 (Figure 7) began in 2016. In this case, part of the protective layer of 0/31.5 mm crushed aggregate (300 mm thick) was replaced with a 100 mm thick layer of lightweight expanded clay granulate (Liapor fr. 0/16 mm).
A total of 23 resistance thermometers (indicated by red circles in Figure 7) are installed in measurement profile no. 6 (hereafter MP6), arranged in 9 horizontal levels and 3 vertical rows. Moisture measurement using the TDR method can be conducted at three locations along the moisture probe protection tube (blue rectangles in Figure 7—vertical rows 1–3).
Measurement profile no. 7 (hereafter MP7), shown in Figure 8, was constructed in 2019. In this profile, part of the protective layer of crushed aggregate fr. 0/31.5 mm (300 mm thick) was replaced with a 100 mm thick composite layer of foam concrete (foam concrete with a bulk density of approximately 600 kg·m−3, reinforced with basalt mesh). This structure was primarily assessed for its deformation resistance, so only 5 resistance temperature sensors and 1 moisture probe protection tube are incorporated into the structure.
As noted in the text above, constructing the individual measurement profiles has been a multi-year process. Figure 9 highlights key stages of the construction as the various thermal insulation layers were being established.

3. Results and Discussion

The following sections of the paper focus on comparing the experimentally determined parameters of the thermal regime and climatic characteristics within individual measurement profiles of the test stand (described in more detail in Section 2). Additionally, the paper addresses the selection of the structure with the most effective thermal insulation based on its material composition and includes numerical modelling of the selected structure under significantly more adverse boundary climatic conditions.

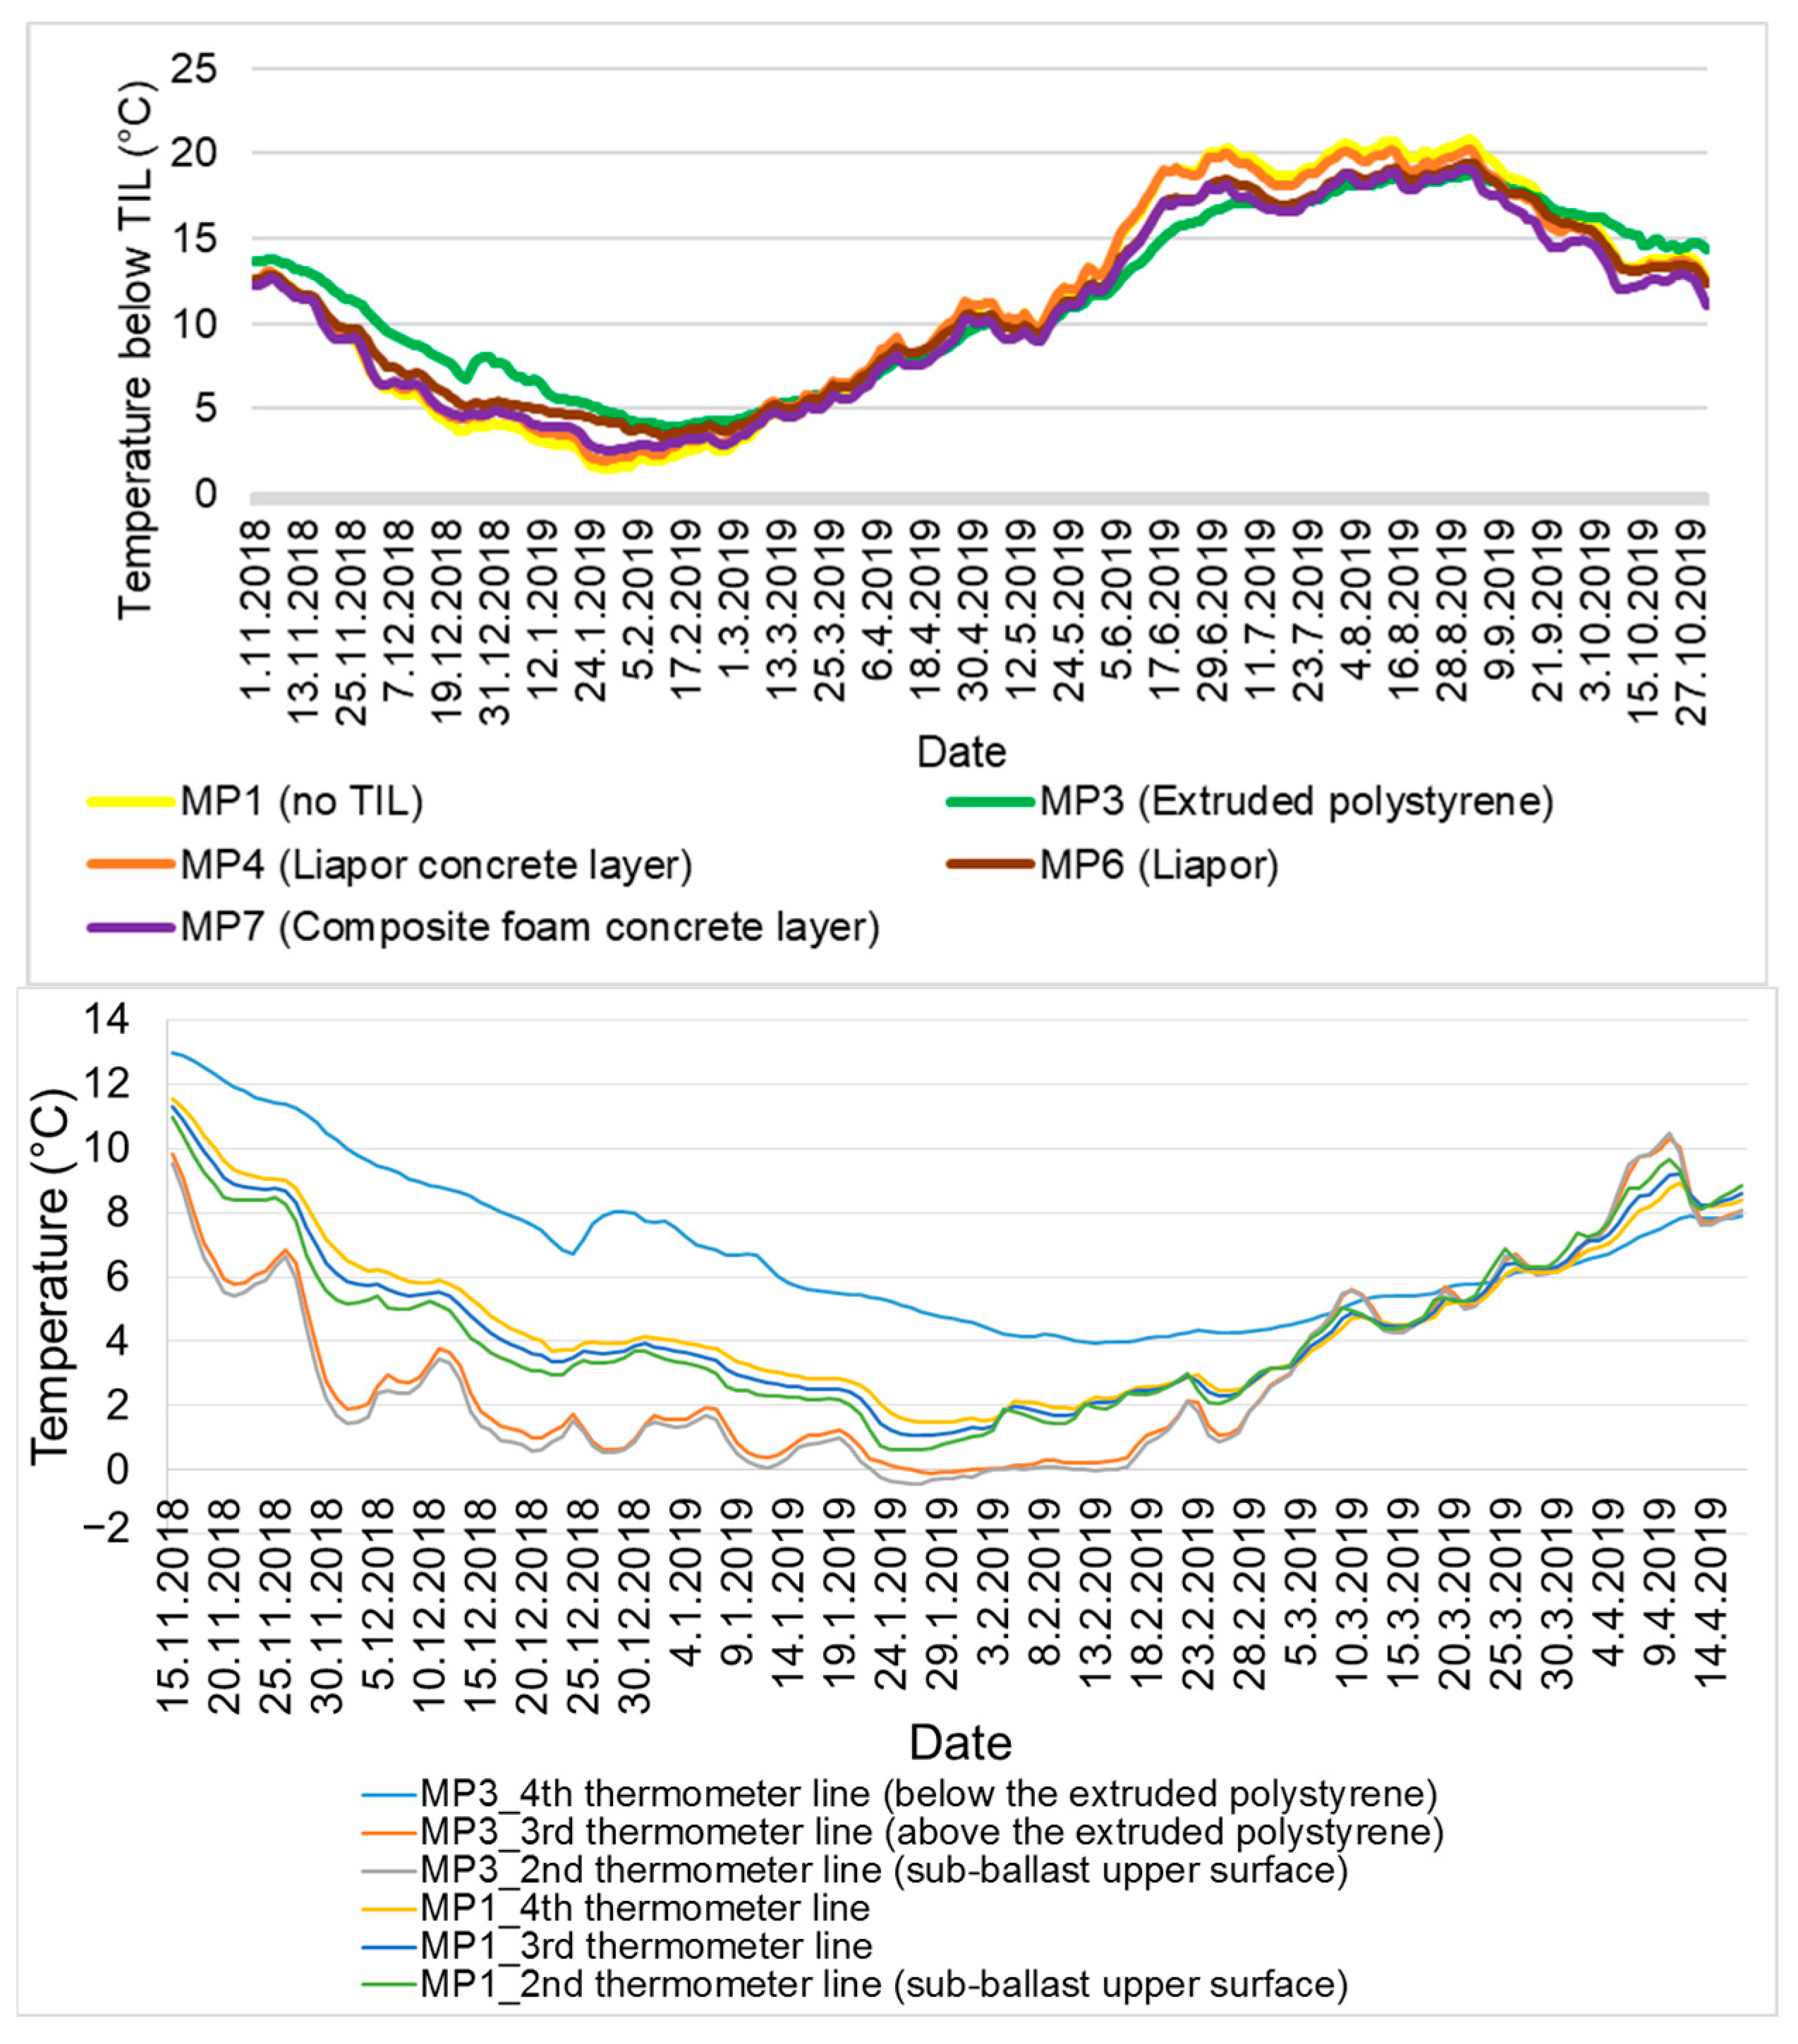
3.1. Experimental Measurements

The thermal regime of the railway track structure is monitored during experimental measurements primarily in winter, when the effects of frost on the structural layers of the sub-ballast layers are assessed. The winter period is defined as the time between the first and last frost occurrences, where the mean daily air temperature θs during the frost period must not exceed −0.1 °C, and the frost period must last at least 3 days. The winter period may include multiple frost occurrences, with short-term warming intervals between them where the mean daily air temperature θs is higher than −0.1 °C. Since 2013, the DRETM test stand at the department has been monitoring the thermal regime of various material compositions of the sub-ballast layers (see Section 2). Table 1 presents the evaluated climatic characteristics and thermal regime parameters for MP1 (the standard material composition of the sub-ballast layers without thermal insulation material), including the following:
  • Mean daily air temperature θs;
  • Average annual air temperature θm;
  • Air frost index IF;
  • Air freezing index at the surface of the ballast bed IFS;
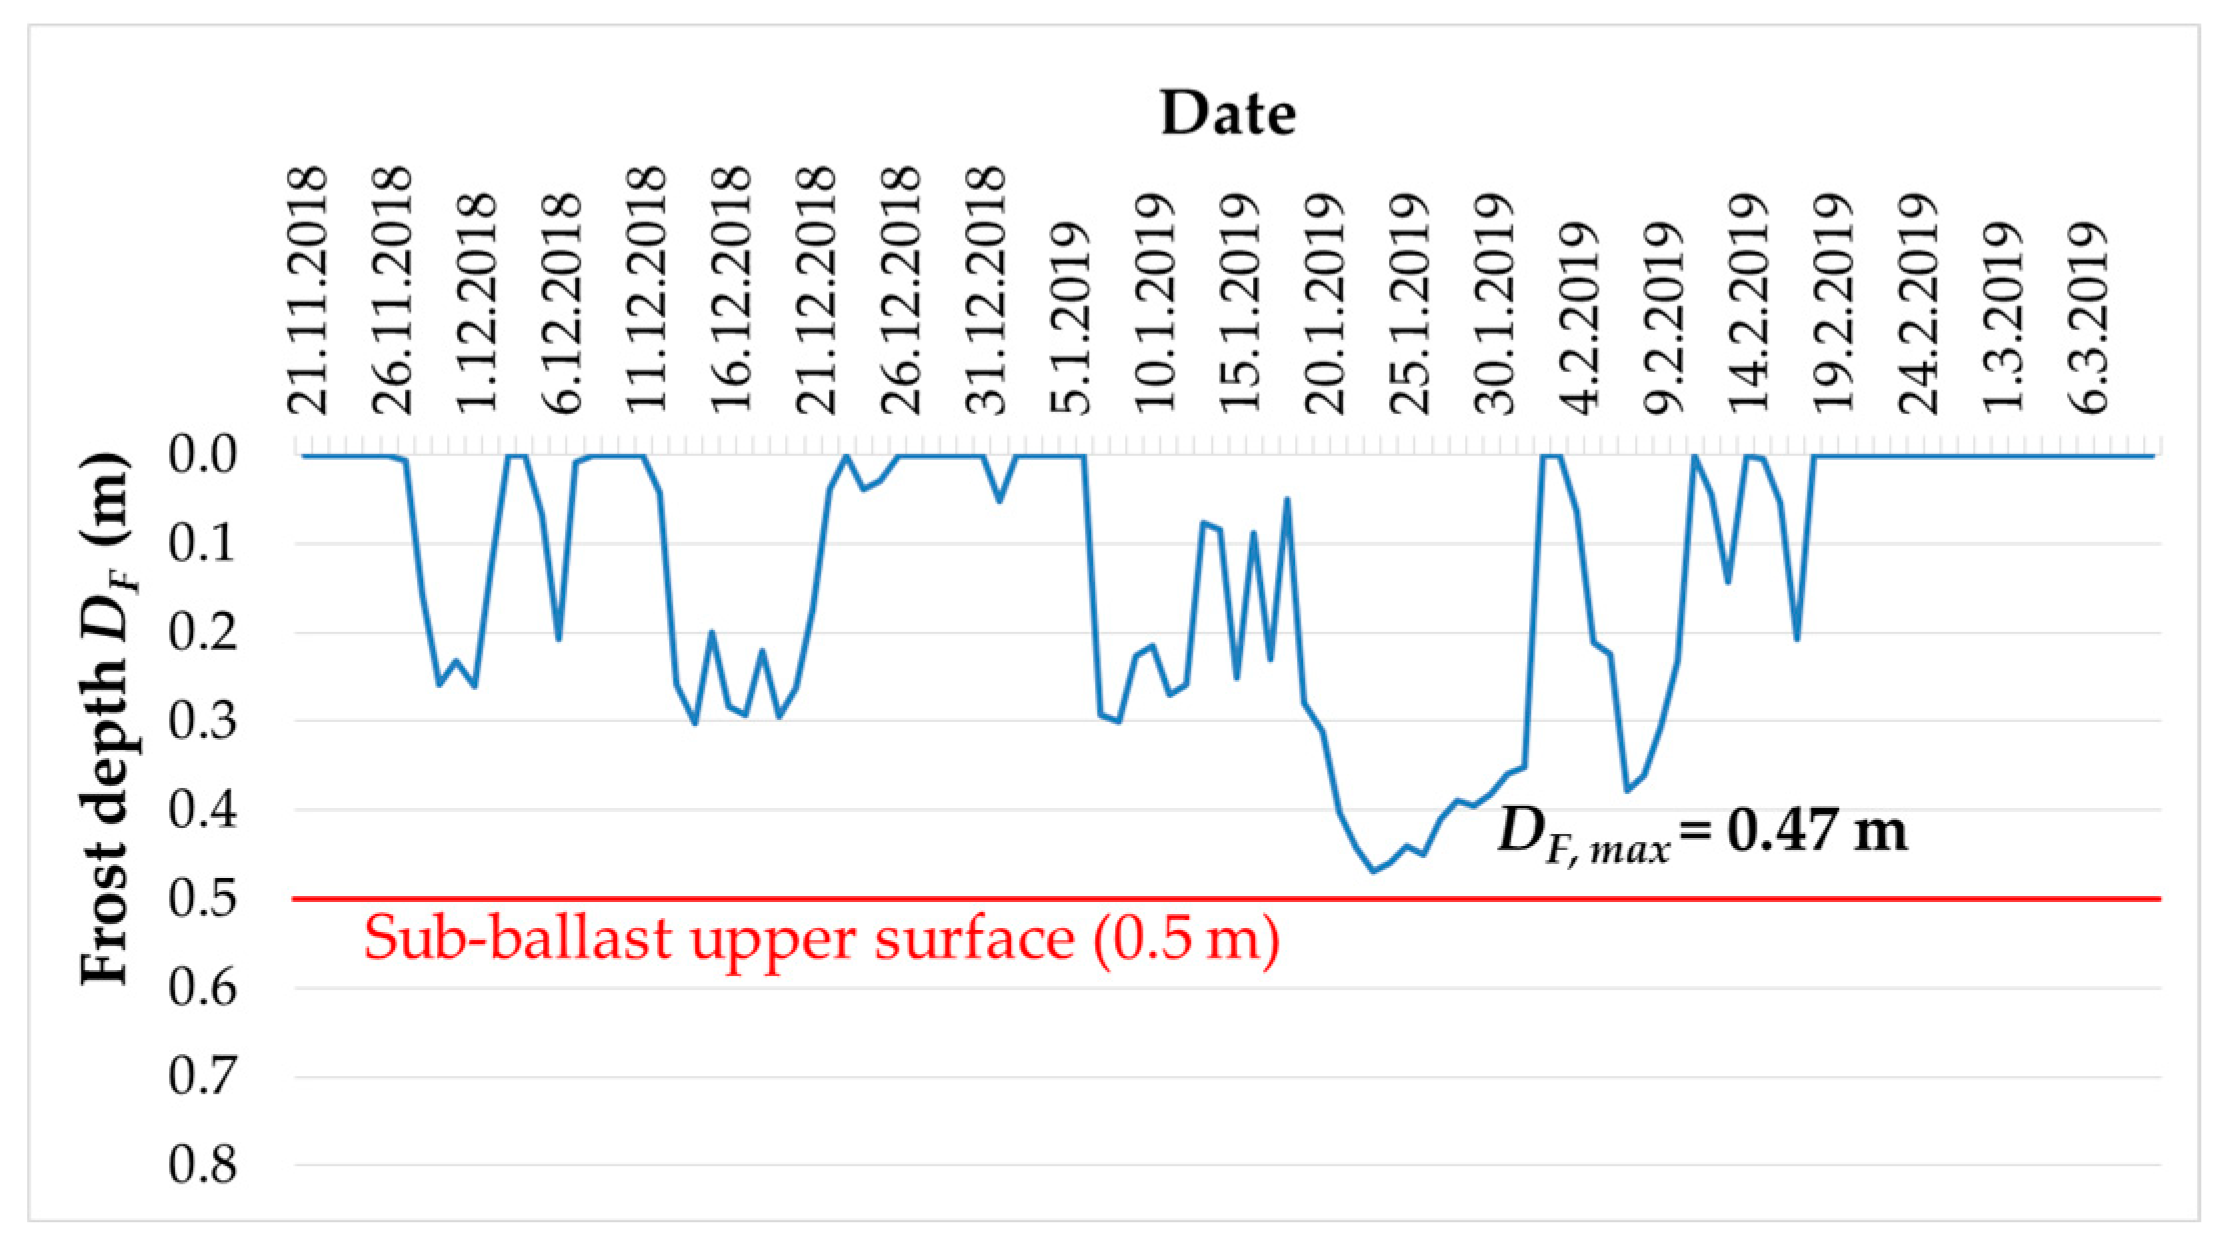
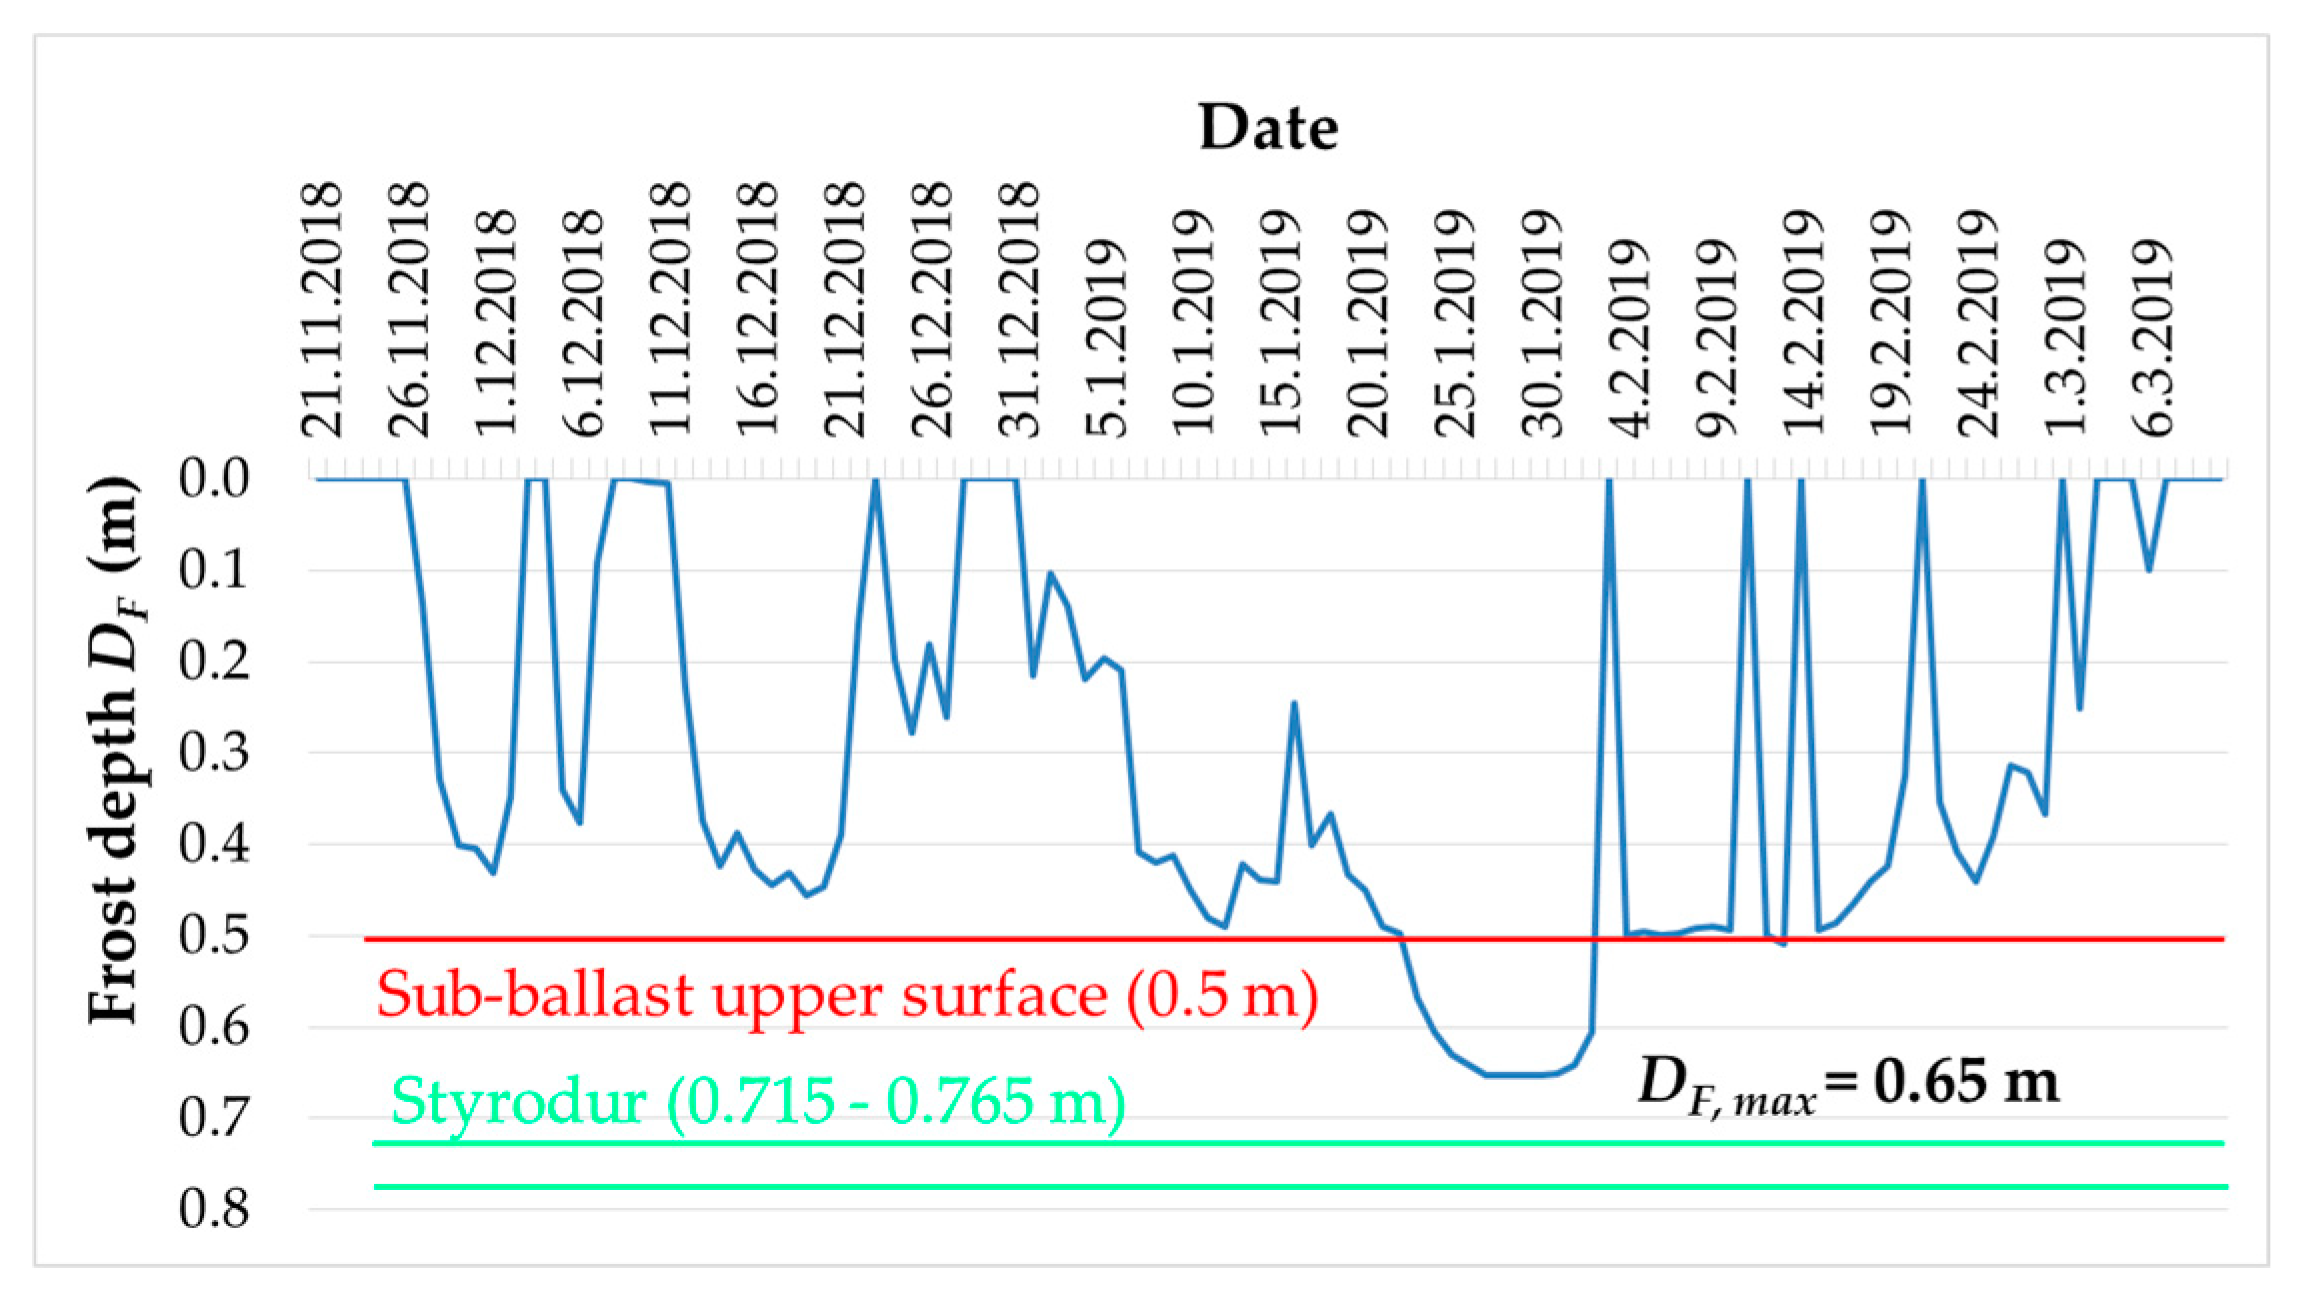
  • The frost depth of the track structure (measurement profile) DF.
In the same manner, the parameters were evaluated for the other measurement profiles of the test stand. The coldest winter period recorded on the DRETM test stand to date was the winter of 2016/2017, which had the highest air frost index IF = 284 °C, day (see Figure 10, left). This winter period was characterised by a single prolonged frost period lasting 79 days (from 28 November 2016 to 14 February 2017), during which the maximum air frost index IF was reached on 14 February 2017. After this date, warming occurred, with only occasional days having a negative mean daily air temperature below −1 °C. During this winter, there were 26 days with a mean daily temperature θs below −5 °C and 7 days with θs below −10 °C. Interestingly, the maximum frost depth was not reached on the day of the maximum air frost index, but nearly two weeks earlier (1 February 2017), when the air frost index was IF = 278 °C, day. Between 1 February and 14 February 2017, air temperatures ranged from −4.2 °C to +1.5 °C. Although these temperatures partially contributed to an increase in the air frost index IF, they did not significantly affect the frost depth of the railway track structure DF.
In the winter of 2016/2017, not all measurement profiles had been constructed. The only profile with a built-in thermal insulation layer (hereinafter TIL) in the sub-ballast layers was MP6, which included a 0/16 mm Liapor layer. By comparing the climatic characteristics and thermal regime parameters of the standard structural composition of the railway substructure (MP1) with those of the modified sub-ballast layers (MP6), it is possible to observe and draw conclusions. These findings were subsequently applied in the numerical modelling discussed in Section 3.2.
The embedded thermal Insulation material at the subgrade surface level significantly increases the thermal resistance of the railway track structure. This insulation prevents cold from penetrating into the underlying materials, leading to a substantial cooling of the overlying layers as cold accumulates within them. It is observed that the higher the temperature below the thermal insulation layer (TIL), the lower the temperature in the structural layer above it. This observation is supported by the greater frost depth recorded in MP6 (DF = 0.72 m), which is 70 mm greater than the frost depth recorded for MP1 in the winter of 2016/2017—(DF = 0.65 m). The measured data also indicate that a sufficient intensity of frost is required to significantly increase the frost depth of the railway track structure DF, especially when the zero isotherm is already positioned deeper within the sub-ballast layers. This conclusion is supported by the values of the air frost index IF and the frost depth DF for MP1. On 21 January 2017, the frost depth in MP1 reached 0.60 m. Despite subsequent days with mean daily air temperatures of −5.1 °C and −6.7 °C, the frost depth decreased to 0.59 m. The frost depth then increased to 0.61 m on 4 February 2017, when the mean daily air temperature was −7.3 °C. The greatest frost depth in MP1 (DF = 0.65 m) was observed the day after a 4-day period with mean daily air temperatures θs ranging from −8 °C to −10.3 °C.
From the data for MP6 (with a 0/16 mm Liapor layer), it can be observed that accumulated cold is retained longer in the overlying layers above the thermal insulation layer (TIL) compared to MP1 (without a thermal insulation layer). This is evidenced by the values recorded on 4 January 2017, when the mean daily air temperature was θs = 0.3 °C. On this date, the frost depth in MP1 decreased from 0.46 m to 0.39 m (a reduction of about 70 mm), whereas in MP6, it decreased from 0.50 m to 0.49 m (a reduction of about 10 mm). A comparison of the measured temperatures below and above the TIL in the individual measurement profiles will be presented in the following text and figures.
To compare the impact of different thermal insulation materials (extruded polystyrene layer, Liapor aggregate fr. 0/16 mm, Liapor concrete, and a composite layer of foam concrete) in the sub-ballast layers with a standard construction (without thermal insulation), the winter period with the highest recorded air frost index was selected. This was the winter of 2018/2019, which had an air frost index IF = 124 °C, day (see Figure 10, right), and during which all the analysed measurement profiles were already constructed. Although the winter period of 2016/2017 had an air frost index IF nearly 2.3 times higher, it could not be included in this analysis because measurement profiles no. 3, 4, and 7 were not yet built at that time. Table 2 provides a comparison of the frost depth DF in the various measurement profiles for the winter period of 2018/2019.
A noteworthy finding is that measurement profiles with embedded thermal insulation material show a slight increase, and MP3 (with an embedded XPS layer) shows a significant increase, in the frost depth DF of the railway track structure (Figure 11, bottom) compared to the standard structure without thermal insulation material (Figure 11, top).
The exception is MP6, which includes an embedded layer of 0/16 mm Liapor aggregate. In this case, snow cover was intentionally left on the measurement profile to monitor its thermal insulation effect, whereas snow cover was removed from the other measurement profiles throughout the winter period in question. Despite this, the trend observed in MP6 was consistent with other profiles. During the winter period of 2022/2023, MP1 achieved a structural frost depth of DF = 0.45 m, while MP6 reached DF = 0.50 m. This observation is supported by data from the winter period of 2016/2017, when MP6 recorded a frost depth (DF = 0.72 m), which was 70 mm greater than the MP1 (DF = 0.65 m). These results indicate a notable thermal-insulating effect of the snow cover in MP6. Based on experience from other winter seasons, it can be estimated that without snow cover, the frost depth in MP6 would have been approximately 50–70 mm greater than that in MP1, resulting in a value of around 0.52–0.54 m. Thus, during the winter period of 2018/2019, the presence of snow cover reduced the frost depth in MP6 by approximately 150 mm.
Figure 12 and Figure 13 (top) present a comparison of the lowest mean daily air temperatures θs, experimentally measured in the different measurement profiles of interest (MP1, MP3, MP4, MP6, and MP7), at the sub-ballast upper surface level, at the temperature sensor located above the thermal insulation layer (TIL), and at the temperature sensor below the TIL. Figure 12 and Figure 13 indicate that the XPS layer embedded in MP3 (green curve in Figure 12 and Figure 13, top) has a significantly greater impact on temperature changes at each level of the railway track structure compared to the other embedded thermal insulation materials. This effect is most pronounced during both winter and summer. More specifically, the difference in experimentally measured temperatures between MP1 (without TIL) and MP3 (with embedded XPS) during the winter period of 2018/2019 can be observed in Figure 13 (bottom).
Figure 13 (bottom) demonstrates that the temperature is approximately 1–4 °C higher at the monitored level below the XPS layer compared to the identical level in MP1 (without built-in thermal insulation material). From this, it can be concluded that the XPS layer has a significant thermal insulation effect within the structure. An interesting observation is that, despite the thermal-insulating properties of XPS, MP3 achieved a greater frost depth than MP1 by up to 0.18 m (see Table 2). Figure 13 (bottom) also demonstrates that during the winter period of 2018/2019, the temperature is approximately 1–4 °C lower at the monitored level above the XPS layer in MP3, as well as at the sub-ballast upper surface level, compared to the identical level in MP1. This implies that frost acting from above on the MP3 structure gradually cools the individual structural layers until it reaches the TIL level of the XPS. As this creates significant resistance to cold air penetration, the cooling of the overlying structural layers becomes more intense, resulting in a greater depth of frost above the XPS layer.
In the case of a significantly higher value of the air frost index IF (if zero isotherms penetrate below the level of the XPS), a lower frost depth DF would be achieved in MP3 compared to measurement profile MP1. However, the increased freezing of the overlying layers does not impact the safety and reliability of the railway structure since these layers are constructed of coarse-grained materials (aggregate or gravel). Therefore, there are no conditions conducive to the freezing of the material above the TIL or to the initiation of uneven uplift during freezing or settlement periods, which could potentially lead to track geometry faults. This phenomenon of colder overlying layers can be observed in the photo (Figure 14), where the MP3 profile shows a clear layer of snow on the surface of the structure. Consequently, during the warming period, the snow cover melted on all surrounding profiles but remained on MP3 for about three days longer. Typically, snow cover is removed from the surface of the measurement profiles during the winter period (it is left only when its thermal insulation effect is being monitored) to increase the intensity of frost action on the measurement profile structure. Research activities related to identifying the thermal insulation effect of snow cover were published, e.g., in ref. [37].
From the above, it is evident that although the embedded XPS layer increases the temperatures of the materials beneath it, it simultaneously causes the materials above the XPS layer to cool down. This cooling effect caused the snow layer on the surface of MP3 to melt more slowly compared to the MP1, MP2, and MP4 profiles located next to MP3.
An equally interesting observation from experimental measurements is that the maximum frost depth DF of the railway track structure does not generally occur on the day the maximum air frost index IF is reached. The evaluated data from the winter periods revealed that the maximum frost depth DF was reached before the maximum value of the air freezing index IF (depending on the nature of the winter period and the properties of the TIL, this ranged from about 1 to 14 days). In the case of measurement profiles with a built-in TIL, the maximum frost depth DF was generally reached later than for the standard sub-ballast layers (without thermal insulation material). This is due, as already mentioned, to the accumulation of a higher amount of cold in the overlying layers above the TIL.
It is also noteworthy that the maximum value of the surface air frost index IFS in the case of MP1 (without thermal insulation material) generally occurs on the day the maximum air frost index IF is reached, or at most 3 days later (coldest winter period 2016/2017). In contrast, for measurement profiles with built-in thermal insulation material (mainly XPS and Liapor), the maximum value of the surface air frost index IFS is frequently reached significantly later than the maximum value of the air frost index IF, sometimes up to 12 days later in the winter period 2021/2022. This delay is likely due to ground frosts and, as previously noted, the accumulation of a greater amount of cold in the overlying structural layers above the embedded thermal insulation material.
Also of interest is the percentage comparison between the achieved air frost index IF and the surface air frost index IFS for both the standard construction (without thermal insulation material) and the modified construction (with thermal insulation material incorporated). For the standard construction (MP1), the surface air frost index IFS is generally 45% to 60% of the air frost index IF, except during the coldest winter period of 2016/2017, when it reached 86% (surface air frost index IFS = 245 °C, day). In the case of measurement profiles with built-in thermal insulation layers (mainly XPS and Liapor), the surface air frost index IFS typically ranges from 88% to 96% of the air frost index IF.
Among the embedded thermal insulation materials considered (XPS layer, Liapor aggregate layer, Liapor concrete layer, and composite foam concrete layer), the XPS layer (MP3) demonstrated the highest thermal resistance in the sub-ballast layers. To date, the DRETM test stand has not recorded a winter period with an air frost index approaching the design parameters for the area, which is 480 °C, day. Consequently, the experience and measured parameters from the experimental measurements conducted at MP3 will be used in numerical modelling, where this structure will be subjected to significantly more severe climatic conditions (air frost index IF up to 2000 °C, day).

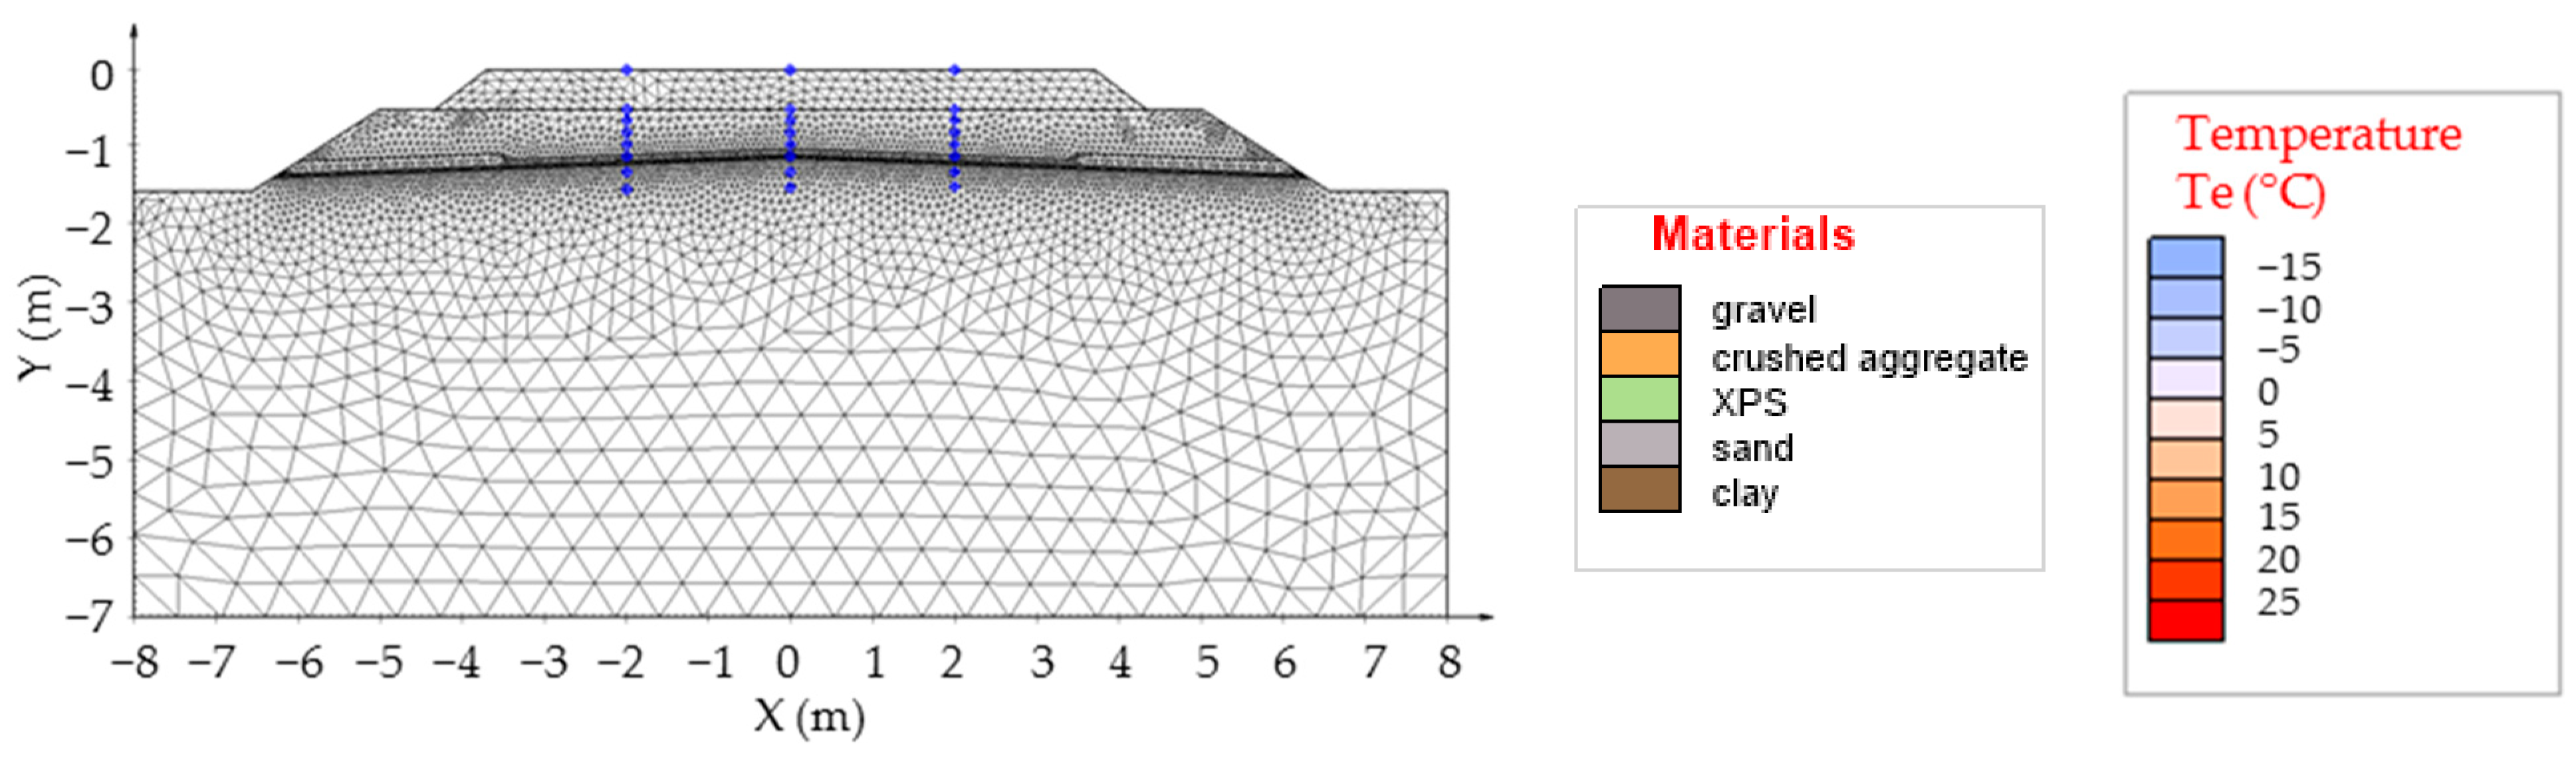
3.2. Numerical Modelling—Structure with Extruded Polystyrene (XPS) Layer in the Sub-Ballast Layers

Numerical modelling was performed for MP3, where the embedded thermal insulation layer (TIL) of XPS, as previously mentioned, provides the greatest thermal resistance to frost penetration into the railway track subgrade. SVOffice software (v2012), specifically SVHeat [38], was selected for the numerical modelling. The SVOffice software (v2012), at the time of its acquisition, was the most advanced 1D/2D/3D geotechnical software developed by the Canadian company SoilVision Systems Ltd. The software was created based on feedback from geoengineering consultants and remains highly suitable even after its upgrade to meet current needs. The SVHeat programme (v2012), used within the numerical modelling framework, is capable of calculating geothermal gradients and the movement of freezing fronts in saturated and unsaturated soils. It also enables the analysis of steady-state or transient thermal conductivity and convection models. User-defined soil properties define the latent heat released or absorbed during the ice–water phase change [38].
Initially, an exact replica of MP3 was developed in the model, and the results were compared with those obtained experimentally. This comparison is detailed in publication [32], which identifies the difference in the frost depth of the railway track structure DF < 10 mm, and the temperature variations in the individual structural layers of MP3 for the winter period 2018/2019 up to θ = ±0.5 °C. In ref. [32] as well as in other publications by the authors of this paper, analyses were conducted on the impact of various input parameters of numerical modelling on the resulting freezing behaviour of the railway track structure. The main parameters influencing the freezing of the railway track structure include the moisture and temperature of the embedded materials, the air frost index, the average annual air temperature (parameters dependent on the mean daily air temperature), and the snow cover thickness. The method for determining each parameter and its input into the numerical model is presented in the following text.
Based on the evaluation of the results and the insights gained from MP3, a numerical model of a double-track railway line running in a low embankment was subsequently developed as a 2D transition model. Figure 15 (centre) illustrates the colour coding used for the materials in the various structural layers of all the numerical models presented. Figure 15 (right) shows the colour coding for the temperature range used during the monitoring of the model’s freezing behaviour after it was solved using FlexPDE, a programme that employs the finite element method (see Figure 15, left). The time step for the solution was set to 0.1 days, with the programme’s grid generation module creating a triangular finite element mesh consisting of three-, six-, or nine-node triangles. Each finite element triangle has an assigned proportional coefficient. The network is controlled according to these coefficients. The mesh generator calculates the network quality parameters and allows for spatially varying node density to focus on areas with construction details. The results of the solution were visualised using the ACUMESH program (v2011) [39].
The individual materials of the structural layers of the numerical model were assigned physical and thermal characteristics, as detailed in Table 3. The thermal–technical parameters (specific heat capacity c—defined in the programme for the dry state of the material and thermal conductivity coefficient λ—defined in the programme for the specified material moisture content w) were defined in the numerical model based on the experimental results determined by calorimetry and the method of determining the time interval of freezing of the structural layer. The procedure for these experimental measurements has already been characterised in several publications, e.g., in ref. [33]. The moisture content of different materials, as already mentioned in the previous text (see Section 2), was defined in the same way on the basis of experimental measurements carried out using the non-destructive TDR method [36] or using the destructive method (by sampling and drying) if the TDR method could not be used (in the case of extruded polystyrene and track ballast).
In addition to the parameters listed in Table 3, the maximum saturation of the individual materials and the boundary conditions for water freezing (freezing and thawing temperatures and the method for determining the characteristic water freezing curve) were defined in the Material Manager dialog box. The characteristic water freezing curve for the subgrade in the software was set based on the temperature at the beginning and end of the phase change using the empirical relationship derived by Tice and Anderson. For sand and crushed aggregate, the curve derived by Fredlund and Xing was applied [38]. The characteristic water freezing aggregate for the ballast bed and XPS layer was not defined due to the nature of the material or the low moisture content.
Once the material characteristics were defined, it was then necessary to define the climatic characteristics and the model boundaries that are affected by the climatic load (boundaries in contact with air). Significantly more adverse climatic characteristics (air frost index up to IF = 2000 °C, day) were used in the numerical model solution compared to the climatic characteristics identified in the individual test stand measurement profiles. To ensure a realistic course of the winter period and to use realistic temperatures, these climatic characteristics were obtained from the Slovak Hydrometeorological Institute (SHI) [40]. The climatic characteristics were assessed based on the coldest winter period of the past 50 years, in terms of the maximum air frost index IF (winter period 1986/87) and the lowest annual mean air temperature θm (year 1980) for the High Tatras region.
Figure 16 (top) presents the initial state of the numerical model where the embedded XPS layer is applied at a uniform design thickness across the full width of the subgrade surface. The numerical model was subjected to maximum climatic loads, with an air frost index IF = 2000 °C, day and an annual mean air temperature θm = −1 °C. Figure 16 (bottom) presents the output of the numerical model for day 448, while Figure 16 (top) shows the structural and material composition of the model. Day 448 marks the end of the longest period of the lowest daily mean air temperatures θs used in this model. During this period, there were 29 consecutive days with daily mean air temperatures θs below −10 °C, followed by 7 days with temperatures greater than −20 °C. This severe cold spell was followed by milder temperatures ranging mainly from θs = +2.8 to θs = −10 °C. Mean daily temperatures θs below −10 °C became sporadic, thus having minimal impact on the freezing of the railway structure. On day 448, the maximum frost depth of the railway track structure DF = 1.07 m was reached at the centreline of the double-track railway. Of the total XPS thickness of 80 mm, 70 mm had frozen. This indicates that sufficient protection against freezing was provided at the centreline of the tracks, with approximately 75 mm of the 80 mm XPS layer having frozen.
The interfaces between different temperature zones in the numerical model were highlighted in red for better orientation. The position of the zero isotherm is marked by the boundary between pale blue and pale orange areas. A problem arises with the lateral freezing of the railway structure (freezing in the direction away from the berm and the embankment slope). Lateral freezing of the subgrade surface (indicated by light green circles in Figure 16, bottom) occurs due to the absence of a ballast layer above the berm or on the embankment slope, which would otherwise provide certain thermal insulation. Due to its fraction of 31.5/63 mm, the ballast bed contains a considerable proportion of air gaps (with a thermal conductivity coefficient of λ = 0.7 W·m−1·K−1 as used in the numerical model). This results in a better thermal insulation property compared to crushed aggregate with a fraction of 0/31.5 mm, which has a thermal conductivity coefficient of λ = 1.73 W·m−1·K−1. In this case, subgrade surface freezing occurred within approximately 1.0 metre from the edge of the active zone of traffic load. The active zone of traffic load, depicted in Figure 16 (bottom), is defined by a 45° angle of spread from the edges of the sleepers. In this instance, the active zone extends up to 2.45 metres from the track centreline towards the embankment slope. A noteworthy finding from the numerical model is that the maximum frost depth of the railway track structure DF does not occur on the day when the maximum air frost index IF is reached, but rather after the longest period of very low mean daily air temperatures θs (consistent with the findings presented in Section 3.1 of the experimental results). On day 448 of the numerical model, the air frost index was as low as IF = 1659 °C, day, compared to the total applied value of IF = 2000 °C, day.
Equally interesting is day 453 of the numerical model (Figure 17, top), when approximately the same maximum frost depth (DF = 1.07 m) was reached at the centreline of the track structure. However, the lateral freezing of the subgrade surface (indicated by light green circles in Figure 17, top) increased from approx. 1.0 m to approx. 1.2 m. This increase is attributed to the accumulated cold in the overlying layers above the thermal insulation material (XPS), as indicated by the “bubble” of colder temperatures in Figure 17 (top), where darker blue represents lower temperatures. On the day when the maximum air frost index IF = 2000 °C, day was applied in the numerical model (day 531), as demonstrated in Figure 17 (bottom), the frost depth at the centreline of the track structure was DF = 1.03 m, which is 40 mm less than the maximum value DF observed. Remarkably, no lateral freezing of the subgrade surface into the active zone of action of the traffic load occurred on this day.
Lateral freezing of the subgrade surface (from the berm and the embankment slope) within the active zone of the traffic load begins on day 425 of the numerical model. It reaches its maximum extent on day 453 and, by day 518, the zero isotherm has moved outside the active zone. During this approx. 100-day period of structural freezing within the active zone, ice formations (such as ice lenses, layers, or sheets) are predicted to develop in the track subgrade, potentially causing frost heaves. The formation and subsequent thawing of these ice structures may lead to significant uneven settling of the track after the winter period ends. An option to prevent lateral freezing of the subgrade surface into the active zone of the traffic load is to increase the design thickness of the XPS TIL below the berm or at the edge of the embankment slope. Figure 18, top, demonstrates a numerical model with the designed greater thickness of the respective TIL at the edge of the embankment slope, or below the berm.
The XPS thickness was progressively adjusted in the numerical model, with the final thickness of 180 mm shown in Figure 18 (top) extending up to a distance of 2.50 m from the embankment slopes, and an 80 mm thick XPS layer continuing up to the track centreline. With this structural treatment, there is no longer any subgrade surface freezing within the active zone of the traffic load. Figure 18 (bottom) presents day 453 of the numerical model, when the maximum frost depth DF of the track structure was reached.
Since the numerical model presented in Figure 18 (top) was satisfactory for the maximum climatic load considered in the numerical modelling (air frost index IF = 2000 °C, day and average annual air temperature θm = −1 °C) and no subgrade surface freezing occurred within the entire active zone of the traffic load, the design dimensions of the structural layers and the numerical modelling were conducted similarly for other climatic loads (range of air frost indices IF = 800–2000 °C, day and average annual air temperature θm = +4 to −1 °C).
The lower limit (IF = 800 °C, day) characterises the climatic load from which, in the case of the standard design of the sub-ballast layers, a large thickness of crushed aggregate protection layer (more than 0.60 m) has to be designed. Therefore, part of it should be replaced by a thermal insulation material. The upper limit (IF = 2000 °C, day) of the climatic load was determined based on the availability of real measured temperatures (the maximum value determined from the data obtained from the SHI). Additionally, in areas with an even higher value of the air freezing index IF, the formation of permafrost (permanently frozen subgrade) can be assumed [41,42].
Table 4 presents the designed thicknesses of the crushed aggregate protection layer at the track centreline (designed with a roof-shaped slope of 5%), the thickness of the XPS applied at the identical roof-shaped slope in the track centreline and near the embankment slope, or under the berm (XPS thickness applied at a width of 2.50 m from the edge of the embankment slope), considering the applied climatic load. The ballast bed was analysed in all numerical models with a total thickness of 0.50 m. In the numerical models, the thermal insulation effect of the snow cover was also included using the so-called nf factor (expressing the dependence between the mean daily air temperature θs and the temperature at the ballast bed surface θbb). In the numerical modelling, nf factor of 0.60 was used, indicating that the temperature at the ballast bed surface θbb is 60% of the value of the applied mean daily air temperature θs (θbb = 0.6·θs).
During the numerical modelling, a constant XPS thickness was initially used along the track centreline to ensure adequate protection of the subgrade surface against freezing. Subsequently, the XPS thickness was adjusted at the embankment slope to provide sufficient protection of the subgrade surface against freezing from above (from the berm) and from the side (from the embankment slope). Finally, the thickness of the crushed aggregate protection layer was modified to ensure adequate protection of the subgrade surface against freezing across the entire area of the active traffic load zone. The width of the active traffic load zone was determined based on the designed dimensions of the sub-ballast layers. It extended from 2.10 m to 2.45 m, depending on the designed structural thickness of the protection layer, from the track centreline towards the embankment slope. The XPS thicknesses were designed based on the thicknesses and dimensions of XPS panels supplied by the manufacturer (in some cases, a 10 mm smaller XPS thickness would have been sufficient, but this was not feasible due to manufacturing constraints).

4. Conclusions

The dimensioning and design of the material composition of railway track structural layers are generally conducted to ensure a minimum of 50 years of service life for the designed structure. Despite ongoing concerns related to global warming and increasing average annual air temperatures, winter periods with significantly adverse climatic conditions (e.g., winter periods of 1986/87 or 2005/2006) or unfavourable winter weather patterns (such as achieving the maximum air frost index in a short period, e.g., winter period 2011/2012) still occur during the design lifespan of railway tracks. For areas with highly adverse climatic conditions (high design air frost index and low average annual air temperature), it would be necessary to design a large thickness of the protective crushed aggregate layer (more than 0.60 m) in the standard design of the sub-ballast layers (consisting solely of a protective layer of crushed aggregate or gravel-sand) to fully ensure the protection of frost-susceptible subgrade surface against freezing. To conserve natural resources and promote sustainable development, it is necessary to reduce the use of such materials and instead replace them with materials that have superior thermal insulation properties, even though these materials may not be readily available in nature.
From the analysis of the applied thermal insulation materials in the structural composition of the sub-ballast layers (XPS layer, Liapor aggregate layer, Liapor concrete layer, composite foam concrete layer) and the experimental or numerical modelling, the following conclusions can be drawn:
  • The frost depth of the railway track structure does not primarily depend on the air frost index IF, but also the average annual air temperature θm, that affects the amount of heat accumulated in the track bed before the freezing period, the course of the winter period (the number and intensity of frost and thaw periods), and the presence of snow cover (especially “dry” snow has a significant thermal-insulating effect);
  • The application of thermal insulation material in the sub-ballast layers provides a significant thermal resistance to frost penetration into the subgrade but results in greater freezing of the overlying layers of the railway track structure (layers located above the thermal insulation material);
  • The frost index on the surface of the ballast bed IFS is lower than the air frost index IF due to the thermal-insulating effect of snow cover. In the case of the standard design of the sub-ballast layers (without embedded thermal insulation material), the surface frost index IFS is significantly lower compared to the modified sub-ballast layers (with applied thermal insulation material), which causes greater cooling of the overlying layers);
  • The highest thermal resistance in the railway track structure is provided by the XPS layer (when comparing the above-mentioned thermal insulation materials);
  • In the case of highly adverse climatic loads on the railway track structure (air frost indices ranging from IF = 800–2000 °C, day and average annual air temperatures from θm = +4 to −1 °C), significant freezing of the subgrade surface occurs even within the active zone of traffic load, extending from the berm and the embankment slope;
  • Complete protection of the subgrade surface against freezing across the entire width of the active traffic load zone can be achieved by designing various thicknesses of XPS, as determined through numerical modelling (see Table 4);
  • Based on the relationship provided in Equation (5) (see Section 2.1) and the thermal technical parameters listed in Table 3 (see Section 3.2), the total thermal resistance (R) for the designed material composition in the numerical model listed in Table 4 (see Section 3.2) can be calculated as R = 3.0 m2·K·W−1 (for IF = 2000 °C, day) or R = 1.58 m2·K·W−1 (for IF = 800 °C, day).
The proposed modified railway track structure with embedded XPS within the railway substructure needs to be tested on a real railway track. However, this is not feasible on the railways in Slovakia. The extent of the climatic load used in the numerical modelling is only found in high-altitude areas in Slovakia, where no railway tracks have been constructed. Therefore, this represents a subject for applied research at research institutions in countries where such climatic loads are standard for the design of their railway tracks.
To test the proposed modified railway track construction (Figure 18, top) in real conditions, suitable machinery would be required to embed XPS into the railway substructure without removing the overlying layers. Of course, other suitable thermal insulation materials could also be tested. However, at present, we are not aware of any other relevant thermal insulation materials that could be tested for their application in railway track construction. Relevant materials are those that are cost-effective, have a low carbon footprint, or are environmentally compatible. It would be appropriate to identify a material that contributes not only to the protection of the frost-susceptible soil from freezing but also enhances the deformation resistance of the railway substructure. This could be the subject of research not only at our institution but also at other foreign research institutions that have railway tracks in areas with higher frost indices.

Author Contributions

Conceptualization, L.I., P.D. and D.N.; methodology, P.D. and M.M.; software, P.D. and D.N.; validation, L.I., P.D. and D.N.; formal analysis, L.I.; investigation, L.I.; resources, L.I.; data curation, P.D., M.M. and D.N.; writing—original draft preparation, L.I., P.D., M.M. and D.N.; writing—review and editing, L.I., P.D. and D.N.; visualization, P.D. and D.N.; supervision, L.I.; project administration, L.I.; funding acquisition, L.I. All authors have read and agreed to the published version of the manuscript.

Funding

This research received no external funding.

Data Availability Statement

The data presented in this article are available upon request from the corresponding author. At the time the project was carried out, there was no obligation to make the data publicly available.

Conflicts of Interest

The authors declare no conflicts of interest.

Abbreviations

For better identification of the abbreviations used and thus improving the readability of this paper, the following list of abbreviations is provided.
DRETMDepartment of Railway Engineering and Track Management
EPSexpanded polystyrene
GLASOPORtrademark for aggregate made from waste glass
LECA/LIAPORtrademark for artificial aggregate made from extruded clay
MPmeasuring profile
SHISlovak Hydrometeorological Institute
TDRtime domain reflectometry
TECANATtrademark for the protective tube of the moisture probe
TILthermal insulation layer
UNIZAUniversity of Žilina
XPSextruded polystyrene

References

  1. Hodás, S.; Pultznerová, A.; Vrchovský, E. Experimental Monitoring of Transition Zones in Railway Tunnels. Civ. Environ. Eng. 2023, 19, 464–473. [Google Scholar] [CrossRef]
  2. Yang, X.; Sun, J.; Pang, R.; Meng, W.; Tao, Z. Experimental Study on the Variation of Unfrozen Water Content and Pore Water in Unsaturated Soil during Thawing Process. IOP Conf. Ser. Earth Environ. Sci. 2021, 861, 052111. [Google Scholar] [CrossRef]
  3. Kou, J.; Teng, J.; Zhang, S. Experimental Study on the Unfrozen Water Content and Pore Size Distribution of Frozen Soil. J. Xi´Univ. Sci. Technol. 2018, 2018, 246–252. [Google Scholar] [CrossRef]
  4. Lu, J.; Pei, W.; Zhang, X.; Bi, J.; Zhao, T. Evaluation of Calculation Models for the Unfrozen Water Content of Freezing Soils. J. Hydrol. 2019, 575, 976–985. [Google Scholar] [CrossRef]
  5. Ižvolt, L.; Dobeš, P.; Holešová, M. Non-Traffic Stresses of Railway Substructures; EDIS-Publisher: Žilina, Slovakia, 2023; ISBN 978-80-554-2001-1. (In Slovak) [Google Scholar]
  6. Long, X.; Cen, G.; Cai, L.; Chen, Y. Experimental Research on Frost Heave Characteristics of Gravel Soil and Multifactor Regression Prediction. Adv. Mater. Sci. Eng. 2018, 2018, 5682619. [Google Scholar] [CrossRef]
  7. Wang, P.; Zhou, G. Frost-Heaving Pressure in Geotechnical Engineering Materials during Freezing Process. Int. J. Min. Sci. Technol. 2018, 28, 287–296. [Google Scholar] [CrossRef]
  8. Zhou, G.; Zhou, Y.; Hu, K.; Wang, Y.; Shang, X. Separate-Ice Frost Heave Model for One-Dimensional Soil Freezing Process. Acta Geotech. 2018, 13, 207–217. [Google Scholar] [CrossRef]
  9. Fredlund, D.G. State of Practice for Use of the Soil-Water Characteristics Curve (SWCC) in Geotechnical Engineering. Can. Geotech. J. 2019, 56, 1059–1069. [Google Scholar] [CrossRef]
  10. He, H.; Zhao, Y.; Dyck, M.F.; Si, B.; Jin, H.; Lv, J.; Wang, J. A Modified Normalized Model for Predicting Effective Soil Thermal Conductivity. Acta Geotech. 2017, 12, 1281–1300. [Google Scholar] [CrossRef]
  11. Kömle, N.I.; Hütter, E.S.; Feng, W.J. Thermal Conductivity Measurements of Coarse-Grained Gravel Materials Using a Hollow Cylindrical Sensor. Acta Geotech. 2010, 5, 211–223. [Google Scholar] [CrossRef]
  12. Siabil, S.M.A.G.; Tafreshi, S.N.M.; Dawson, A.R.; Omran, M.P. Behavior of Expanded Polystyrene (EPS) Blocks under Cyclic Pavement Foundation Loading. In Geosynthetics International; Emerland Publishing: England, UK, 2019; Volume 26, pp. 1–25. [Google Scholar] [CrossRef]
  13. Bian, J.; Cao, W.; Yang, L.; Xiong, C. Experimental Research on the Mechanical Properties of Tailing Microcrystalline Foam Glass. Materials 2018, 11, 2048. [Google Scholar] [CrossRef] [PubMed]
  14. Hisham, N.A.N.; Zaid, M.H.M.; Aziz, S.H.A.; Muhammad, F.D. Comparison of Foam Glass-Ceramics with Different Composition Derived from Ark Clamshell (ACS) and Soda Lime Silica (SLS) Glass Bottles Sintered at Various Temperatures. Materials 2021, 14, 570. [Google Scholar] [CrossRef] [PubMed]
  15. Qin, Z.; Li, G.; Tian, Y.; Ma, Y.; Shen, P. Numerical Simulation of Thermal Conductivity of Foam Glass Based on the Steady-State Method. Materials 2019, 12, 54. [Google Scholar] [CrossRef] [PubMed]
  16. Paunescu, L.; Axinte, S.M.; Dragoescu, M.F.; Cosmulescu, F. Adequate Correlation between the Physical and Mechanical Properties of Glass Foam. J. Multiapp 2021, 2, 14–26. [Google Scholar] [CrossRef]
  17. Yu, W.; Liang, X.; Ni, F.M.; Oyeyi, A.G.; Tighe, S. Characteristics of Lightweight Cellular Concrete and Effects on Mechanical Properties. Materials 2020, 13, 2678. [Google Scholar] [CrossRef]
  18. Falliano, D.; Domenico, D.; Ricciardi, G.; Gugliandolo, E. Experimental Investigation on the Compressive Strength of Foamed Concrete: Effect of Curing Conditions, Cement Type, Foaming Agent and Dry Density. Constr. Build. Mater. 2018, 165, 735–749. [Google Scholar] [CrossRef]
  19. Sun, C.; Zhu, Y.; Guo, J.; Zhang, Y.; Sun, G. Effects of Foaming Agent Type on the Workability, Drying Shrinkage, Frost Resistance and Pore Distribution of Foamed Concrete. Constr. Build. Mater. 2018, 186, 833–839. [Google Scholar] [CrossRef]
  20. Kadela, M.; Kukiełka, A.; Małek, M. Characteristics of Lightweight Concrete Based on a Synthetic Polymer Foaming Agent. Materials 2020, 13, 4979. [Google Scholar] [CrossRef]
  21. Kozłowski, M.; Kadela, M. Mechanical Characterization of Lightweight Foamed Concrete. Adv. Mater. Sci. Eng. 2018, 2018, 6801258. [Google Scholar] [CrossRef]
  22. Krzywoń, R.; Dawczyński, S. Strength Parameters of Foamed Geopolymer Reinforced with GFRP Mesh. Materials 2021, 14, 689. [Google Scholar] [CrossRef]
  23. Niu, F.; Jiang, H.; Su, W.; Jiang, W.; He, J. Performance Degradation of Polymer Material under Freeze-Thaw Cycles: A Case Study of Extruded Polystyrene Board. Polym. Test. 2021, 96, 107067. [Google Scholar] [CrossRef]
  24. Tafreshi, S.N.M.; Siabil, S.M.A.G.; Dawson, A.R. Expanded Polystyrene Geofoam. In New Materials in Civil Engineering; Butterworth-Heinemann: England, UK, 2020; Volume 2020, pp. 117–153. [Google Scholar] [CrossRef]
  25. Nurmikolu, A.; Kolisoja, P. Extruded polystyrene (XPS) foam frost insulation boards in railway structures. In Proceedings of the 16th International Conference on Soil Mechanics and Geotechnical Engineering, Osaka, Japan, 12–15 September 2005. [Google Scholar] [CrossRef]
  26. Addison, P.; Lautala, P.; Oommen, T.; Vallos, Z. Embankment Stabilization Techniques for Railroads on Permafrost. In Proceedings of the 2016 Joint Rail Conference, Columbia, SC, USA, 12–15 April 2016. [Google Scholar] [CrossRef]
  27. Partyka, J.; Wysoczański, A. Utilization Aspects of Extruded Polystyrene and Expanded Clay Aggregate in Road Frost Protection Structures. Innov. Infrastruct. Solut. 2024, 9, 41. [Google Scholar] [CrossRef]
  28. Loranger, E.; Kuznetsova, E.; Hoff, I.; Aksnes, J.; Skoglund, K.A. Evaluation of Norwegian Gradation Based Regulation for Frost Susceptibility of Crushed Rock Aggregates in Roads and Railways. In Bearing Capacity of Roads, Railways and Airfields; CRC Press: Boca Raton, FL, USA, 2017; pp. 2077–2085. [Google Scholar] [CrossRef]
  29. Oyeyi, A.G.; Badewa, E.A.; Ni, F.M.; Tighe, S. Field Study on Thermal Behavior of Lightweight Cellular Concrete as Pavement Subgrade Protection in Cold Regions. Cold Reg. Sci. Technol. 2023, 214, 103966. [Google Scholar] [CrossRef]
  30. Zhuo, Z.; Ali, A.; Zhu, C.; Mehta, Y.; Lein, W.; DeCarlo, C.; Elshaer, M.; Kennedy, D. Evaluating the Potential of Using Foamed Concrete as the Insulation Layer for Pavements in Cold Regions. Constr. Build. Mater. 2022, 341, 127903. [Google Scholar] [CrossRef]
  31. Huang, J.; Su, Q.; Zhao, W.; Li, T.; Zhang, X. Experimental Study on Use of Lightweight Foam Concrete as Subgrade Bed Filler of Ballastless Track. Constr. Build. Mater. 2017, 149, 911–920. [Google Scholar] [CrossRef]
  32. Ižvolt, L.; Dobeš, P.; Holešová, M.; Navikas, D. Numerical Modelling of Thermal Regime of Railway Track—Structure with Thermal Insulation (Styrodur). J. Civ. Eng. Manag. 2021, 27, 525–538. [Google Scholar] [CrossRef]
  33. Ižvolt, L.; Dobeš, P.; Drusa, M.; Kadela, M.; Holešová, M. Experimental and Numerical Verification of the Railway Track Substructure with Innovative Thermal Insulation Materials. Materials 2022, 15, 160. [Google Scholar] [CrossRef]
  34. Decký, M.; Hodásová, K.; Papánová, Z.; Remišová, E. Sustainable Adaptive Cycle Pavements Using Composite Foam Concrete at High Altitudes in Central Europe. Sustainability 2022, 14, 9034. [Google Scholar] [CrossRef]
  35. TNŽ 73 6312; Proposed Construction Design of the Subgrade Layers. Directorate General of the Railways of the Slovak Republic: Bratislava, Slovak Republic, 2005. (In Slovak)
  36. Pieš, J.; Môcová, L. Application of TDR Test Probe for Determination of Moisture Changes of Railway Substructure Materials. In Proceedings of the 13th International Scientific Conference on Sustainable, Modern and Safe Transport, Novy Smokovec, Slovak Republic, 29–31 May 2019. [Google Scholar] [CrossRef]
  37. Ižvolt, L.; Dobeš, P.; Pieš, J. Verification of Boundary Conditions of Numerical Modeling of the Track Substructure Thermal Regime—Influence of the Snow Cover. Arch. Transp. 2018, 48, 51–60. [Google Scholar] [CrossRef]
  38. Thode, R. 2D/3D Geothermal Modeling Software, Tutorial Manual; SVHEAT: Saskatoon, SK, Canada, 2012; Available online: https://manualzilla.com/doc/5907794/svheat-tutorial-manual (accessed on 15 October 2021).
  39. Fredlund, M.; Haihua, L. 2D/3D Visualization Software, User’s Manual; ACUMESH: Saskatoon, SK, Canada, 2011. [Google Scholar]
  40. Decký, M.; Papánová, Z.; Juhas, M.; Kudelčíková, M. Evaluation of the Effect of Average Annual Temperatures in Slovakia between 1971 and 2020 on Stresses in Rigid Pavements. Land 2022, 11, 764. [Google Scholar] [CrossRef]
  41. Song, C.; Dai, C.; Gao, Y.; Wang, C.; Yu, M.; Tu, W.; Jia, M.; Li, R. Spatial-Temporal Characteristics of Freezing/Thawing Index and Permafrost Distribution in Heilongjiang Province, China. Sustainability 2022, 14, 16899. [Google Scholar] [CrossRef]
  42. Wang, K.; Zhang, T.; Clow, G.D. Permafrost Thermal Responses to Asymmetrical Climate Changes: An Integrated Perspective. Geophys. Res. Lett. 2023, 50, e2022GL100327. [Google Scholar] [CrossRef]
Figure 1. Plan view of the DRETM test stand—localisation of measurement profiles with standard and modified structural composition of the sub-ballast layers.
Buildings 15 00239 g001
Figure 2. Test stand DRETM during the winter period.
Buildings 15 00239 g002
Figure 3. Trime-Pico T3/IPH44 moisture probe and HD2 reading device (left), Pt1000 ground temperature sensor located on the surface of the ballast bed and connection of the individual sensors to the data logger located in the distributor (photo in the (middle)), Comet T3419 sensor (right).
Buildings 15 00239 g003
Figure 4. Standard construction of the sub-ballast layers—a protective layer built of crushed aggregate.
Buildings 15 00239 g004
Figure 5. Modified sub-ballast layers—a protective layer of crushed aggregate partially reduced by the application of a thermal-insulating layer of extruded polystyrene.
Buildings 15 00239 g005
Figure 6. Modified construction of the sub-ballast layers—a protective layer of crushed aggregate partially reduced by the application of a reinforcing and thermal-insulating layer of Liapor concrete.
Buildings 15 00239 g006
Figure 7. Modified construction of the sub-ballast layers—a protective layer of crushed aggregate partially reduced by the application of a thermal-insulating layer of Liapor (commercially known as Keramzit).
Buildings 15 00239 g007
Figure 8. Modified construction of the sub-ballast layers—a protective layer of crushed aggregate partially reduced by the application of a reinforcing and thermal insulation layer of composite foam concrete.
Buildings 15 00239 g008
Figure 9. Photographs of the installation of thermal insulation layers are shown from (top left) to (bottom right): the installation of a structural layer of extruded polystyrene (top left), a layer of Liapor concrete (top right), a layer of Liapor fr. 0/16 mm (bottom left), and the installation of a composite layer of foam concrete (bottom right).
Buildings 15 00239 g009
Figure 10. Evaluation of the air frost index IF for the winter period 2016/2017—(left) and winter period 2018/2019—(right).
Buildings 15 00239 g010
Figure 11. Determined value of frost depth DF for the winter period 2018/2019 in measurement profile no. 1 (without built-in thermal insulation material)—(top) and in measurement profile no. 3 (with a built-in layer of extruded polystyrene—XPS)—(bottom).
Buildings 15 00239 g011aBuildings 15 00239 g011b
Figure 12. The course of minimum mean daily air temperatures θs in the individual measurement profiles during the winter period 2018/2019 and during 2019 ((top)—at the sub-ballast upper surface level, (bottom)—between the sub-ballast upper surface level and the thermal insulation layer).
Buildings 15 00239 g012
Figure 13. The course of minimum mean daily air temperatures θs in the individual measurement profiles during the winter period 2018/2019 and during 2019 ((top)—at the level below the thermal insulation material, (bottom)—detail of the comparison of temperatures in the individual levels of MP1 and MP3 in the winter period 2018/2019).
Buildings 15 00239 g013
Figure 14. Unmelted snow cover during a period of warming above MP3 (with an embedded layer of XPS).
Buildings 15 00239 g014
Figure 15. Example of a numerical model with finite element method calculations (left); material composition of the numerical models (centre); and colour coding of the temperatures achieved in the structural layers and subgrade during the freezing process of the numerical model (right).
Buildings 15 00239 g015
Figure 16. Numerical model of the modified sub-ballast layers (with an embedded XPS layer of 80 mm thickness across the entire width of the subgrade surface)—(top). Day 448 of the numerical model (the last day of the severe cold period with daily mean temperatures below −10 °C)—(bottom).
Buildings 15 00239 g016
Figure 17. Day 453 of the numerical model (day of reaching the largest lateral freezing of the subgrade surface)—(top), day 531 of the numerical model (day of reaching the maximum value of the air frost index IF = 2000 °C, day)—(bottom).
Buildings 15 00239 g017
Figure 18. Numerical model of the modified sub-ballast layers (embedded layer of XPS with a structural thickness of 80 mm or 180 mm up to a distance of 2.50 m from the embankment slope)—(top), the specific day of reaching the greatest frost depth in the numerical model (453rd day)—(bottom).
Buildings 15 00239 g018
Table 1. Evaluated thermal regime parameters and climatic characteristics of individual winter seasons from measured data on MP1 (without built-in thermal insulation material).
Winter Periodθs, min
(°C)
θm
(°C)
IF
(°C, day)
IFS
(°C, day)
DF
(m)
2013/2014−11.79.638220.41
2014/2015−10.810.277320.41
2015/2016−10.29.999720.46
2016/2017−19.09.22842480.65
2017/2018 1−11.29.0107660.56
2018/2019−11.310.3124580.47
2019/2020−7.710.150280.37
2020/2021−12.49.6110270.37
2021/2022−8.28.860370.41
2022/2023−9.99.759310.45
2023/2024−8.310.249440.41
1 Winter period when snow cover was not removed from the surface of the measurement profile.
Table 2. Achieved frost depth DF from measured data in individual measurement profiles (without and with built-in thermal insulation materials) in the winter period 2018/2019.
Winter PeriodAchieved Frost Depth—DF (m)
MP1MP3MP4MP6MP7
2018/20190.470.650.490.38 10.49
1 Winter period when snow cover was not removed from the surface of the measurement profile.
Table 3. Physical and thermal–technical parameters of the embedded structural materials and subgrade of the numerical model.
Structural Layer/Material Characteristics Ballast Bed-NewProtective
Layer
Thermal Insulation LayerLevelling LayerSubgrade
Layer materialgravel
fr. 31.5/63 mm
crushed aggregate
fr. 0/31.5 mm
extruded polystyrenesand
fr. 0/1 mm
clay
Temperature θ (°C)235510
Moisture w (%)15.5121226
Bulk density ρ (kg·m−3)190019303517501650
Specific heat capacity c (J·kg−1·K−1)980109020609601095
Thermal conductivity coefficient λ (W·m−1·K−1)0.71.730.042.001.55
Table 4. Designed structural layer thicknesses of numerical models as a function of climatic load.
Air Frost
Index IF
(°C, day)
Average Annual Air Temperature θm
(°C)
Duration of Frost Period
(Days)
Protective Layer Thickness tpl
(mm)
XPS Thickness in the Track Centreline
(mm)
XPS Thickness at the Embankment Slope
(mm)
80041102003050
100021804505060
120011905005080
1400120050060100
1600−0.522050080120
1800−124050080140
2000−125550080180
Disclaimer/Publisher’s Note: The statements, opinions and data contained in all publications are solely those of the individual author(s) and contributor(s) and not of MDPI and/or the editor(s). MDPI and/or the editor(s) disclaim responsibility for any injury to people or property resulting from any ideas, methods, instructions or products referred to in the content.

