Abstract
Prefabricated stations utilizing digital modeling techniques demonstrate significant advantages over traditional cast-in-place methods, including improved dimensional accuracy, reduced environmental impact, and minimized material waste. To maximize these benefits, this study develops a digital twin platform for prefabricated assembled superimposed stations through the integration of Digital Twin Scene–Entity–Relationship–Incident–Control (SERIC) modeling with IoT technology. The platform adopts a “1+5+N” architecture that implements model-data separation, lightweight processing, and model-data association for SERIC model management, while IoT-enabled data acquisition facilitates lifecycle data sharing. By integrating BIM models, engineering data, and IoT sensor inputs, the platform employs multi-source analytics to monitor construction progress, enhance safety surveillance, ensure quality control, and optimize designs. Implementation at Jinan Metro Line 8’s prefabricated underground station confirms the SERIC-IoT digital twin’s efficacy in advancing sustainable, high-quality rail transit development. Results demonstrate the platform’s capacity to improve construction efficiency and operational management, aligning with urban rail objectives prioritizing sustainability and technological innovation. This study establishes that integrating SERIC modeling with IoT in digital twin frameworks offers a robust approach to modernizing prefabricated station construction, with scalable applications for future smart transit infrastructure.
1. Introduction
With the continuous advancement of information technology and the growing emphasis on energy conservation and emission reduction, the traditional construction industry is increasingly demanding intelligent solutions. Consequently, BIM technology and IoT technology have been widely adopted in the construction sector [1]. As a representative technology of civil engineering informatization, BIM has brought profound transformations to the construction industry. Its applications span the entire construction lifecycle, such as structural health monitoring [2], data acquisition [3] and building information visualization [4]. Numerous scholars have applied BIM in the design of subway stations; Li [5] developed a BIM 3D model for standard metro station sections. Cui [6] incorporated IoT technology for regional safety monitoring, laying the groundwork for lifecycle safety management [7]. Liu Jun [8] leveraged BIM to automate slab assembly in framed underground structures, mitigating hoisting-related issues and enhancing product protection. Wang [9] further utilized BIM models to simulate prefabricated component assembly for construction schedule control.
IoT was first introduced by Kevin Ashton in 1998 and has gained increasingly more attention in the academia and industry [10]. This technology aims to share information across platforms enabling innovative applications [11]. The application of IoT in the construction industry is diverse, encompassing enhanced safety, operational efficiency, and construction methodologies. Zhou [12] utilized IoT technology to establish a safety barrier alert system for underground construction sites. Louis [13] developed an IoT framework supporting real-time decision-making on construction sites. By leveraging sensor data to determine equipment status and inputting it into operational models, this framework improves operational performance and enables scientific planning.
Research by the aforementioned scholars reveals that although BIM and IoT devices have individually advanced to sophisticated levels, standalone applications still present limitations. BIM exhibits a real-time data synchronization gap, failing to reflect dynamic building conditions, while IoT faces challenges such as lack of unified data standards and cross-system data sharing barriers. This further stimulates research on the applications of integrated BIM-IoT systems [14].
The integration of BIM-IoT systems [15] optimizes construction efficiency and engineering quality in transportation hubs, accelerating the digital and intelligent transformation of construction processes [16]. BIM-IoT systems also represent an enabling approach for digital twins. Digital twin technology, initially proposed by Michael Grieves, dynamically connects physical entities with virtual models through bidirectional data flows [17], enabling lifecycle mapping and optimization. Its core elements comprise physical entities, virtual counterparts, and their information exchange [18]. By creating visualizable virtual 3D models, digital twins use multidimensional simulations as engines and data as drivers to deliver industry-specific applications, including intelligent services, refined management, and reliable operation and maintenance [19]. The technology has gained traction in structural health monitoring [20], bridge engineering [21], and underground infrastructure [22], demonstrating significant potential.
Current research on integrating BIM-IoT systems in prefabricated assembled superimposed stations primarily addresses localized stages such as quality inspection, hoisting, and component assembly. However, comprehensive studies remain scarce regarding dynamic perception, intelligent analysis, and risk early-warning systems for critical lifecycle data—spanning component casting, curing, transportation, hoisting, assembly, and subsequent operation and maintenance [23]. This gap impedes systematic technical support for ensuring long-term safety and reliability in large-scale structures like stations.
Regarding the above issues, this paper proposes a Digital Twin Scene–Entity–Relationship–Incident–Control (SERIC) modeling method. The SERIC modeling method establishes a BIM model of prefabricated station components as a virtual entity, integrates it with physical component entities to form a digital twin, and further enhances this framework by incorporating IoT technology. This integration adds scene, relationship, incident, and control, ultimately constructing a comprehensive digital twin platform. Through analysis of the SERIC-IoT integration process and its deep convergence in construction assistance, this study demonstrates the platform’s core capabilities in real-time control and dynamic coordination. The approach significantly contributes to deformation control in primary station structures, operational safety assurance, and design optimization for similar projects. The application process and overall idea of this study are shown in Figure 1.
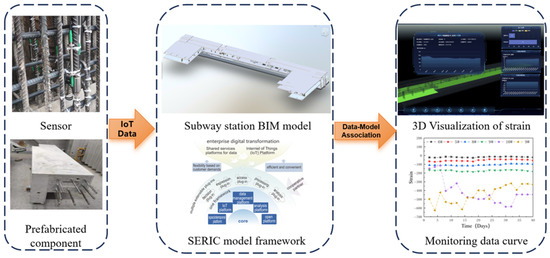
Figure 1.
Application process and design ideas.
2. Digital Twin Platform Architecture
This paper proposes a “1+5+N” logical architecture for the digital twin platform (Figure 2), where ‘1’ denotes one framework, ‘5’ represents five core modules (IoT foundation, data infrastructure, capability engine, object service, and open platform), and ‘N’ stands for N scalable components (e.g., decision-making, visualization, and analytical components). The five modules’ architecture (Figure 3) is built upon an underlying framework that equally emphasizes information technology and professional capabilities, grounded in a unified ‘Digital Twin’ model of infrastructure. It supports infrastructure data lifecycle services, including access, processing, representation, analysis, and decision-making. The prefabricated station digital twin platform serves as a configurable PaaS platform, delivering essential IT capabilities and domain-specific functionalities. This platform facilitates the rapid standardized construction of digital infrastructure, supports the efficient development of various smart applications, and enables the entire lifecycle management of digital construction and station operations.
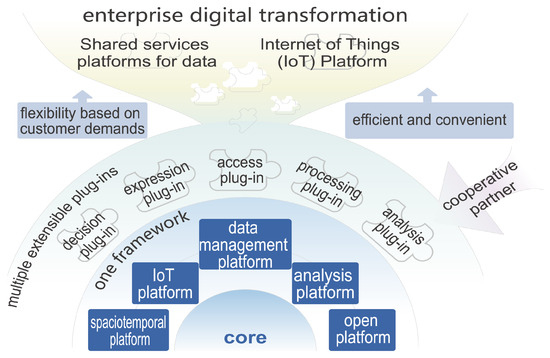
Figure 2.
Platform Building Digital Twin Logical Architecture.
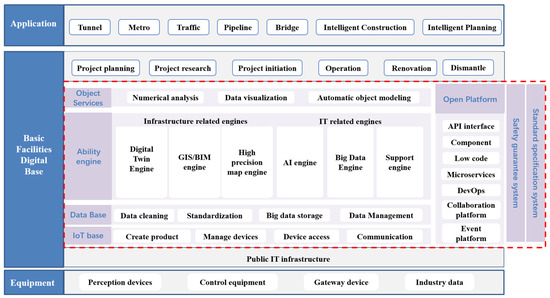
Figure 3.
Specific components of the “5 modules”.
The IoT foundation corresponds to physical entities in digital twins, such as LiDAR, millimeter-wave radar, and sensors, transmitting data to virtual space via communication infrastructure like 4G/5G networks. Downward, it connects diverse IoT terminal devices within infrastructure, enabling rapid and secure device access while unifying data reception from sensors. Upward, it supplies the data foundation with diverse physical space data and downward controls devices through command distribution.
The data foundation primarily provides functions including data standardization, cleansing, storage, metadata management and permissions. It handles multi-source data such as collected structured data, personnel data, equipment data, and foundational data. Downward, it offers data storage services for multimodal data from the IoT foundation, users, and third-party platforms. Upward, it supplies data access services and fused data storage to capability engines.
Capability engines integrate comprehensive scenarios encompassing station Revit, point clouds, oblique photography, geological models, and parametric borehole models. They deliver data-driven automated geometric modeling, processing, and publishing capabilities.
Object services provide common service capabilities across various infrastructure domains, including numerical analysis, constitutive models, physical field solving, data visualization, automated object modeling, dynamic model updating, and early warning systems. The functional workflow involves: first, visualizing information (e.g., BIM models, personnel behavior, construction progress, safety analysis, and IoT devices); second, performing auxiliary decision-making analysis; ultimately achieving corresponding functionalities.
The IoT foundation, data foundation, capability engines, and public object services are uniformly integrated upward into the microservices framework of an open platform. Platform services are delivered via API interfaces, offering DevOps process development support and leveraging low-code development technologies to help users rapidly implement requirements.
3. Application Features of Digital Twin Platform for Prefabricated Assembled Superimposed Stations
3.1. Prefabricated Component Management
Component information, as static data, is entered into the database according to unified data standards and linked to the BIM (Building Information Modeling) model. Quality information for prefabricated components typically exists in tabular form. By establishing data standards, parameters such as designed pile top elevation and concrete strength grade are standardized and normalized to achieve unified data entry (Figure 4).
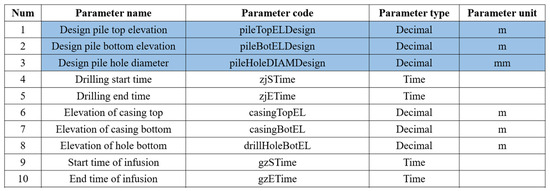
Figure 4.
Component information input scheme.
This process ensures data consistency and traceability, enabling different project stakeholders to share and access identical information. Integrating component information with BIM models facilitates comprehensive management and analysis of construction projects, including material specifications, dimensions, performance, and installation details (Figure 5). Furthermore, this linkage supports subsequent maintenance and operations, allowing engineers and managers to quickly locate issues and make informed decisions through real-time queries. Unified data standards also enhance interoperability between software and systems, improving efficiency, reducing information silos, and ensuring smooth project implementation.
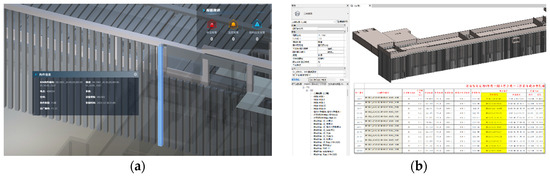
Figure 5.
Component Information Interaction (a) Component browsing interactive interface; (b) Project numerical model correlation effect.
3.2. Professional Interface Management for Reserved and Embedded Components
BIM models play a critical role in managing interfaces for reserved and embedded components. Through precise modeling in BIM, project teams can clearly identify interface locations and dimensional requirements across disciplines, effectively preventing conflicts during design and construction.
BIM provides a 3D visualization platform enabling multidisciplinary collaboration in a unified environment. Designers, constructors, and engineers can review layouts of reserved and embedded components in real time, ensuring coordination between specialties. Additionally, BIM allows detailed annotations of reserved positions, including dimensions, materials, and installation requirements (Figure 6). Centralized management of this information enhances construction efficiency, reduces communication errors, and ensures accurate execution.
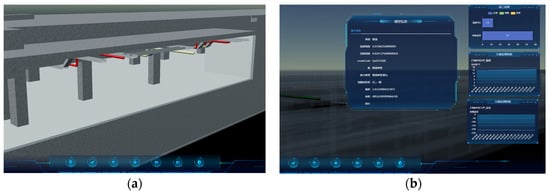
Figure 6.
Pipeline Interactive Interface (a) Pipeline pre embedded layout; (b) View basic information of pipelines.
3.3. Real-Time BIM Model Resource Sharing
Leveraging standardized data, the system first configures templates for digital objects (e.g., main station components, monitoring points) and generates instances based on these templates to build digital entities of infrastructure. Simultaneously, the system automatically identifies and integrates BIM model files from diverse software platforms and projects. Users can flexibly define processing workflows, including data cleansing, format conversion, and information extraction. During processing, the system analyzes and optimizes models according to predefined rules, identifies component relationships, and generates standardized model data. Processed BIM models are automatically published to the Model Service Resource Platform as service resources, enabling access and utilization by project teams and stakeholders.
4. Establishment of the 3D BIM Model
4.1. Modeling Process and Methodology
During the BIM modeling process, the foundational component model is first constructed using Revit. Subsequently, data-model separation and lightweight processing are performed [24]. Finally, leveraging data-model association, visualization, and interactive browsing technologies, the model is integrated into the BIM platform to provide differentiated services for various project stakeholders [25]. The specific workflow is as follows:
- Model Establishment: Revit is employed to create the 3D BIM model for the metro station (Figure 7).
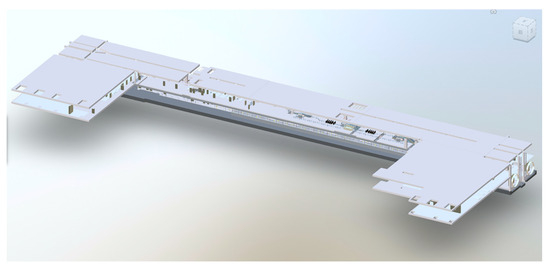 Figure 7. Screenshot of subway station BIM model effect.
 - Data-Model Separation: The mathematical model is decoupled from the practical application scenarios. This process avoids complexities related to data sources, quality, and processing workflows, enabling efficient management and collaboration of multi-dimensional data (Figure 8).
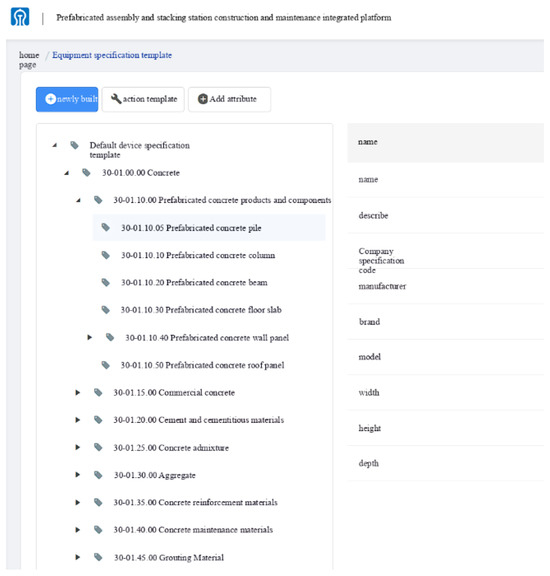 Figure 8. Screenshot of BIM model digital analog separation operation interface.
 - Lightweight Processing: To reduce the data volume of the 3D model, enhance storage and transmission efficiency, and ensure adaptability across multiple platforms, model lightweighting techniques are applied to optimize geometric information. This study utilizes an octree processor to achieve this processing (Figure 9).
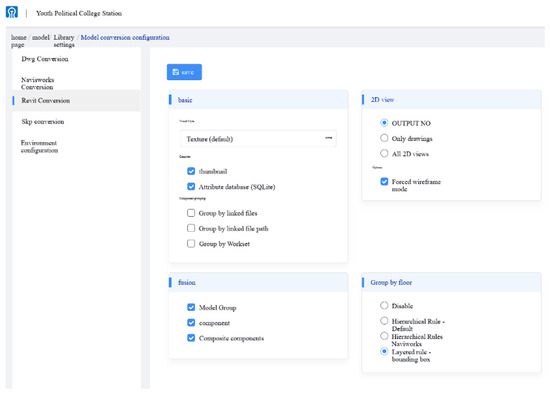 Figure 9. Screenshot of input parameters for octree processor.
 - Data-Model Association: By establishing a mapping relationship between the mathematical model and the actual engineering project, mathematical methods are used to perform structured analysis and state prediction of the engineering entity. To facilitate the engineering application of the model, a structured physical station dataset is constructed by integrating sensor networks [26]. Using the Cuiping West Road Utility Tunnel project (from the start point to chainage K0+987.149) as a case study, the construction schedule is dynamically linked with model components, enabling visual monitoring of construction progress (Figure 10).
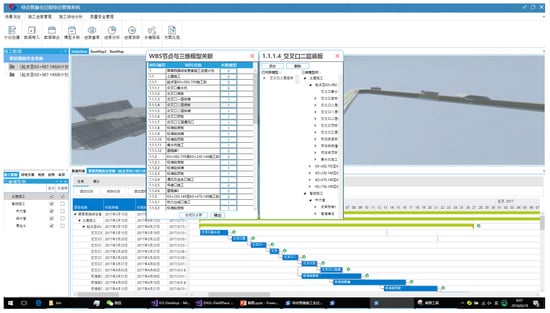 Figure 10. Schematic diagram of numerical model correlation.
 - Model Visualization and Interactive Browsing: The visualization effect of the project model is shown in Figure 11.
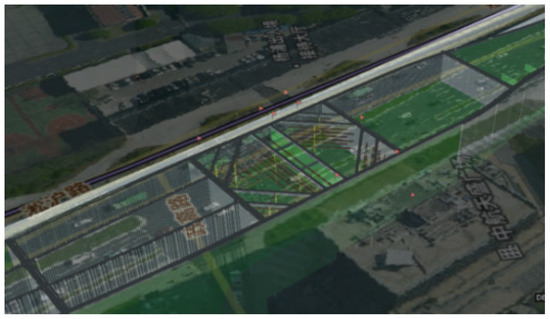 Figure 11. Visualization effect of project model.
4.2. Modeling Characteristics
- Data Interoperability: By performing data-model separation and lightweight processing on Revit modeling components and adopting standardized data formats for cross-platform interaction, the compatibility of the model across different software systems is significantly improved. This creates favorable conditions for the seamless application of the design model during the construction phase.
- High Reusability: For standard components that recur during construction, BIM models can be rapidly and batch-created through unified parameter settings and referencing 2D drawings, significantly enhancing modeling efficiency.
5. IoT Device Integration
The monitoring system utilizes fiber Bragg grating (FBG) surface strain sensors (NZS-FBG-SSG) paired with a demodulator. The NZS-FBG-A02 demodulator supports unattended operation, while the strain sensors achieve synchronous strain measurement with concrete structures through surface-mounted installation. This system is particularly suited for real-time monitoring of distributed strain and temperature over long distances. By deploying sensing nodes at critical locations of prefabricated structures, stress–strain data under load can be acquired in real time to track overall stiffness variations.
Monitoring data is transmitted to the BIM platform database via standard communication protocols, providing foundational data for subsequent analysis. This integration approach achieves seamless convergence between physical monitoring data and digital models.
6. SERIC Digital Twin Modeling Method
This paper proposes a systematic digital twin modeling method for complex engineering systems based on the SERIC modeling framework [27], and validates its effectiveness through a typical engineering case (Figure 12).
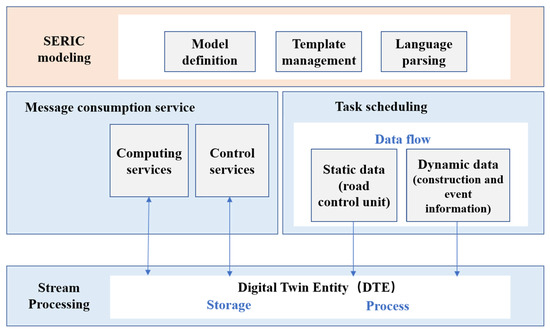
Figure 12.
Overall architecture of digital twin modeling. The arrows represent the direction of data flow.
6.1. SERIC Modeling Theoretical Framework
The SERIC modeling framework comprises five core meta-models:
- Digital Twin Entity (DTE): Based on the PVL (Physical-Virtual-Link) cognitive model, formally defined as DTE = (G, A, S, B), where G denotes geometric features, A represents the attribute set, S is the state machine (S ∈ {V, PV}), and B defines behavioral rules.
- Digital Twin Controller (DTC): DTC = (trigger, input, algorithm, output), where algorithm refers to microservice-encapsulated computational logic. The DTC serves as the core decision-making unit of digital twin systems, adopting a modular architecture. This architecture consists of four components: a trigger component, an input parameter constructor, a core algorithm component, and an output component. The trigger component enables conditional dynamic triggering via a rule engine. The input parameter constructor handles data format conversion and normalization. The core algorithm component encapsulates domain knowledge as microservices. The output component provides multi-channel distribution capabilities, publishing state update events via an event bus or directly invoking behavioral interfaces of downstream digital twin entities. Component decoupling is achieved through the Chain of Responsibility pattern. In real-time systems, empirical data show end-to-end latency below 200 milliseconds, providing foundational support for system scalability and dynamic evolution.
- Digital Twin Incident (DTI): DTI = (type, content, producer, consumer), implementing cross-entity communication via a publish-subscribe pattern. DTI modeling requires explicit definition of event types, content bodies, producers, and consumers.
- Digital Twin Scene (DTS): DTS = {DTE, DTR, DTI, DTC}, where DTE denotes the entity set, DTR the relationship set, DTI the incident set, and DTC the control logic set. DTS configurations form scene files that instantiate and dynamically execute these components.
- Digital Twin Relationship (DTR): DTR ⊆ DTE × DTE, defining topological associations between entities, including spatial relationships and information flows.
An example of SERIC digital twin modeling is shown in Figure 13.
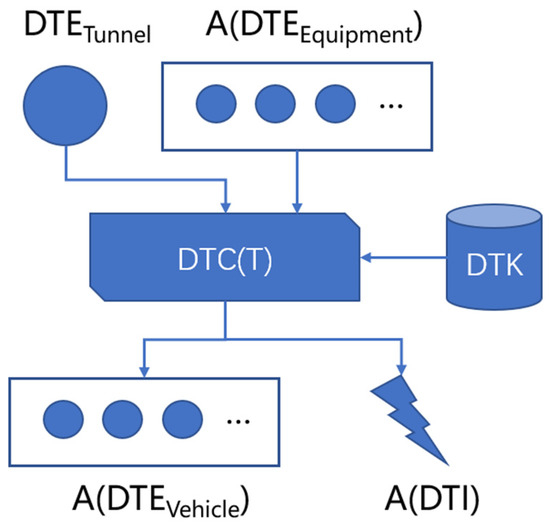
Figure 13.
Example of Digital Twin Modeling. This image shows a digital twin of a station operation, where A(⋯⋯) represents a set and arrows indicate the input and output directions of data.
6.2. Advantage of the SERIC Modeling Method
As a systematic digital twin modeling framework, SERIC offers the following core advantages:
- Standardization: SERIC provides a standardized modeling language through its five-element structure, enabling formal descriptions of digital twin system structures, behaviors, and interaction logic, thereby enhancing model reusability and verifiability.
- Scalability: Its layered modeling strategy (conceptual, logical, physical) supports component encapsulation, facilitating functional expansion and system integration across multi-domain complex scenarios.
- Dynamicity and Real-Time Capability: Event-driven mechanisms and rule engines enable dynamic responses. Integration with message middleware (e.g., Kafka) ensures low-latency data processing and decision feedback, meeting real-time monitoring and control requirements.
- Multi-Scenario Adaptability: Template-based design enables rapid adaptation to diverse industrial scenarios, significantly reducing development costs.
In summary, SERIC demonstrates significant strengths in standardization, system flexibility, real-time performance, and cross-domain applicability, providing a systematic solution for digital twin system construction.
7. Engineering Application
7.1. Engineering Background
The proposed digital twin technology integrating BIM and IoT was applied to the underground prefabricated assembled composite station of Phase I of Jinan Urban Rail Transit Line 8 (Figure 14). This phase adopted a prefabricated scheme featuring pile-wall compositing, prefabricated retaining piles, cast-in-place sidewalls, composite roof slabs, and prefabricated supports. The roof slab utilized a hybrid prefabricated and cast-in-place approach. This method leveraged the retaining structure to participate in the load-bearing of the main structure, enhancing its utilization rate. It achieved refined design and cost reduction, providing innovative solutions for green metro construction.
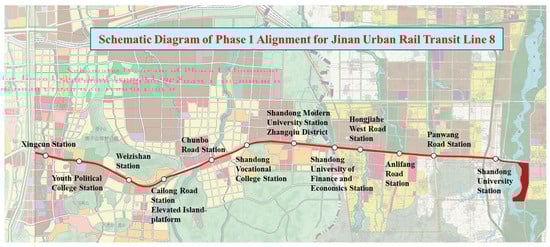
Figure 14.
Schematic diagram of the direction of Jinan Urban Rail Transit Line 8 Phase I Project. The hollow circle represents the station, and the solid red line represents the subway line.
7.2. Digital Twin Lifecycle Solution
Data fusion technology enables integrated management of multi-disciplinary and multi-service engineering data. The digital twin platform for prefabricated composite stations incorporates IoT-collected monitoring data and other engineering data (e.g., design, production, and construction information). Built-in algorithms analyze these multi-source data to achieve construction progress tracking, structural safety monitoring, quality management, and process-aided design (Figure 15).
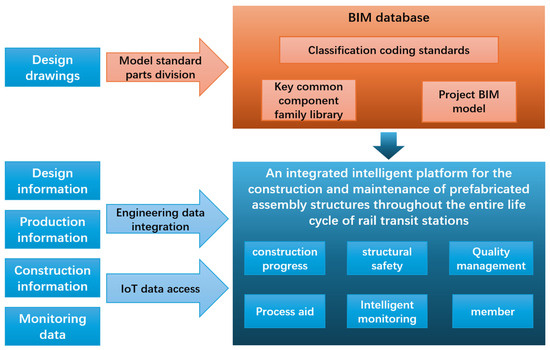
Figure 15.
A holistic solution based on a digital twin platform for prefabricated assembled stacked stations.
7.3. Sensor Layout Scheme and Monitoring Data
To compare structural deformation patterns under different stratigraphic conditions, key structures such as base slabs, sidewalls, and center columns at various axes were intensively monitored based on the project’s characteristics and technical requirements. Analyses were conducted on structural deformation discrepancies. This study examines a specific underground station on Line 8 of an urban rail transit system (Figure 16). The station measures approximately 232.6 m in length; its standard section width is 20.1 m. The main structure, buried at a depth of approximately 11 m, features a two-level island platform and was constructed using the cut-and-cover method.
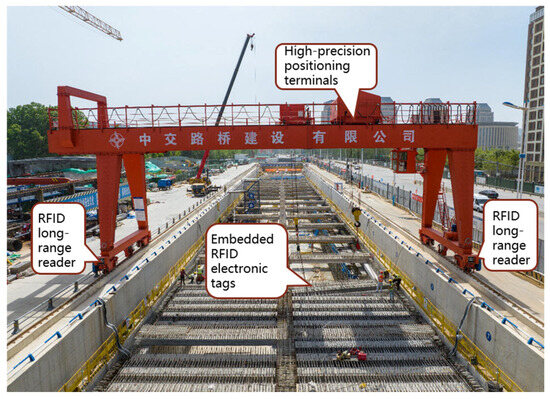
Figure 16.
Engineering Site Schematic Diagram.
During construction, ambient temperatures ranged between 5 °C and 30 °C, with a high groundwater level. To prevent water ingress into optical fibers, sensors were equipped with waterproof sheaths. The concrete had a strength grade of C45, with a sidewall thickness of 0.8 m, base slab thickness of 1.8 m, and center column cross-section dimensions of 0.8 m × 1.5 m. Monitoring points were installed on base slabs, sidewalls, and center columns at Axes 23, 14, and 8 (Figure 17). FBG strain sensors monitored internal concrete strain, while temperature-compensating FBGs were deployed at adjacent locations to eliminate environmental thermal effects.
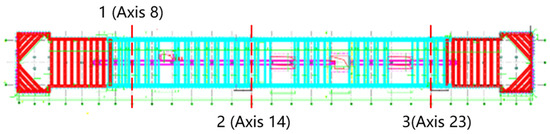
Figure 17.
Planar Schematic Diagram of Sensor Deployment Locations.
This enabled remote automated acquisition of structural deformation information during construction, offering intuitive insights into the mechanical behavior of critical joints in the prefabricated station under load. Taking the 14 Axis layout of sensors and monitoring data as an example for analysis, the layout is shown in Figure 18, the strain curve is shown in Figure 19, and the monitoring data is shown in Table 1. Embedded FBG strain sensors were symmetrically installed at dual internal and external measurement points and secured to reinforcement bars. Identical monitoring zones and sensor installation methods were implemented across different axial planes. For sidewalls, five vertically equidistant monitoring positions were established, each containing internal and external measurement points. In center columns, one monitoring position was installed at each B1 and B2 level, with dual measurement points per position. For base slabs, three horizontally distributed monitoring sections were arranged, each configured with upper and lower measurement points. Monitoring points were concentrated at the ends and midspans of these structural elements—regions experiencing significant shear forces and bending moments, where deformations and displacements are representative.
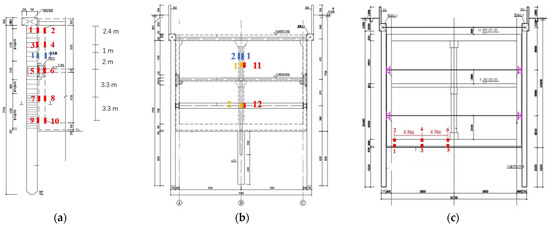
Figure 18.
Layout of FBG sensors: (a) side wall; (b) center column; (c) base plate. Among them, red is the embedded sensor, blue is the temperature sensor, and yellow is the surface sensor.
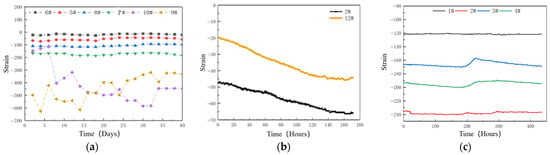
Figure 19.
Monitoring data strain curve: (a) side wall; (b) center column; (c) base plate.

Table 1.
Sensor monitoring data.
- Analysis of Sidewall Sensor Data (Axis 14): Monitoring data from Sensors #5–#10 indicate significant compressive strain throughout the B2 level sidewall structure. Compressive strain increases with depth, peaking at −614.6 με at Sensor #10 over 40 days. Comparing the internal and external sensors at the same level, it can be found that the compressive strain on the formation side is significantly higher than that on the free side, which is caused by the compression of the structure by the formation. Additionally, sensors #5–#8 at higher elevations exhibit minimal strain fluctuations with near-identical values across time intervals. These variations are attributed to ambient temperature changes, though their structural impact is negligible. Conversely, sensors #9–#10 at the base display non-monotonic strain patterns, characterized by alternating increasing and decreasing trends. This behavior results from dynamic construction loads in high-activity zones where personnel, vehicles, and equipment operate, leading to significant measurement deviations and complex deformation responses. Sidewall deformation analysis reveals pronounced distortion near the base versus consistent micro-strain elsewhere. Consequently, structural safety assessments identify the sidewall base as the critical risk zone.
- Column Sensor Analysis (Axis 14): The data from the Axis 14 central column sensor will be analyzed for the monitoring results of the lower sensors 2 # and 12 #. Among them, the sensor on the inner side is 2 #, and the sensor on the outer side is 12 #. The monitoring results show that the middle column structure of the underground second floor of the station is similar to the side walls, with obvious compressive strain overall. In addition, it can be observed that the sensor located on the inner side bears a greater compressive strain, approximately 2.5 times the strain value of the outer sensor, indicating that the compression effect on the inner structure of the central column is more significant. In addition, it should be noted that the compressive strain on both sides of the central column shows a linear increasing trend with time. After 180 h, the strain value of the inner sensor increases to 1.4 times the initial strain, and the strain value of the outer sensor increases to 2 times the initial strain. This is significantly different from the variation pattern of the strain on the Axis 14 side wall over time. The strain at the side wall changes less over time, indicating that the overall settlement in the central column area is significantly greater than that in the side wall area. This suggests that in the width direction of the station, the settlement curve presents a “U” shape, with high on both sides and low in the middle. That is, in the axial direction of the station, the settlement in the central area is significantly greater than that at the end position. In the width direction of the station, the settlement in the central area is significantly greater than that at the end position. The settlement is significantly greater than the positions on both sides.
- Base Slab Monitoring (Axis 14): The monitoring results of the Axis 14 bottom plate sensor show that the overall bottom plate structure of the underground second floor of the station has significant compressive strain. Within 450 h, the average compressive strain value of sensor 1 # was −121.2 με, the average compressive strain value of sensor 2 # was −167.9 με, and the average compressive strain value of sensor 3 # was −193.7 με; The average compressive strain value of sensor 4 # is −235.3 με. As the depth of the sensor increases, the structural strain value shows a linear increase trend, with the strain value at the bottom of the base plate being the highest. Unlike the side wall structure, this is caused by the weight of the bottom plate. In addition, it can be observed that the strain curves of the top 1 # and bottom 4 # have relatively small fluctuations, while the strain curves of the middle 2 # and 3 # have relatively large fluctuations. However, the overall strain of the bottom plate does not change significantly over time, indicating that the overall stability of the station bottom plate is good, and the local deformation is not obvious.
Through analysis of station side walls, base slabs, and central columns, we have identified their deformation characteristics during construction and analyzed the underlying causes. This process has pinpointed key monitoring areas. After operational deployment, in the event of abnormalities, rapid identification and timely feedback can be achieved, thus significantly enhancing the project’s resilience to risk warnings. All monitoring streams are integrated via IoT into the digital twin platform for real-time visualization and risk analytics.
7.4. Platform Application
7.4.1. Data Interoperability
Structural data for underground stations encompass main civil works and ancillary facilities. The platform standardizes main structural information and prefabricated component data for foundational structural management. Construction progress reporting generates daily logs and synchronizes 3D models to visualize completion status [8]. Monitoring data primarily derive from fiber optic sensors measuring hydration heat and concrete shrinkage strain in base slabs, sidewalls, and center columns.
Throughout design, construction, and operation, standardized protocols were established in the database. The capability engine integrates BIM models, structural data, monitoring data, and engineering data for unified management. This facilitates rapid multi-platform and multi-device data access, real-time dynamic updates, and structured data management. Functions include BIM model integration, attribute data access, model updates, monitoring data querying, and progress management (Figure 20).
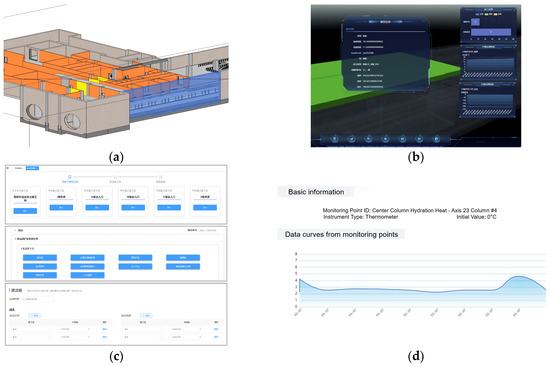
Figure 20.
Platform data interaction interface: (a) component model code information; (b) 3D visualization model information display; (c) filling in information on sub unit projects, construction items, and cast-in-place piles; (d) Hydration heat measurement point data.
7.4.2. Data Integration and Risk Analysis
Structural stress state assessment enables construction safety evaluation and early risk warnings. Big data mining identifies potential risks and non-compliant construction parameters. Automated monitoring data undergo standardization and storage in the database after IoT device integration. Clicking monitored objects in 3D scenes displays real-time data as historical curves (Figure 21).
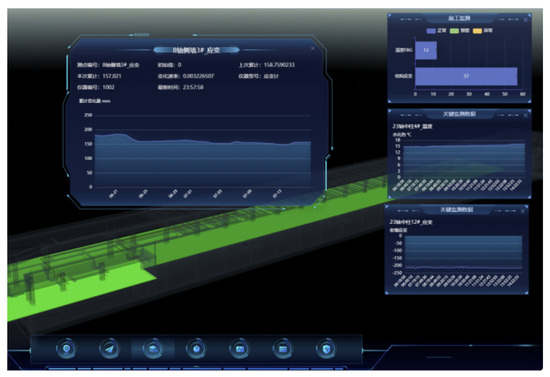
Figure 21.
Data integration and visualization schematic.
Leveraging the IoT base and data processing capabilities, the system automatically identifies early warnings and pushes alerts via dashboard interfaces. External notifications (SMS, email, mobile apps) are also supported. Visualized historical curves and statistical charts interact with 3D objects and link to warning messages (Figure 22).
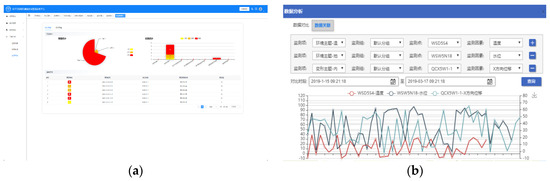
Figure 22.
Risk monitoring management: (a) Warning Information Management Interface; (b) Data association analysis.
The core of the “1+5+N” digital twin platform framework lies in creating a unified digital platform that integrates multi-source data for comprehensive risk visualization. Based on the optical fiber monitoring data illustrated in Figure 19, real-time data analysis of strain in the base slab, side walls, and central columns is conducted within the platform. This enables timely detection of abnormal deformation in key structural nodes of the prefabricated station, facilitating the implementation of emergency measures to control deformation in the main structure of the subway station. The framework aims to aggregate engineering risk data, enabling full-process risk control, joint emergency response, and remote safety monitoring (Figure 23).
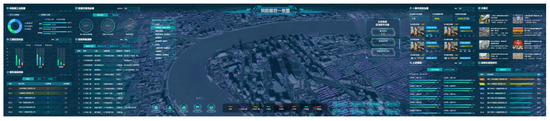
Figure 23.
Platform Risk Management Integration.
8. Discussion
This study adopted prefabricated assembly technology, compared to traditional cast-in-place concrete techniques, it significantly reduces construction time, streamlines processes, and minimizes impacts on surrounding structures. This study achieves approximately 80% labor reduction and 65% carbon emission reduction versus conventional methods.
The SERIC-IoT digital twin system developed in this research integrates BIM and IoT technologies, overcoming limitations of single-technology approaches. It features unified data formats and bidirectional synchronization: real-time field data and modifications update the BIM model to maintain fidelity, while BIM information guides on-site construction and operations, establishing a closed-loop feedback mechanism.
This study also establishes a full lifecycle component quality monitoring system. In production phase, embedded temperature and humidity sensors in concrete specimens track curing conditions, strain gauges monitor shrinkage or prestress changes.
In transportation phase, GPS locators on vehicles capture trajectories, accelerometers record vibrations to assess potential damage.
In construction phase, laser rangefinders, total stations, and UWB positioning devices collect component coordinates during hoisting; AR-enabled QR code scanning verifies installation accuracy against design specifications.
In operation phase, Stress and strain sensors, crack detectors, and environmental monitors continuously track structural health. This IoT framework generates empirical data at critical lifecycle stages, enabling evidence-based quality tracking.
However, limitations persist in sensor coverage density and analytical sophistication, necessitating further research enhancements.
9. Conclusions
This study proposes an overall architecture for a digital twin platform of prefabricated assembled superimposed stations based on the concept of digital twins. It establishes a full lifecycle data management technology for prefabricated components using digital twin technology. By integrating BIM models, engineering data, and IoT data, the platform analyzes multi-source data through built-in algorithms to achieve objectives such as construction progress tracking, structural safety monitoring, and quality management control. The research outcomes were applied in the underground prefabricated assembled superimposed station of Jinan Urban Rail Transit Line 8 Phase I. Building on one framework, five platform modules were refined through preliminary preparations including deploying fiber optic sensors and designing the station’s digital twin solution. With the support of N components, the platform realized data interoperability, data mining and analysis, and risk integration.
The platform’s capabilities were validated through its implementation in the Jinan Line 8 project, providing digital enablement for construction, facility operation, maintenance, and safety management of prefabricated assembled superimposed stations.
However, this study has limitations:
- Due to cost constraints of equipment such as fiber optic sensors, monitoring points remain limited, capturing data only from critical nodes rather than forming a comprehensive digital twin system for all components.
- While dynamic monitoring and data visualization were achieved, data analysis and processing remain relatively simplistic, relying heavily on manual interpretation to detect anomalies. This introduces delays in data responsiveness. In future studies, following the approach of Zhao [28], AI algorithms can be embedded into digital twin platforms. By leveraging machine learning to rapidly analyze data, abnormal conditions can be identified, enabling dynamic engineering information management throughout the entire life cycle of design, construction, and operation.
- Insufficient access to real-time operational data within stations necessitates future research incorporating passenger flow early-warning scenarios. This can be achieved by analyzing trend indicators, such as passenger flow density, queue lengths at station entrances and exits, security check areas, fare gates, escalators, and platforms, which assess congestion levels in passenger gathering and dispersal areas. Such analysis supports optimized train operations and passenger flow management, ultimately enhancing travel efficiency.
Author Contributions
Conceptualization, L.L., J.L., Y.L. and Q.X.; methodology, L.L., J.L., B.H. and Q.X.; software, J.L., B.H. and Y.G.; validation, B.H. and Y.G.; resources, L.L.; data curation, Y.G.; writing—original draft preparation, L.L., Y.L. and G.H.; writing—review and editing, Y.L. and G.H.; supervision, Y.L. and G.H.; project administration, Y.L.; funding acquisition, L.L. and Q.X. All authors have read and agreed to the published version of the manuscript.
Funding
This research was funded by Key R&D Program of Shandong Province, China (2021CXGC011203) and the Shandong Province Housing and Urban Rural Construction Science and Technology Plan (2019-K7-12).
Data Availability Statement
The original contributions presented in this study are included in the article. Further inquiries can be directed to the corresponding author.
Conflicts of Interest
Authors Linhai Lu, Jiahai Liu, Bingbing Hu and Yingqi Gao were employed by the company Jinan Transportation Development Investment Co., Ltd. The remaining authors declare that the research was conducted in the absence of any commercial or financial relationships that could be construed as a potential conflict of interest.
References
- Oyekan, J.; Hutabarat, W.; Turner, C.; Tiwari, A.; He, H.; Gompelman, R. A knowledge-based cognitive architecture supported by machine learning algorithms for interpretable monitoring of large-scale satellite networks. Sensors 2021, 21, 4267. [Google Scholar] [CrossRef]
- Valinejadshoubi, M.; Bagchi, A.; Moselhi, O. Managing structural health monitoring data using building information modeling. Suppl. J. Civ. Environ. Eng. 2016, 6 (Suppl. S5). [Google Scholar] [CrossRef]
- Tang, S.; Shelden, D.R.; Eastman, C.M.; Pishdad-Bozorgi, P.; Gao, X. A review of building information modeling (BIM) and the internet of things (IoT) devices integration: Present status and future trends. Autom. Constr. 2019, 101, 127–139. [Google Scholar] [CrossRef]
- Valinejadshoubi, M.; Moselhi, O.; Iordanova, I.; Valdivieso, F. Automated system for high-accuracy quantity takeoff using BIM. Autom. Constr. 2024, 157, 105155. [Google Scholar] [CrossRef]
- Li, K. The Application Study of BIM Technology in the Structure Design of Subway Station. J. Railw. Eng. Soc. 2015, 32, 103–108. [Google Scholar]
- Cui, F. Metro Area Safety Monitoring System Design Based on Internet of Things. Comput. Meas. Control 2018, 26, 165–167+172. [Google Scholar]
- Nguyen, D.C.; Nguyen, T.Q.; Jin, R.; Jeon, C.H.; Shim, C.S. BIM-based mixed-reality application for bridge inspection and maintenance. Constr. Innov. 2022, 22, 487–503. [Google Scholar] [CrossRef]
- Liu, J.; Xiao, W.; Wei, J.; Wang, K. Study on Automatic Assembly Technology of Structural Plate Components of Prefabricated Underground Buildings. J. Munic. Technol. 2022, 40, 1–5+65. [Google Scholar]
- Wang, Z. BIM Technology in Construction Schedule Control of Prefabricated Subway Station. J. BEE 2021, 49, 140–144. [Google Scholar]
- Santucci, G. From internet to data to internet of things. In Proceedings of the International Conference on Future Trends of the Internet, Luxembourg, 17 November 2009. [Google Scholar]
- Arslan, V.; Ulubeyli, S.; Kazaz, A. The use of internet of things in the construction industry. In UEMK 2019 Proceedings Book; Gaziantep University: Gaziantep, Turkey, 2019; Volume 24, p. 25. [Google Scholar]
- Zhou, C.; Ding, L.Y. Safety barrier warning system for underground construction sites using Internet-of-Things technologies. Autom. Constr. 2017, 83, 372–389. [Google Scholar] [CrossRef]
- Louis, J.; Dunston, P.S. Integrating IoT into operational workflows for real-time and automated decision-making in repetitive construction operations. Autom. Constr. 2018, 94, 317–327. [Google Scholar] [CrossRef]
- Shao, H.; Fang, Y.; Lu, Y. The application and research of multi-source heterogeneous BIM big data integration technology in Hezong highway project. J. Inf. Technol. Civ. Eng. Archit. 2021, 13, 132–136. [Google Scholar]
- Zhang, Y.Y.; Lin, J.R.; Zhang, J.P. Present and future of integrated applications of BIM, cloud computing, big data and internet of things. J. Graph. 2018, 39, 806–816. [Google Scholar]
- Mesároš, P.; Mandičák, T.; Behúnová, A. Use of BIM technology and impact on productivity in construction project management. Wirel. Netw. 2022, 28, 855–862. [Google Scholar] [CrossRef]
- Tao, F.; Zhang, H.; Zhang, C. Advancements and challenges of digital twins in industry. Nat. Comput. Sci. 2024, 4, 169–177. [Google Scholar] [CrossRef]
- Tao, F.; Xiao, B.; Qi, Q.; Cheng, J.; Ji, P. Digital twin modeling. J. Manuf. Syst. 2022, 64, 372–389. [Google Scholar] [CrossRef]
- Edington, L.; Dervilis, N.; Wagg, D. A time-evolving digital twin tool for engineering dynamics applications. Mech. Syst. Signal Process. 2023, 188, 109971. [Google Scholar] [CrossRef]
- Torzoni, M.; Tezzele, M.; Mariani, S.; Manzoni, A.; Willcox, K.E. A digital twin framework for civil engineering structures. Comput. Methods Appl. Mech. Eng. 2024, 418, 116584. [Google Scholar] [CrossRef]
- Pregnolato, M.; Gunner, S.; Voyagaki, E.; De Risi, R.; Carhart, N.; Gavriel, G.; Tully, P.; Tryfonas, T.; Macdonald, J.; Taylor, C. Towards Civil Engineering 4.0: Concept, workflow and application of Digital Twins for existing infrastructure. Autom. Constr. 2022, 141, 104421. [Google Scholar] [CrossRef]
- Li, T.; Rui, Y.; Zhao, S.; Zhang, Y.; Zhu, H. A quantitative digital twin maturity model for underground infrastructure based on D-ANP. Tunn. Undergr. Space Technol. 2024, 146, 105612. [Google Scholar] [CrossRef]
- Zhu, M.; Sun, X.; Chen, X.; Cui, H.Z.; Li, A.D.; Ding, Z.K. Green, efficient, and intelligent construction of underground metro station. Tunn. Constr. 2021, 41, 2037–2047. [Google Scholar]
- Zhang, K.; Wu, H.; Lin, M. Research Status and Development Trends of Prefabricated Pile Monitoring Systems. Digit. Technol. Appl. 2024, 42, 207–209. [Google Scholar]
- Ding, H.; Liao, J. Design and Research of Tunnel Engineering Information Platform Based on BIM Technology. Tunn. Constr. 2019, 39, 60–68. [Google Scholar]
- Feng, S.; Li, D.; Cao, J. Design of Brain System for Intelligent High-Speed Railway Station based on Digital Twin. Railw. Transp. Econ. 2020, 42, 87–92. [Google Scholar]
- Semeraro, C.; Lezoche, M.; Panetto, H.; Dassisti, M. Digital twin paradigm: A systematic literature review. Comput. Ind. 2021, 130, 103469. [Google Scholar] [CrossRef]
- Zhao, Z.; Liu, Y.; Lu, Y.; Ji, C.; Lin, C.; Yao, L.; Pu, Z.; de Brito, J. Prediction of properties of recycled aggregate concrete using machine learning models: A critical review. J. Build. Eng. 2024, 90, 109516. [Google Scholar] [CrossRef]


Disclaimer/Publisher’s Note: The statements, opinions and data contained in all publications are solely those of the individual author(s) and contributor(s) and not of MDPI and/or the editor(s). MDPI and/or the editor(s) disclaim responsibility for any injury to people or property resulting from any ideas, methods, instructions or products referred to in the content. |
© 2025 by the authors. Licensee MDPI, Basel, Switzerland. This article is an open access article distributed under the terms and conditions of the Creative Commons Attribution (CC BY) license (https://creativecommons.org/licenses/by/4.0/).