Article

Seismic Failure Assessment Using Energy Outputs of Finite Element Analysis: A Strategy for Complex Heritage Masonry Structures Modeled with Concrete Damaged Plasticity Material

1
Department of Mechanical Engineering, Hajim School of Engineering and Applied Sciences, University of Rochester, Rochester, NY 14627, USA
2
Department of Mechanical Engineering, Faculty of Engineering, Bilecik Şeyh Edebali Üniversitesi, Bilecik 11230, Türkiye
3
Department of Architecture, Built Environment, and Construction Engineering (ABC), Politecnico di Milano, 20133 Milano, Italy
*
Author to whom correspondence should be addressed.
Buildings 2025, 15(3), 318; https://doi.org/10.3390/buildings15030318
Submission received: 29 November 2024 / Revised: 20 December 2024 / Accepted: 27 December 2024 / Published: 22 January 2025
(This article belongs to the Special Issue Selected Papers from the REHABEND 2024 Congress)

Abstract

:
The structural assessment of masonry construction often requires the use of nonlinear 2D and 3D finite element analysis. This work describes a strategy for using energy outputs from such analyses to accurately assess failure conditions precipitated by increasing lateral load. The methodology relies on the analogy between plastic strains and fracture that is inherent to the concrete damaged plasticity (CDP) macro-model used to represent the quasi-brittle behavior of masonry material. At critical conditions, energy imparted to a structure by loading can no longer be completely stored as elastic strain energy and must be dissipated. This occurs with fractures in masonry, which are represented with plastic strains when using CDP material. The development of plastic dissipation energy can therefore be used as a measure for understanding the progressive collapse of a structure, as we illustrate with the following three case studies analyzed using Abaqus/CAE Explicit: the massive earthen pyramid at Huaca de la Luna (Trujillo, Peru), the Roman pozzolanic concrete vault of Diocletian’s Frigidarium (Rome, Italy), and the mixed-material triumphal arch of the San Pedro Apóstol Church of Andahuaylillas (Peru). The method is verified by other measures of failure and has particular applicability for seismic analysis of complex masonry and earthen structures.

1. Introduction and Objectives

Historic monuments have often survived years of renovation, repurposing, additions, and subtractions, to say nothing of the irregularities in material and form that many of these monuments were originally built with. For heritage buildings, non-standard is the standard. Code-based analyses of structural integrity have been implemented and even specialized for the assessment of historic monuments [1,2]. However, as these and other authors note, there are instances when common practices are not ideal. To assess such unique structures and to recommend appropriate interventions for their preservation requires analytical creativity. This work summarizes a strategy that utilizes energy outputs from explicit nonlinear finite element (FE) models to assess the time evolution of failure in a way that is compatible with modeling the mechanical peculiarities of heritage structures.
Unique circumstances may arise due to the scale and complexity of a monument. Analyses that track nodal displacements require a representative node. For relatively simple small structures, there may be an obvious choice, e.g., the apex of a gabled roof or cupola at the top of a dome [3,4]. However, such a choice becomes more difficult (or multiple curves are required, see [4]) when the structure includes, perhaps, multiple gabled roofs, or is sufficiently large that the failure of one gable or dome is not indicative of the failure condition of the rest of the structure. Additionally, tracking failure by monitoring variations in the supporting reactions may become challenging or even numerically unfeasible for a large or irregular massive structure. Non-standardized materials produce additional challenges. The extremely nonlinear behavior of brittle materials produces complex models that require careful analysis. To efficiently model masonry bricks and blocks, macro-models that reduce the material and its morphology to a continuum can be adopted [5,6,7,8,9].
We highlight the following three critical open issues related to loading, limit states, and numerical convergence for seismic analyses of built heritage structures that are addressed in the present work:
  • In the context of the so-called “displacement-based design”, predicting the displacement that a structure can reach at limit state conditions is fundamental. The substantial inability of finite element models conceived in the static field to accurately predict the ultimate displacements for historical buildings is well documented in the literature [10,11,12,13]. The Italian guidelines for cultural heritage (probably the most advanced for numerical analysis of monumental structures), address this limitation by suggesting nonlinear static analyses—in the absence of a clear drop in the load-bearing capacity and for materials unable to withstand tensile stresses—up to “relevant displacements” of the pushover curve (§ 5.2.4 [14]). Thus, a quantitative measure of failure is missing.
  • Nonlinear static analyses often exhibit a lack of convergence for applied loads far from the collapse limit state and/or premature halting. These issues can be solved by using dynamic analyses in which the equations of motion are solved at each load step by means of well-known integration schemes that do not require sub-iterations based on return mapping procedures. This easily justifies the potentially high cost of using the explicit formulation adopted here instead of a standard formulation.
  • Relative distributions of inertial forces acting on a structure are often based on modal superposition and are imposed a priori. For a nonlinear static analysis, the hypothesis of a linear elastic material for masonry is used for these calculations, but it is unrealistic, especially when masonry is subjected to progressively increasing horizontal accelerations. Such an assumption, already questionable at the beginning of the analyses for monumental historic masonry buildings (which are often damaged by previous seismic events and may exhibit pre-existing states of cracking that occurred over a long period of time, for example induced by foundation settlements) would require adaptive procedures, as for instance adaptive pushover analyses, which are typically carried out in a static fashion. Indeed, with the progressive application of the horizontal loads, crack spreads and damage patterns tend to evolve, with the progressive shift of the period of the structure towards the right portion of the spectrum. The presence of evolving crack patterns changes the natural frequencies and the corresponding participating mass, and potentially invalidates the originally determined force distributions.
In the present work, we address these issues by proposing a methodology that is compatible with dynamic loading and explicit analysis, which removes the need to calculate modal participation factors for pushover loads altogether. The methodology relies on the analogy between plastic strains and fracture that is inherent to the concrete damaged plasticity (CDP) macro-model that is commonly used to represent the quasi-brittle behavior of heritage structures’ masonry material [5,6,7,8,9,15,16,17,18,19,20,21,22,23]. At critical conditions, energy imparted to a structure by loading can no longer be completely stored as elastic strain energy and must be dissipated. This occurs with fractures in masonry, which are represented with plastic strains when using CDP material. The concepts are initially illustrated with the static pushover analysis of a 3D wall, followed by a dynamic 2D in-plane analysis of a panel loaded by acceleration applied at the base, and finally three different walls loaded with applied displacement. The examples are used to explain the assessment steps and for comparisons with other measures of stability.
The second half of this paper demonstrates the utility of the methodology when applied to case studies of varying complexity, with each case illustrating issues of irregularity in archaeological and historical architecture discussed above. The first case study is an analysis of Huaca de la Luna’s main pyramid, a monument of massive scale and extremely brittle adobe material, which was constructed and reconstructed over a period of six centuries with an unintuitive system of adobe brick piers [24]; second, the Frigidarium of Diocletian, a gigantic Imperial Roman concrete vaulted structure [25]; and third, the triumphal arch of the Church of San Pedro Apóstal in Andahuaylillas, an Andean Spanish church of mixed adobe, stone, and brick material [26]. Through these analyses, we show that the benefits of this methodology are that (a) the evolution of collapse can be monitored from initiation to total failure and (b) the method is well suited to modeling failure under seismic action as the result of inertial forces excited by acceleration applied to the base of the structure.

2. Materials and Methods

In nonlinear FE models characterized by CDP formulation, the interpretation of energy results to determine structural failure offers a rational and verifiable strategy both to numerically determine lateral capacity and to evaluate the enucleation of local damage to structural failure. The underlying postulate is that the structural failure of masonry constructions modeled as a continuum can be defined as a transition from stable to unstable equilibrium via fracture into disconnected parts. This leads to a sudden variation in support reactions. In a nonlinear dynamic FE formulation, this transition can also be detected from the time evolution of elastic strain energy (SE), plastic dissipation energy (PD) due to fracture propagation, and kinetic energy (KE) arising from disconnected parts moving away from each other.
The concrete damaged plasticity (CDP) formulation for material is an isotropic continuum material model [27,28,29]. It assumes a homogenous layout of masonry components and allows separate definition of tensile and compressive behavior. The formulation uses plasticity to represent fractures, and we highlight the analogy between plastic strains and fracture given by Lubliner et al. as “plastic strain may be identified with any and all inelastic strain, including cracking strain” [28]. The direct analogy between plastic strains and fracture means that the growth of plastic strains implies propagation of fractures. Therefore, plastic dissipation energy (PD), which describes energy dissipated through plastic deformation, can serve as a proxy measure for fracture growth. Sharp asymptotic behavior occurs after a structure can no longer dissipate enough energy from loading via small or slow-propagating cracks, and the structure loses equilibrium and separates into parts. Thus, in the limit state, for disconnected parts to move independently, plastic strains—and with them plastic dissipation energy—must grow asymptotically.
Under static loading conditions, failure detected from the asymptotic growth of PD is also reflected in the growth of kinetic energy (KE). When the structure separates into parts at failure, each of the disconnected elements move with increasing velocity under the applied loads, and KE, defined by the velocity of a mass in motion, must increase. Although negligible during the phase of stability of the simulation, KE begins to manifest itself as portions begin to accelerate independently of the whole. Ultimately, KE grows asymptotically, inevitably intersecting the elastic strain energy (SE) curve.
Structural failure also affects the evolution of elastic strain energy, since elastic strains will actually decrease during fracture growth. Thus, when approaching failure conditions, SE will sharply decrease in the presence of total failure or continue to grow at a lower rate for a failure involving only a portion of the structure. Under the stated conditions, SE will never exhibit the same asymptotic behavior as either PD or KE; thus, the two curves can be expected to intersect in close proximity to failure. This intersection point can be taken as a logical point of measure for failure.
This methodology for determining lateral capacity, and the measures used for its validation, are discussed below in the analysis of simple masonry walls under (1) static pushover loading, (2) dynamic loading via ground acceleration, and (3) static displacement loading. The first two cases are analyzed in Abaqus/CAE Explicit, while the third is formulated in Abaqus/CAE Standard for purposes of comparison with original published results. All masonry examples and case studies are represented by CDP material, a necessary prerequisite to using the presented methodology.

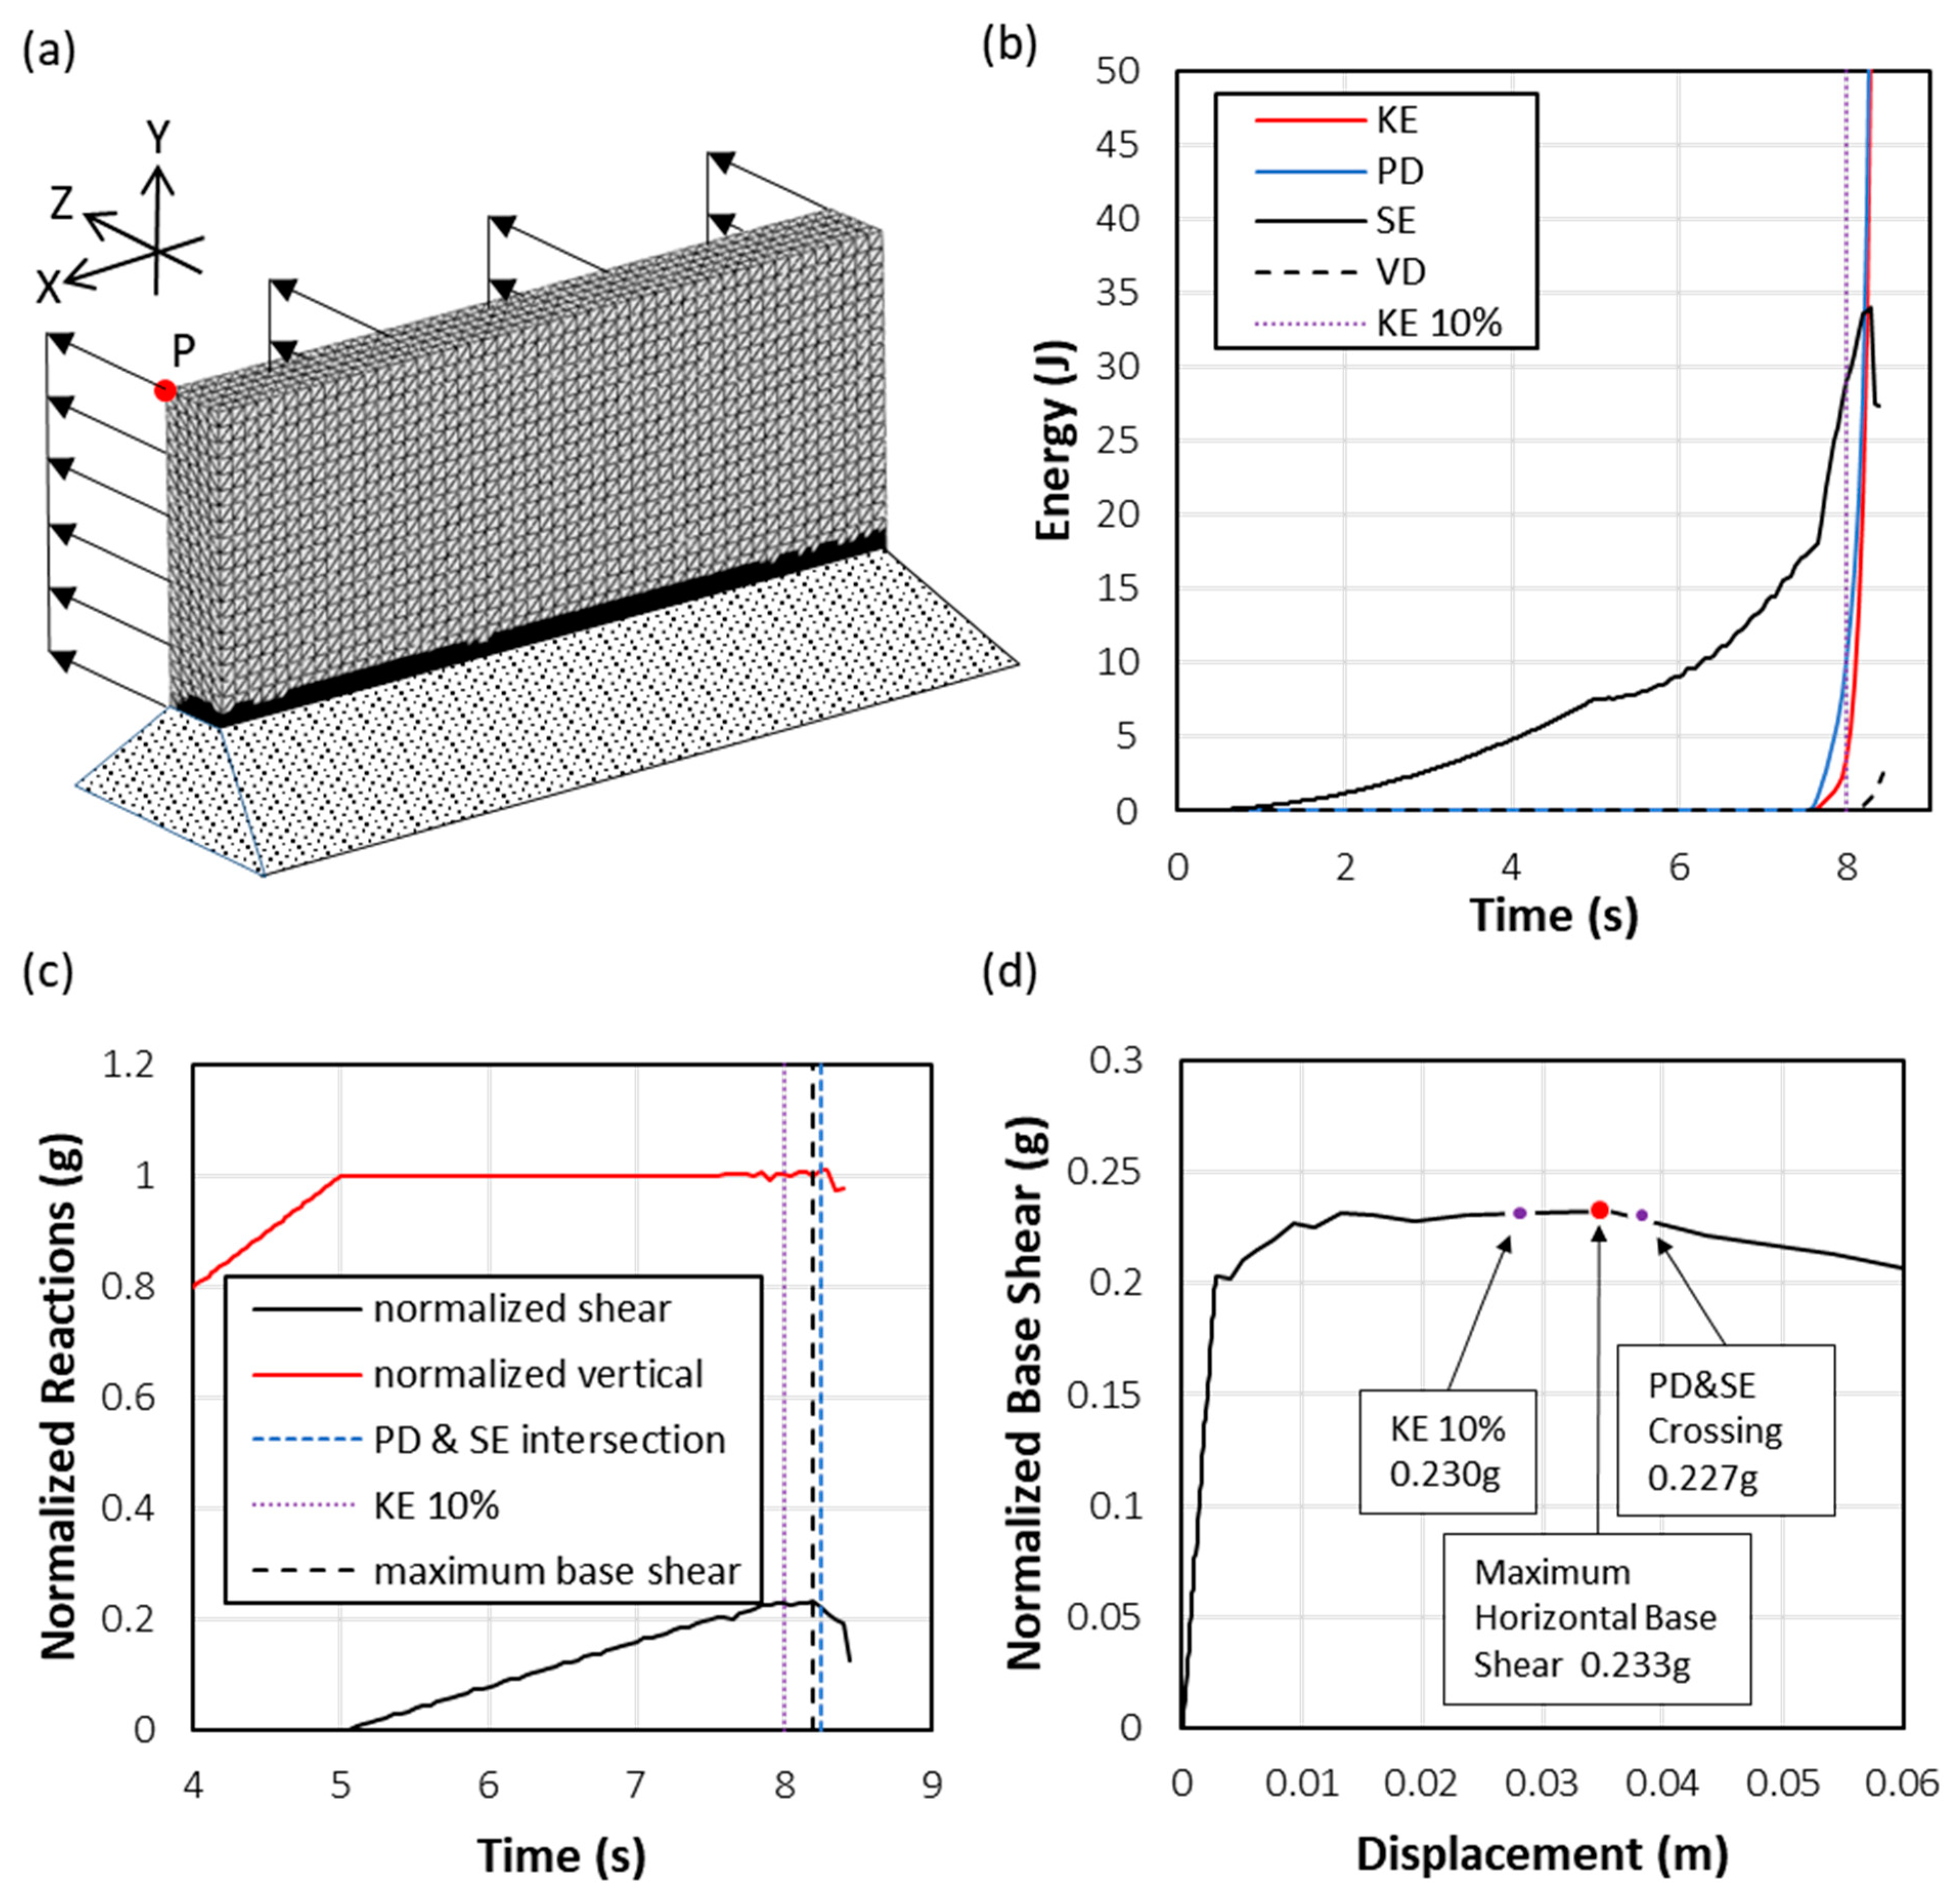
2.1. Validation with a 3D Static Pushover Test

Pushover analysis is a well-established approach for assessing the lateral capacity of a structure subjected to a monotonically increasing lateral load pattern [30,31]. Loads can be implemented as a lateral displacement or force distribution acting on one side of the structure or by directly applying horizontal acceleration to the entire mass. We illustrate the applicability of our methodology to the pushover analysis by considering an unreinforced adobe wall with dimensions 10 m × 2 m × 0.5 m, subjected to a uniform horizontal acceleration field normal to the plane of the wall. Figure 1a shows the half model, where a vertical symmetry plane is used to reduce the cost of the analysis. The mesh is illustrated in Figure 1a and described in Table 1. The extremely brittle adobe material of the structure is modeled with CDP material, which has the input parameters given in Table 2 and Figure 2. The wall is free standing and fully constrained at the bottom to a rigid surface.
The analysis is performed in Abaqus/CAE Explicit in the following two steps: full gravitational loading is applied first, followed by a uniform monotonically increasing lateral acceleration acting over the entire mass of the wall in the +Z direction. Quasi-static conditions are enforced by adopting long time intervals for the application of both gravitation and lateral accelerations as follows: 5 s for gravitation to increase linearly from 0 to 1 g, followed by 10 s of lateral acceleration increasing linearly from 0 to 0.8 g.
As shown in Figure 1b, the structural response of the wall is accurately represented by the time evolution of elastic strain energy (SE), kinetic energy (KE), and plastic dissipation energy (PD). During gravitational loading, the response remains purely static. No significant KE is developed during gravitation loading, such that SE is the only energy present at total gravitational load. Thereafter, the response continues to be static under increasing lateral acceleration until the structural integrity is compromised and the wall collapses. The development of fracture damage at the base of the wall corresponds to the growth of PD after 7 s. The subsequent appearance of KE marks the beginning of the separation of the wall from its base. This is closely followed by structural collapse, characterized by the sudden transition from a quasi-static to a fully dynamic state as indicated by the asymptotic growth of KE. The energy released, PD, follows an identical asymptotic growth pattern, while SE immediately decreases, having reached a peak at collapse. Viscous dissipation energy (VD) produced by the artificial viscosity parameter used in Abaqus/CAE Explicit to dampen possible oscillatory behavior remains negligible until failure.
Figure 1c shows the concomitant time evolution of the horizontal and vertical reactions normalized by the weight of the wall and expressed as fractions of g. In the first five seconds, only the gravitational load is applied and, thus, only a vertical reaction develops. Thereafter, as a result of the lateral acceleration applied to the mass, an equilibrating horizontal reaction (base shear) develops at the constrained boundary. While the vertical reactions hold constant, the base shear increases monotonically versus time. At structural failure, both reactions show a sudden decrease, indicating that the structure has lost the capability of resisting the lateral load and, in this case, the mass of the wall has nearly separated from its base. As expected, failure occurs by outward rotation about the base of the wall. The fracture pattern at failure—represented in the CDP formulation as plastic strains—is denoted by black zones that appear at the base of the wall in Figure 1a.
Examination of the energy and reaction plots in Figure 1b,c suggests complementary ways to associate a specific time interval to failure. KE begins to develop at 7.5 s, reaches 10% of SE at 8 s, and finally becomes asymptotic at 8.2 s. The PD curve, which can be taken to represent the work necessary to propagate the fractures at the base of the wall, begins to appear at 7.5 s and crosses the SE curve at 8.2 s. Thus, based purely on energy considerations, total failure (structural collapse) can be reasonably defined to happen between t = 7.5 s (when the structural response cannot anymore be regarded as static) and t = 8.2 s (when PD intersects SE).
Finally, the capacity curve of the wall under lateral acceleration (Figure 1d) can be used to illustrate the close relationship in structural capacity identified from the energy-based approach and from taking the maximum of the capacity curve, commonly used as a point of comparison [18,33,34,35,36,37,38,39]. In the present case, the curve is constructed by plotting the normalized base shear against the horizontal displacement of point P in Figure 1a. By convention, the lateral capacity is determined by the maximum base shear, in this case 0.233 g, whereas the KE 10% criterion and the PD/SE intersection give a lateral capacity of 0.230 g and 0.227 g, respectively. Of relevance, the energy-based approaches predict more conservative values, which remain within 3% of the value-defined maximum shear.

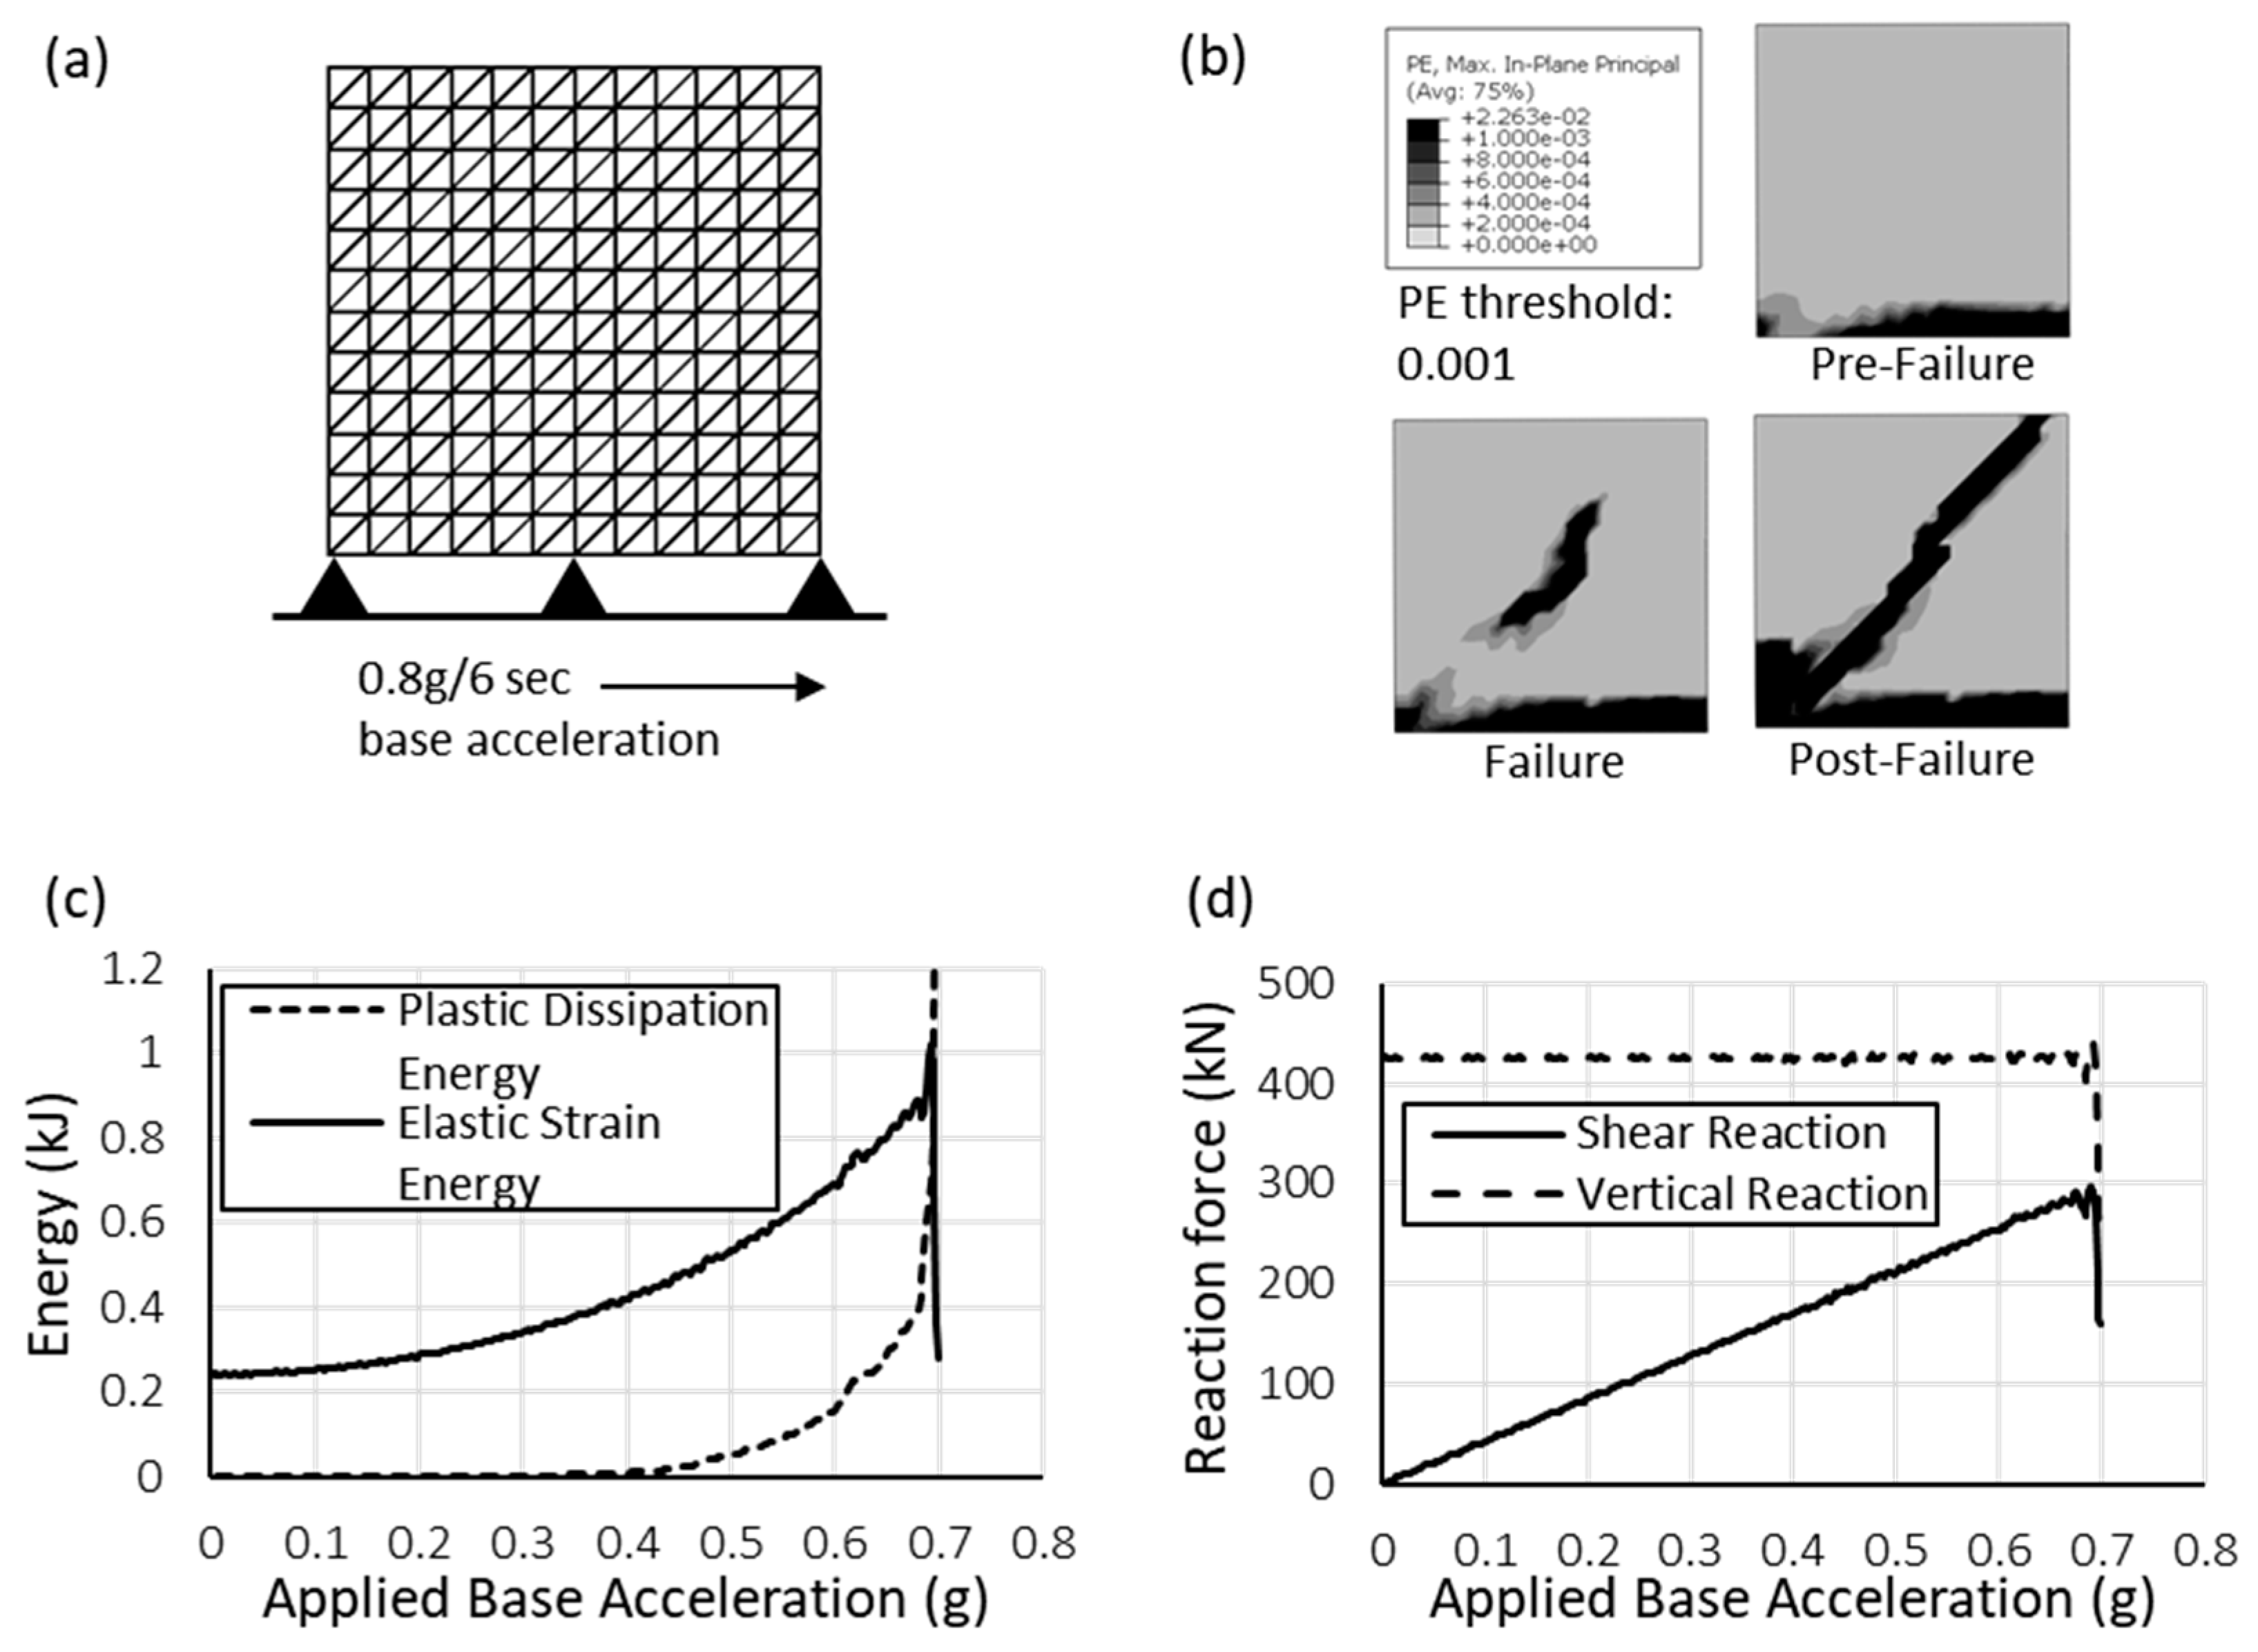
2.2. Validation with a Dynamic Ground Acceleration Test

Using a simple 5 m × 5 m plane stress adobe wall (Figure 3), we now illustrate the application of the methodology to a model undergoing applied ground acceleration. In Figure 3a, the basic model and its regular mesh are presented. Table 3 lists relevant mesh properties, and Table 2 and Figure 2 list the CDP parameters used to define the material. After being subjected to gravitational loading for 4 s, linearly increasing acceleration is applied to the base of the model from 0 to 0.8 g over 6 s of simulation time. Figure 3b shows the development of fractures via plastic strain visualizations at the time steps just before, during, and just after the identified failure, defined by the energy results in Figure 3c and reaction forces in Figure 3d. Note that Figure 3c,d independently identify 0.69 g as the lateral capacity.
In Figure 3c, energy curves from the model slowly increase before intersecting at 0.69 g applied base acceleration. During the course of loading, SE increases. For much of this time, PD remains low, and the structure can accommodate the load with little to no fracture. However, the increasing base acceleration and the opposing inertial force of the wall produce a tensile stress concentration at the lower right side, where a crack begins to propagate (Figure 3b). As it propagates, the contact surface at the base of the model is reduced and compressive loads at the lower left corner exceed their elastic range. The initiation of a diagonal shear plane weakens the model’s integrity further.
The initiation and development of the separation, crushing, and shearing zones within the monument dissipate energy from loading via fracture, which manifests as PD in the CDP material model. As fracture zones develop, the level of PD visibly increases, as seen in Figure 3c. In larger models, the changing rate of increase of PD is particularly valuable and it can be correlated with plastic strain visualizations to identify partial failures (see Section 3.1). We note that fractures in weakened zones of the model propagate rapidly as increasing acceleration is applied, together producing asymptotic growth of PD and the failure identified at 0.69 g.
This failure is verified in Figure 3d, where linearly increasing base acceleration produces linearly increasing shear force until 0.69 g, at which point the reaction suddenly drops off. The vertical reaction remains constant until then, at which point it too drops. As discussed above, the separation of the model along the shear plane visible in Figure 3b produces an unstable condition in which the reactions at the base can no longer equilibrate all portions of the model. This marks the transition from stable equilibrium to a failure condition.
For this model, KE cannot be used to evaluate failure due to the load application at the base. Unlike the pushover analysis, the applied base acceleration load induces failure that is the result of the structure’s inertial and thus dynamic response, which is non-uniform. The relative kinetic energy immediately starts to rise with the application of acceleration, and continues to do so, since the magnitude linearly increases over the course of the simulation. KE reaches a point of asymptotic growth that is related to the increasing applied load before failure is reached, and so is not useful for this load case.

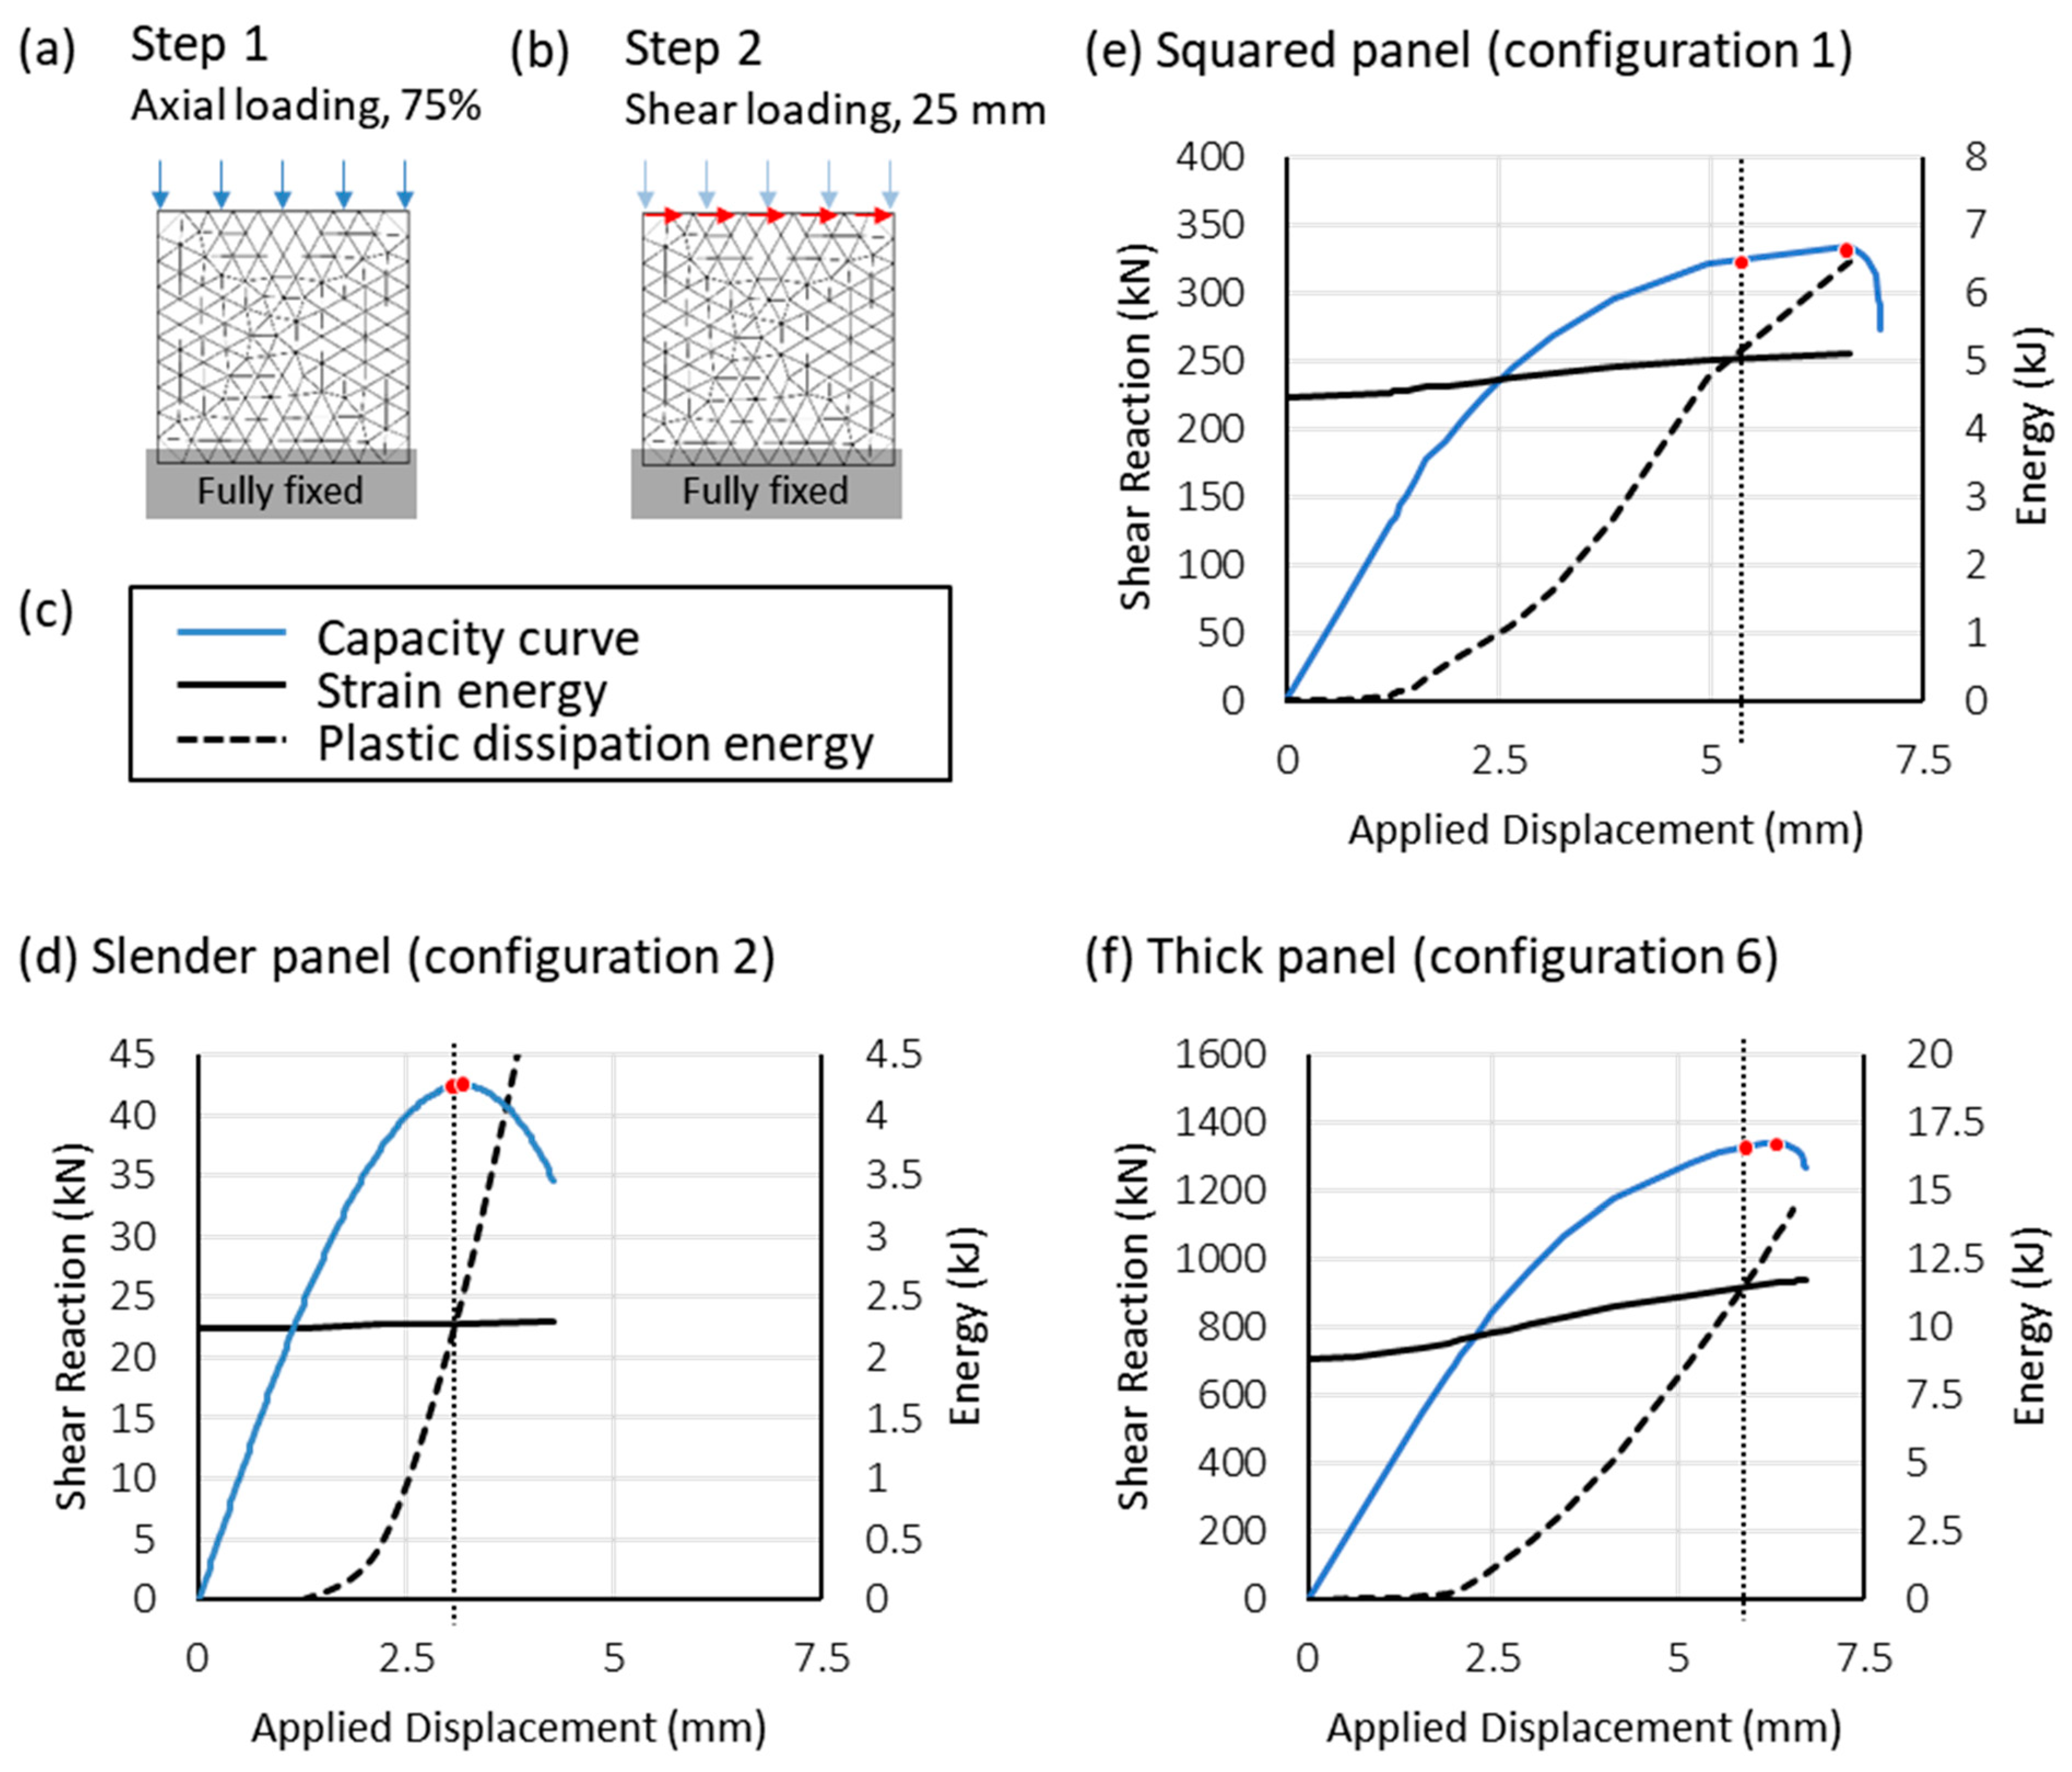
2.3. Validation with an Axial Loading and Shear Displacement Test

The methodology presented here identifies critical applied loads that correlate with measures of critical load presented elsewhere. For this example of a shear displacement test, we recreate three simple panels that are originally described in detail for the purposes of a material calibration study [33]. Our use of these models is entirely based on the detailed description of geometry and material that gives us the ability to recreate the simple models and related capacity curves. By following the given example, we verify that our numerical results for applied displacement versus shear reaction match the published results. Then, we correlate the maximum capacity defined by applied displacement versus shear reaction curves, in blue, with that defined by the energy method, in black (Figure 4).
We closely follow the descriptions of geometry, material, mesh, and loading given in [33], repeating the most fundamental information here for clarity. The analyses consider three configurations defined with the following geometries (B × H × t):
A square panel, 2.5 m × 2.5 m × 0.5 m;
A slender panel, 1.25 m × 2.5 m × 0.5 m;
A thick panel, 5 m × 2.5 m × 0.5 m.
The geometries are discretized into 4-node linear tetrahedral elements of approximately 0.25 m size, and their material is an isotropic plastic-damaging 3D continuum with numerical inputs for the definition of masonry given in ([33], Table 5). We summarize the mesh and material properties for clarity in Table 4 and Table 5, respectively.
This model is analyzed with a fully constrained boundary condition at the base and loading is performed in two steps. We illustrate the given loading conditions in Figure 4a,b. The first step, axial loading, is a pressure defined as 75% of the given compressive strength of the material; the second step maintains axial pressure and applies a linearly increasing displacement of 25 mm along the top of the panel.
The capacity curves presented in Figure 4d–f are obtained from our static analysis, performed in Abaqus/CAE 2022. These capacity curve results match the published data for models undergoing a 75% axial load ratio (see [33], Figures 11, 12 and 18, and the maximum shear of each capacity curve is shown to fall on the flexural and shear failure curves defined in [33], Figure 11).
Furthermore, the critical shear loads obtained from the capacity curves correspond within 5% to the critical shear load obtained from the intersection of SE and PD curves (Figure 4d–f). A thin black dotted line links the energy intersection point with the shear reaction at that instant, noted with a red dot. The absolute maximum of the blue capacity curve is also noted with a red dot. Notably, the critical shear load defined by the energy outputs is slightly more conservative than the capacity curve maximum, for all three configurations.

3. Application Cases

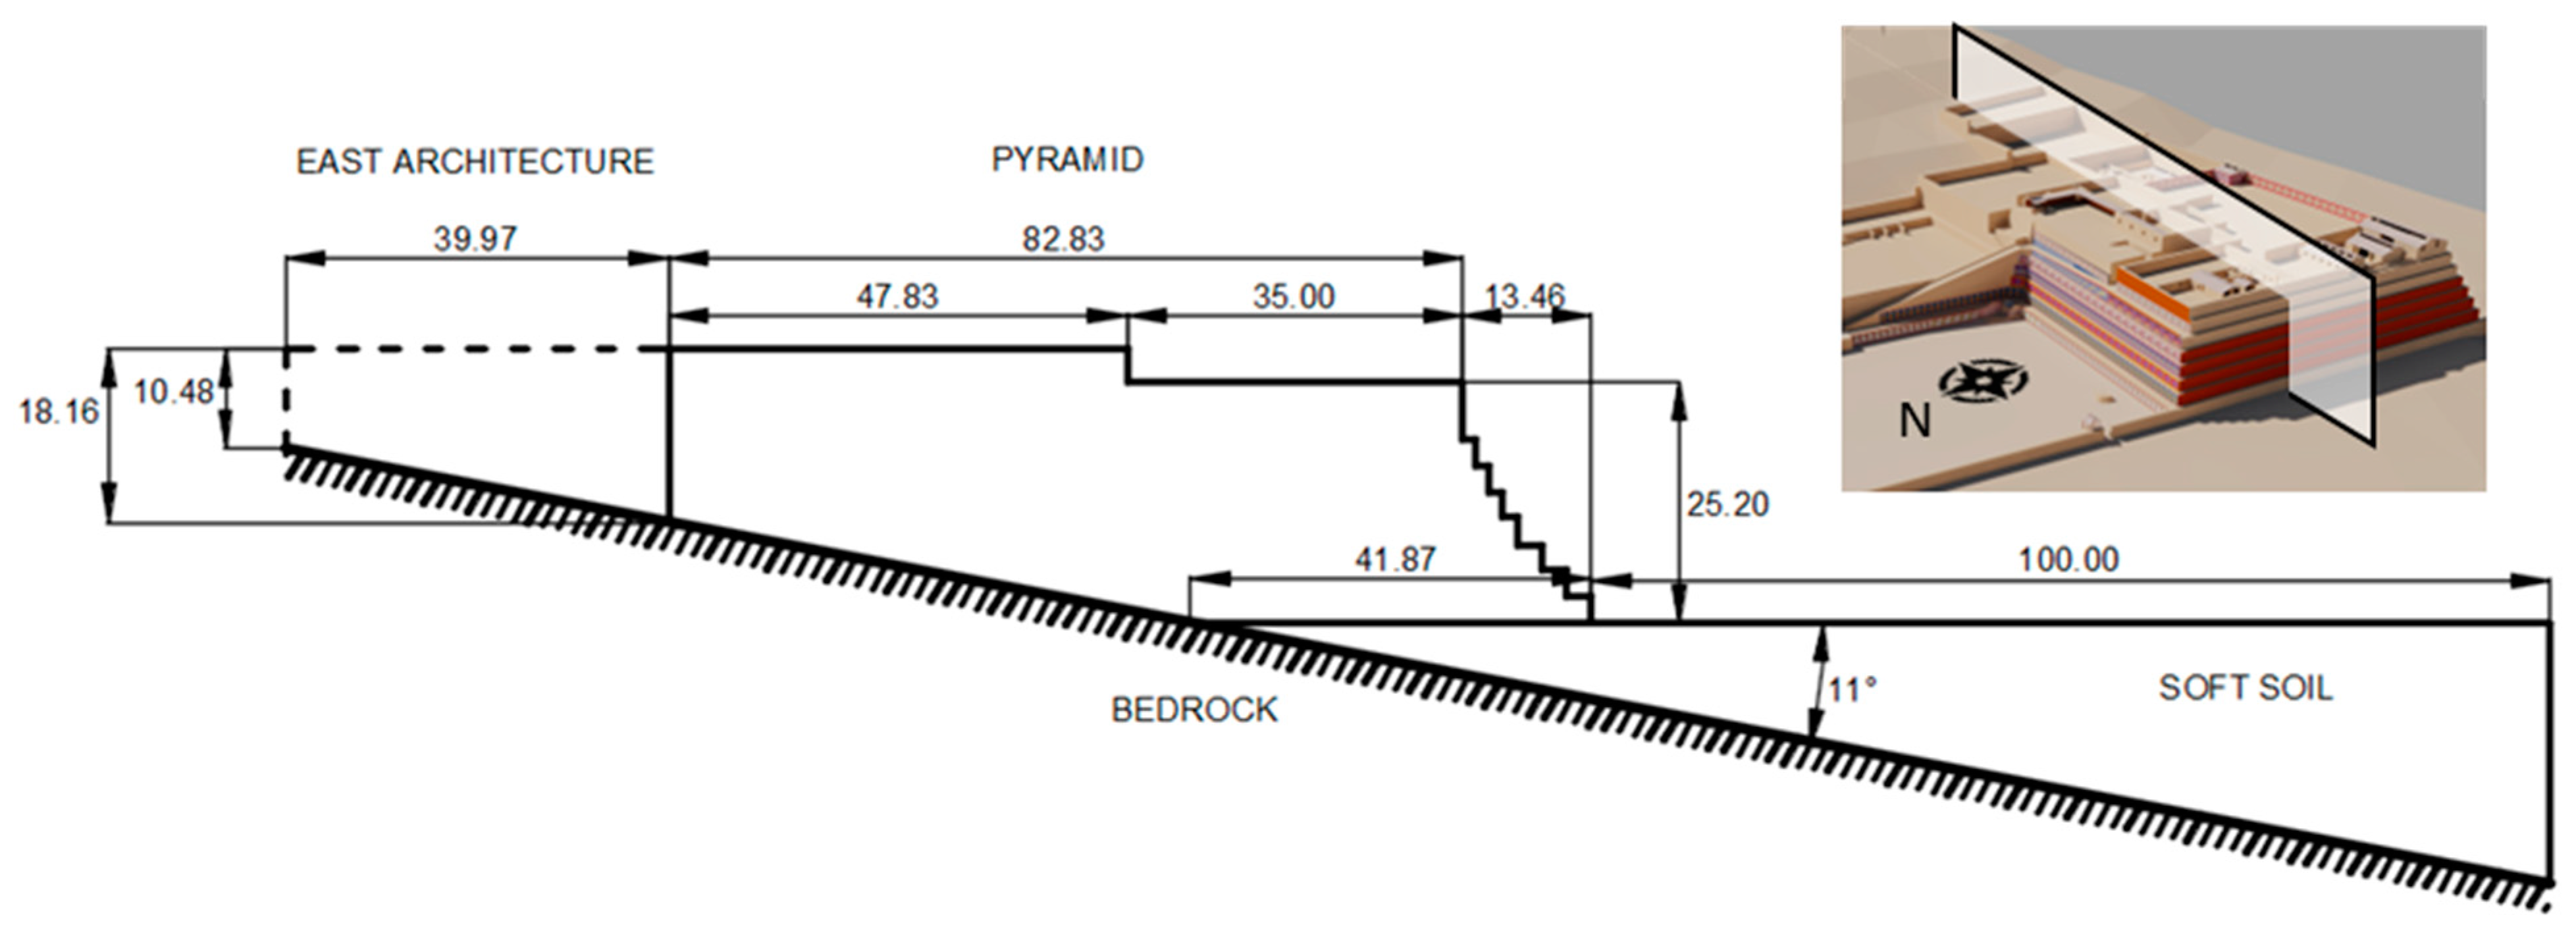
3.1. Huaca de la Luna, Trujillo, Perú

The interpretation of energy outputs is adaptable to unique structural and foundational conditions and offers a tracking mechanism to understand failure from crack-onset to collapse. The main pyramid of Huaca de la Luna, a major Moche cultural monument built and expanded from 100–650 C.E., illustrates these aspects of the method’s utility [24,40,41,42]. The pyramid started as a platform and was significantly expanded over generations. In its extant condition, it reaches approximately 28 m in height—approximately the limit of its adobe material’s compressive strength—and has an area of approximately 44,000 square meters. Sloping bedrock from nearby Cerro Blanco (Figure 5a, background) and soft soil (foreground) make up an irregular foundation. Damage has resulted from anthropogenic activity on the north and west façades and natural erosion throughout, and the northwest corner and potentially northern façade show signs of structural problems (Figure 5b,c).
The main pyramid’s massive scale, uncommon foundation, and brittle material (defined in detail in [40]) is accommodated by nonlinear FE simulations using Abaqus/CAE Explicit. An initial sensitivity analysis of various geometrical and material behavior parameters was undertaken, given the complexity of the monument, and the parameters used for the examples provided here are described in Table 6, Figure 6 and Figure 7.
From the energy results of one of these 2D simulations (Figure 8), we can evaluate how linearly increasing ground acceleration produces fractures that lead to failure. The definition of the mesh for this model is given in Table 7. By the end of gravitational loading at 5 s of analytical time (Figure 8a), parts of the model have exceeded the elastic range, producing limited zones of plastic strains. As ground acceleration is increased, plastic strains increase at an increasing rate (points b and c) until their asymptotic growth signals a collapse (point c to d, and beyond). The plastic strain maps for the labeled points of the energy plot show that the significant rapid growth of fractures corresponds to damage at the west façade. This is consistent with the extant condition.
By extruding the 2D model, we obtain a simplified 3D model (mesh described in Table 8). First, we test eastward acceleration, utilizing a symmetry plane to reduce the cost of the analysis (Figure 9). The energy plot considers total damage to the monument under lateral acceleration, showing a lateral capacity of approximately 0.07 g (Figure 9b). From the capacity curves in Figure 9c, we identify the maximum elastic deformation along the west façade occurring at approximately 0.05 g; deformations beyond the plastic regime increase by as much as factor of 10 at the point of failure defined by the energy curves. Together with the overall development of energy and the plastic strain visualization, we identify an evolution of failure that involves a sliding collapse of the entire west façade, with displacements at both noted points largely matching as base acceleration increases.
The entire symmetrical model is then tested under southward acceleration (Figure 10). Under this condition, the majority of damage appears at the northwest corner (Figure 10a), where damage is presently best observed at the site (Figure 5c). The collapse culminates at approximately 0.11 g (Figure 10b). Under increasing base acceleration, damage extends eastward along the north façade. This concentration of damage to the northwest corner is illustrated by the plots showing deformation measured at the northwest corner and at the center of the west façade (Figure 10c). At the midpoint of the west façade, measured displacements are still well within the elastic range at the maximum load defined for the structure from energy outputs. In contrast, the northwest corner exceeds the elastic regime with deformations more than 10 times greater than the maximum elastic deformation. The greatest vulnerability defined by this analysis is associated with the sliding failure of a portion of the north façade and northwest corner, with the sliding plane visible in the inset of Figure 10a.
Notably, the 3D models introduce out-of-plane behavior that is impossible to capture with the 2D plane strain models and that increases the vulnerability of the structure. Damage patterns produced by the simulations correspond in form and location to damage observed at the monument. The comparatively lower lateral capacity in 3D is correctly identified—0.07 g and 0.11 g versus the 0.15 g identified from 2D models. This example demonstrates a successful application of the method to 3D space, where the measure of load capacity of the entire structure is defined based on accumulated damage throughout the structure.

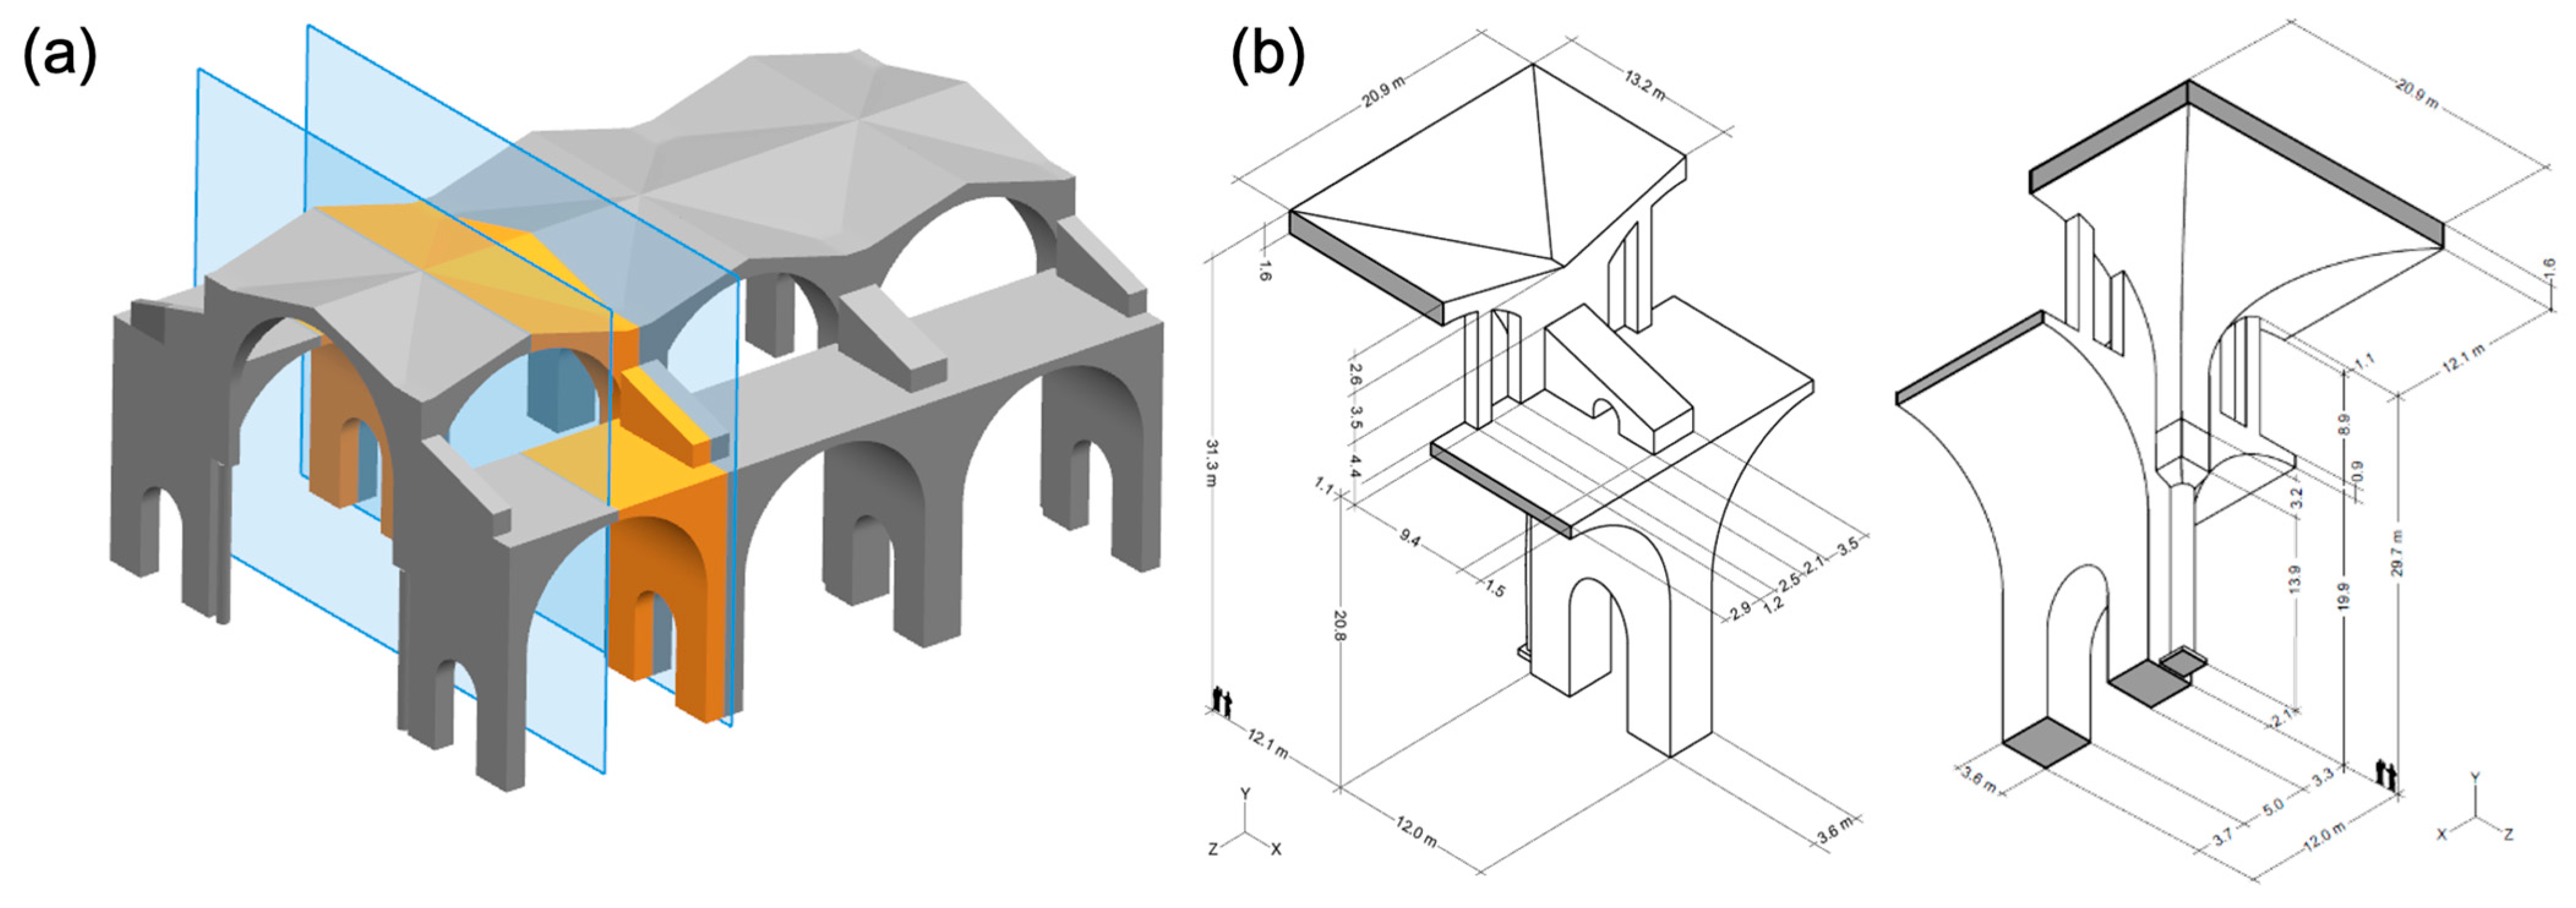
3.2. Frigidarium of the Baths of Diocletian, Rome, Italy

The Frigidarium of the Baths of Diocletian in Rome (298–306 C.E.) is one of the largest vaulted structures of Roman Imperial architecture and is built almost entirely with opus caementicium (unreinforced Roman pozzolanic concrete). Located at the center of the bath complex, the Frigidarium proper is a gigantic rectangular hall (about 63 m long, 24 m wide, and 30 m high). The hall is partitioned into three bays, each covered by concrete cross vaults carried by monolithic granite columns and laterally stabilized by contrasting arches positioned on massive flanking shear walls. This hall is surrounded by smaller side halls, formed by the shear walls and covered by concrete barrel vaults (Figure 11a). The lateral capacity of the Frigidarium has been investigated before [25,44,45,46,47]. We present the results of a pushover analysis based on the modified kinematic limit analysis (KLA) of a modular 3D section of the bay architecture (Figure 11b) developed most clearly in [25] and consistent with related studies. By assuming it had fractured into a series of discrete rigid elements, the structure was transformed into a mechanism. The elements were connected together by non-dissipative hinges and then subjected to weights and horizontal forces due to lateral acceleration acting at the element centroids. Pushover analysis was then reduced to finding the critical value of acceleration that would cause the mechanism to transition from static to dynamic conditions.
The failure analysis of the Frigidarium based on nonlinear FE energy outputs resulting from monotonically increasing ground acceleration shows the method’s applicability to a complex historical structure built with unreinforced concrete. Using symmetry planes as shown in Figure 11a, an equivalent modular section of the Frigidarium was analyzed as a 3D nonlinear model in Abaqus/CAE Explicit. Following [48], the CDP formulation was implemented for opus caementicium, while the granite columns were considered to be linearly elastic. The FE mesh for CDP material elements consisted of 33,312 linear hexahedral and 288 linear plate elements, and 80 beam elements representing the columns (Table 9). The CDP material definition is given in Figure 12 and Table 10. The model was subjected to gravitational loads over the first 5 s, followed by ground acceleration, linearly increasing from 0 to 0.3 g over 8 s.
The energy plots in Figure 13a show the evolution of SE and PD from the beginning of ground acceleration until structural collapse due to dynamic inertial load. At point 1, PD corresponds to the fracture along the crown of the vault intrados and the damage on the left side shear wall (Figure 13b). From point 1 to failure at point 2, PD rapidly increases to produce the fracture pattern visualized in Figure 13c, with extensive additional damage at the left shear wall and on the vault extrados. The intersection between PD and SE determines structural collapse—and thus lateral capacity—at 0.225 g.
The fracture pattern at collapse corresponds to the structure’s separation into rigid elements, which was explored using KLA (Figure 14). Whereas the nonlinear FE-based energy procedure yields a unique capacity, the KLA results are markedly affected by (i) the location of the separating planes and the position of the hinges, and (ii) the assumed infinite material compressive strength inherent to the elements’ rigidity. This is clearly illustrated in [25]. The initial five-block model shown in Figure 14, which follows as closely as possible the FE collapse fracture pattern for the same geometry, produces a capacity of 0.440 g. Repositioning the separation plane between block 1 and 3 lowers the capacity to 0.328 g. The successive inclusion of material crushing strength through iterative adjustments of the contact conditions between blocks reduces the capacity to 0.273 g. Finally, by exploring the sensitivity of the kinematic chain to the orientation of the contact surfaces, the capacity is further reduced to 0.266 g.
Taken together, these results show that the kinematic analysis technique—although computationally much simpler than nonlinear finite element modeling—inevitably produces an arbitrary capacity, depending on how failure mechanisms are introduced to the kinematic model. The more conservative estimate of failure extracted from energy results considers quasi-brittle material behavior both in tension and in compression that can only be approximated with KLA. This establishes a rational methodology for determining a quantifiable failure point, even for complex architectural configurations.

3.3. Church of San Pedro de Andahuaylillas, Perú

Energy output analysis may also be performed on a structure with conventional quasi-static pushover analysis, as in the study of the mixed-material triumphal arch of the Church of San Pedro de Andahuaylillas [8]. Built by the Jesuits over a pre-Columbian temple and located along the so-called Andean baroque route, the church is one of the most important monuments of early colonial religious architecture in the Andes and dates from the late 16th or early 17th century. Typical of early Andean colonial architecture, the church is characterized by a triumphal arch that separates the main nave from the presbytery. The geometry and material composition of the triumphal arch are shown in Figure 15. The structural arch is made of fired clay bricks surrounded by adobe masonry and surmounted by a high tympanum also of adobe masonry. The arch is stabilized by lateral walls of mixed stone/adobe masonry construction.
It is not possible to completely assess the deeper damage of the church accumulated over the years because the building has undergone conservation works in the last 50 years [49]. To complicate matters, the majority of the previous work was executed taking into account only the esthetic—and thus non-structural—aspects. Deep fractures in the walls of the presbytery and the chapels and in the triumphal arch have been identified. For example, diagonal deep fissures are present in the tympanum above the triumphal arch, as shown in Figure 16.
As part of the seismic assessment of the building, this work focused on the pushover analysis of the triumphal arch subjected to in-plane accelerations. Two-dimensional plane stress FE models were constructed from measurements taken on site and observed material distributions of adobe, fired bricks, and stone. After gravitational loading, a uniform monotonically increasing lateral acceleration was applied to the entire model using the Abaqus/CAE Explicit nonlinear FE formulation. The desired quasi-static condition was enforced by adopting long time intervals: 3 s for gravitational load followed by 7 s of monotonically increasing lateral acceleration from 0 to 0.6 g. The materials in each model are denoted with colors: green represents portions that are adobe masonry, gray those that are fired bricks, and red those that are stone masonry (see for example, Figure 15b). All materials are modeled using the CDP formulation, with the properties of each defined in Table 11 [51]. The quadratic triangular mesh is defined in Table 12 and Figure 17, and it was originally described in [26].
Four models—labeled 1–4 in Figure 18—are used to evaluate the effect of the architectural elements and structural materials on the lateral stability of the triumphal arch. Model 1, consisting of only adobe material, represents the arch proper surmounted by the tympanum and with abutting lateral shear walls without windows. Lateral wall windows are introduced in Model 2, while still maintaining adobe material only. Models 3 and 4 are geometrically identical to 2, but the arch intrados is assigned brick properties in Model 3. Stone masonry properties are added to the lateral walls in Model 4. The bases of all models are fully constrained.
For each test case, results are shown in terms of the capacity curve (base shear versus lateral displacement of the same reference point) together with the corresponding image of structural damage distribution at failure conditions (Figure 18b). The damaged status is shown in terms of maximum principal plastic strain distributions superimposed on the actual deformed configuration, with black bands representing areas where these strains exceed a 10−2 threshold. In all models, the lateral acceleration is directed from left to right in order to account for the structural weakness due to the right lateral wall being smaller than the left one.
Under gravitational loading, a vertical fracture develops at the center of the arch intrados and then deviates horizontally to the left under the effect of lateral acceleration. Under increasing lateral forces, this fracture propagates vertically downward, resulting in the separation of the left upper portion of the arch intrados. This failure propagation pattern is common to Models 1–4, although it does not produce total failure conditions in all cases. The capacity curves for Models 1–4 are shown in Figure 18a to better highlight the effect of geometrical and material changes, with the corresponding failure mechanisms shown in Figure 18b.
For Model 1, other than the common damage pattern at the arch intrados, the crack causing structural failure forms at the corner between the right-side wall and the arch pier and grows diagonally upward, bringing about failure at 0.383 g. The weakening effect of the window opening in each shear wall under lateral acceleration is clearly visible in Models 2–4 as a diagonal fracture originating from the corner of the right window. In Model 2, this fracture causes the separation of the shear wall from the right pier, leading to structural failure at 0.27 g. In contrast, the capacity curve of Model 3 shows the stiffening and strengthening effect of the fired brick arch. Although the failure mechanism is essentially the same as in Model 2, failure of Model 3 happens at 0.316 g. Finally, Model 4 shows the additional strengthening effect of the stone masonry material introduced in the form of a buttress within each shear wall; this is shown in red in Figure 15. In this case, partial failure occurs at the intrados of the arch followed by the separation of the side walls from the piers. The lateral capacity ultimately increases to 0.355 g. Taken together, the curves show that the presence of windows on the shear walls produces a significant reduction of capacity (30%, from 0.383 g for Model 1 to 0.270 g for Model 2). With the introduction of brick and stone masonry, the capacity is almost fully recuperated, rising to 0.316 g for Model 3 (with the introduction of brick) and 0.355 g for Model 4 (with the introduction of stone buttressing in the shear walls).
Additional results of Model 4 are illustrated in Figure 17. The time evolution of SE, PD, and KE and the base shear all indicate failure at 7.3 s of lateral acceleration, which corresponds to 0.365 g. This closely matches the maximum lateral capacity defined by the capacity curve for the same model in Figure 18 (0.355 g). Because this simulation uses quasi-static pushover loading, kinetic energy remains negligible until a portion of the structure enters an unstable condition and grows asymptotically. The spike in kinetic energy verifies the failure acceleration as determined from the asymptotic growth of PD (Figure 17). The drop in equilibrating shear force at the base, within the same plot, offers another verification of the energy-defined failure point.
Beyond the lateral capacity, the PD curve in Figure 17 shows the successive stages of fracture propagation—the discrete jumps that are evident just after 5 and 6 s, or at approximately 0.18 g and 0.26 g. These are related to the development of the fracture at the arch intrados followed by the diagonal fracture on the right shear wall discussed earlier. Such relevant information about the evolution of fracture damage through the structure is not easily detectable from the capacity curves or reaction data, and thus is a valuable feature of the presented energy-based methodology.

4. Conclusions

The major contribution of the present work is to the analysis of masonry structures under lateral accelerations whose fracture-related failure, due to complexity or uniqueness, proves difficult to capture with failure analysis standards. This paper provides a rationale for the method, using straightforward wall examples. With these examples, we show that the failure point obtained by analyzing the plastic dissipation (PD) and elastic strain energy (SE) outputs of structures modeled with concrete damaged plasticity (CDP) material corresponds to other measures of failure. We then show complex applications for which standard measures of failure are difficult to implement, e.g., the massive earthen pyramid of Huaca de la Luna, the complex Frigidarium of the Baths of Diocletian, and the mixed-material triumphal arch of the Church of Andahuaylillas, which all present challenges to typical analysis.
In applying our methodology to these unique structures, we illustrate its main advantages as follows:
  • The response from initial damage up to complete structural failure can be traced by using nonlinear dynamic analysis solved with an explicit algorithm. The inherent stability of the explicit analysis coupled with the concrete damaged plasticity (CDP) material formulation allows the correct modeling of large fracture propagations, which yields an accurate assessment of complex built heritage structures.
  • Quantitatively predicting the displacement that a structure can reach in its ultimate limit state conditions becomes possible, even in the absence of softening of the global pushover curve. This feature makes the proposed procedure particularly suitable and appealing in the context of the so-called “displacement-based design”.
  • Most importantly, for the dynamic assessment of masonry structures, it is not necessary to impose static load distributions a priori, based on modal superposition. In fact, the relative distributions of inertial forces acting on the superstructure are a direct consequence of the application of accelerations (or, alternatively, of velocities) directly at the base. In the context of a nonlinear dynamic analysis, such inertial forces are automatically computed and considered in the step-by-step solution of the nonlinear equations of motion. In this way, the use of slow dynamic analyses solves to some extent the issues related to calculating modal participation factors and to adapting them to reflect progressive damage.
At the present stage, these advantages are limited to models that are created using CDP material, since the methodology has only been evaluated this way and it relies specifically on energy outputs related to this formulation. It is possible that evaluating energy release, related to fracture propagation, could be generalized to other modeling strategies based on different material formulations. Although the analyses presented here are limited to deformable continuum models, the methodology may be applicable to rigid block kinematics. The prediction of structural failure based on the evolution of kinetic energy in response to ground acceleration in such models should be explored.
This work sets the stage for the application of the present methodology to seismic assessment based on time history analysis, which necessarily must apply dynamic loads in the form of time-varying ground acceleration or velocity. A preliminary demonstration of this application has already been completed as part of a 2D time history analysis of Huaca de la Luna [52]. The next steps toward developing a complete strategy for seismic assessment of built heritage structures will require extending the present approach to multi-dimensional seismic loading.

Author Contributions

Conceptualization, R.P.; methodology, R.P., G.M., S.T., J.S. and A.R.; validation, A.R.; investigation, A.R., J.S. and S.T.; resources, R.P.; data curation, A.R.; writing—original draft preparation, A.R., R.P. and G.M.; writing—review and editing, R.P., A.R., G.M. and S.T.; visualization, A.R., R.P. and J.S.; supervision, R.P. All authors have read and agreed to the published version of the manuscript.

Funding

Support for graduate students involved with this research was provided to Selman Tezcan by the Ministry of National Education of Türkiye and to Selman Tezcan and Anna Remus by the University of Rochester Hajim School of Engineering’s Department of Mechanical Engineering.

Data Availability Statement

Dataset available on request from the authors.

Conflicts of Interest

The authors declare no conflicts of interest.

References

  1. D’Ayala, D.; Lagomarsino, S. Performance-Based Assessment of Cultural Heritage Assets: Outcomes of the European FP7 PERPETUATE Project. Bull. Earthq. Eng. 2015, 13, 5–12. [Google Scholar] [CrossRef]
  2. Diaferio, M.; Foti, D.; Sabbà, M.F.; Lerna, M. A Procedure for the Seismic Risk Assessment of the Cultural Heritage. Bull. Earthq. Eng. 2021, 19, 1027–1050. [Google Scholar] [CrossRef]
  3. Spoldi, E.; Russo, S. Damage Assessment and Dynamic Characteristics of Temples in Nepal Post Gorkha 2015 Earthquake. Int. J. Archit. Herit. 2021, 15, 479–493. [Google Scholar] [CrossRef]
  4. Karanikoloudis, G.; Lourenço, P.B.; Alejo, L.E.; Mendes, N. Lessons from Structural Analysis of a Great Gothic Cathedral: Canterbury Cathedral as a Case Study. Int. J. Archit. Herit. 2021, 15, 1765–1794. [Google Scholar] [CrossRef]
  5. Rainone, L.S.; Tateo, V.; Casolo, S.; Uva, G. About the Use of Concrete Damage Plasticity for Modeling Masonry Post-Elastic Behavior. Buildings 2023, 13, 1915. [Google Scholar] [CrossRef]
  6. Schiavoni, M.; Giordano, E.; Roscini, F.; Clementi, F. Advanced Numerical Insights for an Effective Seismic Assessment of Historical Masonry Aggregates. Eng. Struct. 2023, 285, 115997. [Google Scholar] [CrossRef]
  7. Schiavoni, M.; Giordano, E.; Roscini, F.; Clementi, F. Numerical Assessment of Interacting Structural Units on the Seismic Damage: A Comparative Analysis with Different Modeling Approaches. Appl. Sci. 2023, 13, 972. [Google Scholar] [CrossRef]
  8. Karimi, A.H.; Karimi, M.S.; Kheyroddin, A.; Shahkarami, A.A. Experimental and Numerical Study on Seismic Behavior of An Infilled Masonry Wall Compared to An Arched Masonry Wall. Structures 2016, 8, 144–153. [Google Scholar] [CrossRef]
  9. Clementi, F. Failure Analysis of Apennine Masonry Churches Severely Damaged during the 2016 Central Italy Seismic Sequence. Buildings 2021, 11, 58. [Google Scholar] [CrossRef]
  10. Milani, G.; Valente, M. Comparative Pushover and Limit Analyses on Seven Masonry Churches Damaged by the 2012 Emilia-Romagna (Italy) Seismic Events: Possibilities of Non-Linear Finite Elements Compared with Pre-Assigned Failure Mechanisms. Eng. Fail. Anal. 2015, 47, 129–161. [Google Scholar] [CrossRef]
  11. Vitorino, S.; Corazzi, R.; Doz, G. Seismic Performance Assessment of the Historical Cathedral of Santa Maria Del Fiore Dome by Numerical Analysis. Eng. Fail. Anal. 2024, 165, 108734. [Google Scholar] [CrossRef]
  12. Nastri, E.; Tenore, M.; Todisco, P. Calibration of Concrete Damaged Plasticity Materials Parameters for Tuff Masonry Types of the Campania Area. Eng. Struct. 2023, 283, 115927. [Google Scholar] [CrossRef]
  13. Kalkbrenner, P.; Pelà, L.; Sandoval, C. Multi Directional Pushover Analysis of Irregular Masonry Buildings without Box Behavior. Eng. Struct. 2019, 201, 109534. [Google Scholar] [CrossRef]
  14. Direttiva del Presidente del Consiglio dei Ministri; DPCM Gazzetta Ufficiale della Repubblica Italiana G.U. Valutazione e Riduzione del Rischio Sismico del Patrimonio Culturale con Riferimento Alle Norme Tecniche per le Costruzioni di cui al Decreto Ministeriale 14 Gennaio 2008; 2011; Volume 54. [Google Scholar]
  15. Bayraktar, A.; Hökelekli, E.; Yang, T.T.Y. Seismic Failure Behavior of Masonry Domes under Strong Ground Motions. Eng. Fail. Anal. 2022, 142, 106749. [Google Scholar] [CrossRef]
  16. Valente, M.; Milani, G. Seismic Response and Damage Patterns of Masonry Churches: Seven Case Studies in Ferrara, Italy. Eng. Struct. 2018, 177, 809–835. [Google Scholar] [CrossRef]
  17. Misir, I.S.; Yucel, G. Numerical Model Calibration and a Parametric Study Based on the Out-of-Plane Drift Capacity of Stone Masonry Walls. Buildings 2023, 13, 437. [Google Scholar] [CrossRef]
  18. Shehu, R. Implementation of Pushover Analysis for Seismic Assessment of Masonry Towers: Issues and Practical Recommendations. Buildings 2021, 11, 71. [Google Scholar] [CrossRef]
  19. Malcata, M.; Ponte, M.; Tiberti, S.; Bento, R.; Milani, G. Failure Analysis of a Portuguese Cultural Heritage Masterpiece: Bonet Building in Sintra. Eng. Fail. Anal. 2020, 115, 104636. [Google Scholar] [CrossRef]
  20. Valente, M. Seismic Behavior and Damage Assessment of Two Historical Fortified Masonry Palaces with Corner Towers. Eng. Fail. Anal. 2022, 134, 106003. [Google Scholar] [CrossRef]
  21. Milani, G.; Valente, M. Failure Analysis of Seven Masonry Churches Severely Damaged during the 2012 Emilia-Romagna (Italy) Earthquake: Non-Linear Dynamic Analyses vs Conventional Static Approaches. Eng. Fail. Anal. 2015, 54, 13–56. [Google Scholar] [CrossRef]
  22. Fortunato, G.; Funari, M.F.; Lonetti, P. Survey and Seismic Vulnerability Assessment of the Baptistery of San Giovanni in Tumba (Italy). J. Cult. Herit. 2017, 26, 64–78. [Google Scholar] [CrossRef]
  23. Funari, M.F.; Silva, L.C.; Mousavian, E.; Lourenço, P.B. Real-Time Structural Stability of Domes through Limit Analysis: Application to St. Peter’s Dome. Int. J. Archit. Herit. 2021, 17, 915–937. [Google Scholar] [CrossRef]
  24. Tezcan, S.; Pando, M.A.; Aguilar, R.; Perucchio, R. Nonlinear 2D and 3D Finite Element Static and Dynamic Analysis of the Main Pyramid of Huaca de La Luna, Peru. In Proceedings of the 13th International Conference on Structural Analysis of Historical Construction (SAHC 2023), Kyoto, Japan, 12–15 September 2023; Springer International Publishing: Cham, Switzerland, 2023; Volume 47. [Google Scholar]
  25. Sadholz, A.; Muir, C.; Perucchio, R. Limit Analysis to Assess the Seismic Capacity of Diocletian’s Frigidarium. In Proceedings of the Structural Analysis of Historical Constructions: Anamnesis, Diagnosis, Therapy, Controls, Leuven, Belgium, 13–15 September 2016; Van Balen, K., Verstrynge, E., Eds.; Taylor & Francis Group: London, UK, 2016; pp. 272–278. [Google Scholar]
  26. Tezcan, S.; Tambe, N.; Muir, C.; Aguilar, R.; Perucchio, R. Nonlinear FE Analysis of the Response to Lateral Accelerations of the Triumphal Arch of the Church of Andahuaylillas, Peru. In Structural Analysis of Historical Constructions; RILEM Bookseries; Aguilar, R., Torrealva, D., Moreira, S., Pando, M.A., Ramos, L.F., Eds.; Springer International Publishing: Cham, Switzerland, 2019; Volume 18, pp. 1301–1309. ISBN 978-3-319-99440-6. [Google Scholar]
  27. Lee, J.; Fenves, G.L. Plastic-Damage Model for Cyclic Loading of Concrete Structures. J. Eng. Mech. 1998, 124, 892–900. [Google Scholar] [CrossRef]
  28. Lubliner, J.; Oliver, J.; Oller, S.; Oñate, E. A Plastic-Damage Model for Concrete. Int. J. Solids Struct. 1989, 25, 299–326. [Google Scholar] [CrossRef]
  29. Dassault Systemes Abaqus/CAE User’s Guide. Available online: http://130.149.89.49:2080/v2016/pdf_books/CAE.pdf (accessed on 27 February 2024).
  30. Chopra, A.K. Dynamics of Structures: Theory and Applications to Earthquake Engineering, 3rd ed.; Prentice-Hall International Series in Civil Engineering and Engineering Mechanics; Pearson/Prentice Hall: Upper Saddle River, NJ, USA, 2007; ISBN 978-0-13-156174-8. [Google Scholar]
  31. Pinho, R. Using Pushover Analysis for Assessment of Buildings and Bridges. In Advanced Earthquake Engineering Analysis; Pecker, A., Ed.; Springer: Vienna, Austria, 2007; pp. 91–120. ISBN 978-3-211-74214-3. [Google Scholar]
  32. Aguilar, R.; Pando, M.A.; Briceño, C.; Zavala, G.; Castañeda, B.; Perucchio, R.; Uceda, S. Structural and Geotechnical Engineering Assessment of Huaca de La Luna—A Massive Earthen Moche Culture Pyramid in Northern Peru. J. Cult. Herit. 2018, 34, 83–94. [Google Scholar] [CrossRef]
  33. D’Altri, A.M.; Cannizzaro, F.; Petracca, M.; Talledo, D.A. Nonlinear Modelling of the Seismic Response of Masonry Structures: Calibration Strategies. Bull. Earthq. Eng. 2022, 20, 1999–2043. [Google Scholar] [CrossRef]
  34. Silva, V.; Crowley, H.; Varum, H.; Pinho, R.; Sousa, R. Evaluation of Analytical Methodologies Used to Derive Vulnerability Functions. Earthq. Eng. Struct. Dyn. 2014, 43, 181–204. [Google Scholar] [CrossRef]
  35. Ferretti, F.; Simoni, E.; Buratti, N.; Mazzotti, C. Typological Fragility Analysis of Masonry Buildings in Emilia Romagna Region (Italy). Bull. Earthq. Eng. 2023, 21, 3321–3356. [Google Scholar] [CrossRef]
  36. Aşıkoğlu, A.; Vasconcelos, G.; Lourenço, P.B.; Pantò, B. Pushover Analysis of Unreinforced Irregular Masonry Buildings: Lessons from Different Modeling Approaches. Eng. Struct. 2020, 218, 110830. [Google Scholar] [CrossRef]
  37. Gaggero, M.B.; Korswagen, P.A.; Esposito, R.; Rots, J.G. In-Plane Behaviour of Unreinforced Masonry Strengthened with a Structural Glass Window: A Proof of Concept. Buildings 2023, 13, 361. [Google Scholar] [CrossRef]
  38. Cannizzaro, F.; Pantò, B.; Lepidi, M.; Caddemi, S.; Caliò, I. Multi-Directional Seismic Assessment of Historical Masonry Buildings by Means of Macro-Element Modelling: Application to a Building Damaged during the L’Aquila Earthquake (Italy). Buildings 2017, 7, 106. [Google Scholar] [CrossRef]
  39. Betti, M.; Galano, L.; Vignoli, A. Time-History Seismic Analysis of Masonry Buildings: A Comparison between Two Non-Linear Modelling Approaches. Buildings 2015, 5, 597–621. [Google Scholar] [CrossRef]
  40. Tezcan, S.; Pando, M.A.; Aguilar, R.; Castañeda, B.; Rojas, C.; Perucchio, R. Preliminary Nonlinear Static and Dynamic Analysis of the Main Pyramid of Huaca de La Luna, Peru. In Proceedings of the COMPDYN 2021: 8th ECCOMAS Thematic Conference on Computational Methods in Structural Dynamics and Earthquake Engineering, Athens, Greece, 28–30 June 2021; Papadrakakis, M., Fragiadakis, M., Eds.; Athens, Greece, 2021; pp. 244–257. [Google Scholar]
  41. Riccio, C.; Remus, A.; Tezcan, S.; Silva, L.C.; Milani, G.; Perucchio, R. A Macroblock 2D Finite Element Model for Assessing the Roots of Failure of Huaca de La Luna’s Main Pyramid (Peru) under Seismic Action. Eng. Fail. Anal. 2023, 151, 107417. [Google Scholar] [CrossRef]
  42. Remus, A.; Yılmaz, L.; Tezcan, S.; Perucchio, R. Effect of Eastern Architecture and Sloping Foundation Conditions on the Static and Dynamic Response of the Adobe Pyramid Huaca De La Luna (Perú). In Proceedings of the 13th International Conference on the Structural Analysis and Historical Constructions (SAHC 2023), Kyoto, Japan, 12–15 September 2023; Springer International Publishing: Cham, Switzerland, September 2023; Volume 47. [Google Scholar]
  43. Remus, A.; Tezcan, S.; Pando, M.A.; Aguilar, R.; Perucchio, R. 2D and 3D Nonlinear Finite Element Sensitivity Analysis of the Static and Dynamic Behavior of the Adobe Pyramid of Huaca de La Luna, Trujillo, Perú. Int. J. Archit. Herit. 2024, 1–29. [Google Scholar] [CrossRef]
  44. Sadholz, A.; Muir, C.; Perucchio, R. A 3D Kinematic Model for Assessing the Seismic Capacity of the Frigidarium of the Baths of Diocletian. In Proceedings of the 2015 Digital Heritage, Granada, Spain, 28 September–2 October 2015; Volume 2, pp. 89–92. [Google Scholar]
  45. Faleri, F. Structural Analysis of Concrete Vaulted Monuments in Imperial Rome; Politecnico di Milano: Milan, Italy, 2019. [Google Scholar]
  46. Faleri, F. Seismic Vulnerability of Roman Concrete Vaulted Monuments: Two Case Studies Dating Back to Imperial Rome. Master’s Thesis, Politecnico di Milano, Milan, Italy, 2019. [Google Scholar]
  47. Ivancic, S.; Brune, P.; Perucchio, R. A Concrete Damage Plasticity Model for Ancient Roman Pozzolanic Concrete. In Proceedings of the 9th International Masonry Conference, Guimarães, Portugal, 7–9 July 2014; International Masonry Society: Guimarães, Portugal, 2014. [Google Scholar]
  48. Brune, P. The Mechanics of Imperial Roman Concrete and the Structural Design of Vaulted Monuments. Ph.D. Thesis, University of Rochester, Rochester, NY, USA, 2010. [Google Scholar]
  49. Vargas, J.; Aguilar, R.; Gonzales, M.; Briceño, C. Structural Intervention in Saint Peter the Apostle Church of Andahuaylillas in Cusco, Peru. In Proceedings of the 13th Ibero-American Seminar on Earthen Architecture and Construction (XXIII SIACOT), Valparaiso, Chile, 19–23 November 2013. [Google Scholar]
  50. Wang, Y.; Qiao, Z.; Dong, Y.; Briceño, C.; Aguilar, R.; Perucchio, R. Nonlinear Finite Element Evaluation of the Structural Response to Lateral Accelerations of the Adobe Church of Andahuaylillas, Peru. In Proceedings of the Second International Conference on Performance-based and Life-cycle Structural Engineering (PLSE 2015), Portland, OR, USA, 9–11 December 2015; School of Civil Engineering, The University of Queensland: Brisbane, QLD, Australia, 2015; pp. 358–367. [Google Scholar]
  51. Briceño, C.; Wang, Y.; Qiao, Z.; Dong, Y.; Perucchio, R. Seismic Analysis of Earthen Churches: The Triumphal Arch at Andahuaylillas, Peru. In Proceedings of the CIVIL-COMP Proceedings, Prague, Czech Republic, 1–4 September 2015. [Google Scholar]
  52. Remus, A.; Tezcan, S.; Pando, M.A.; Aguilar, R.; Perucchio, R. Damage Assessment via Time History Analysis of the Massive Earthen Pyramid of Huaca de La Luna (Huacas de Moche, Perú). In Proceedings of the 18th World Conference on Earthquake Engineering, Milan, Italy, 30 June–5 July 2024. [Google Scholar]
Figure 1. Pushover analysis of (a) a 3D wall shown with its finite element mesh, fractures shown in black, and speckled foundation with (b) accompanying energy outputs, (c) reaction forces, and (d) pushover curve.
Buildings 15 00318 g001
Figure 2. Compressive behavior (a) and tensile behavior (b) for adobe are derived from material tests first published in [32]; the tensile behavior is taken as one-tenth of the maximum compressive strength.
Buildings 15 00318 g002
Figure 3. Analysis loaded with ground acceleration: (a) a wall with the shown mesh and applied acceleration at the base, (b) the resulting damage pattern, shown with fractures in black, (c) energy outputs as applied acceleration increases, and (d) equilibrating reactions as applied acceleration increases.
Buildings 15 00318 g003
Figure 4. Three simple panel models are recreated following [33] to compare maximum capacity defined by capacity curves and defined by the proposed methodology. An example of (a) loading step 1, with blue arrows showing the direction of axial load, and (b) loading step 2, with red arrows showing the direction of shear load is provided; (c) offers a legend that applies for the energy and capacity curve results of the three models evaluated, with results for each geometry given in (df). Red dots note the failure point as determined by the maximum of the capacity curve and by the energy curve intersection; the dotted vertical line shows the relationship of the energy curves with the capacity curve.
Buildings 15 00318 g004
Figure 5. Huaca de la Luna complex as (a) 3D reconstruction, (b) laser scan of damage, and (c) photograph of damage [32].
Buildings 15 00318 g005
Figure 6. The baseline cross-sectional geometry of the main pyramid of the Huaca de la Luna complex, along with its hypothetical location, was used for a sensitivity study that also investigated variations of this geometry [43].
Buildings 15 00318 g006
Figure 7. Compressive behavior (a) and tensile behavior (b) are derived from material tests first published in [32]; a conservative estimate of tensile behavior is taken as one-third of the maximum compressive strength.
Buildings 15 00318 g007
Figure 8. Evolution of elastic and plastic dissipation energies under gravitation (a) and lateral acceleration loads up to collapse (bd). Arrows denote an eastward acceleration applied to the base.
Buildings 15 00318 g008
Figure 9. Simplified 3D model under W-E ground acceleration (N-S symmetry applied at the boundary) produces (a) fracture patterns shown with plastic strains, (b) energy outputs, and (c) capacity curves.
Buildings 15 00318 g009
Figure 10. Simplified 3D model under N-S ground acceleration produces (a) fracture patterns shown with plastic strains, (b) energy outputs, and (c) capacity curves.
Buildings 15 00318 g010
Figure 11. Frigidarium section shown in yellow (a) and geometry used for nonlinear FEA under lateral acceleration (b).
Buildings 15 00318 g011
Figure 12. Compressive behavior (a) and tensile behavior (b) are derived from material tests of Roman concrete; for a comprehensive discussion see [48].
Buildings 15 00318 g012
Figure 13. Base acceleration applied to the FE model: (a) energy results, (b) initial fracture pattern, and (c) fracture pattern at collapse.
Buildings 15 00318 g013
Figure 14. Kinematic limit analysis: (a) assumed rigid element configuration with connecting hinges (noted with dots, separated elements are numbered) and (b) attendant collapse mechanism [25].
Buildings 15 00318 g014
Figure 15. Triumphal arch: (a) plan and elevation and (b) material distribution (green represents adobe masonry, gray represents fired bricks, and red represents stone masonry).
Buildings 15 00318 g015
Figure 16. Damage to the triumphal arch of the Church of Andahuaylillas (reproduced from [50]).
Buildings 15 00318 g016
Figure 17. Model 4: mesh (left) and combined energy and reaction plot up to structural failure (right).
Buildings 15 00318 g017
Figure 18. Capacity curves (a) and fracture patterns at failure (b) for the four models of the triumphal arch. The red triangle denotes the reference point where the lateral displacements are measured.
Buildings 15 00318 g018
Table 1. Mesh characteristics for the 3D wall model.
Element TypeElement Size [m]Number of Elements
Quadratic tetrahedral (C3D10M)0.131,351
Table 2. CDP Material behavior parameters used for adobe material.
Density and Elastic Behavior
Mass Density [kg/m3]Young’s Modulus [MPa]Poisson’s Ratio
17351230.2
Plasticity Parameters
Dilation AngleEccentricityFb0/fc0KViscosity
Parameter
180.11.160.675 × 10−4
Table 3. Mesh characteristics for the plane stress example.
Element TypeElement Size [m]Number of Elements
Quadratic triangles
(CPS6M)
0.42288
Table 4. Mesh characteristics for the shear displacement example.
Element TypeElement SizeNumber of Elements
Linear tetrahedron0.25 m13,107
Table 5. Material behavior parameters used for the shear displacement example.
Density and Elastic Behavior
Mass Density [kg/m3]Young’s Modulus [MPa]Poisson’s Ratio
210013920.2
Compressive Behavior
Stress [MPa]Inelastic StrainDamage Parameter
2.6700
2.670.0030
0.80.010.9
Tensile Behavior
Stress [MPa]Cracking StrainDamage Parameter
0.05400
0.0070.00150.9
Plasticity Parameters
Dilation AngleEccentricityFb0/fc0KViscosity
Parameter
100.11.160.6670
Table 6. CDP material behavior parameters used for Huaca de la Luna’s main pyramid.
Density and Elastic Behavior
Mass Density [kg/m3]Young’s Modulus [MPa]Poisson’s Ratio
17351230.2
Plasticity Parameters
Dilation AngleEccentricityFb0/fc0KViscosity
Parameter
10.11.160.671 × 10−8
Table 7. Mesh characteristics for the 2D Huaca de la Luna example.
Element TypeElement SizeNumber of Elements
Quadratic plane strain
triangle (CPE6M)
0.75 m8175
Table 8. Mesh characteristics for the 3D Huaca de la Luna example (refers to whole model, not the model simplified with a symmetry plane).
Element TypeElement SizeNumber of Elements
Linear brick element (C3D8R)1 m233,604
Table 9. Mesh characteristics for the Frigidarium.
Element TypeElement Size [m]Number of Elements
Linear hexahedral~0.4533,312
Linear quadrilateral plate ~0.45288
Linear line (beam)~0.3580
Table 10. CDP material behavior parameters used for the Frigidarium.
Density and Elastic Behavior
Mass Density [kg/m3]Young’s Modulus [GPa]Poisson’s Ratio
15003.370.2
Plasticity Parameters
Dilation AngleEccentricityFb0/fc0KViscosity
Parameter
310.11.160.671 × 10−4
Table 11. CDP material behavior parameters used for the triumphal arch of the Church of Andahuaylillas.
Density and Elastic Behavior
MaterialMass Density [kg/m3]Young’s Modulus [MPa]Poisson’s Ratio
Adobe15393500.25
Brick180012000.25
Stone masonry220023500.25
Postcritical behavior
Materialσc [MPa]σf [MPa]GIC [N/m]GIF [N/m]
Adobe0.8750.087514004
Brick2.40.1238402.16
Stone masonry5.30.17684805.104
Plasticity parameters (common to all materials)
Dilation angleEccentricityFb0/fc0KViscosity
parameter
10.11.160.671 × 10−8
Table 12. Mesh characteristics for triumphal arch of the Church of Andahuaylillas.
Element TypeElement SizeNumber of Elements
Quadratic triangular plane stress~0.3 m4680
Disclaimer/Publisher’s Note: The statements, opinions and data contained in all publications are solely those of the individual author(s) and contributor(s) and not of MDPI and/or the editor(s). MDPI and/or the editor(s) disclaim responsibility for any injury to people or property resulting from any ideas, methods, instructions or products referred to in the content.

