Article

Seismic Damage Quantification of RC Short Columns from Crack Images Using the Enhanced U-Net

1
School of Civil Engineering, Wuhan University, Wuhan 430072, China
2
Engineering Research Center of Urban Disasters Prevention and Fire Rescue Technology of Hubei Province, Wuhan 430072, China
*
Author to whom correspondence should be addressed.
Buildings 2025, 15(3), 322; https://doi.org/10.3390/buildings15030322
Submission received: 16 December 2024 / Revised: 15 January 2025 / Accepted: 18 January 2025 / Published: 22 January 2025

Abstract

:
It is of great importance to quantify the seismic damage of reinforced concrete (RC) short columns since they often experience severe damage due to likely excessive shear deformation. In this paper, the seismic damage quantification method of RC short columns under earthquakes is proposed based on crack images and the enhanced U-Net. To this end, RC short-column specimens were prepared and tested under cyclic loading. The force-displacement hysteresis curves were obtained to quantitatively calculate the damage indicator of the RC short column based on the energy criterion. At the same time, crack images of the column surfaces were taken by smartphones using the partition photographing scheme and image stitching algorithm. The widely used U-Net was enhanced by adding a double attention mechanism to segment the cracks in the images. The results demonstrate that it has better accuracy in terms of recognizing tiny cracks compared to the original U-Net. By image analysis, the crack information was further extracted from the crack images to investigate the damage development of RC short columns. Finally, correlations between the damage indicator based on the energy criterion and crack information of the RC short columns under cyclic loading were analyzed, showing that the highest correlation exists between the damage indicator and the total crack area. Finally, the normalized total crack area, i.e., the ratio between the total crack area and the corresponding monitored area of the surface, is defined to quantify the seismic damage of RC short columns when utilizing crack images for damage assessment.

1. Introduction

As a special type of reinforced concrete (RC) member, the RC short column possesses a relatively small shear-span ratio. Compared to the ordinary RC column, it has a larger lateral stiffness and thus sustains larger actions under seismic excitations [1]. In addition, it often experiences larger shear deformation due to the small shear-span ratio. Accordingly, the RC short column generally exhibits shear failure under seismic loads [2], resulting in poor deformation and energy dissipation capacity. In fact, the presence of RC short columns is generally thought to be one of the main reasons for the deterioration of RC structures during earthquake events [3,4,5]. Therefore, it is of great importance to evaluate the damage extent of RC short columns under seismic excitations.
With the rapid advancement of computer science, computer technology has gained popularity recently in damage evaluation or capacity assessment of RC members. For damage evaluation, the primary applications include the detection and localization of concrete cracks [6,7,8], spalling [9,10], reinforcement exposure [11,12], as well as the calculation of crack geometric features such as length, width, and inclination [13,14,15]. In the early stages, image processing algorithms such as threshold segmentation, edge detection, histogram transformation, and morphological operations were commonly used to fulfill these tasks. In recent years, the focus has shifted towards the utilization of deep learning models such as the FCN [16], U-Net [17], Mask-RCNN [18], and their improved variants [19,20,21,22,23,24]. In the case of capacity assessment, Zhang et al. [25] used the 3D digital twin model integrated with point clouds and images to estimate the load-carrying capacity of cracked RC beams.
In the related studies, the damage extents of RC members are often divided into several discrete states, such as no damage, minor damage, moderate damage, severe damage, and collapse. They are further correlated with the surface characteristics or damage types of RC members, which are recognized by way of computer vision aided by deep learning. In this manner, the damage status of RC members is successfully assessed by various computer vision algorithms and deep learning models [26,27,28,29,30,31,32,33,34]. For example, Miao et al. [26] categorized visible seismic damage as concrete cracking, concrete cover spalling, exposure of reinforcement, crushing of concrete, and buckling and fracture of reinforcement, and designed a deep convolutional network architecture for pixel-level detection of visible damage. Later, Zou et al. [27] proposed a damage assessment method for RC members, which can preliminarily determine the failure modes and damage levels by locating the damage position and identifying damage types on the surface of RC members. In addition, a simplified relationship between member damage levels and structural damage levels was established to realize the cross-scale assessment from members to structures quantitatively. Moreover, Zhang et al. [31] classified RC column damage levels after seismic tests and qualitatively determined the seismic damage levels of RC columns using the deep contrast attention model.
Differing from the above studies, others concentrate on automatically identifying the cracks in the RC components using deep learning. For instance, Dung et al. [35] proposed a VGG16-based fully convolutional network (FCN) to detect cracks. However, FCN-based approaches suffer from the loss of low-level semantic information during the up-sampling process. To overcome this limitation, Liu et al. [36] employed a U-Net network for crack segmentation. Later, the accuracy of crack detection was of more concern in the related studies [13,22,37,38]. For example, Bae et al. [13] proposed a computer vision-based crack quantification algorithm by decision-making based on statistical methods, which separates cracks through image processing techniques and enables precise quantification based on statistics. Moreover, Xu et al. [37] used the DeepLabv3 + model to accurately detect cracks and analyzed connected domains to extract seven geometric characteristic parameters, including crack roundness and surface percentage.
From the above literature review, it can be clearly seen that the existing studies mainly concern identifying damage status or segmenting the crack using deep learning. However, the involved damages, including the cracks, cannot directly reflect the overall damage content of RC members, since they are located on the surface of RC members. Therefore, it is interesting to further investigate the relationship between the visual damage and the overall damage content of RC members. In particular, there is no related study about the RC short column, which is however susceptible to damage in seismic excitations. To address the above issues, RC short-column specimens are prepared and tested under cyclic loading in this study. Based on the energy criterion, damage indicators of the RC short columns are calculated quantitatively through the measured force-displacement hysteresis curves. Meanwhile, crack images of the column surfaces are taken by smartphones using the partition photography scheme and image stitching algorithm and are segmented using the enhanced U-Net deep learning model. By image analysis, the crack information including the length, width, and area is further extracted from the crack images. Finally, correlations between damage indicators based on the energy criterion and crack information of the RC short columns are analyzed to investigate the feasibility of crack features to quantify the seismic damage of RC short columns.

2. Cyclic Test of RC Short Columns

2.1. Preparation of the Specimens

As shown in Figure 1, two RC short-column specimens, designated SC1 and SC2, respectively, were prepared for the cyclic test. Their prototype is designed to support the rail in the metro overhauling depot, as shown in Figure 2. They are both composed of two parts: the column and the foundation beam. For the column, the height is 950 mm and the section size is 350 mm × 350 mm; for the foundation beam, the length is 1300 mm and the section size is 350 mm × 500 mm. The column can be roughly categorized as a short column due to its relatively small shear-span ratio, which is about 2.2 considering the influence of the loading setup (see Figure 4).
For both specimens, the strength grade of concrete is C60 [39], and the strength grade of rebar, including the longitudinal reinforcement and stirrup, is HRB400 [39]. Before the cyclic test, the mechanical properties of the materials used in the specimens were measured and listed in Table 1, where Ec and fcu represent the elastic modulus and cubic compressive strength of concrete, respectively; Es, fy, fu, and εy denote the elastic modulus, yield strength, ultimate strength and yield strain of rebar, respectively.

2.2. Testing Device and Measurements

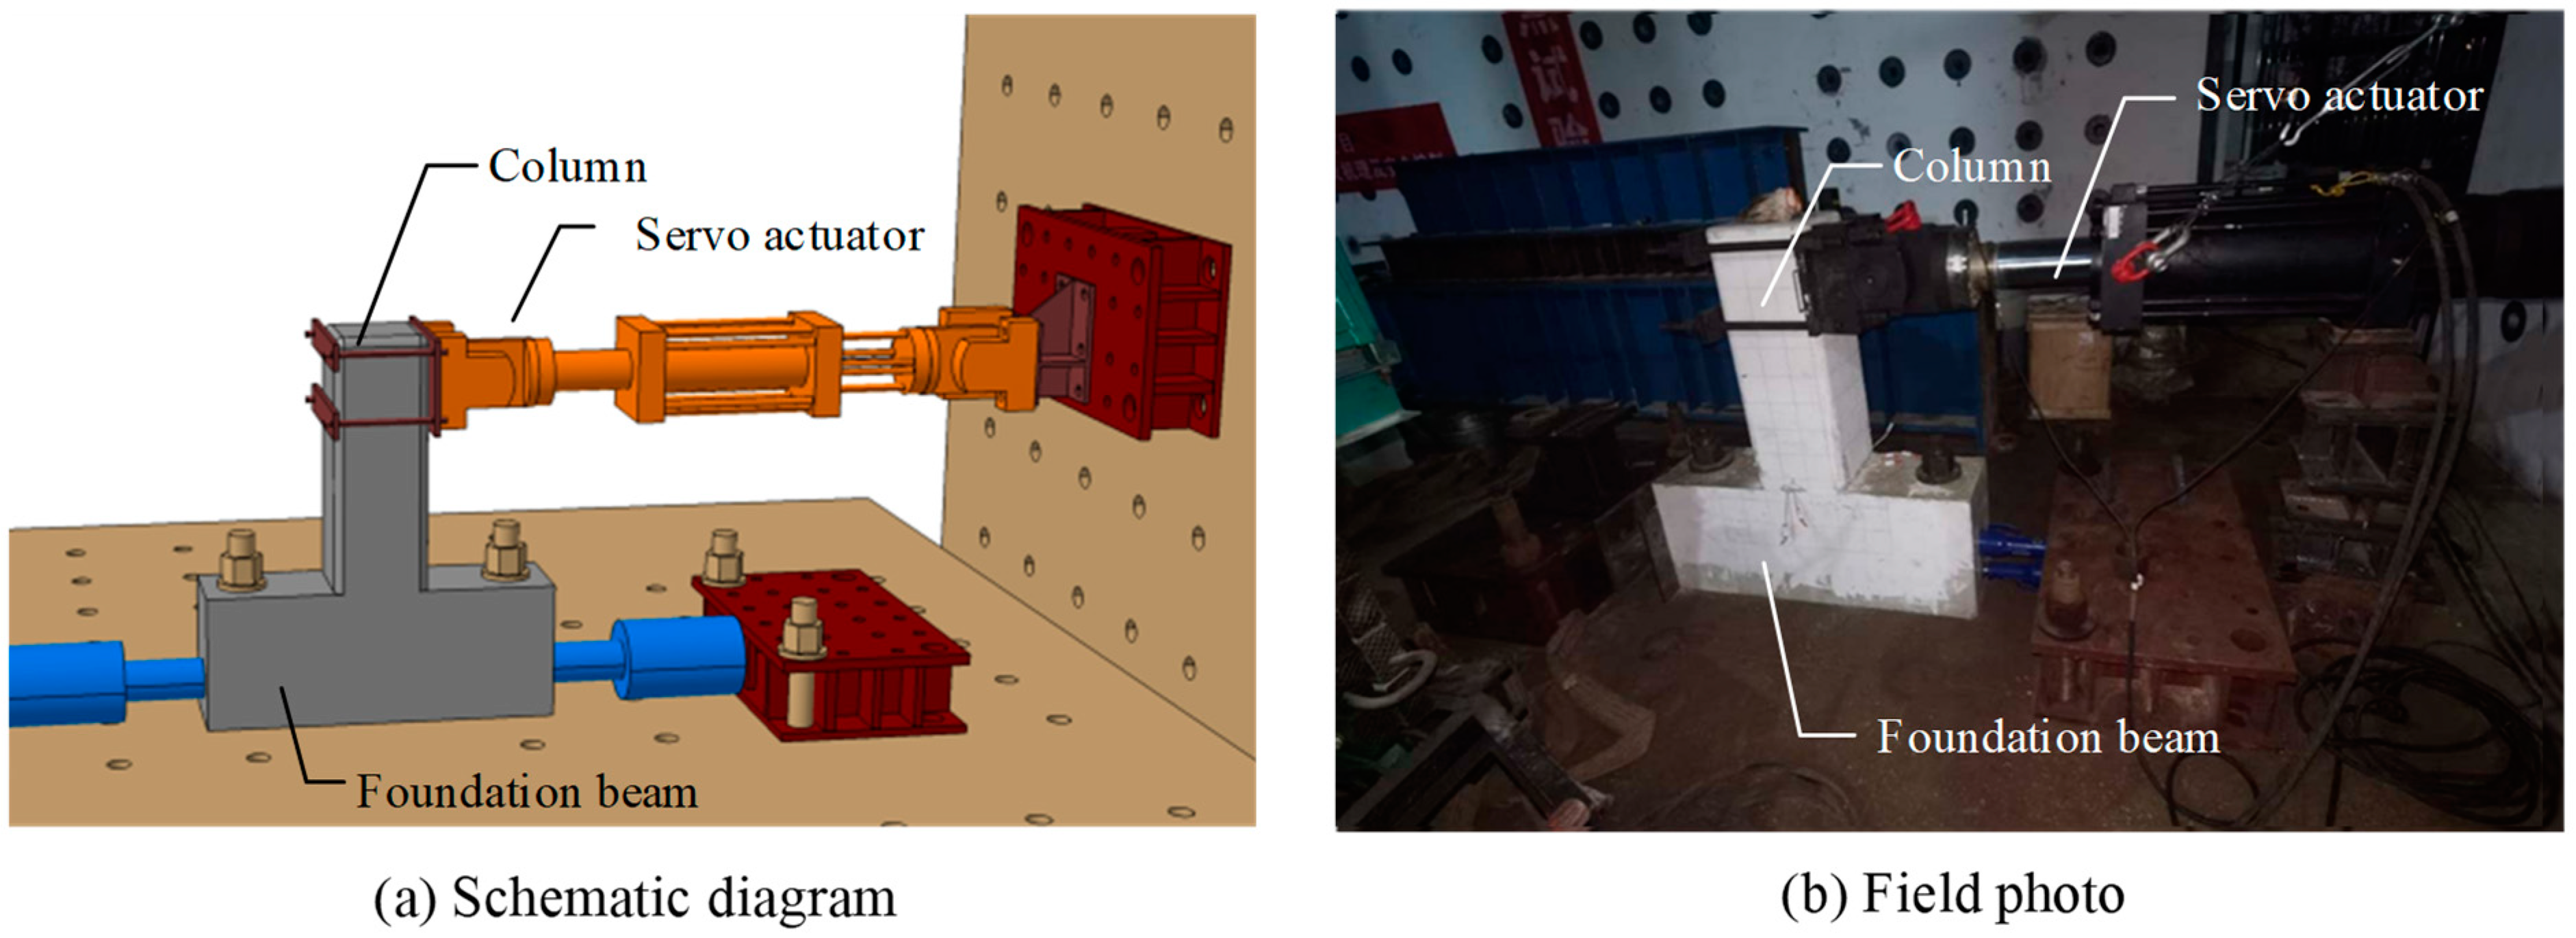
As shown in Figure 3, the RC short column specimen is fixed to the test floor by two steel rods passing vertically through the PVC pipes embedded in the foundation beam (see Figure 1). In addition, horizontal restraint is provided to limit the likely slip of the foundation beam. The cyclic lateral force is applied using a 600 kN electro-hydraulic servo actuator, which is connected to the reaction wall at the rear and to the top of the specimen at the head using a specially designed steel fixture. For the sake of convenience, the gravity load is not considered in this study.
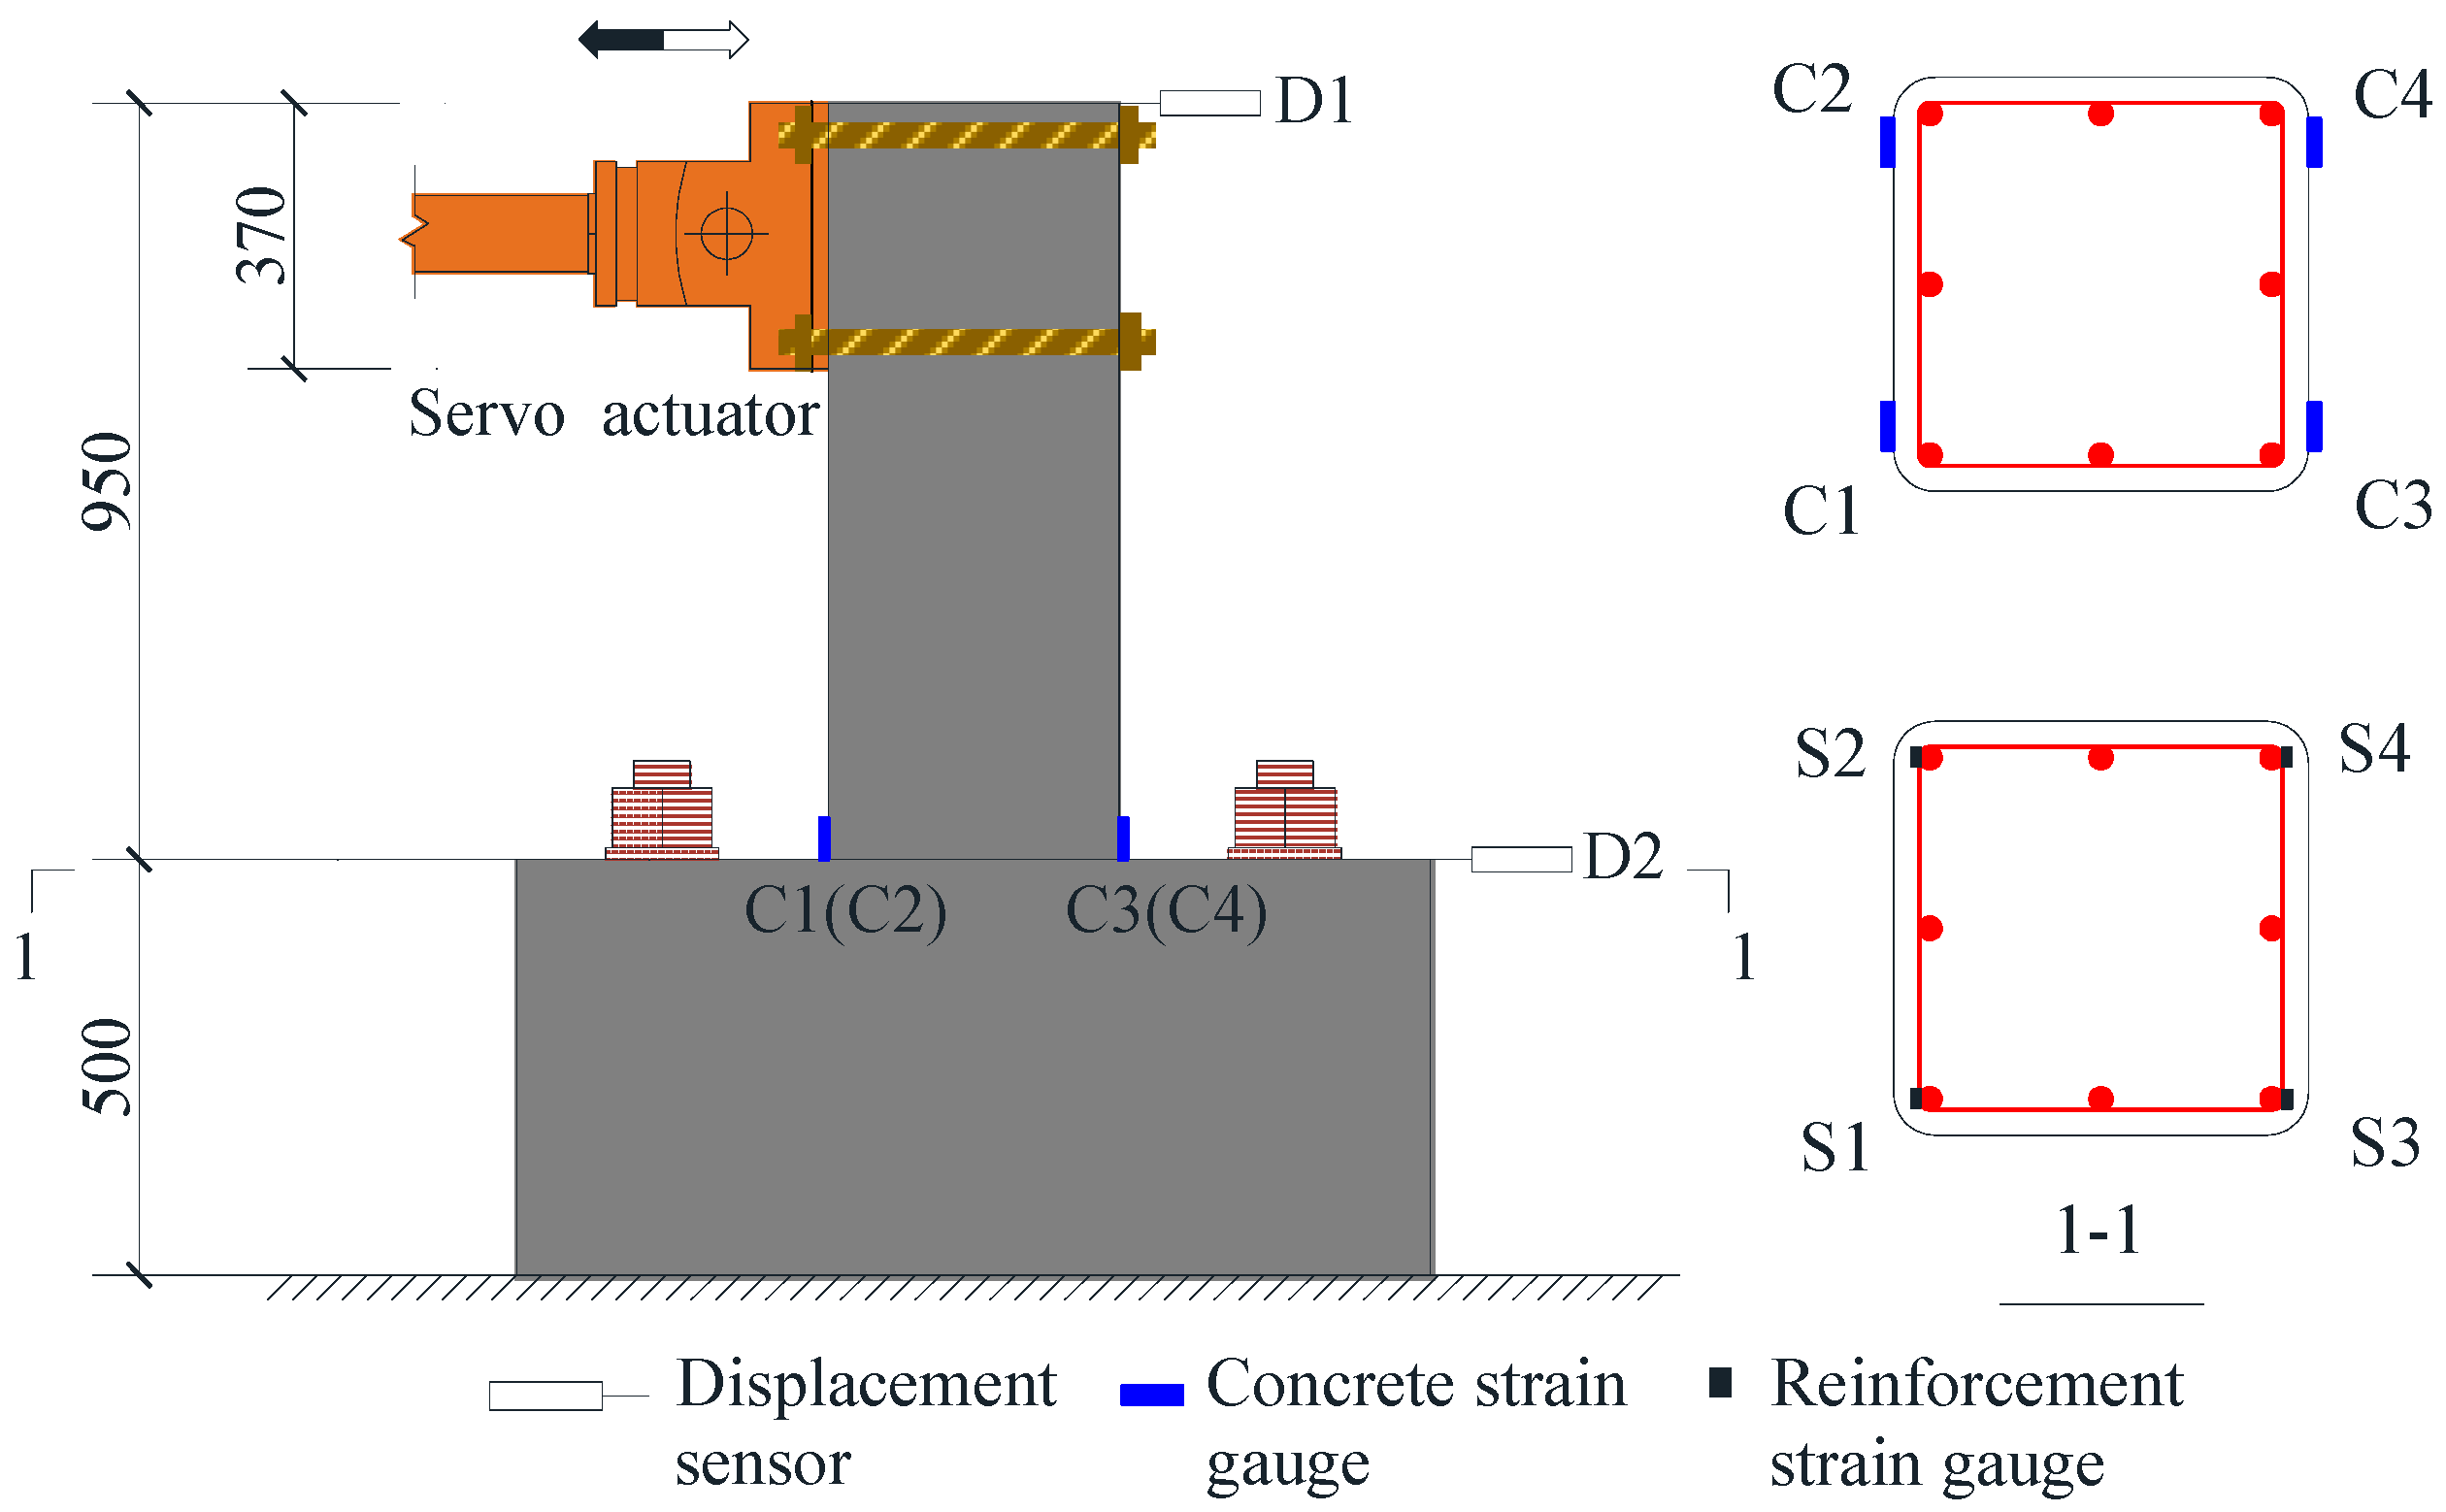
Figure 4 shows schematically the measurements arranged in this study. It can be seen that two displacement meters, i.e., D1 and D2, are placed on top of the column and the foundation, respectively, to monitor their horizontal displacements during the test. In addition, a total of eight strain gauges are mounted to measure the strain of concrete and rebar, among which C1–C4 denote the ones for concrete, and S1–S4 are for longitudinal reinforcements.
Figure 4. Measurements in the test.
Buildings 15 00322 g004

2.3. Test Procedure

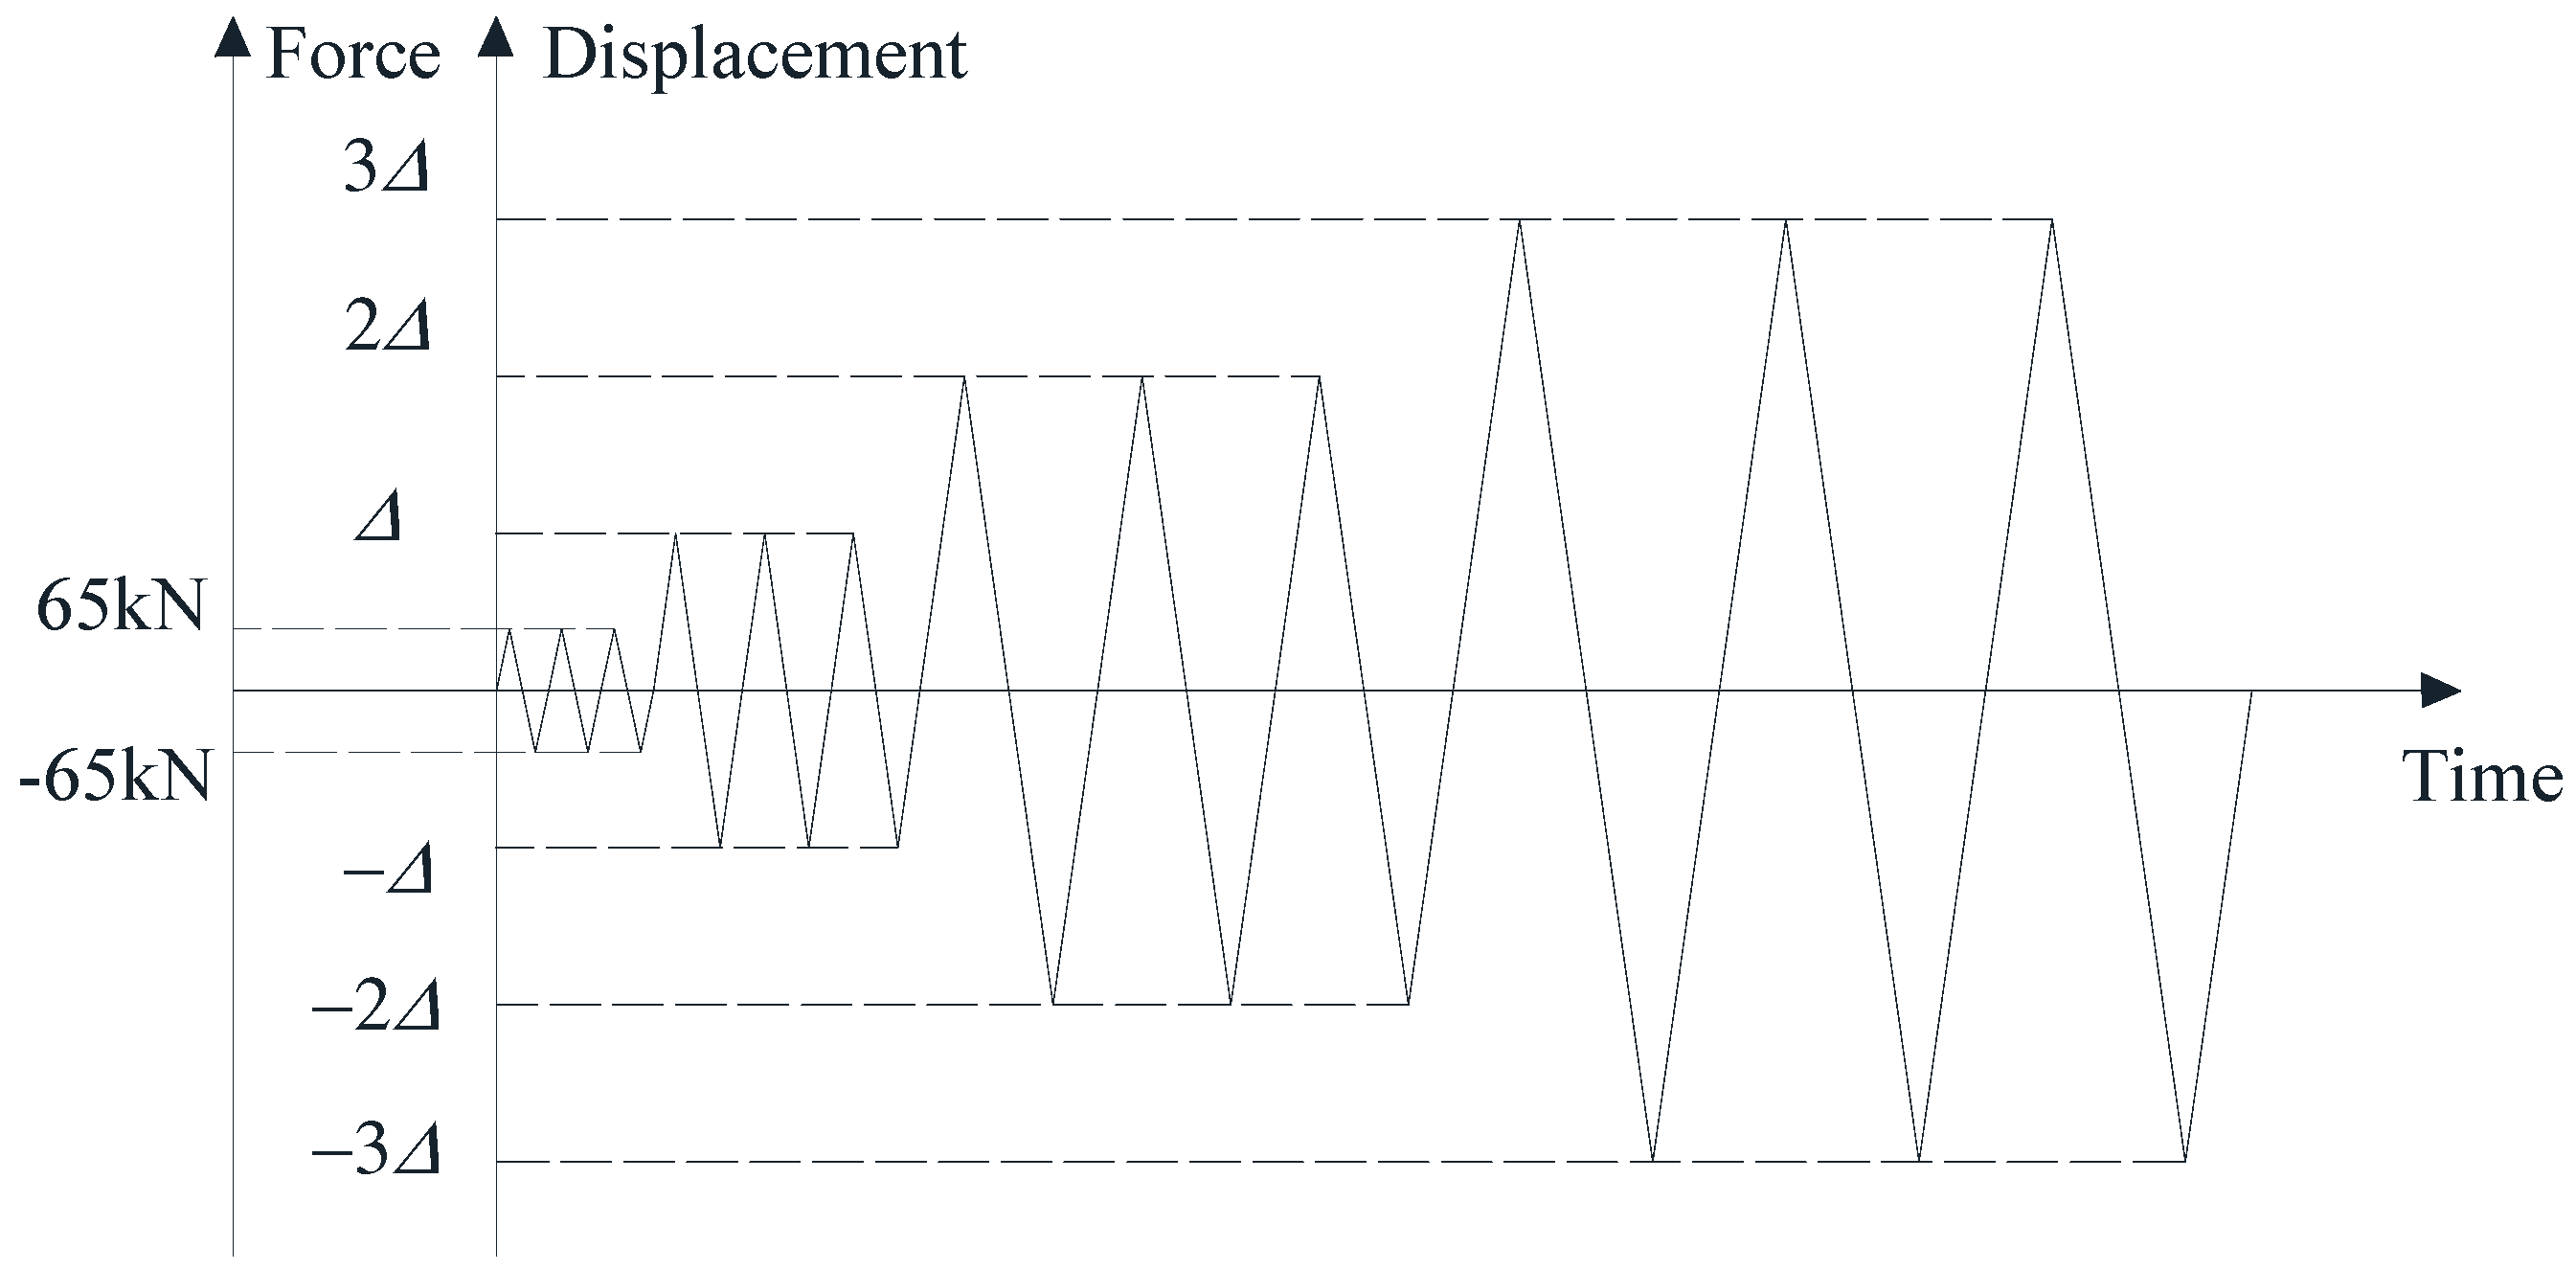
The load-displacement control is adopted to apply the cyclic lateral load [40], i.e., the load control is used at the first stage while the displacement control is alternatively employed at the second stage. Figure 5 shows schematically the loading protocol actually executed in the test, where Δ represents the increment of displacement amplitude. In order to investigate different damage-developing processes, different increments, i.e., Δ1 and Δ2, are adopted for SC1 and SC2, respectively.
From Figure 5, it can be seen that before yielding the force is exerted up to 65 kN and after yielding the displacement magnitude is applied as a multiple of Δ. Moreover, for each loading level, three cycles are repeated to investigate the strength degradation of the specimen. The test stops when the specimen fails or its strength drops below 85% of the lateral bearing capacity. Note that the force or displacement is positive when the specimen is pushed; otherwise, it is negative.

2.4. Test Results

2.4.1. Damage Process

No cracks occurred when SC1 was loaded to 65 kN, indicating that it was basically elastic during the first loading stage. After that, its damage statuses under different displacement magnitudes are shown in Figure 6, where the number in the bracket denotes the cycle number. As seen in Figure 6a, three primary oblique cracks appeared along the height of the column and one horizontal crack developed in its lower region when SC1 was first loaded to Δ1. In addition, cracks also emerged on the surface of the foundation beam. Subsequently, when SC1 was first loaded to 2Δ1, a number of cross cracks occurred due to previous cyclic loads, as seen in Figure 6b. Moreover, more major and minor cracks formed on the surface of the column and foundation beam, demonstrating clearly the damage progression of the specimen. Afterwards, when SC1 was first loaded to 3Δ1, cracks were more densely distributed on the specimen, as shown in Figure 6c. However, no obvious concrete spalling happened.
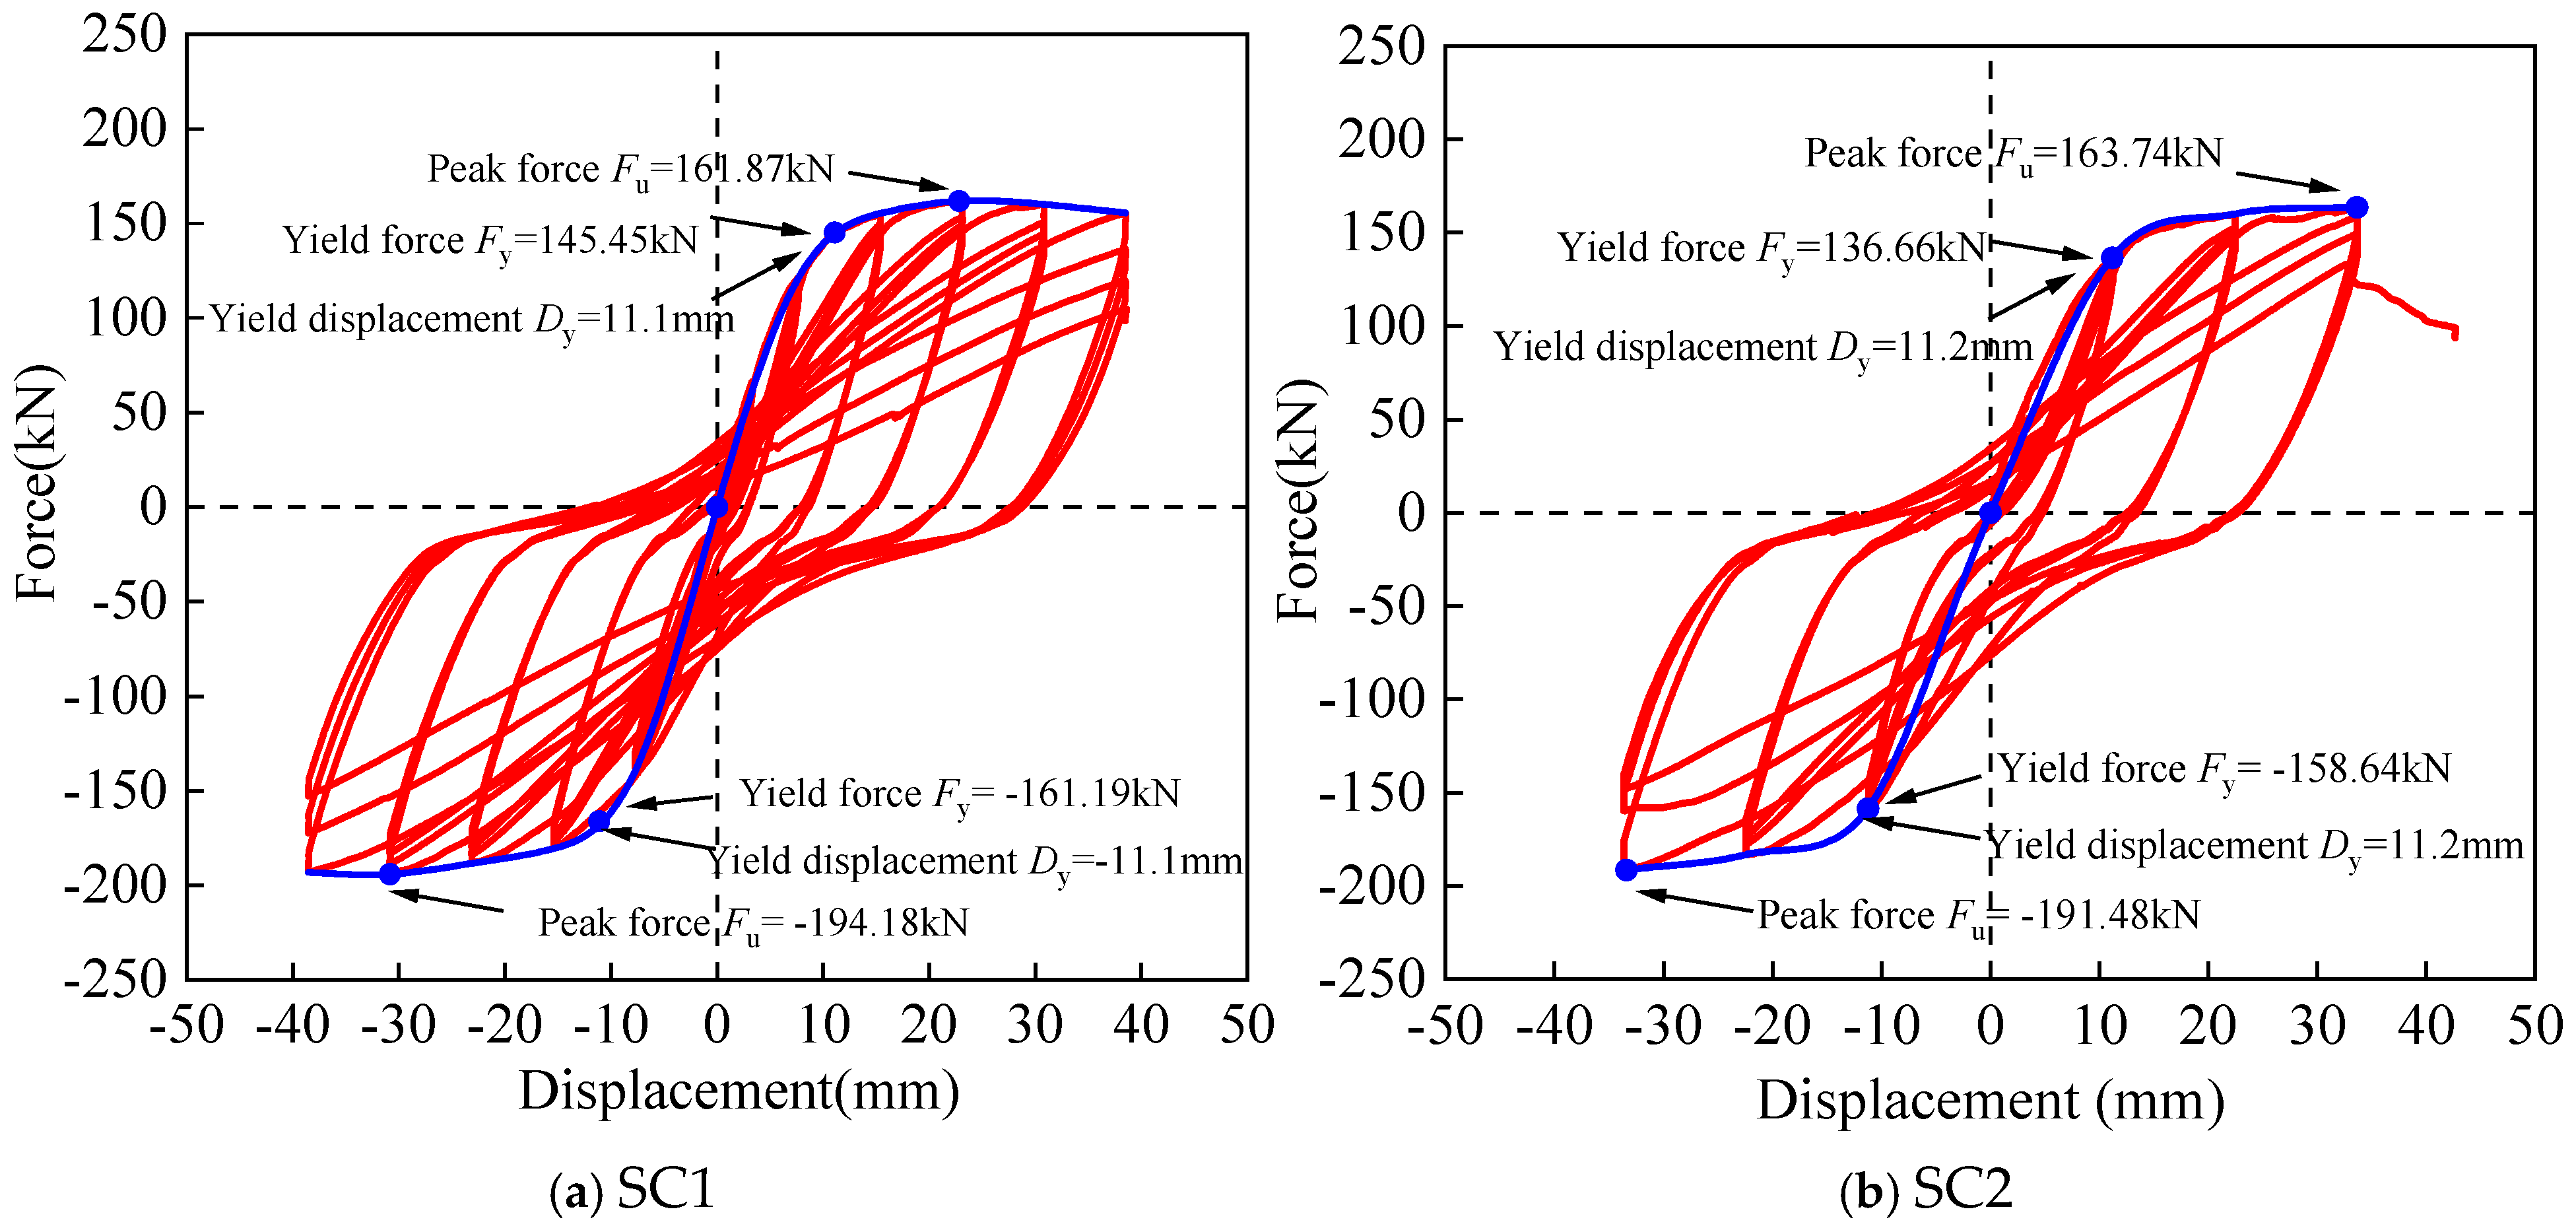
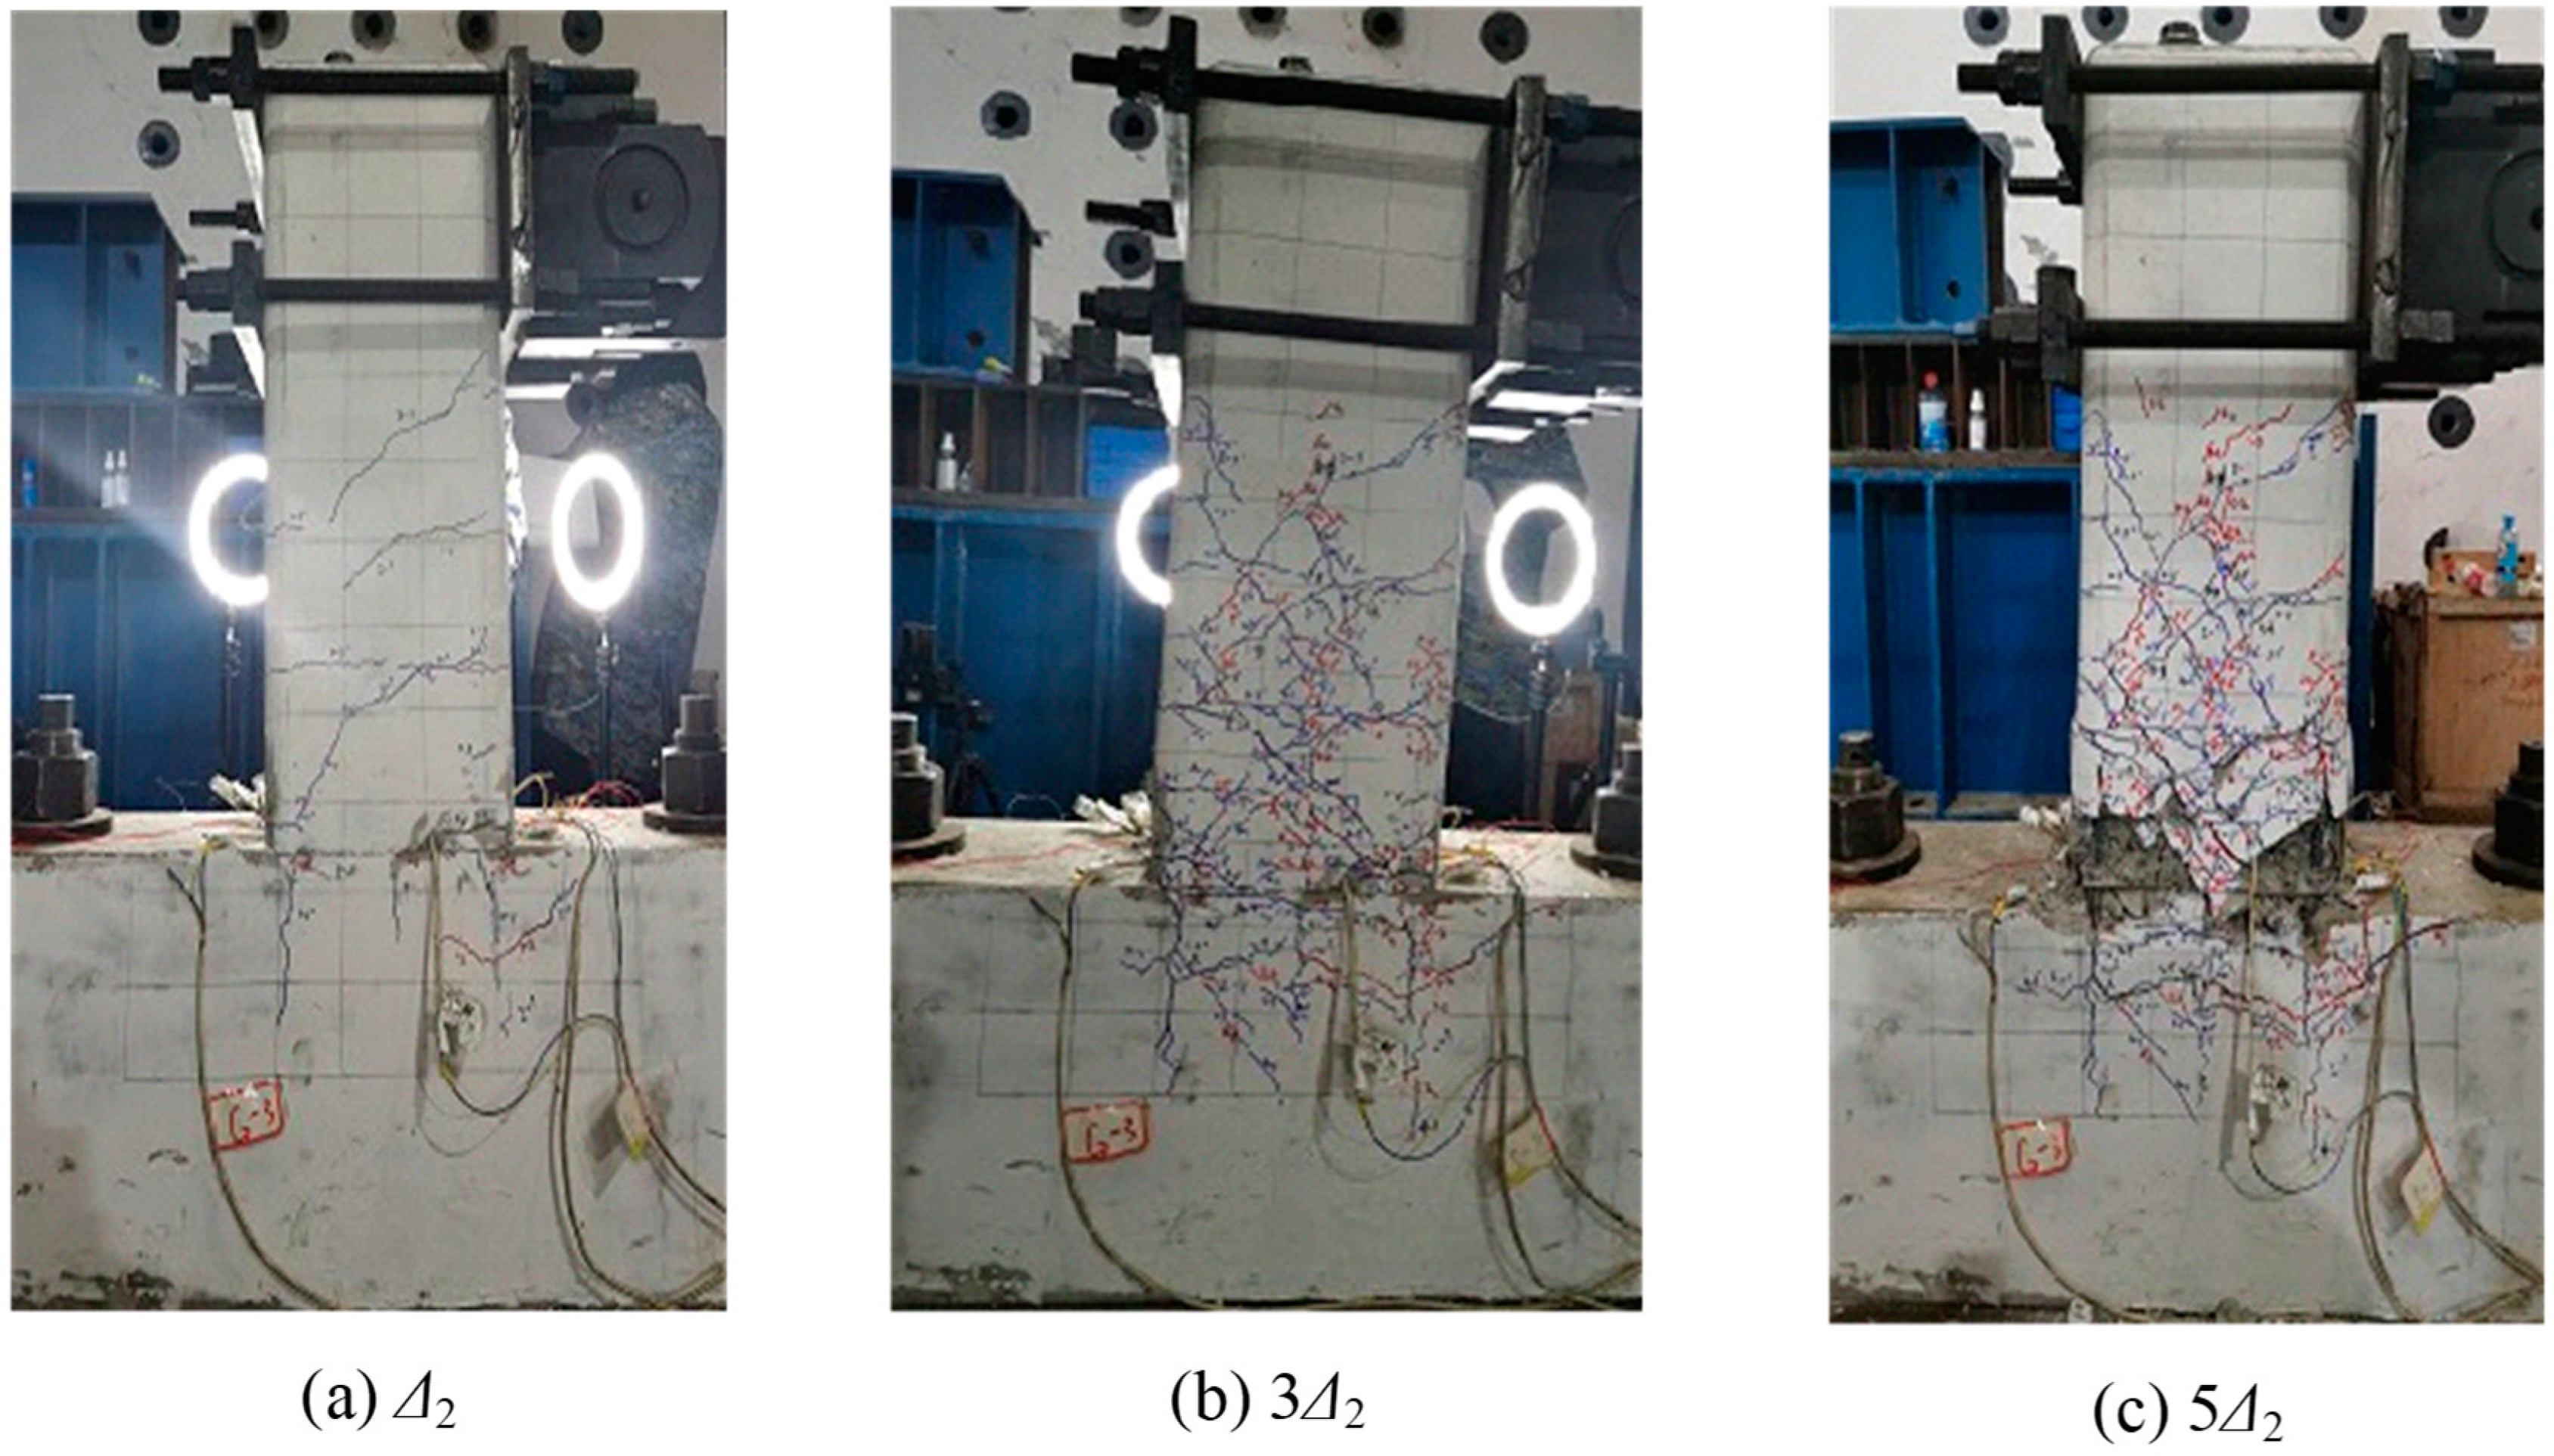
Figure 7 shows the damage status of SC2 under different displacement magnitudes. By comparing Figure 6 and Figure 7, it can be found that the two specimens underwent similar damage processes under cyclic loading, except that SC2 seems to experience more severe damage since concrete spalling began to appear when it was loaded to 3Δ2, as seen in Figure 7b. However, it is worth noting that the two specimens actually have different values of yield displacement, as seen in Figure 8. Moreover, when it was loaded to 5Δ2, concrete spalling occurred in the wider region at the column bottom accompanied by reinforcement exposure as well.

2.4.2. Load-Displacement Curves

Figure 8 plots the load-displacement hysteresis curves of the two specimens. It can be seen that in the early stage, the hysteresis curves are plump, showing that the damage to the specimens is minimal. However, the hysteresis curves show an obvious pinching effect as the load increases, indicating damage development of the specimens. In addition, obvious strength degradation can be observed when the displacement is relatively large. Figure 8 also gives the corresponding skeleton curves of the two specimens, on which the yield points are approximately identified using the plotting method [41]. It can be found that the peak forces of the two specimens are nearly equal although they experienced different damage-developing processes. In addition, note that the peak forces of each specimen differ in the two directions, which is due to the Bauschinger effect of rebars or possible slip in the test device.
Figure 8. Load-displacement hysteresis curve.
Buildings 15 00322 g008

3. Crack Image Acquisition

3.1. Photographing Scheme

During the cyclic test, the column surface opposite to that shown in Figure 6 and Figure 7 was selected to obtain crack images using the Huawei P40Pro cell phone, whose parameters are listed in Table 2. For the convenience of further extracting the crack information, the phone was kept parallel to the surface of the column, making its optical axis always perpendicular to the column surface.
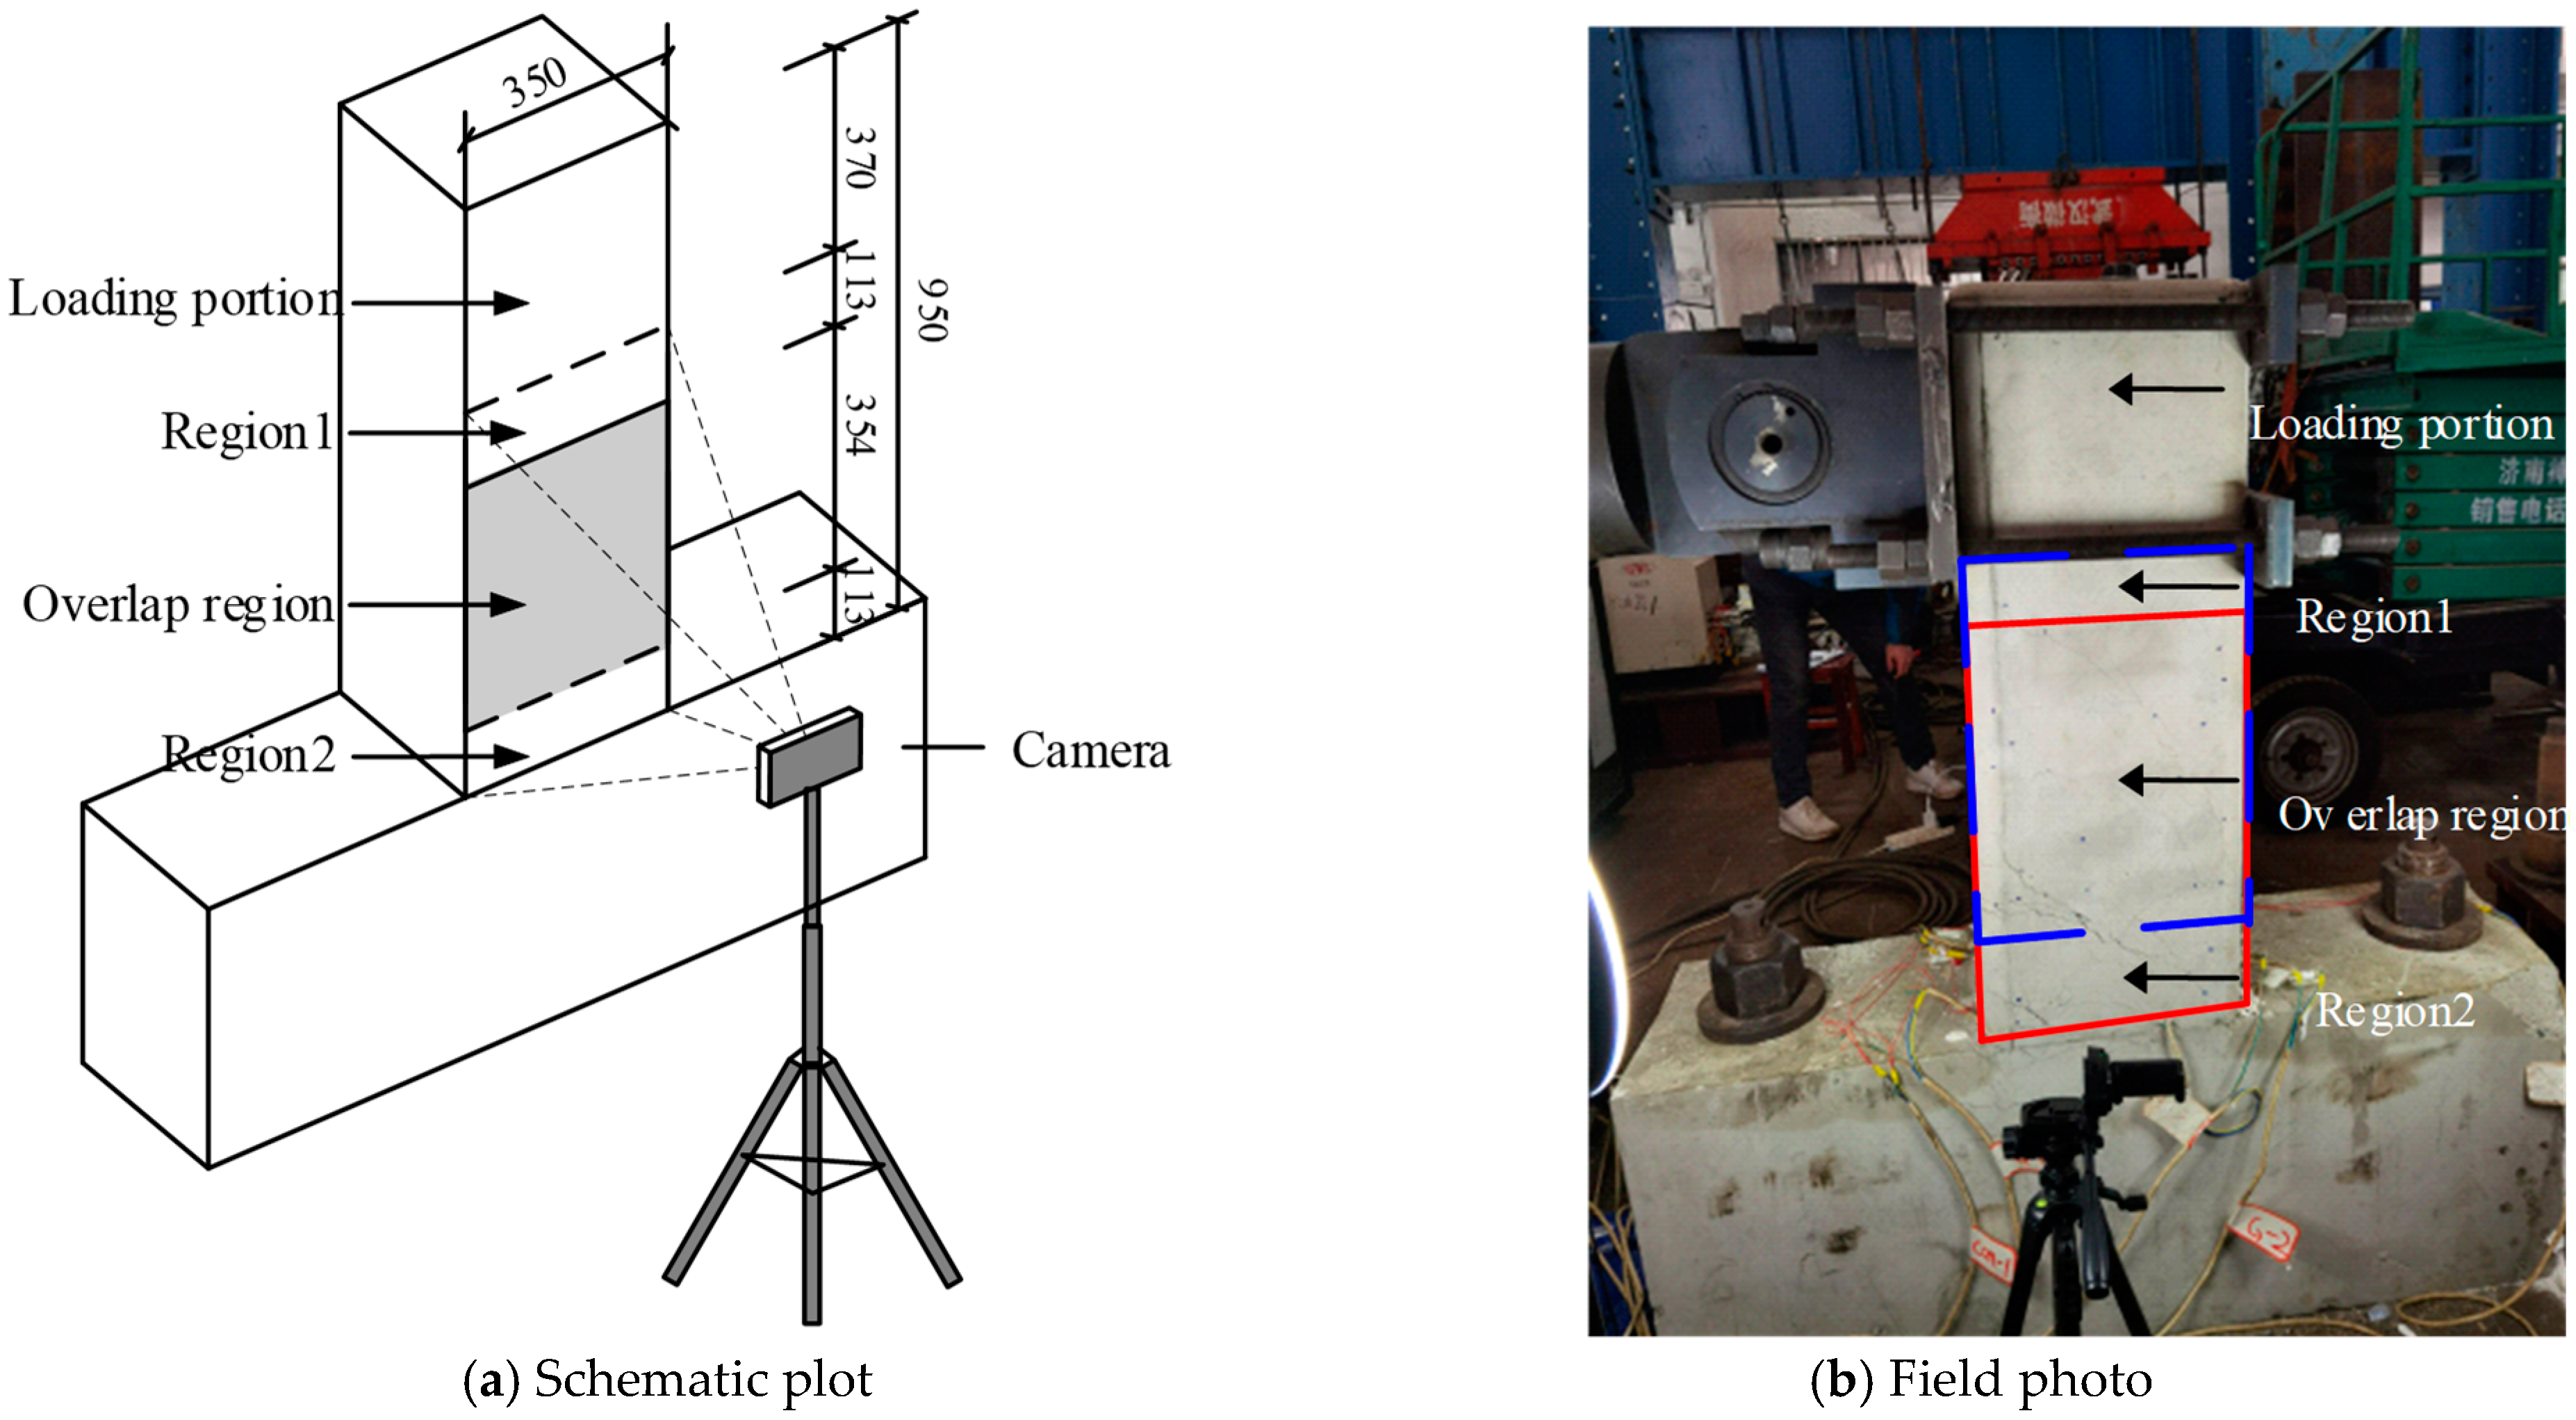
Considering the large column surface as opposed to the small cracks on the surface, the image acquisition using the cell phone cannot be completed at one time. Some methods, such as Crack Monitoring from Motion (CMfM) [42], are not adopted in this study since an additional complex setup is generally required. Therefore, the partition photographing scheme is proposed in this study to acquire high-resolution images. As shown in Figure 9, the column surface consists of two portions: one is for loading and the other is for photographing. The photographing portion is further divided into two regions (denoted as Region 1 and Region 2) having the same size of 350 mm × 467 mm with an overlap length of 354 mm. The phone is fixed on an adjustable tripod, which can move in a vertical direction. The distance between the phone and the column surface is 320 mm. By moving the tripod vertically to appropriate positions, the two regions can be photographed in turn. It is worth noting that the partition photographing scheme proposed in this study can be theoretically applied to photograph any large object so long as it is split into more regions.
For each specimen, crack images were acquired at the positive and negative displacement magnitudes for each cycle. Note that before yielding, there is no need to take the images since no obvious cracks occur on the surface. In addition, crack images were only taken at the first three displacement levels for SC2, since it was damaged severely when the lateral displacement exceeded 3Δ2, as seen in Figure 7.

3.2. Crack Image Stitching

After crack images for the two regions are taken, they are further combined into a whole one for subsequent crack segmentation. There are various image stitching algorithms proposed in the past decades [43,44,45], among which the one based on the feature points proposed by Brown [46] is selected in this study due to its high accuracy.
The image stitching is conducted as follows: (1) use the Harris corner detection operator [43] to obtain key points of each image; (2) retain the key points with the most distinctive features through the adaptive non-maximum suppression; (3) downsample the region with a size of 40 pixels around each key point and flatten the result into a one-dimensional vector as the feature description vector; (4) employ the Euclidean distance to screen out the pairing key points between the two images; (5) use the random sample consensus strategy [47] to obtain the projection transformation matrix for stitching images; (6) synthesize the new image using the cross-dissolution method; and (7) use a weighted average fusion algorithm to suppress potential stitching artifacts [48].
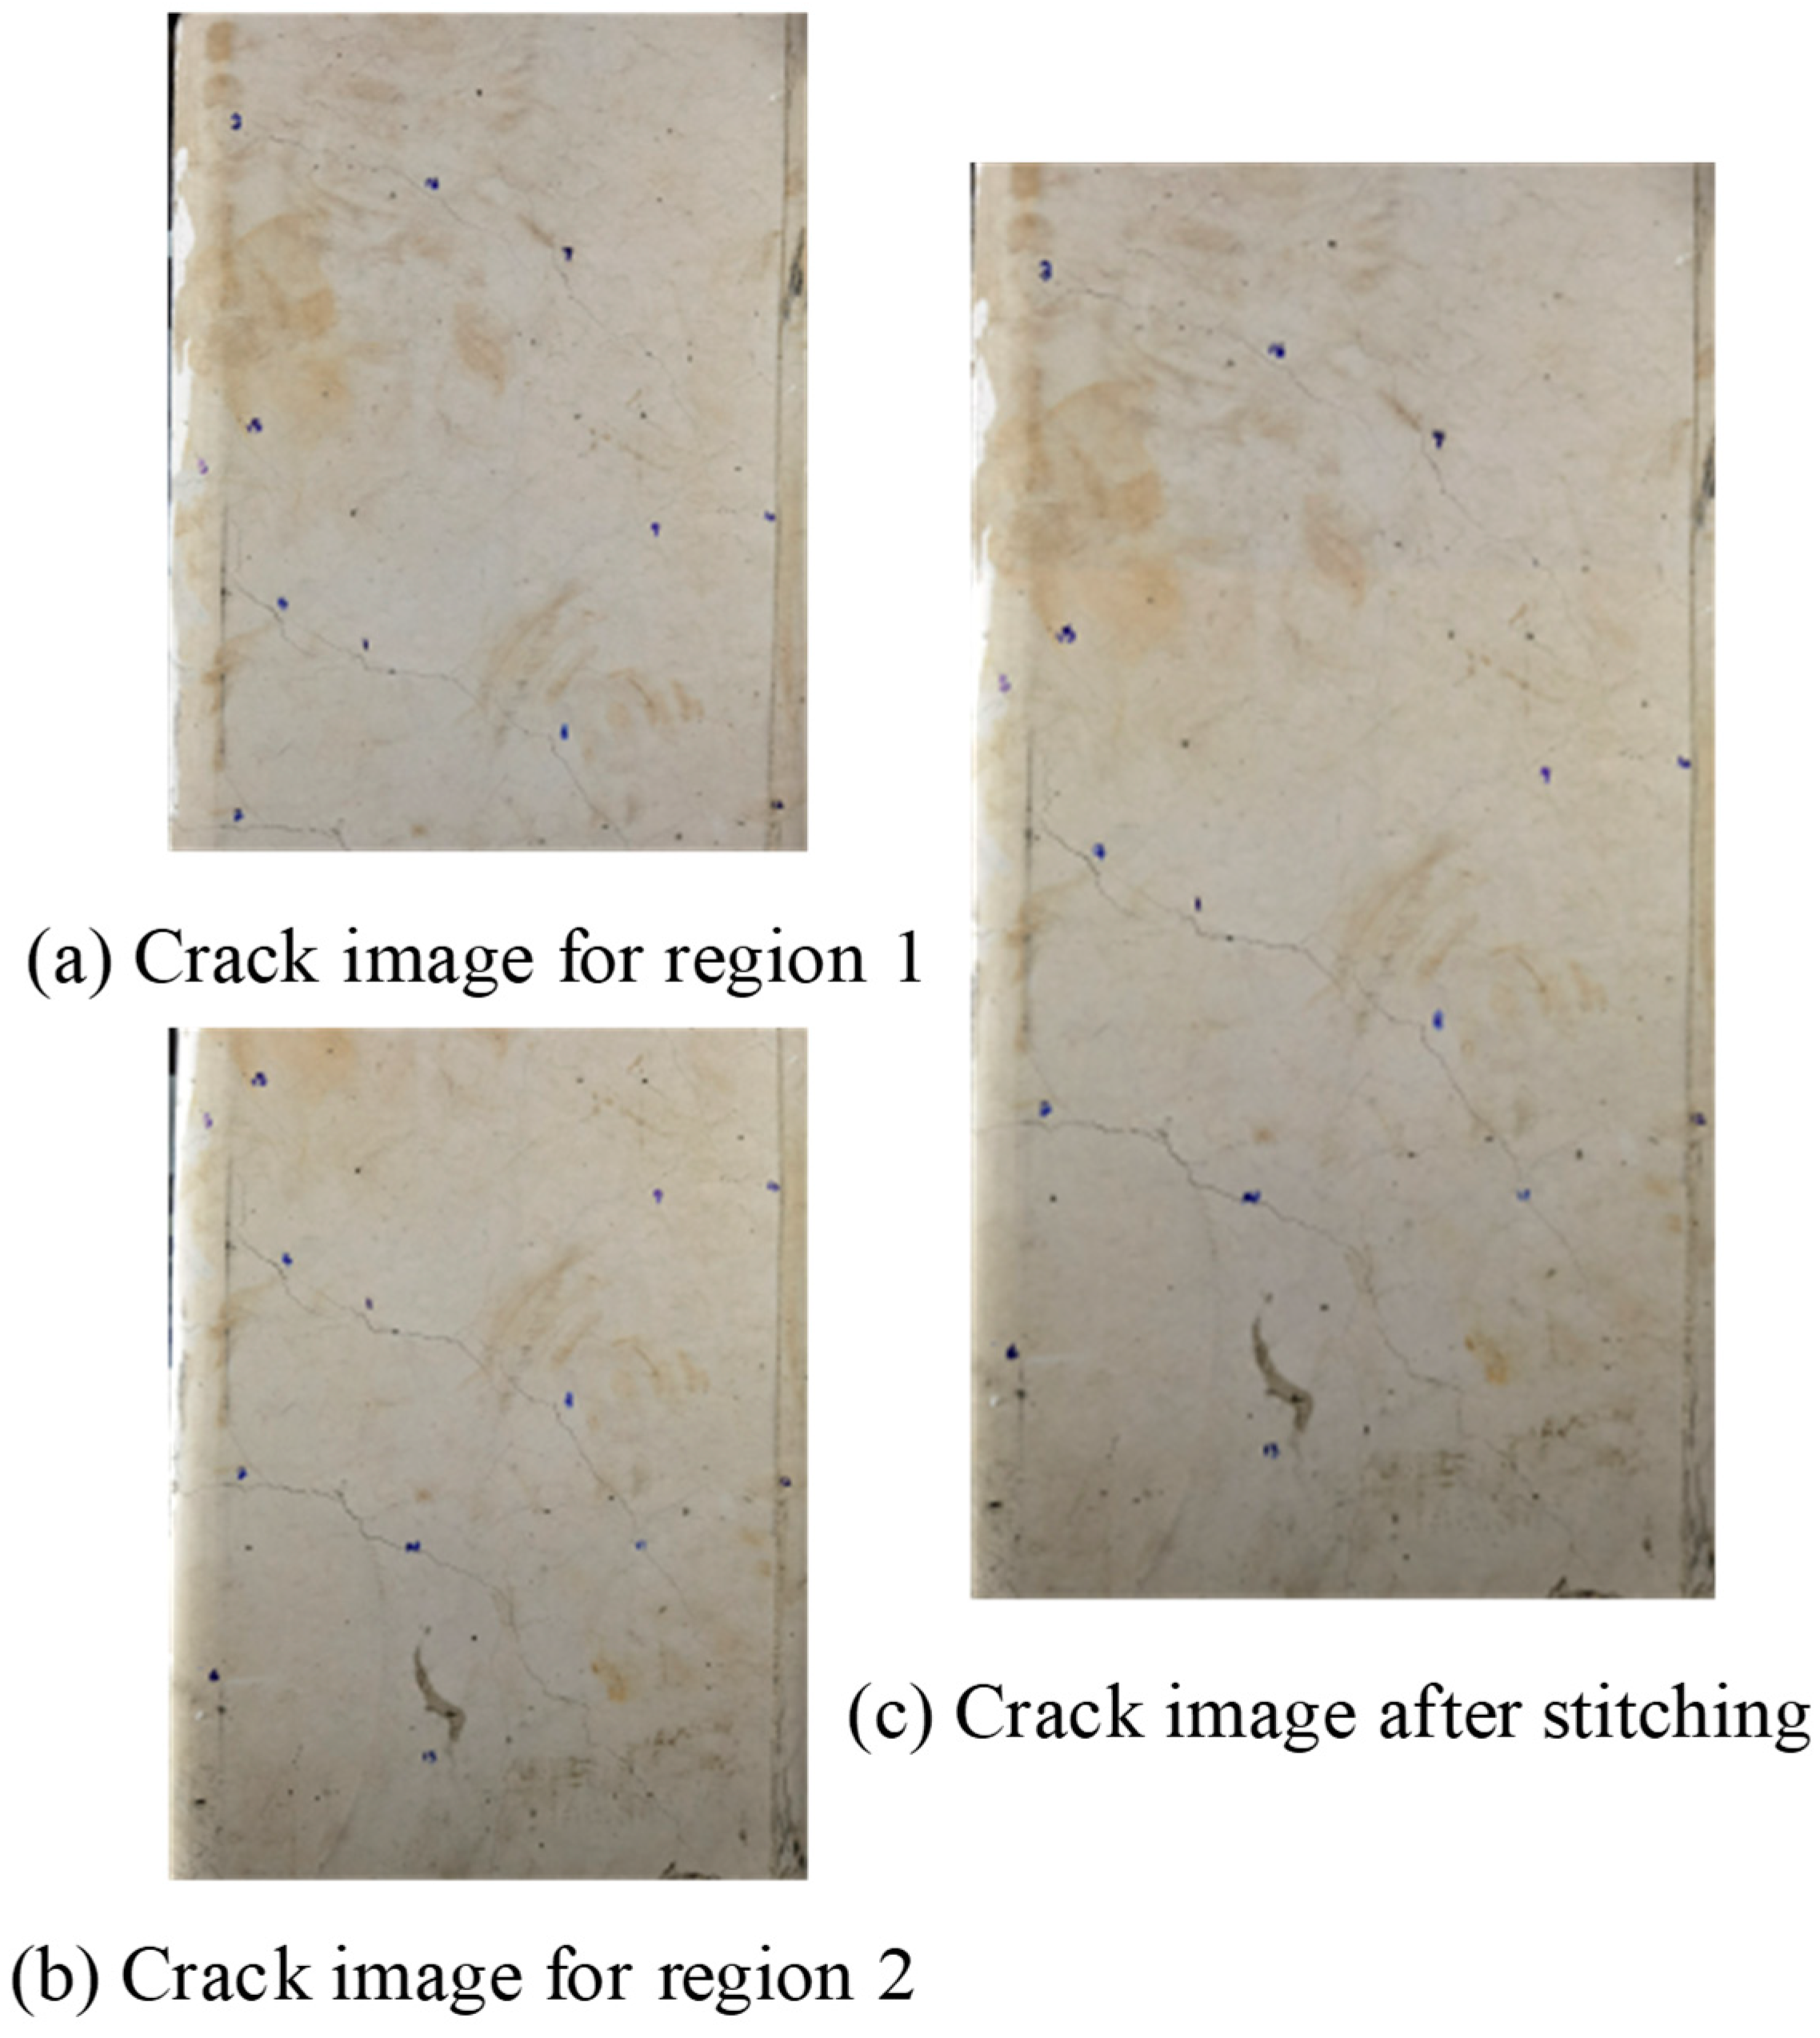
Figure 10 shows an example of crack image stitching through the above procedure. The resolutions of the two images for the two regions are both 6144 × 8192. After stitching, the resulting image has a resolution of 6144 × 12,288. It can be seen that the image stitching algorithm adopted is well capable of stitching the images taken through the partition photographing scheme proposed in this study. Finally, a total of 18 stitched crack images were obtained for each specimen.

4. Crack Segmentation Based on the Enhanced U-Net

4.1. Architecture of the Network

4.1.1. Architecture of the Original U-Net

Semantic segmentation is an important task of computer vision concentrating on assigning class labels to each pixel. The U-Net proposed in 2015 [17] is widely used in the field of semantic segmentation due to its simplicity and high accuracy.
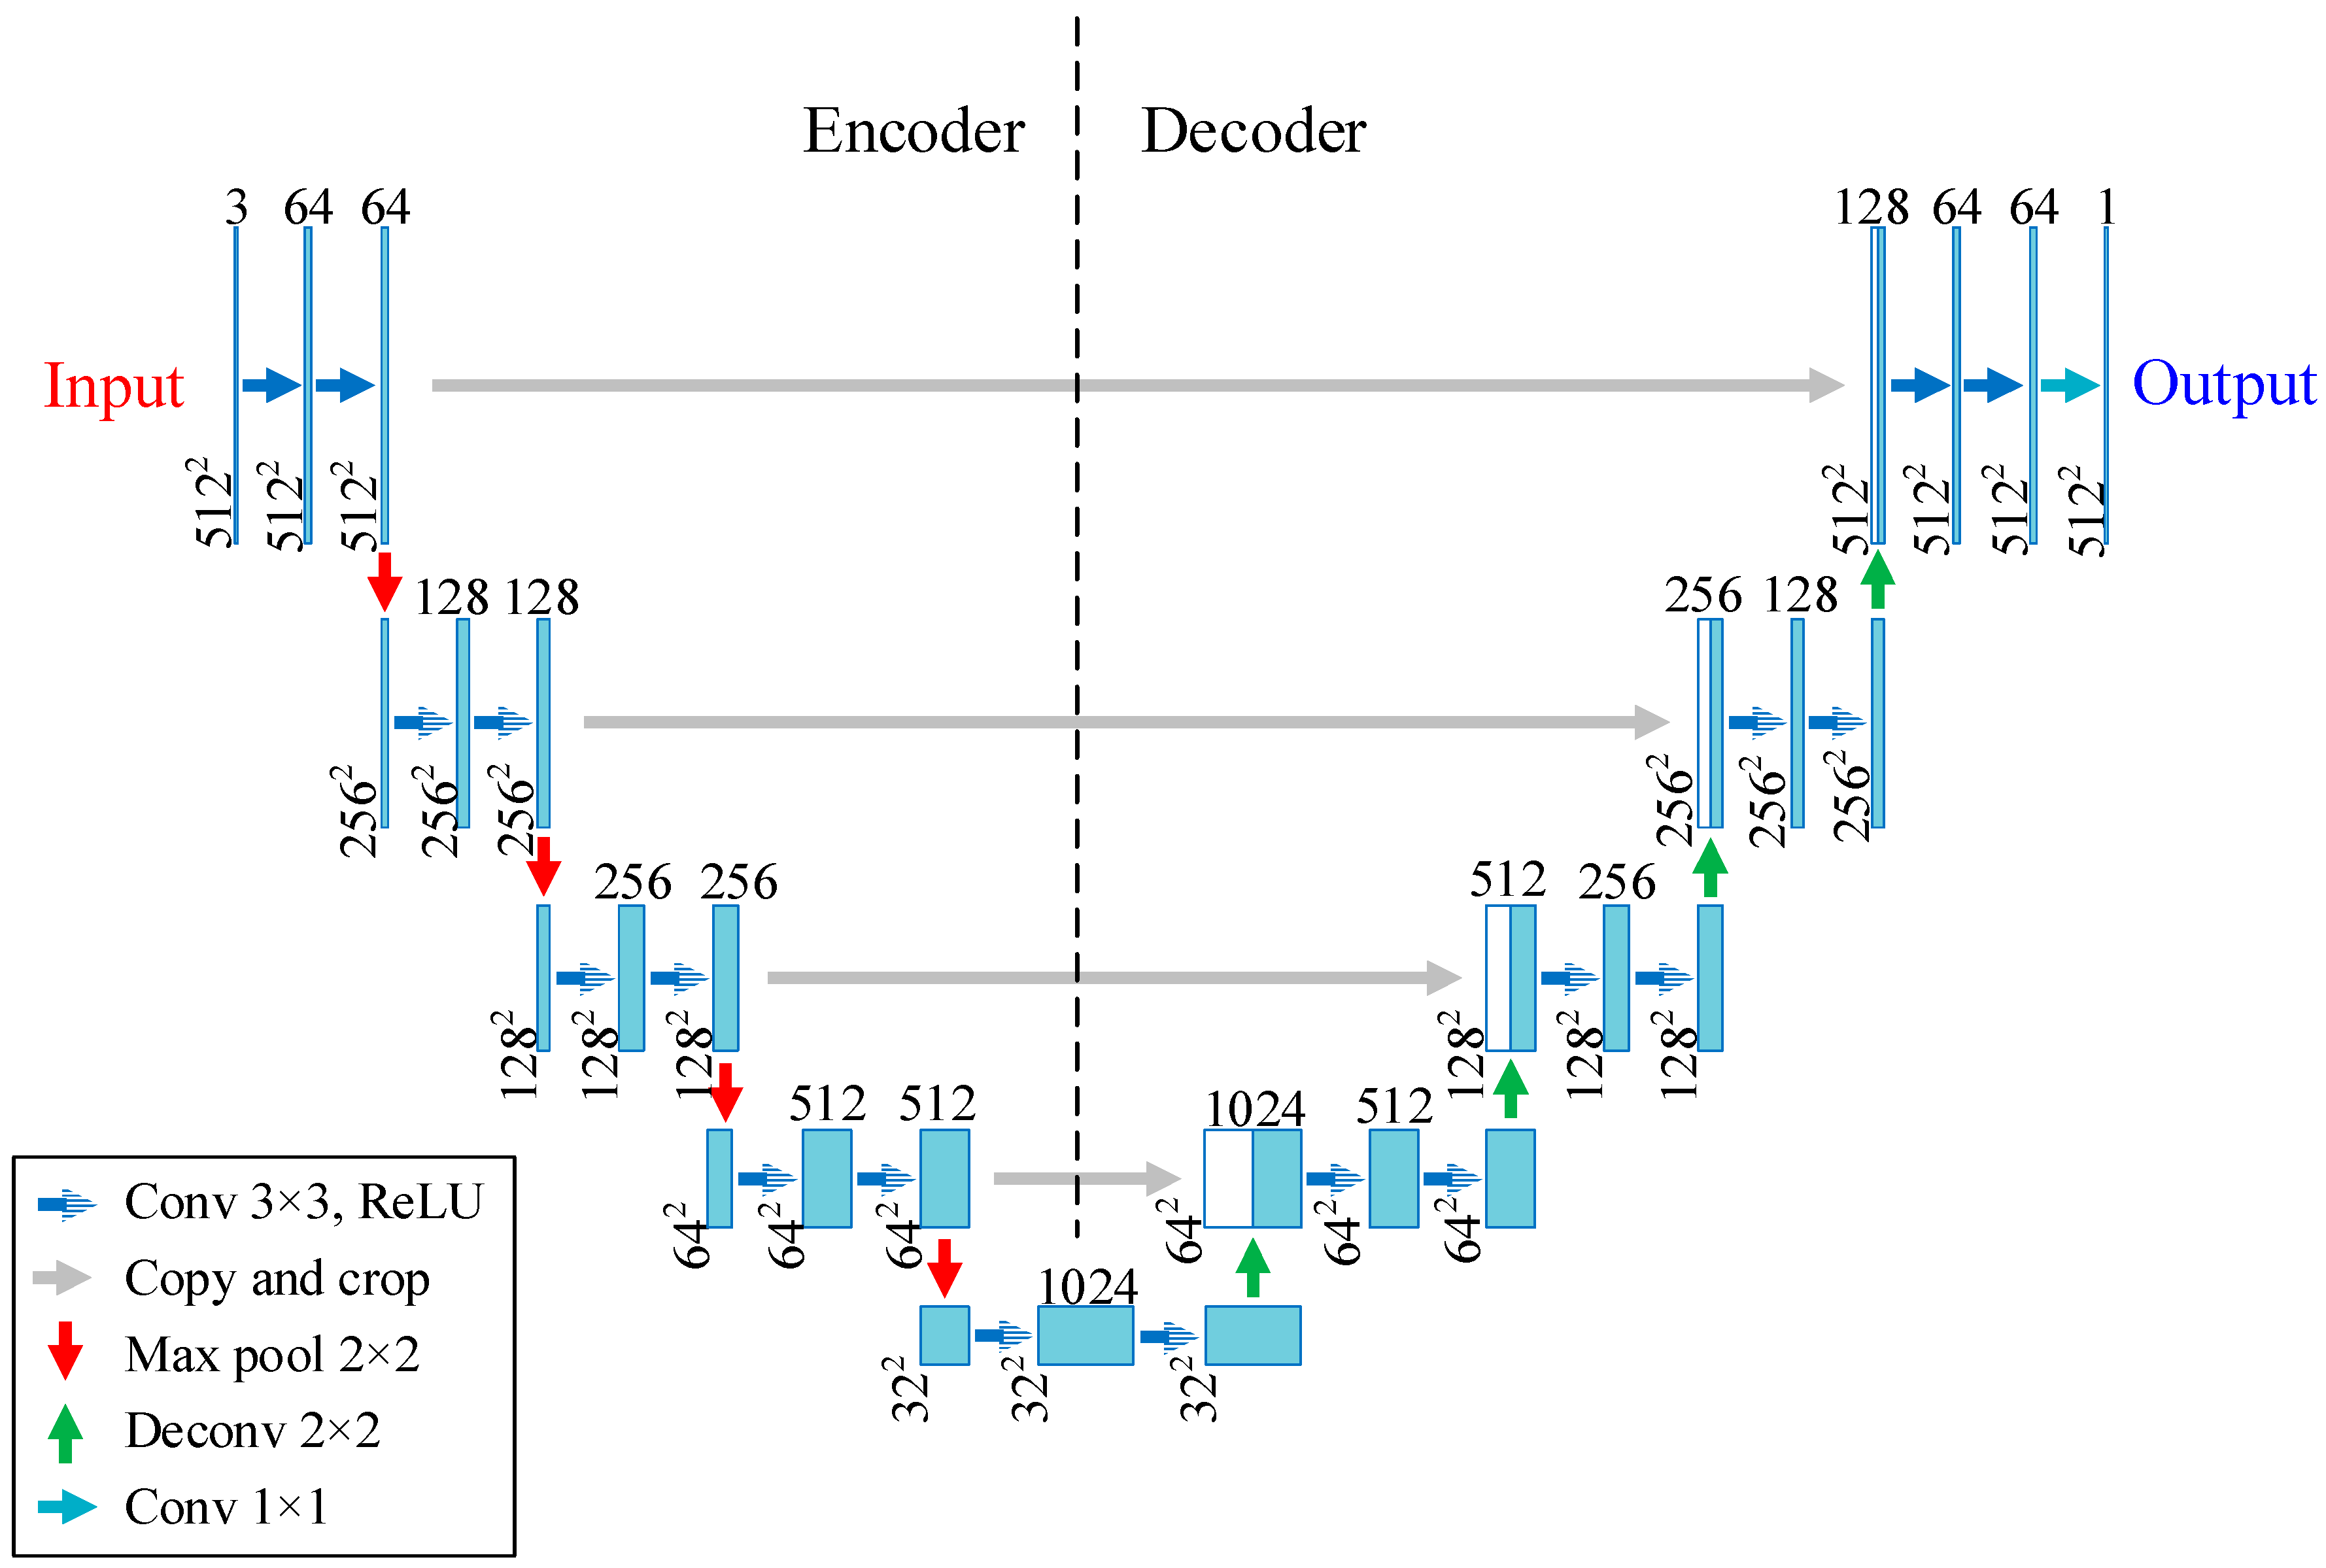
Figure 11 shows the architecture of the original U-Net, which is characterized by the U-shaped encoder-decoder structure and skip connections. The encoder consists of a series of convolution layers, activation layers, and pooling layers. Through repetitive manipulations of convolution, activation, and pooling, the features of the input image are extracted at different scales. In contrast to the encoder, the decoder is composed of a number of deconvolution layers, skip connections, and convolution layers. The deconvolution layer is used to restore the size of features so that they can align and concatenate with the features extracted in the encoder.

4.1.2. Architecture of the Proposed DA-CrackNet

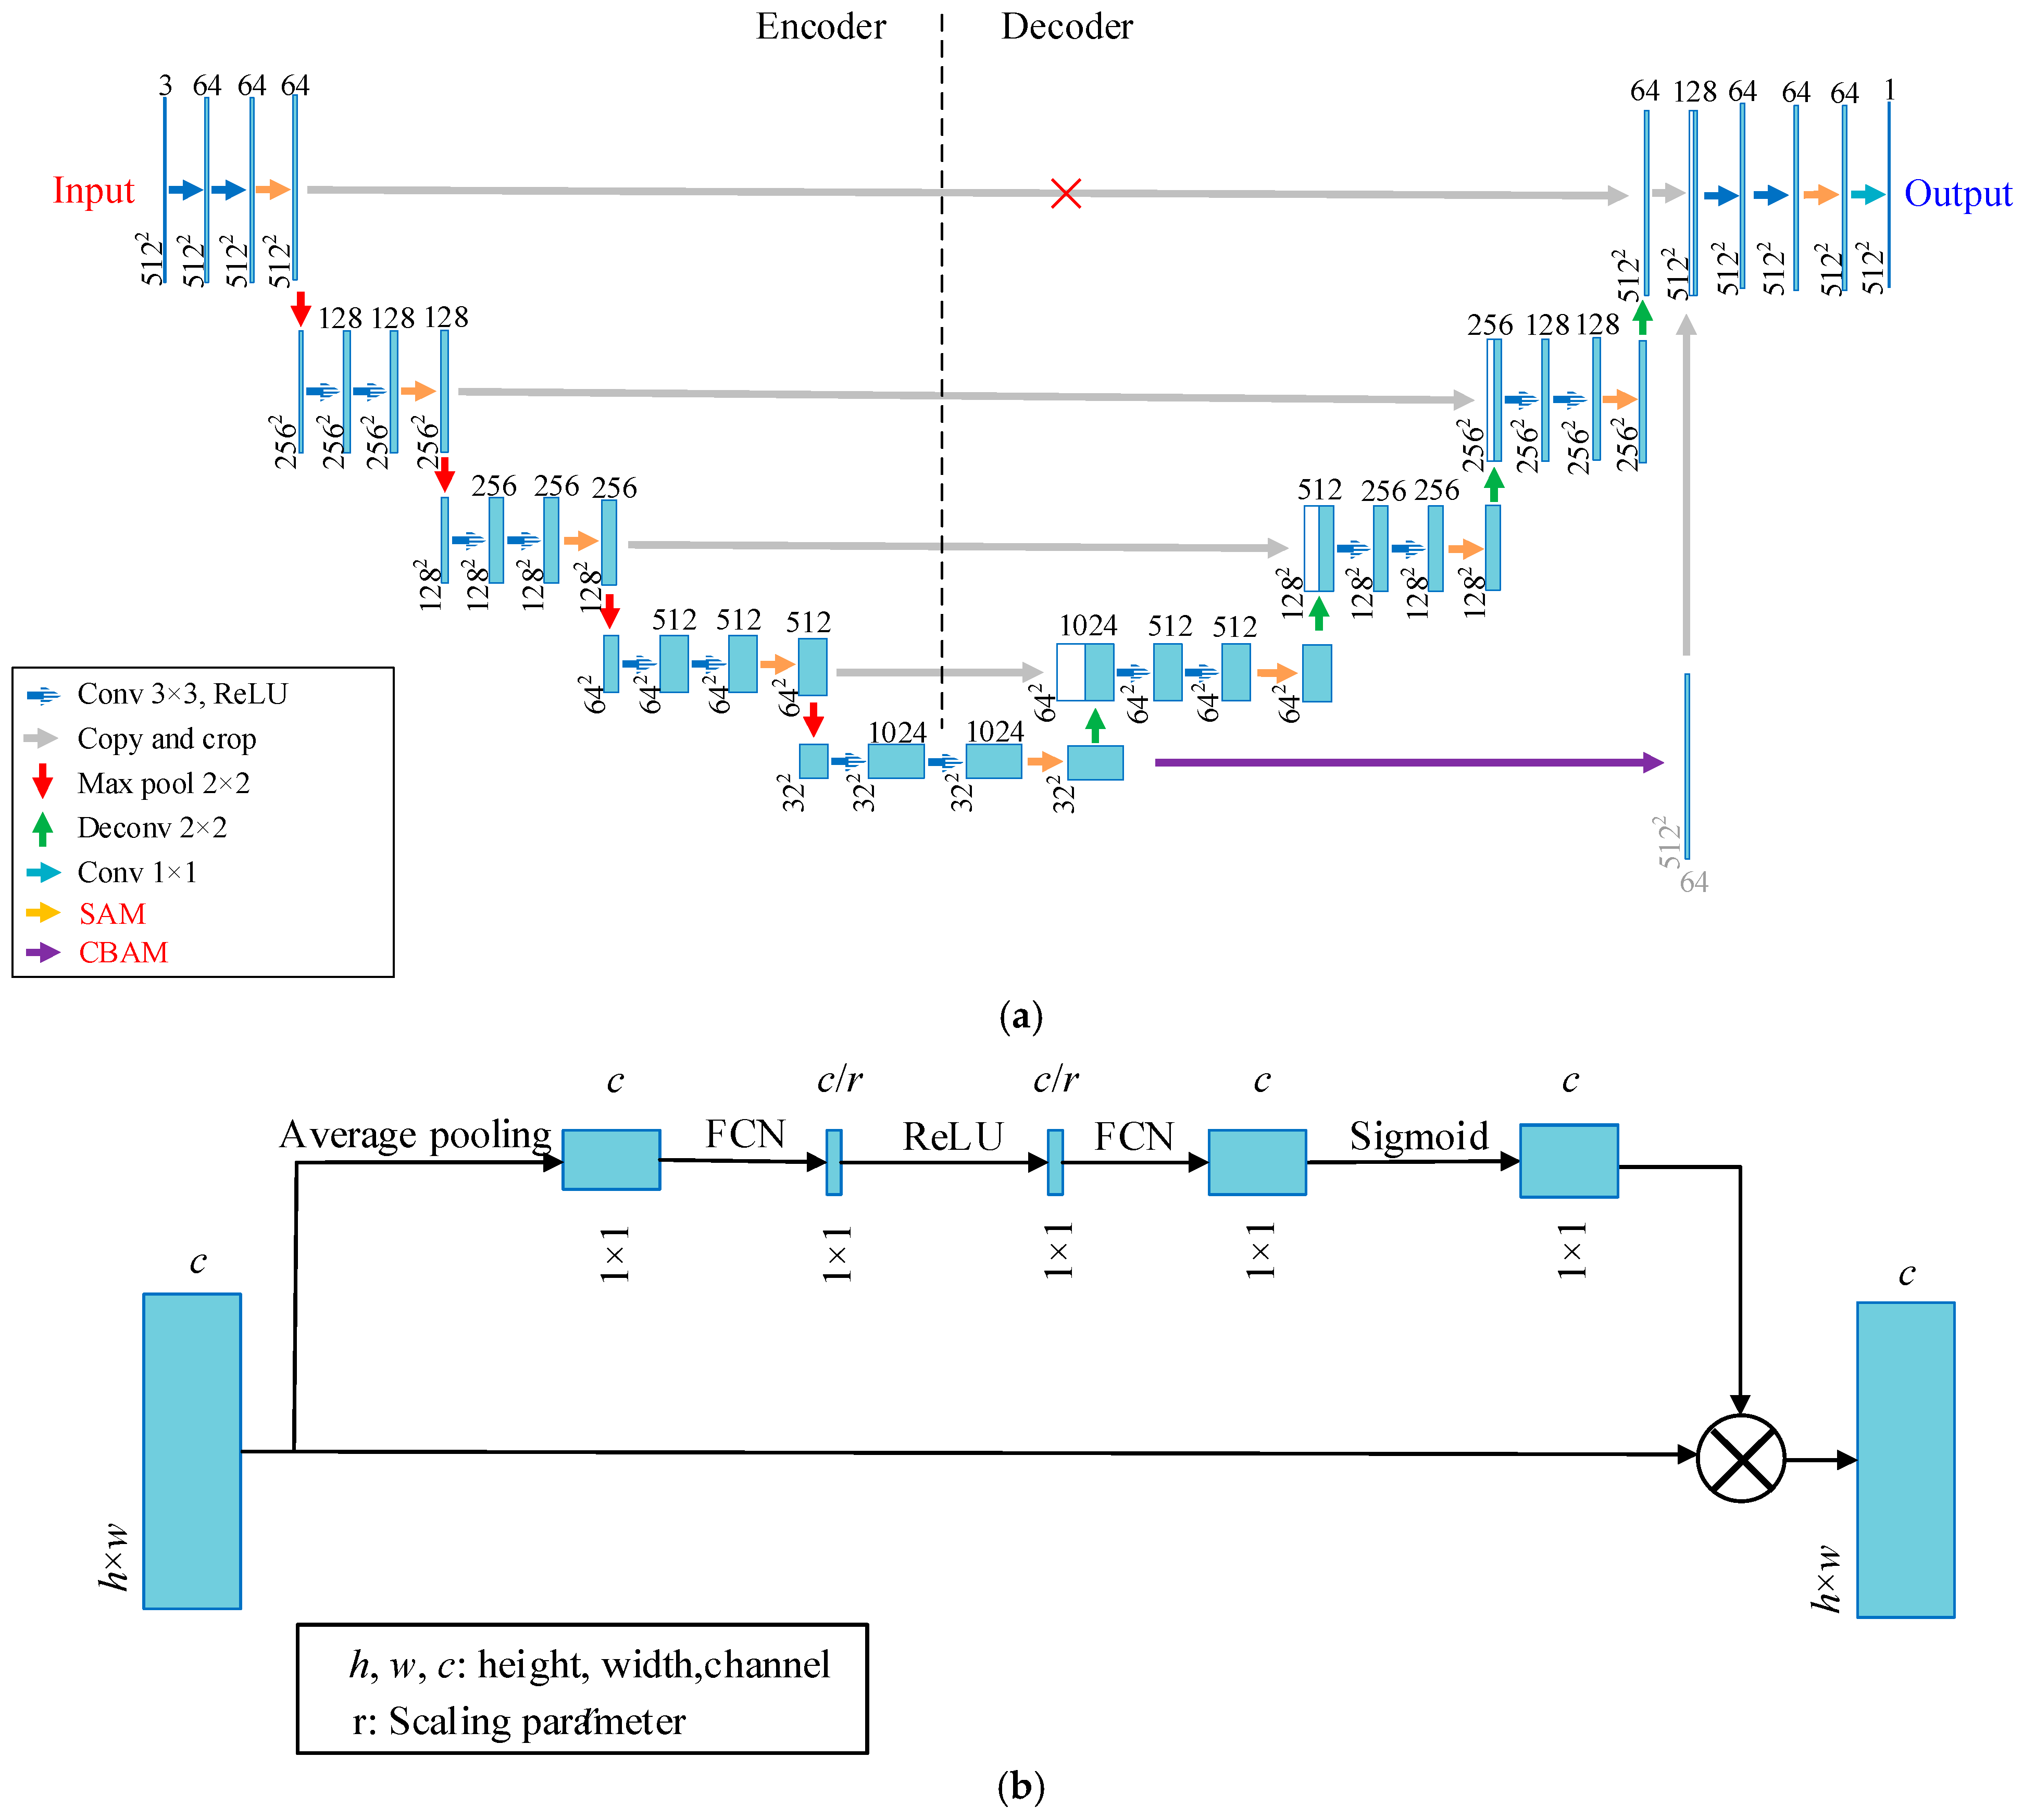
Although the U-Net has had great success in the segmentation of normal objects in images, difficulties are likely to be encountered in the segmentation of tiny objects, e.g., the cracks involved in this study. As for the cracks, some tiny crack pixels would be lost in the process of pooling, resulting in discontinuous segmentation [49,50]. In addition, some U-Net variants, including Attention U-Net [51], UNet++ [52], U-Net3+ [53], and Transunet [54], also have their own limitations. For example, Attention U-Net adds the Attention Gate module to skip links to highlight significant image areas and suppress task-independent feature responses, but the recognition of small cracks is still insufficient. To address this issue, the original U-Net is enhanced by adding a dual-attention mechanism to develop a deep learning model for crack segmentation, which is referred to as DA-CrackNet in this study.
Figure 12 presents the architecture of the DA-CrackNet proposed in this study. The dual-attention mechanism includes the soft attention mechanism (SAM) [55] and the convolutional block attention mechanism (CBAM) [56]. As shown in Figure 12a, the SAM is embedded in the backbone of the original U-Net to restore the low-level semantic information in tiny cracks, which is then concentrated on the high-level semantic features recovered by the decoder to improve the performance of tiny crack segmentation. Figure 12b shows the details of the SAM, which works by weighting different channels of the image. Specifically, the highly correlated channel is given a larger weight, while the irrelevant channel is given a smaller weight.
Differing from the SAM, the CBAM is connected to the deepest layer to extract the necessary information more efficiently, as seen in Figure 12a. The result of CBAM is connected to the convolution block closest to the output, and the skip connection in the first level is canceled relevantly. As shown in Figure 12c, the CBAM consists of the channel attention mechanism (see Figure 12d) and spatial attention mechanism (see Figure 12e). The former adaptively recalibrates the weight of each channel, which can be seen as an object selection process to determine what to pay attention to. The latter can be regarded as an adaptive spatial region selection mechanism, which focuses on important locations.

4.2. Training and Testing of the Network

4.2.1. Preparation of the Dataset

The crack images acquired previously in Section 3 are used to construct the crack dataset. In accordance with the input requirement of the DA-CrackNet proposed previously, they are first split into smaller ones with the size of 512 × 512 and then labeled using the pixel-level annotation software labelme [57].
In order to improve the performance of the proposed network, data augmentation is considered to increase the number of samples in the crack dataset. In addition to the commonly used approaches, such as flipping and rotation [58], a new augmentation method based on the random erasing algorithm [59], i.e., the fill-crack method, is proposed in this study. Figure 13 illustrates the procedure of the fill-crack method based on the crack image and the corresponding crack mask: (1) choose cracks randomly in the crack mask and fill them with black pixels; (2) extract the background color from the crack image; (3) fill cracks chosen in step (1) using the background color extracted; (4) smooth the edges using the inpaint method [60].
After data augmentation, a total of 1267 samples were finally obtained to construct the crack dataset. According to the hold-out method [61], it is randomly divided into the training set, validation set, and testing set with a ratio of 8:1:1.

4.2.2. Training of the Network

The crack dataset is further used to train the DA-CrackNet proposed in this study. For comparison purposes, the original U-Net is also trained using the same dataset. The training is performed on Windows Server 2022. The hardware environment used is AMD Ryzen9 5900X (CPU), NVIDIA RTX 3090 (GPU) with 24 GB VRAM and 64 GB memory; the software environment used includes Python 3.8.8, PyTorch 1.10.1, CUDA 11.4, and cuDNN 8.1.0.
For crack segmentation, the number of pixels in the background is far more than that of pixels in the crack area. The traditional binary cross entropy (BCE) is widely used as the loss function because it can well resist noise. In addition, the dice loss gives more accurate results for the segmentation of unbalanced datasets. Considering the generalization of BCE loss and the accuracy of dice loss [60,62], the following loss function, i.e., LossBCE+Dice, is finally adopted in this study:
L o s s BCE + Dice = 0.5 L o s s BCE + L o s s Dice
L o s s BCE = i = 1 N y i l o g p i
L o s s Dice = 1 2 i = 1 N y i p i i = 1 N y i + p i
where yi is the real value, pi is the predicted value, and N is the number of pixels.
Considering the VRAM capacity and image size, the batch size is set to 8 and the number of epochs is set to 300. The SGDM optimizer is used, the initial learning rate is set to 10−3, and the momentum is set to 0.9 to accelerate the convergence. In addition, the cosine annealing strategy is adopted to adjust the learning rate to suppress overfitting, and the minimum learning rate is set to 10−5.
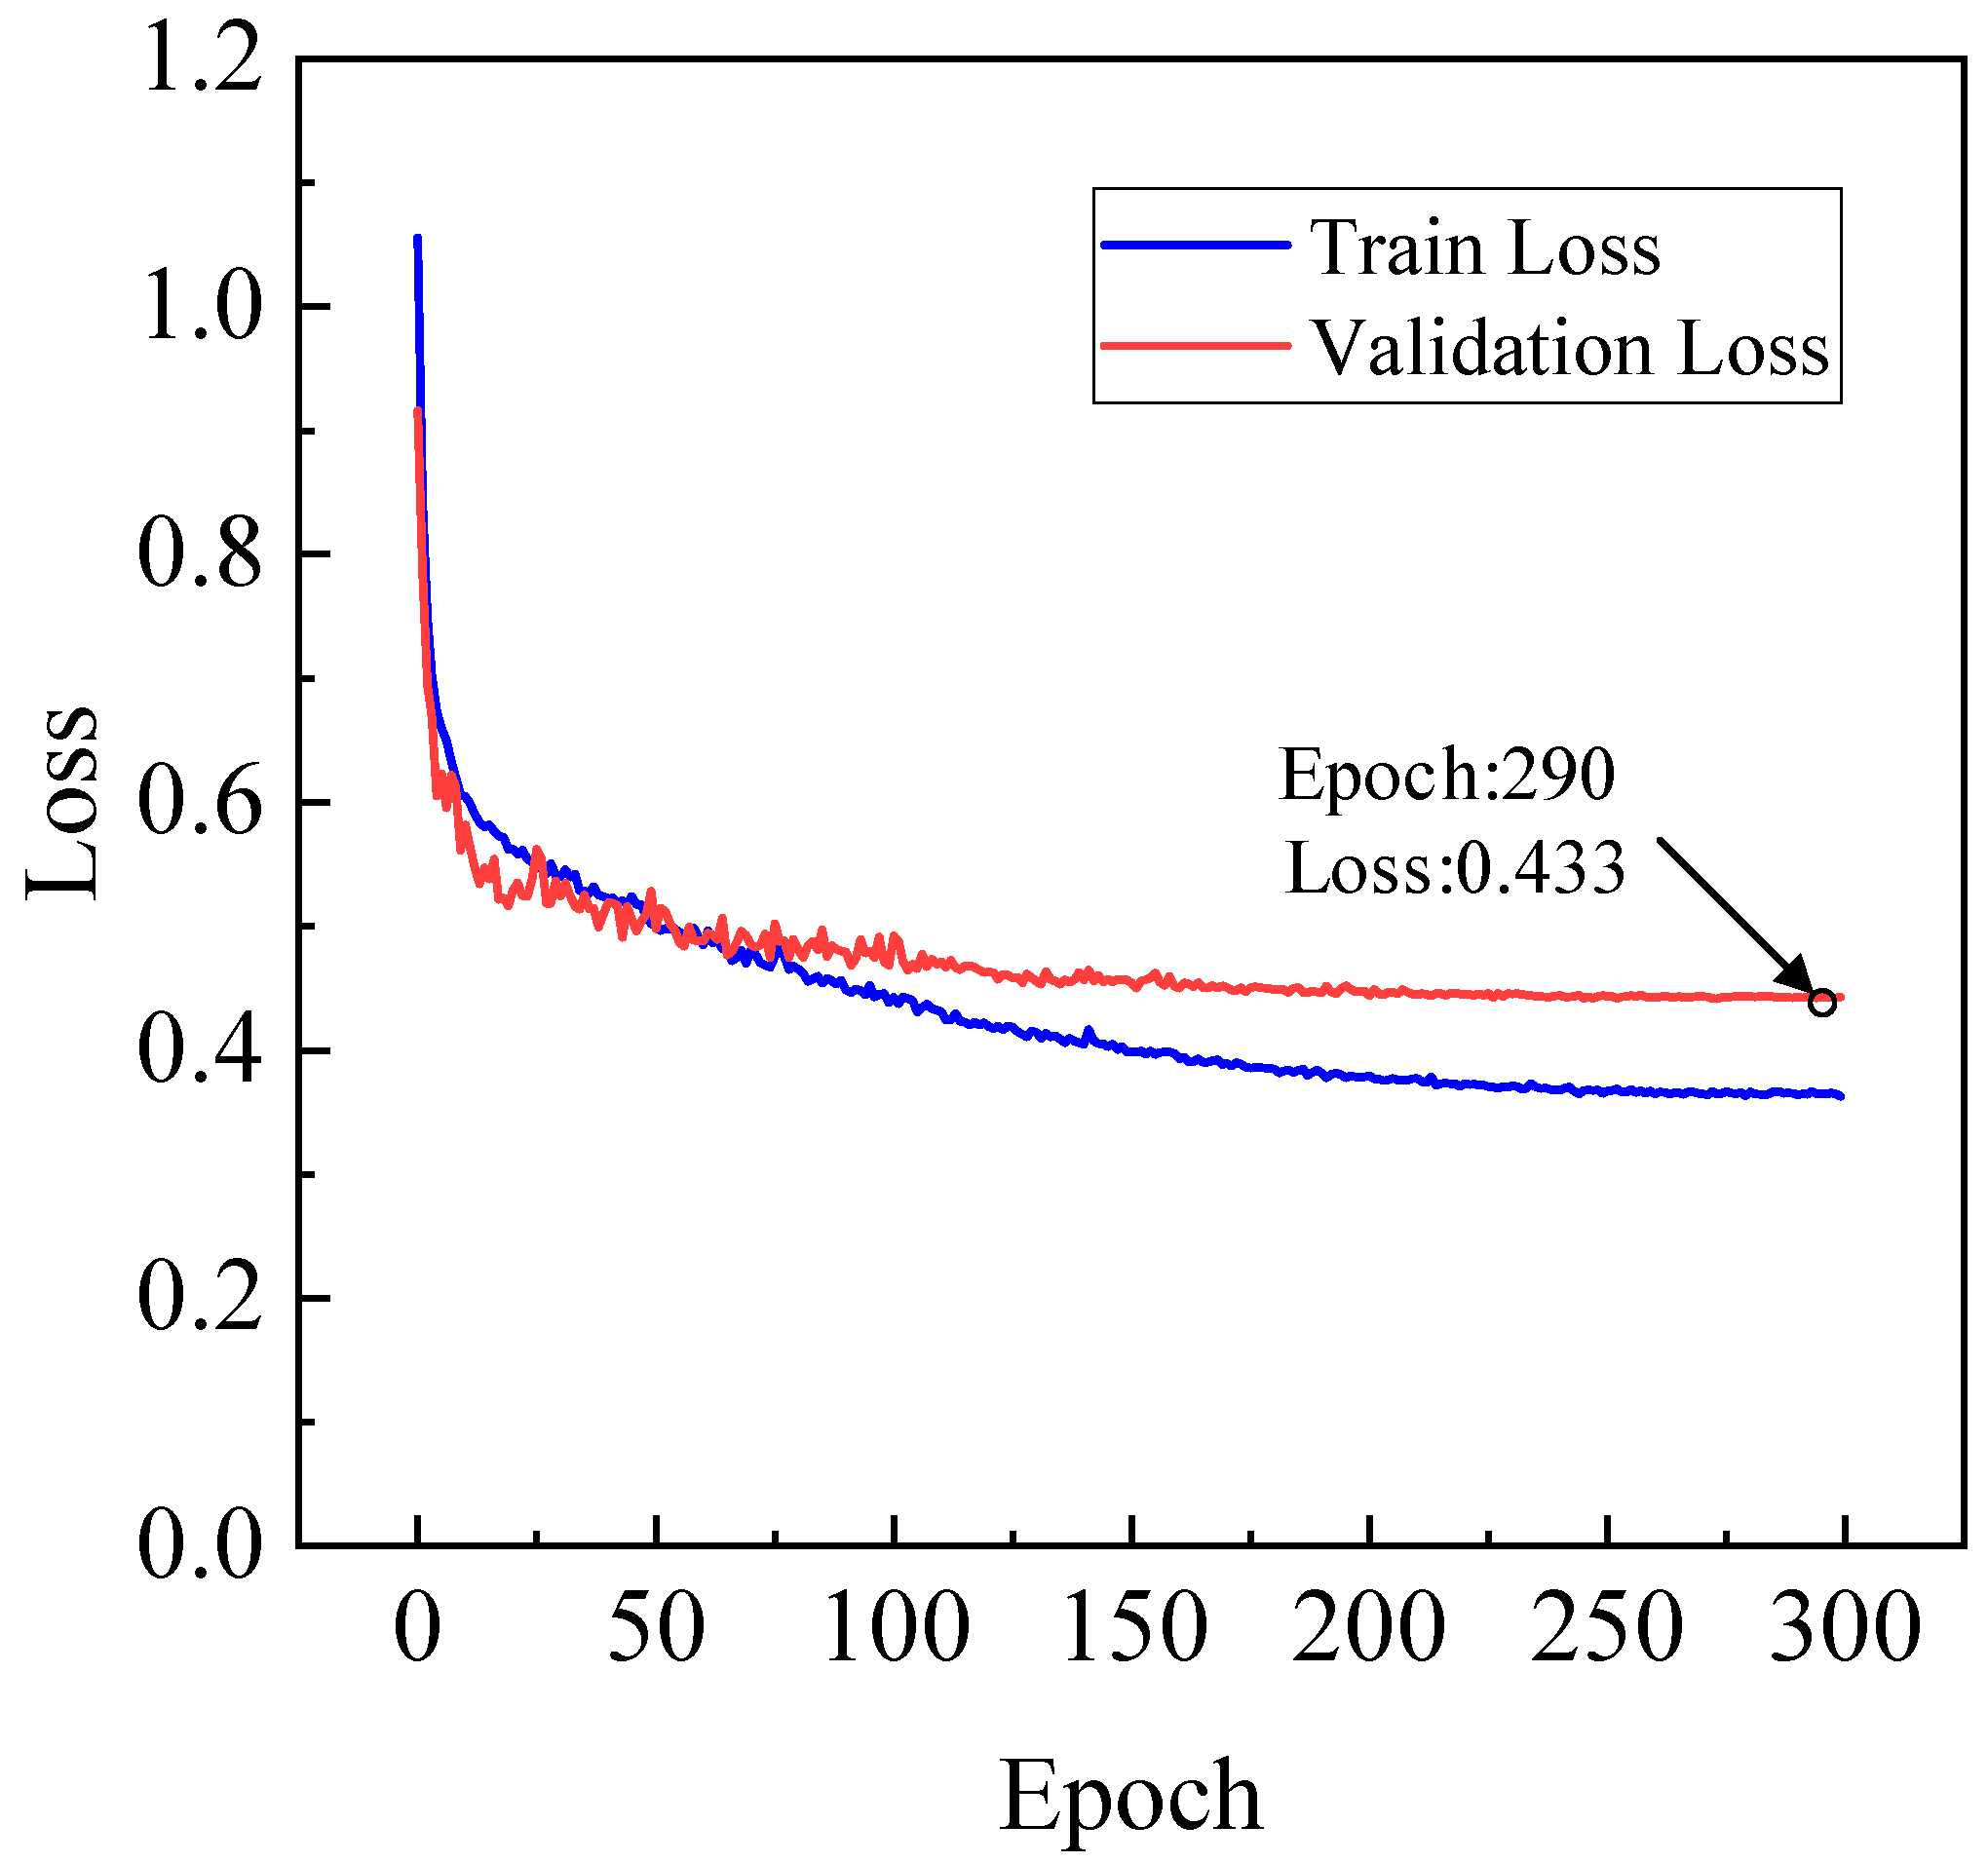
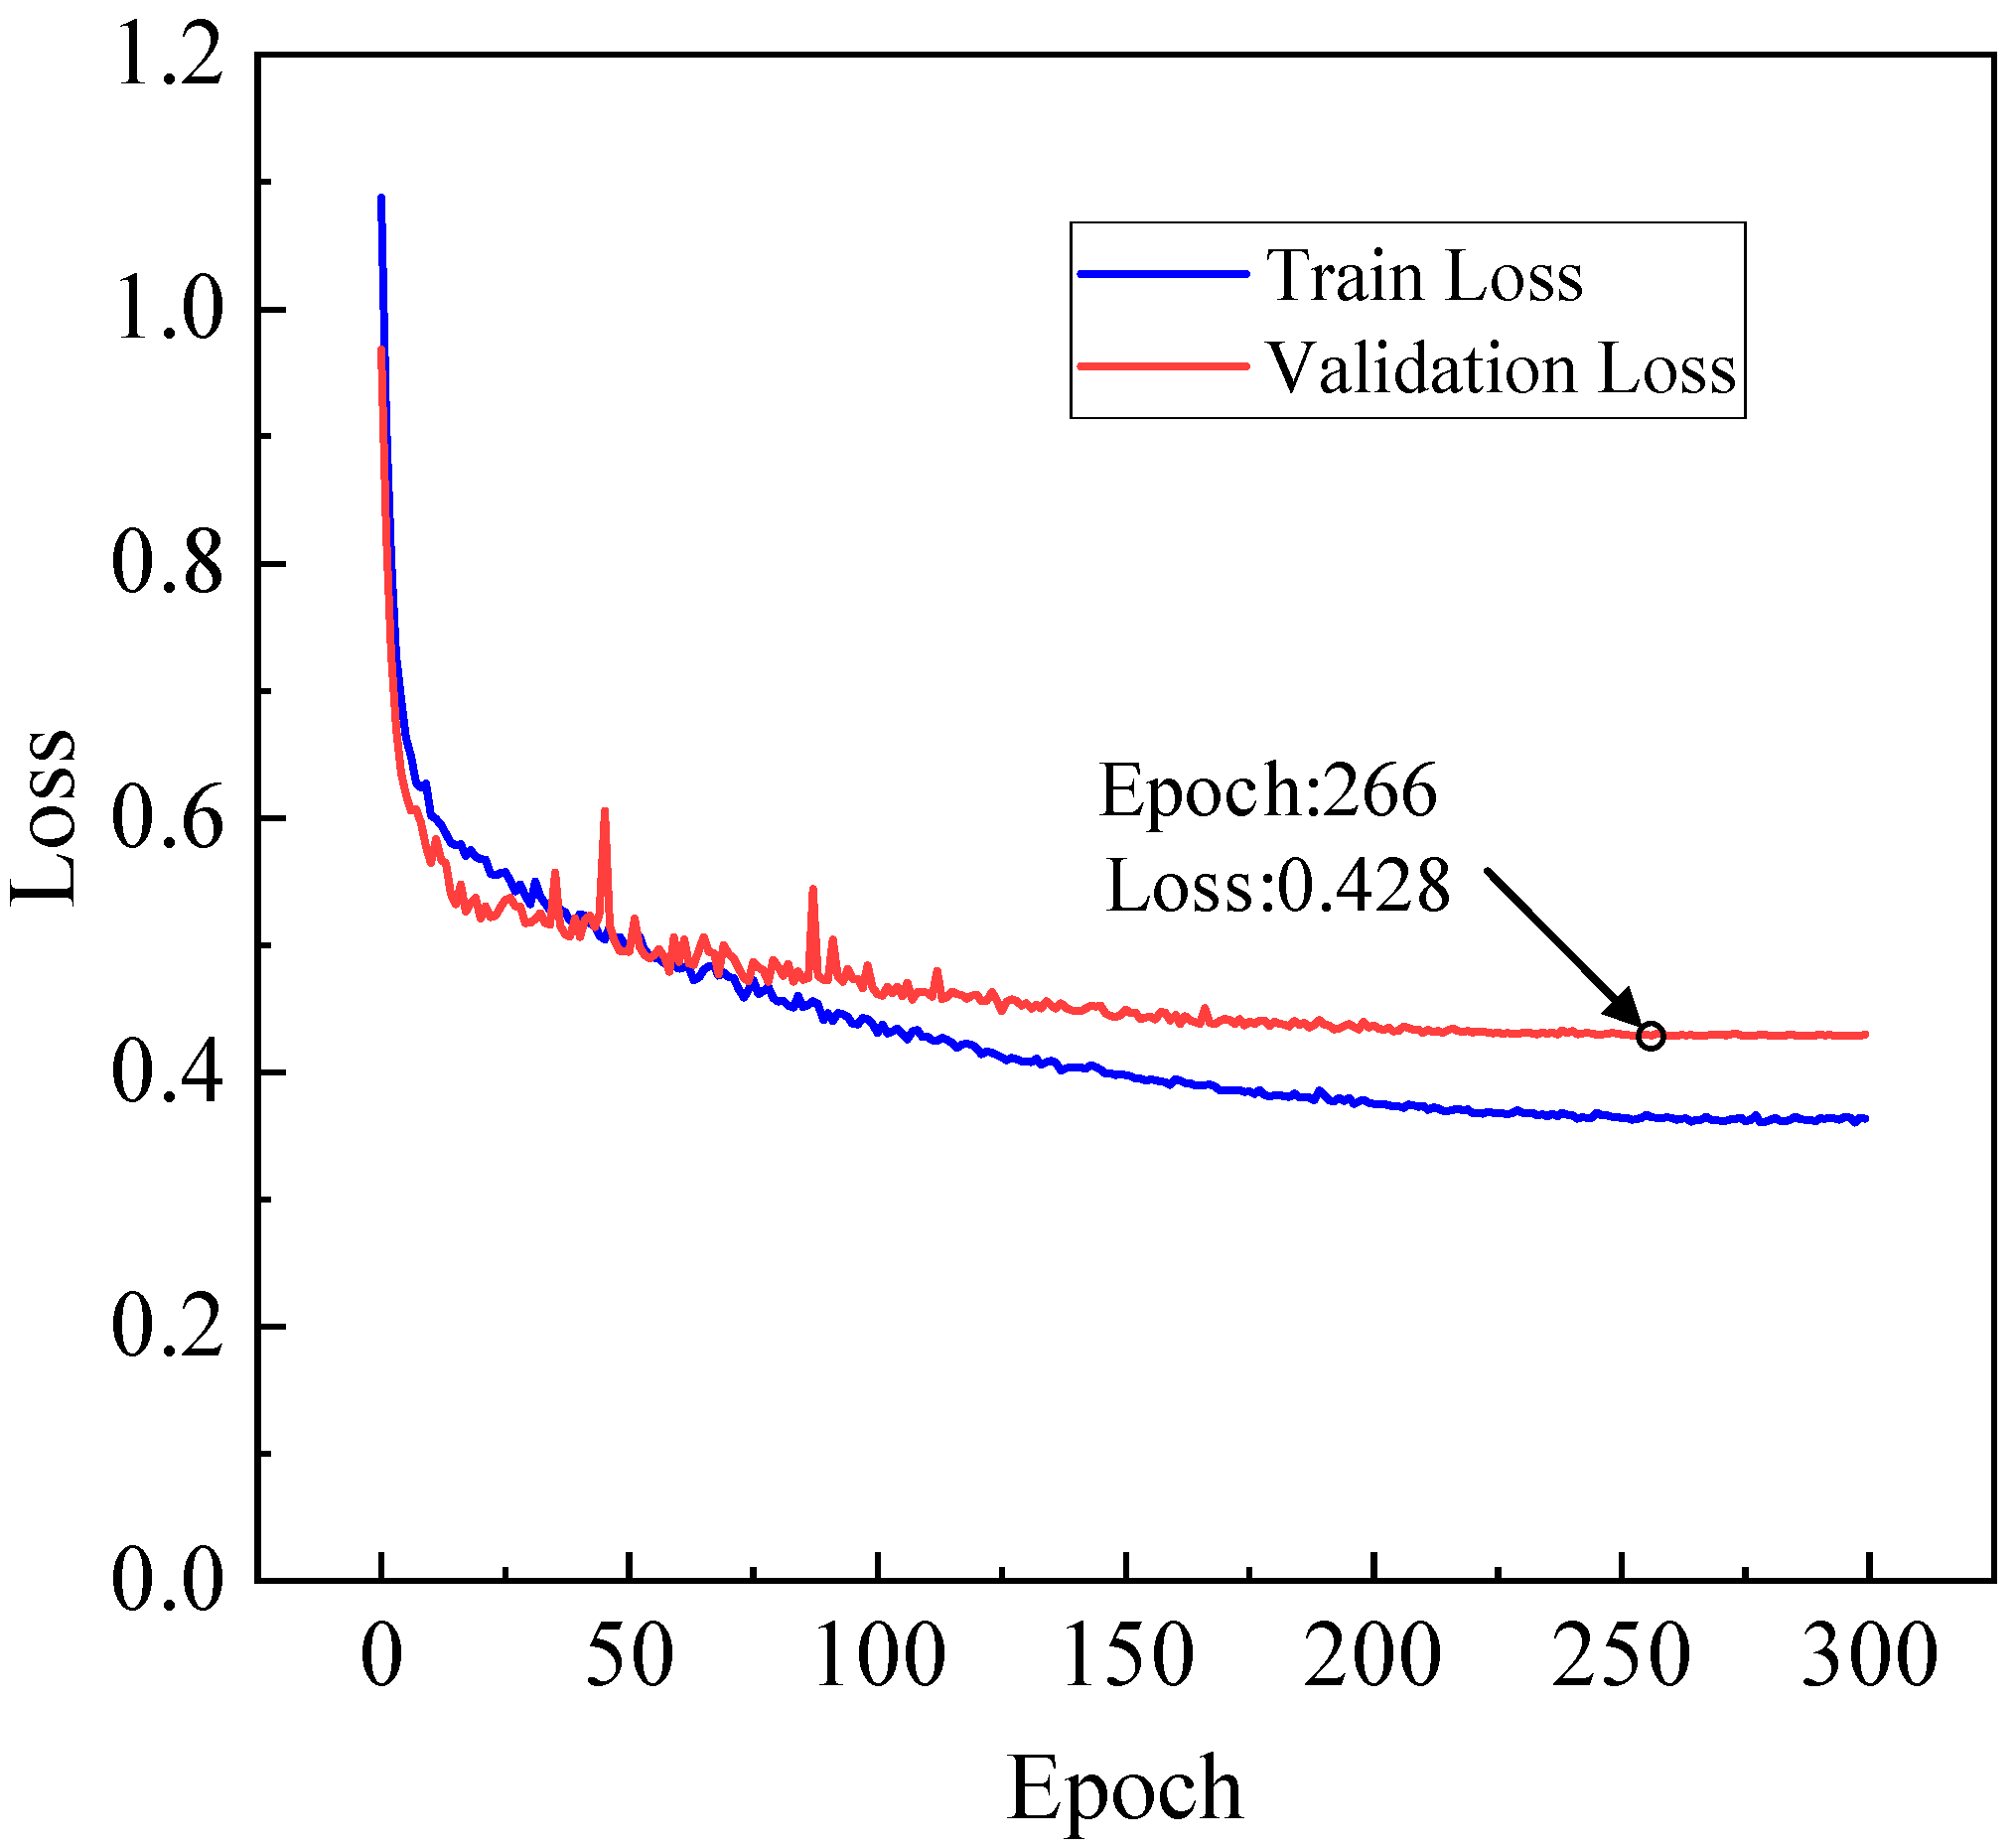
Using the same hyperparameter values, the proposed DA-CrackNet and the original U-Net are trained, respectively. The loss curves obtained from the training set and validation set for the two networks are plotted in Figure 14 and Figure 15, respectively. It can be seen that for the DA-CrackNet, the loss value obtained from the validation set is smallest when the number of epochs reaches 290, indicating that the optimal network has been achieved. As for the U-Net, the number of epochs for yielding the optimal network is 266, which is less than that for the DA-CrackNet. It makes sense since the DA-CrackNet is more complex than the original U-Net, thus resulting in more computational costs.

4.2.3. Testing of the Network

The performance of the crack segmentation model can be evaluated by four metrics: precision, recall, F1 score, and the mean intersection of union (mIoU), which are calculated, respectively, as follows:
Precision = TP FP + TP
Recall = TP FN + TP
F 1   score = 2 × TP 2 × TP + FP + FN
mIoU = TP TP + FP + FN
where TP, FP, TN, and FN represent the number of true positive, false positive, true negative, and false negative pixels, respectively.
Based on the testing set, the crack segmentation performance of the proposed DA-CrackNet and the original U-Net is comparatively evaluated using the above four metrics as well as the training time spent on an epoch. All of the metrics are listed in Table 3. It can be seen that both the DA-CrackNet and the U-Net have excellent crack segmentation performance. Compared to the U-Net, the DA-CrackNet has a higher performance in terms of the above four metrics although consuming more time for training.
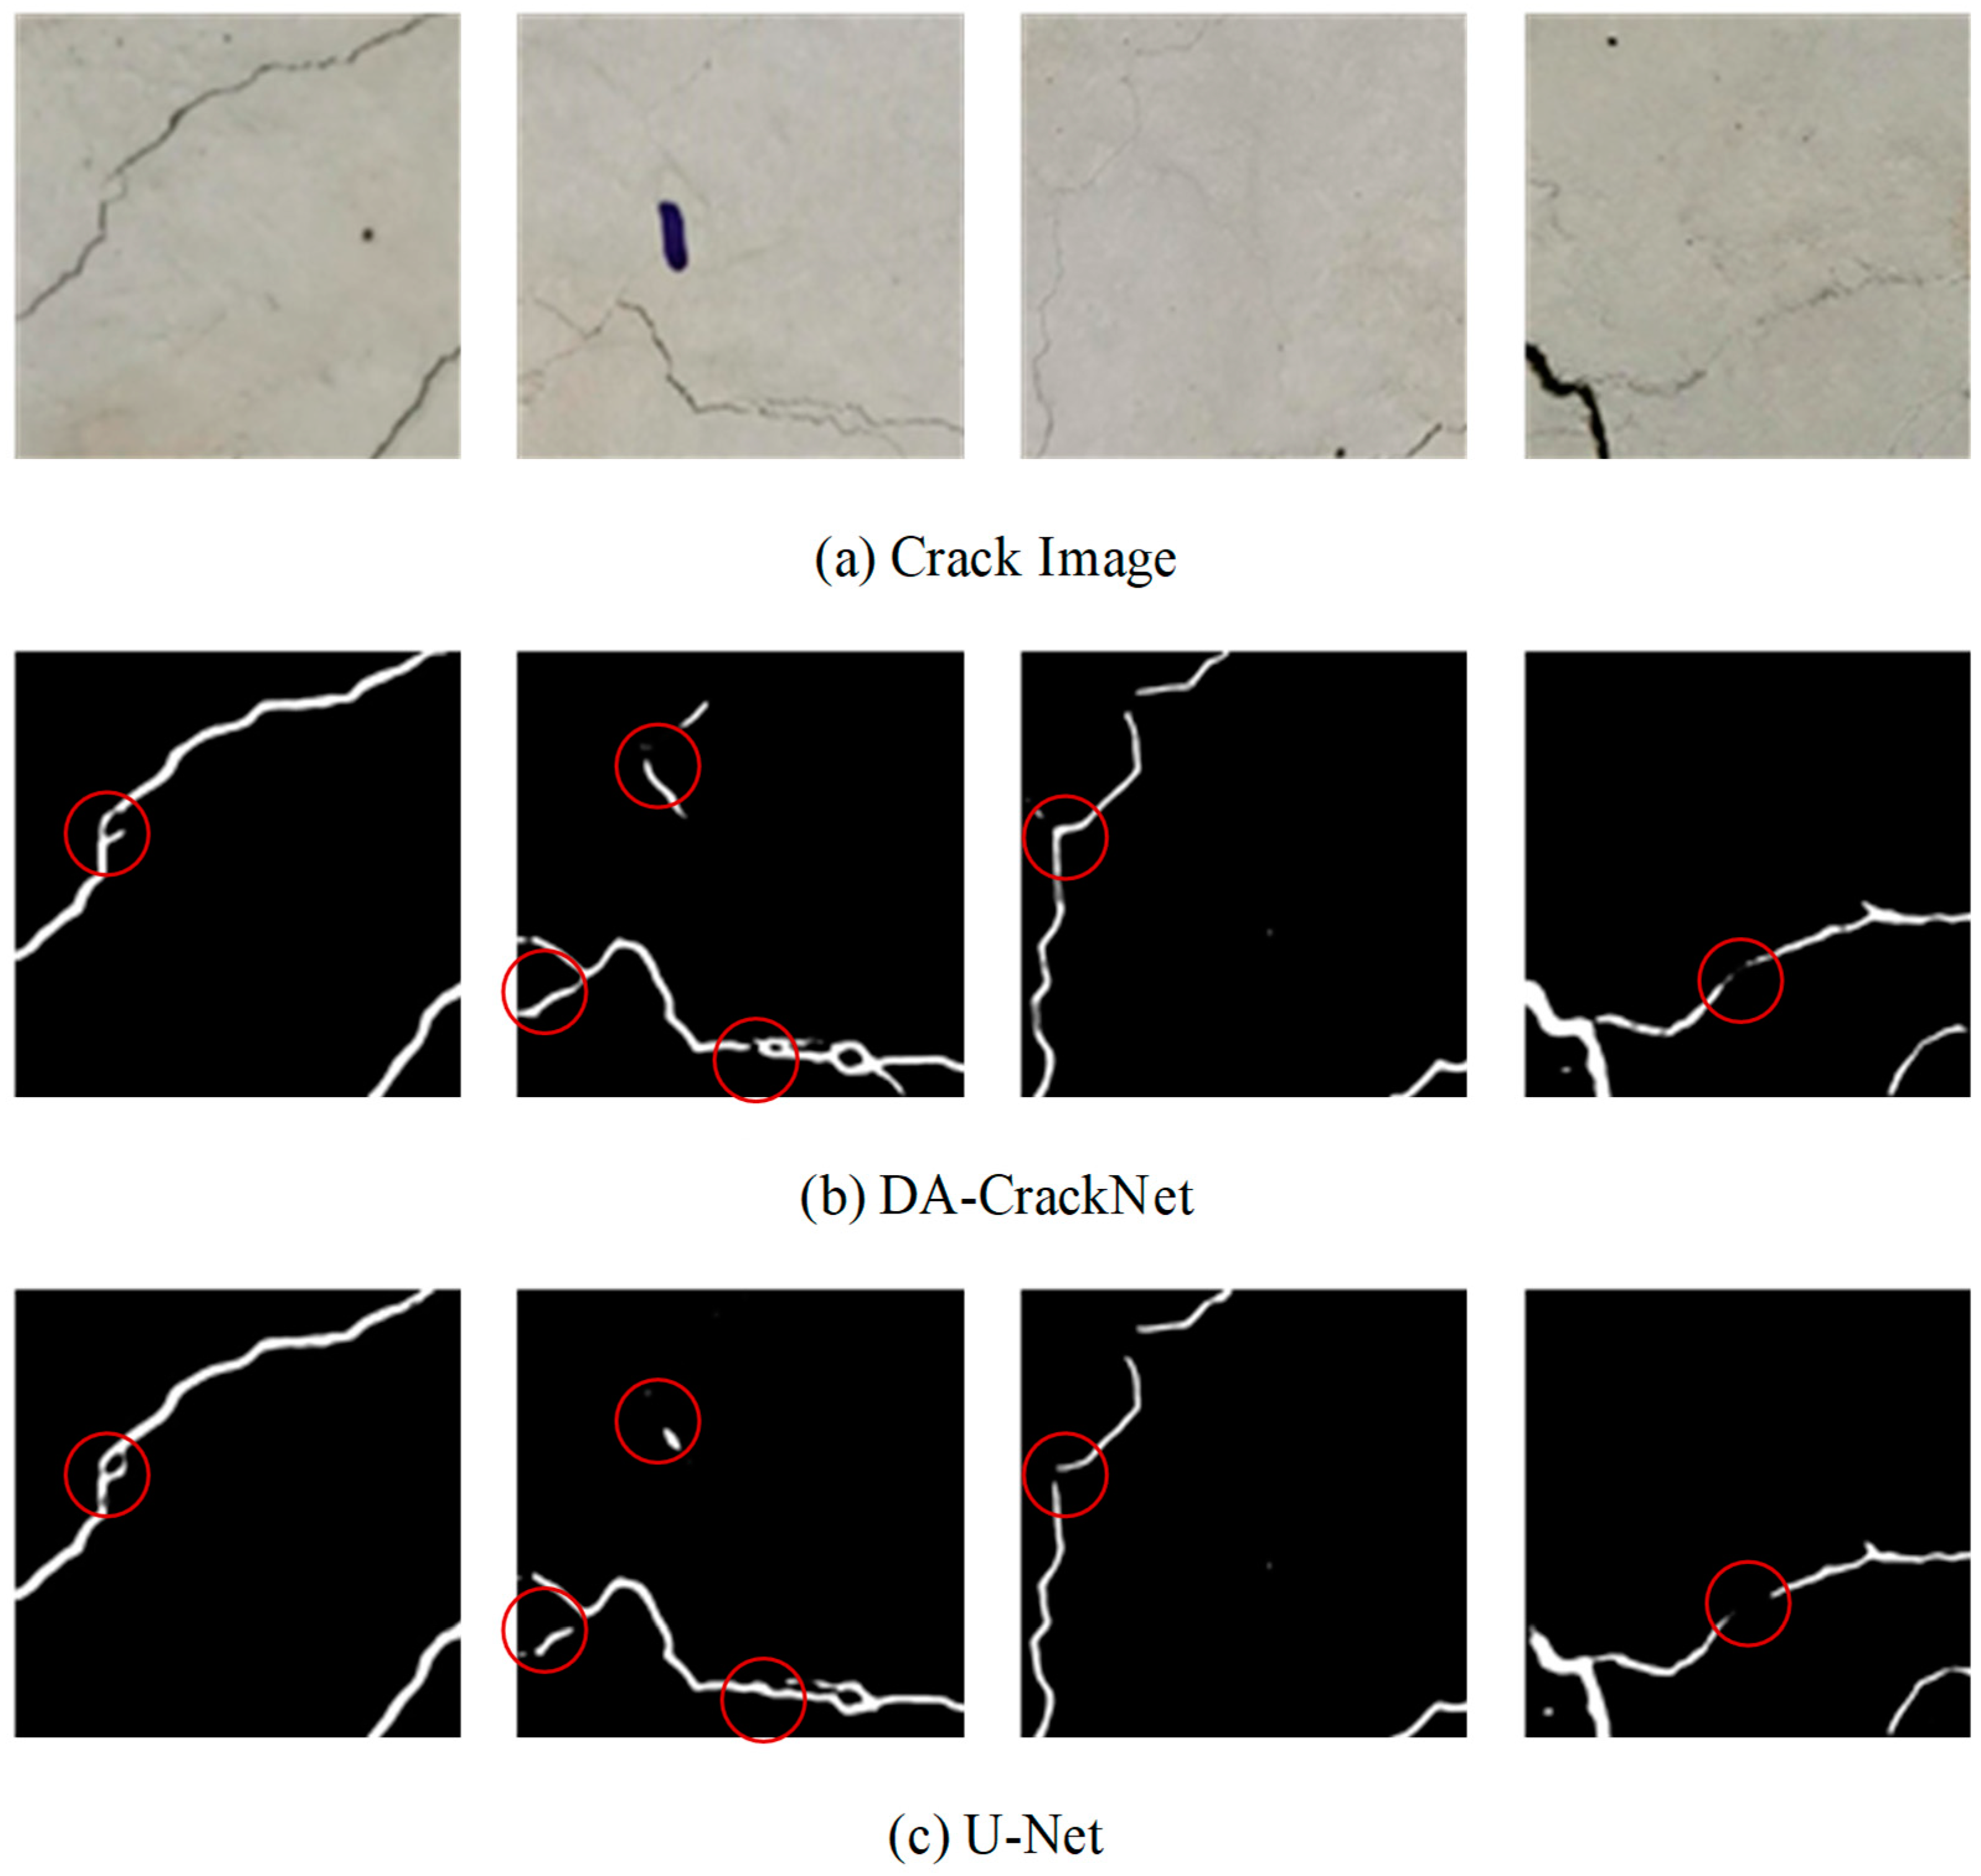
Moreover, four crack images are randomly selected from the testing set, as shown in Figure 16a, to be segmented using the above two networks. The segmentation results are shown in Figure 16b,c, respectively. It can be found that the DA-CrackNet is superior to the U-Net on the whole since the results from the former are more continuous than those from the latter, as highlighted in the figures. It can be ascribed to the dual-attention mechanism introduced in the DA-CrackNet. However, for tiny cracks that are even difficult for human eyes to identify, both the networks would yield inaccurate results.
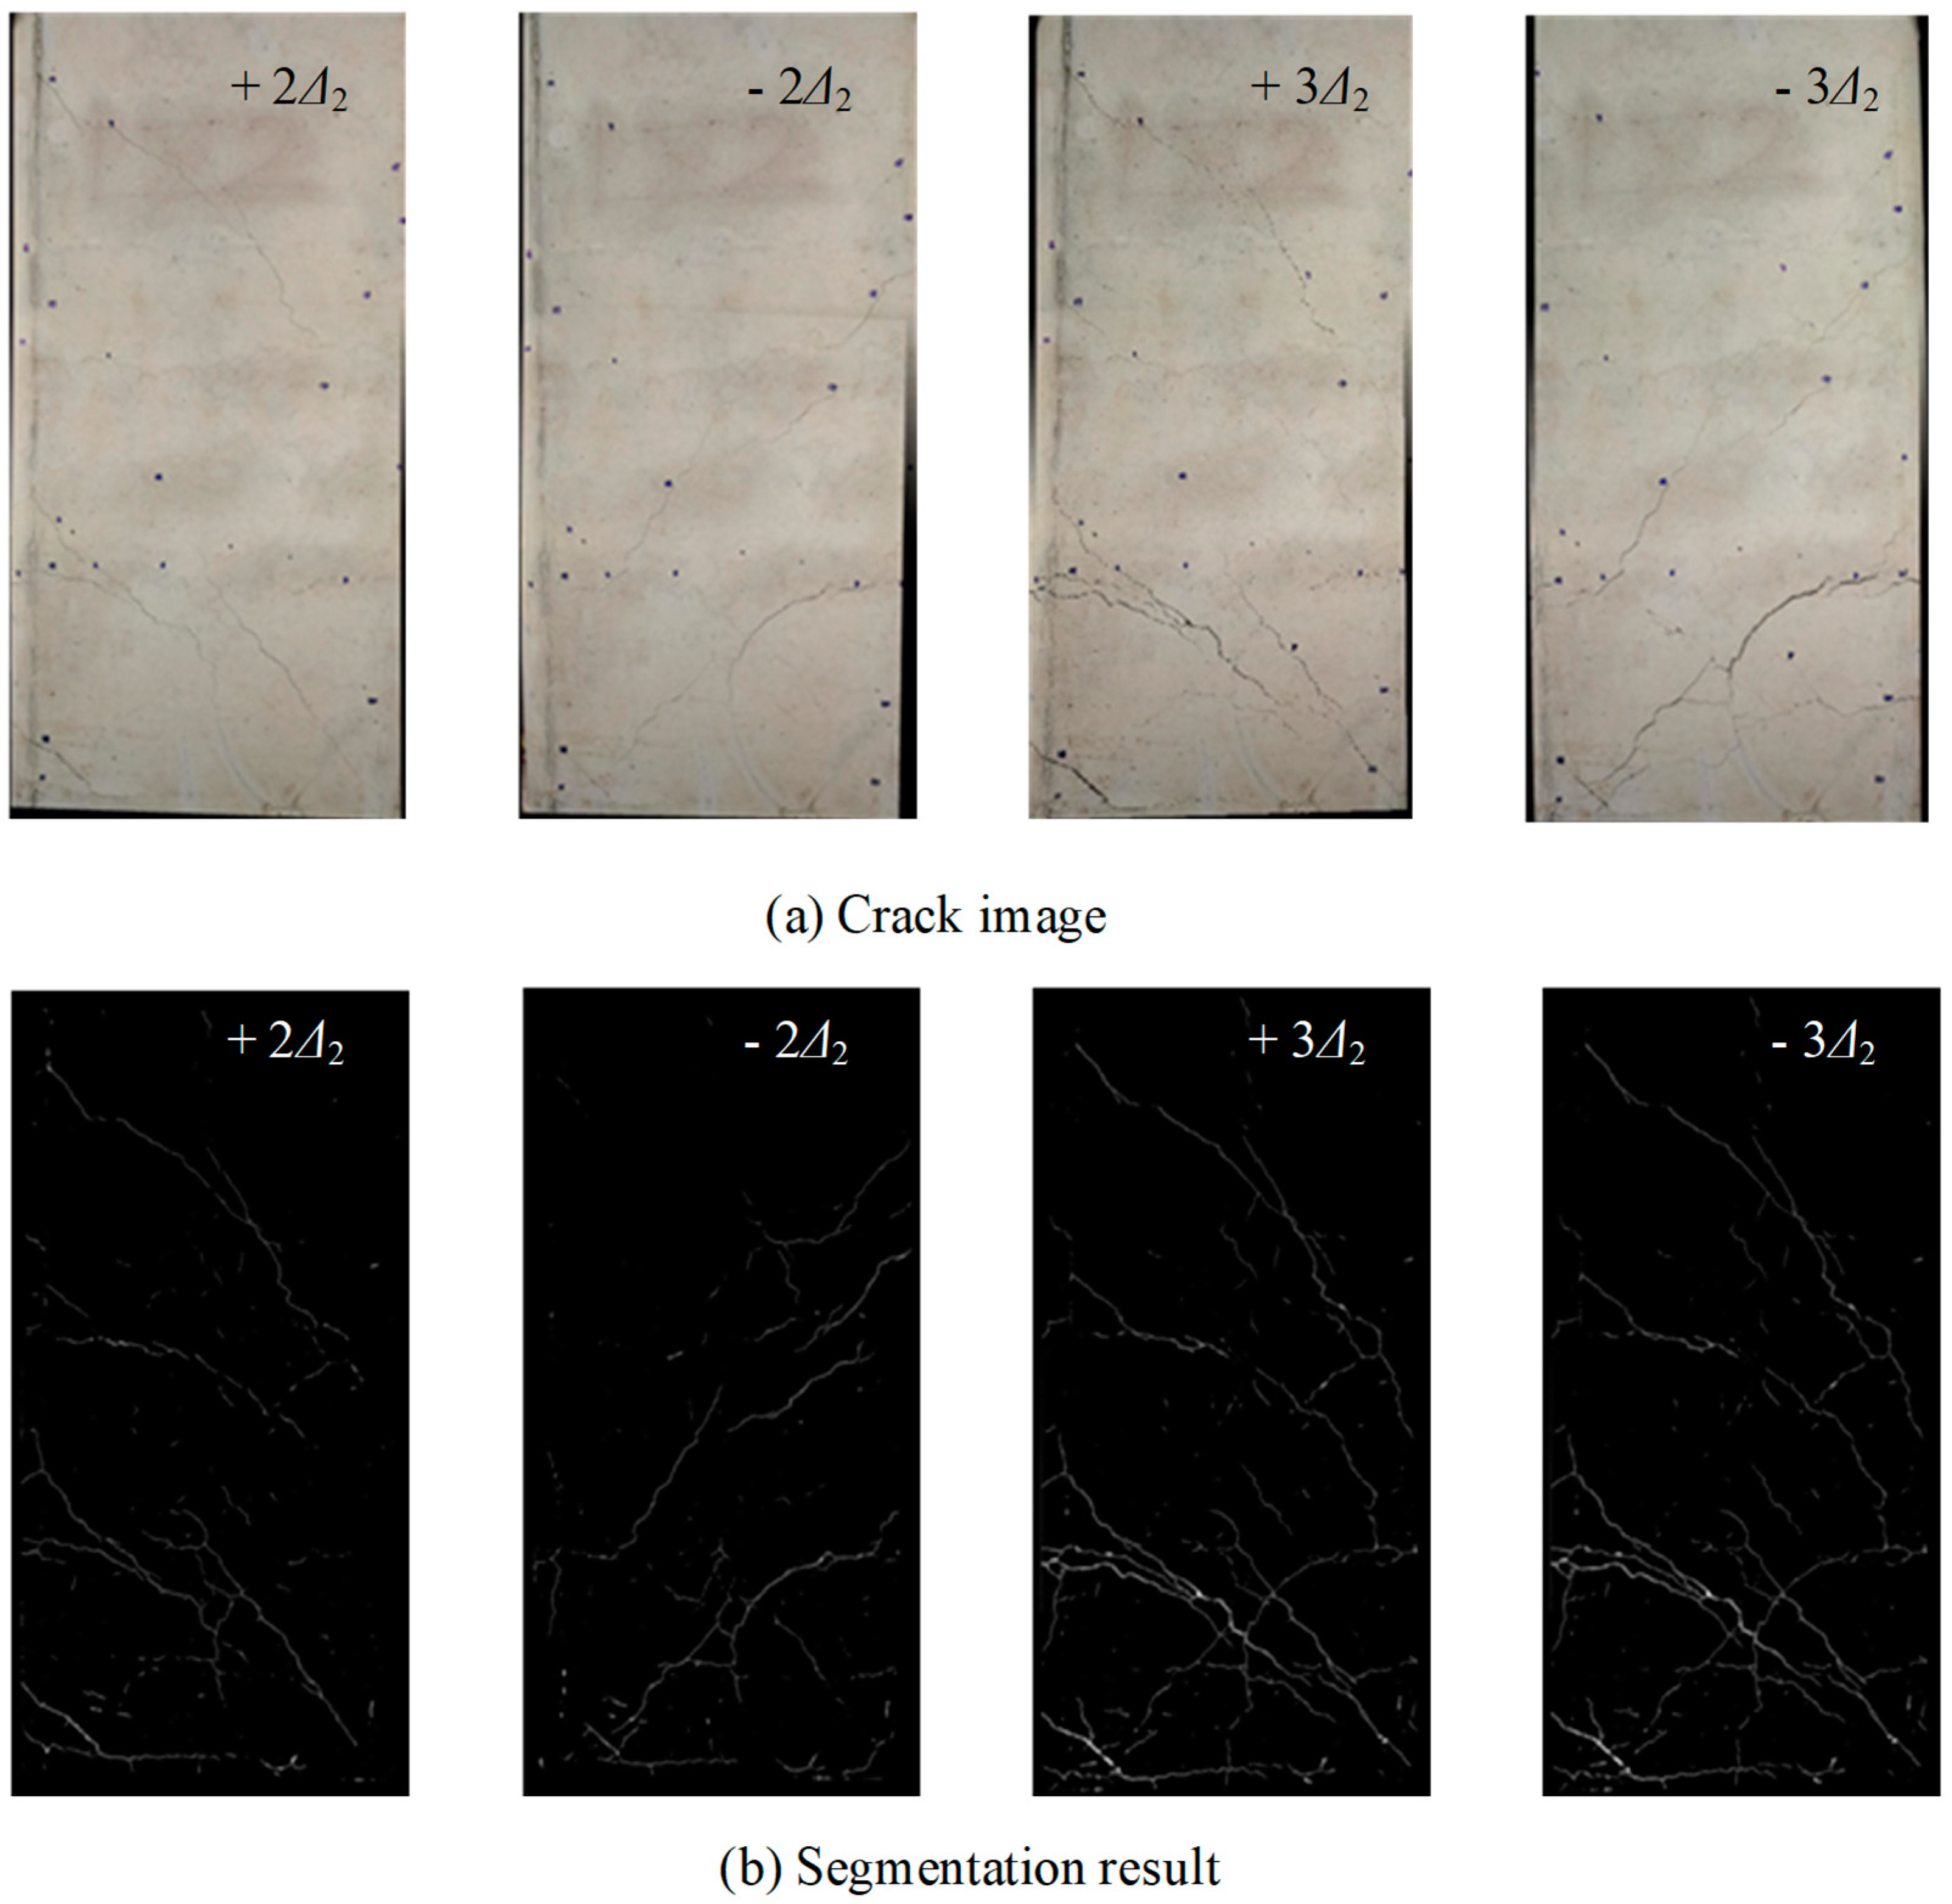
Finally, crack images of SC2 at displacements of ±2Δ2 and ±3Δ2, as shown in Figure 17a, are used to further test the generalization performance of the proposed DA-CrackNet. In conformity with the input of the network, the crack image is first split into smaller ones with the size of 512 × 512. They are then passed into the network and the outputs are simply combined to obtain the whole segmentation result, as seen in Figure 17b. It can be clearly seen that the cracks in the images are successfully recognized with high accuracy. In particular, the fine cracks can be effectively segmented, showing that the proposed network has satisfactory performance.

5. Seismic Damage Evaluation of RC Short Columns Based on Crack Information

5.1. Damage Development During the Test

Several damage models have been proposed to evaluate seismic damage of RC members, including the deformation criterion, low-cycle fatigue criterion, energy criterion, and deformation-energy dual criterion. The energy criterion is chosen herein to quantitatively assess the damage extent of the RC short columns due to its clear mechanical meaning and ease of calculation.
Based on the energy criterion, the damage indicator of the RC short column under cyclic loading can be computed by
d = d E E t
where d is the damage indicator; d E is the current cumulative hysteresis energy, i.e., the sum of the area of hysteresis loops up to the present; and Et is the total hysteresis energy, i.e., the sum of the area of all hysteresis loops up to failure. From the definition, it can be easily inferred that d ranges between 0 and 1. At the beginning of loading, d is equal to 0 since no damage occurs; however, upon failure, d goes to 1.0, meaning that the RC short column completely fails.
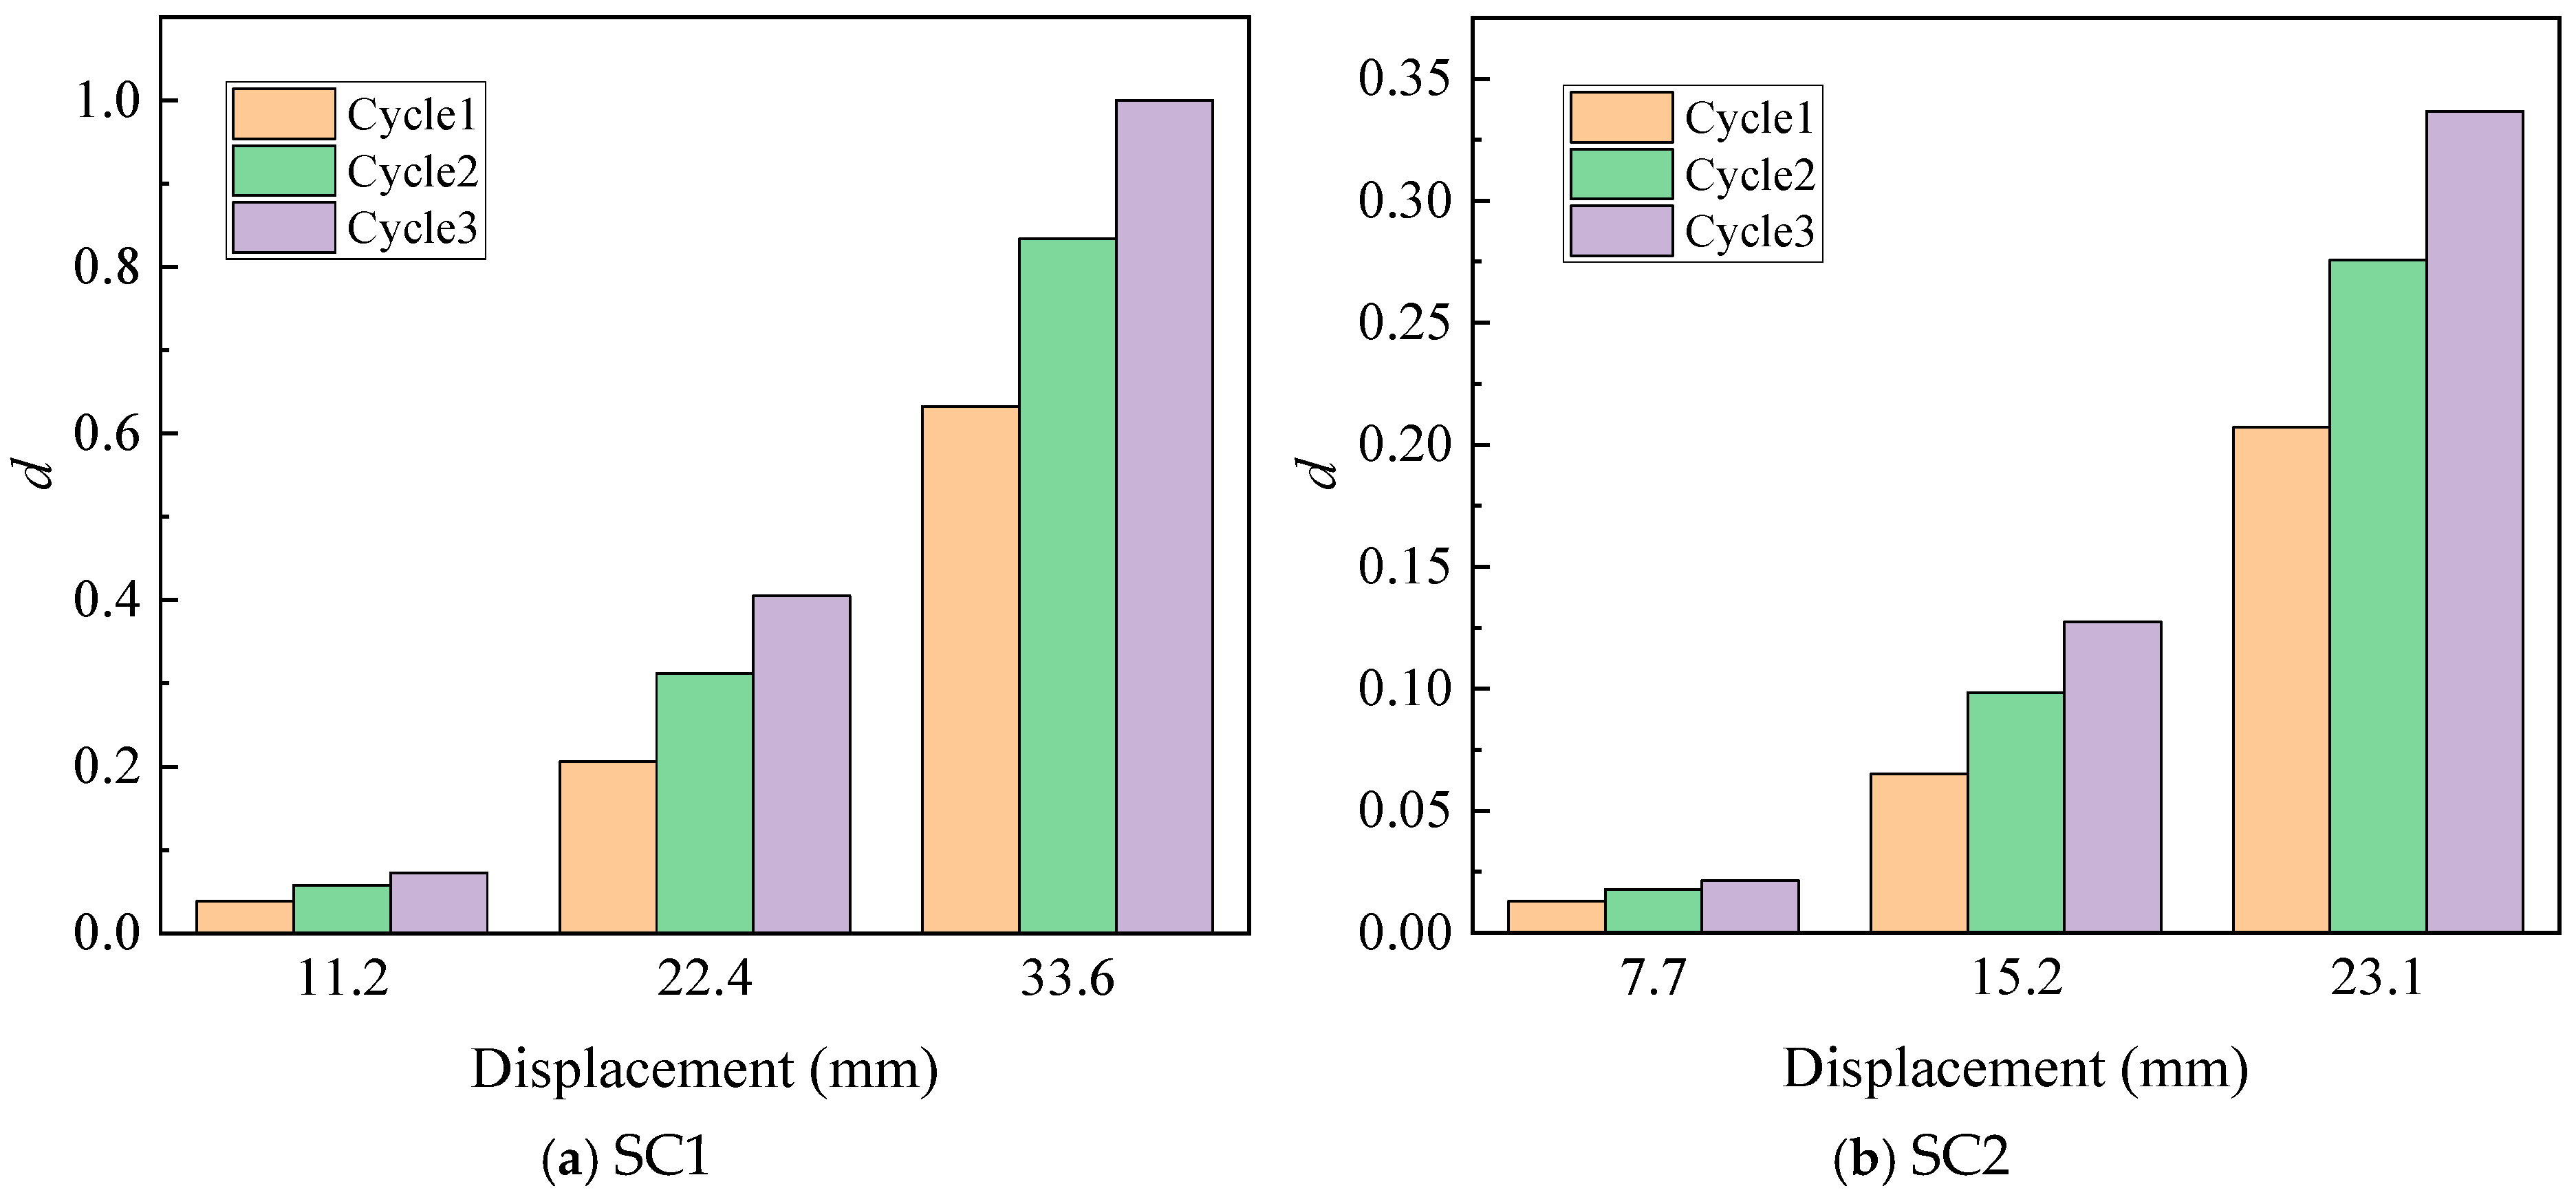
Using the above damage indicator, damage development histograms of the two specimens under cyclic loading are shown in Figure 18. It can be clearly seen that the damage to specimens arises monotonically with the increase in the displacement amplitude. Moreover, as the cycle number increases, the damage to specimens also increases. It can be easily comprehended considering the energy accumulation in the repeated loading, as seen in Equation (5).

5.2. Crack Development During the Test

As seen in Figure 6 and Figure 7, the cracks on column surfaces develop progressively as the lateral displacement of the RC short column increases or the damage grows. Not only does the number of cracks increase but also the crack length and width increase until concrete spalling and reinforcement exposure emerge. Therefore, it is of great significance to acquire the crack information since it can potentially be used to reflect seismic damage of the RC short column especially when the damage is relatively small.
Since the crack is very long and thin, i.e., the width is much smaller than the length, the crack length can be approximately computed by
l P 2
where l is the crack length; P is the crack perimeter, which can be calculated using the boundary chain code [63] as
P = # { k | x k + 1 , y k + 1 N 4 x k , y k } + 2 # { k | x k + 1 , y k + 1 N D x k , y k }
where # denotes the number of set elements; N4(xk, yk) and ND(xk, yk) denote the 4-neighborhood and diagonal neighborhood of pixel point (xk, yk), respectively; (xk, yk) and (xk+1, yk+1) denote the coordinates of the k-th and (k + 1)-th pixel point.
In addition, crack width varies along the length, which makes it hard to determine precisely. Therefore, the average crack width is calculated alternatively by
w ¯ = A l
where A is the crack area, which can be represented by the number of pixels occupied by the cracks.
Using Equations (6)–(8), the properties of each crack including area, length, and width can be easily calculated by image analysis based on the segmentation results in Section 4. In the case of multiple cracks, the total area, the total length, and the maximum width can be easily obtained based on the results for all cracks. Further, the average width can be computed by the total area divided by the total length. In addition, the maximum area is introduced, which is defined as the product of the total length and the maximum width.
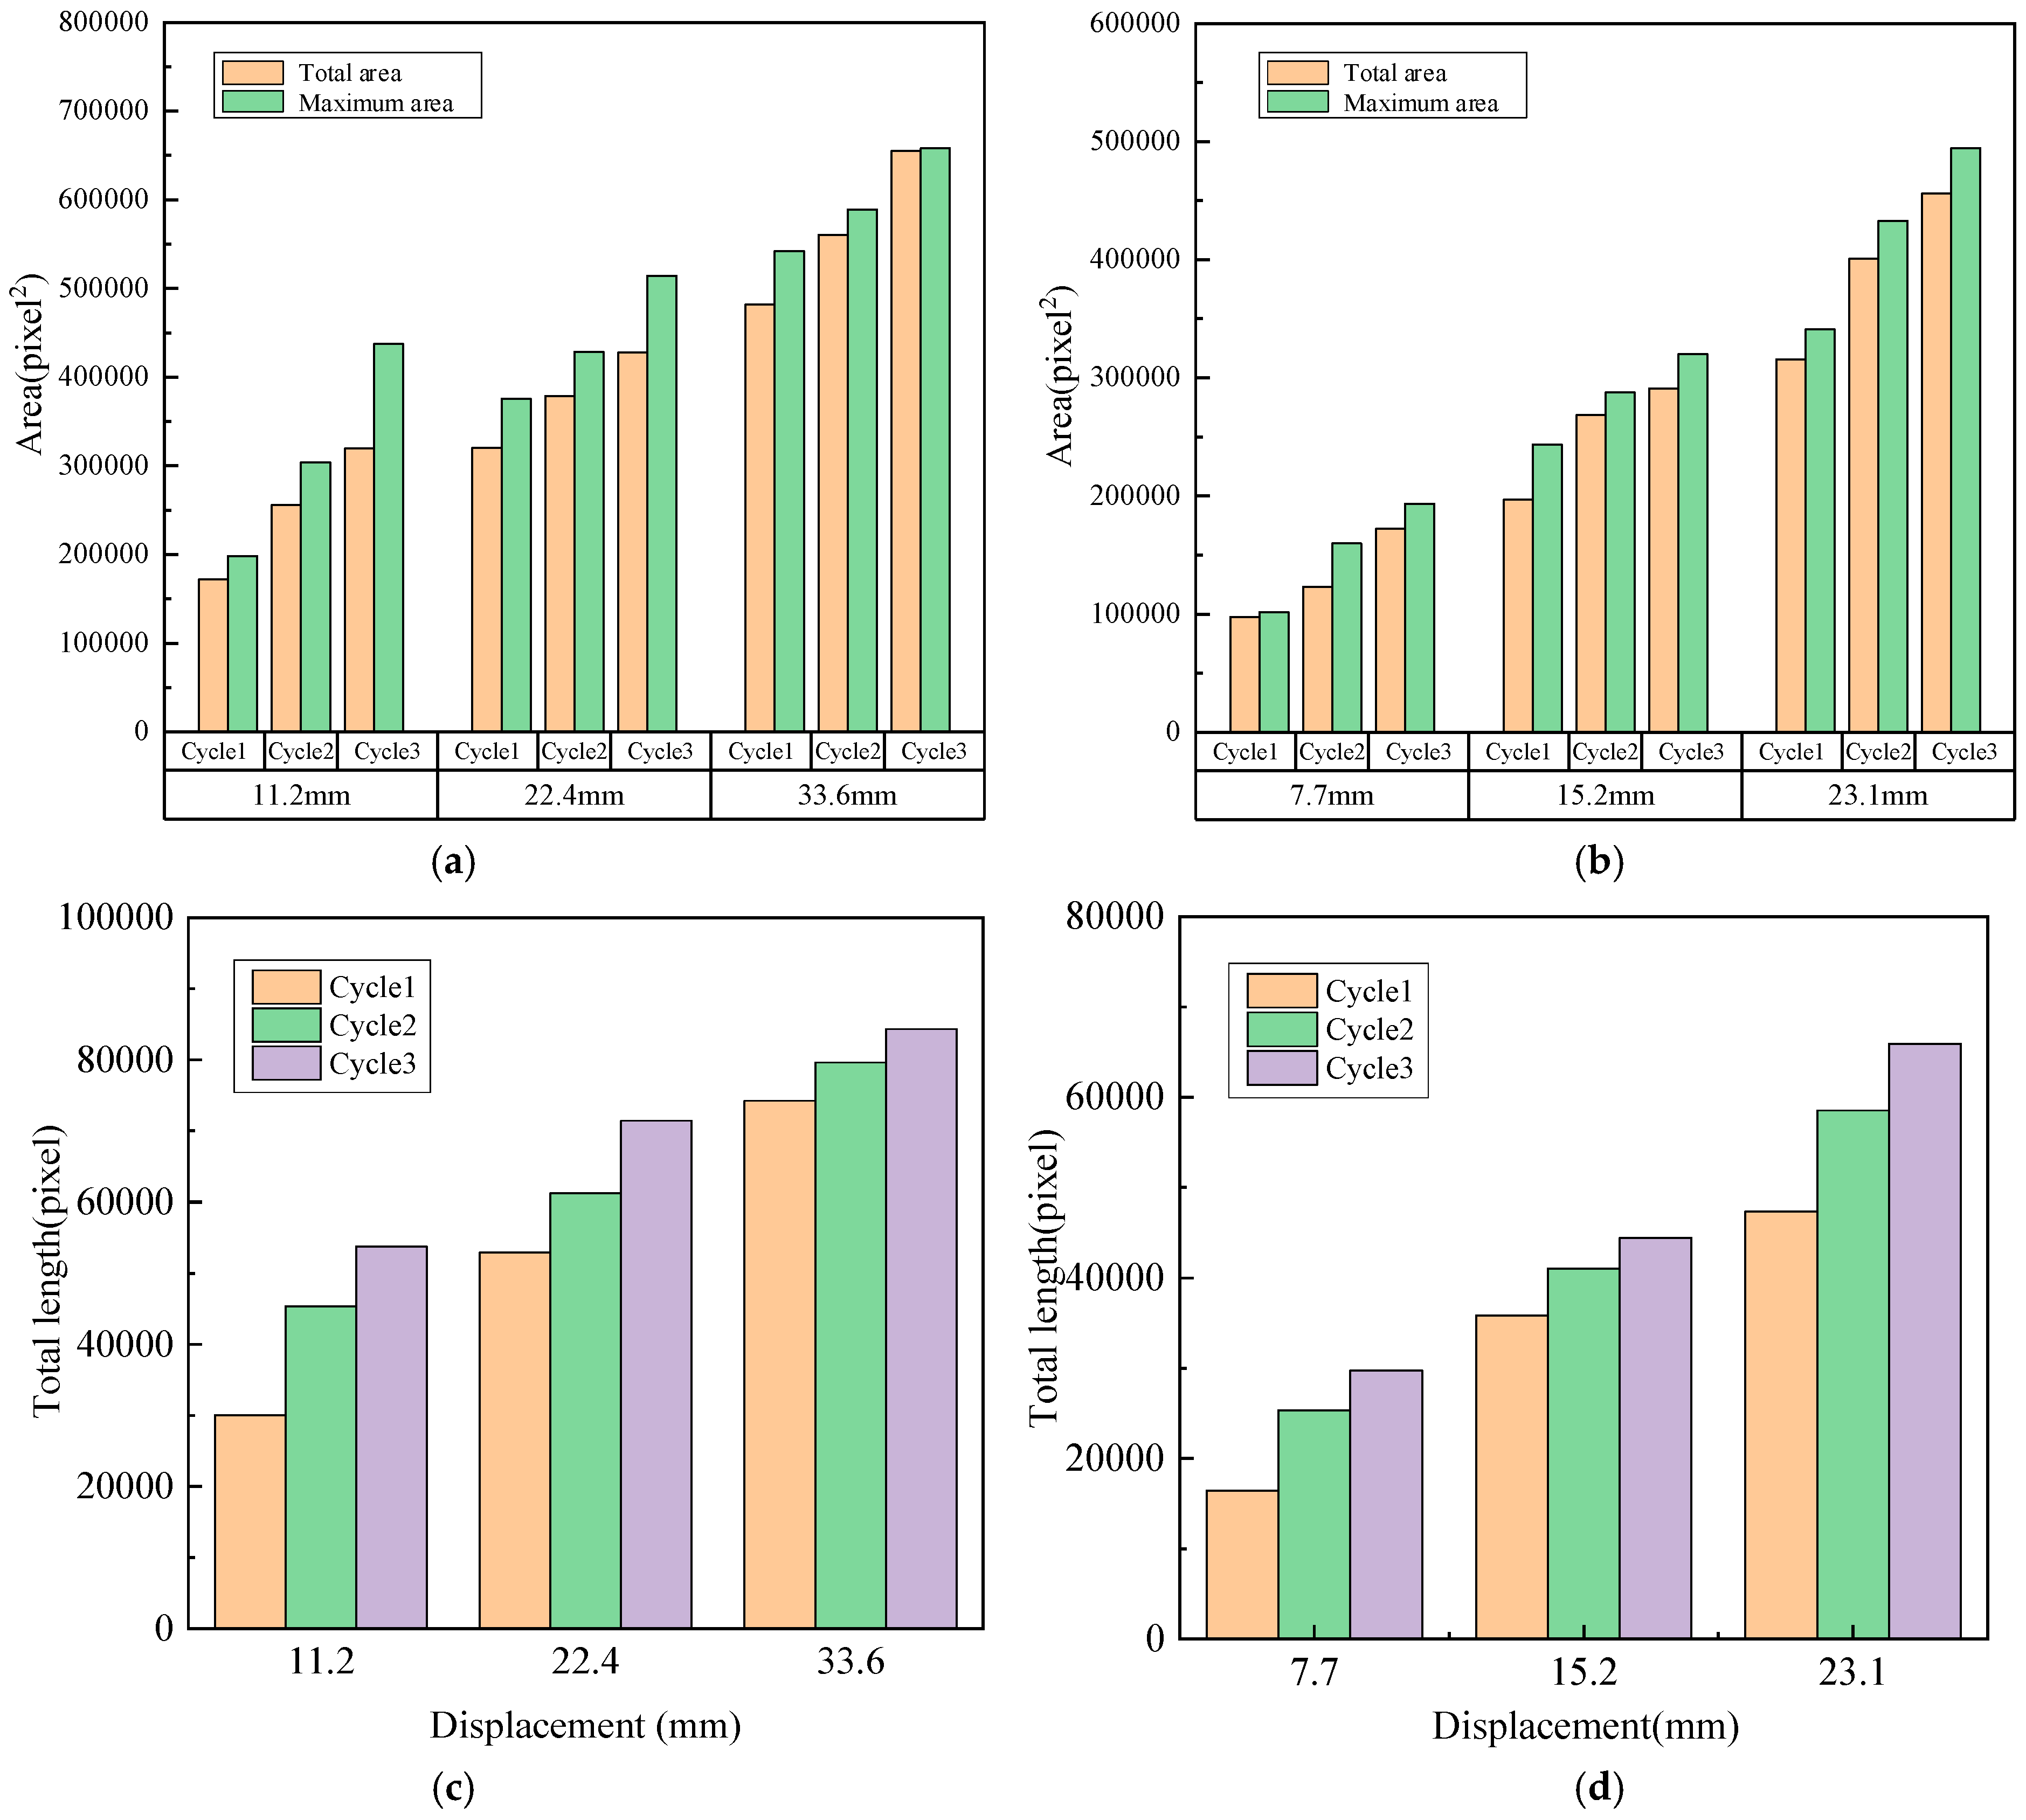
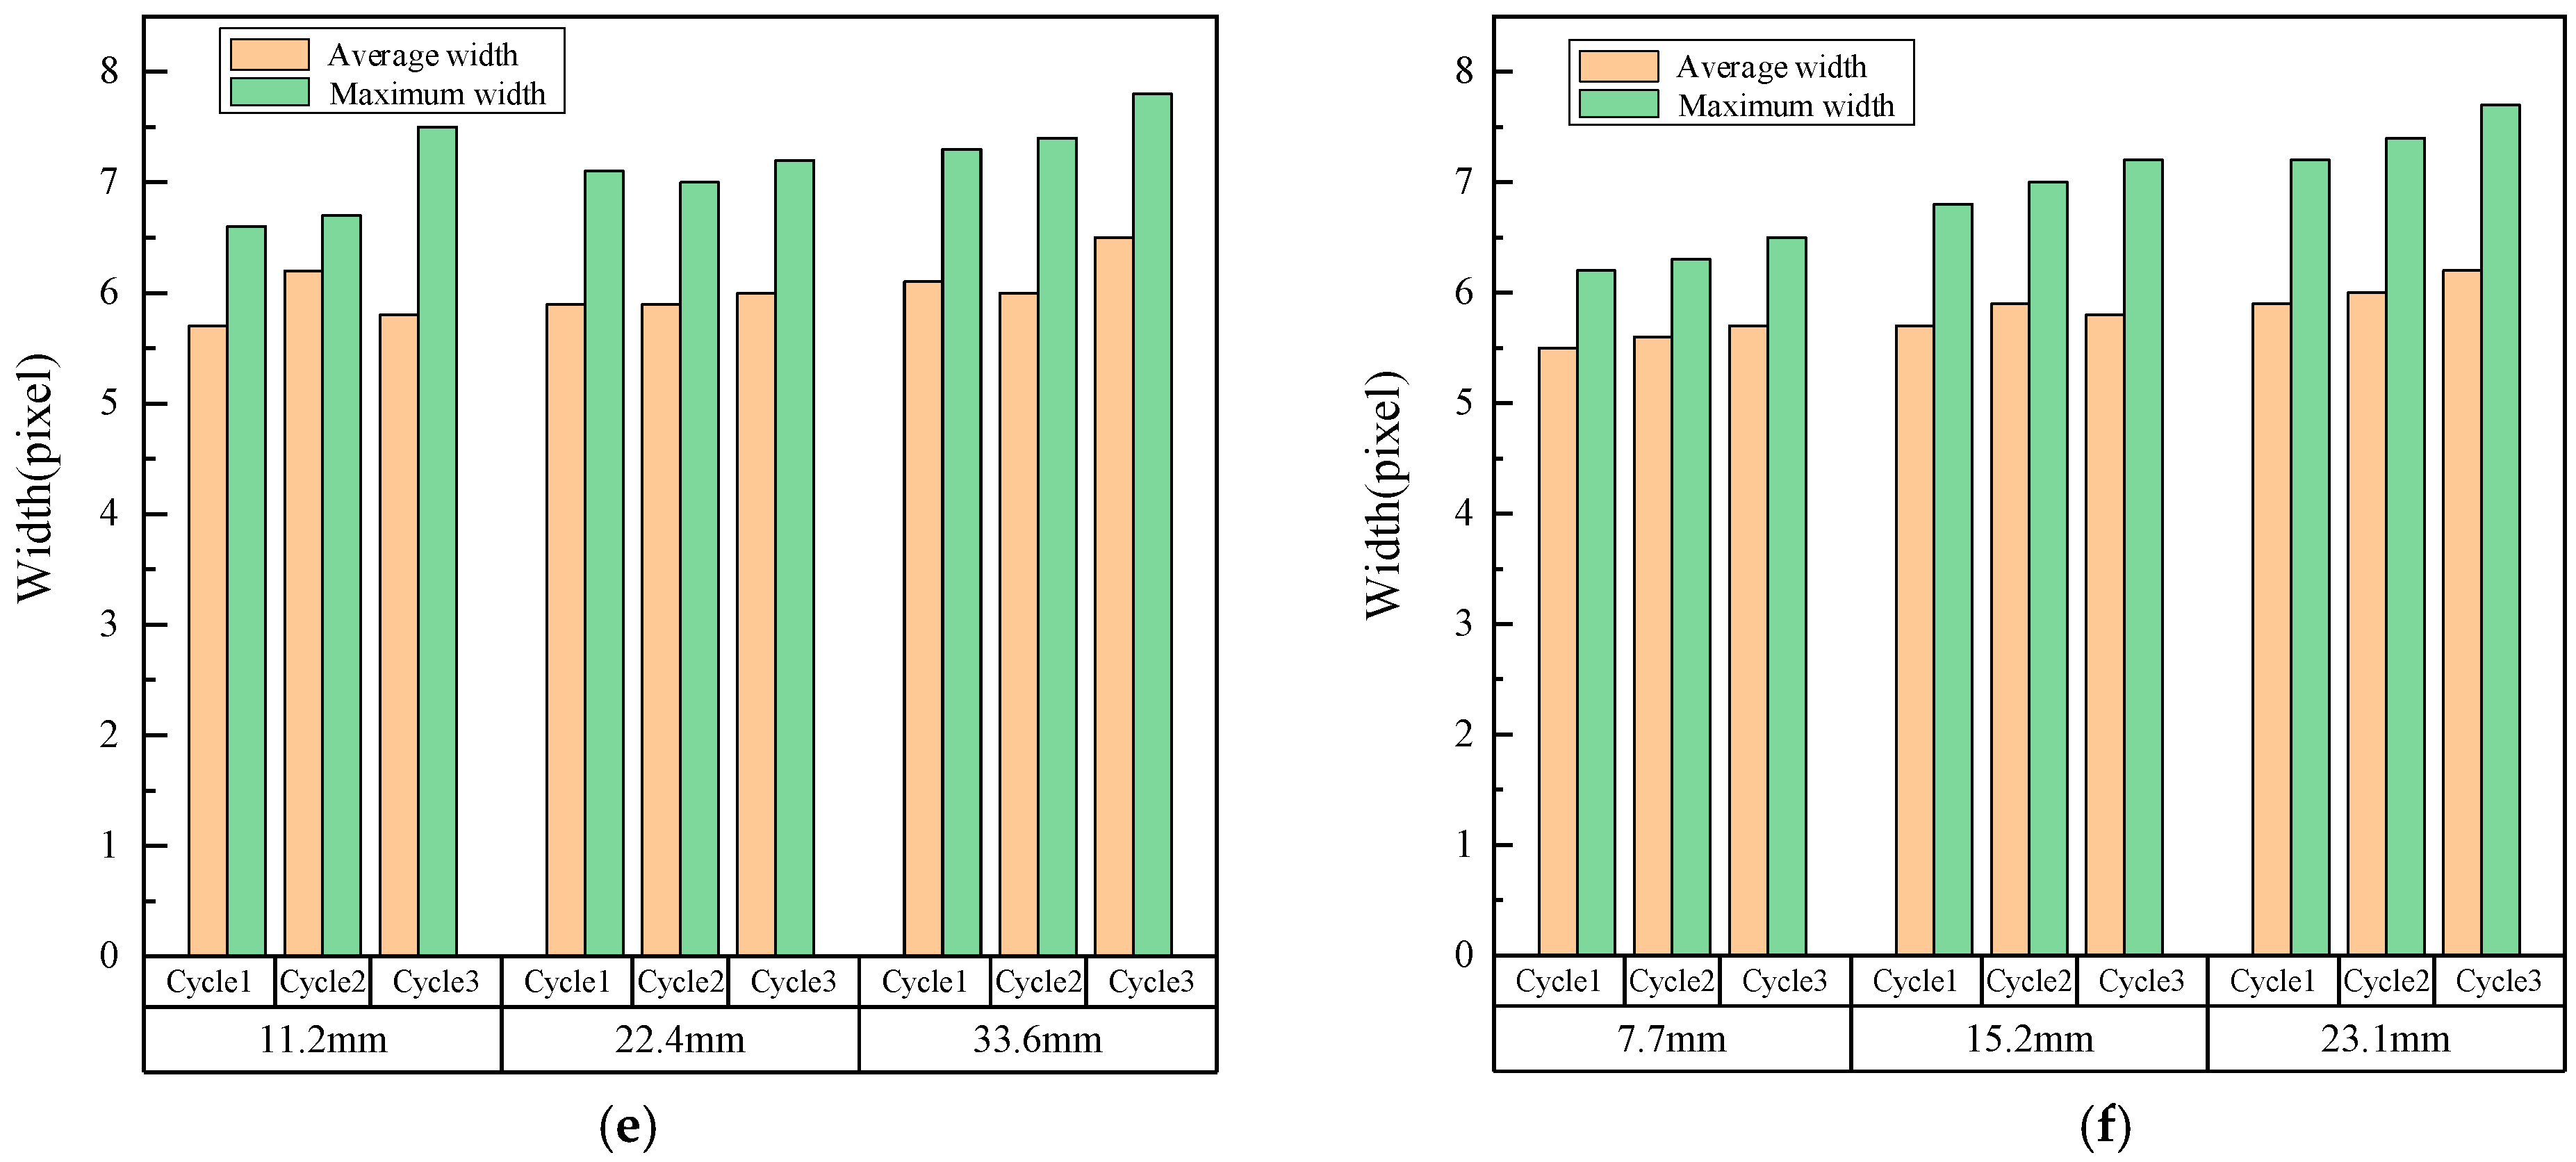
Figure 19 presents the obtained crack information of the two specimens under different displacement magnitudes and cycles. Note that the results under the two loading directions are averaged for the whole cycle. It can be seen that the total area, maximum area, and total length basically increase monotonically with the increase of displacement amplitude as well as cycle number, which is fairly consistent with the varying tendency of damage as observed before. A similar observation can be made for the average width and maximum width; nevertheless, small fluctuations occur at some displacement magnitudes. It might be attributed to the difficulty in obtaining the actual crack width and the resulting numerical errors.

5.3. Correlation Between Seismic Damage and Crack Information

As seen in the last two sections, both damage indicators and crack properties of the RC short-column specimens generally ascend as the displacement magnitude and cycle numbers increase. It implies that the two types of quantities might have inherent correlations. Accordingly, it is worth further investigating the relationship between seismic damage and crack information.
Table 4 lists the calculated correlation coefficients between the damage indicator and the crack information for the two specimens. It can be clearly seen that the total area, maximum area, and total length of cracks all have high correlations with the damage indicator. In particular, the total area is most correlated to the damage indicator with the correlation coefficients higher than 0.97. However, the correlation coefficients drop obviously for the average width and maximum width, especially in the case of SC2, which has correlation coefficients smaller than 0.9. This outcome is consistent with the observations made in the last section.
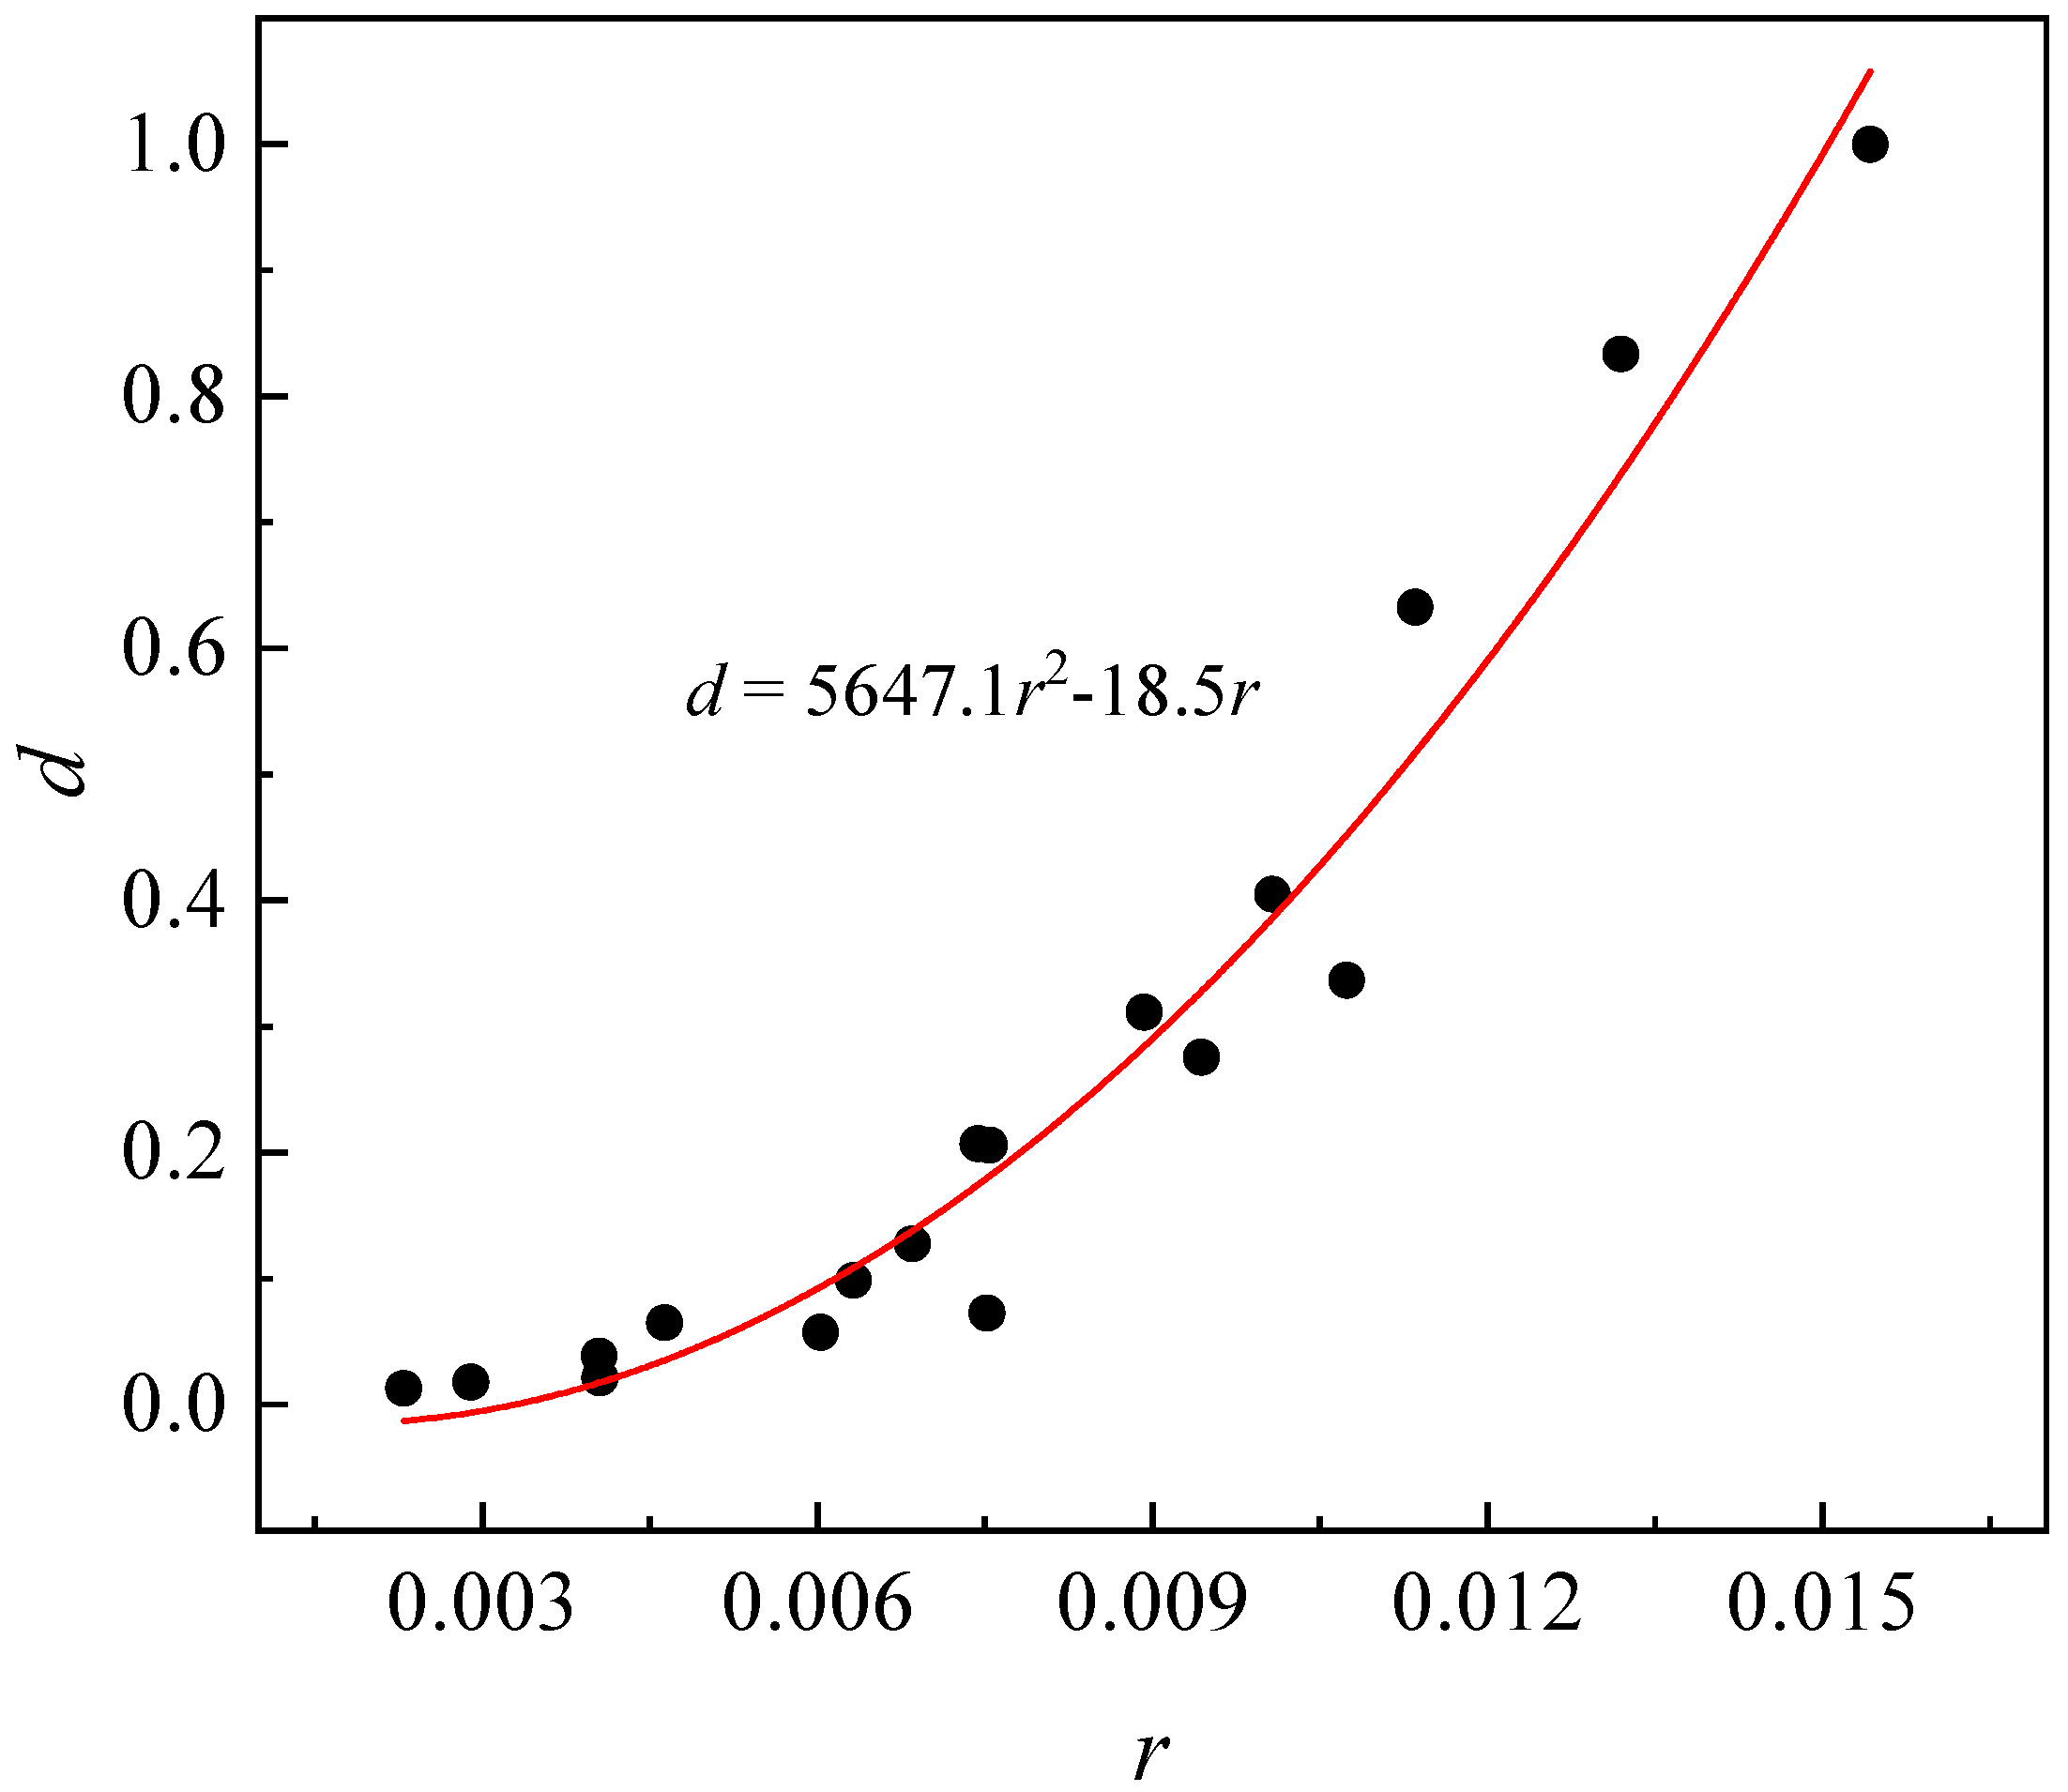
From the above discussion, it can be concluded that the total crack area is most suitably used to quantitatively assess the seismic damage extent of RC short columns. Based on the computed data, Figure 20 shows the scatter plot between the damage indicator and the total crack area. Note that, for the sake of generality, the normalized total crack area r is used instead, which is defined as the ratio between the total crack area and the corresponding monitored area of the surface in this study. By statistical regression analysis, the following relationship can be established with the coefficient of determination of 0.977.
d = 5647.1 r 2 18.5 r
From Equation (9), the damage indicator of the RC short column can be approximately determined for a given total crack area. Therefore, the normalized total crack area can be used to quantify seismic damage of RC short columns from crack images.

6. Conclusions

In this paper, RC short-column specimens were prepared and tested under cyclic loading. The force-displacement hysteresis curves were obtained to calculate the damage indicator of the RC short column based on the energy criterion. Meanwhile, crack images of the column surfaces were taken by smartphones using the partition photographing scheme and image stitching algorithm. The widely used U-Net was enhanced by adding a double attention mechanism to segment the cracks in the images. Finally, the crack geometry information of the specimens was extracted through image analysis and correlated with the damage indicator. Based on the above work, the following conclusions can be drawn:
(1) Compared to the original U-Net, the DA-CrackNet proposed in this study has a higher performance in terms of precision, recall, F1 score, and mIoU due to the incorporation of a double attention mechanism. In particular, it can better recognize fine cracks since the segmented cracks are more continuous.
(2) The total area, maximum area and total length of cracks on the RC short columns basically arise monotonically with the increase of displacement amplitude as well as cycle number. A similar observation is made for the average width and maximum width; nevertheless, small fluctuations occur at some displacement magnitudes.
(3) The total area, maximum area, and total length of cracks on the RC short columns all have high correlations with the damage indicator. In particular, the total crack area is most correlated to the damage indicator with correlation coefficients higher than 0.97. Further, the normalized total crack area is defined as a metric to quantify seismic damage of RC short columns from crack images.
It is however worth noting that the above conclusions are applicable to RC short columns with properties akin to the specimens in this study. For different scenarios, more studies would be necessitated. In addition, more crack morphology metrics, such as orientation and connectivity, could be incorporated into the future study.

Author Contributions

Conceptualization, X.H. and Z.C.; methodology, X.H.; software, Z.C., Q.C. and C.S.; validation, Z.C. and Q.C.; formal analysis, Z.C.; investigation, Z.D.; resources, Z.D.; data curation, Z.C.; writing—original draft preparation, Z.C. and Q.C.; writing—review and editing, X.H.; visualization, Z.C. and Q.C.; supervision, X.H.; project administration, X.H.; funding acquisition, X.H. All authors have read and agreed to the published version of the manuscript.

Funding

This work was supported by The National Natural Science Foundation of China under Grant No. 51578429. The financial support is gratefully acknowledged. Any opinions, findings, conclusions, or recommendations expressed in this study are those of the authors and do not necessarily reflect the views of the sponsor.

Data Availability Statement

The raw data supporting the conclusions of this article will be made available by the authors on request.

Conflicts of Interest

The authors declare no conflict of interest.

References

  1. Rirong, F.U.; Liu, K.; Men, G.; Hui, L. The Impact Analysis of Seismic Performance of Setting Up the Core Column Strengthening Measures on Short Column Structure; Atlantis Press: Amsterdam, The Netherlands, 2016. [Google Scholar] [CrossRef]
  2. Promis, G.; Ferrier, E.; Hamelin, P. Effect of external FRP retrofitting on reinforced concrete short columns for seismic strengthening. Compos. Struct. 2009, 88, 367–379. [Google Scholar] [CrossRef]
  3. Kam, W.Y.; Pampanin, S.; Elwood, K. Seismic Performance of Reinforced Concrete Buildings in the 22 February Christchurch (Lyttleton) Earthquake. Bull. N. Z. Soc. Earthq. Eng. 2011, 44, 223–233. [Google Scholar]
  4. Ricci, P.; Luca, F.D.; Verderame, G.M. 6th April 2009 L’Aquila earthquake, Italy: Reinforced concrete building performance. Bull. Earthq. Eng. 2011, 9, 285–305. [Google Scholar] [CrossRef]
  5. Vicente, R.S.; Rodrigues, H.; Varum, H.; Costa, A.; da Silva, J.A.R.M. Performance of masonry enclosure walls: Lessons learned from recent earthquakes. Earthq. Eng. 2012, 11, 23–34. [Google Scholar] [CrossRef]
  6. Hamidia, M.; Sheikhi, M.; Asjodi, A.H.; Dolatshahi, K.M. Computer vision-based quantification of updated stiffness for damaged RC columns after earthquake. Adv. Eng. Softw. 2024, 190, 103597. [Google Scholar] [CrossRef]
  7. Ji, X.D.; Miao, Z.H.; Kromanis, R. Vision-based measurements of deformations and cracks for RC structure tests. Eng. Struct. 2020, 212, 110508. [Google Scholar] [CrossRef]
  8. Kim, B.; Cho, S. Automated Vision-Based Detection of Cracks on Concrete Surfaces Using a Deep Learning Technique. Sensors 2018, 18, 3452. [Google Scholar] [CrossRef] [PubMed]
  9. Hoang, N.D.; Huynh, T.C.; Tran, V.D. Concrete Spalling Severity Classification Using Image Texture Analysis and a Novel Jellyfish Search Optimized Machine Learning Approach. Adv. Civ. Eng. 2021, 2021, 5551555. [Google Scholar] [CrossRef]
  10. Cao, M.T.; Nguyen, N.M.; Chang, K.T.; Tran, X.-L.; Hoang, N.-D. Automatic recognition of concrete spall using image processing and metaheuristic optimized Logit Boost classification tree. Adv. Eng. Softw. 2021, 159, 103031. [Google Scholar] [CrossRef]
  11. Paal, S.G.; Brilakis, I.; Desroches, R. Automated computer vision-based detection of exposed transverse reinforcement for post-earthquake safety assessments. In Proceedings of the World Conference of Structural Control & Monitoring, Barcelona, Spain, 15–17 July 2014. [Google Scholar]
  12. Xu, Y.; Wei, S.; Bao, Y.; Li, H. Automatic seismic damage identification of reinforced concrete columns from images by a region-based deep convolutional neural network. Struct. Control Health Monit. 2019, 26, e2313. [Google Scholar] [CrossRef]
  13. Bae, H.; An, Y.K. Computer vision-based statistical crack quantification for concrete structures. Measurement 2023, 211, 112632. [Google Scholar] [CrossRef]
  14. Nguyen, H.N.; Kam, T.Y.; Cheng, P.Y. An Automatic Approach for Accurate Edge Detection of Concrete Crack Utilizing 2D Geometric Features of Crack. J. Signal Process. Syst. Signal Image Video Technol. 2014, 77, 221–240. [Google Scholar] [CrossRef]
  15. Vashpanov, Y.; Son, J.Y.; Heo, G.; Podousova, T.; Kim, Y.S. Determination of Geometric Parameters of Cracks in Concrete by Image Processing. Adv. Civ. Eng. 2019, 2019, 2398124. [Google Scholar] [CrossRef]
  16. Long, J.; Shelhamer, E.; Darrell, T. Fully Convolutional Networks for Semantic Segmentation. In Proceedings of the IEEE Conference on Computer Vision and Pattern Recognition (CVPR), Boston, MA, USA, 7–12 June 2015; pp. 3431–3440. [Google Scholar]
  17. Ronneberger, O.; Fischer, P.; Brox, T. U-Net: Convolutional Networks for Biomedical Image Segmentation. In Proceedings of the Medical Image Computing and Computer-Assisted Intervention, Munich, Germany, 5–9 October 2015; Navab, N., Hornegger, J., Wells, W.M., Frangi, A.F., Eds.; Springer: Cham, Switzerland, 2015; Volume 9351, pp. 234–241. [Google Scholar]
  18. He, K.M.; Gkioxari, G.; Dollár, P.; Girshick, R. Mask R-CNN. IEEE Trans. Pattern Anal. Mach. Intell. 2020, 42, 386–397. [Google Scholar] [CrossRef]
  19. Zhang, J.M.; Lu, C.Q.; Wang, J.; Wang, L.; Yue, X.-G. Concrete Cracks Detection Based on FCN with Dilated Convolution. Appl. Sci. 2019, 9, 2686. [Google Scholar] [CrossRef]
  20. Zhang, L.X.; Shen, J.K.; Zhu, B.J. A research on an improved Unet-based concrete crack detection algorithm. Struct. Health Monit. Int. J. 2021, 20, 1864–1879. [Google Scholar] [CrossRef]
  21. Yu, C.; Du, J.; Li, M.; Li, Y.; Li, W. An Improved U-Net Model for Concrete Crack Detection. Mach. Learn. Appl. 2022, 10, 100436. [Google Scholar]
  22. Xiang, C.; Guo, J.J.; Cao, R.; Deng, L. A crack-segmentation algorithm fusing transformers and convolutional neural networks for complex detection scenarios. Autom. Constr. 2023, 152, 104894. [Google Scholar] [CrossRef]
  23. Shamsabadi, E.A.; Xu, C.; Rao, A.S.; Nguyen, T.; Ngo, T.; Dias-Da-Costa, D. Vision transformer-based autonomous crack detection on asphalt and concrete surfaces. Autom. Constr. 2022, 140, 104316. [Google Scholar] [CrossRef]
  24. Liu, Z.; Yeoh, J.; Gu, X.Y.; Dong, Q.; Chen, Y.; Wu, W.; Wang, L.; Wang, D. Automatic pixel-level detection of vertical cracks in asphalt pavement based on GPR investigation and improved mask R-CNN. Autom. Constr. 2023, 146, 104689. [Google Scholar] [CrossRef]
  25. Zhang, C.G.; Shu, J.P.; Zhang, H.; Ning, Y.; Yu, Y. Estimation of load-carrying capacity of cracked RC beams using 3D digital twin model integrated with point clouds and images. Eng. Struct. 2024, 310, 118126. [Google Scholar] [CrossRef]
  26. Miao, Z.H.; Ji, X.D.; Okazaki, T.; Takahashi, N. Pixel-level multicategory detection of visible seismic damage of reinforced concrete components. Comput. Aided Civ. Infrastruct. Eng. 2021, 36, 620–637. [Google Scholar] [CrossRef]
  27. Zou, D.J.; Zhang, M.; Bai, Z.L.; Liu, T.; Zhou, A.; Wang, X.; Cui, W.; Zhang, S. Multicategory damage detection and safety assessment of post-earthquake reinforced concrete structures using deep learning. Comput. Aided Civ. Infrastruct. Eng. 2022, 37, 1188–1204. [Google Scholar] [CrossRef]
  28. Han, X.; Zhao, Z.; Chen, L.; Hu, X.; Tian, Y.; Zhai, C.; Wang, L.; Huang, X. Structural damage-causing concrete cracking detection based on a deep-learning method. Constr. Build. Mater. 2022, 337, 127562. [Google Scholar] [CrossRef]
  29. Dunphy, K.; Sadhu, A.; Wang, J. Multiclass damage detection in concrete structures using a transfer learning-based generative adversarial networks. Struct. Control Health Monit. 2022, 19, e3079. [Google Scholar] [CrossRef]
  30. Hamidia, M.; Afzali, M.; Jamshidian, S.; Safi, M. Post-earthquake stiffness loss estimation for reinforced concrete columns using fractal analysis of crack patterns. Struct. Concr. J. FIB 2023, 24, 3933–3951. [Google Scholar] [CrossRef]
  31. Zhang, H.; Gao, K.; Huang, J.W.G. Fully decouple convolutional network for damage detection of rebars in RC beams. Eng. Struct. 2023, 285, 116023. [Google Scholar] [CrossRef]
  32. Zhang, G.; Sun, B.; Wang, S.; Xu, J.; Zhang, H. RC column damaged classification based on deep contrasted attention. J. Civ. Struct. Health Monit. 2023, 13, 15–33. [Google Scholar] [CrossRef]
  33. Yilmaz, M.; Dogan, G.; Arslan, M.H.; Ilki, A. Categorization of Post-Earthquake Damages in RC Structural Elements with Deep Learning Approach. J. Earthq. Eng. 2024, 28, 2620–2651. [Google Scholar] [CrossRef]
  34. Bazrafshan, P.; On, T.; Basereh, S.; Okumus, P.; Ebrahimkhanlou, A. A graph-based method for quantifying crack patterns on reinforced concrete shear walls. Comput. Aided Civ. Infrastruct. Eng. 2024, 39, 498–517. [Google Scholar] [CrossRef]
  35. Dung, C.V.; Anh, L.D. Autonomous concrete crack detection using deep fully convolutional neural network. Autom. Constr. 2019, 99, 52–58. [Google Scholar] [CrossRef]
  36. Liu, Z.Q.; Cao, Y.W.; Wang, Y.Z.; Wang, W. Computer vision-based concrete crack detection using U-net fully convolutional networks. Autom. Constr. 2019, 104, 129–139. [Google Scholar] [CrossRef]
  37. Xu, S.; Tang, H.; Wang, X.; Wang, D. Assessment of geometric parameters of segmented crack on concrete building facade using deep learning. Structures 2023, 57, 105188. [Google Scholar] [CrossRef]
  38. Chu, H.; Chun, P. Fine-grained crack segmentation for high-resolution images via a multiscale cascaded network. Comput. -Aided Civ. Infrastruct. Eng. 2024, 39, 575–594. [Google Scholar] [CrossRef]
  39. GB50010-2010; Code for Design of Concrete Structures. China Architecture & Building Press: Beijing, China, 2010. (In Chinese)
  40. JGJ/T 101-2015; Specification for Seismic Test Buildings. China Architecture & Building Press: Beijing, China, 2015. (In Chinese)
  41. Feng, P.; Qiang, H.L.; Ye, L.P. Discussion and Definition on Yield Points of Materials, Members and Structures. Eng. Mech. 2017, 34, 36–46. [Google Scholar] [CrossRef]
  42. Belloni, V.; Sjölander, A.; Ravanelli, R.; Crespi, M.; Nascetti, A. Crack Monitoring from Motion (CMfM): Crack detection and measurement using cameras with non-fixed positions. Autom. Constr. 2023, 156, 105072. [Google Scholar] [CrossRef]
  43. Harris, C. A combined corner and edge detector. In Proceedings of the Fourth Alvey Vision Conference, Manchester, UK, 31 August–2 September 1988; pp. 147–151. [Google Scholar]
  44. Toyama, F.; Shoji, K. Image mosaicing from a set of images without configuration information. In Proceedings of the 17th International Conference on Pattern Recognition, Cambridge, UK, 26 August 2004; pp. 899–902. [Google Scholar]
  45. Lowe, D.G. Distinctive Image Features from Scale-Invariant Key points. Int. J. Comput. Vis. 2004, 60, 91–110. [Google Scholar] [CrossRef]
  46. Brown, M.; Lowe, D.G. Automatic Panoramic Image Stitching using Invariant Features. Int. J. Comput. Vis. 2007, 74, 59–73. [Google Scholar] [CrossRef]
  47. Fischler, M.A.; Bolles, R.C. Random sample consensus: A paradigm for model fitting with applications to image analysis and automated cartography. Commun. ACM 1981, 24, 381–395. [Google Scholar] [CrossRef]
  48. Chen, K.L.; Wang, M.L. Image stitching algorithm research based on OpenCV. In Proceedings of the 33rd Chinese Control Conference, Nanjing, China, 28–30 July 2014; pp. 7292–7297. [Google Scholar]
  49. Ju, H.Y.; Li, W.; Tighe, S.S.; Xu, Z.; Zhai, J. CrackU-net: A novel deep convolutional neural network for pixelwise pavement crack detection. Struct. Control Health Monit. 2020, 27, e2551. [Google Scholar]
  50. Tang, Y.Z.; Zhang, A.A.; Luo, L.; Wang, G.; Yang, E. Pixel-level pavement crack segmentation with encoder-decoder network. Measurement 2021, 184, 109914. [Google Scholar] [CrossRef]
  51. Schlemper, J.; Oktay, O.; Schaap, M.; Heinrich, M.; Kainz, B.; Glocker, B.; Rueckert, D. Attention gated networks: Learning to leverage salient regions in medical images. Med. Image Anal. 2019, 53, 197–207. [Google Scholar] [CrossRef] [PubMed]
  52. Zhou, Z.; Siddiquee, M.M.R.; Tajbakhsh, N.; Liang, J. UNet++: A Nested U-Net Architecture for Medical Image Segmentation. In Proceedings of the 4th Deep Learning in Medical Image Analysis (DLMIA) Workshop, Granada, Spain, 20 September 2018. [Google Scholar]
  53. Huang, H.; Lin, L.; Tong, R.; Hu, H.; Zhang, Q.; Iwamoto, Y.; Han, X.; Chen, Y.-W.; Wu, J. UNet 3+: A Full-Scale Connected UNet for Medical Image Segmentation. arXiv 2020, arXiv:2004.08790. [Google Scholar]
  54. Chen, J.; Lu, Y.; Yu, Q.; Luo, X.; Adeli, E.; Wang, Y.; Lu, L.; Yuille, A.L.; Zhou, Y. TransUNet: Transformers Make Strong Encoders for Medical Image Segmentation. arXiv 2021, arXiv:2102.04306. [Google Scholar]
  55. Hu, J.; Shen, L.; Sun, G.; Wu, E. Squeeze-and-Excitation Networks. IEEE Trans. Pattern Anal. Mach. Intell. 2020, 42, 2011–2023. [Google Scholar] [CrossRef]
  56. Woo, S.H.; Park, J.; Lee, J.Y.; Kweon, I.S. CBAM: Convolutional Block Attention Module. In Proceedings of the 15th European Conference on Computer Vision (ECCV), Munich, Germany, 8–14 September 2018; Ferrari, V., Hebert, M., Sminchisescu, C., Weiss, Y., Eds.; Springer: Cham, Switzerland, 2018; Volume 11211, pp. 3–19. [Google Scholar]
  57. Russell, B.C.; Torralba, A.; Murphy, K.P.; Freeman, W.T. LabelMe: A database and web-based tool for image annotation. Int. J. Comput. Vis. 2008, 77, 157–173. [Google Scholar] [CrossRef]
  58. Zhong, Z.; Zheng, L.; Kang, G.L.; Li, S.; Yang, Y. Random Erasing Data Augmentation. In Proceedings of the 34th AAAI Conference on Artificial Intelligence/32nd Innovative Applications of Artificial Intelligence Conference/10th AAAI Symposium on Educational Advances in Artificial Intelligence, New York, NY, USA, 7–12 February 2020; Volume 34, pp. 13001–13008. [Google Scholar]
  59. Telea, A. An Image Inpainting Technique Based on the Fast Marching Method. J. Graph. Tools 2004, 9, 23–34. [Google Scholar] [CrossRef]
  60. Sudre, C.H.; Li, W.Q.; Vercauteren, T.; Ourselin, S.; Cardoso, M.J. Generalised Dice Overlap as a Deep Learning Loss Function for Highly Unbalanced Segmentations. In Proceedings of the 3rd MICCAI International Workshop on Deep Learning in Medical Image Analysis (DLMIA)/7th International Workshop on Multimodal Learning for Clinical Decision Support (ML-CDS), Québec City, QC, Canada, 14 September 2017; Cardoso, M.J., Arbel, T., Eds.; Springer: Cham, Switzerland, 2017; Volume 10553, pp. 240–248. [Google Scholar]
  61. Yadav, S.; Shukla, S. Analysis of k-fold cross-validation over hold-out validation on colossal datasets for quality classification. In Proceedings of the 2016 IEEE 6th International Conference on Advanced Computing (IACC), Bhimavaram, India, 27–28 February 2016; pp. 78–83. [Google Scholar]
  62. Rajput, V. Robustness of different loss functions and their impact on networks learning capability. arXiv 2021, arXiv:2110.08322. [Google Scholar]
  63. Trucco, E. Computer and Robot Vision. AI Commun. 1995, 8, 50–51. [Google Scholar] [CrossRef]
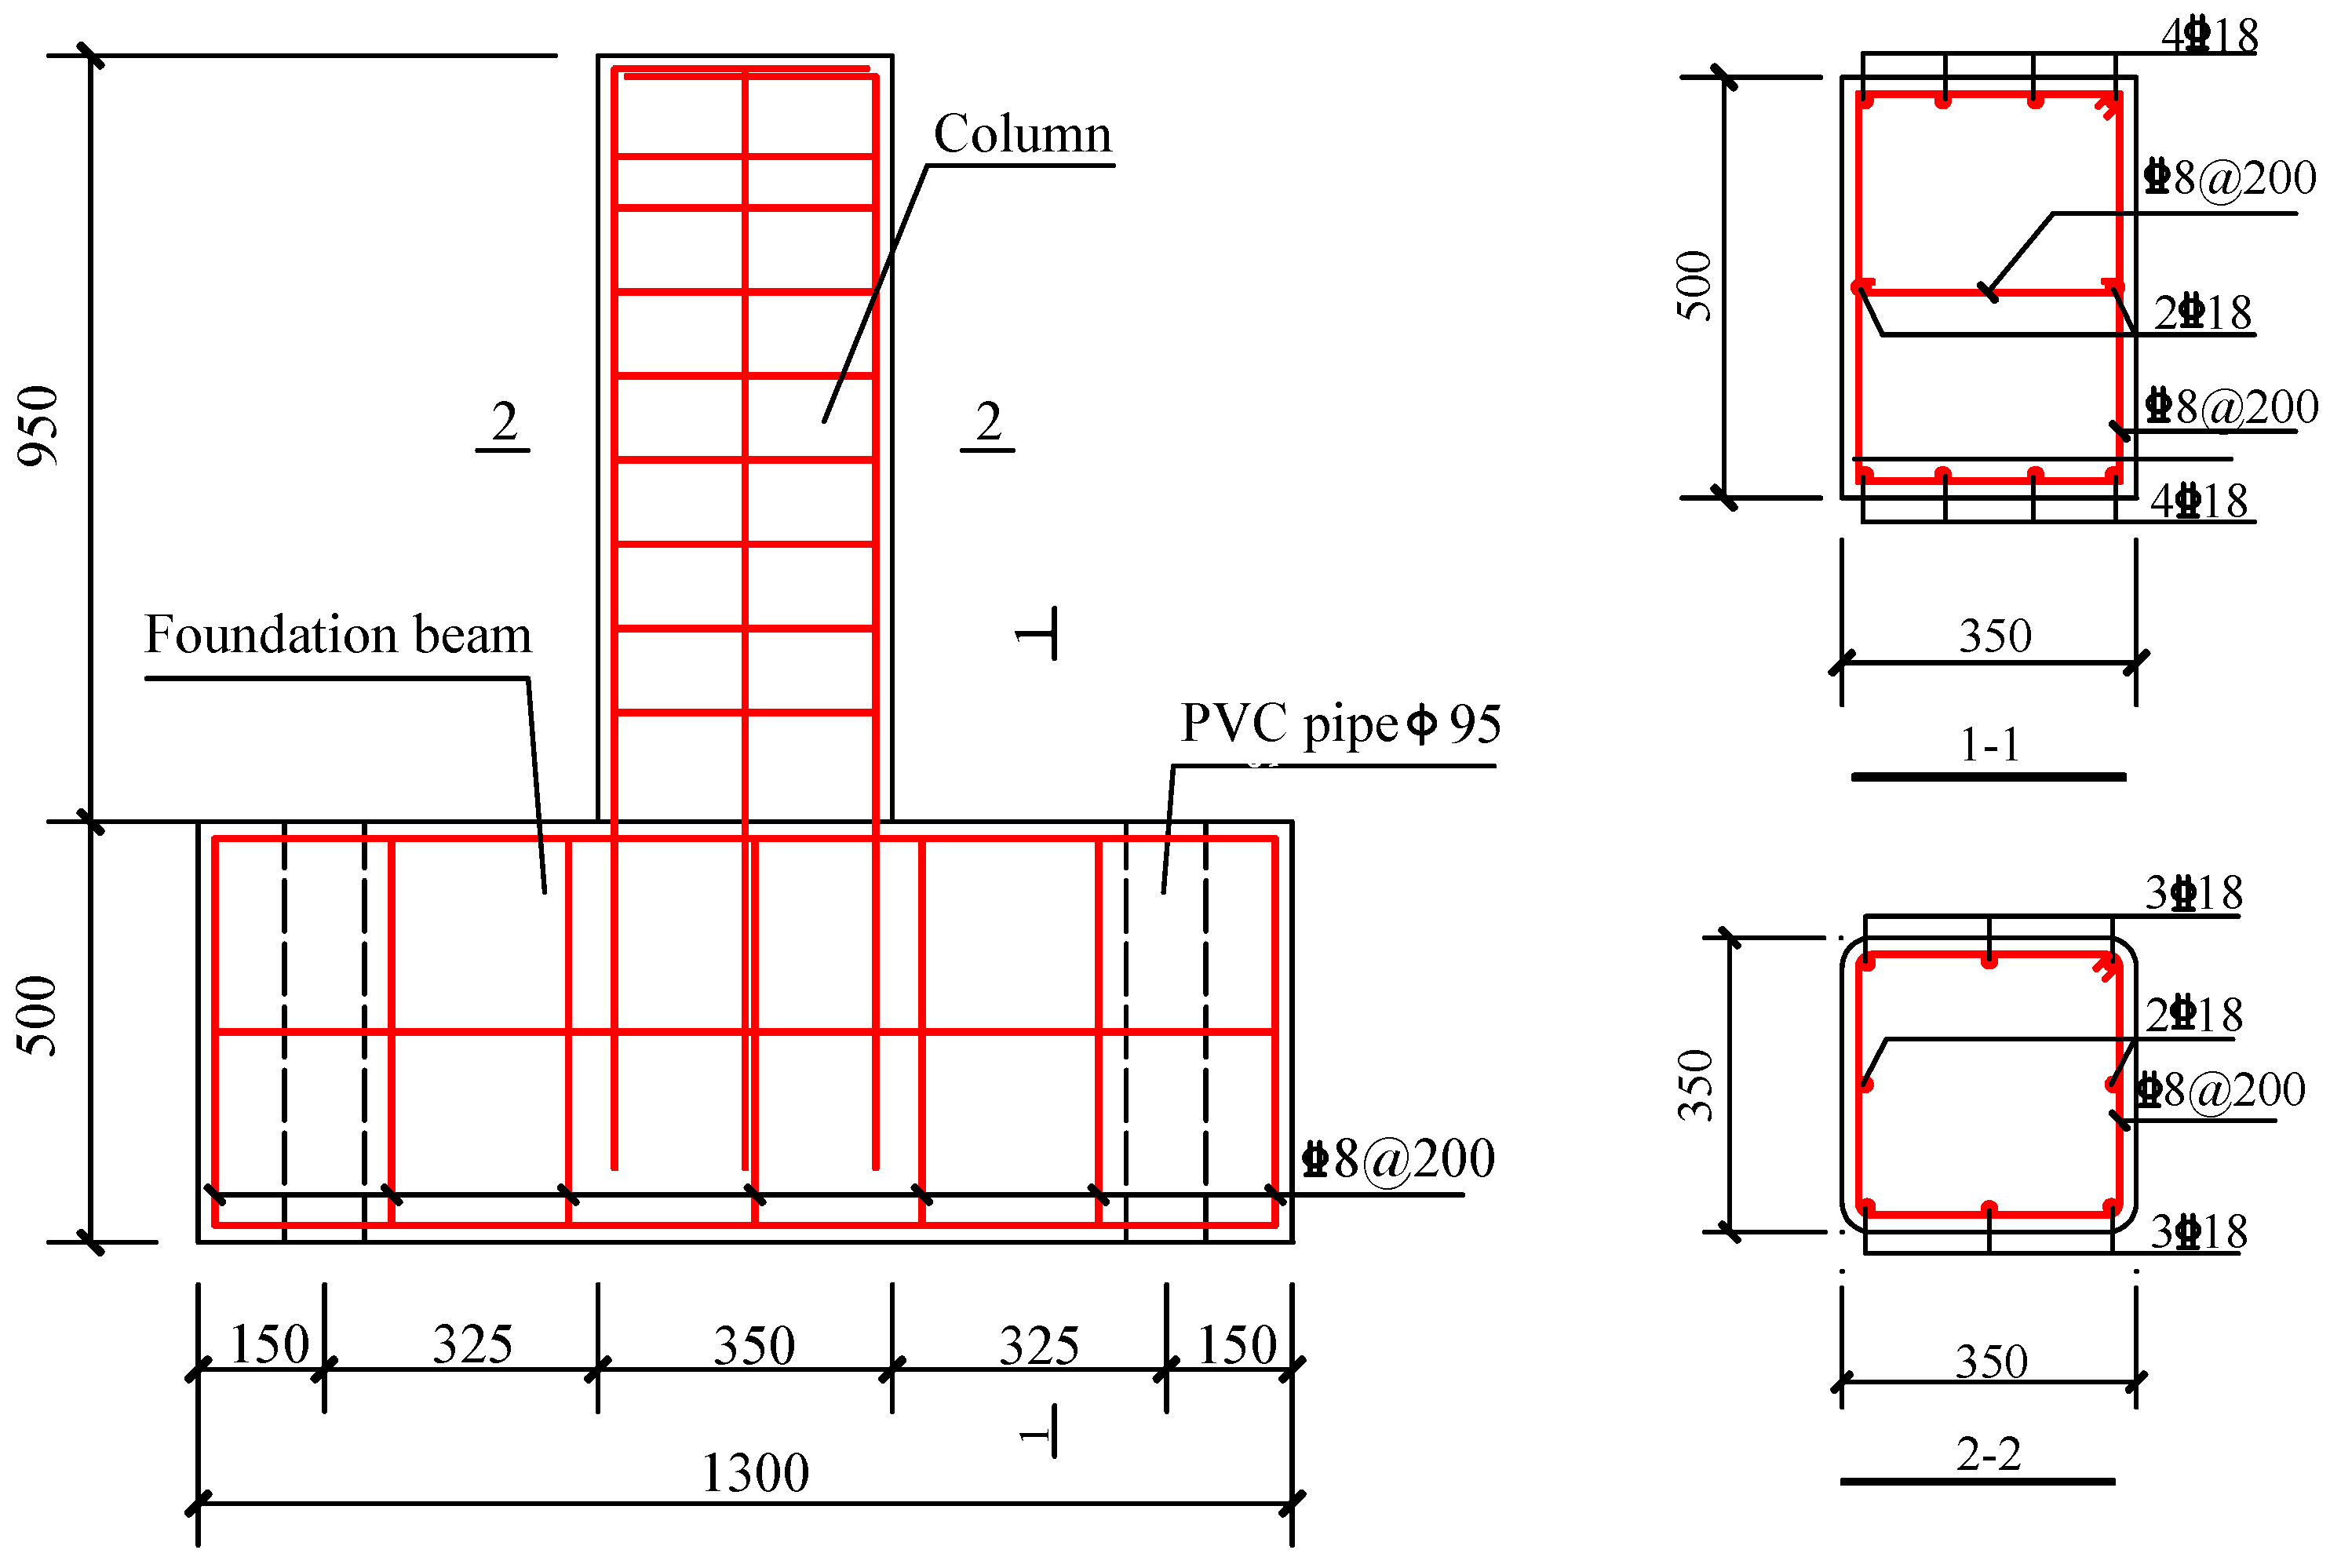
Figure 1. Details of specimens (unit: mm).
Buildings 15 00322 g001
Figure 2. Prototype of the prepared specimens.
Buildings 15 00322 g002
Figure 3. Test setup.
Buildings 15 00322 g003
Figure 5. Loading protocol.
Buildings 15 00322 g005
Figure 6. Damage statuses of SC1 under different displacement magnitudes.
Buildings 15 00322 g006
Figure 7. Damage statuses of SC2 under different displacement magnitudes.
Buildings 15 00322 g007
Figure 9. Partition photographing scheme proposed in this study.
Buildings 15 00322 g009
Figure 10. Example of crack image stitching.
Buildings 15 00322 g010
Figure 11. Architecture of the original U-Net.
Buildings 15 00322 g011
Figure 12. Architecture of the DA-CrackNet proposed in this study. (a) Overall architecture. (b) Soft attention mechanism. (c) Convolutional block attention mechanism. (d) Channel attention mechanism. (e) Spatial attention mechanism.
Buildings 15 00322 g012aBuildings 15 00322 g012b
Figure 13. Procedure of the fill-crack method proposed in this study.
Buildings 15 00322 g013
Figure 14. The loss curve of the DA-CrackNet.
Buildings 15 00322 g014
Figure 15. The loss curve for the U-Net.
Buildings 15 00322 g015
Figure 16. Comparison between the segmentation results using the two networks.
Buildings 15 00322 g016
Figure 17. Segmentation of crack images of SC2.
Buildings 15 00322 g017
Figure 18. Damage development histograms of the two RC short columns under cyclic loading.
Buildings 15 00322 g018
Figure 19. Crack information. (a) Crack area of SC1. (b) Crack area of SC2. (c) Crack length of SC1. (d) Crack length of SC2. (e) Crack width of SC1. (f) Crack width of SC2.
Buildings 15 00322 g019aBuildings 15 00322 g019b
Figure 20. Relationship between the damage indicator and total crack area.
Buildings 15 00322 g020
Table 1. Mechanical properties of materials used.
TypeStrength GradeEc or Es (GPa)fy (MPa)fcu or fu (MPa)εy
ConcreteC6035-54.49-
Longitudinal reinforcementHRB400200395.62590.392.95 × 10−3
StirrupHRB400201467.71534.402.66 × 10−3
Table 2. Huawei P40 Pro parameters.
Sensor Size/InchEffective Pixels per MillionImage Resolution
1/1.2850006144 × 8192
Table 3. Performance of the DA-CrackNet and the U-Net.
NetworkPrecision (%)Recall (%)F1 Score (%)mIoU (%)Time (s)
DA-CrackNet94.0579.0376.2769.1653.97
U-Net93.8476.9975.7668.7747.56
Table 4. Correlation between damage indicator and crack information.
SpecimenTotal AreaMaximum AreaTotal LengthAverage WidthMaximum Width
SC10.9730.9680.9600.9360.938
SC20.9700.9020.9130.9020.899
Disclaimer/Publisher’s Note: The statements, opinions and data contained in all publications are solely those of the individual author(s) and contributor(s) and not of MDPI and/or the editor(s). MDPI and/or the editor(s) disclaim responsibility for any injury to people or property resulting from any ideas, methods, instructions or products referred to in the content.