
Energy Performance Study of a Data Center Combined Cooling System Integrated with Heat Storage and Waste Heat Recovery System

 ,
, 
Abstract
1. Introduction
1.1. Literature Reviews
1.2. Research Gaps and New Contribution of This Study
- (1)
- For data centers, many studies only postulated the servers working under a constant load level; however, in a real situation, the working loads of servers are not a constant in time series, which poses a chance for optimized control of both thermal and electrical power management systems. In this paper, a consideration of partial load status is involved in the system dynamic simulation, which can offer a more realistic result.
- (2)
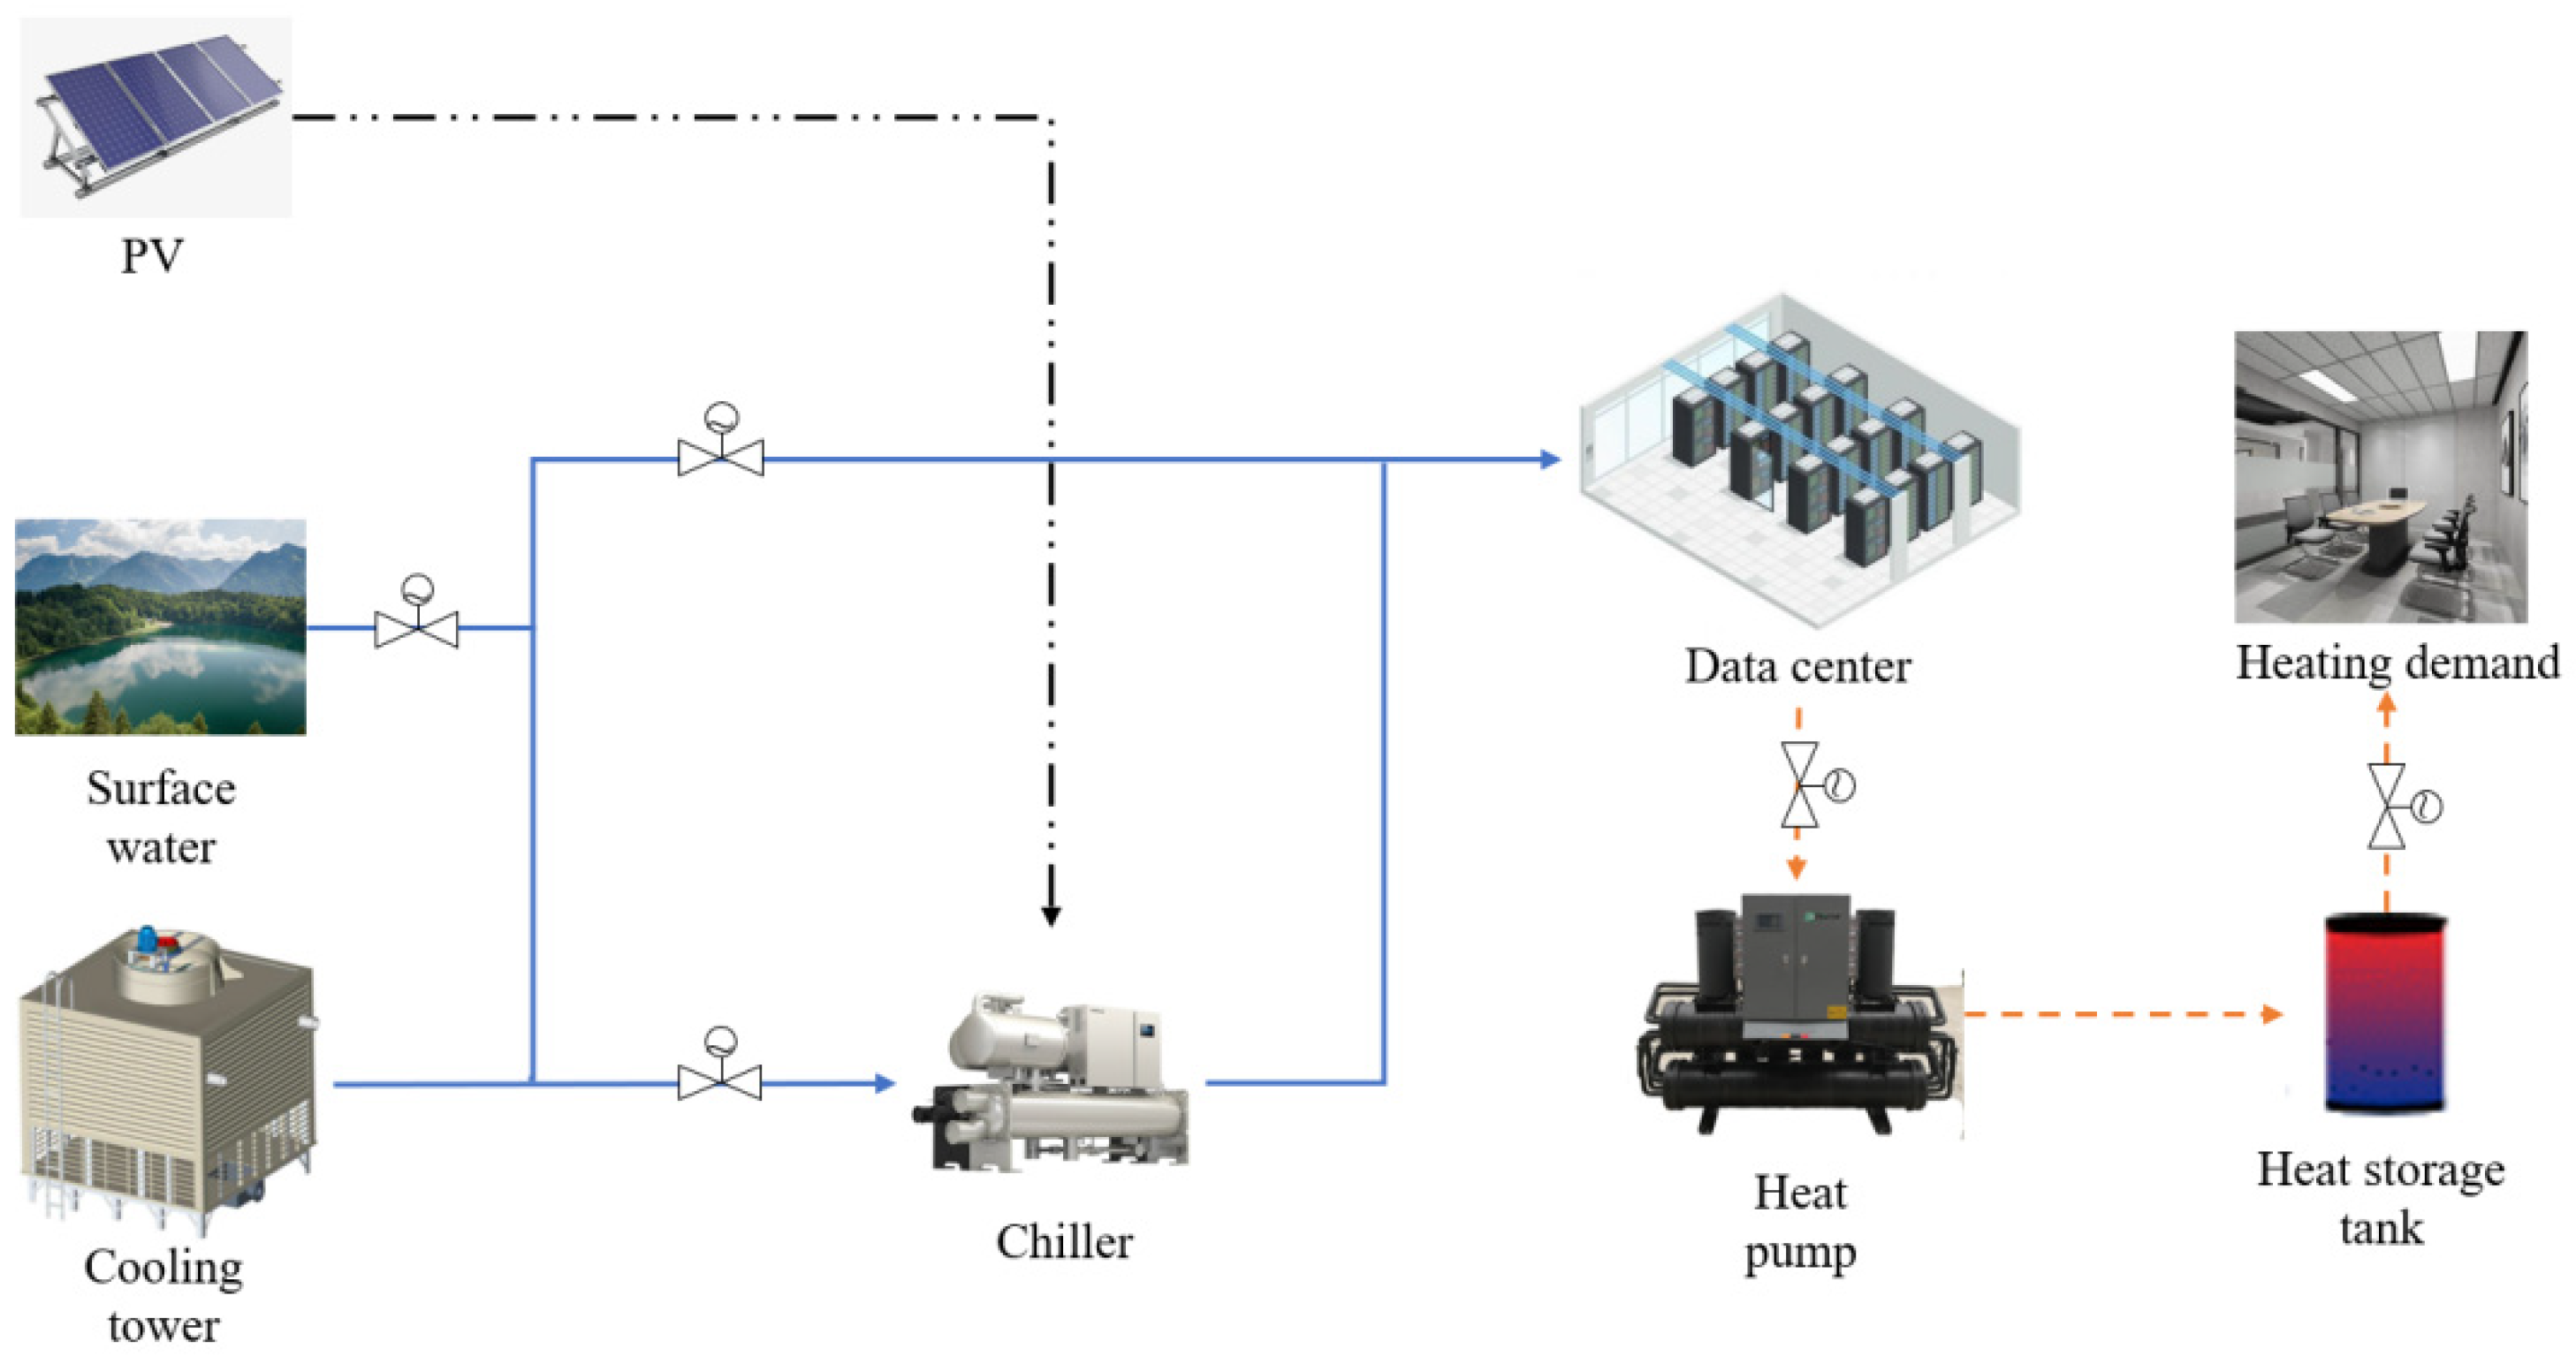
- A complete and sophisticated multiple energy sources integrated model for data centers is established, which can offer free cooling using energy from lakes or rivers, PV power generation from solar energy, and waste heat recovery for building heating.
- (3)
- Detailed analyses that are conducted with quantitative estimation of energy saving potentials of the proposed system are presented, which can provide a solid guide for the future design and operation of a greener data center in the age of AI.
2. Methodology and Model
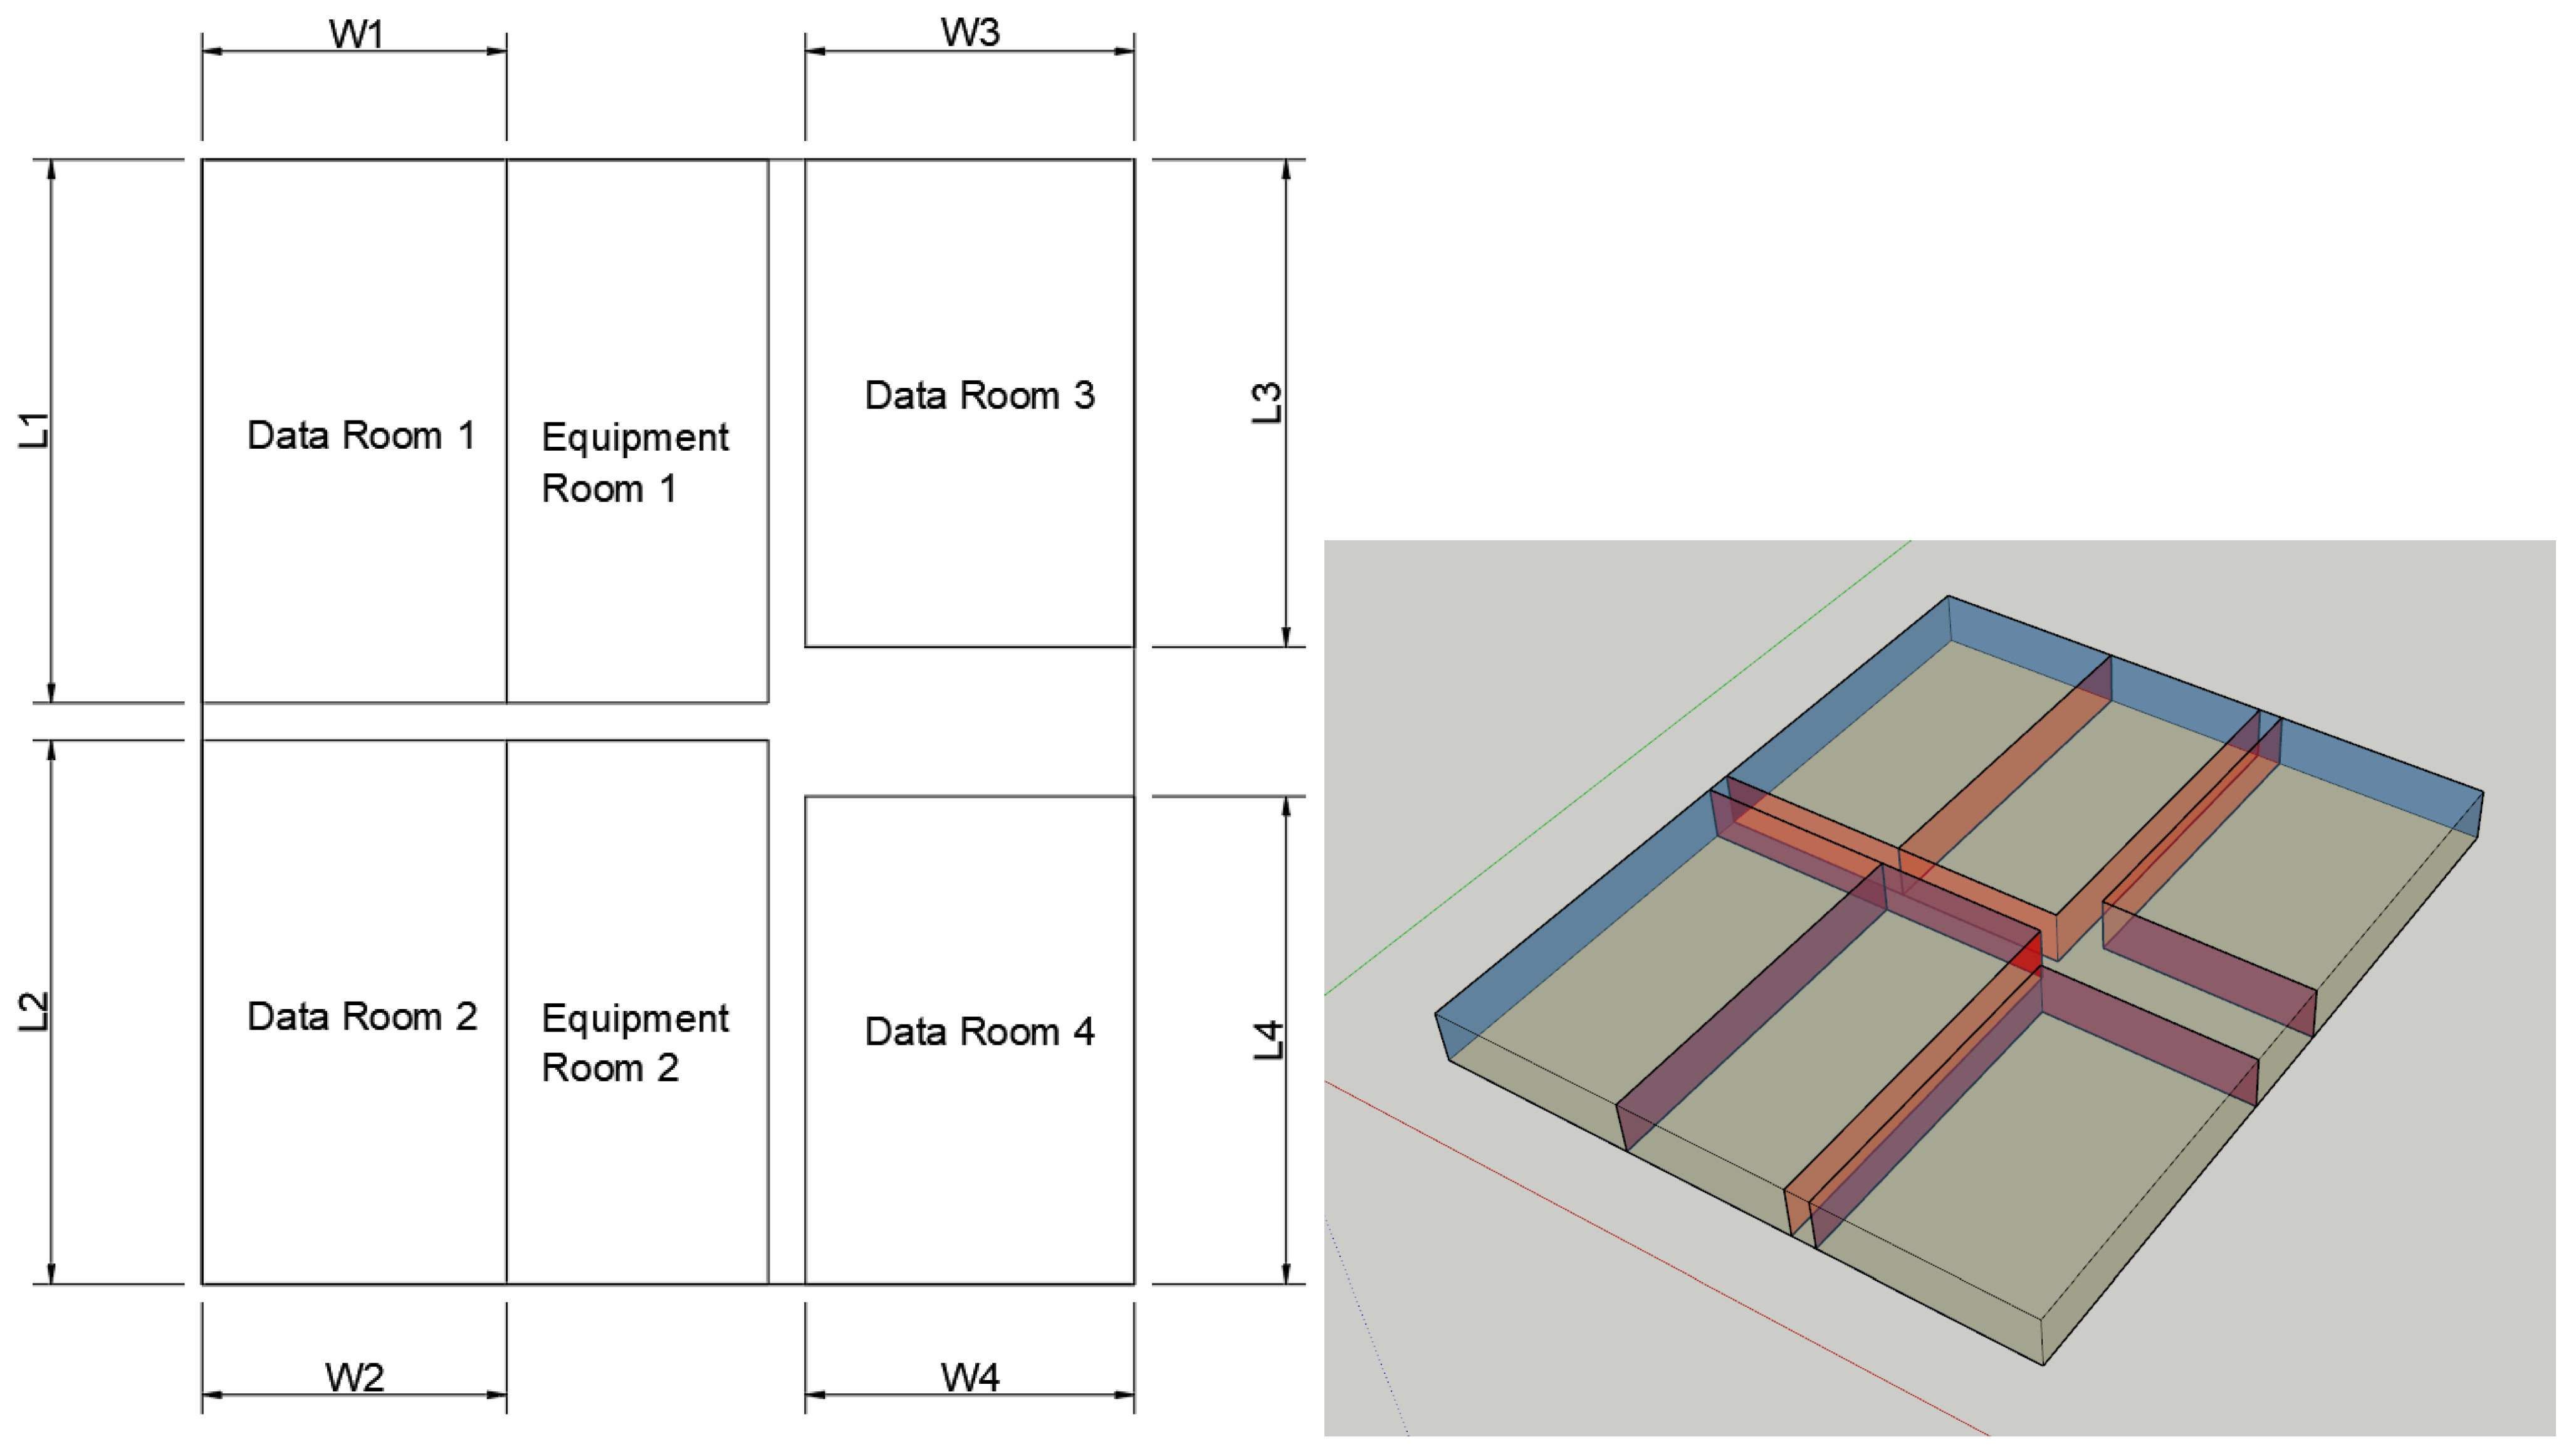
2.1. Model of Data Center
2.2. Multi-Energy Source Integration System Structure
2.3. Sub-Models of the System
- (1)
- Chiller
- (2)
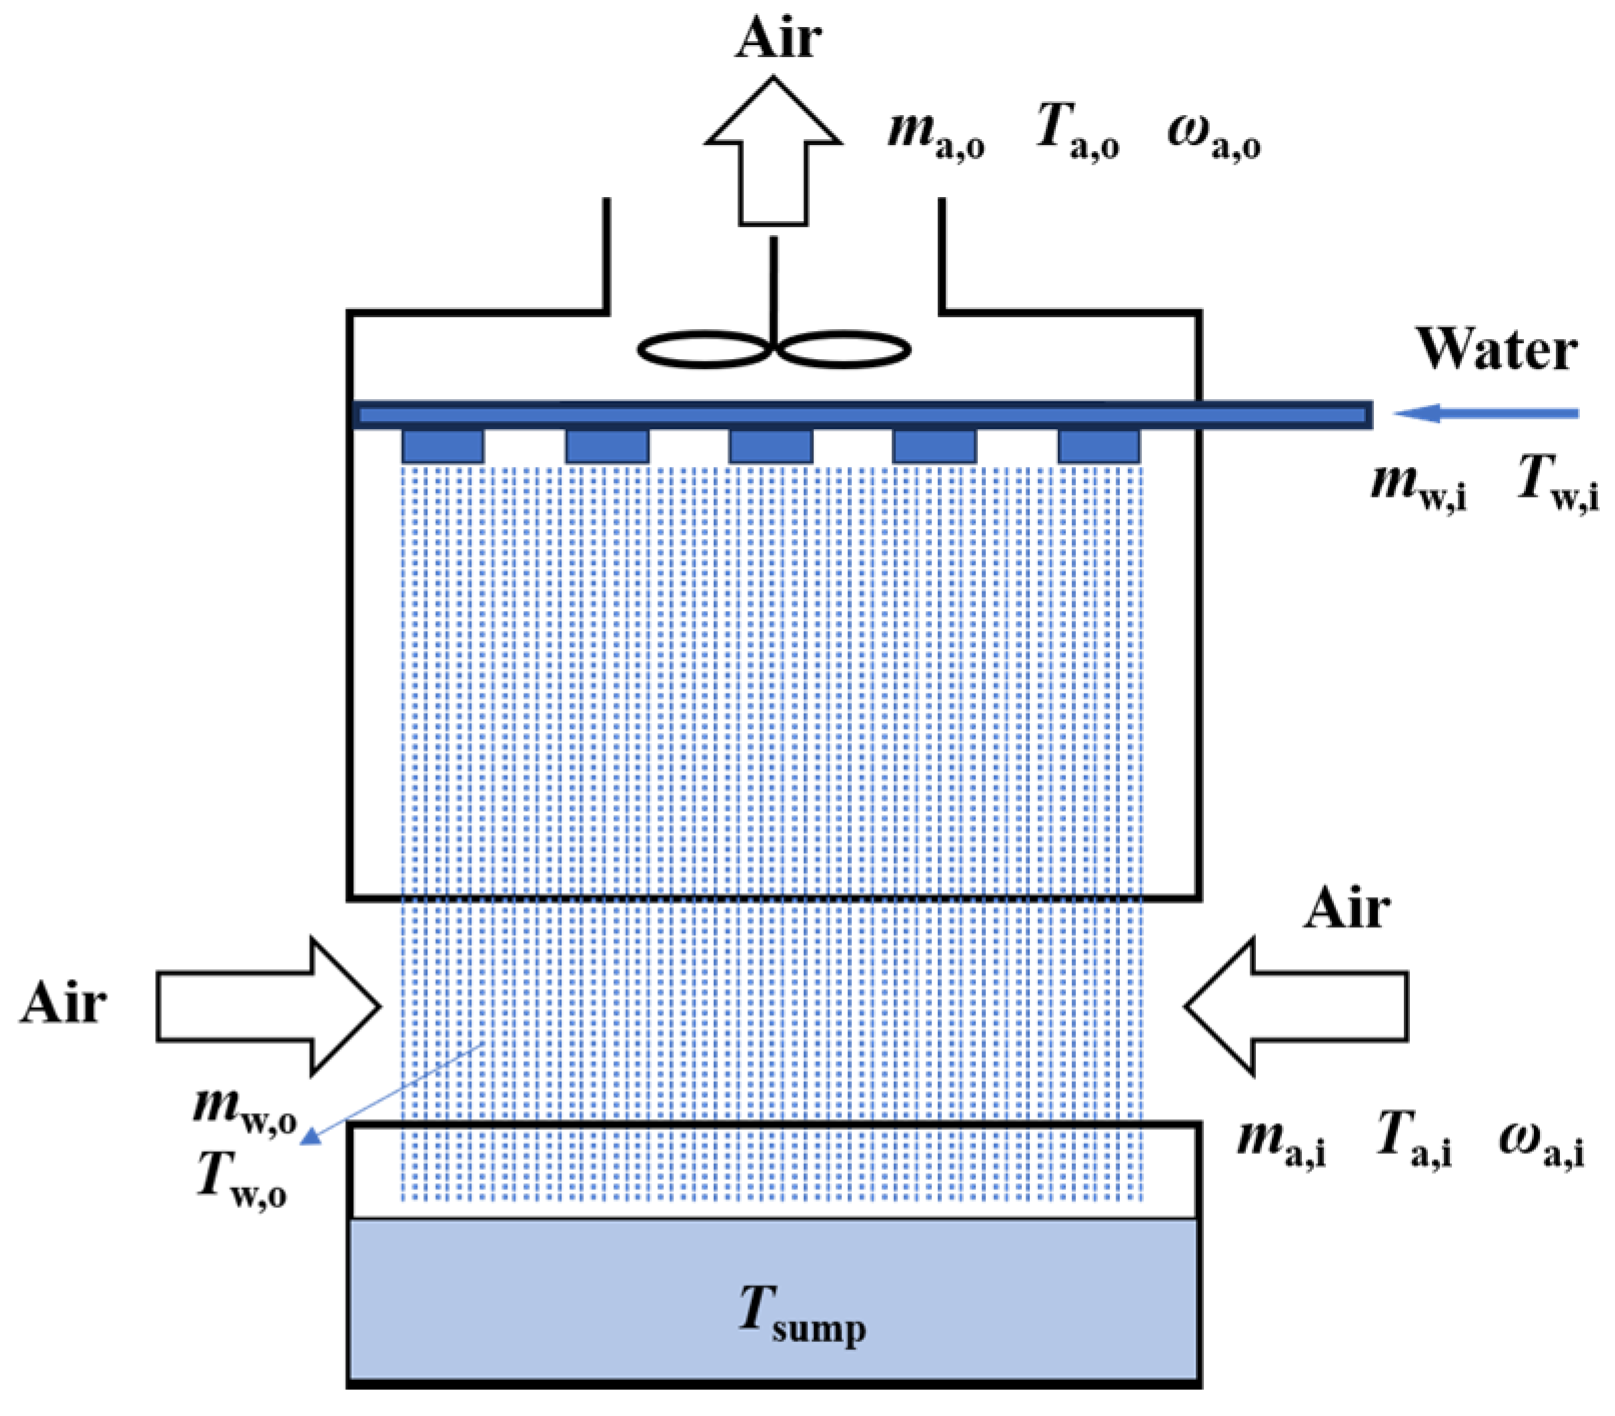
- Cooling Tower
- (3)
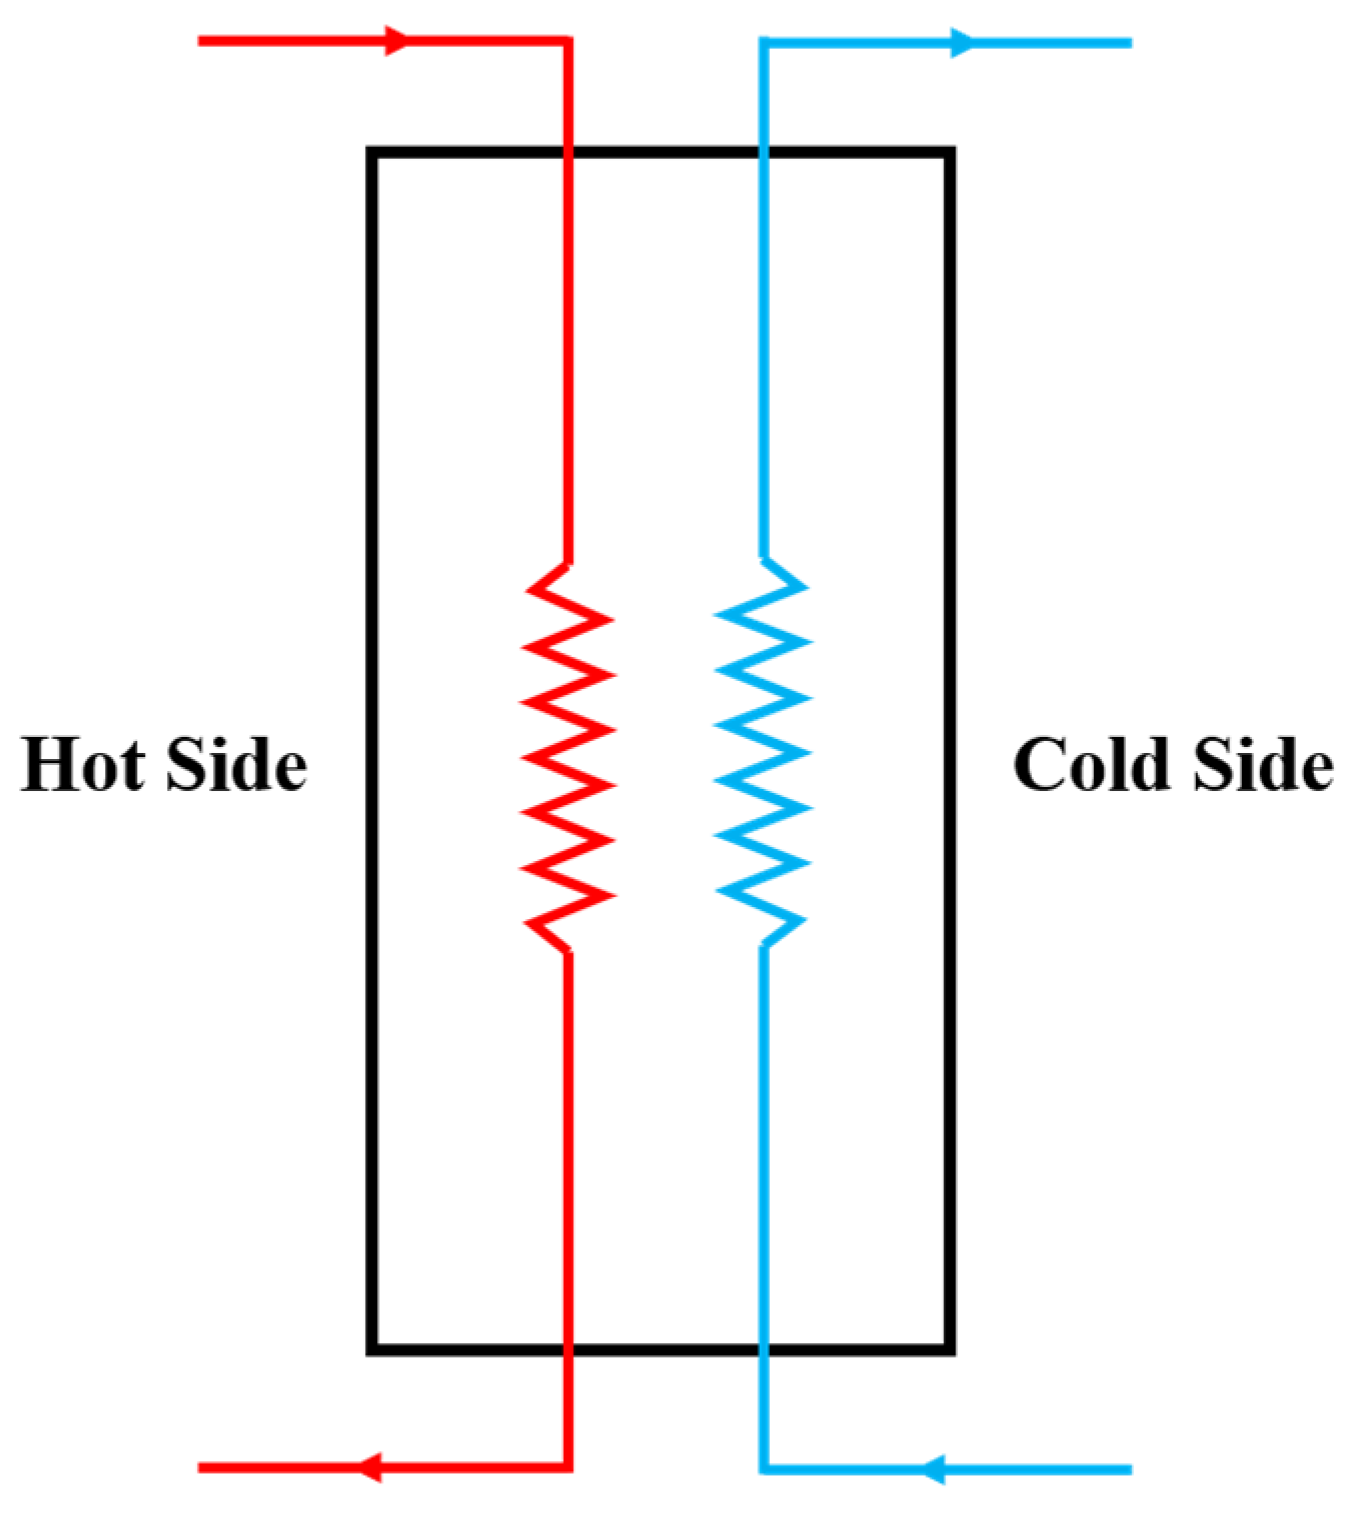
- Heat Exchanger
- (4)
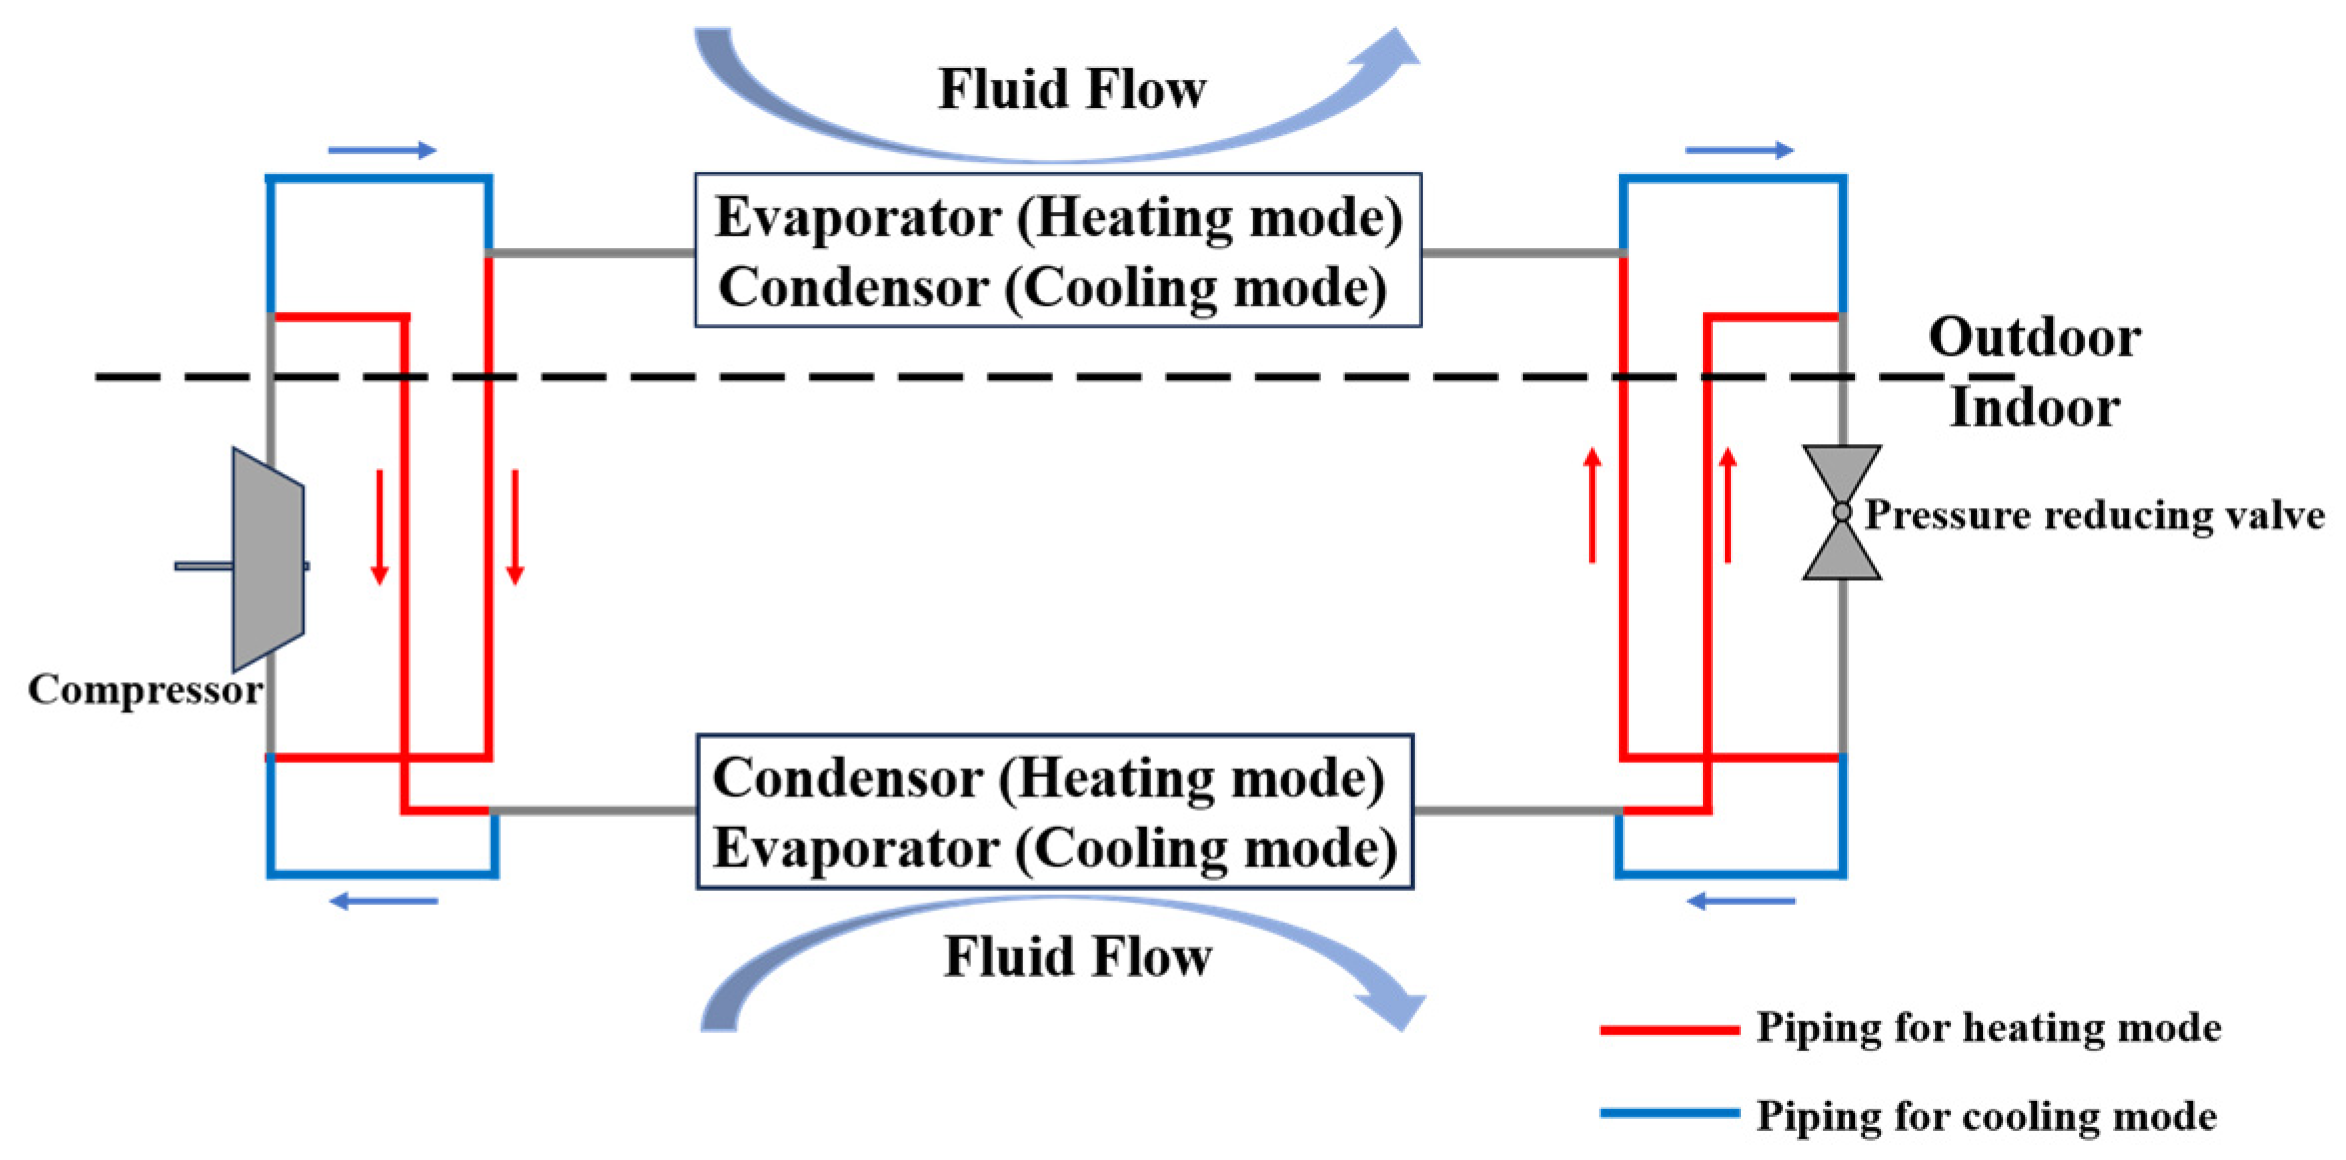
- Water Source Heat Pump
- (5)
- Pump and Fan
- (6)
- Photovoltaic System
- (7)
- Hot Water Tank
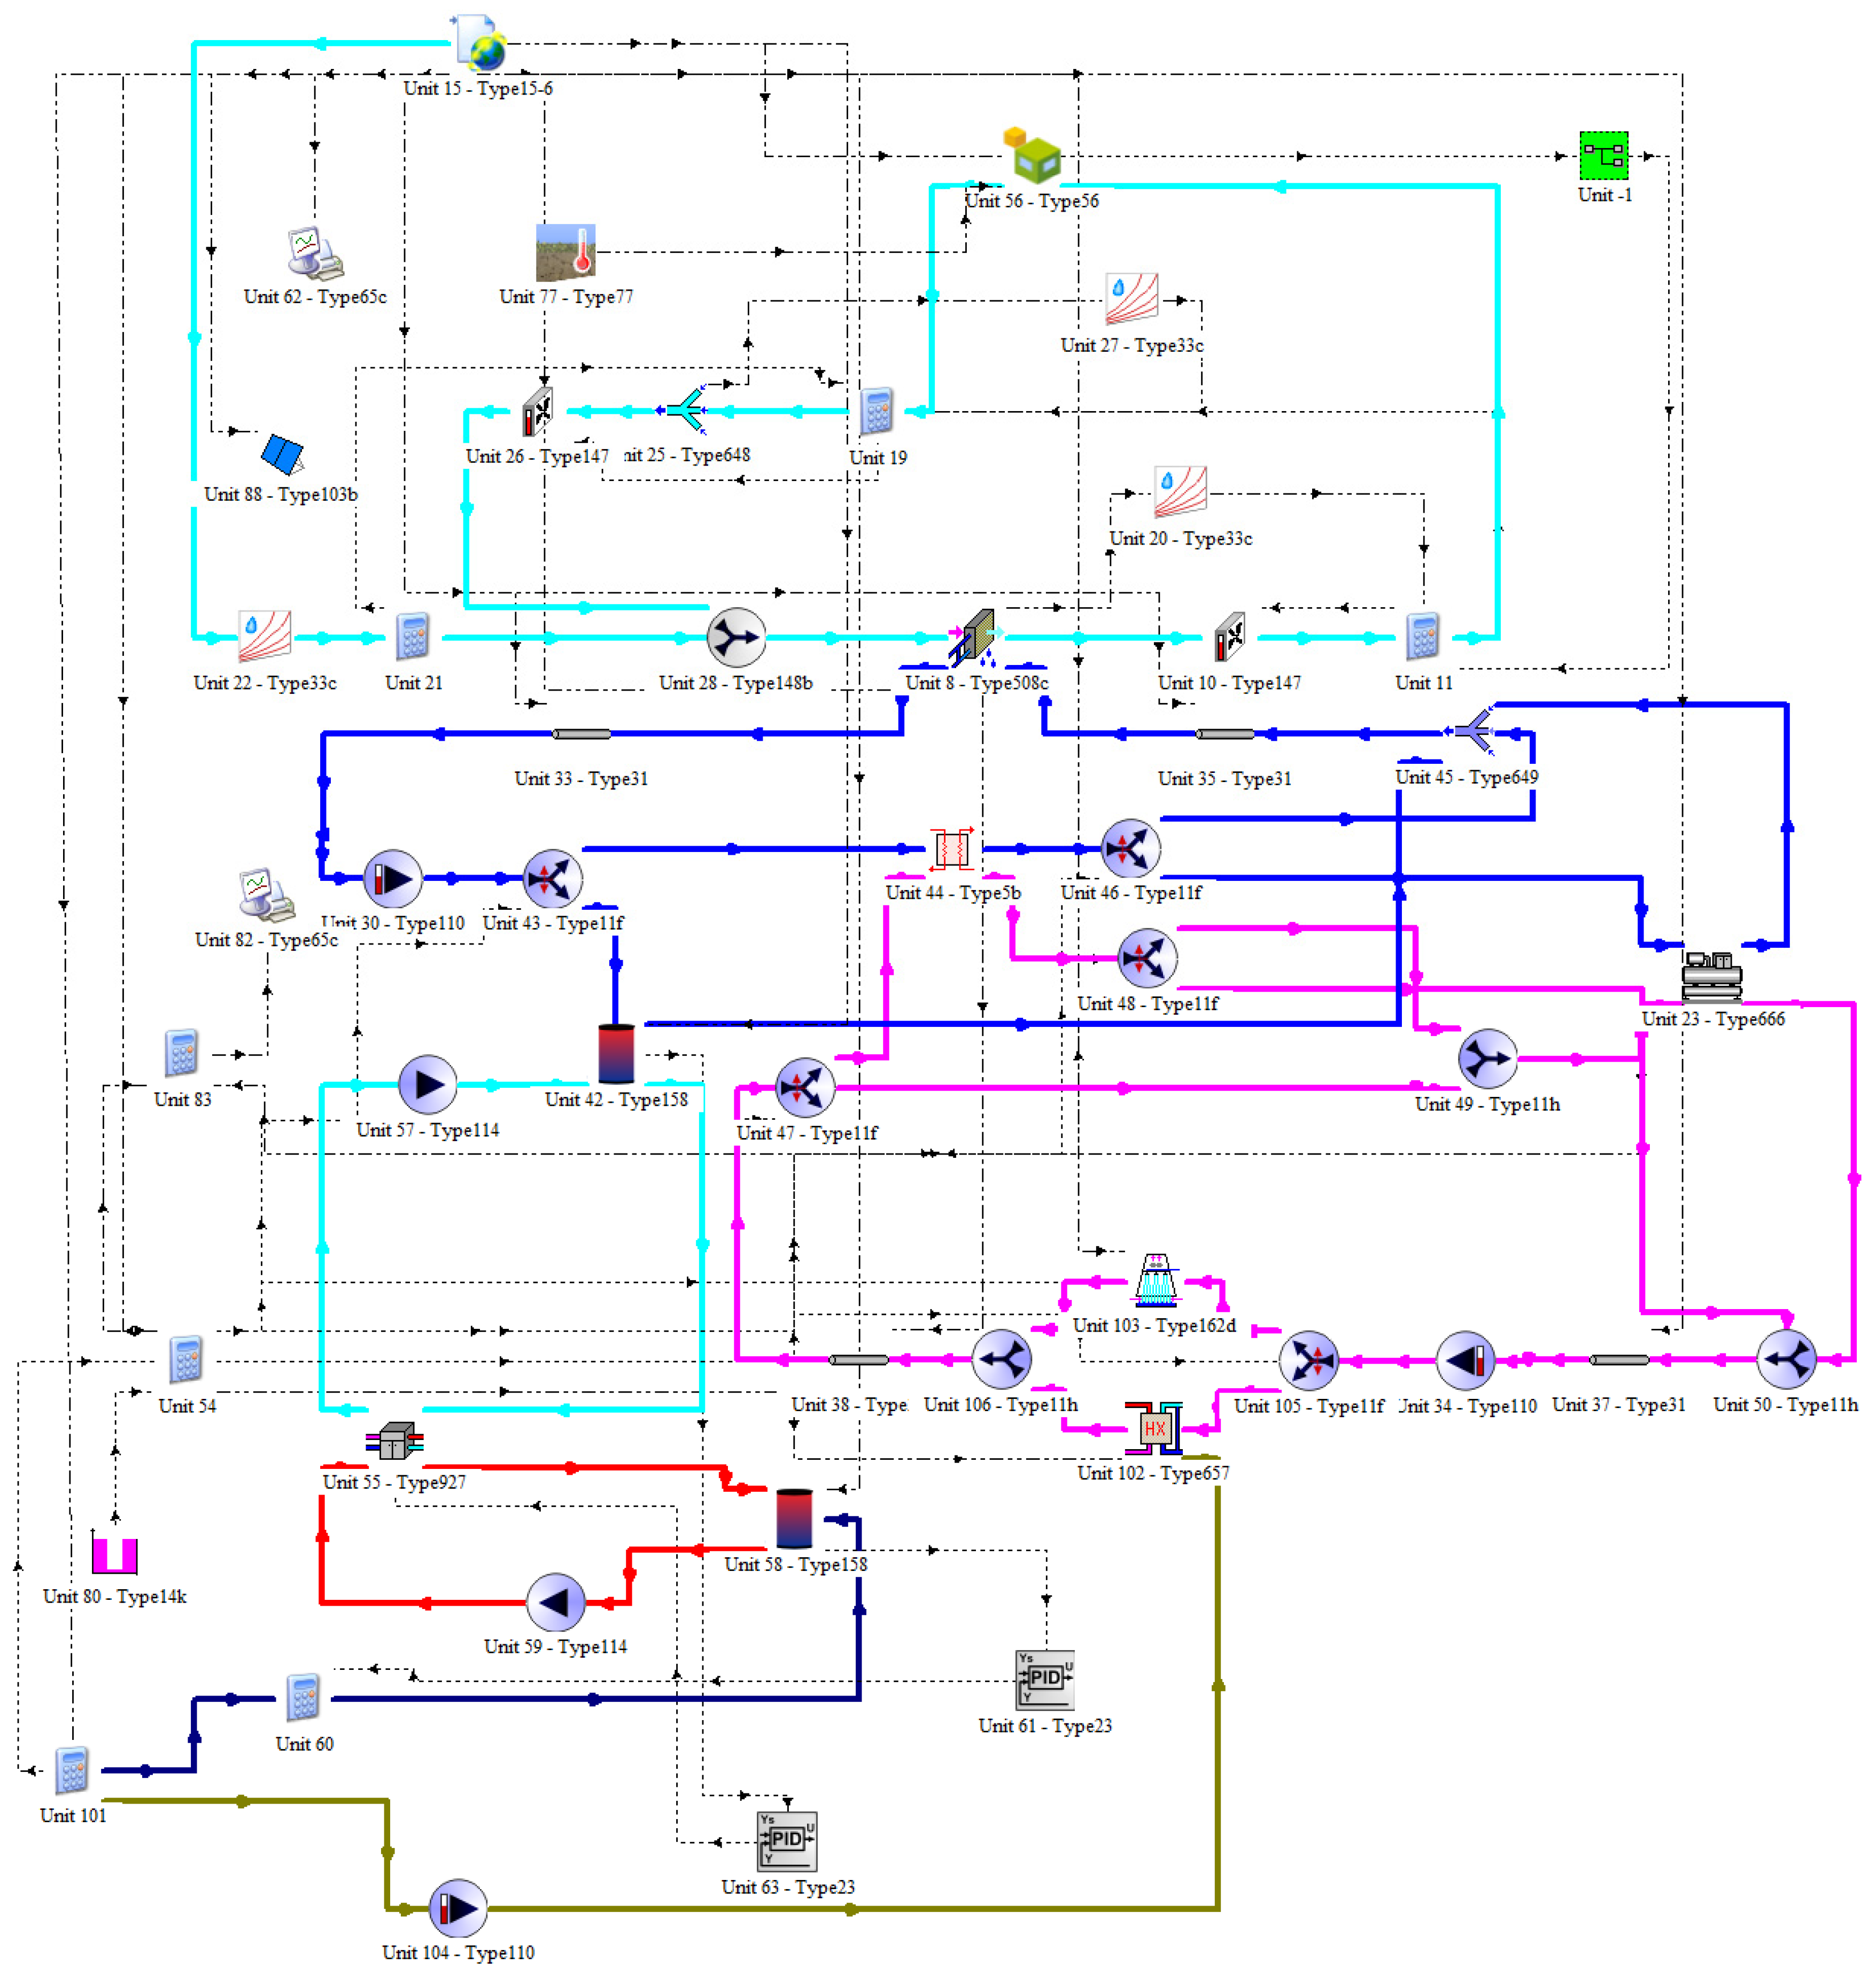
2.4. Simulation Model
2.5. Model Validation
3. Results and Discussion
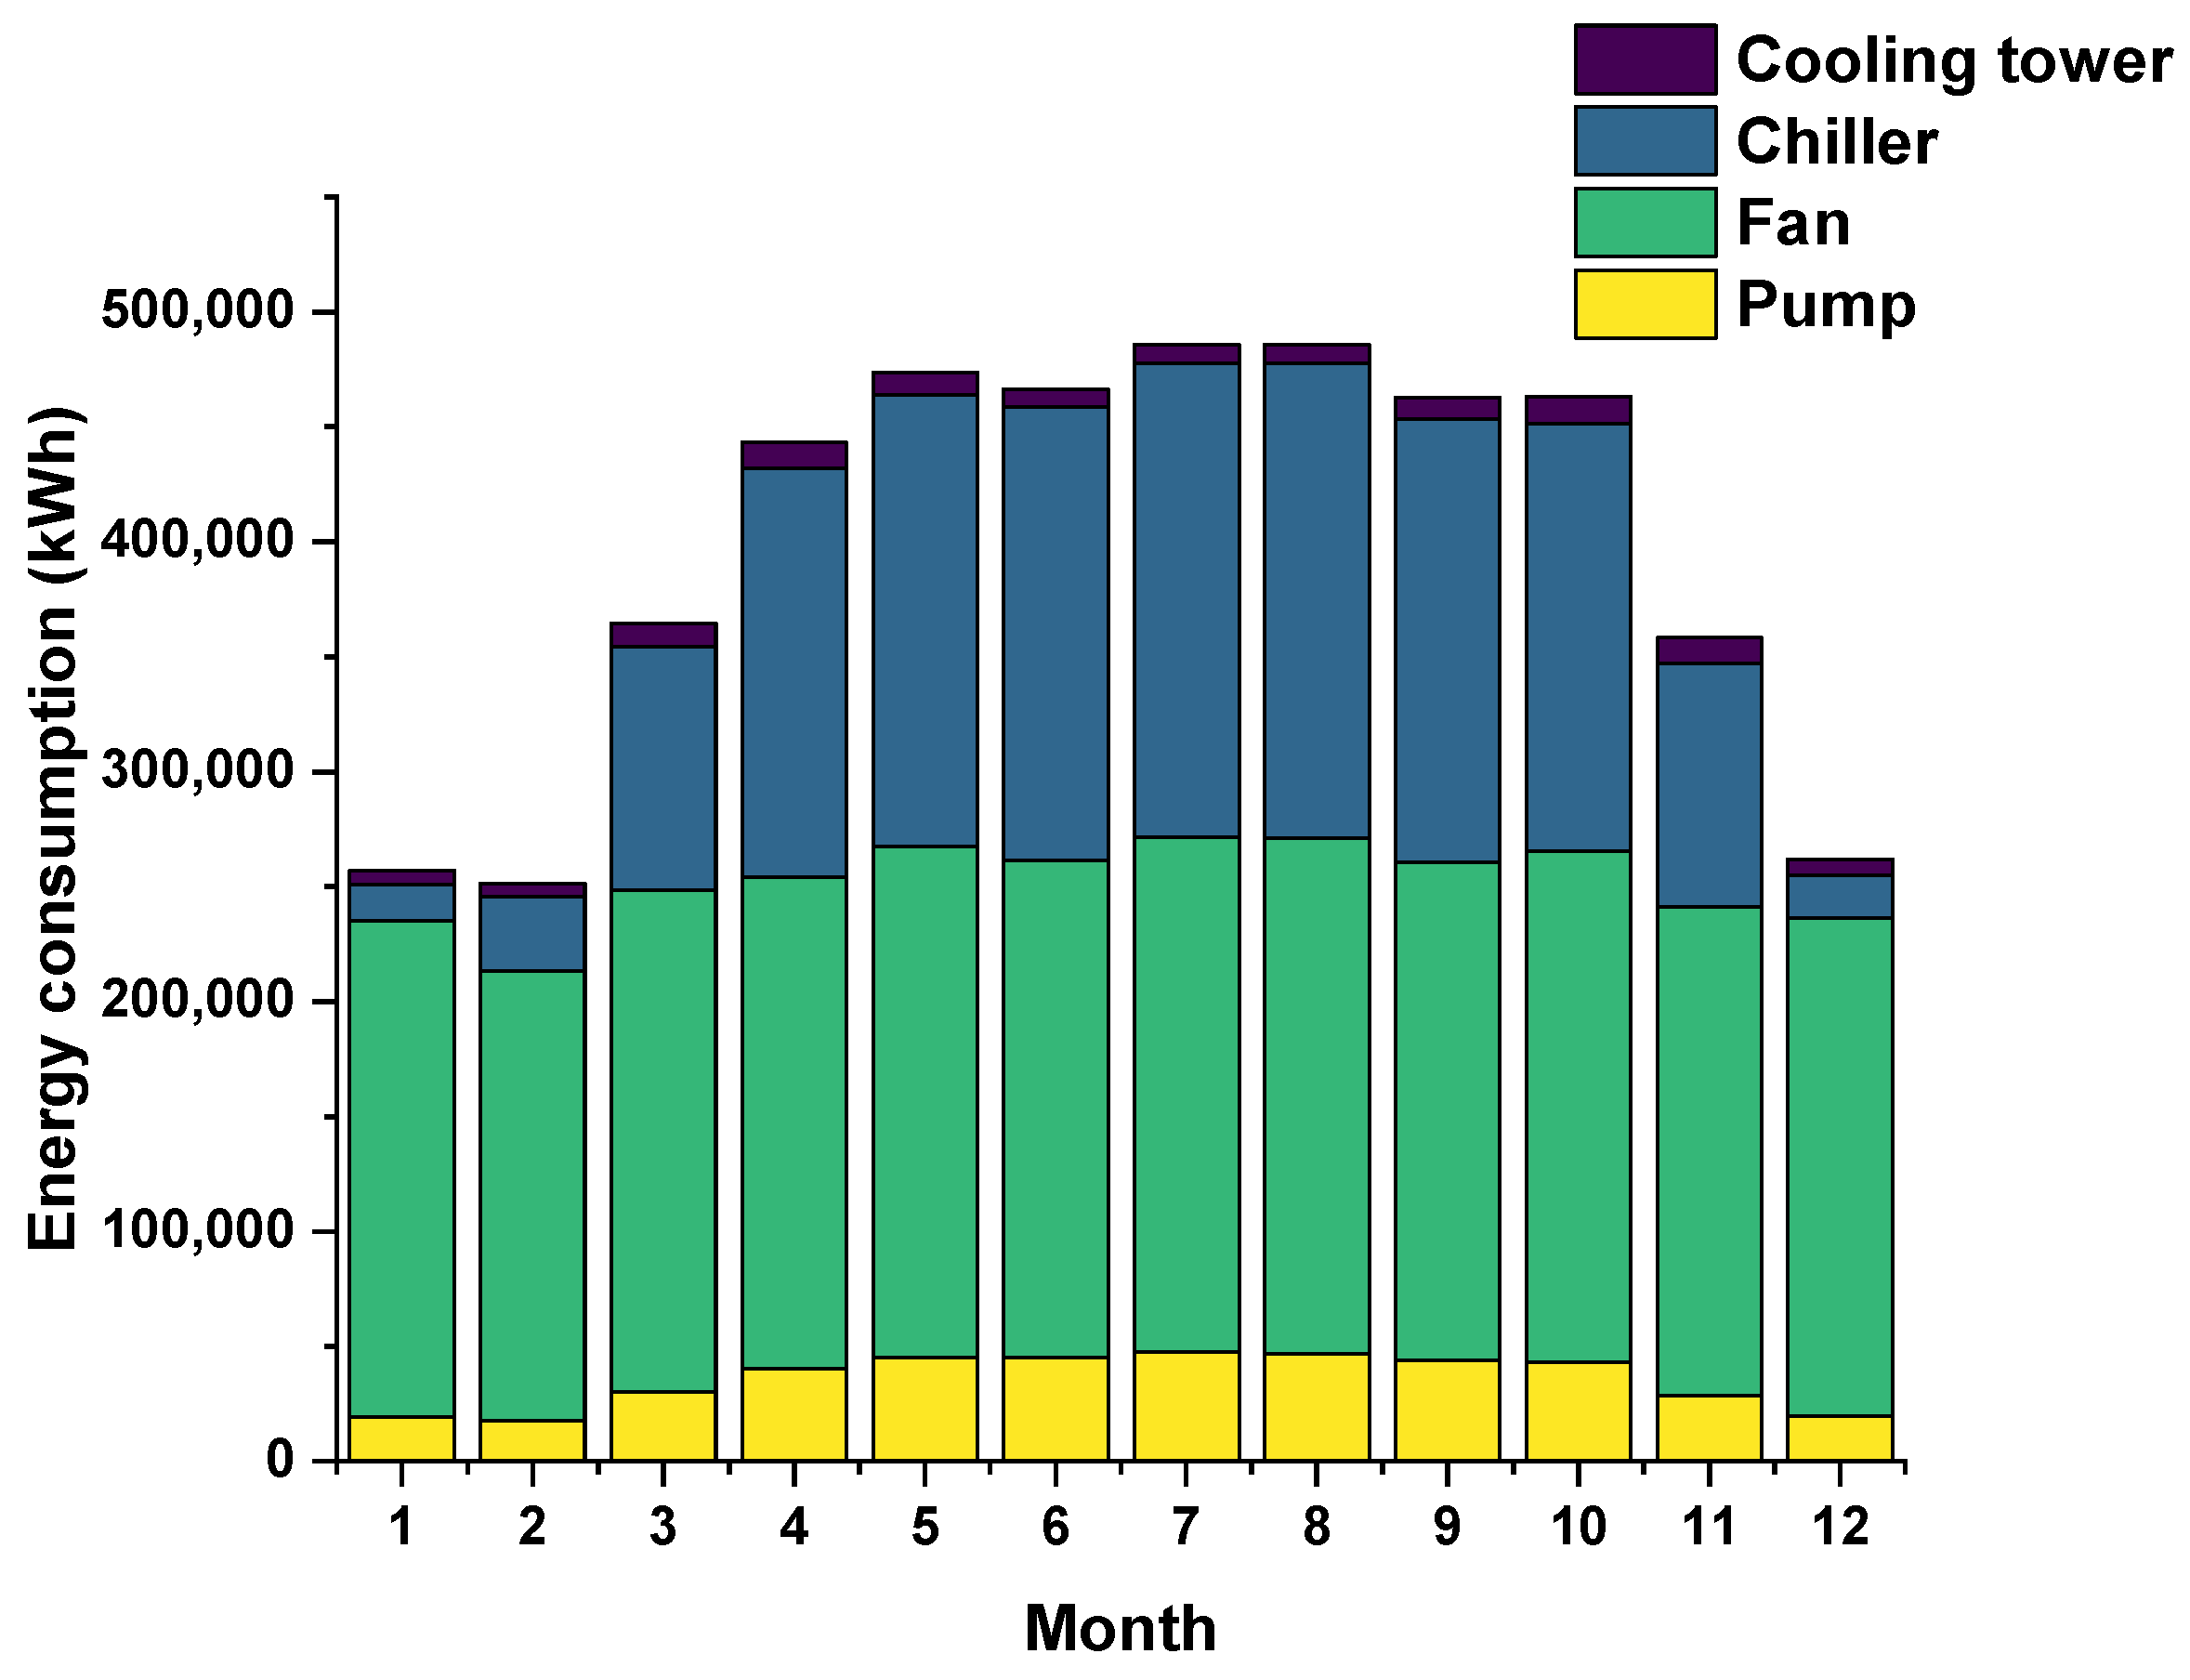
3.1. System Energy Consumption
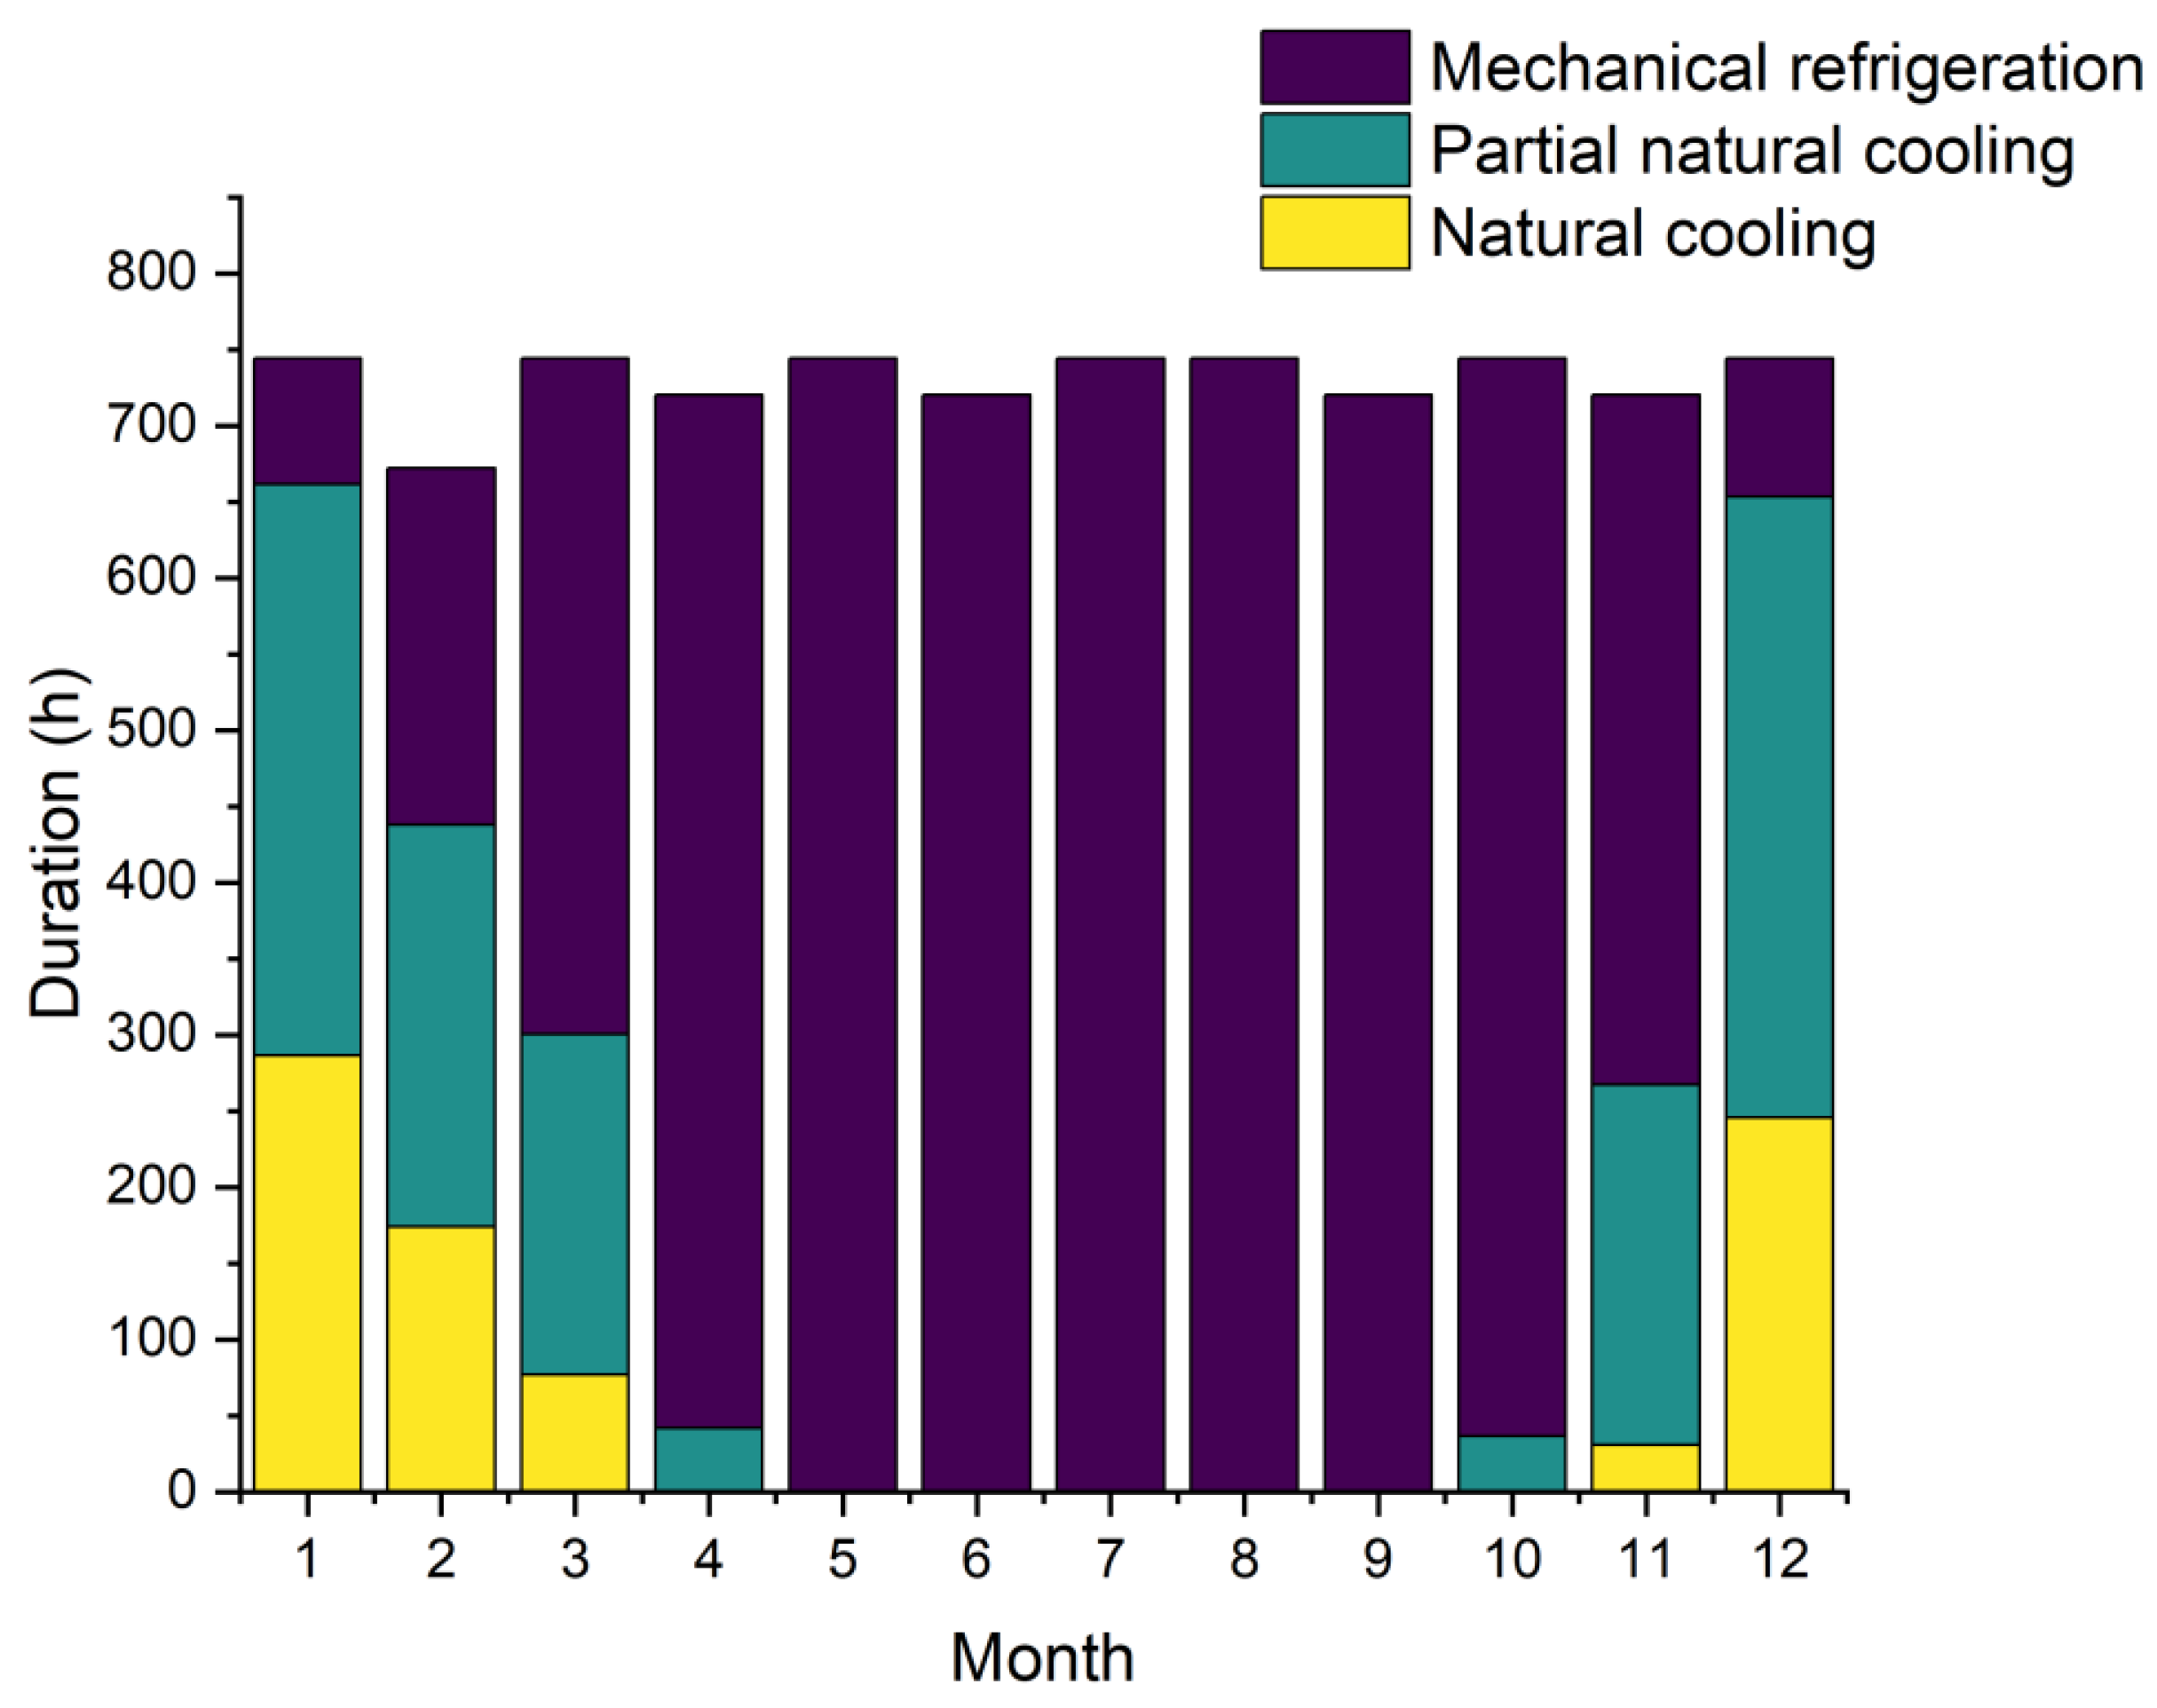
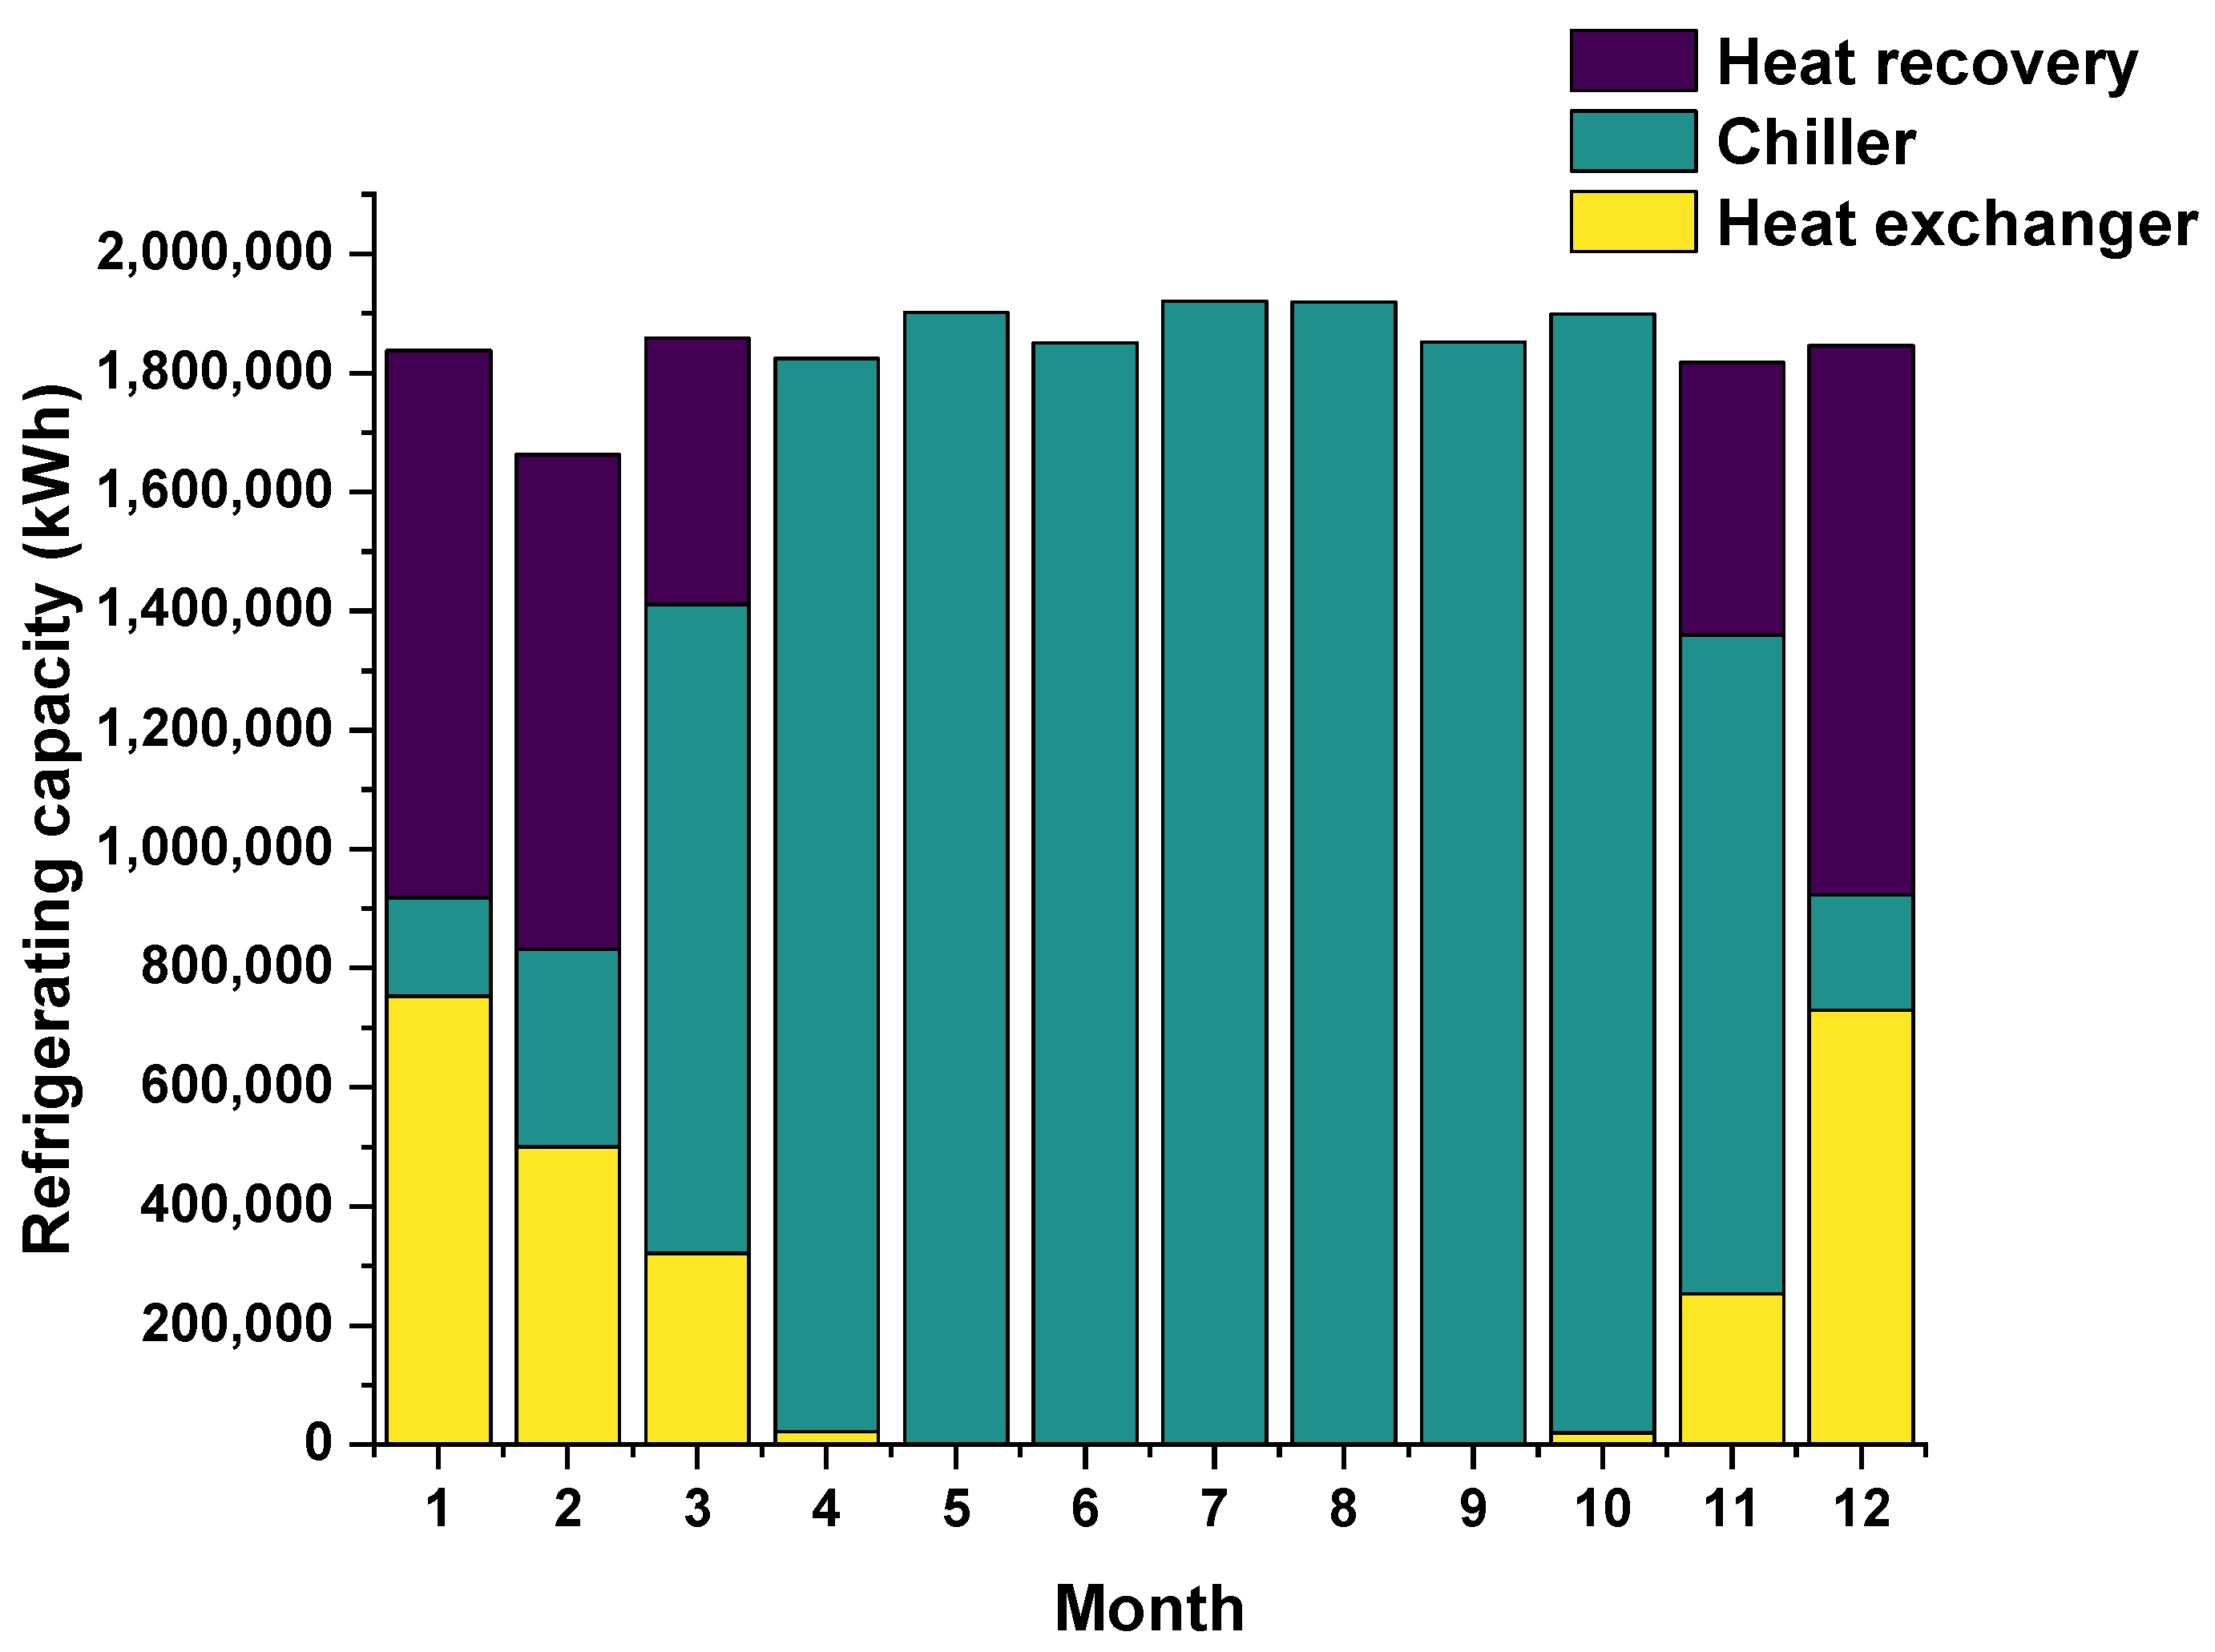
3.2. System Cooling Capacity
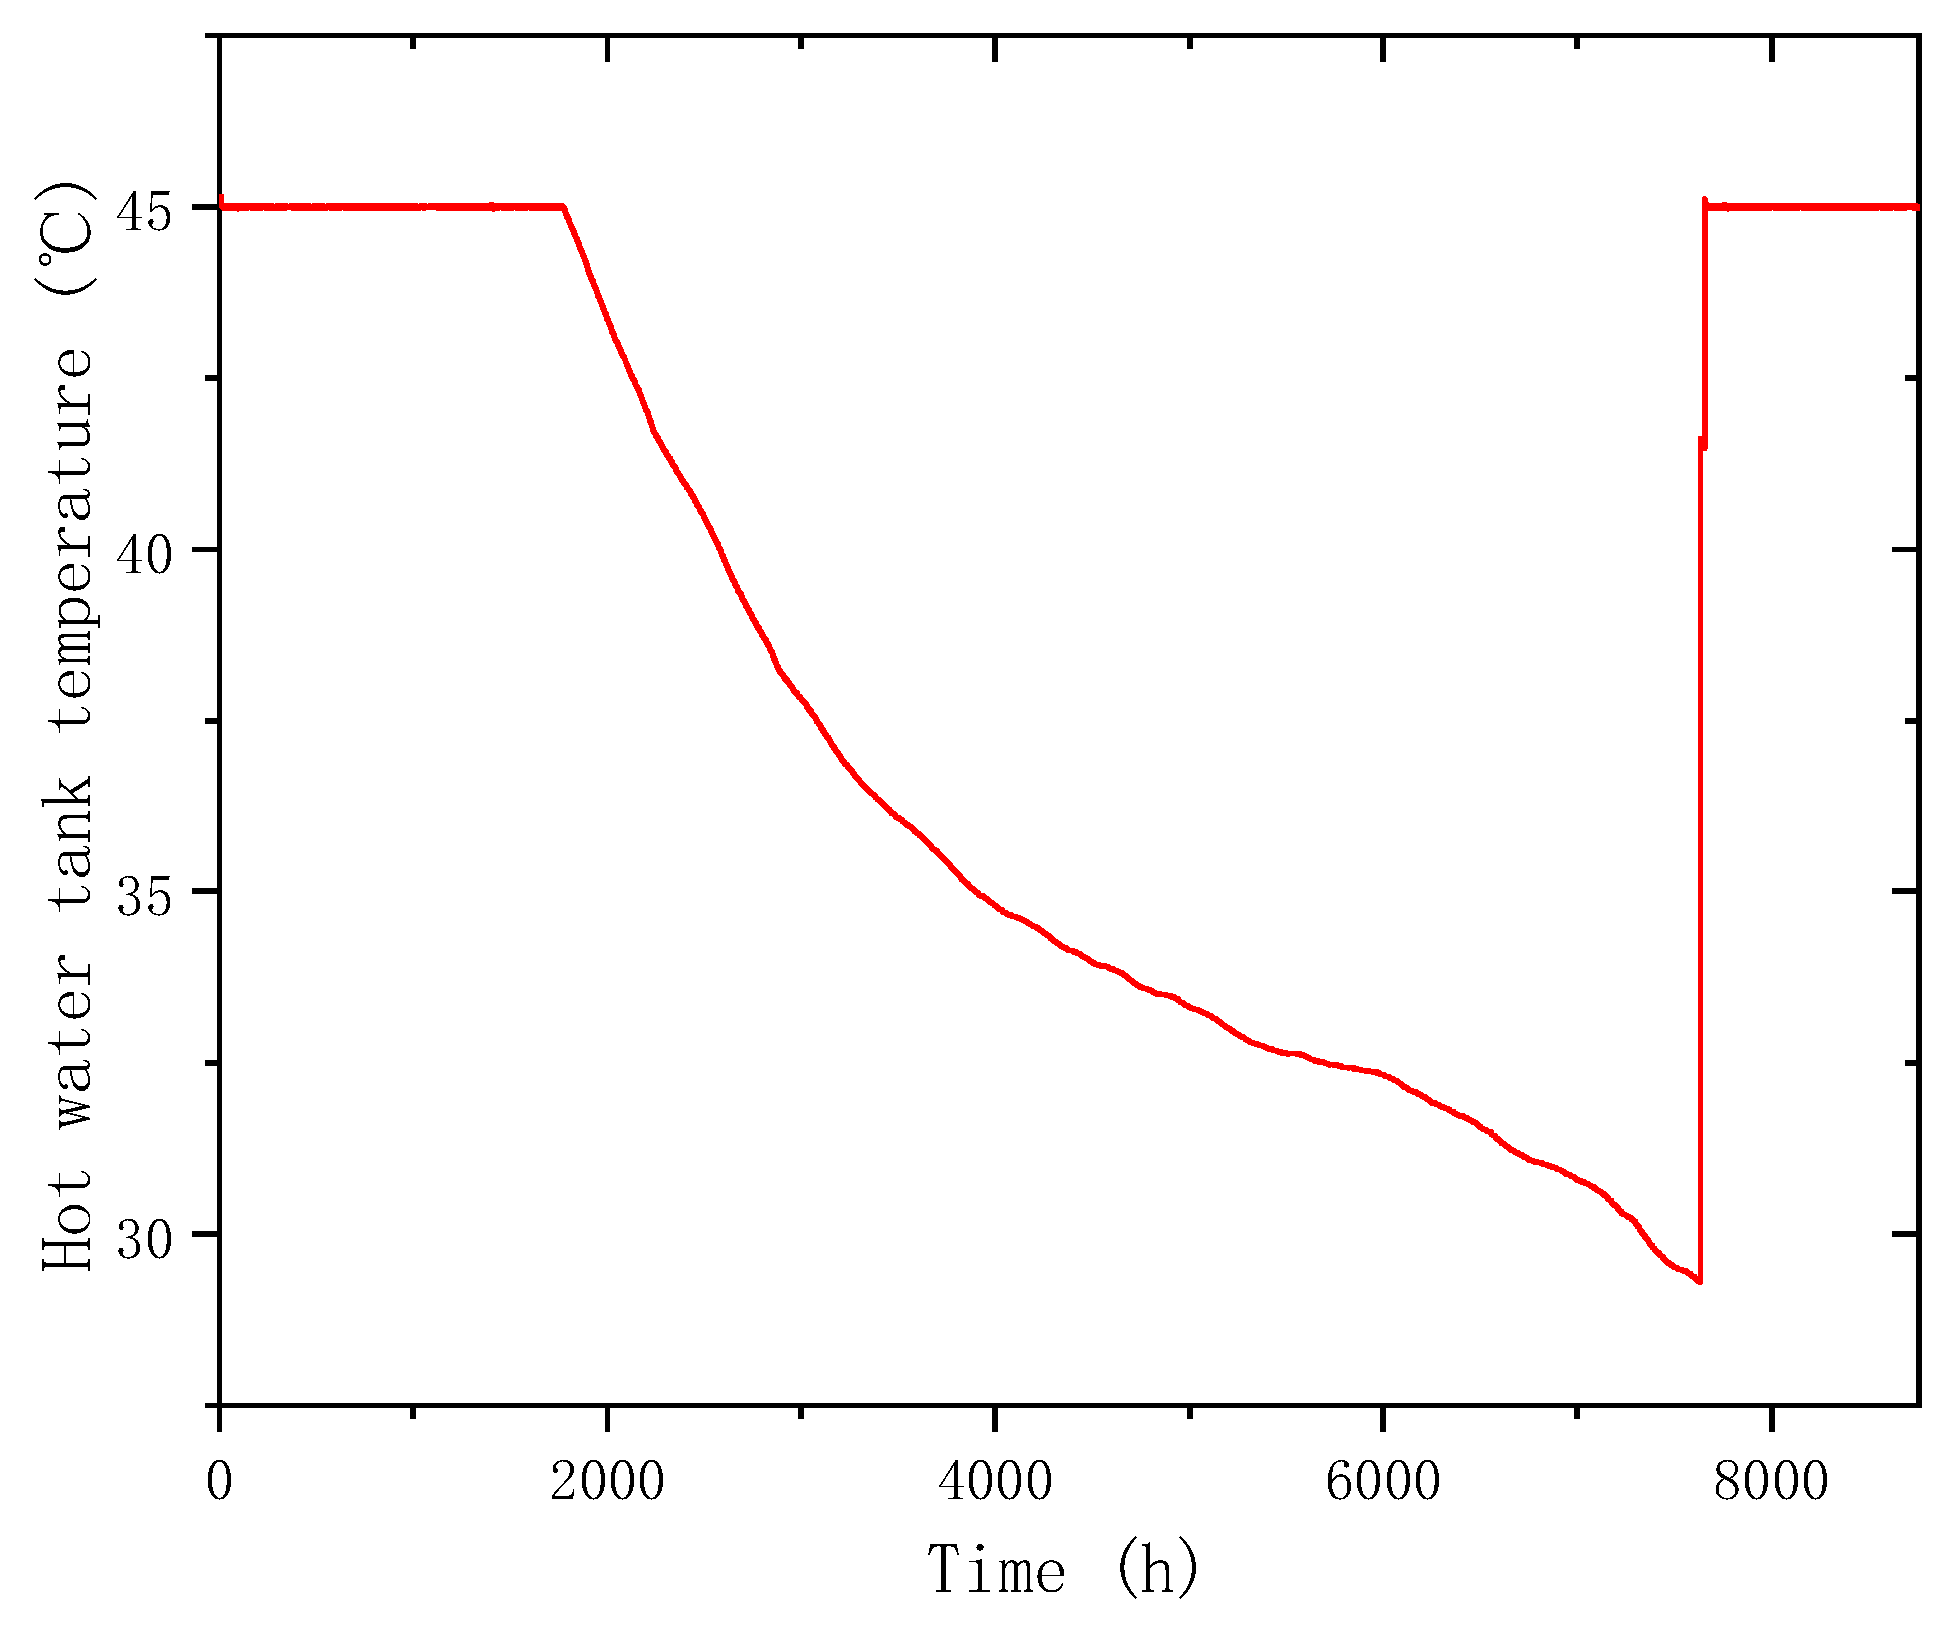
3.3. Waste Heat Recovery System
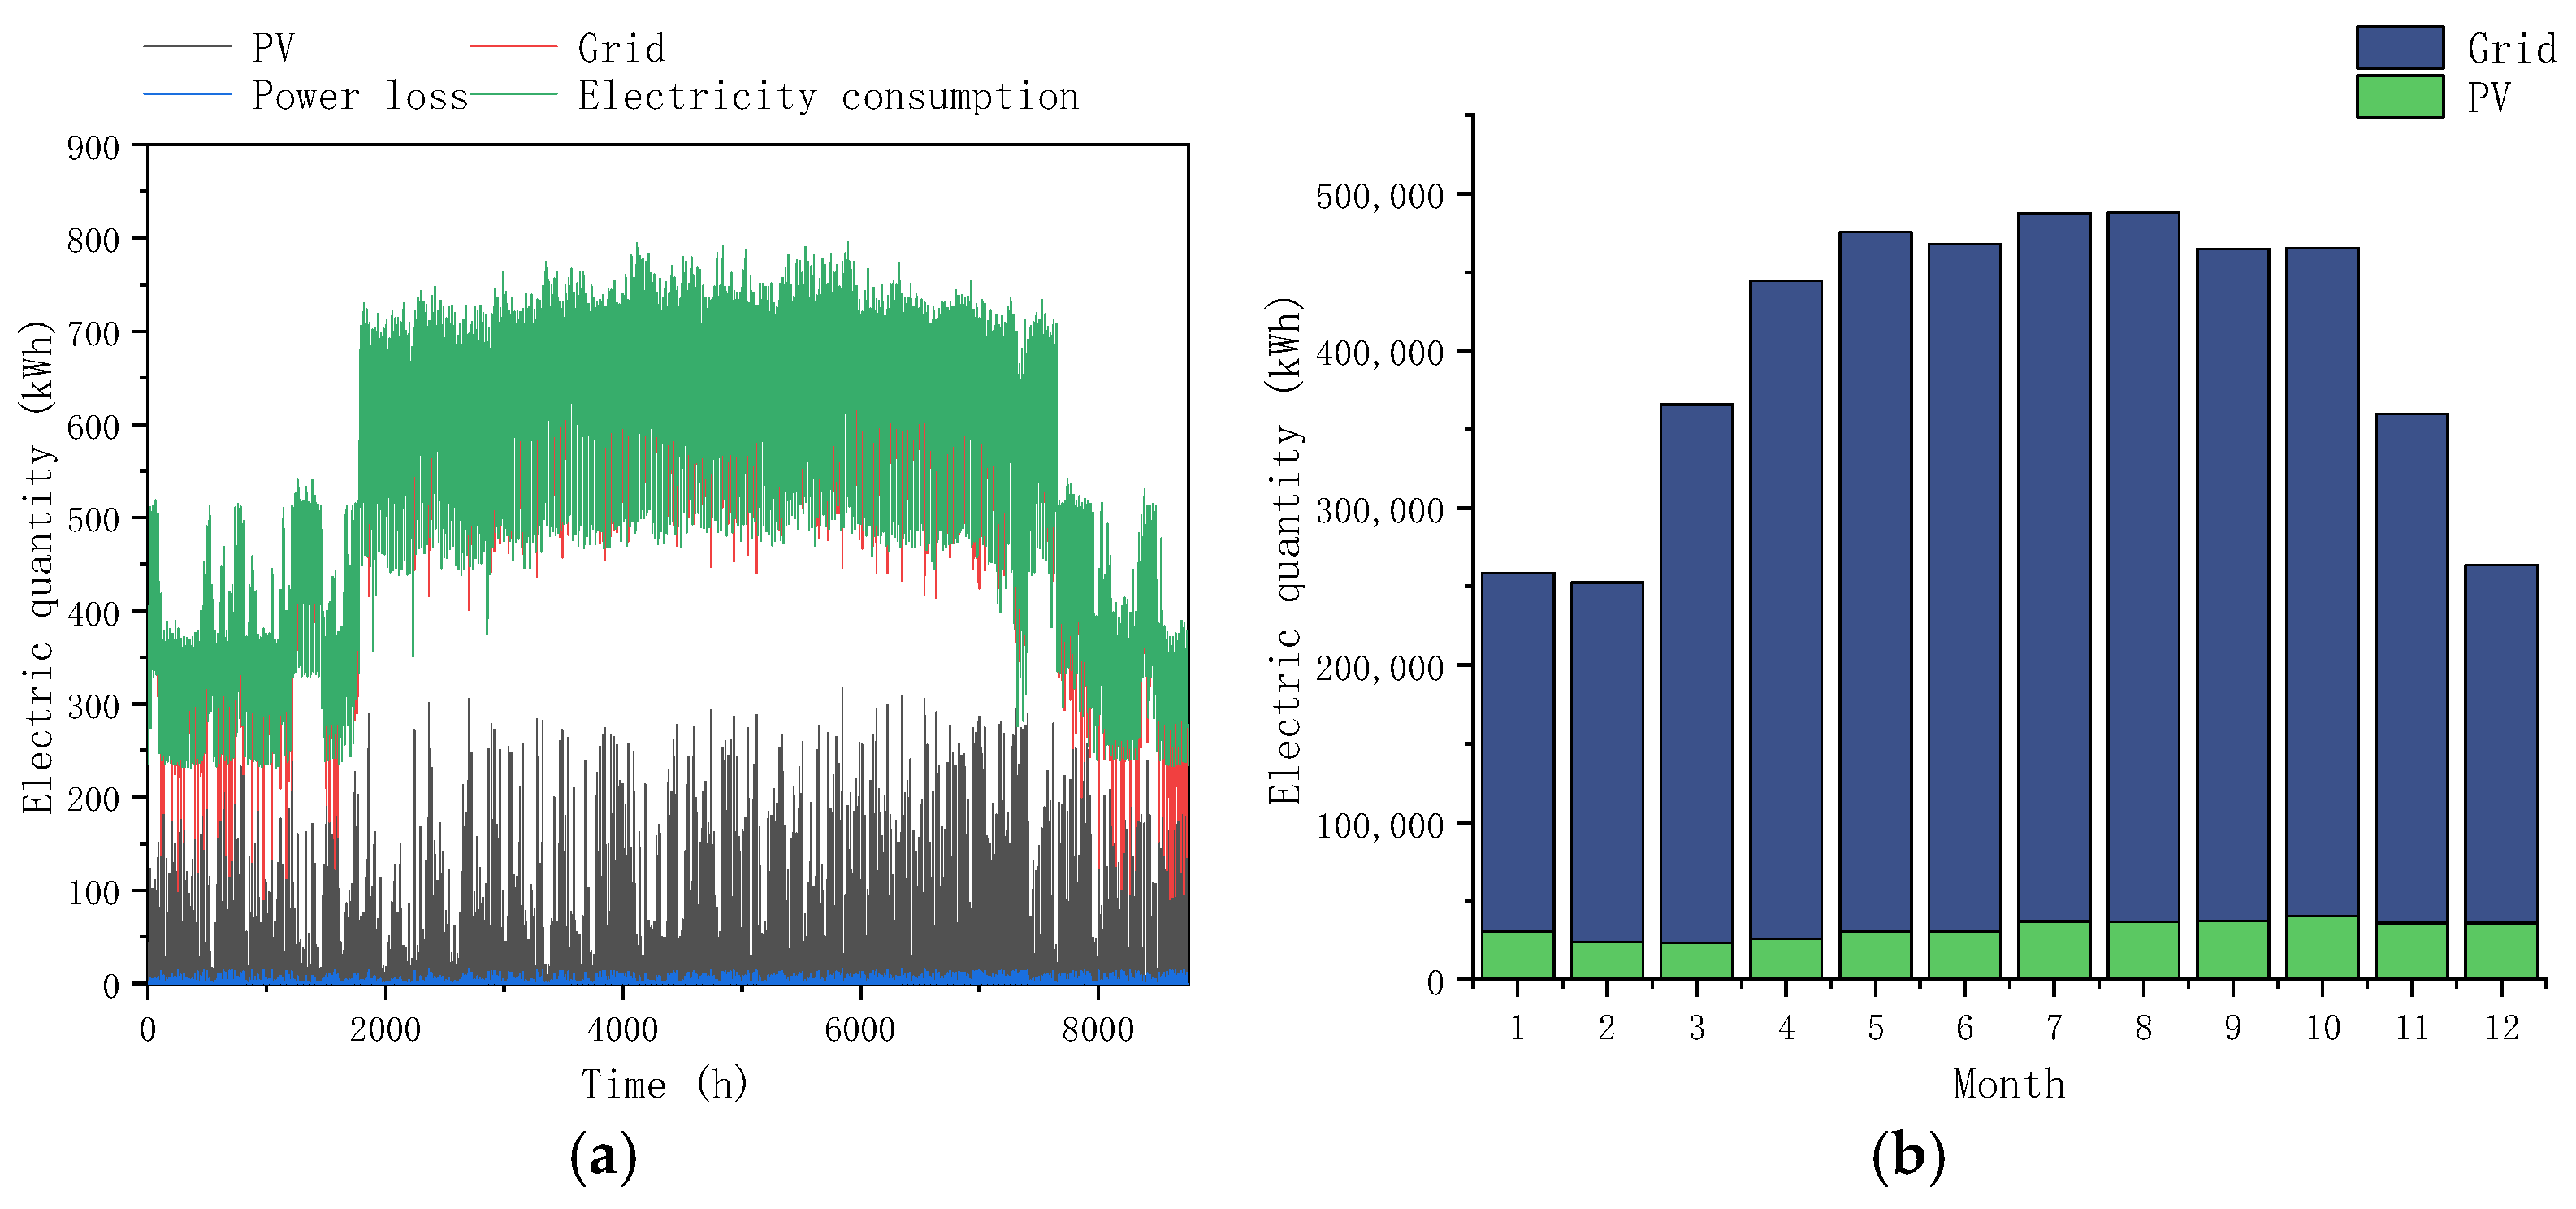
3.4. System Electricity Balance
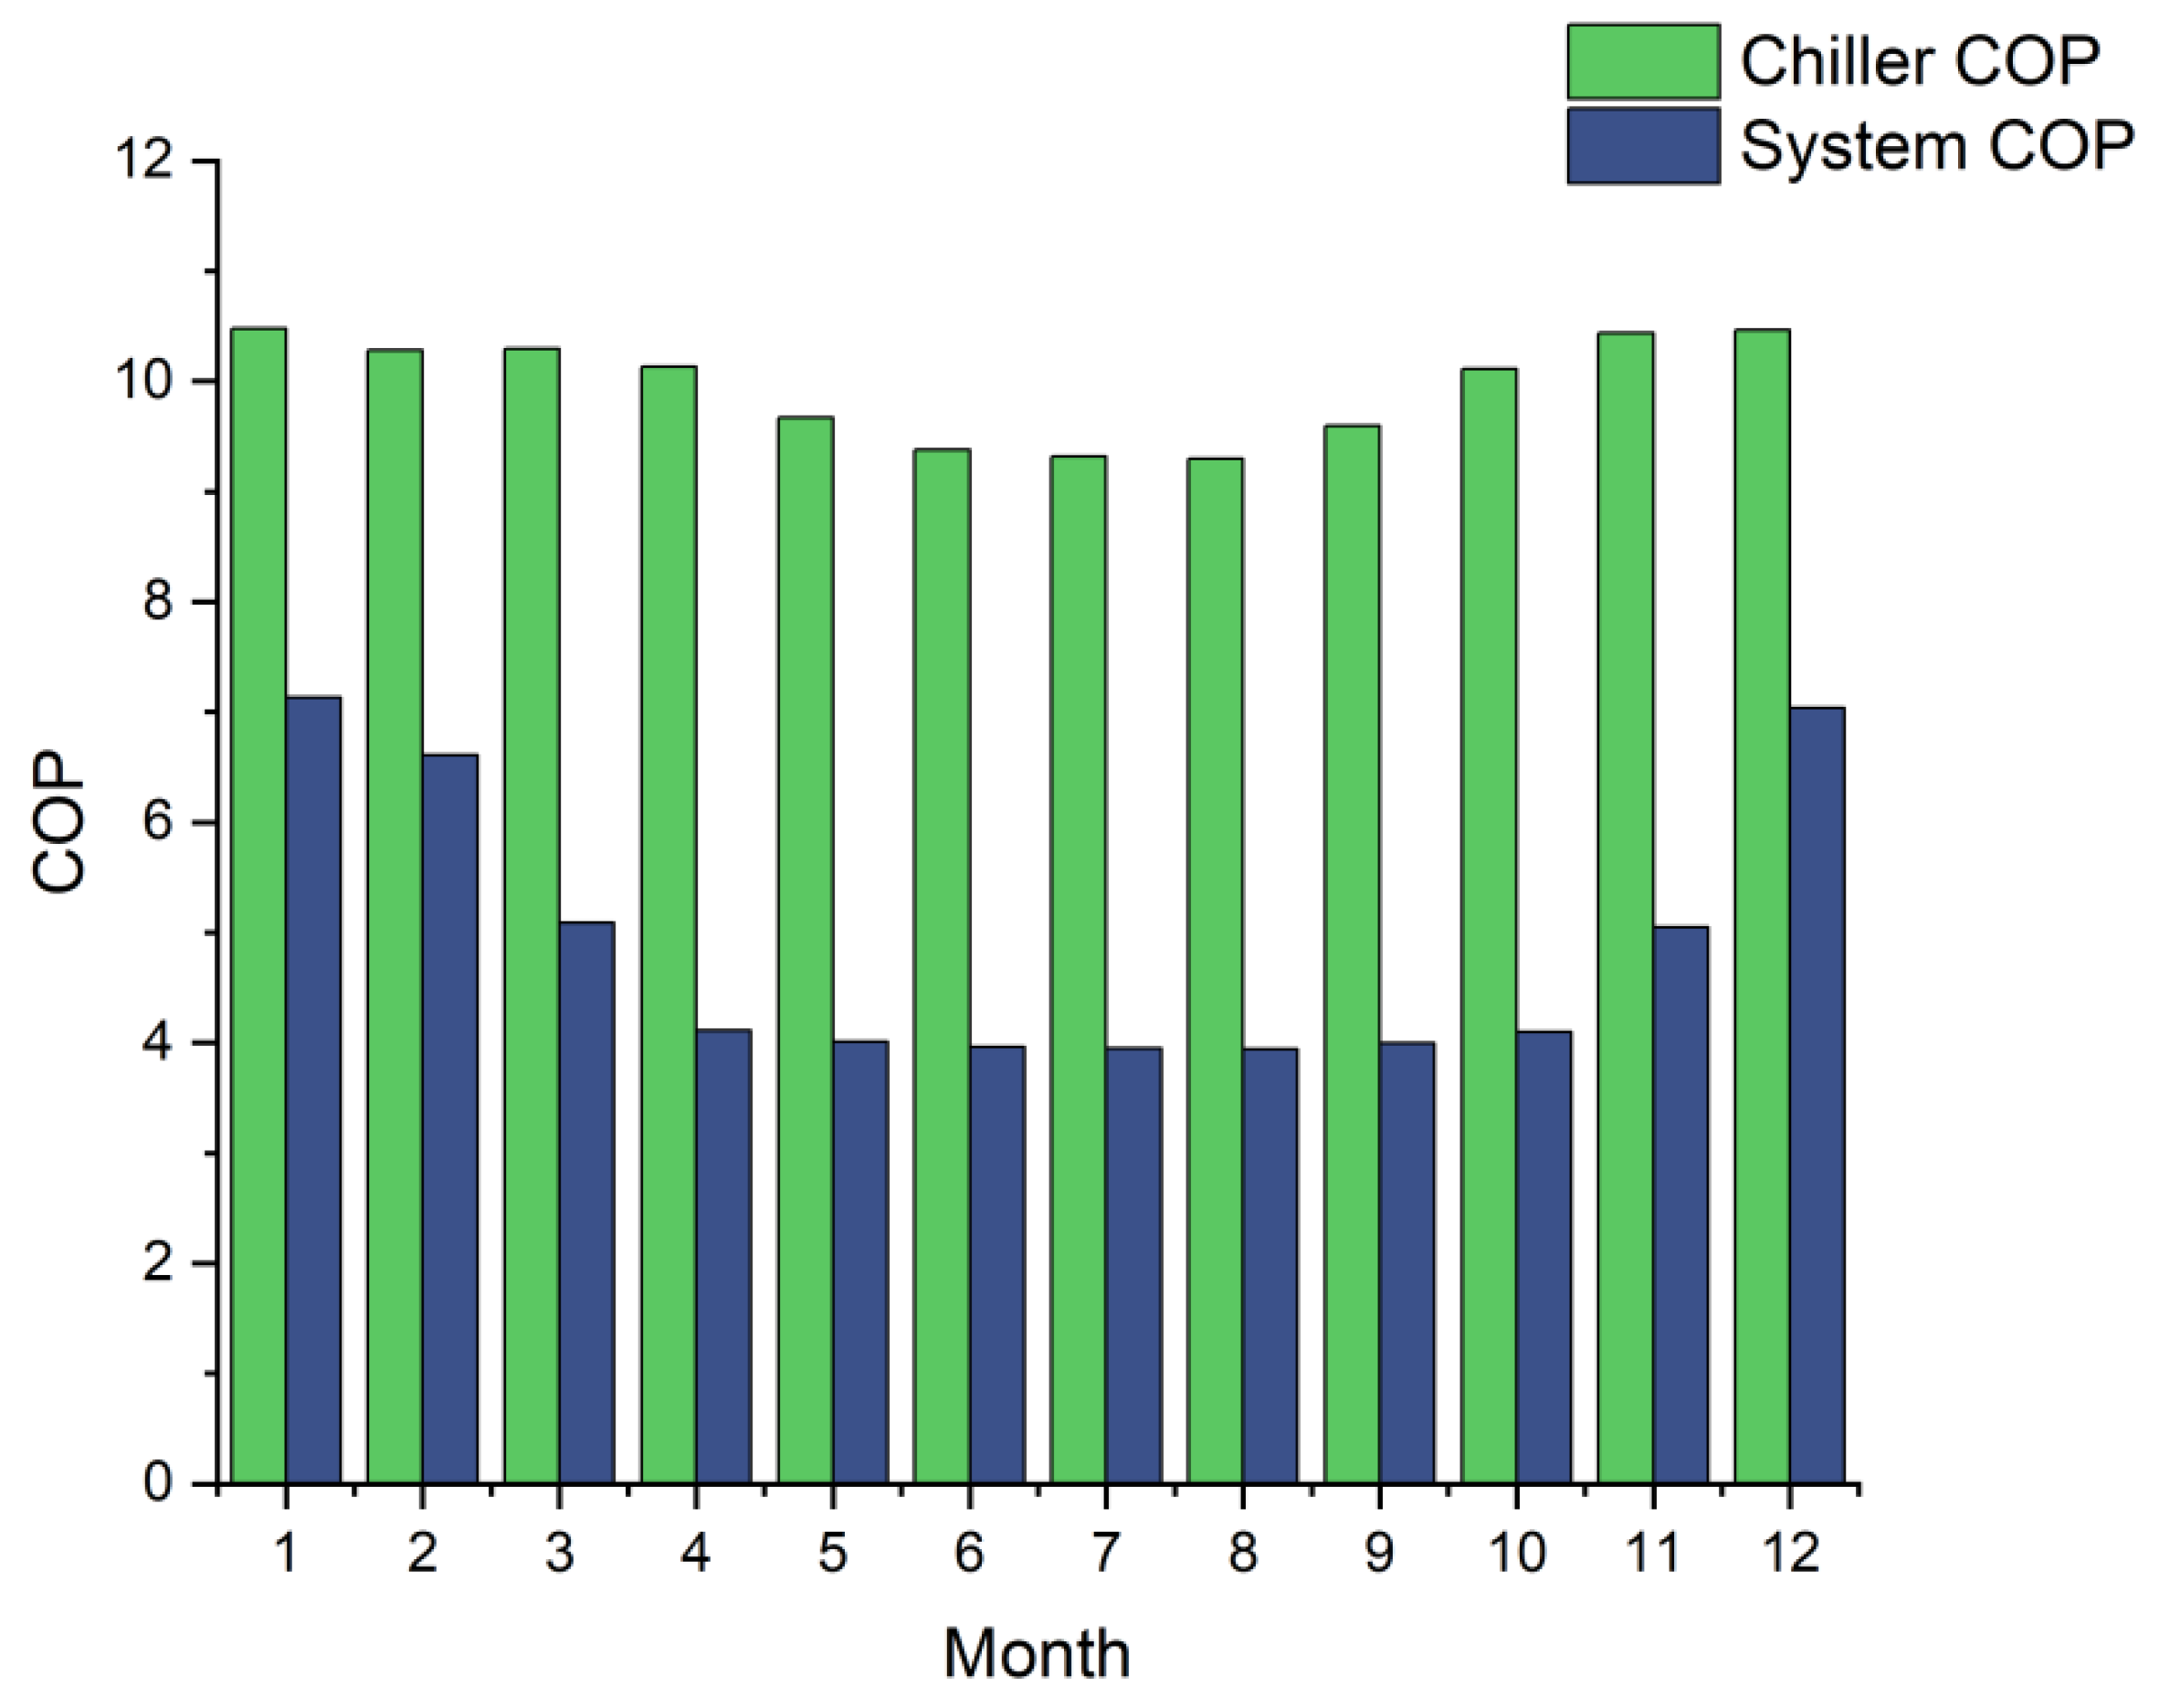
3.5. System Energy Efficiency
4. Conclusions
- (1)
- In terms of energy consumption, the use of a natural cooling system and waste heat recovery system enables a portion of the required cooling for data centers to be obtained for free. This proportion is closely related to outdoor meteorological parameters, and it will further decrease when the outdoor air temperature or the water temperature is lower.
- (2)
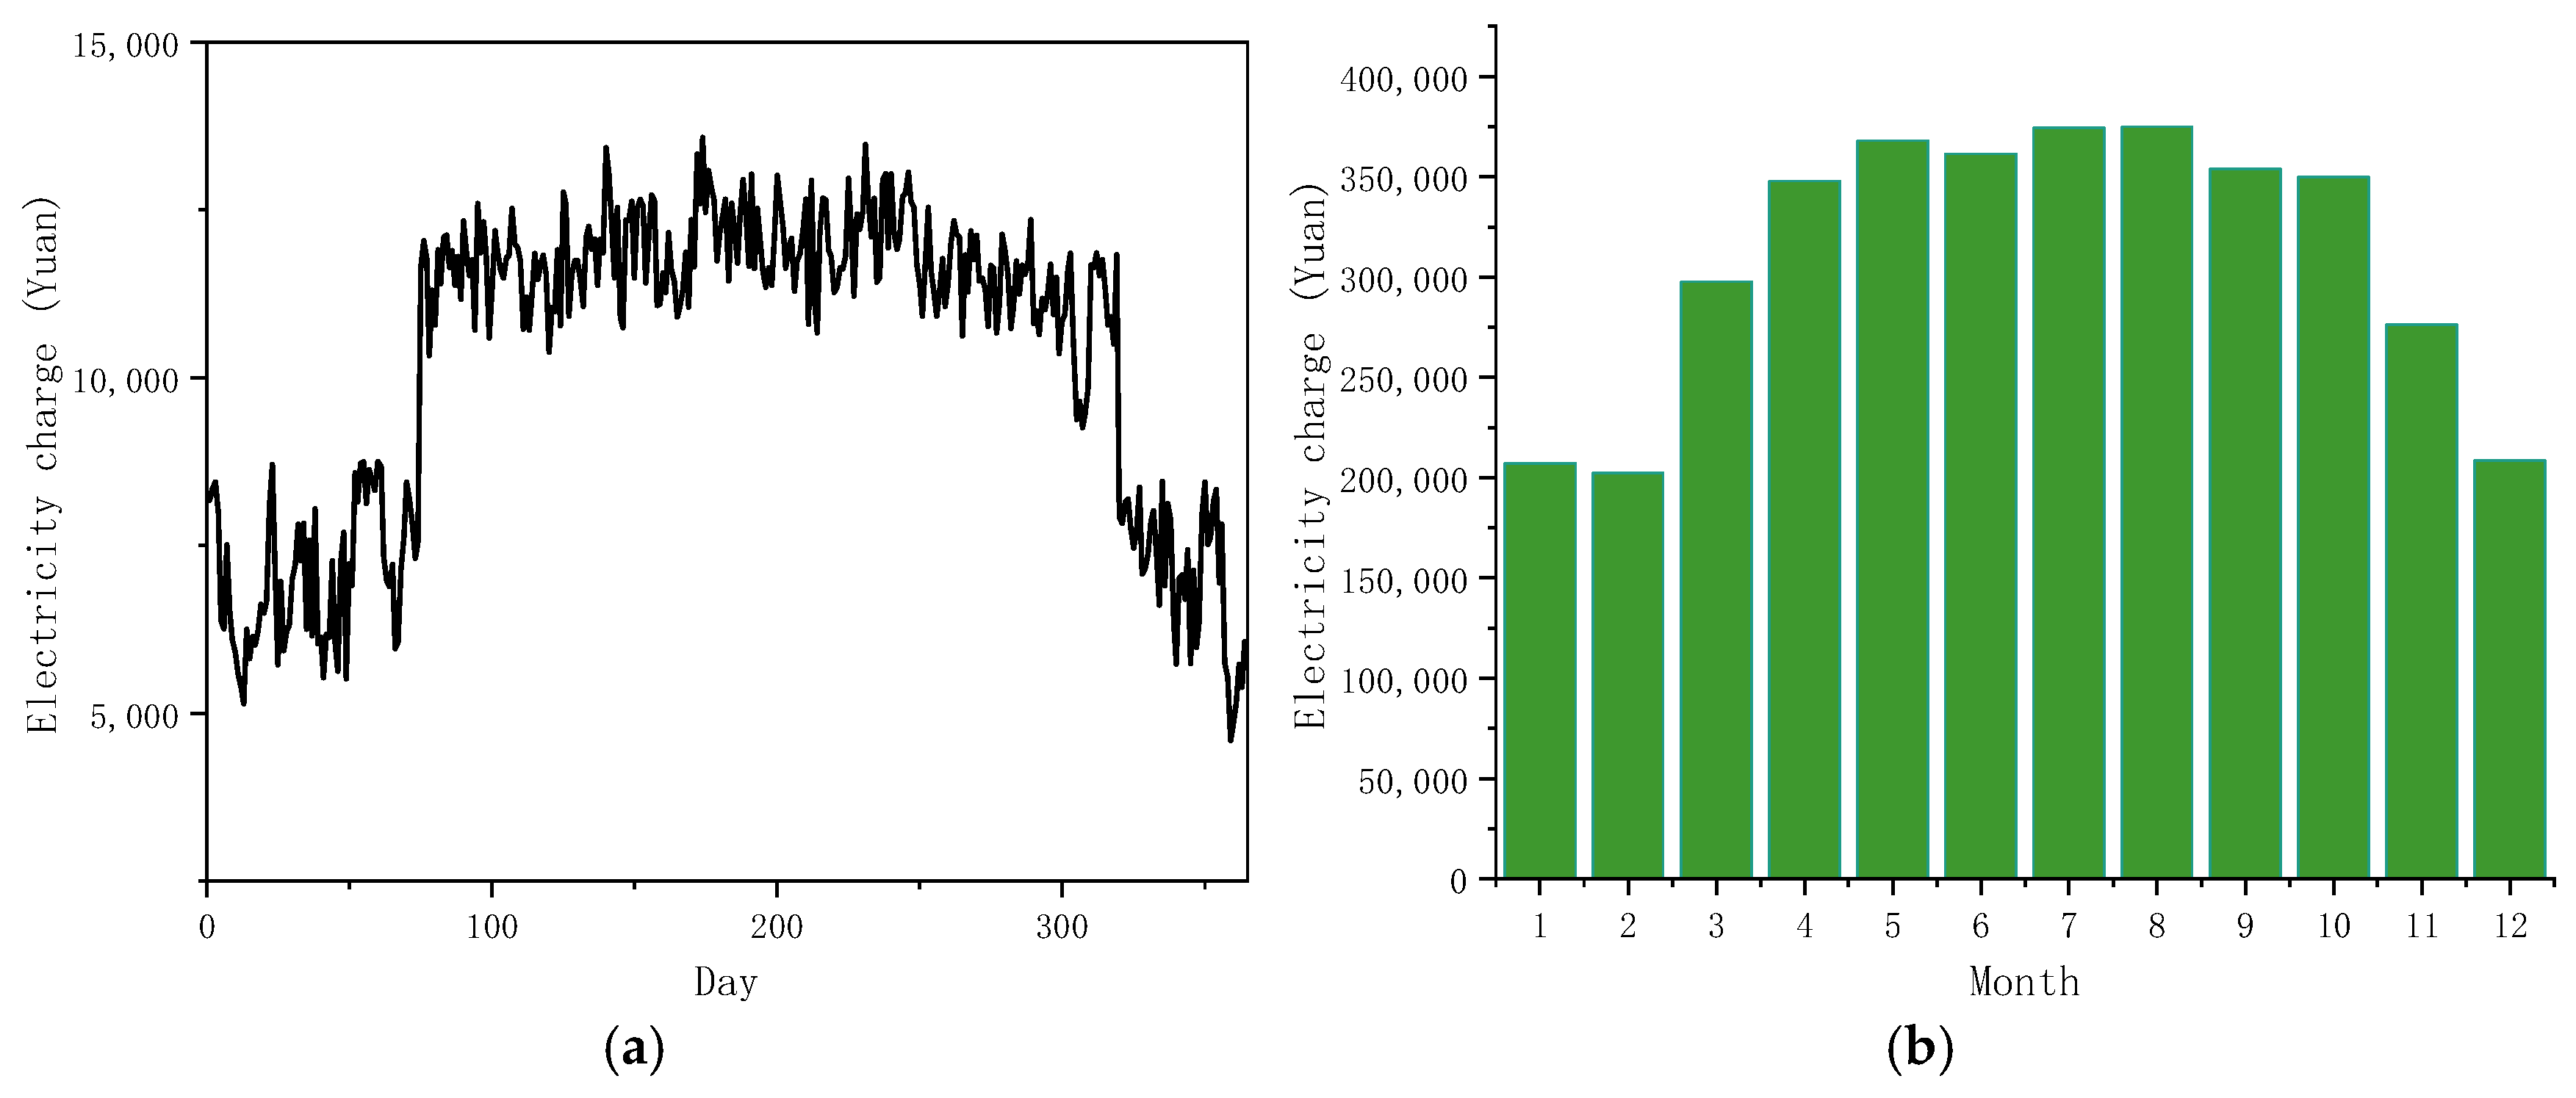
- Compared to the reference condition, the proposed hybrid renewable energy system achieves significant energy-saving benefits. The system COP increases, and the PUE decreases, resulting in the reduction in electricity expenses. Efficient cooling equipment under partial loads is required to reduce the energy consumption of the cooling system. In addition to the cooling system and IT equipment, data center energy consumption also includes auxiliary facilities such as the power supply and distribution system and the lighting system. Improving the energy efficiency of those facilities and reducing their proportion in the total energy consumption can further reduce the PUE.
- (3)
- During the operation of the waste heat recovery system, the heat pump can absorb heat from the data center and provide heating energy for users. As the demand for heating increases, more heat can be recovered from the data center.
- (4)
- The rooftop PV system can generate electricity to supply the data center. The area of the PV system in the study is limited by the roof area. In actual projects, measures such as increasing the scale of PV systems—and coupling with wind power, hydropower, etc.—can be taken to increase the proportion of renewable energy in the energy consumption, thereby achieving further energy savings.
Author Contributions
Funding
Data Availability Statement
Conflicts of Interest
References
- Ma, Z.; Clausen, A.; Lin, Y.; Jørgensen, B.N. An overview of digitalization for the building-to-grid ecosystem. Energy Inform. 2021, 4, 36. [Google Scholar] [CrossRef]
- Zhang, Y.; Shan, K.; Li, X.; Li, H.; Wang, S. Research and Technologies for next-generation high-temperature data centers—State-of-the-arts and future perspectives. Renew. Sustain. Energy Rev. 2023, 171, 112991. [Google Scholar] [CrossRef]
- Masanet, E.; Shehabi, A.; Lei, N.; Smith, S.; Koomey, J. Recalibrating global data center energy-use estimates. Science 2020, 367, 984–986. [Google Scholar] [CrossRef]
- Huang, P.; Copertaro, B.; Zhang, X.; Shen, J.; Löfgren, I.; Rönnelid, M.; Fahlen, J.; Andersson, D.; Svanfeldt, M. A review of data centers as prosumers in district energy systems: Renewable energy integration and waste heat reuse for district heating. Appl. Energy 2020, 258, 114109. [Google Scholar] [CrossRef]
- Zhang, H.; Shao, S.; Xu, H.; Zou, H.; Tian, C. Free cooling of data centers: A review. Renew. Sustain. Energy Rev. 2014, 35, 171–182. [Google Scholar] [CrossRef]
- Ling, L.; Zhang, Q.; Zeng, L. Performance and energy efficiency analysis of data center cooling plant by using lake water source. Procedia Eng. 2017, 205, 3096–3103. [Google Scholar] [CrossRef]
- Du, S.; Zhang, Q.; Zou, S.; Meng, F.; Liu, L. Simulation analysis on energy consumption and economy of CPU cooling system based on loop heat pipe for data center. Therm. Sci. Eng. Prog. 2023, 45, 102115. [Google Scholar] [CrossRef]
- Xu, S.; Zhang, H.; Wang, Z. Thermal Management and Energy Consumption in Air, Liquid, and Free Cooling Systems for Data Centers: A Review. Energies 2023, 16, 1279. [Google Scholar] [CrossRef]
- Zhou, X.; Xin, Z.; Tang, W.; Sheng, K.; Wu, Z. Comparative study for waste heat recovery in immersion cooling data centers with district heating and organic Rankine cycle (ORC). Appl. Therm. Eng. 2024, 242, 122479. [Google Scholar] [CrossRef]
- Zhang, C.; Han, Z.; Dong, J.; Li, M.; Zhang, Y.; Li, X.; Wen, Z.; Wang, Q. A novel data center air conditioner and its application scheme balancing high-efficiency cooling and waste heat recovery: Environmental and economic analysis. Energy 2024, 291, 130294. [Google Scholar] [CrossRef]
- Lu, T.; Lü, X.; Välisuo, P.; Zhang, Q.; Clements-Croome, D. Innovative approaches for deep decarbonization of data centers and building space heating networks: Modeling and comparison of novel waste heat recovery systems for liquid cooling systems. Appl. Energy 2024, 357, 122473. [Google Scholar] [CrossRef]
- Ebrahimi, K.; Jones, G.F.; Fleischer, A.S. A review of data center cooling technology, operating conditions and the corresponding low-grade waste heat recovery opportunities. Renew. Sustain. Energy Rev. 2014, 31, 622–638. [Google Scholar] [CrossRef]
- Deymi-Dashtebayaz, M.; Valipour-Namanlo, S. Thermoeconomic and environmental feasibility of waste heat recovery of a data center using air source heat pump. J. Clean. Prod. 2019, 219, 117–126. [Google Scholar] [CrossRef]
- Lin, X.; Zuo, L.; Yin, L.; Su, W.; Ou, S. An idea to efficiently recover the waste heat of Data Centers by constructing an integrated system with carbon dioxide heat pump, mechanical subcooling cycle and lithium bromide-water absorption refrigeration cycle. Energy Convers. Manag. 2022, 256, 115398. [Google Scholar] [CrossRef]
- Perdigones, A.; García, J.L.; García, I.; Baptista, F.; Mazarrón, F.R. Economic Feasibility of PV Mounting Structures on Industrial Roofs. Buildings 2023, 13, 2834. [Google Scholar] [CrossRef]
- Xie, C.; Mao, H.; Cheng, N.; Ma, L.; Tian, Z.; Luo, Y.; Zhou, C.; Li, H.; Wang, Q.; Kong, W.; et al. Climate change impacts on global photovoltaic variability. Appl. Energy 2024, 374, 124087. [Google Scholar] [CrossRef]
- Deng, W.; Liu, F.; Jin, H.; Li, B.; Li, D. Harnessing renewable energy in cloud datacenters: Opportunities and challenges. IEEE Netw. 2014, 28, 48–55. [Google Scholar] [CrossRef]
- Malkamäki, T.; Ovaska, S.J. Solar Energy and Free Cooling Potential in European Data Centers. Procedia Comput. Sci. 2012, 10, 1004–1009. [Google Scholar] [CrossRef]
- Jahangir, M.H.; Mokhtari, R.; Mousavi, S.A. Performance evaluation and financial analysis of applying hybrid renewable systems in cooling unit of data centers—A case study. Sustain. Energy Technol. Assess. 2021, 46, 101220. [Google Scholar] [CrossRef]
- Guizzi, G.L.; Manno, M. Fuel cell-based cogeneration system covering data centers’ energy needs. Energy 2012, 41, 56–64. [Google Scholar] [CrossRef]
- Little, A.B.; Garimella, S. Waste Heat Recovery in Data Centers Using Sorption Systems. J. Therm. Sci. Eng. Appl. 2012, 4, 021007. [Google Scholar] [CrossRef]
- Zachary Woodruff, J.; Brenner, P.; Buccellato, A.P.C.; Go, D.B. Environmentally opportunistic computing: A distributed waste heat reutilization approach to energy-efficient buildings and data centers. Energy Build. 2014, 69, 41–50. [Google Scholar] [CrossRef]
- Chen, D.; Ma, Y.; Zou, A. A survey of data center load scheduling based on renewable energy consumption. Comput. Eng. Sci. 2023, 45, 790–801. [Google Scholar]
- Xu, M.; Buyya, R. Managing renewable energy and carbon footprint in multi-cloud computing environments. J. Parallel Distrib. Comput. 2020, 135, 191–202. [Google Scholar] [CrossRef]
- Khosravi, A.; Nadjaran Toosi, A.; Buyya, R. Online virtual machine migration for renewable energy usage maximization in geographically distributed cloud data centers. Concurr. Comput. Pract. Exp. 2017, 29, e4125. [Google Scholar] [CrossRef]
- Zeng, Q.; Li, L.; Chen, X.; Tian, Z.; Mao, H.; Luo, Y.; Zhou, C.; Fan, J. Techno-economic performance and optimization of a large solar district heating system with pit storage under Tibetan Plateau climate conditions. Energy 2025, 315, 134449. [Google Scholar] [CrossRef]
- Hui, T. Simulation and Parameter Analysis of Water-Side Free Cooling system in Data Center. Master’s Thesis, Hunan University, Changsha, China, 2018. (In Chinese). [Google Scholar]


| Computer Room 1 | Computer Room 2 | Computer Room 3 | Computer Room 4 | |
|---|---|---|---|---|
| L × W × H (m3) | 29.1 × 16.3 × 4.5 | 29.1 × 16.3 × 4.5 | 26.1 × 17.6 × 4.5 | 26.1 × 17.6 × 4.5 |
| Area (m2) | 474.3 | 474.3 | 459.4 | 459.4 |
| Server number | 190 | 192 | 178 | 180 |
| Heat transfer coefficient for enclosure structure | 1.26 W/(m2·K) | |||
| Illuminance | 10 W/m2 | |||
| Maximum power of server rack | 4 kW | |||
| Design Cooling Load | Load for Computer Room 1 | Load for Computer Room 2 | Load for Computer Room 3 | Load for Computer Room 4 |
|---|---|---|---|---|
| 2694.74 kW | 691.66 kW | 698.89 kW | 648.48 kW | 655.71 kW |
| Component | Name |
|---|---|
| Type 5b | Plate heat exchanger |
| Type 56 | Data center |
| Type 103b | PV system |
| Type 110 | Water pump |
| Type 114 | Water Pump |
| Type 147 | Air blower |
| Type 158 | Water tank |
| Type 162d | Cooling tower |
| Type 508c | Cooling coil |
| Type 657 | Heat exchanger |
| Type 666 | Water cooled chiller |
| Type 927 | Water source heat pump |
| Twet_bulb/°C | qtower/m3∙s−1 | Ttower_in/°C | Tout_sim/°C | Tout [27]/°C | Er/% |
|---|---|---|---|---|---|
| 22 | 1536 | 37 | 30.82 | 32 | 3.69 |
| 1234 | 35 | 28.53 | 30 | 4.90 | |
| 1697 | 38 | 31.94 | 33 | 3.21 | |
| 21 | 1345 | 35 | 28.97 | 30 | 3.43 |
| 1850 | 38 | 32.36 | 33 | 1.94 | |
| 1674 | 37 | 31.25 | 32 | 2.34 |
| Tco_in/°C | Tch_in/°C | COPsim | COP [27] | Er/% |
|---|---|---|---|---|
| 18.33 | 8 | 5.182 | 5.166 | 0.31 |
| 20.67 | 10 | 7.286 | 6.838 | 6.55 |
| 32 | 12 | 6.301 | 6.213 | 1.42 |
| 18.33 | 9 | 5.907 | 5.97 | 1.06 |
| 25.33 | 11 | 7.637 | 7.116 | 7.32 |
Disclaimer/Publisher’s Note: The statements, opinions and data contained in all publications are solely those of the individual author(s) and contributor(s) and not of MDPI and/or the editor(s). MDPI and/or the editor(s) disclaim responsibility for any injury to people or property resulting from any ideas, methods, instructions or products referred to in the content. |
© 2025 by the authors. Licensee MDPI, Basel, Switzerland. This article is an open access article distributed under the terms and conditions of the Creative Commons Attribution (CC BY) license (https://creativecommons.org/licenses/by/4.0/).
Share and Cite
Zhou, C.; Hu, Y.; Liu, R.; Liu, Y.; Wang, M.; Luo, H.; Tian, Z. Energy Performance Study of a Data Center Combined Cooling System Integrated with Heat Storage and Waste Heat Recovery System. Buildings 2025, 15, 326. https://doi.org/10.3390/buildings15030326
Zhou C, Hu Y, Liu R, Liu Y, Wang M, Luo H, Tian Z. Energy Performance Study of a Data Center Combined Cooling System Integrated with Heat Storage and Waste Heat Recovery System. Buildings. 2025; 15(3):326. https://doi.org/10.3390/buildings15030326
Chicago/Turabian StyleZhou, Chaohui, Yue Hu, Rujie Liu, Yuce Liu, Meng Wang, Huiheng Luo, and Zhiyong Tian. 2025. "Energy Performance Study of a Data Center Combined Cooling System Integrated with Heat Storage and Waste Heat Recovery System" Buildings 15, no. 3: 326. https://doi.org/10.3390/buildings15030326
APA StyleZhou, C., Hu, Y., Liu, R., Liu, Y., Wang, M., Luo, H., & Tian, Z. (2025). Energy Performance Study of a Data Center Combined Cooling System Integrated with Heat Storage and Waste Heat Recovery System. Buildings, 15(3), 326. https://doi.org/10.3390/buildings15030326