

Stress Concentration Factors of CHS-to-CFRHS Y-Joints Under Axial Tension Loading


Abstract
1. Introduction
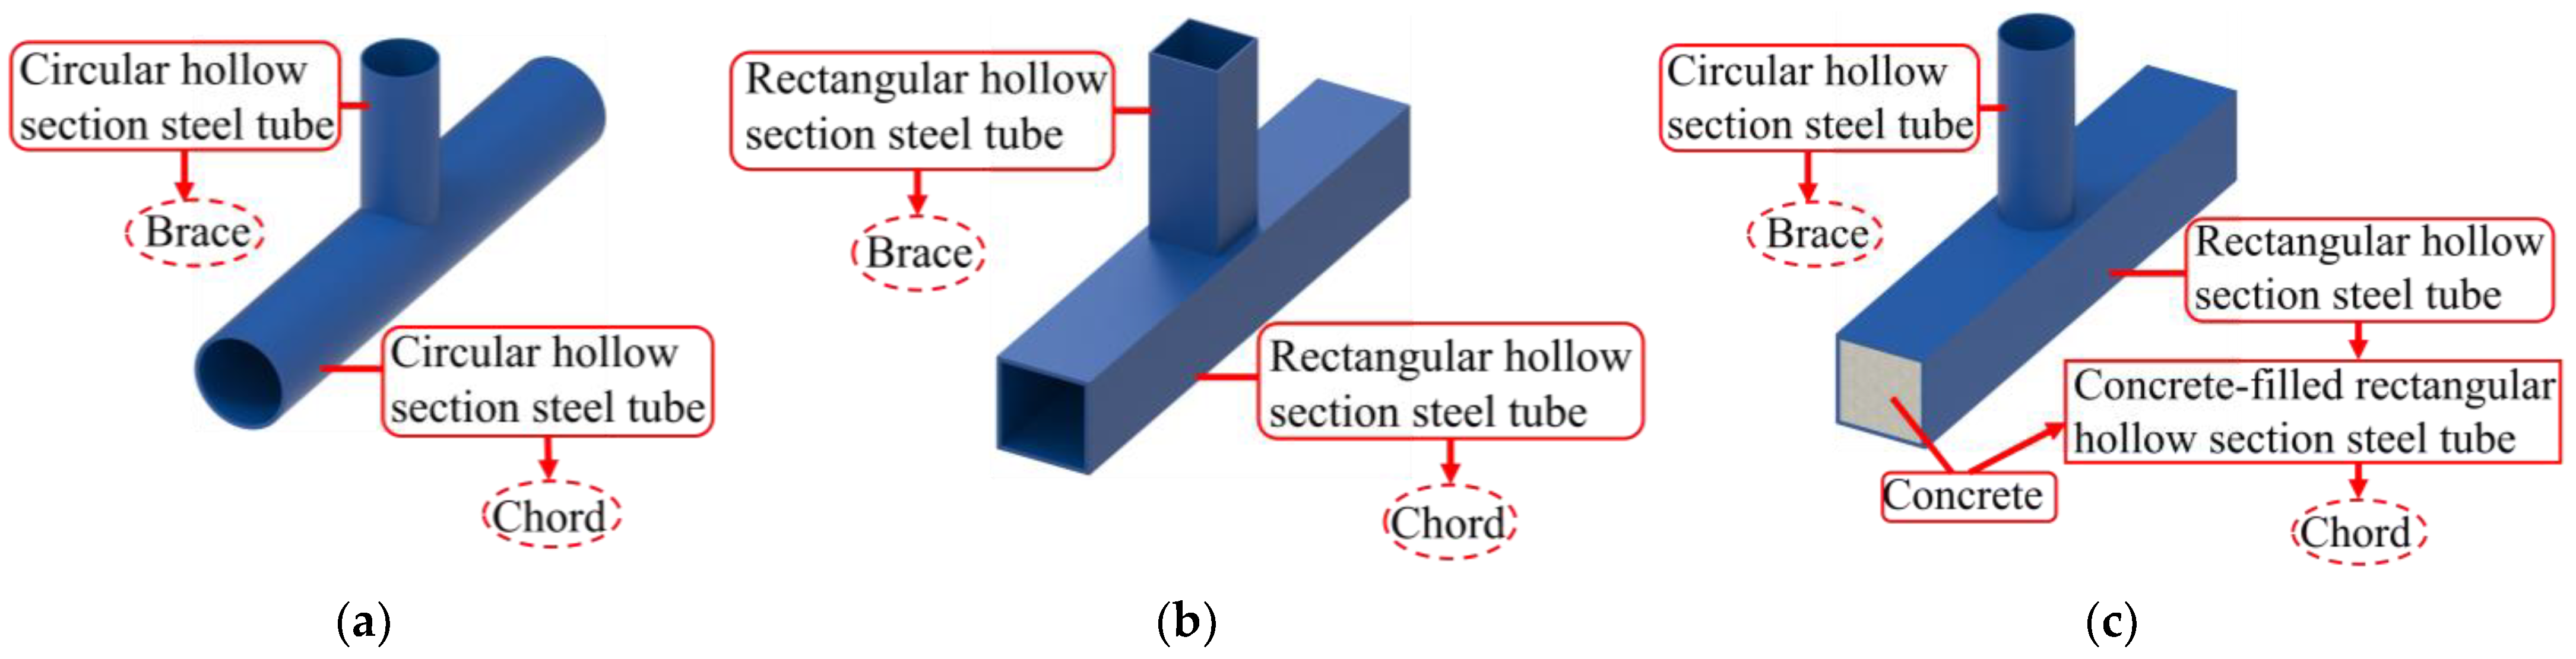
2. FE Model and Verification
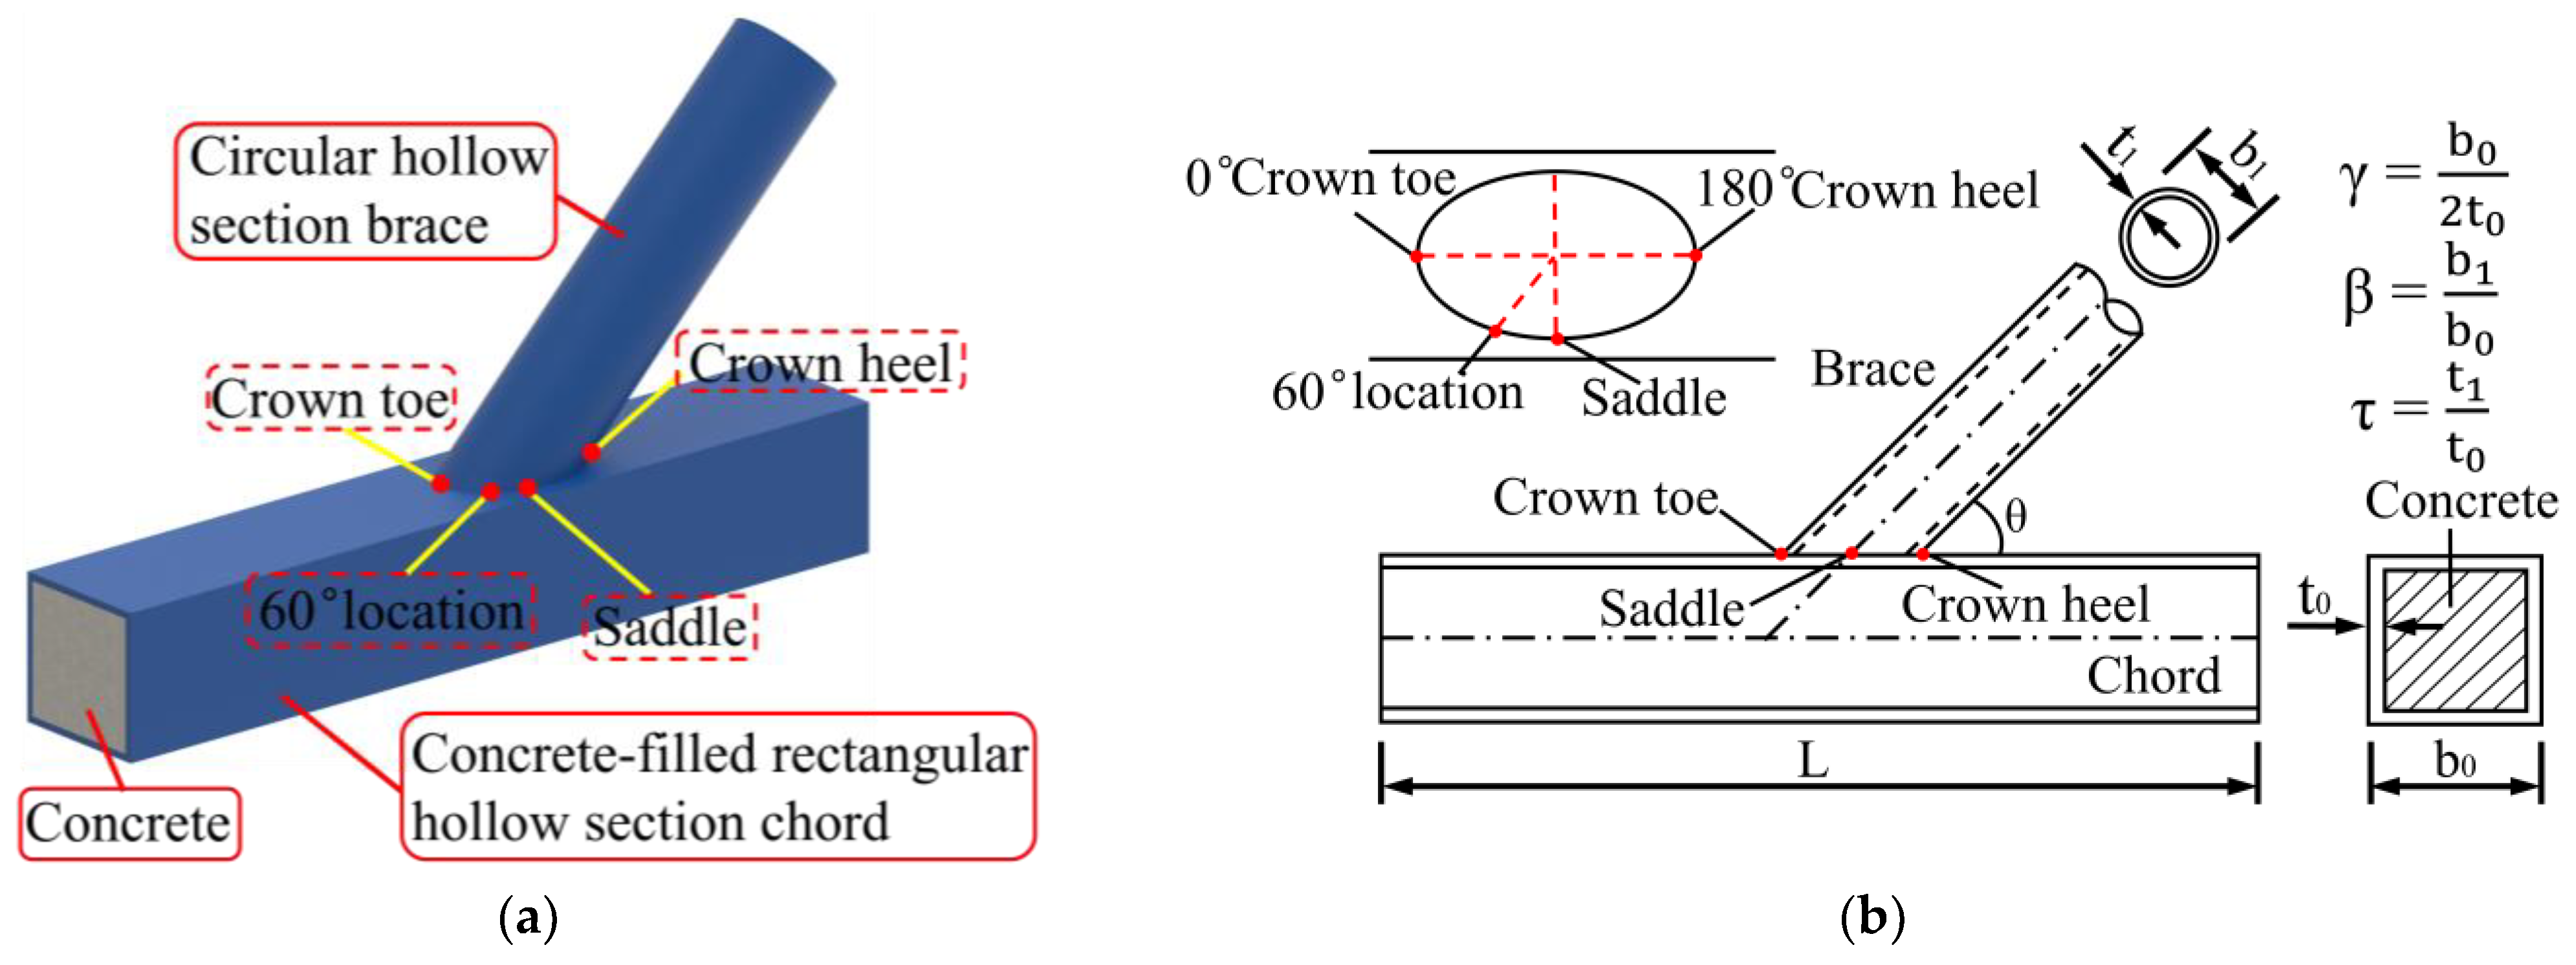
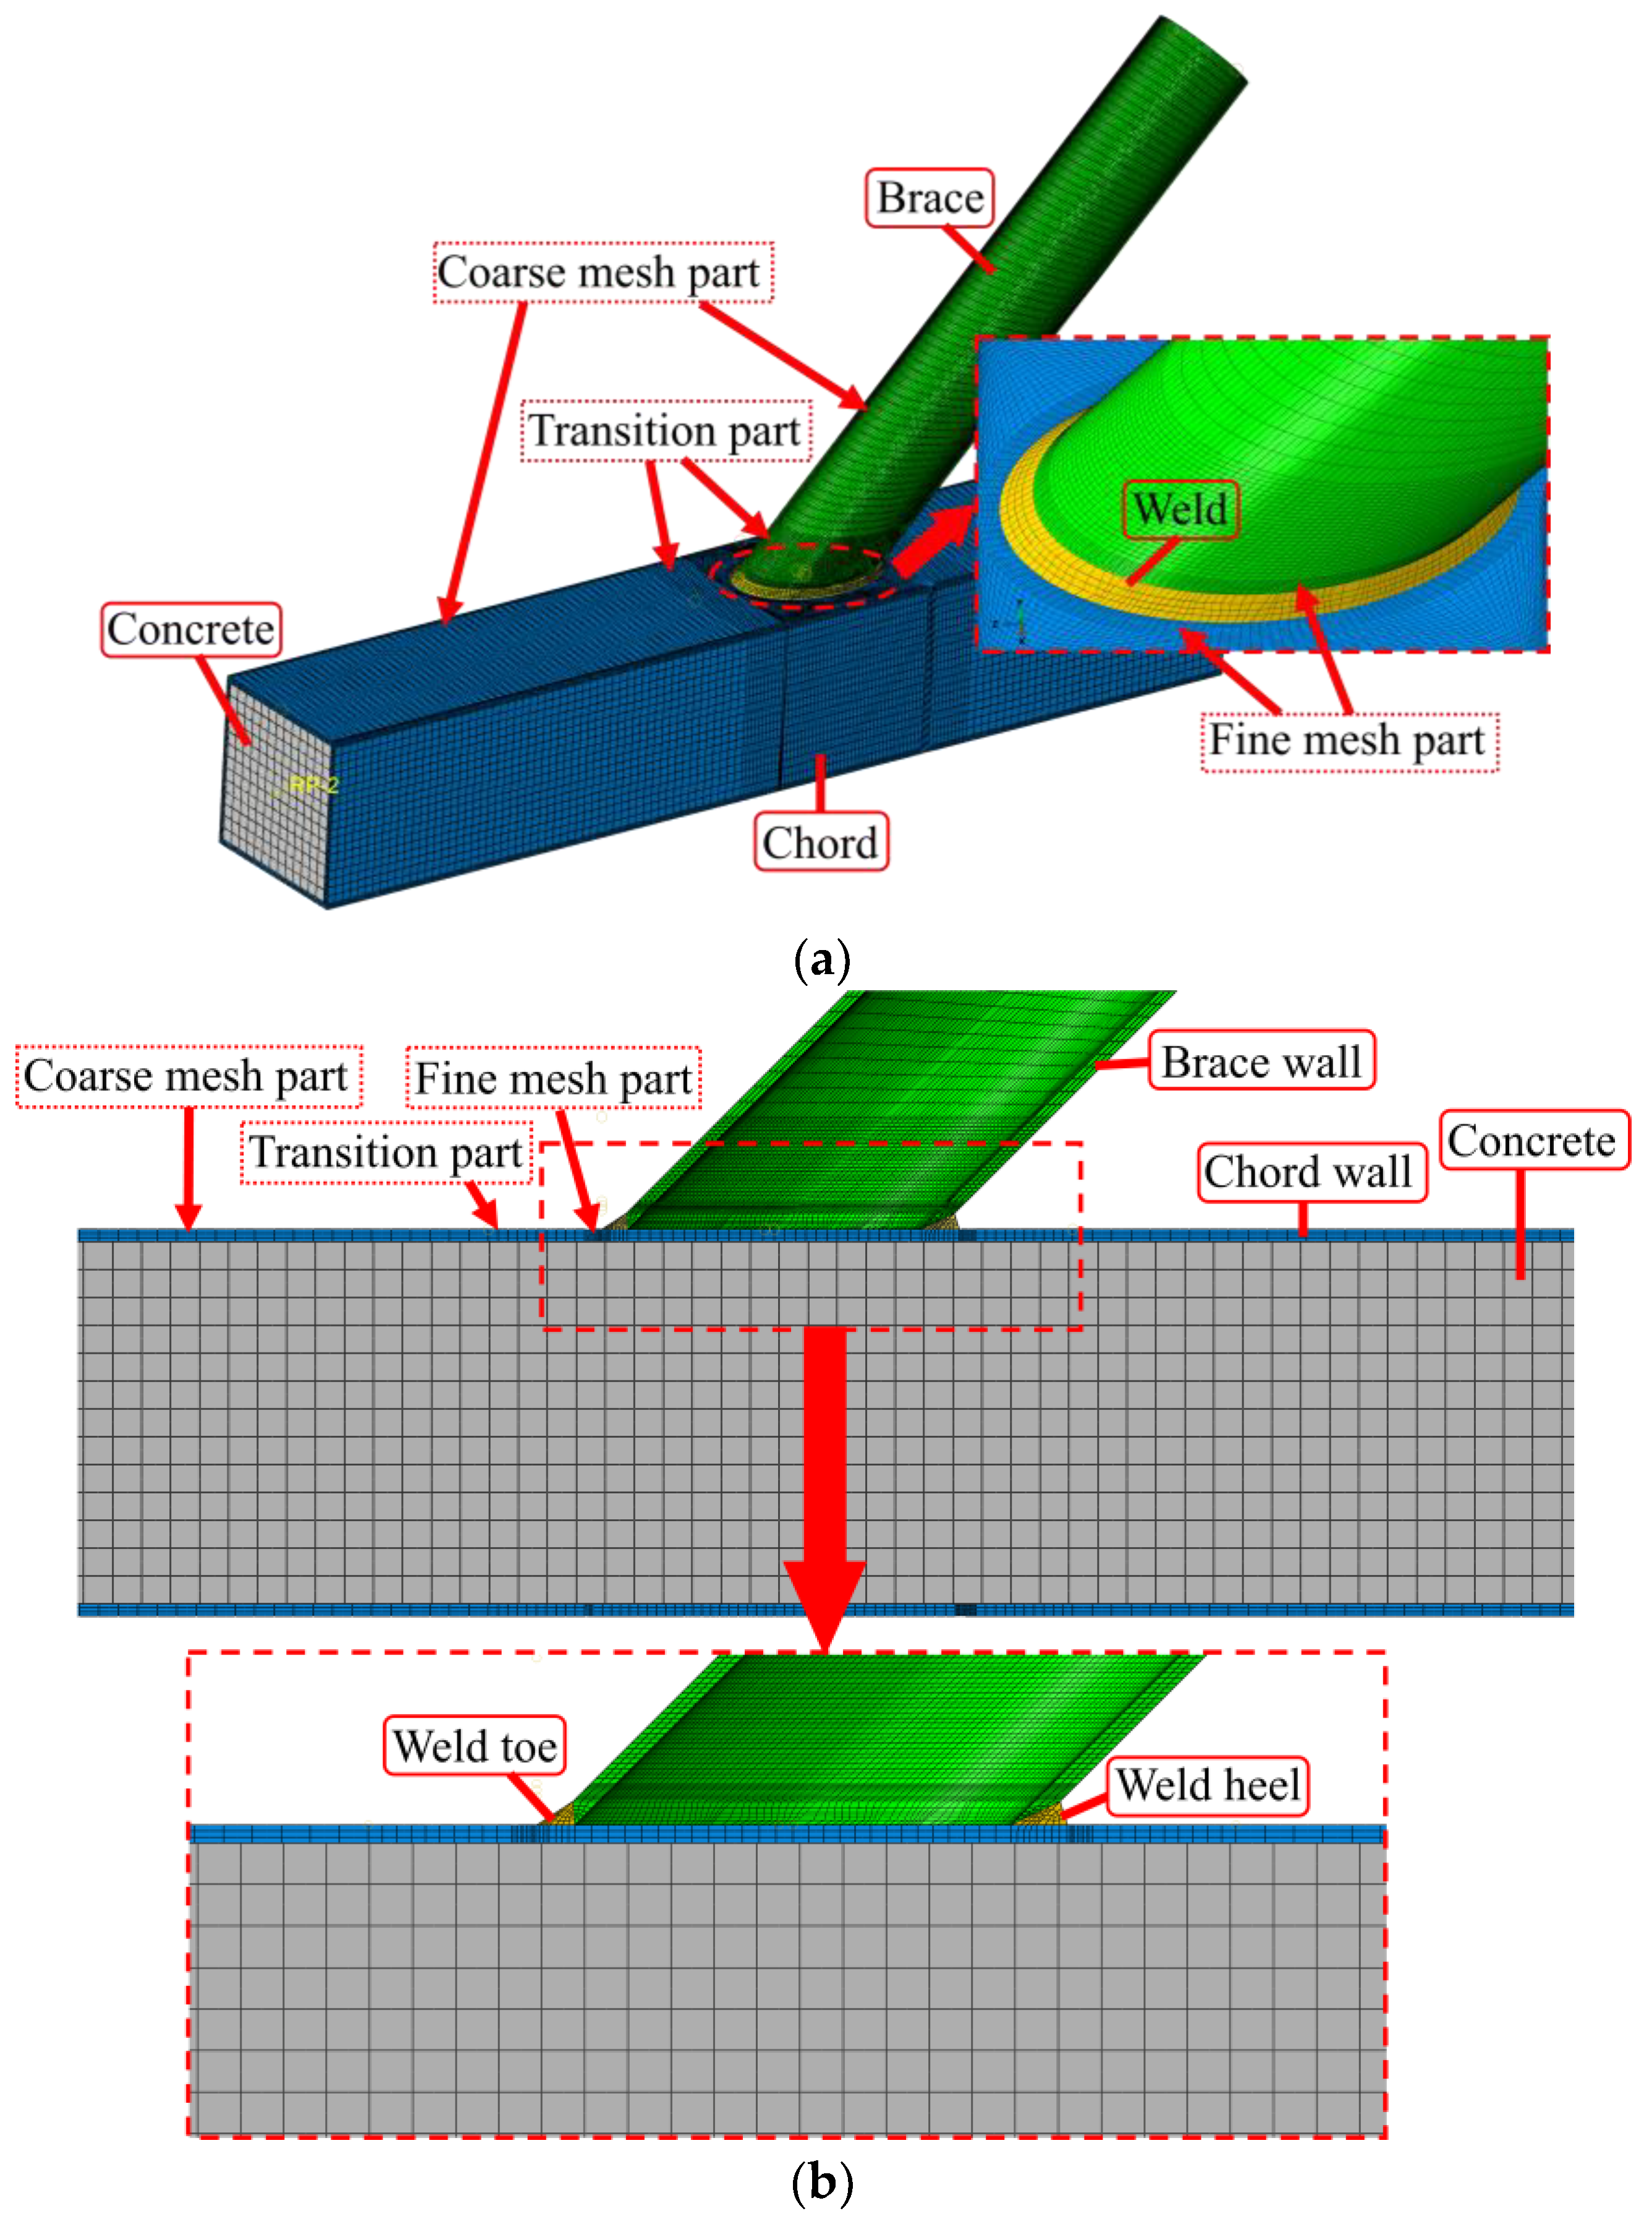
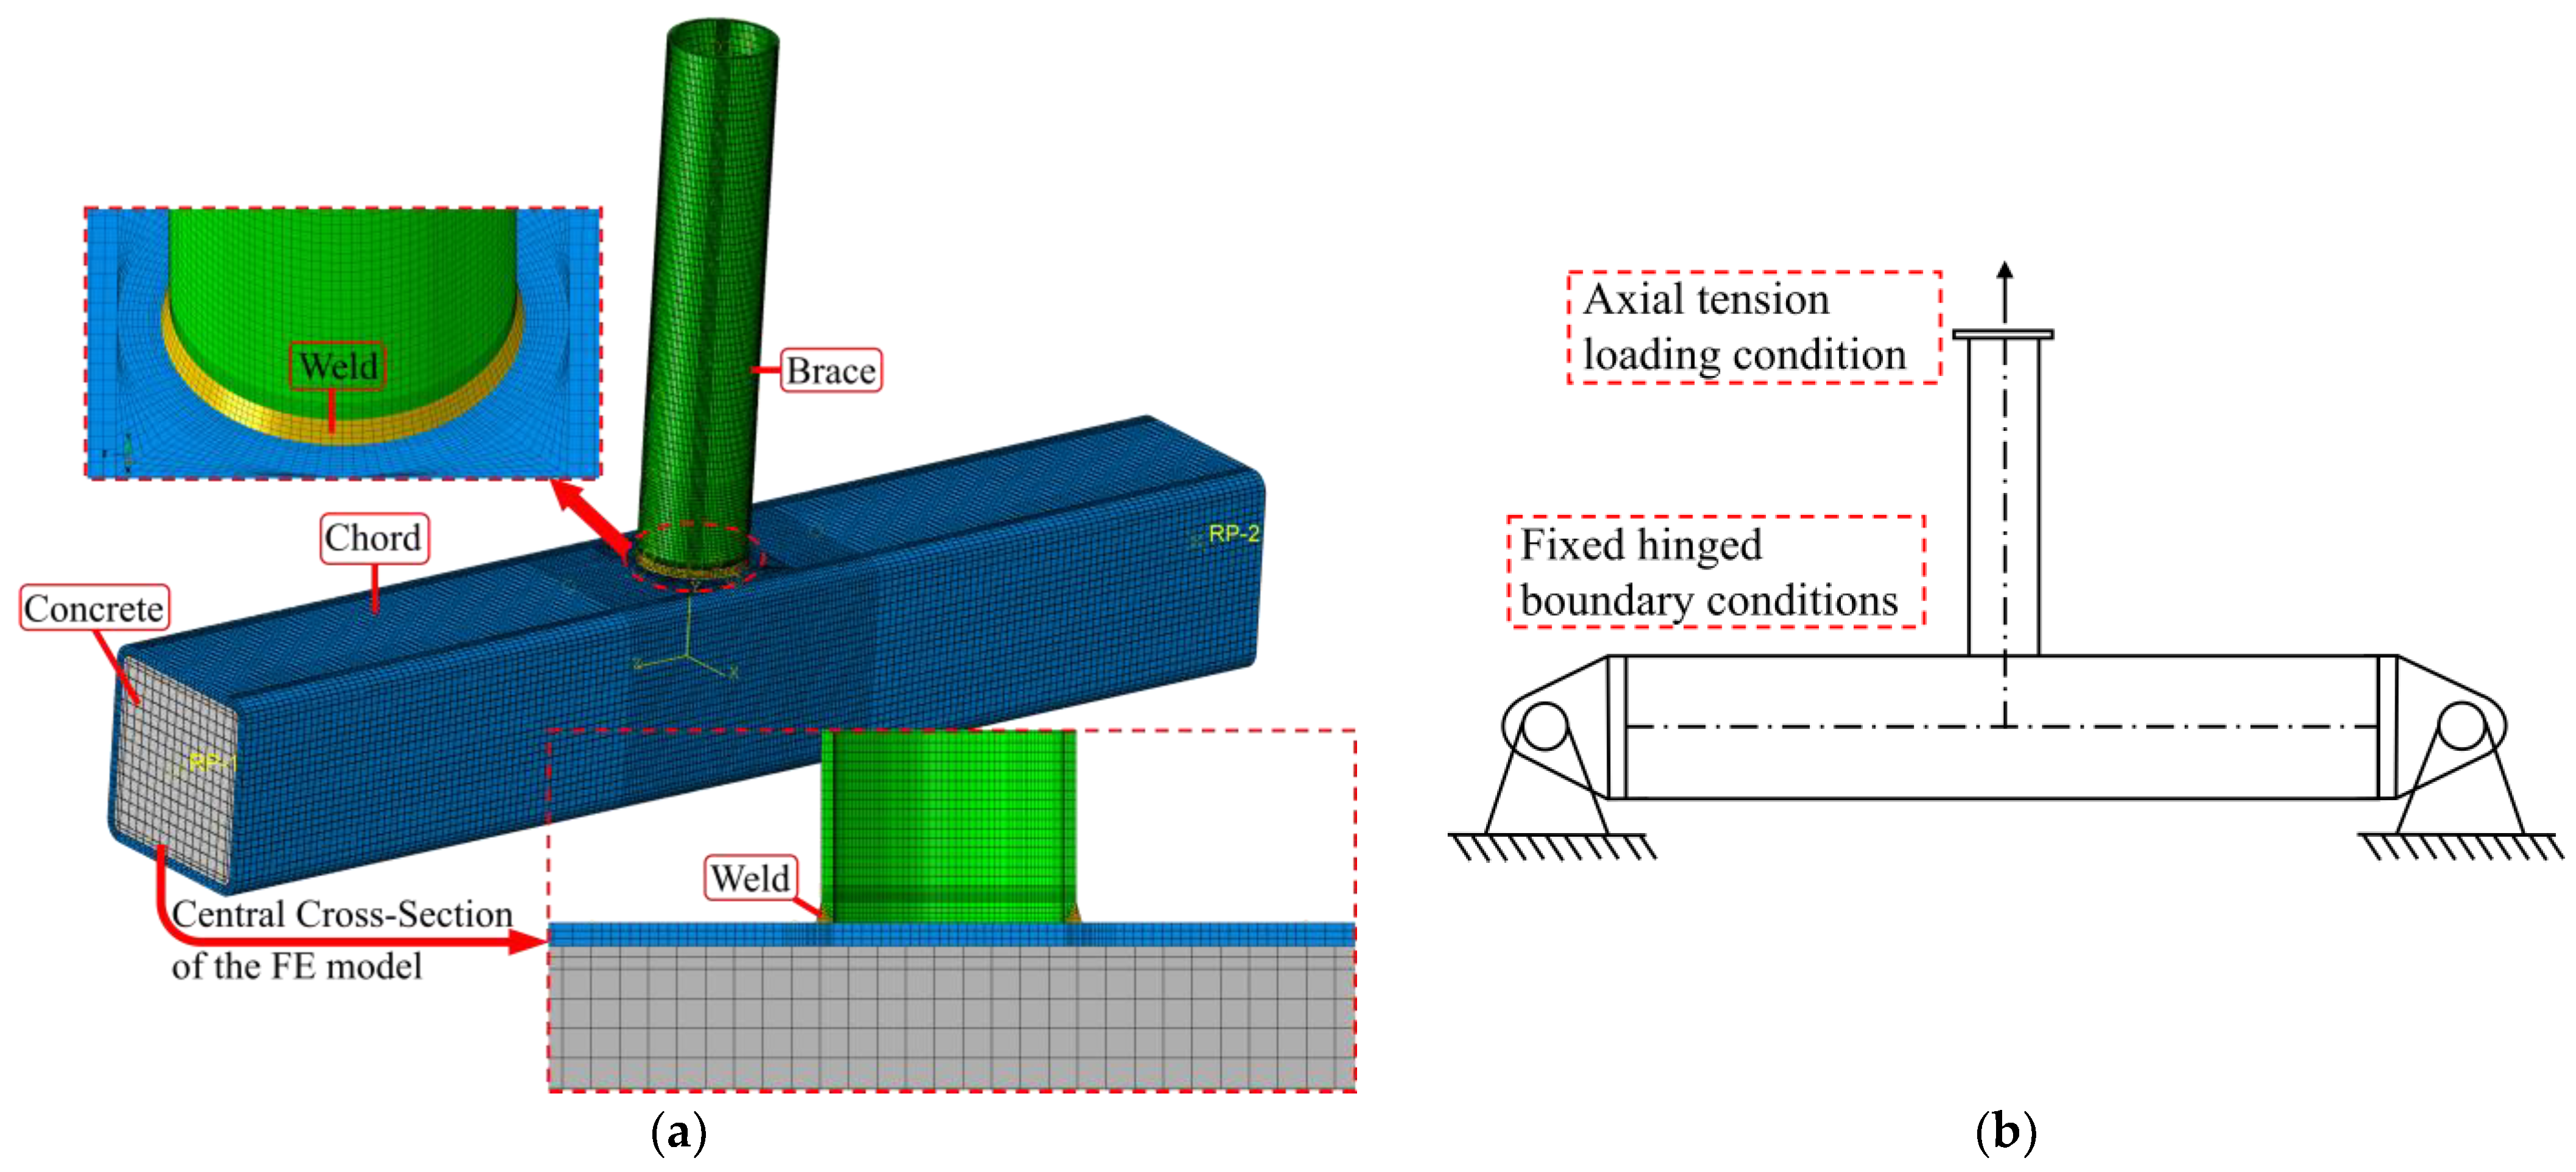
2.1. FE Model
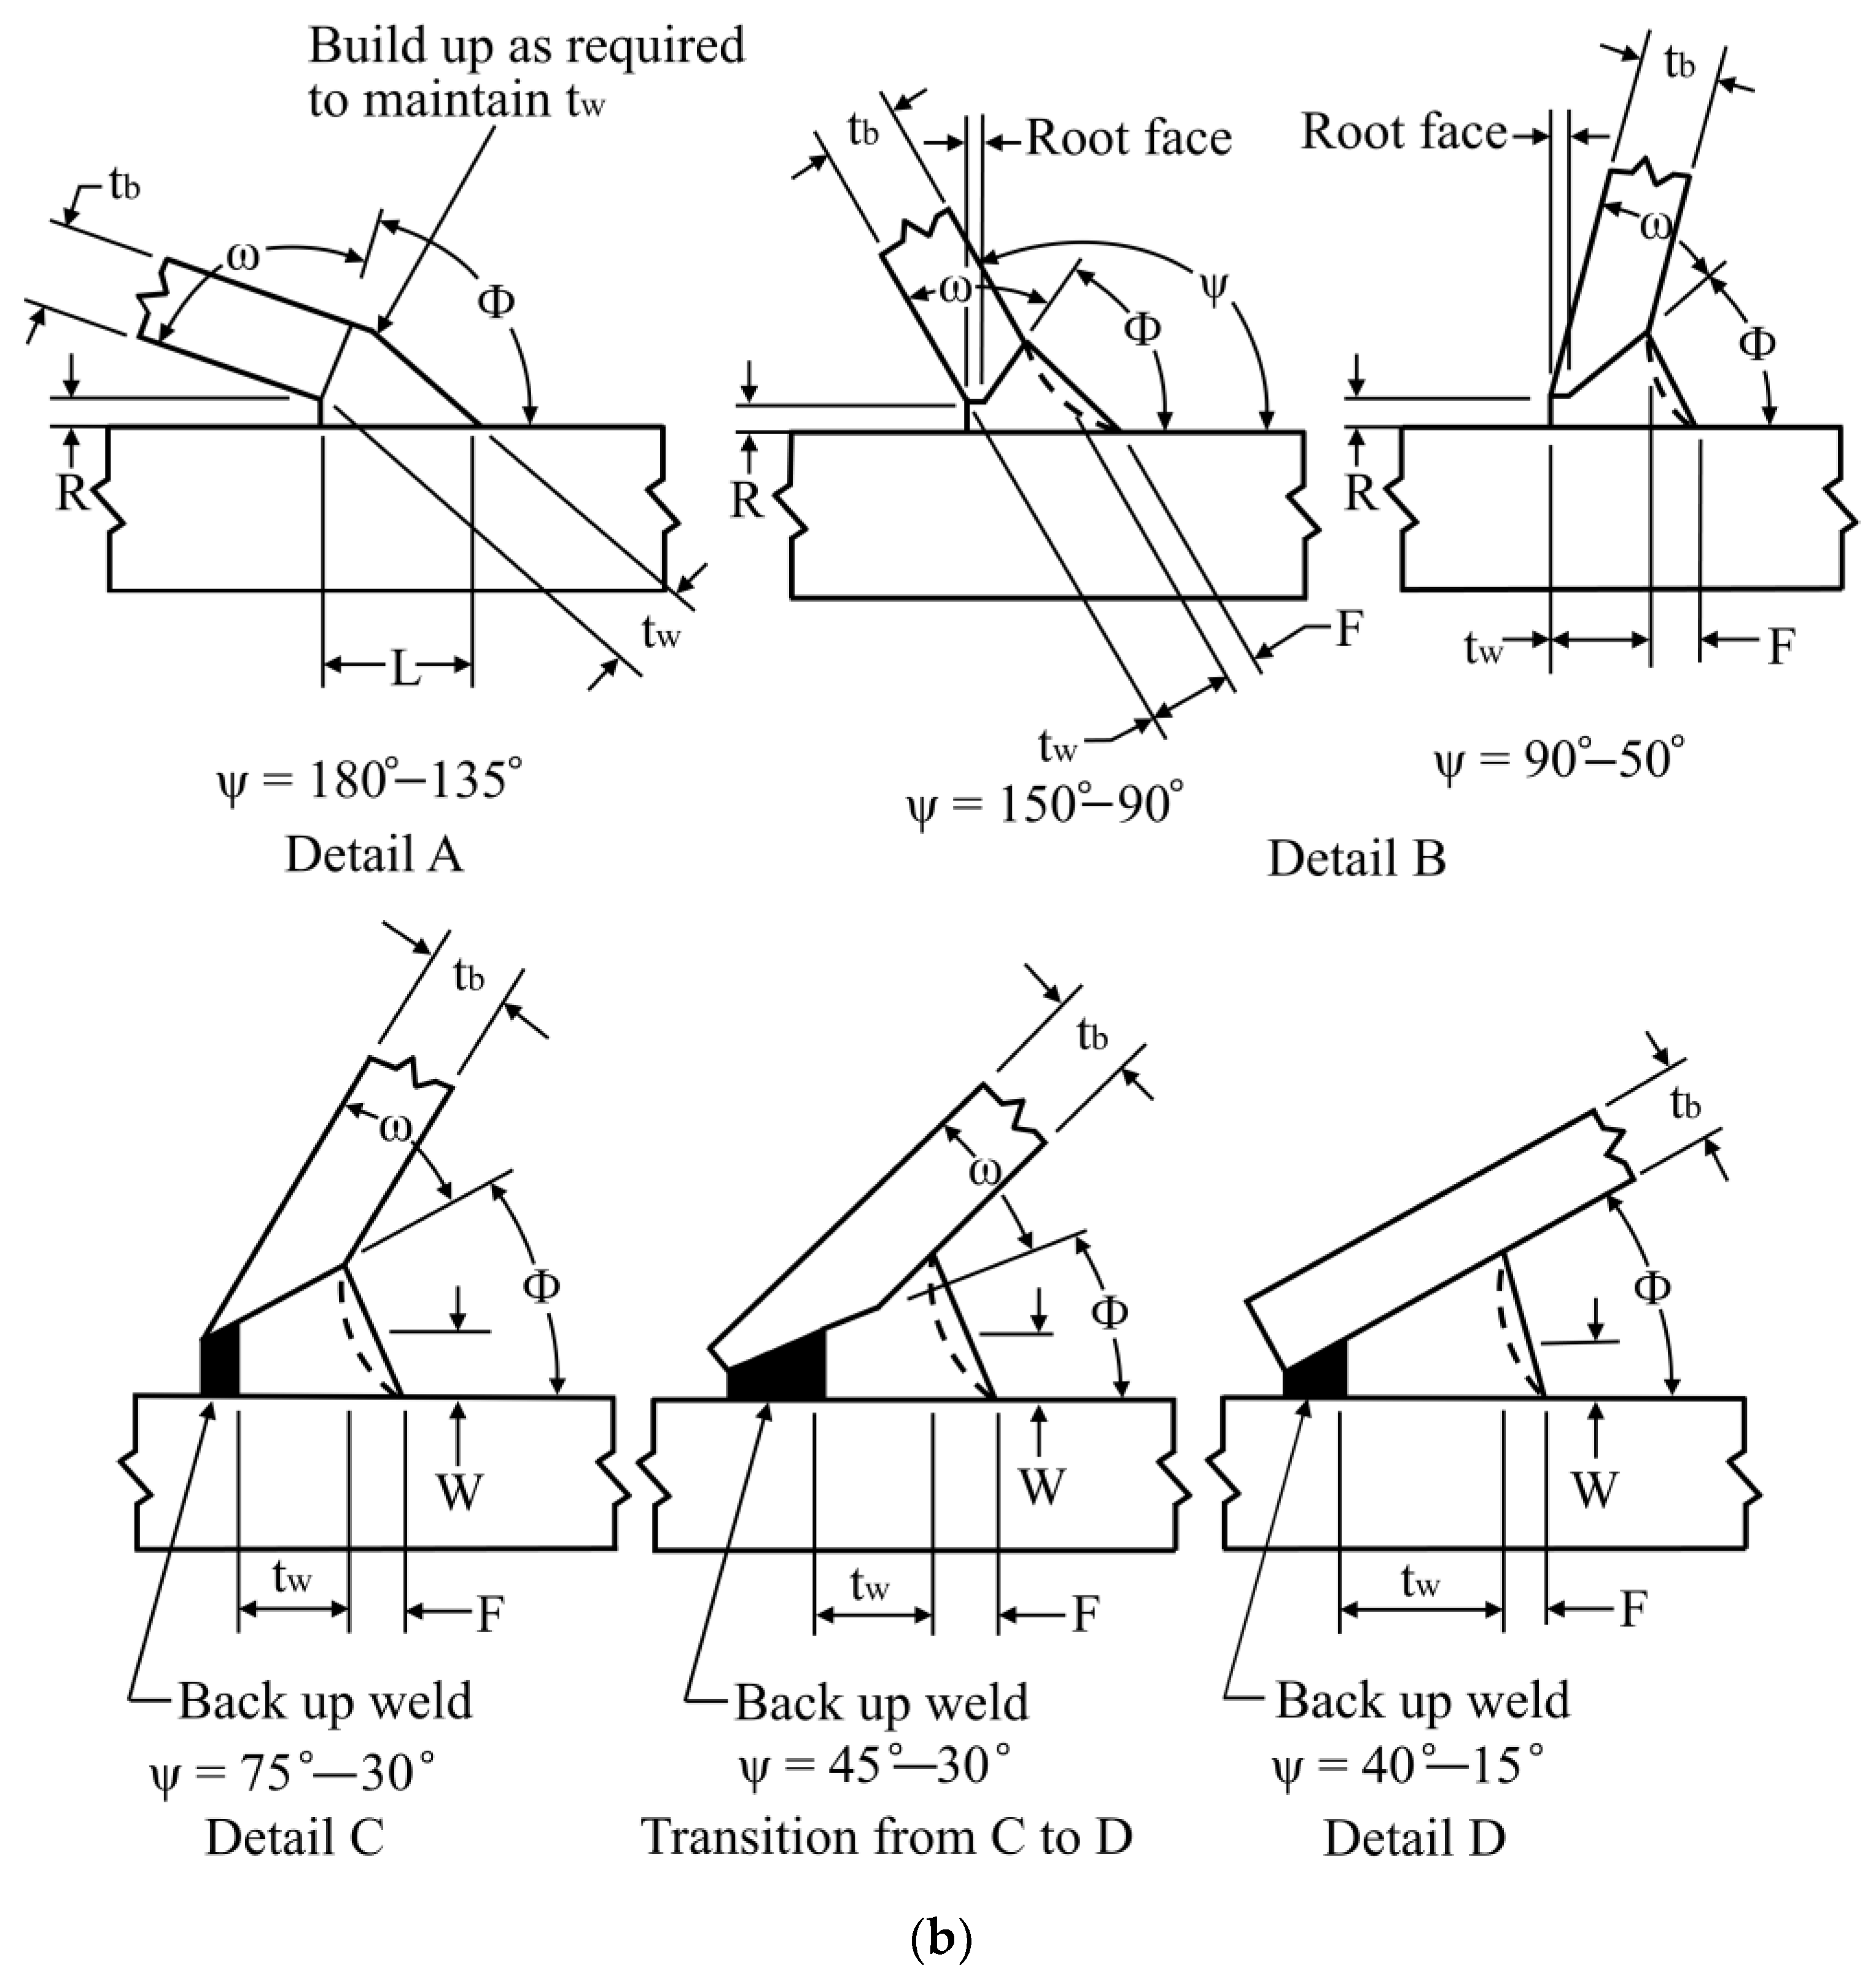
2.2. Weld Details
2.3. Steel–Concrete Interface of the CFST Chord of the CHS-to-CFRHS Y-Joint
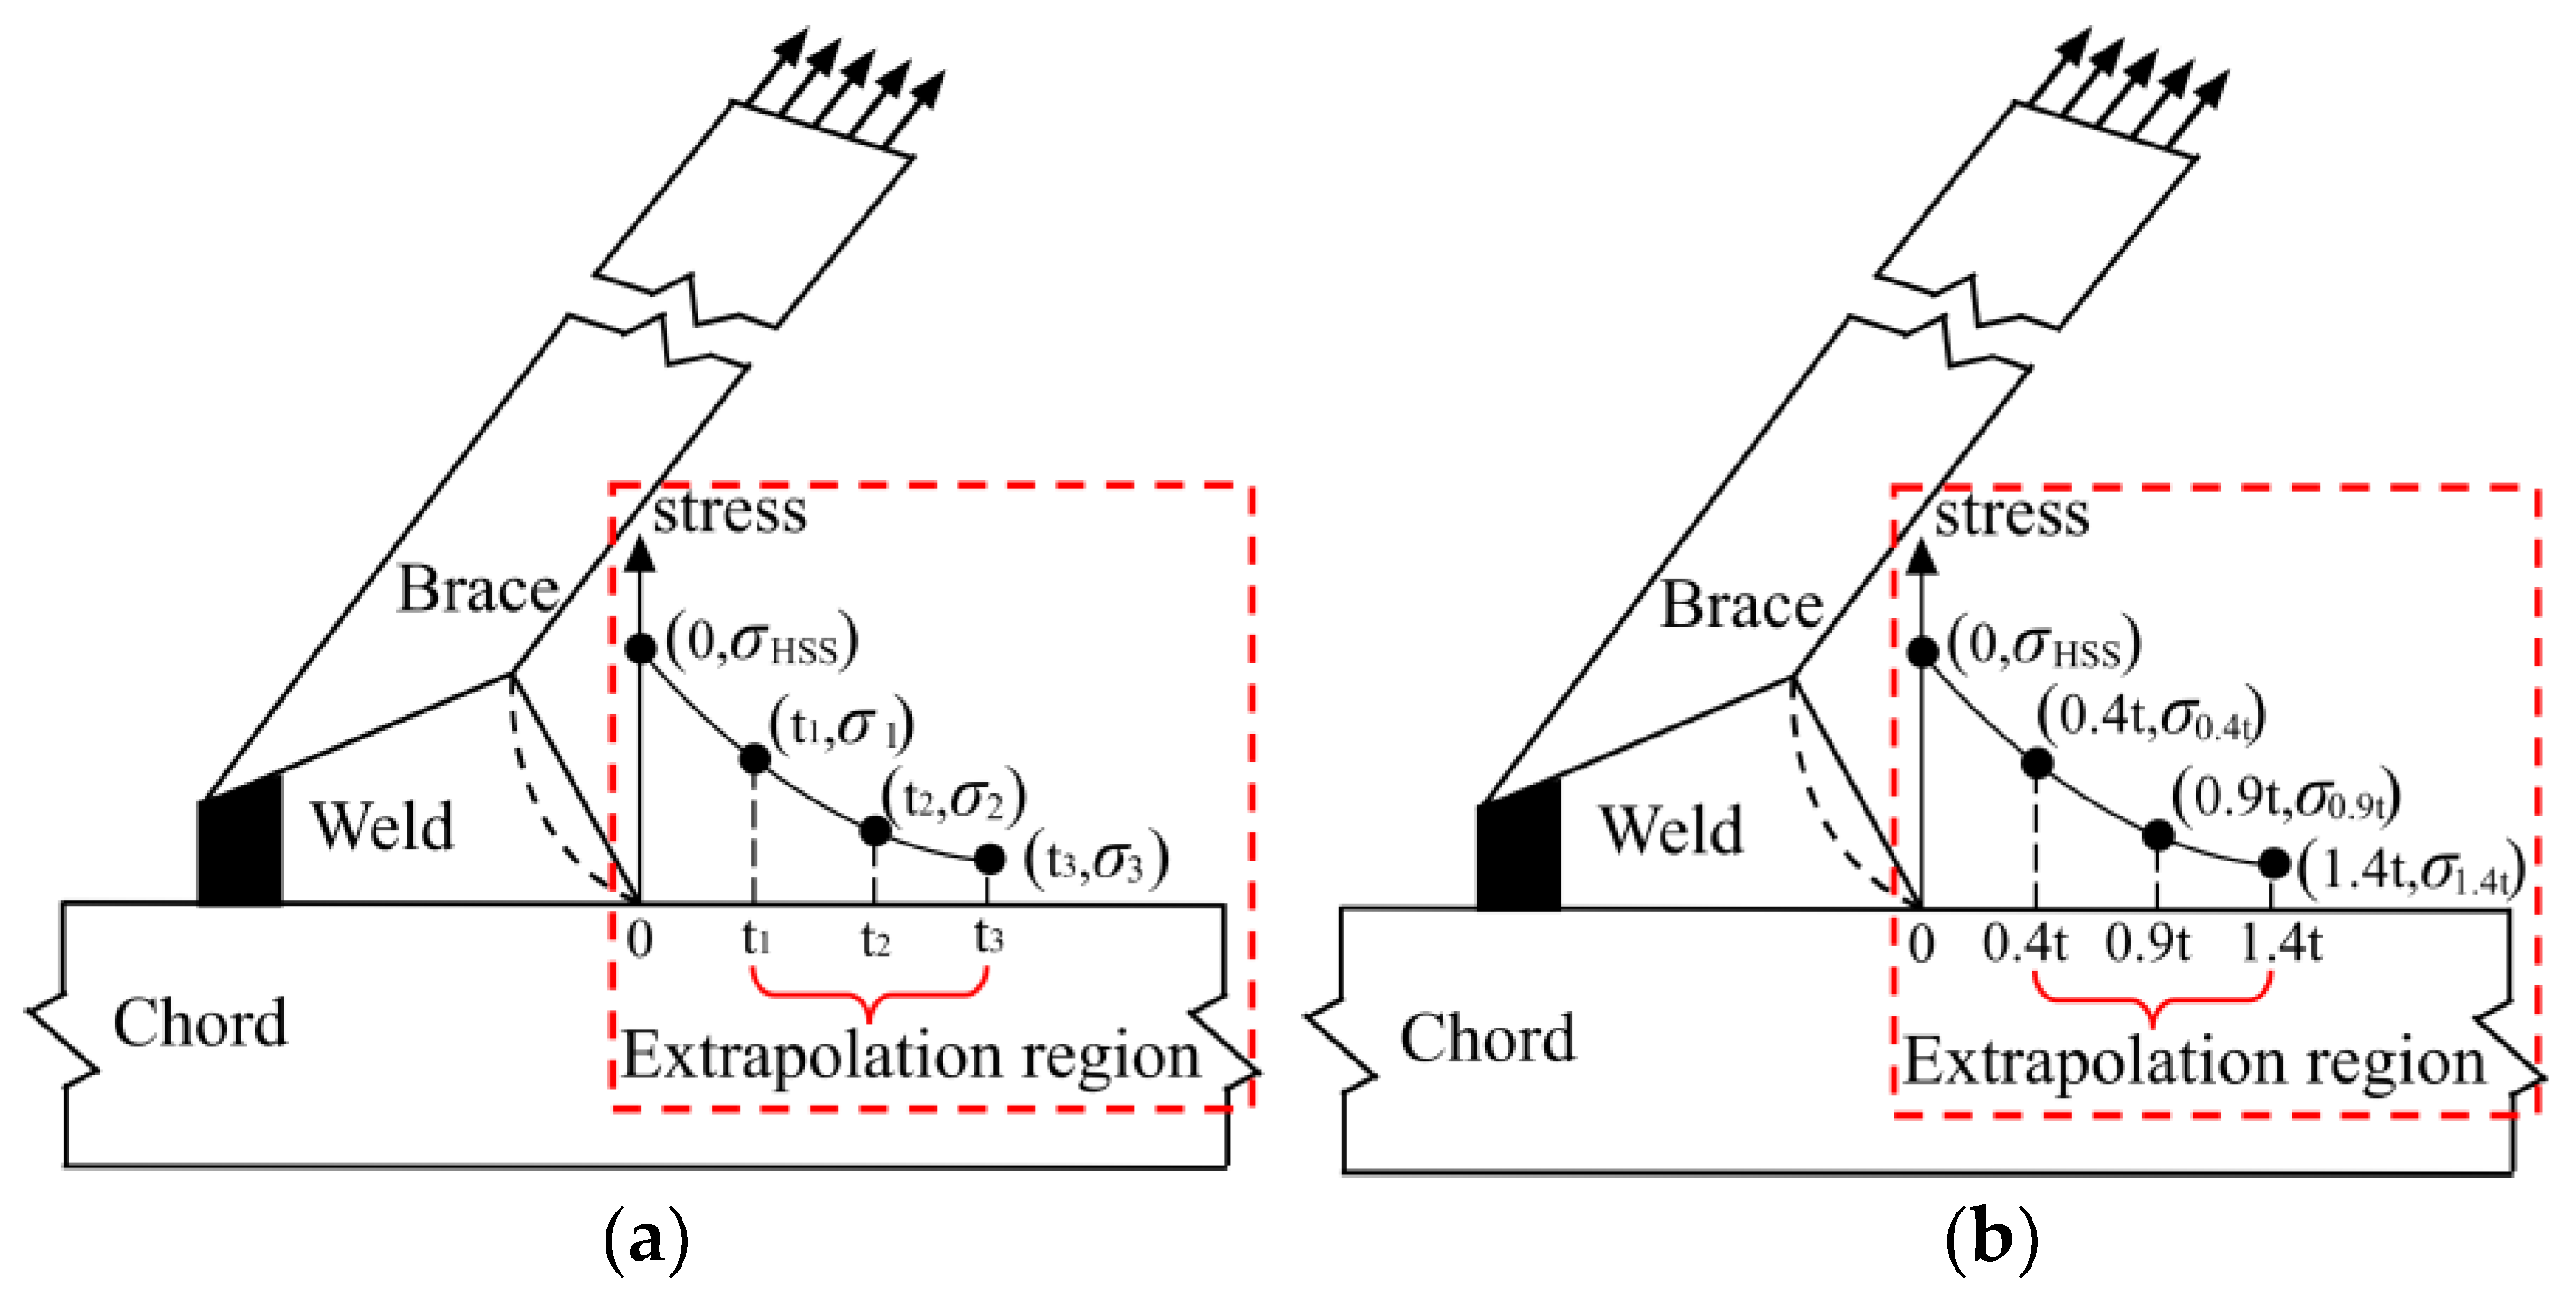
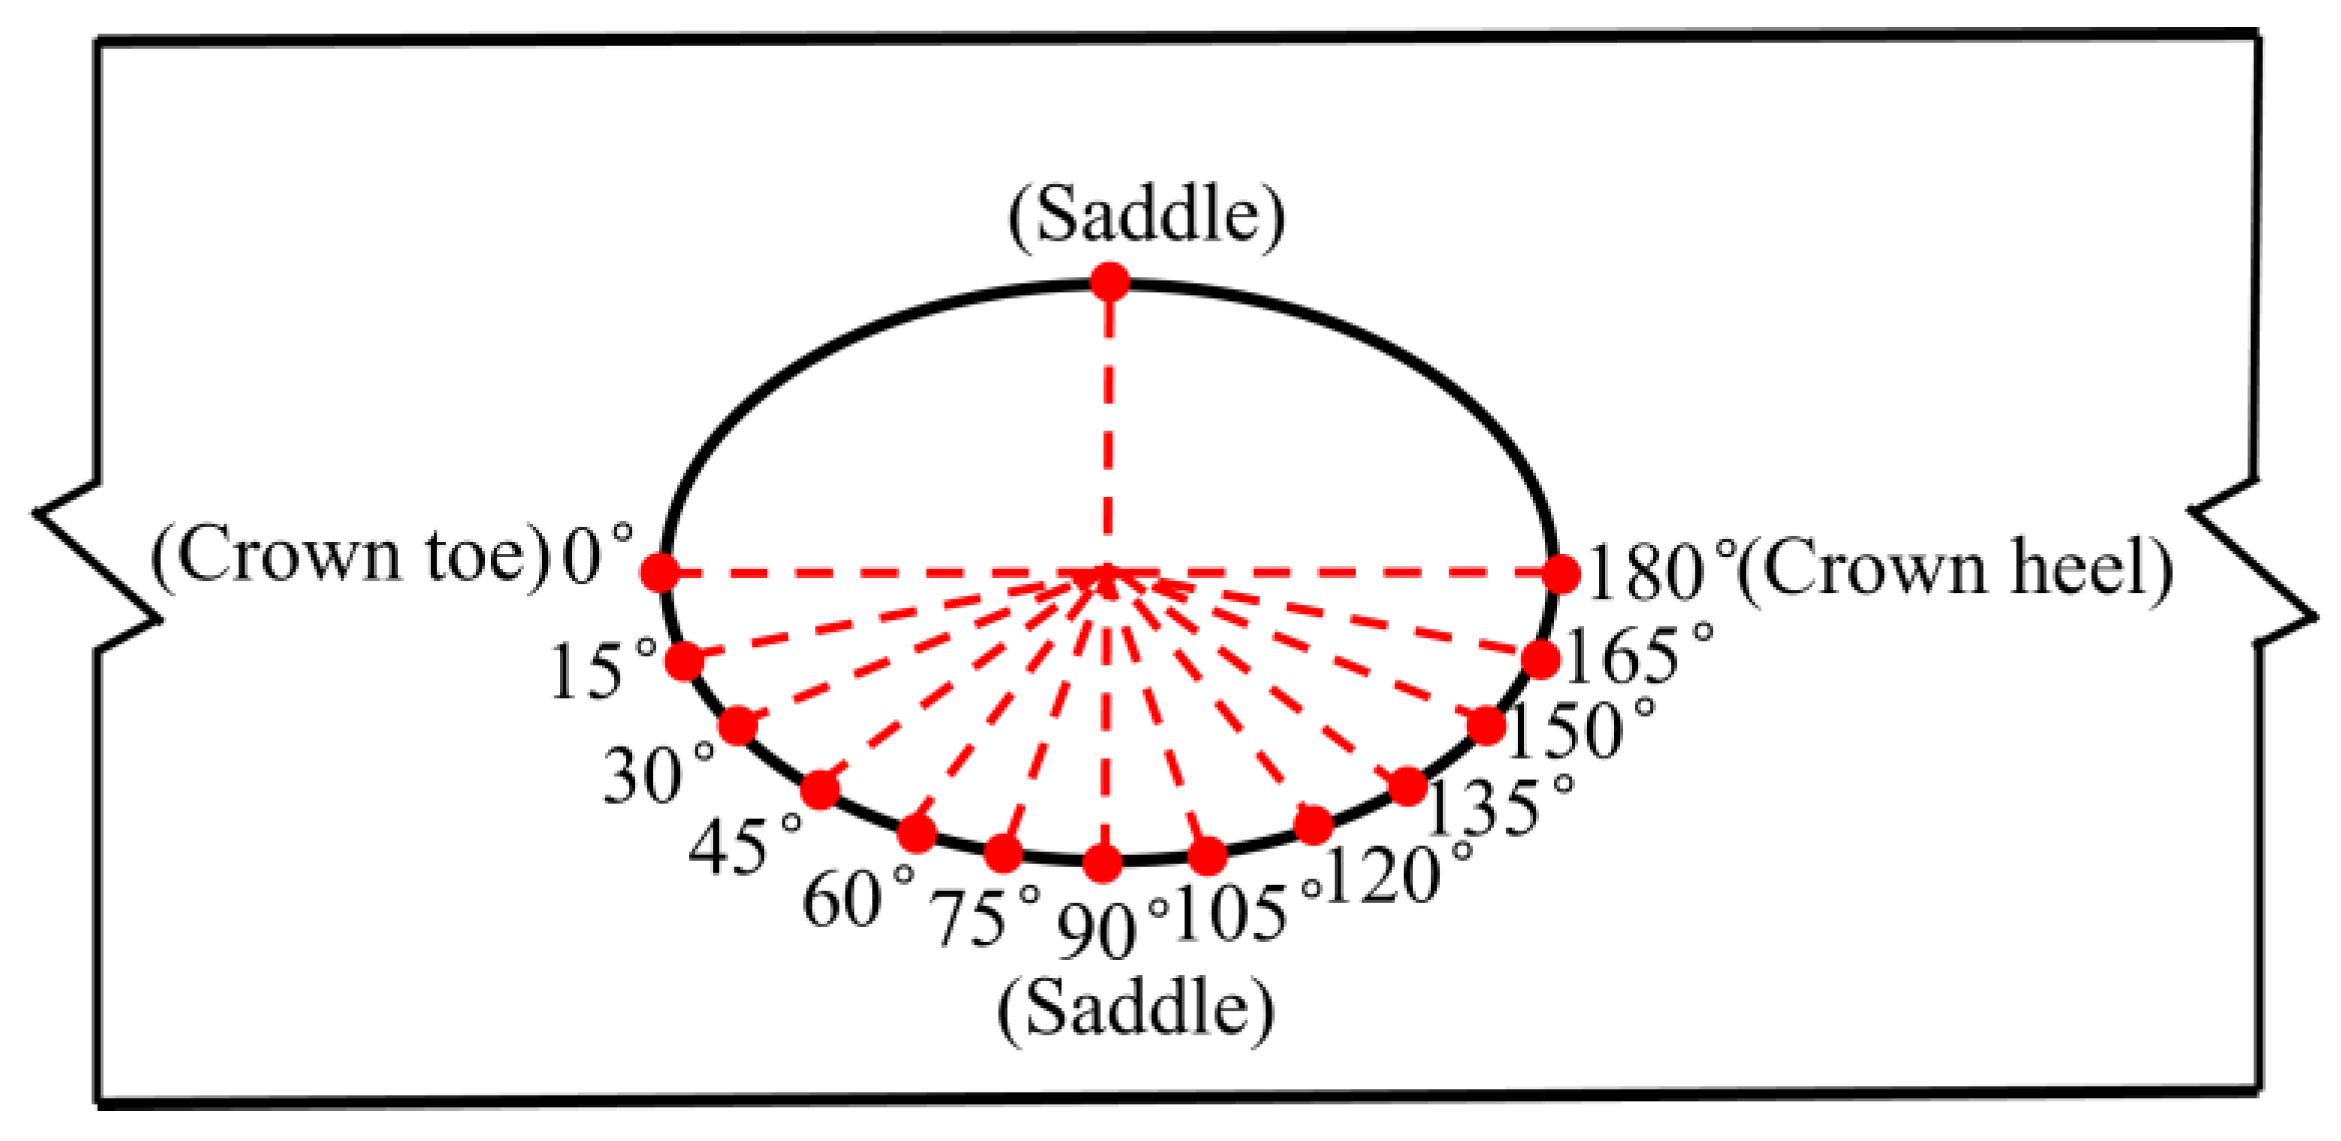
2.4. Extracting SCFs from the FE Models
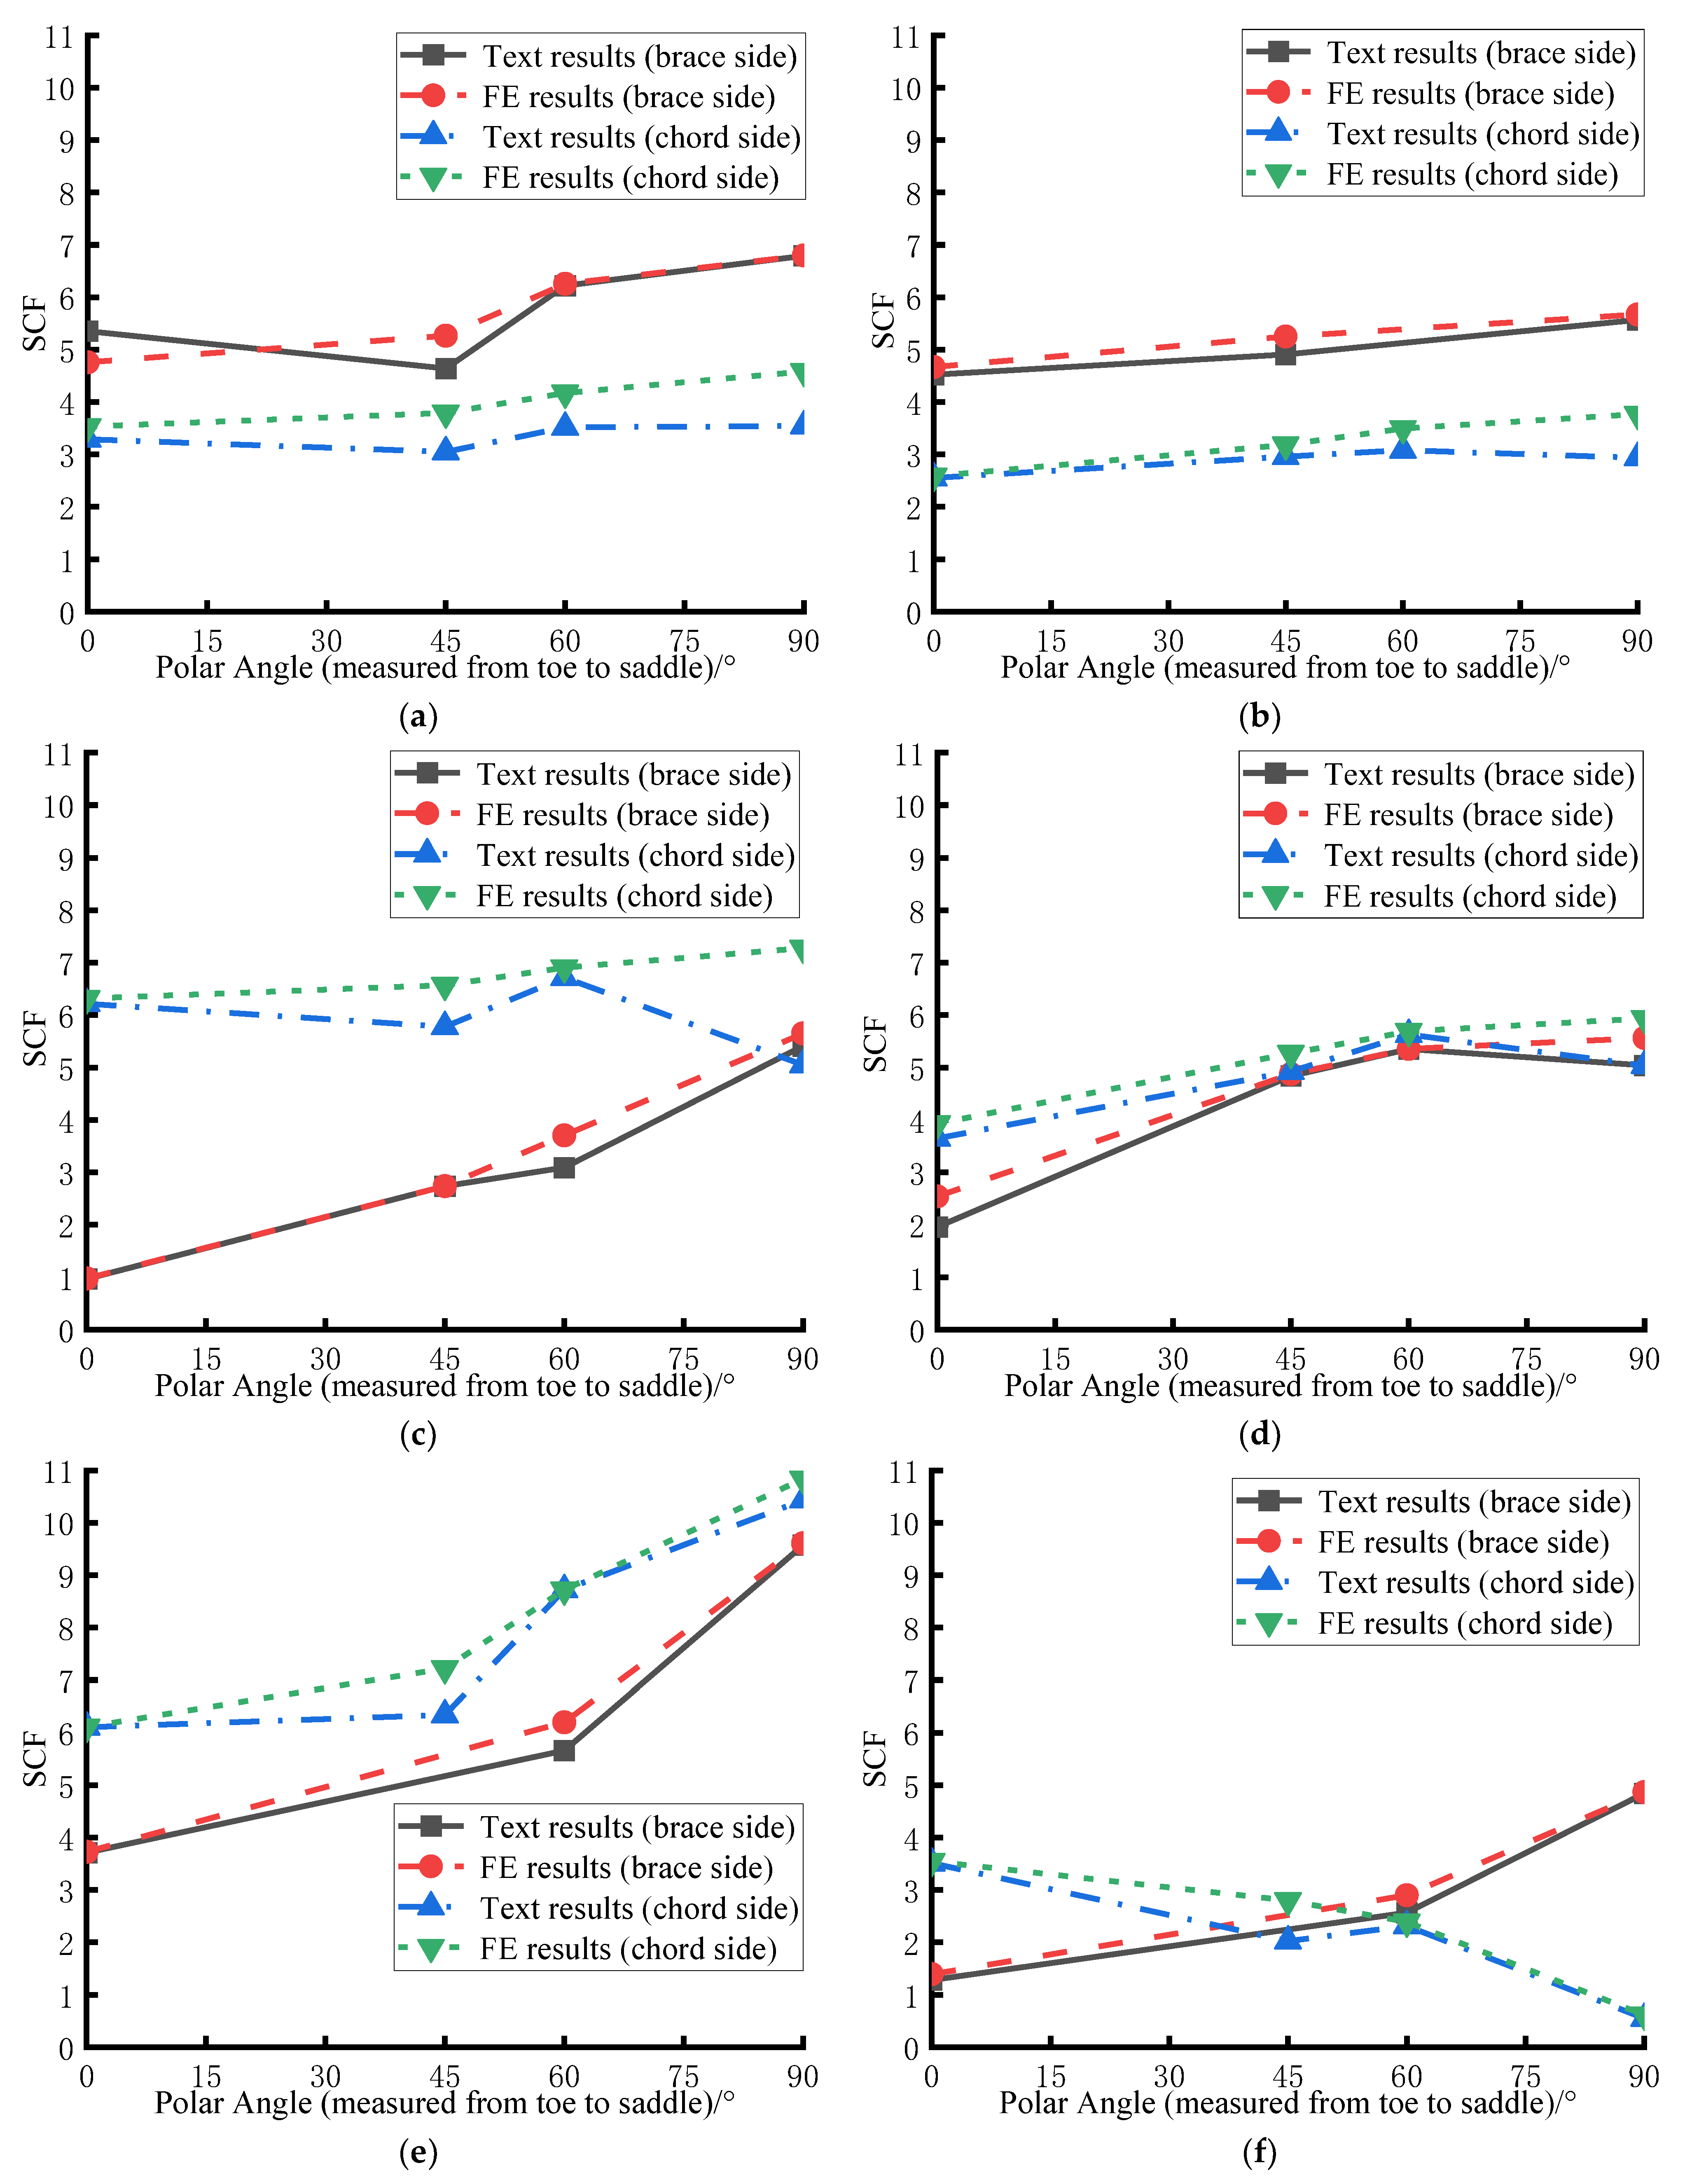
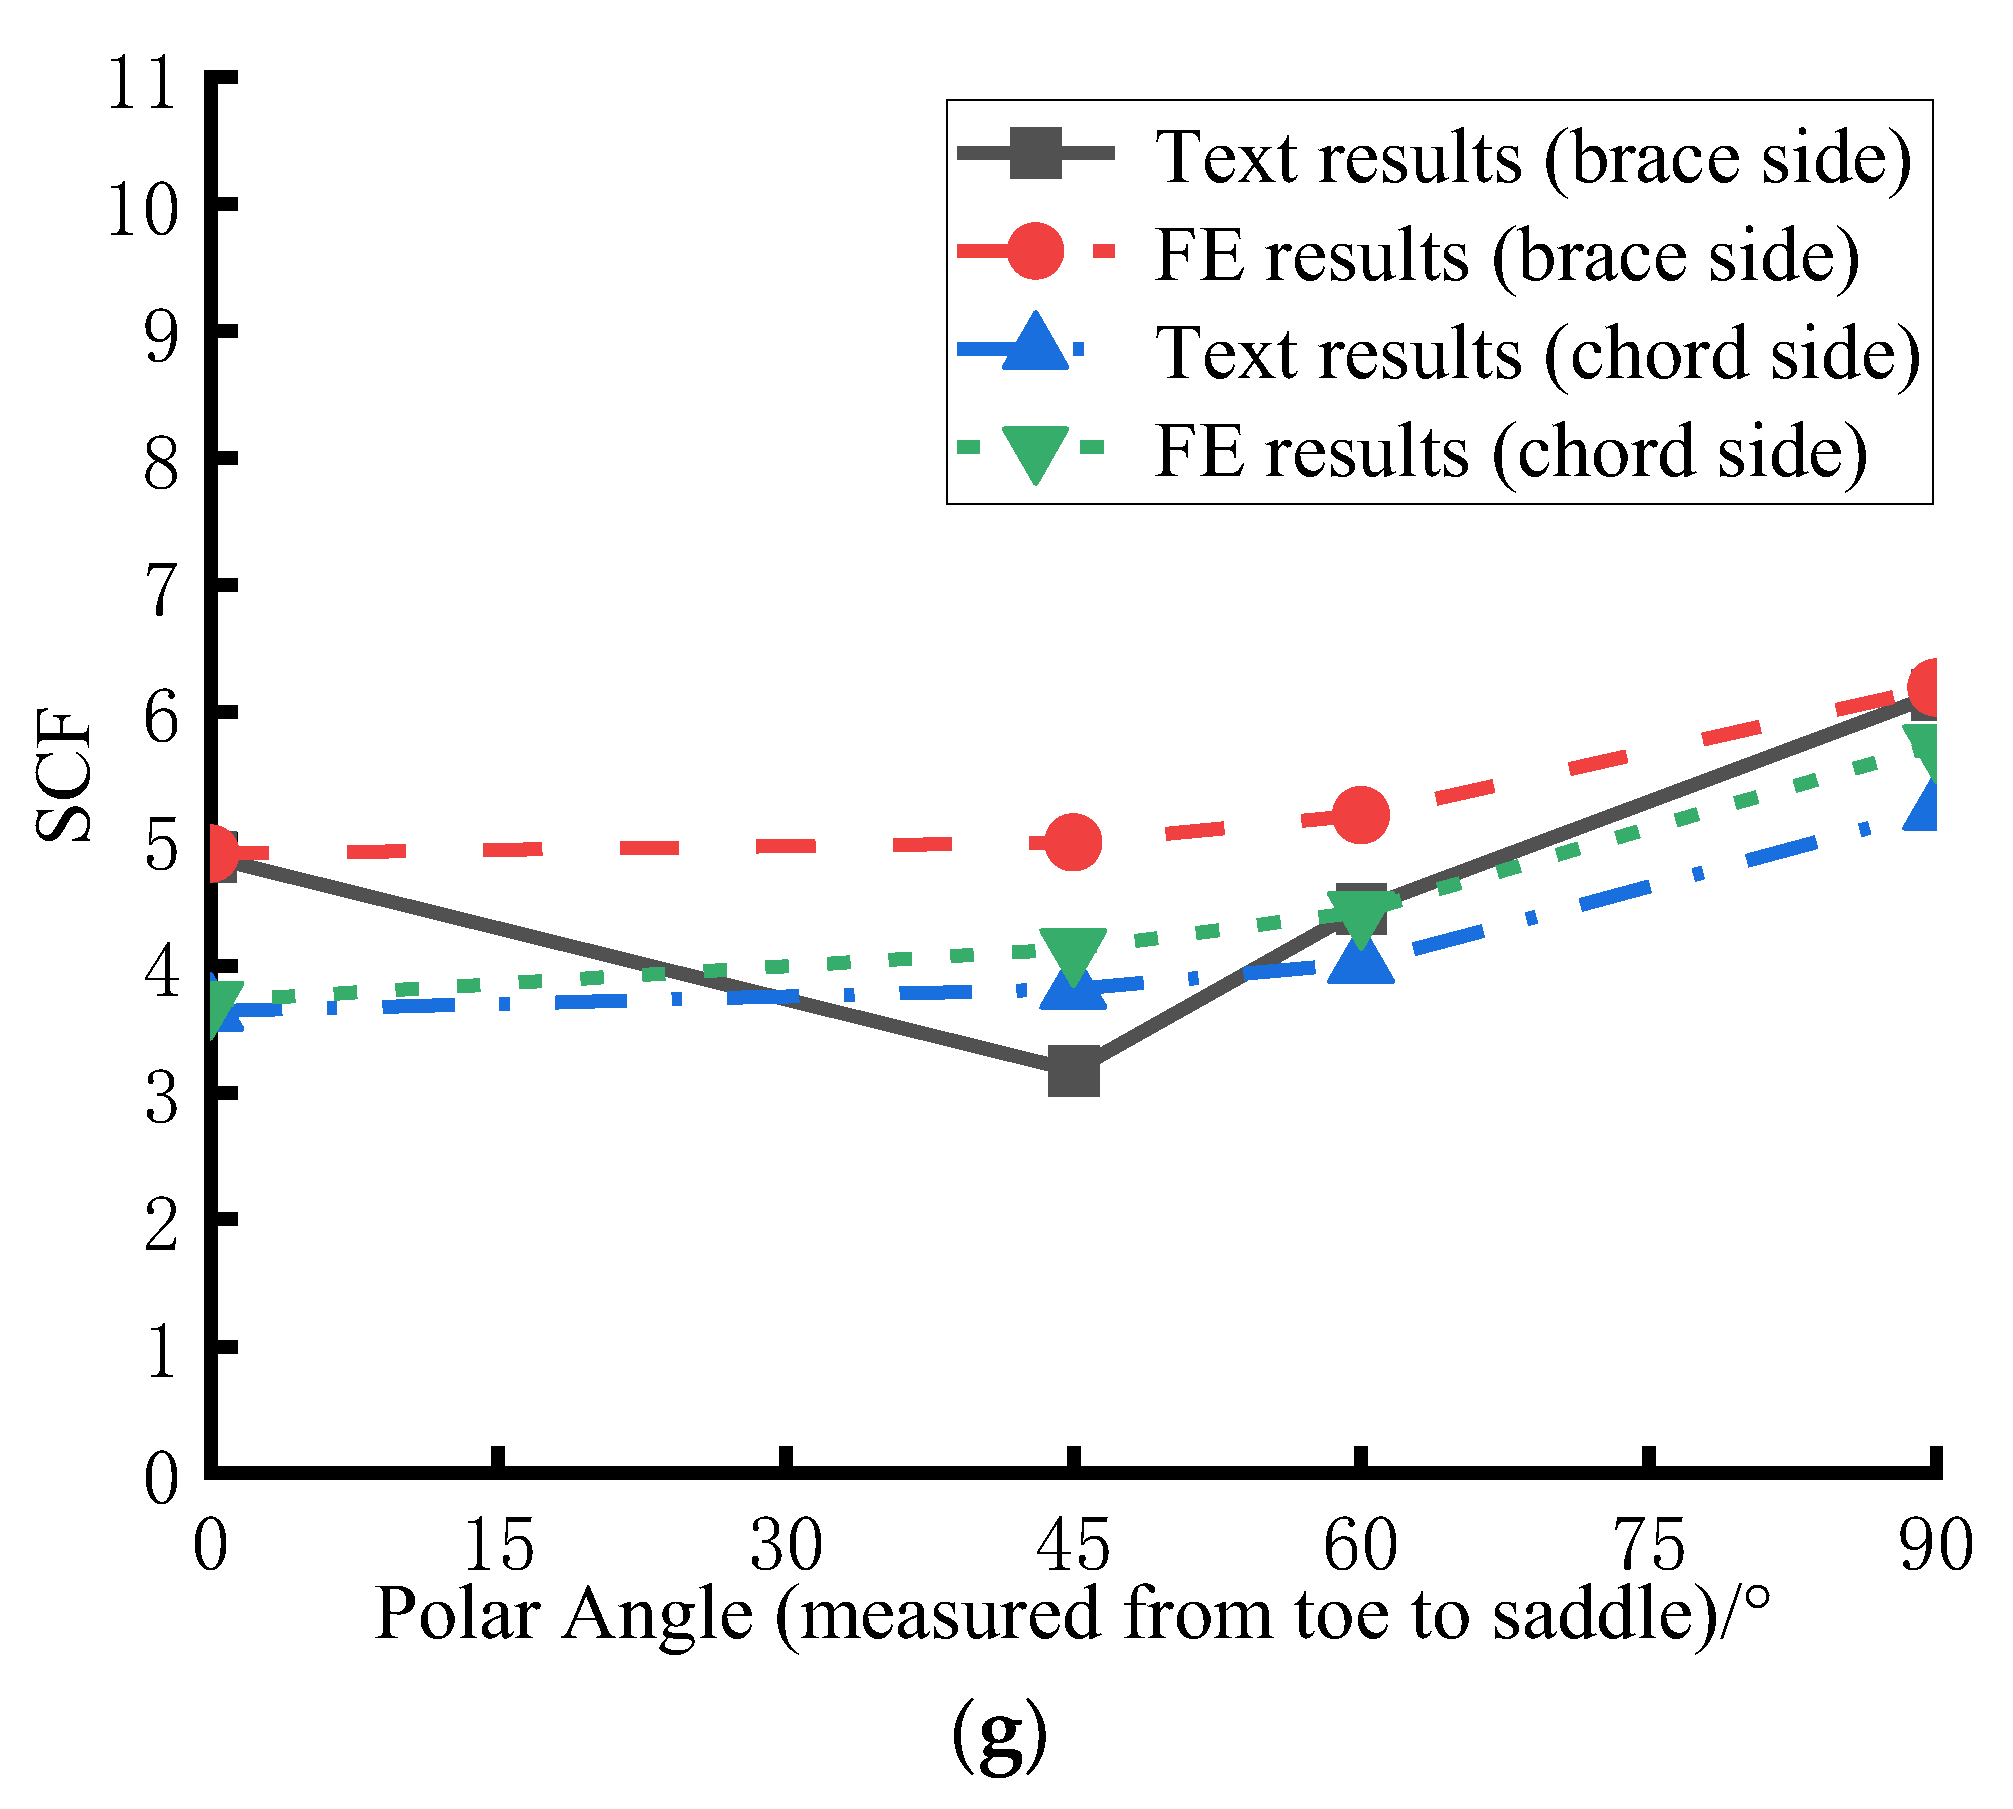
2.5. Verification of the FE Analysis Method
3. SCF Distribution of CHS-to-CFRHS Y-Joints
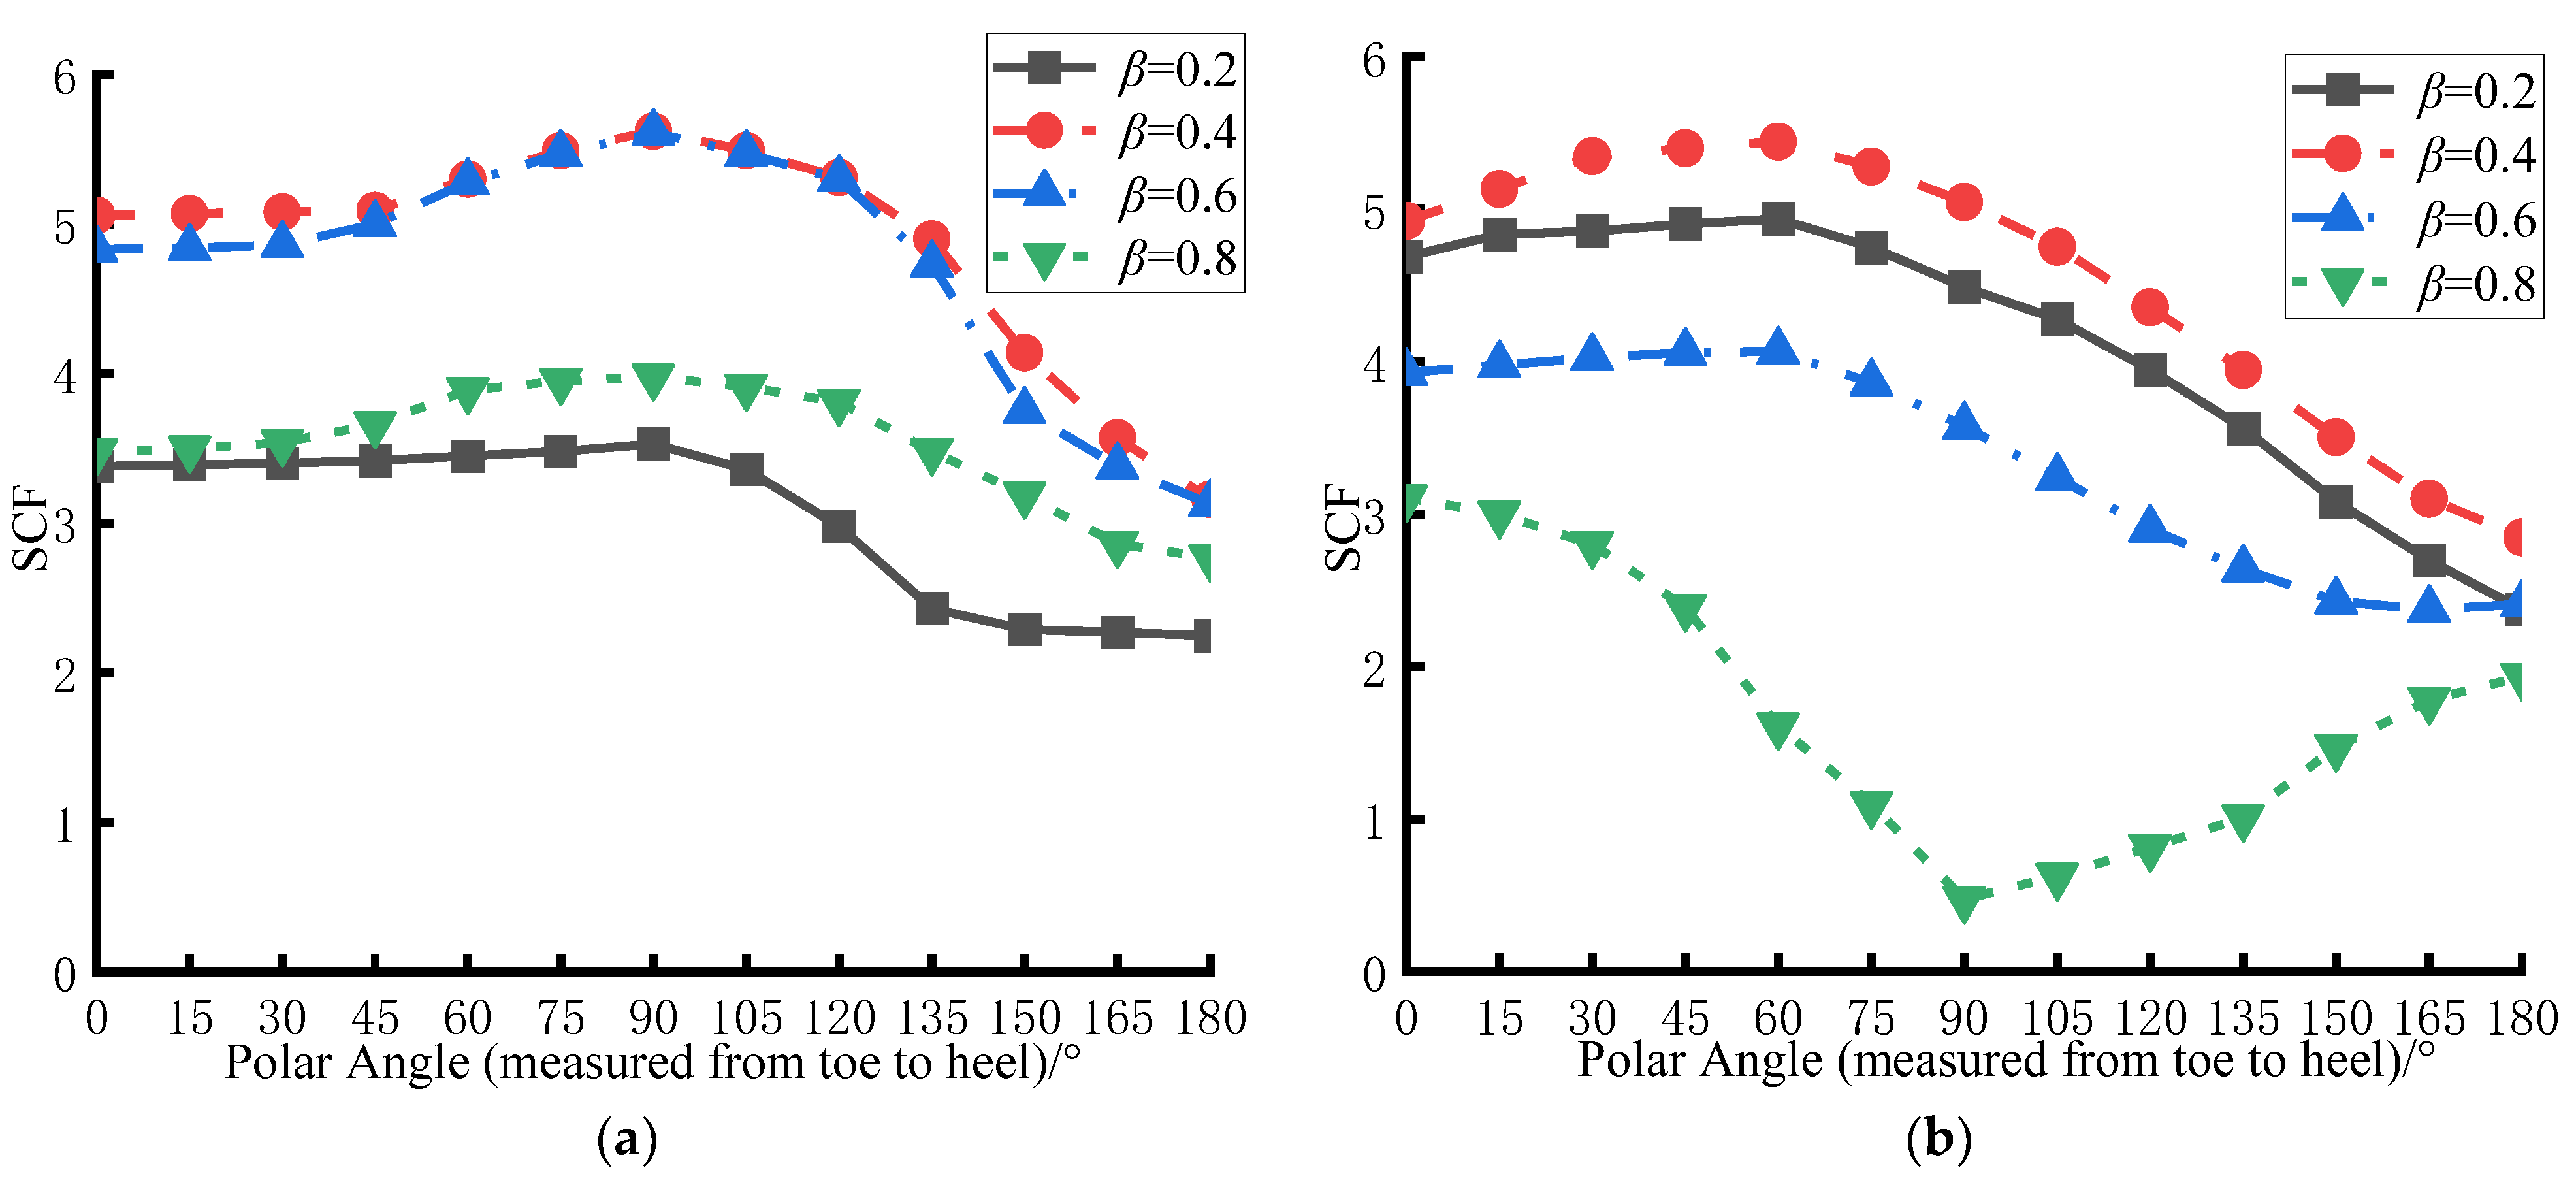
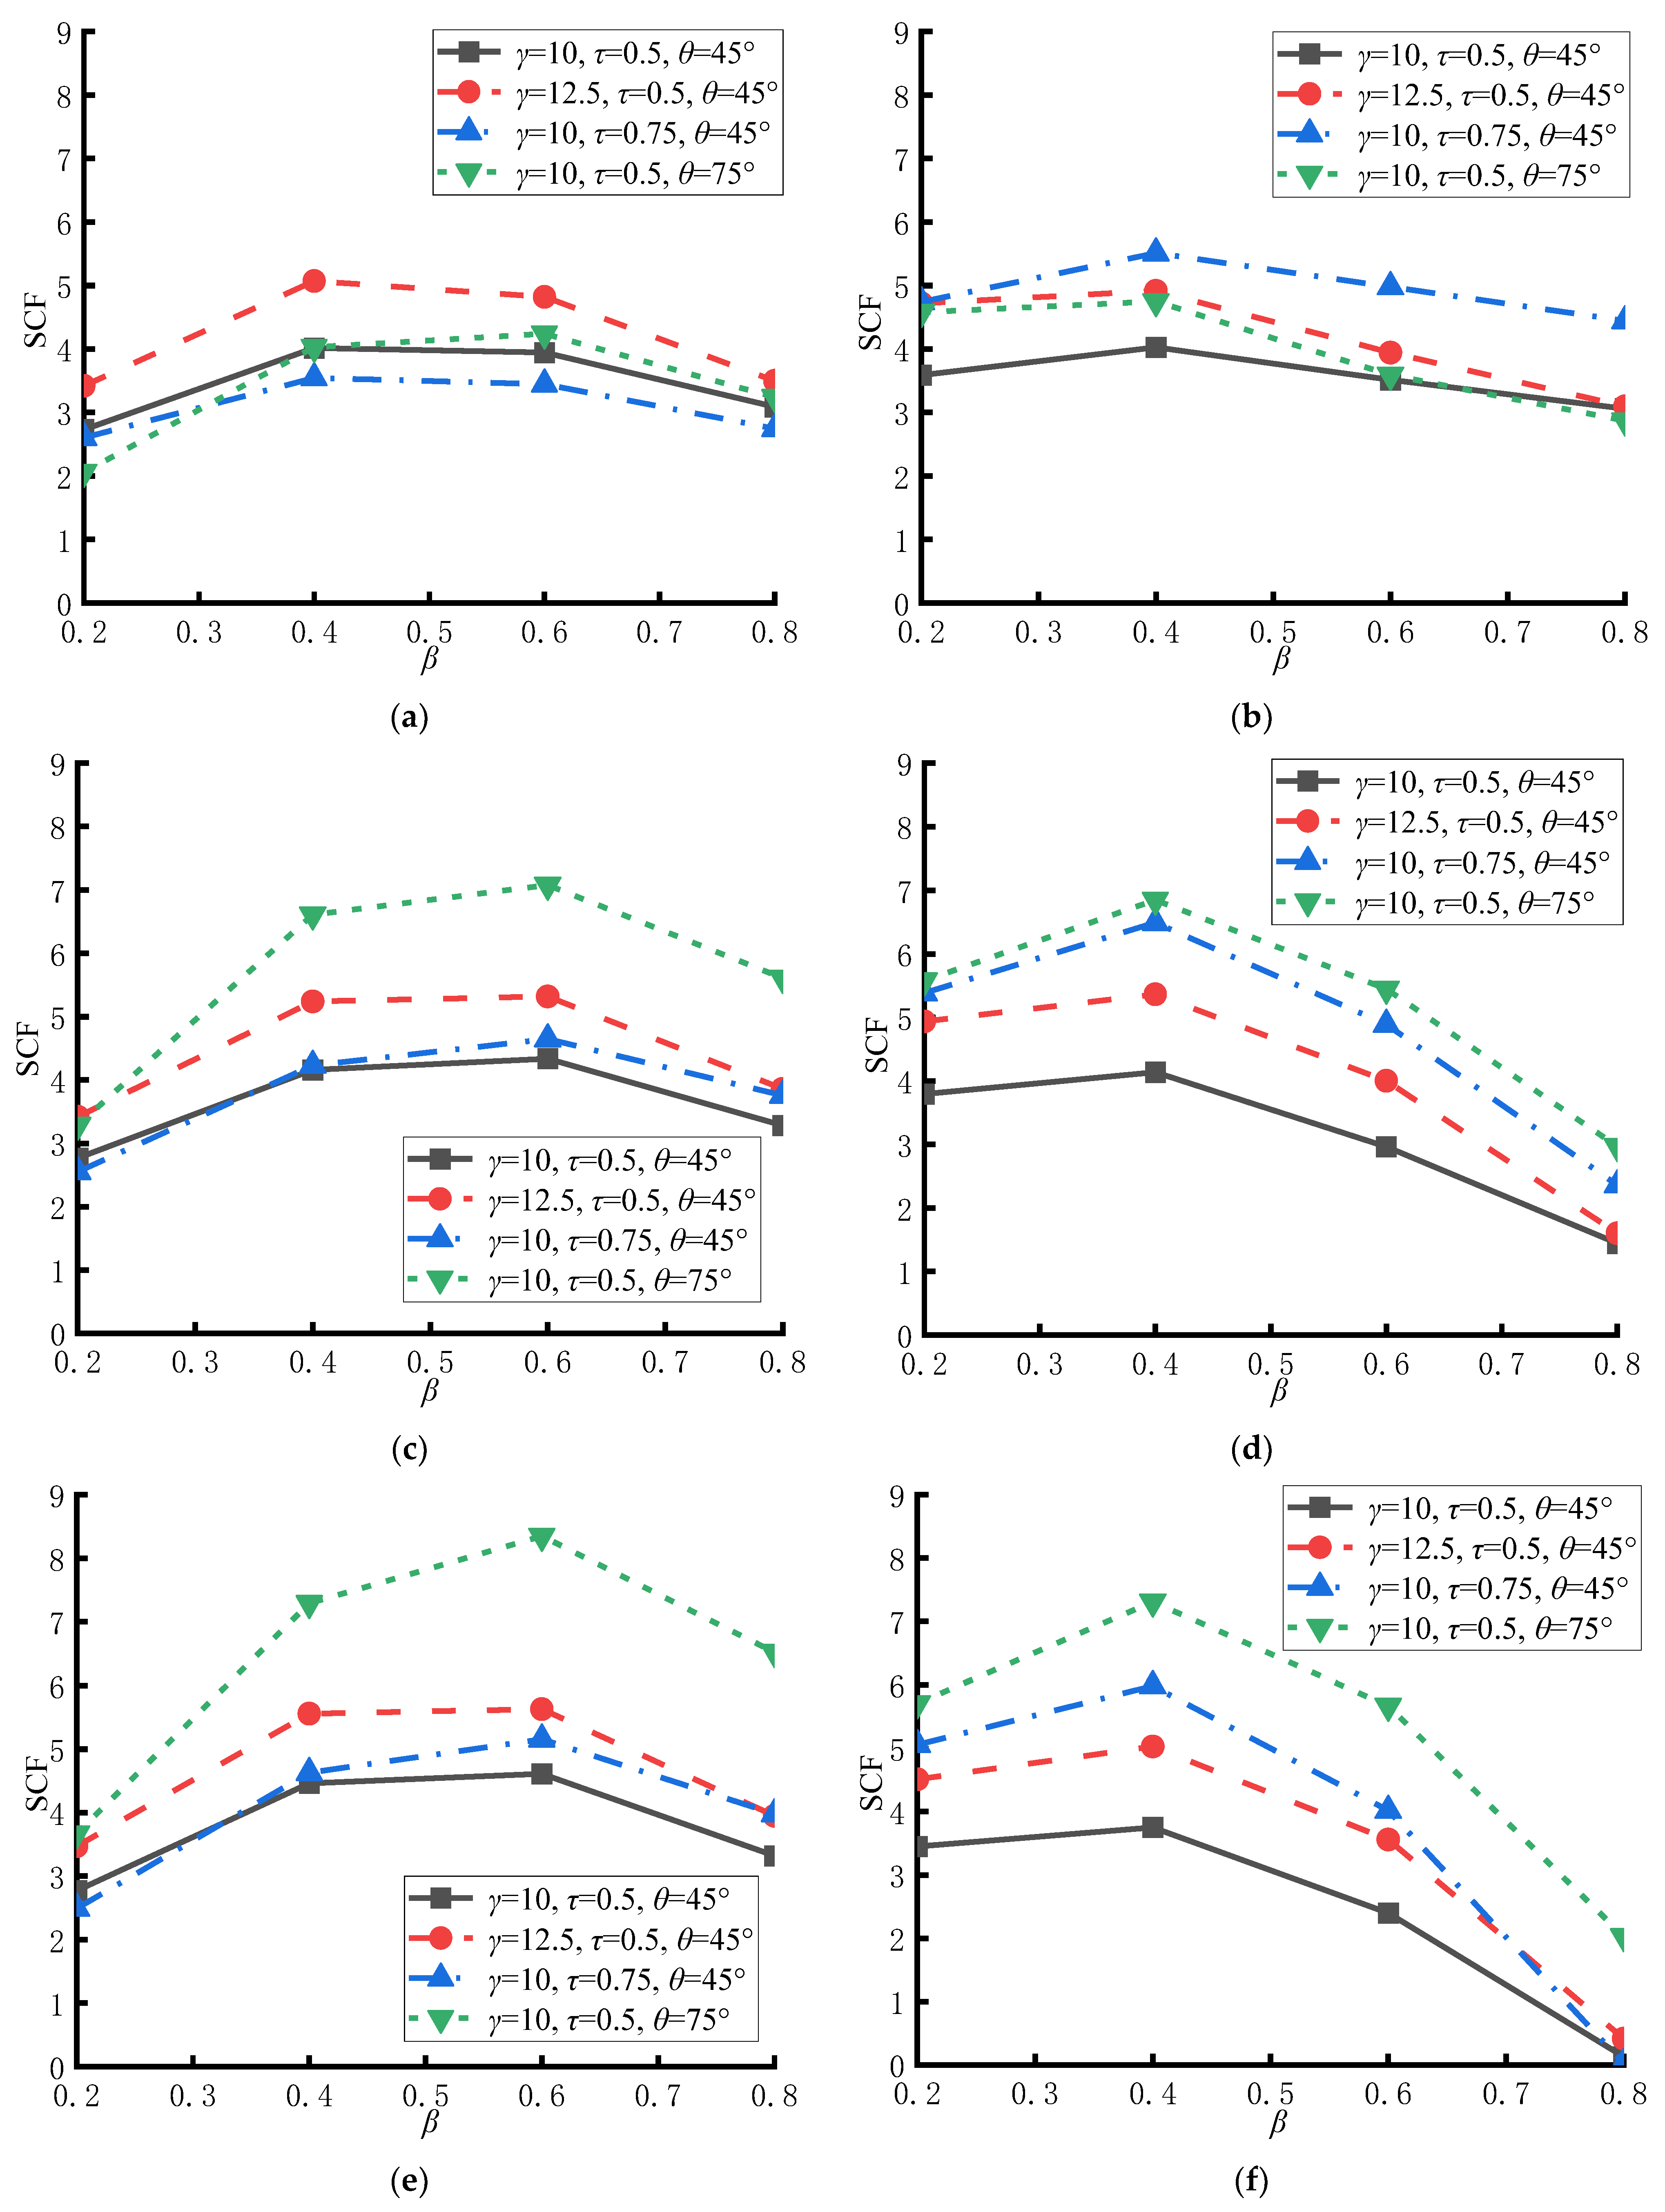
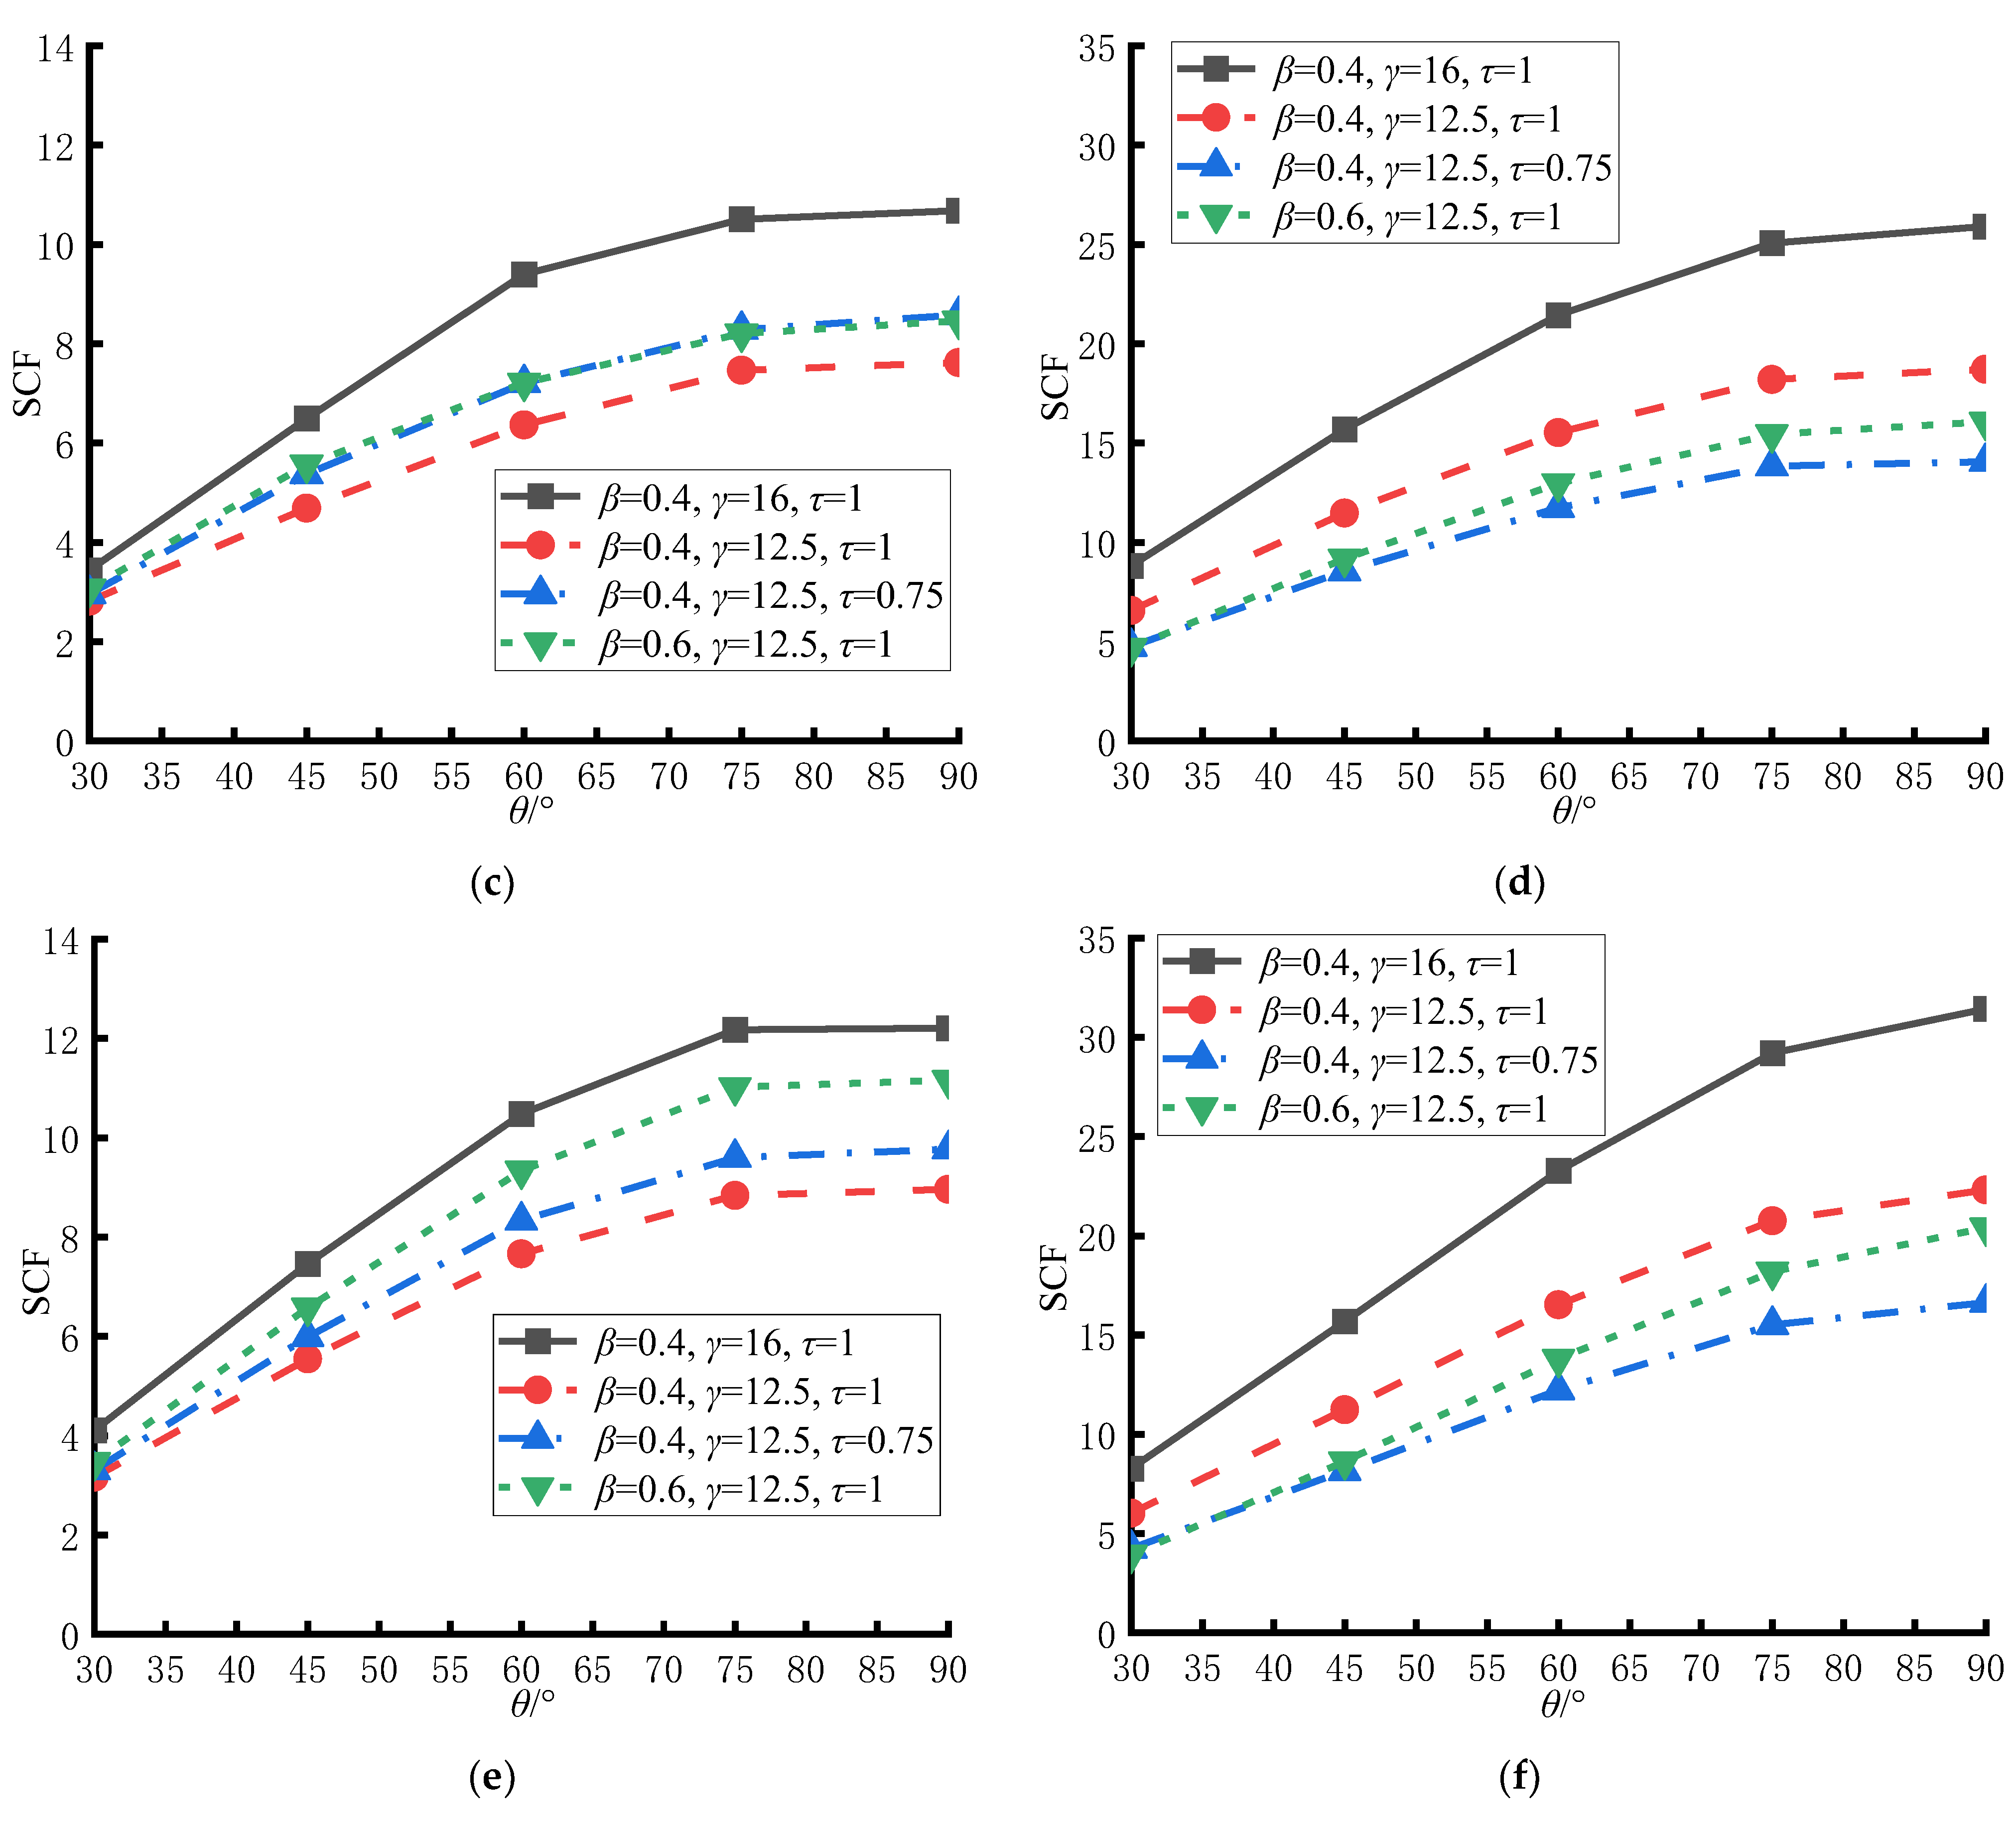
3.1. Influence of β on the SCF Distribution
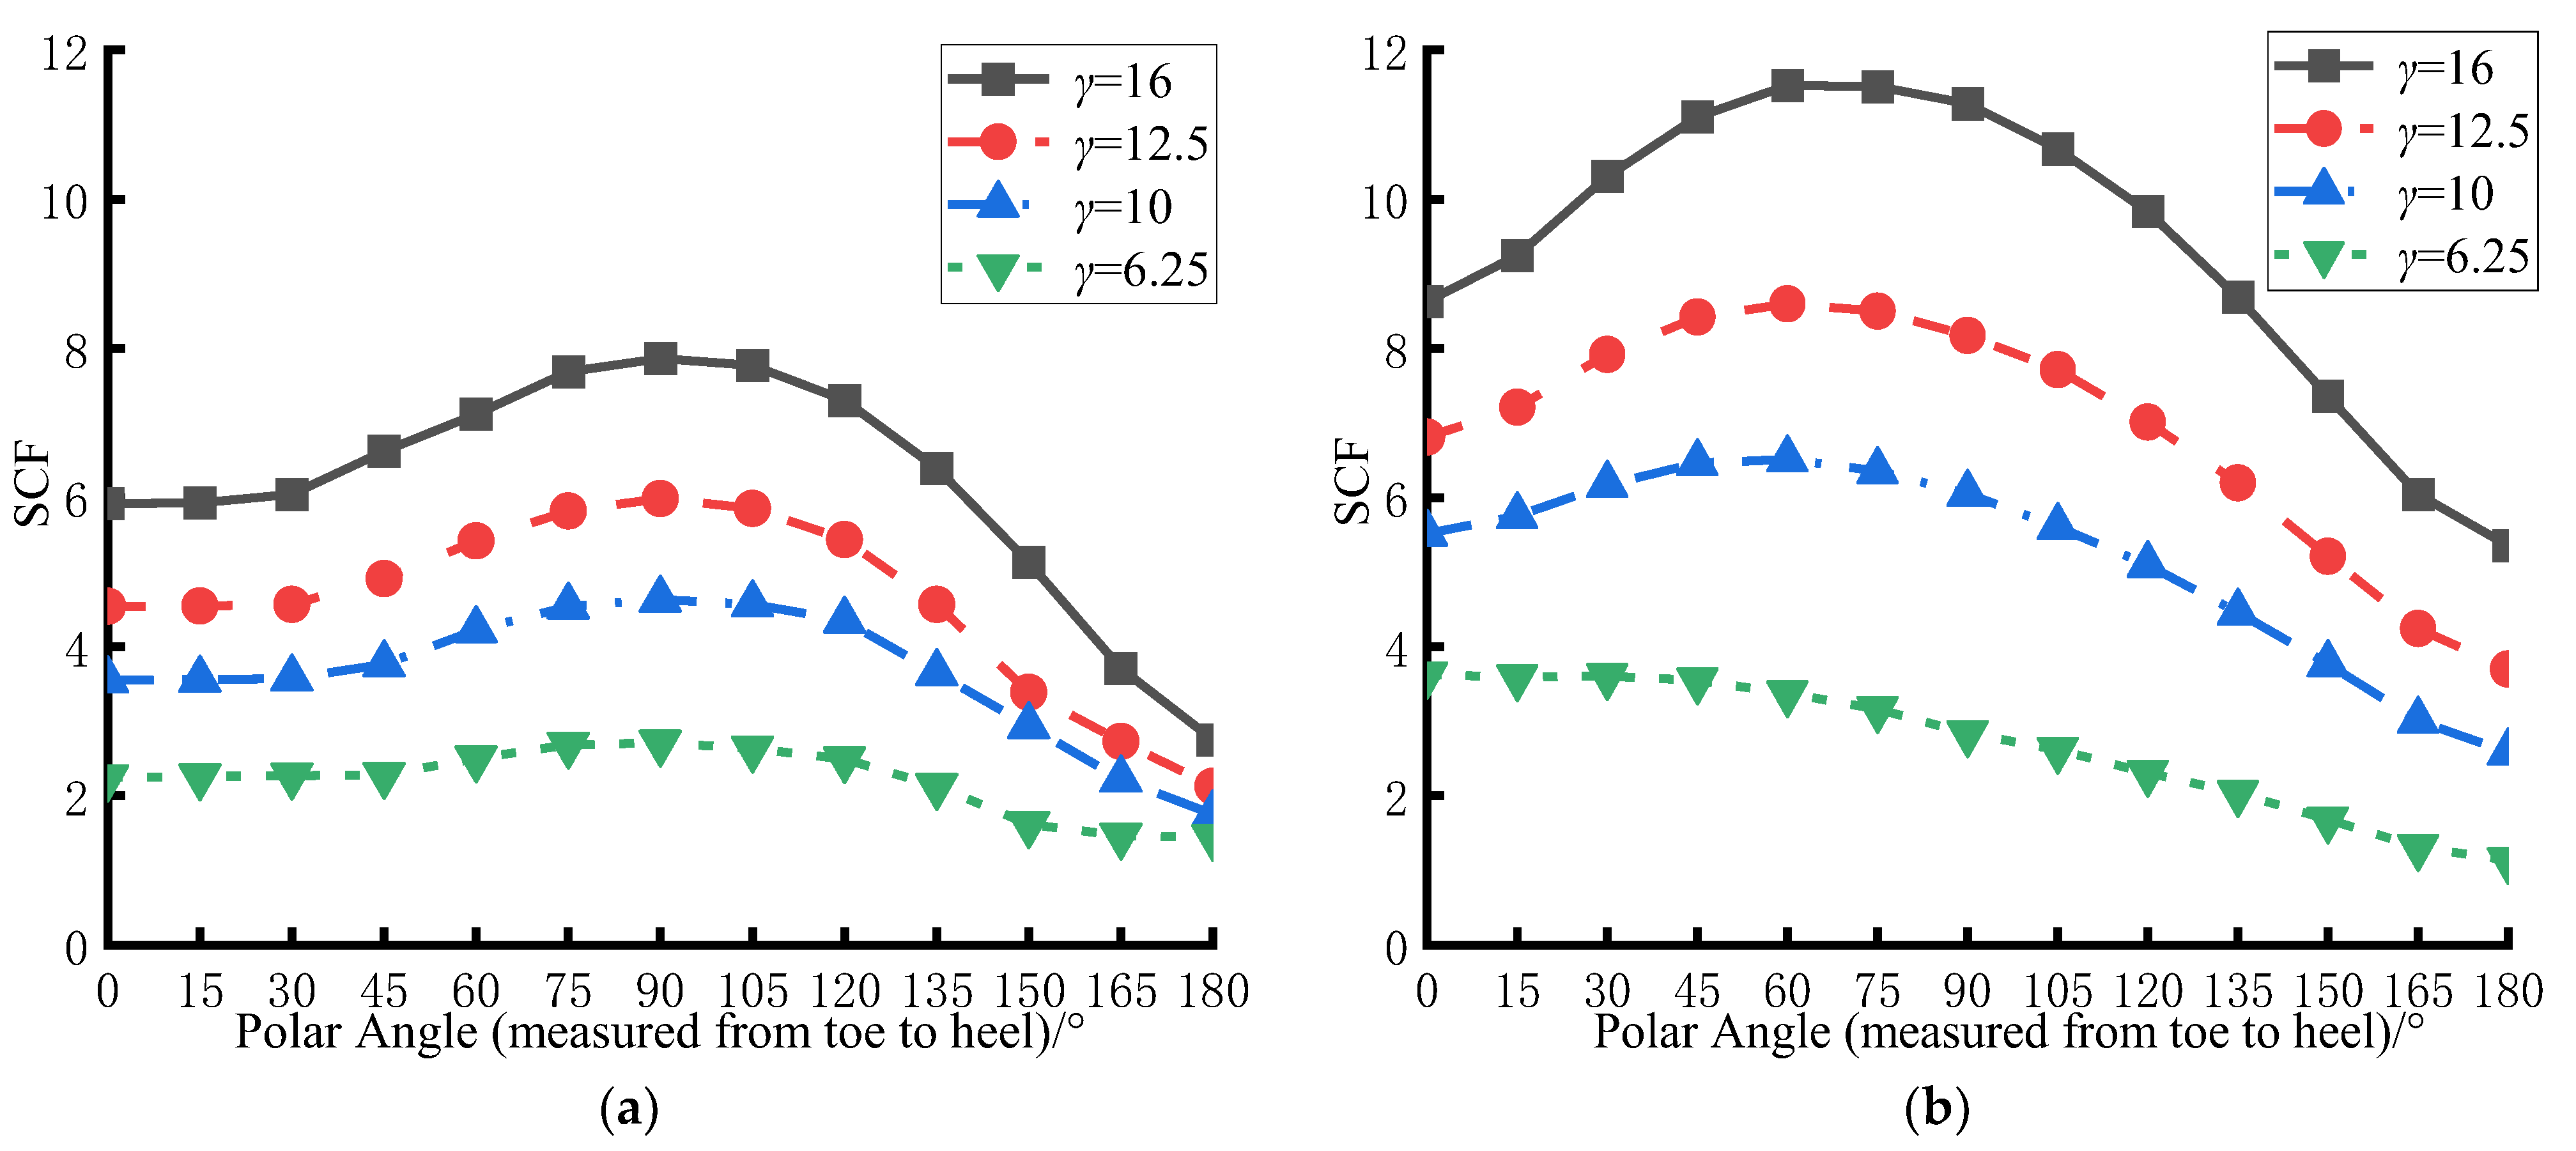
3.2. Influence of γ on the SCF Distribution
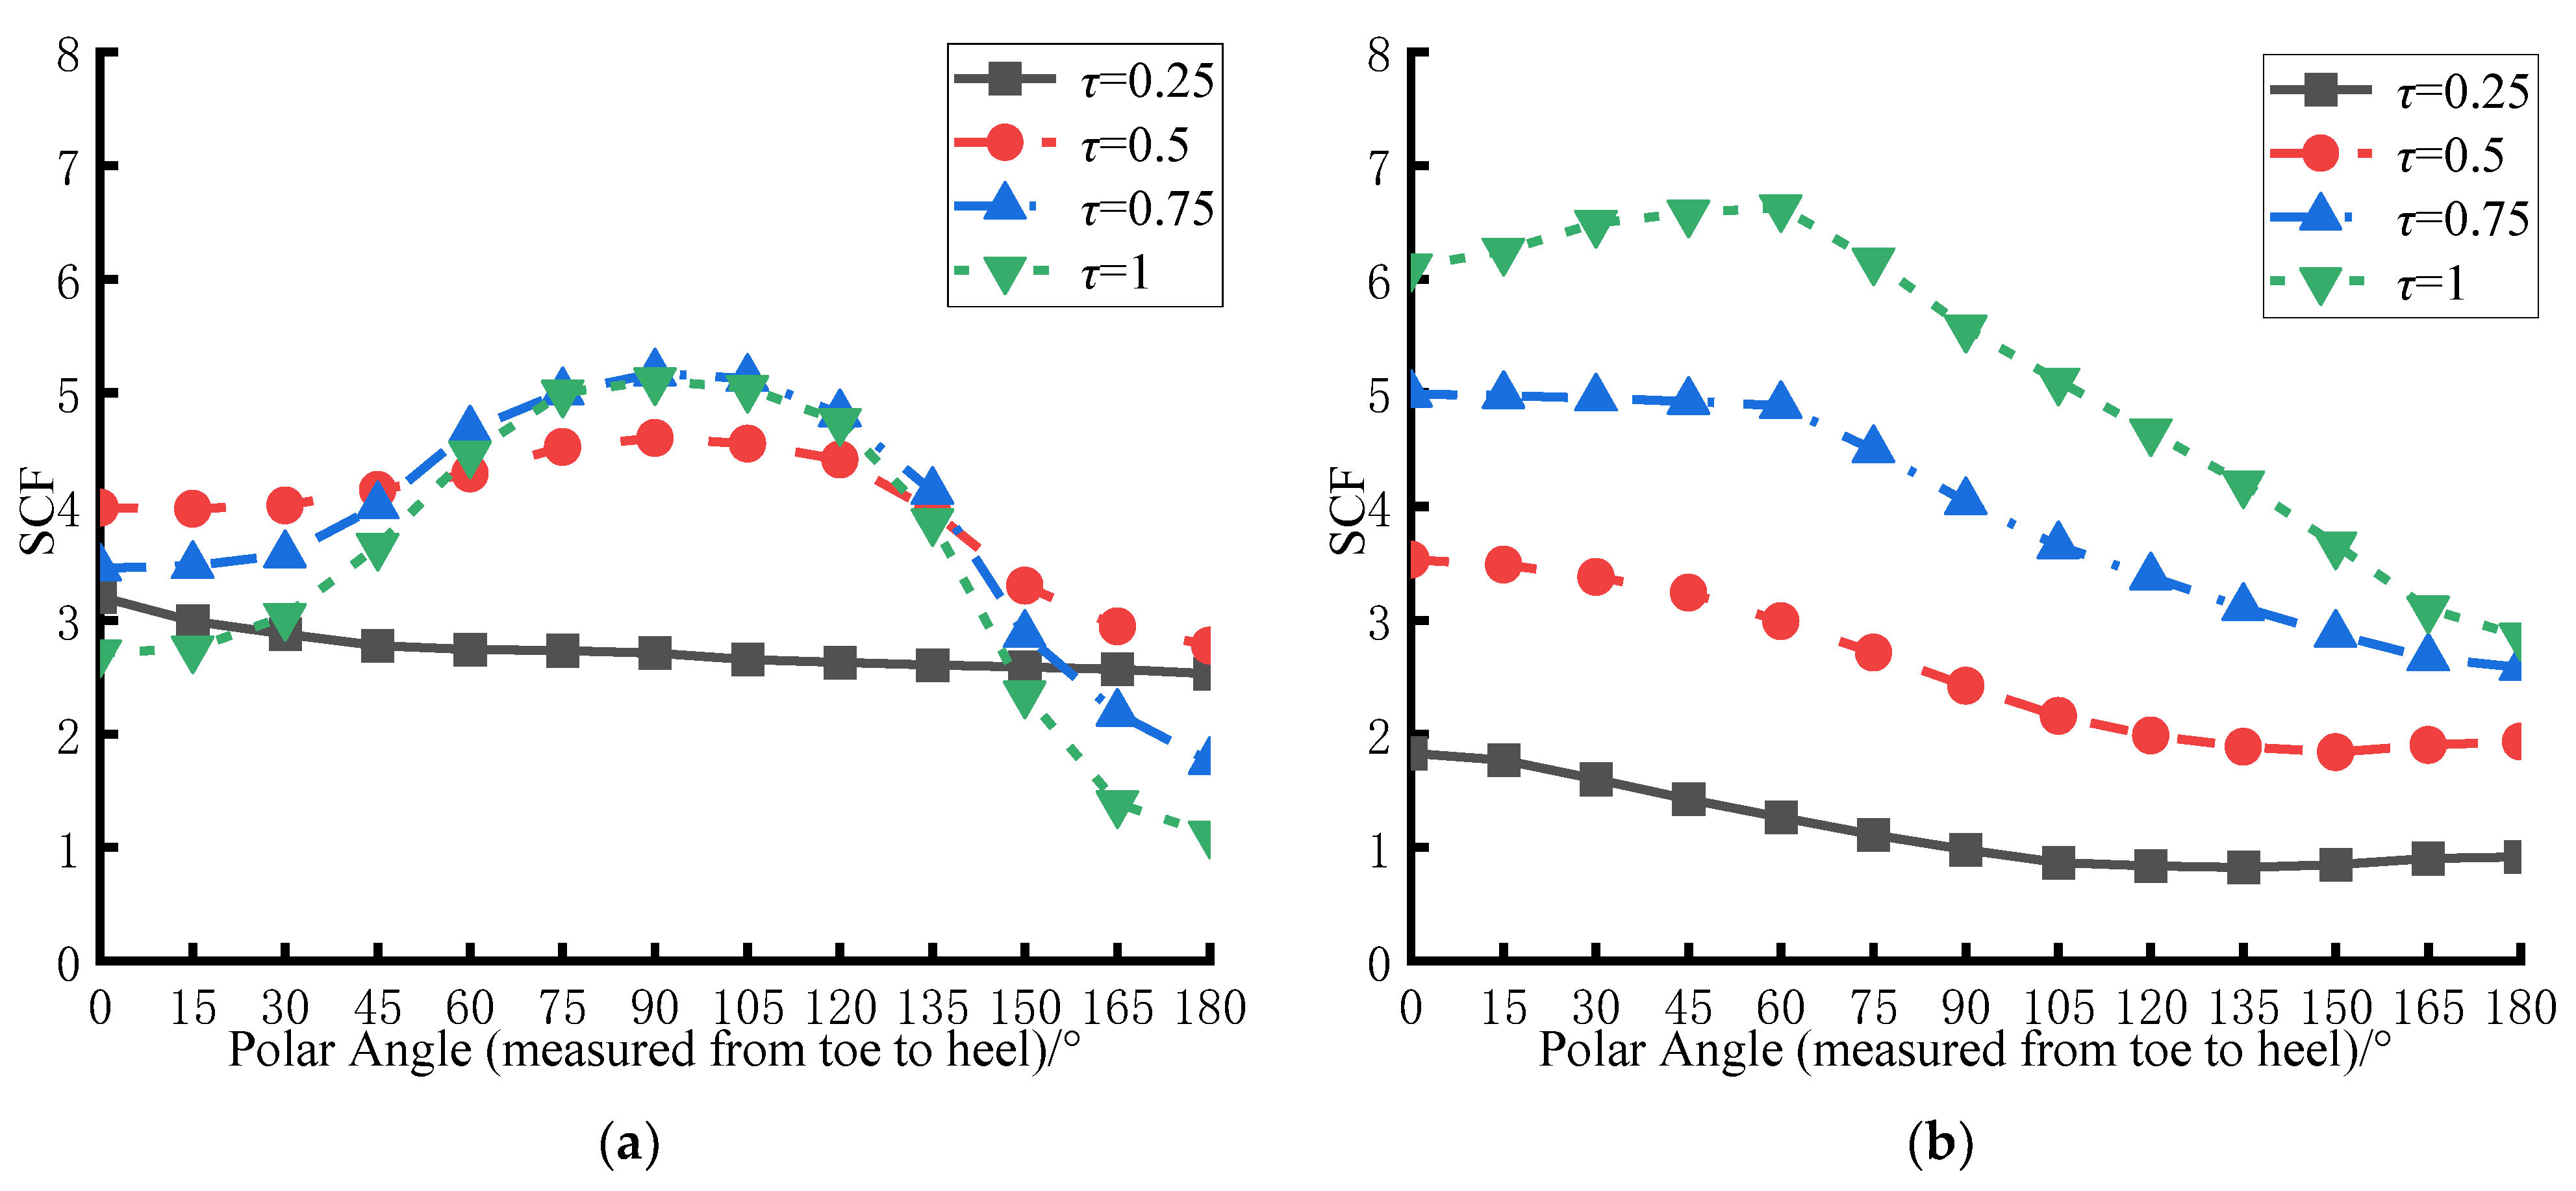
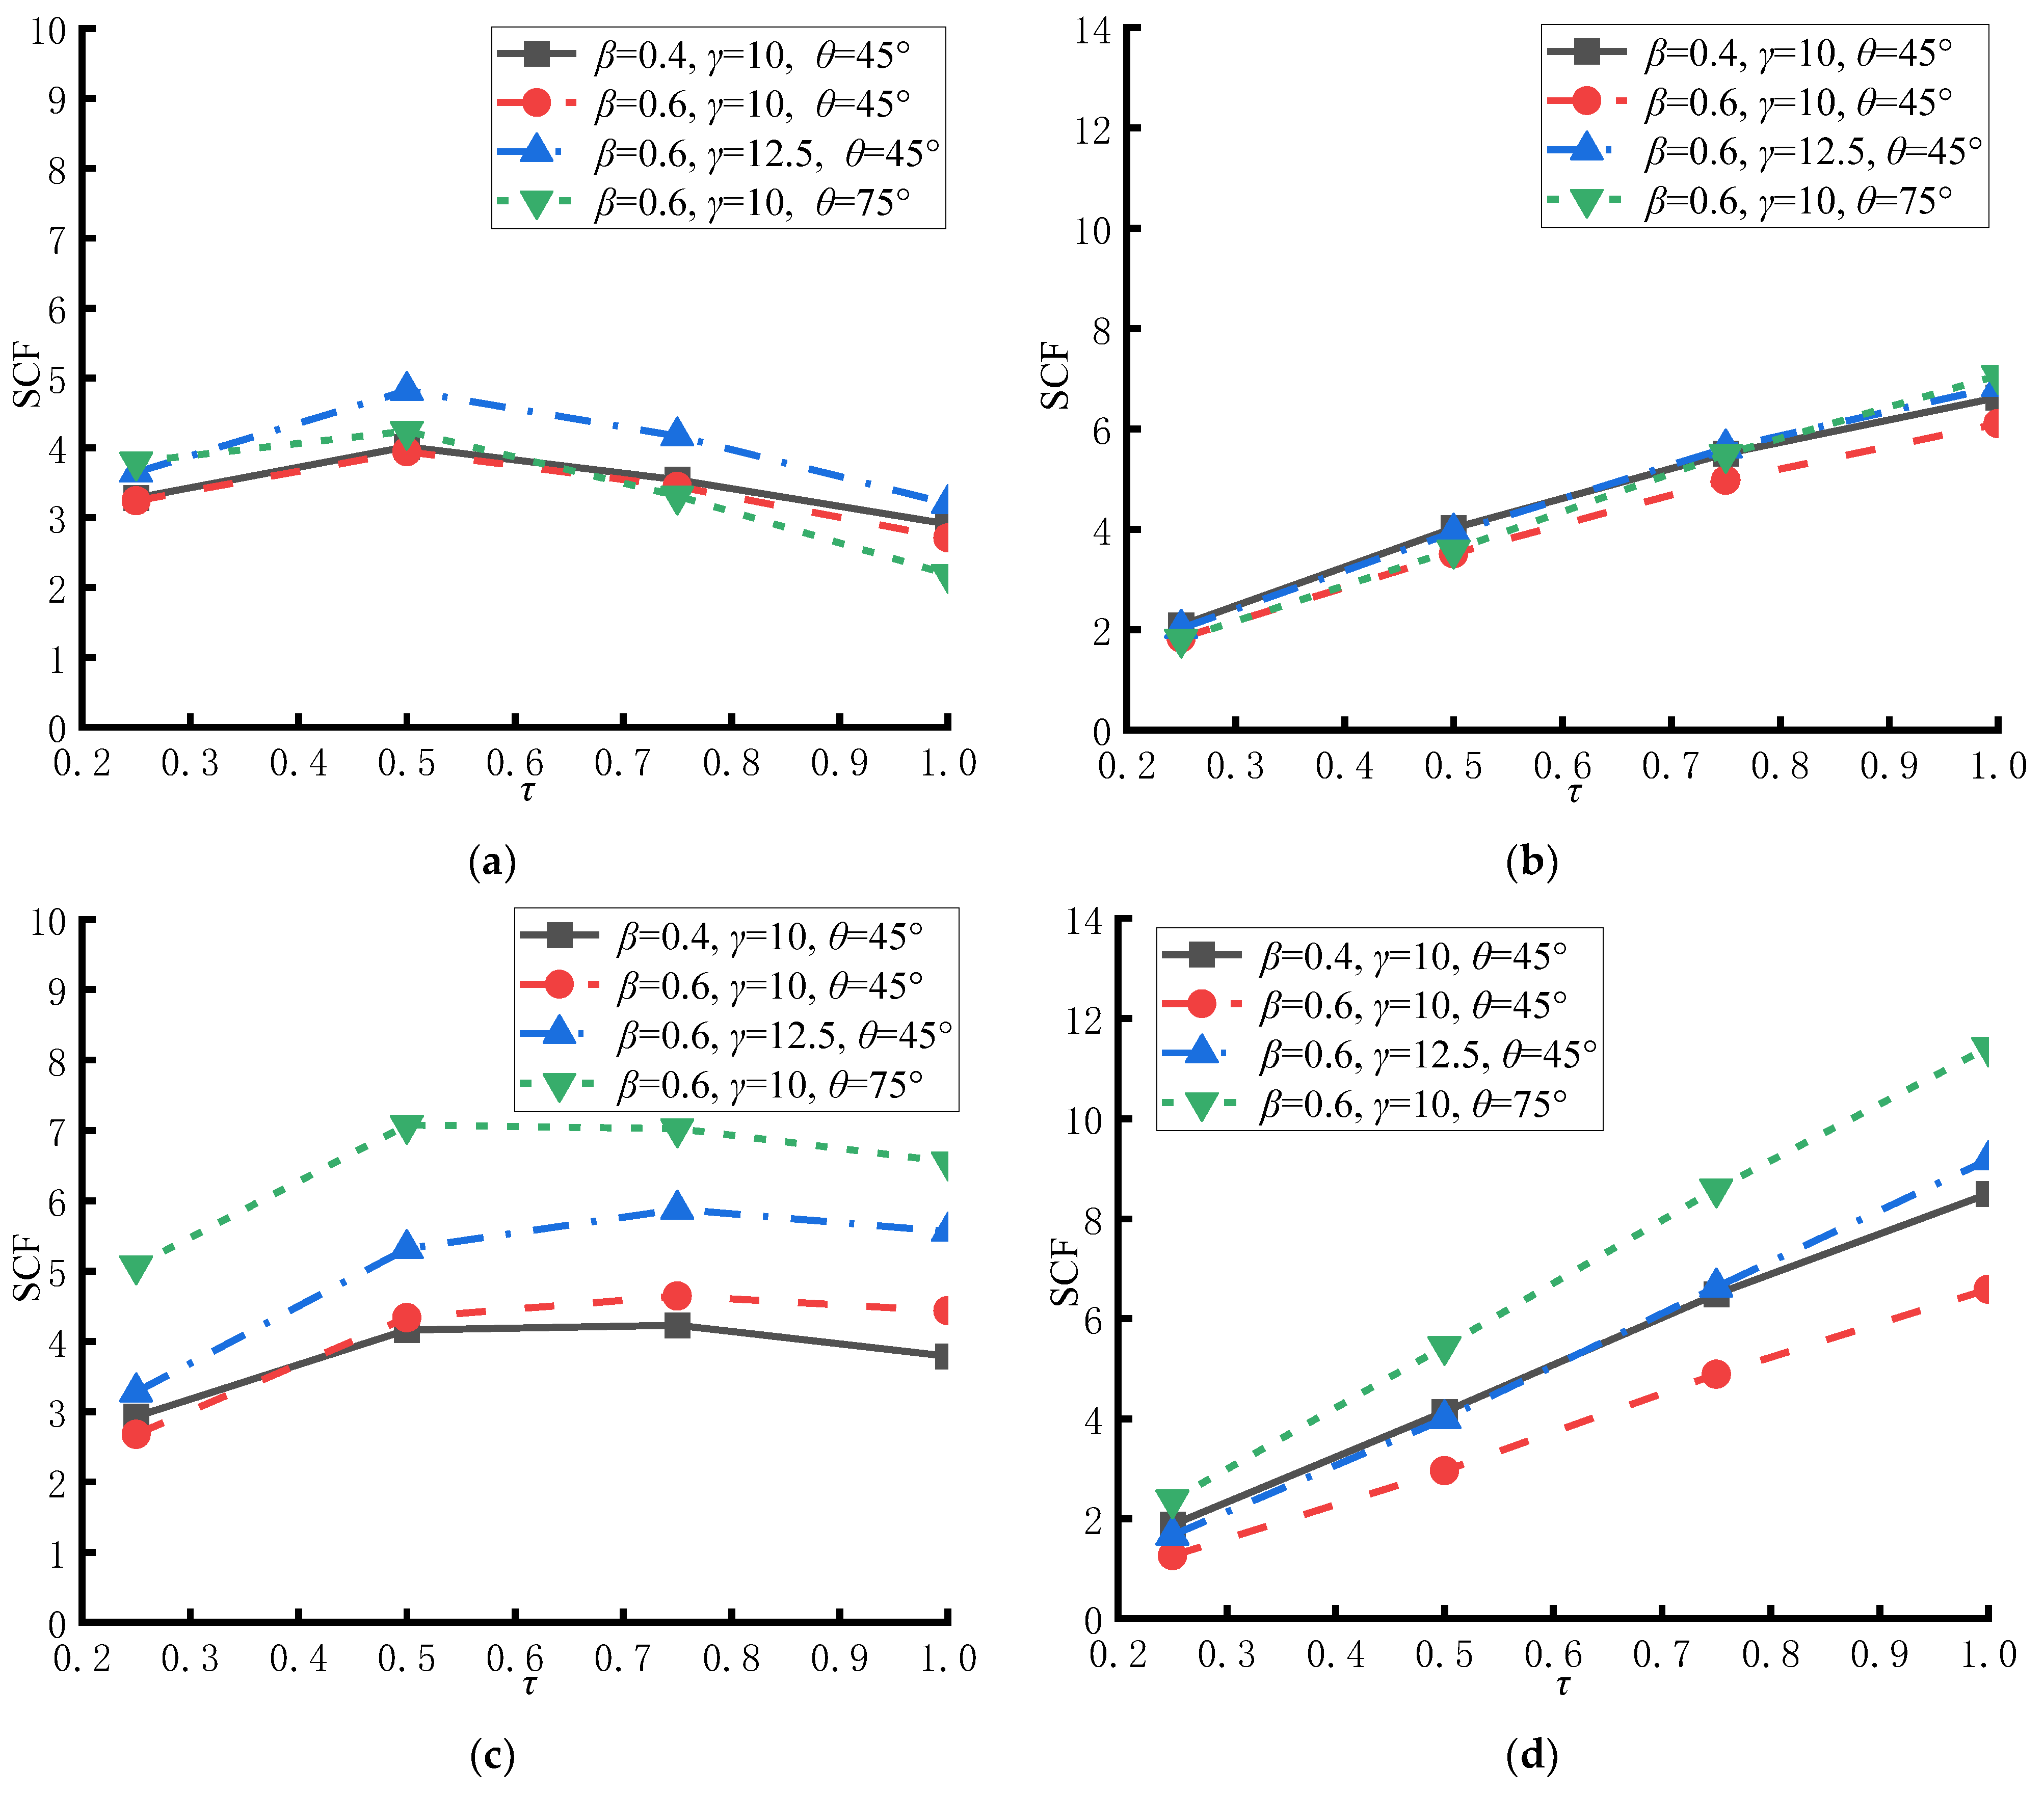
3.3. Influence of τ on the SCF Distribution
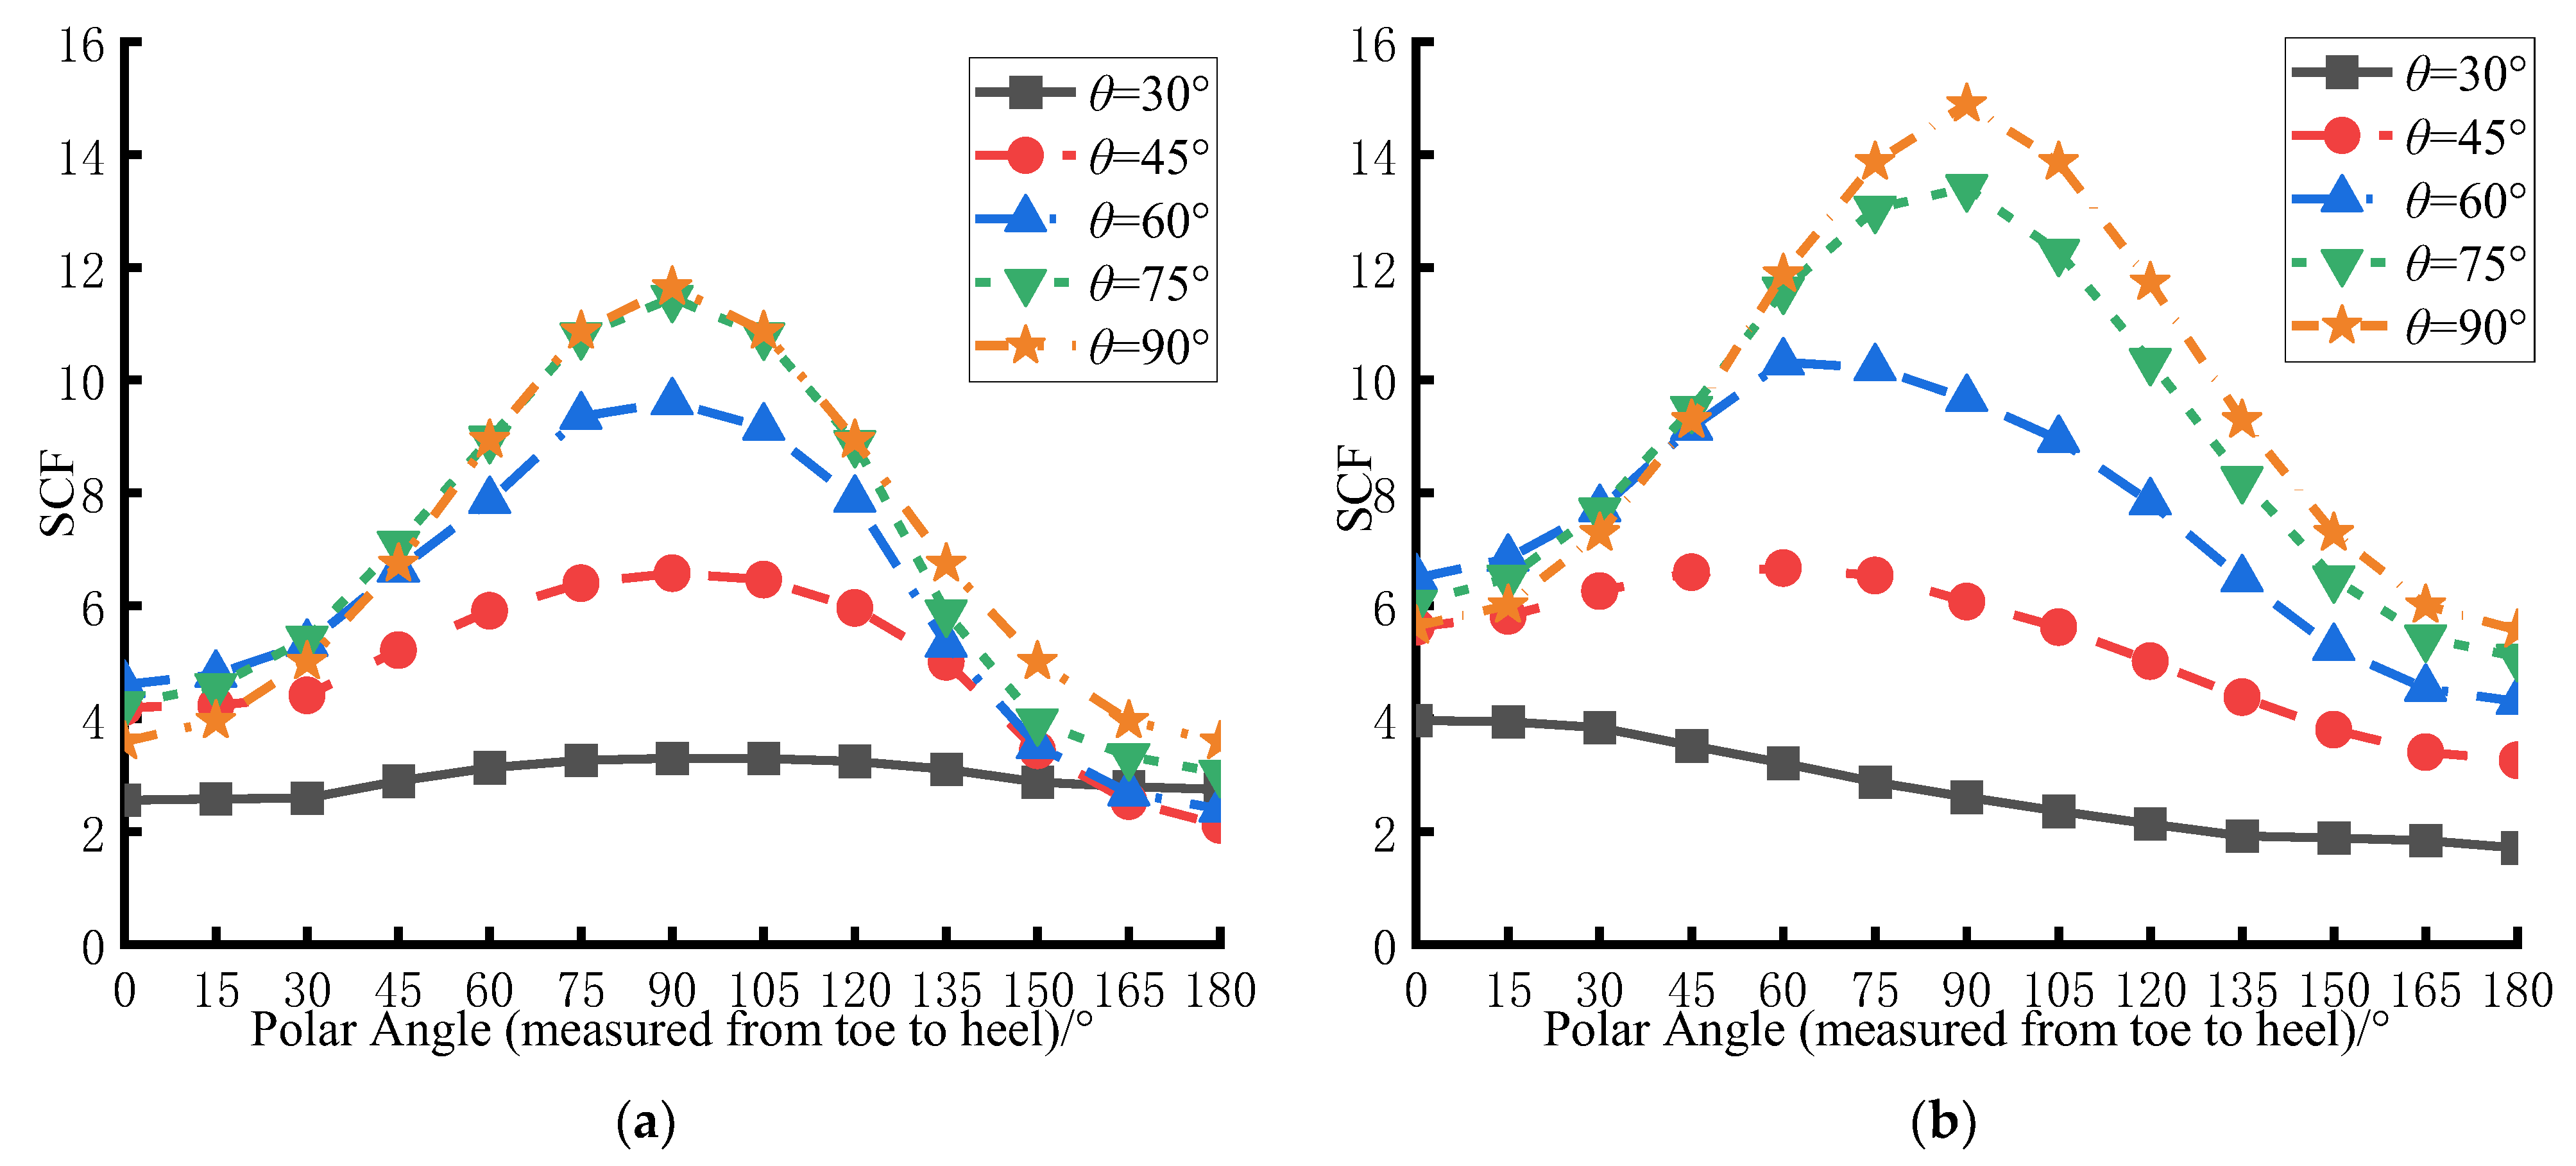
3.4. Influence of θ on the SCF Distribution
4. SCFs at Key Hot Spot Locations on CHS-to-CFRHS Y-Joints
4.1. Influence of β on SCFs at Key Hot Spot Locations
4.2. Influence of γ on SCFs at Key Hot Spot Locations
4.3. Influence of τ on SCFs at Key Hot Spot Locations
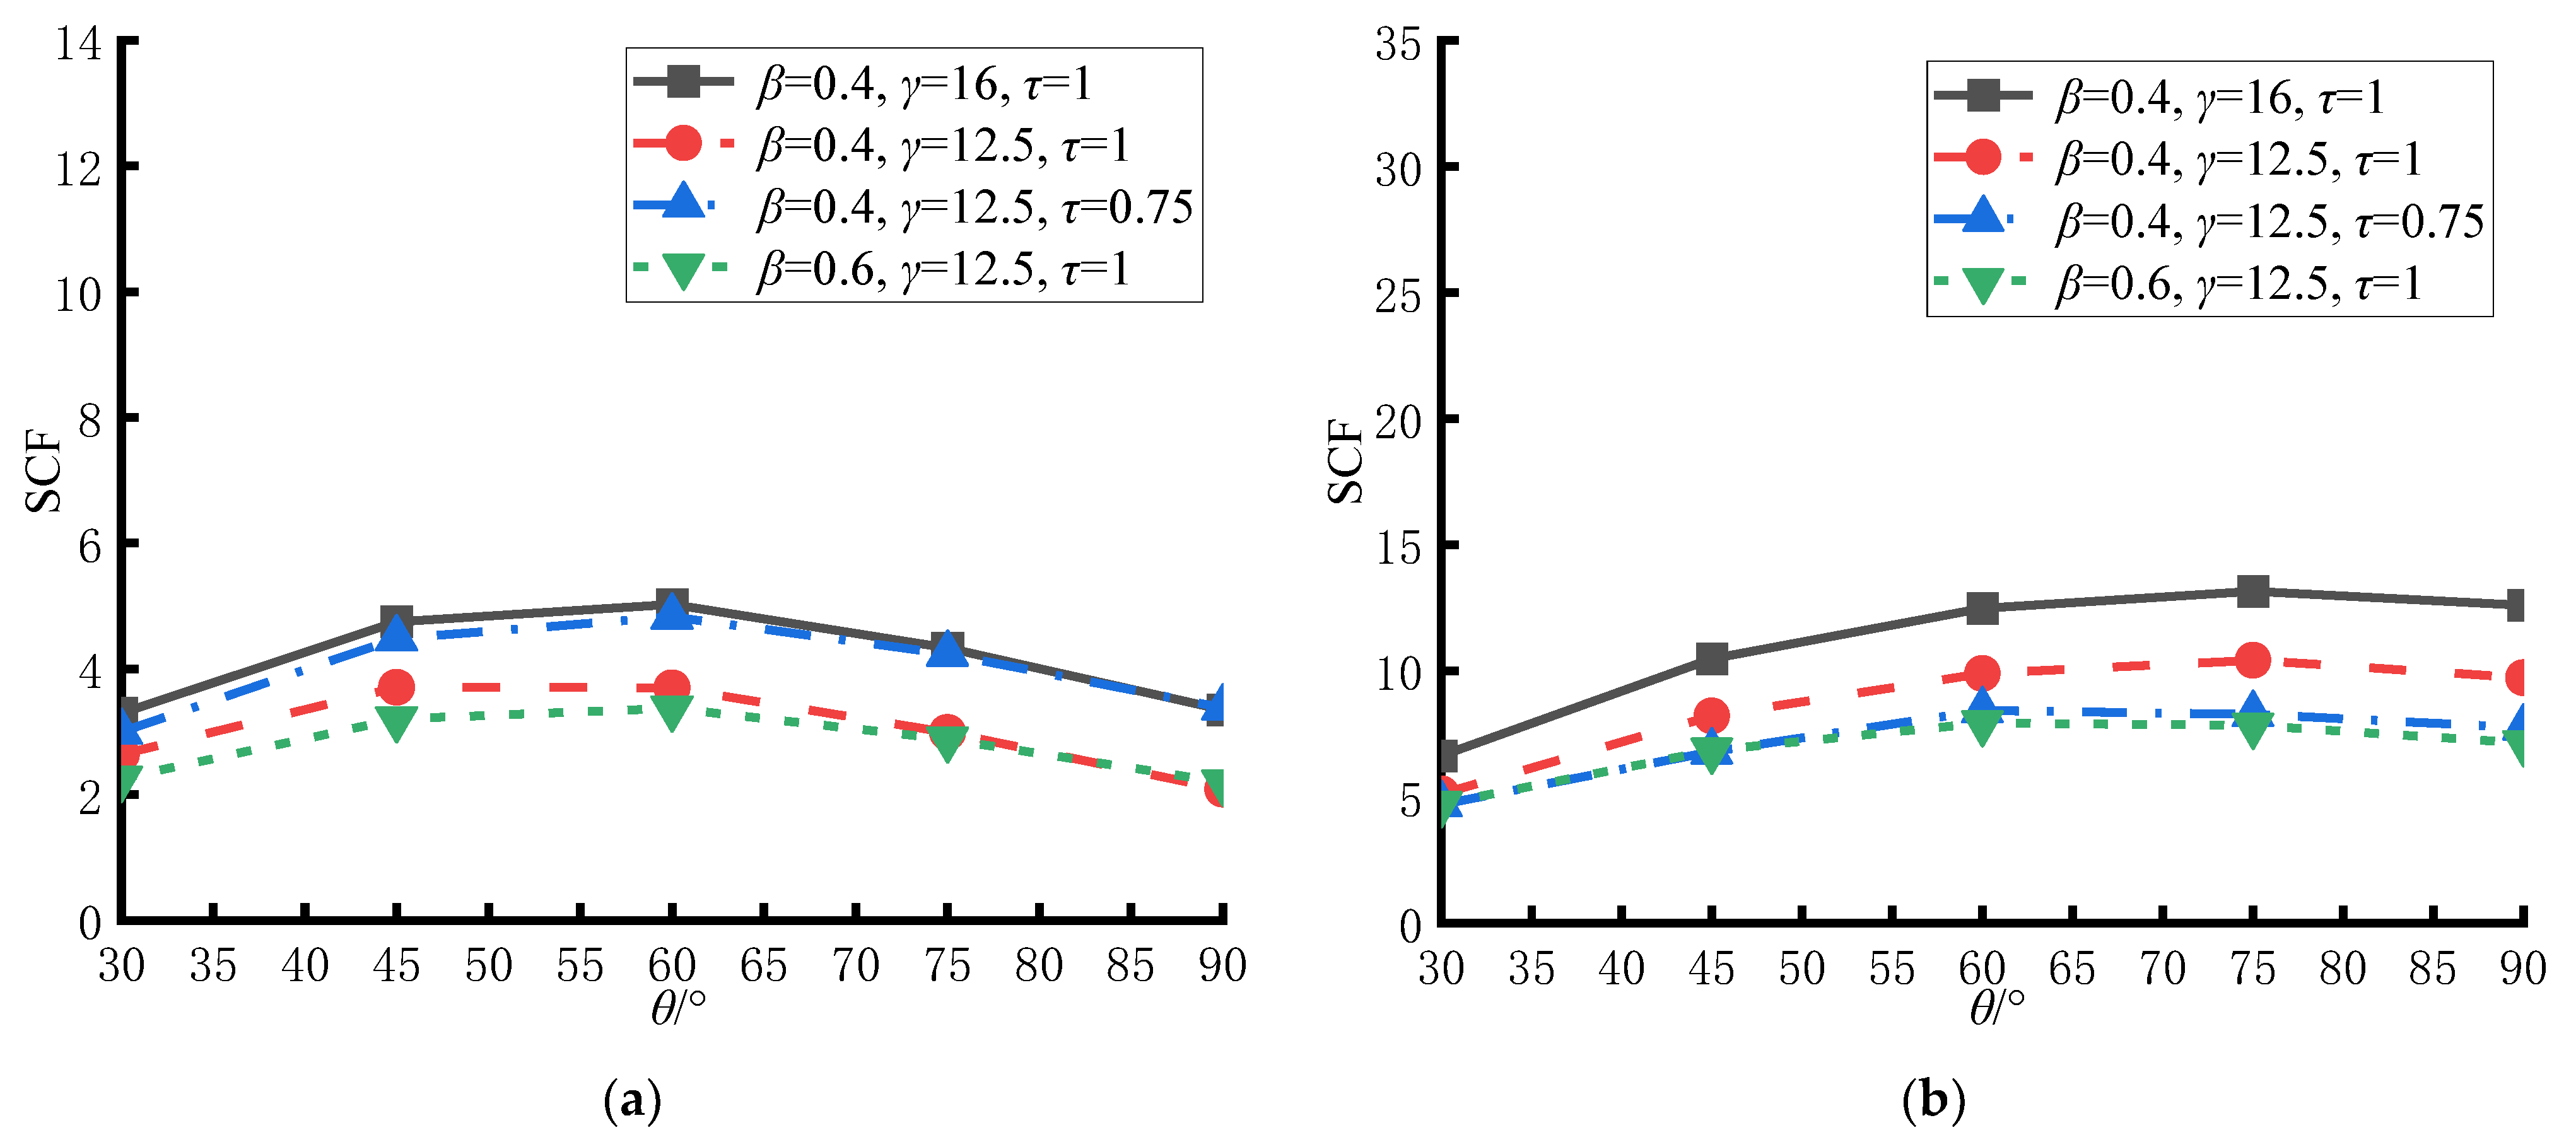
4.4. Influence of θ on SCFs at Key Hot Spot Locations
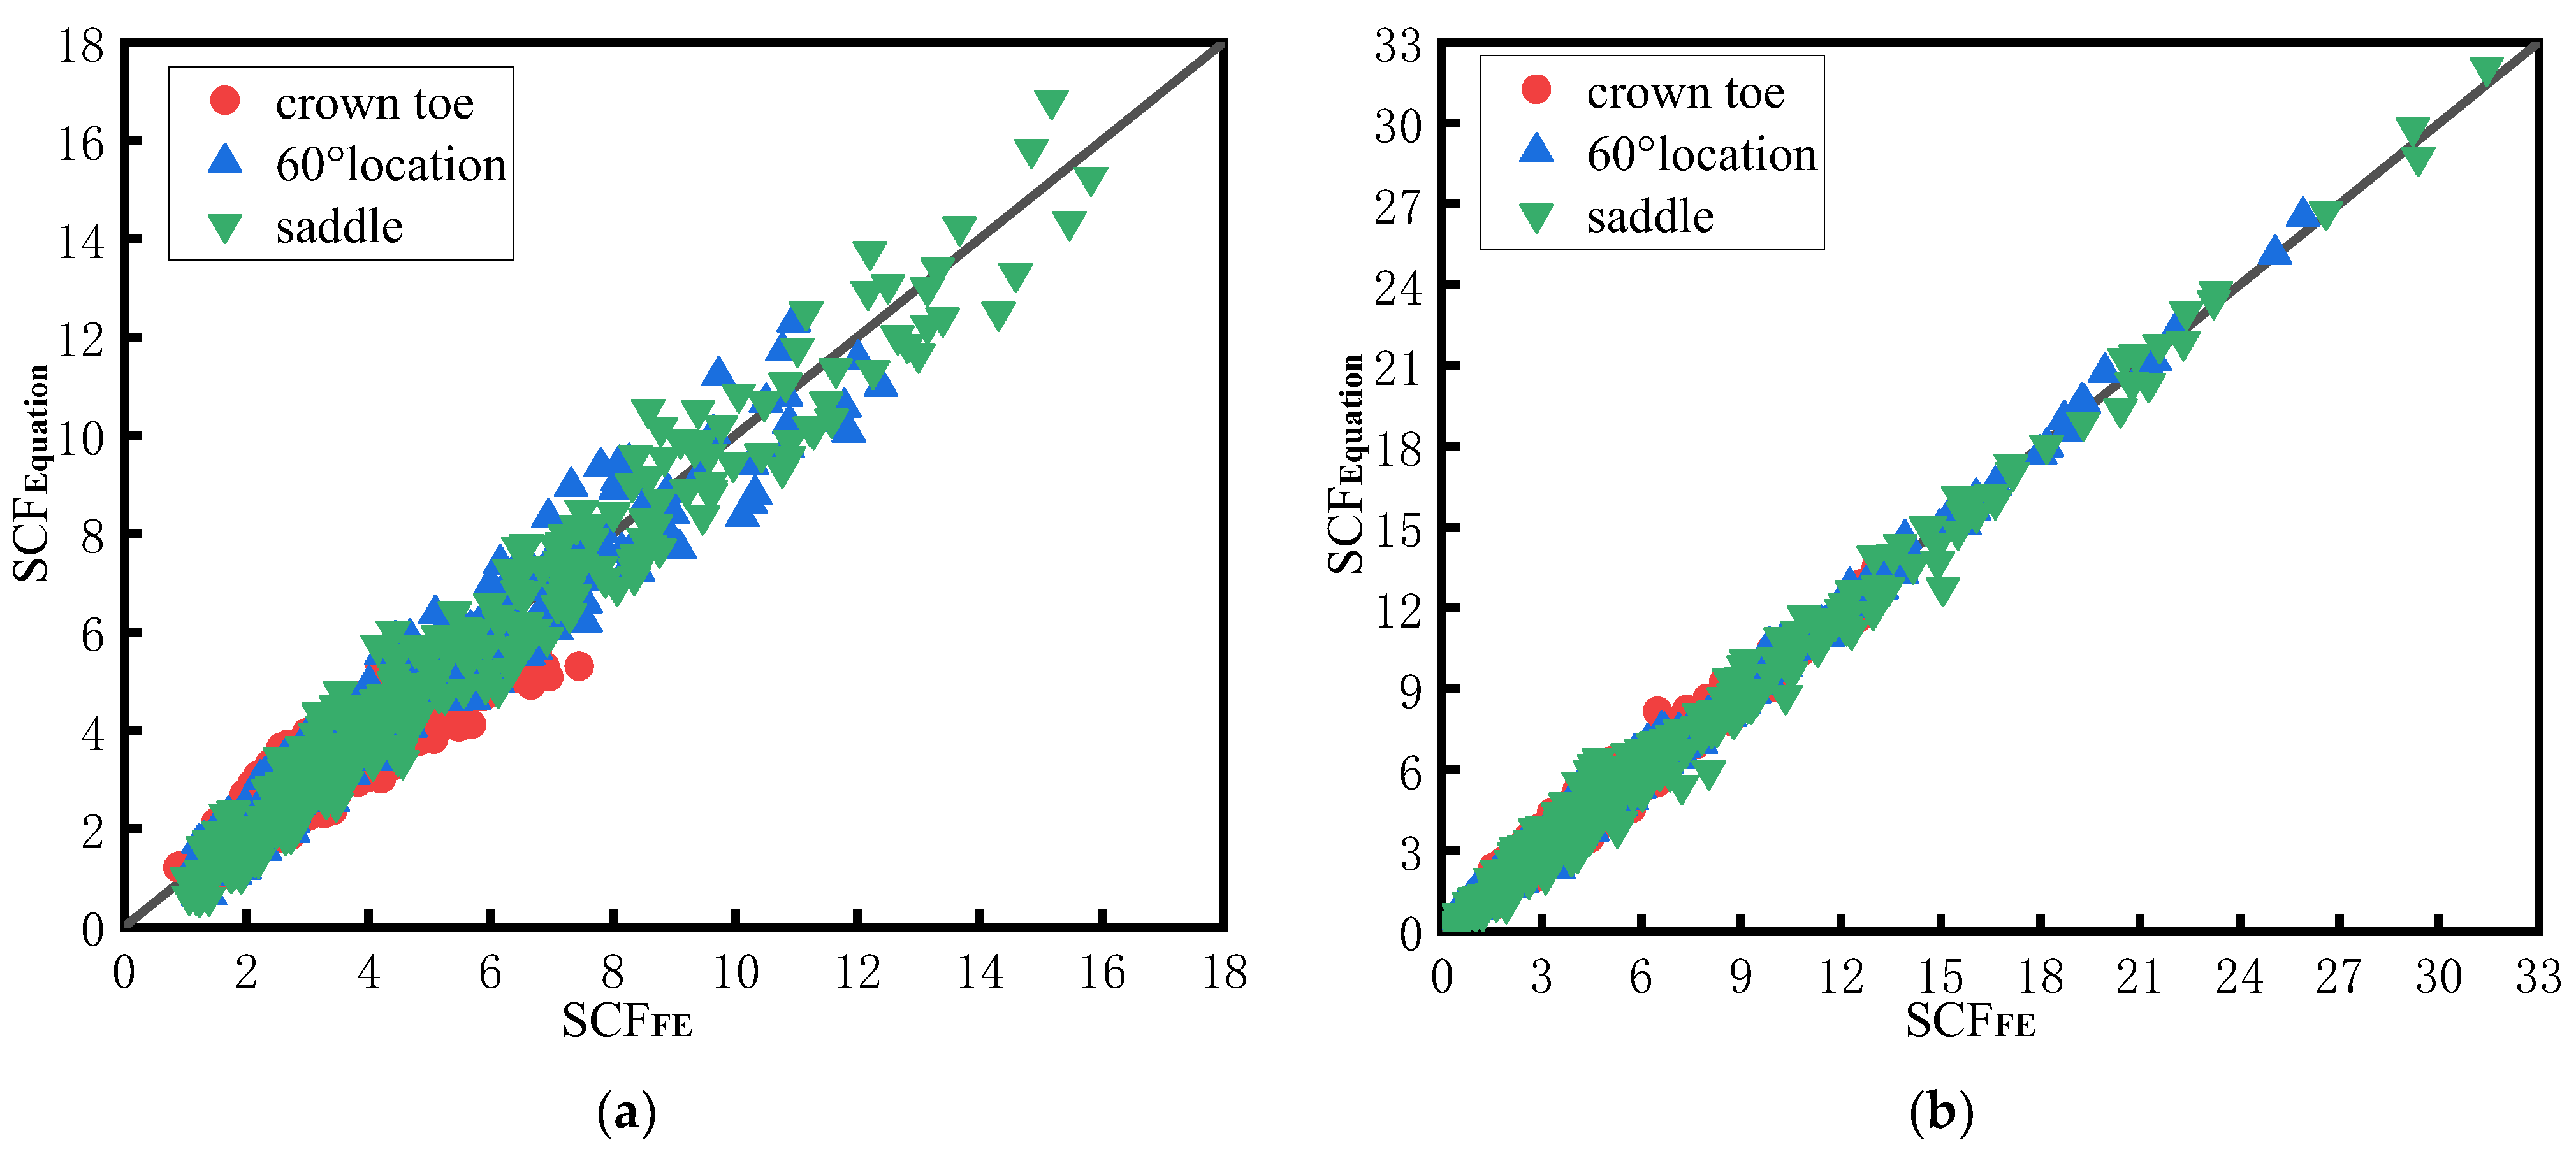
5. Proposed Design Equations
5.1. Multiple Regression Analysis
- At the crown toe in the brace:
- At the 60° location in the brace:
- At the saddle in the brace:
- At the crown toe in the chord:
- At the 60° location in the chord:
- At the saddle in the chord:
5.2. Verification of the Design Equations
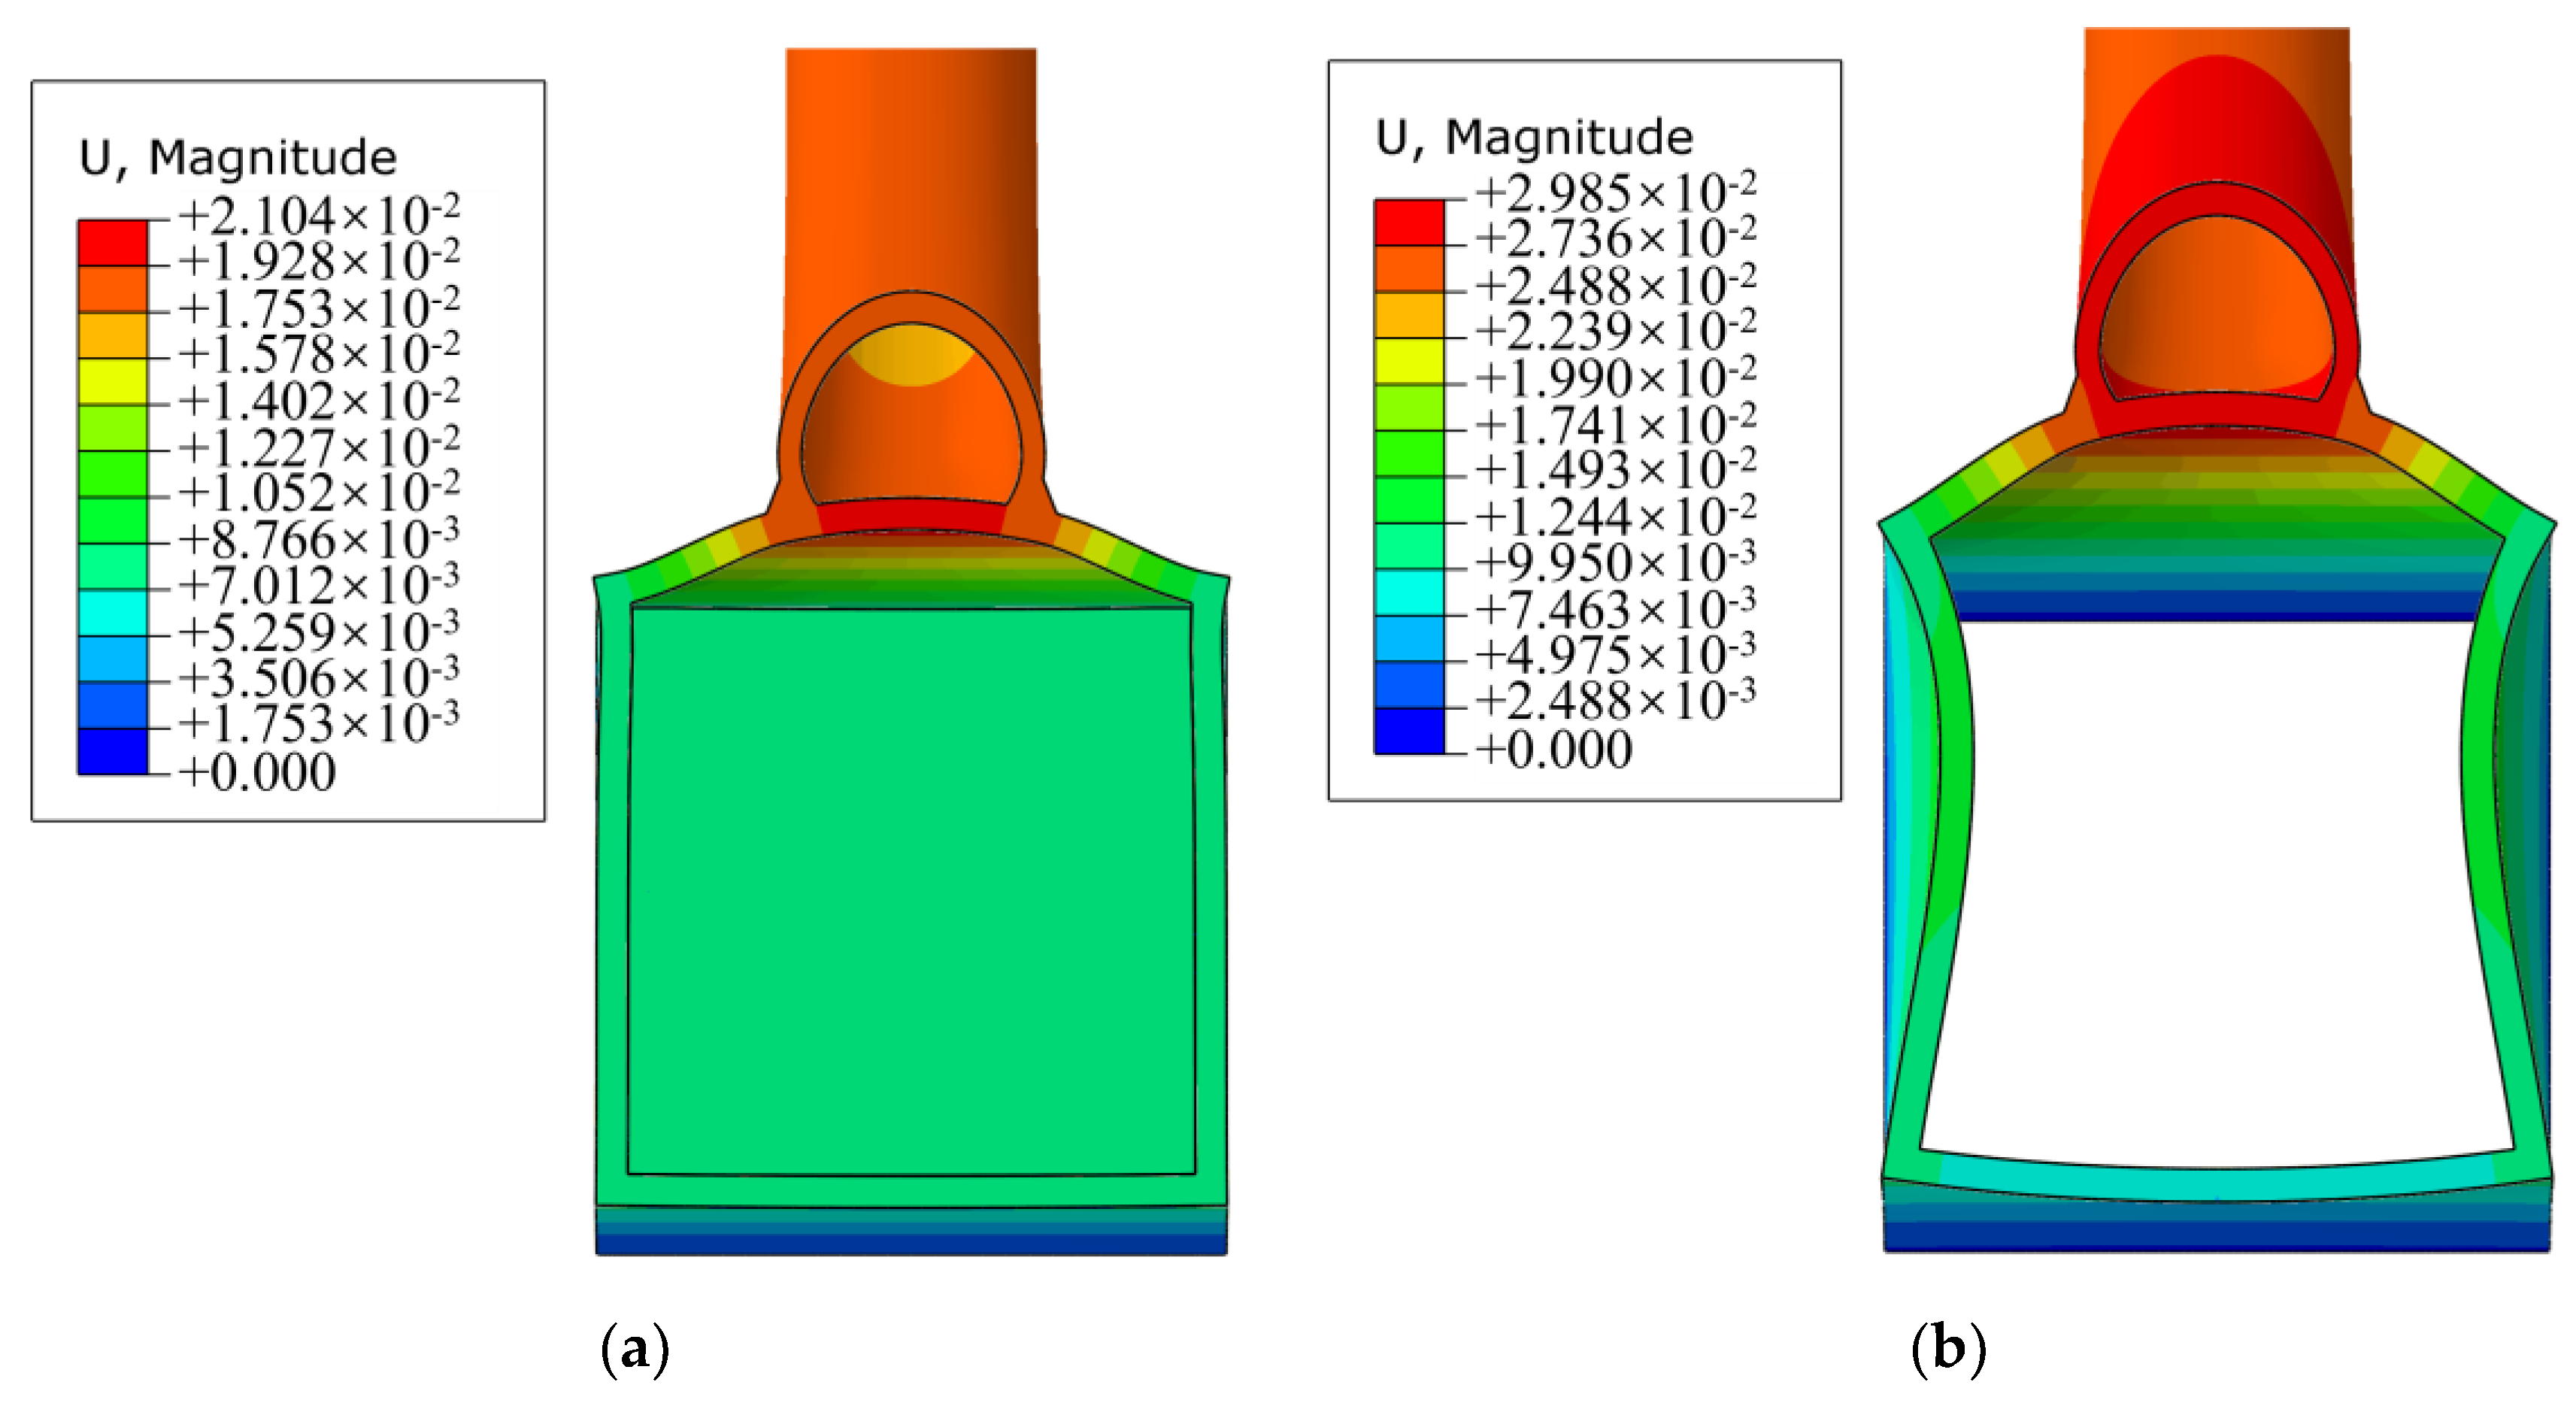
6. Comparative Analysis of the SCFs for CHS-to-CFRHS Y-Joints and CHS-to-RHS Y-Joints
7. Conclusions
- When the CHS-to-CFRHS Y-joint is subjected to axial tension loading of the brace, on the chord side, the SCF values reach the maximum values at the crown toe, 60° location or saddle in most cases. On the brace side, the majority of the maximum SCF values are located at the saddle, with a minority at the crown toe.
- For the CHS-to-CFRHS Y-joint under axial tension loading of the brace, as the value of β increases, the values of the SCFs initially increase and then decrease, reaching the maximum values between β = 0.4 and 0.6. Therefore, the width of the brace of the CHS-to-CFRHS Y-joint should not be set to half of the width of the chord to avoid high stress concentrations that lead to poor fatigue performance. As the value of γ increases, the values of the SCFs exhibit a constant linear increase. As a result, increasing the thickness of the chord of the CHS-to-CFRHS Y-joint can reduce stress concentrations and improve the fatigue performance.
- The intersection angle of brace and chord has an important influence on the magnitudes of the SCF values on both the chord and the brace side of CHS-to-CFRHS Y-joints under axial tension loading of the brace. The values of the SCFs at the 60° location and saddle increase as the value of θ increases, reaching the maximum values when the value of θ reaches 90°, on both the chord and the brace side.
- The empirical design equations proposed in this research for SCF calculations at the crown toe, 60° location and saddle of CHS-to-CFRHS Y-joints under axial tension loading of the brace provide safe and reliable results. The SCFs calculated via the empirical design equations can be utilised to calculate the HSS and predict the fatigue life via the HSS method for the fatigue design of CHS-to-CFRHS Y-joints in a composite truss structure.
- Infilling concrete in the chord for welded tubular joints can decrease the SCFs along the weld profile and peak SCF. In the comparison of the SCFs along the weld profile and peak SCF between the CHS-to-CFRHS Y-joints and the CHS-to-RHS Y-joints, infilling concrete in the chord leads to a reduction in SCFs along the weld profile of more than 15% in the chord and 11% in the brace on average, and the peak SCF is decreased by more than 15.6% on the chord side and 15.2% on the brace side.
- For the CHS-to-CFRHS Y-joint under axial tension loading of the brace, the infilled concrete can limit the inwards deformation of the chord side walls and decrease the outwards deformation of the chord top wall, leading to lower HSS and reducing the stress concentrations.
Author Contributions
Funding
Data Availability Statement
Conflicts of Interest
References
- Xiao, L.; Wei, X.; Zhao, J.M.; Wu, C.T. Hot spot stress concentration factor of CFST T/Y joints based on modified equivalent thickness. Structures 2023, 51, 910–925. [Google Scholar] [CrossRef]
- Xu, F.; Chen, J.; Guo, Y.; Ye, Y. Innovative design of the world’s tallest electrical transmission towers. Proc. Inst. Civ. Eng.-Civ. Eng. 2019, 172, 9–16. [Google Scholar] [CrossRef]
- Packer, J.A. Concrete-filled HSS connections. J. Struct. Eng. 1995, 121, 458–467. [Google Scholar] [CrossRef]
- Sakai, Y.; Hosaka, T.; Isoe, A.; Ichikawa, A.; Mitsuki, K. Experiments on concrete filled and reinforced tubular K-joints of truss girder. J. Constr. Steel Res. 2004, 60, 683–699. [Google Scholar] [CrossRef]
- Han, L.H.; Li, W.; Bjorhovde, R. Developments and advanced applications of concrete-filled steel tubular (CFST) structures: Members. J. Constr. Steel Res. 2014, 100, 211–228. [Google Scholar] [CrossRef]
- EN 1993-1-8, 2005; Eurocode 3: Design of Steel Structures, Part 1-8: Design of Joints. CEN: Brussels, Belgium, 2005.
- CIDECT Design Guide No.3; Design Guide for Rectangular Hollow Section (RHS) Joints Under Predominantly Static Loading. Verlag TÜV Rheinland Gmb: Geneva, Switzerland, 2009.
- Xu, F.; Chen, J.; Jin, W.L. Punching shear failure of concrete-filled steel tubular CHS connections. J. Constr. Steel Res. 2016, 124, 113–121. [Google Scholar] [CrossRef]
- Xu, F.; Chen, J.; Jin, W.L. Experimental investigation and design of concrete-filled steel tubular CHS connections. J. Struct. Eng. 2015, 141, 04014106. [Google Scholar] [CrossRef]
- Huang, W.J.; Fenu, L.; Chen, B.C.; Briseghella, B. Experimental study on K-joints of concrete-filled steel tubular truss structures. J. Constr. Steel Res. 2015, 107, 182–193. [Google Scholar] [CrossRef]
- Xu, F.; Chen, J.; Chan, T.M. Mechanical behaviour of concrete-filled CHS connections subjected to in-plane bending. Eng. Struct. 2017, 148, 101–112. [Google Scholar] [CrossRef]
- Song, S.S.; Chen, J.; Xu, F. Mechanical behaviour and design of concrete-filled K and KK CHS connections. J. Constr. Steel Res. 2022, 188, 107000. [Google Scholar] [CrossRef]
- Hou, C.; Han, L.H.; Zhao, X.L. Concrete-filled circular steel tubes subjected to local bearing force: Experiments. J. Constr. Steel Res. 2013, 83, 90–104. [Google Scholar] [CrossRef]
- Hou, C.; Han, L.H.; Zhao, X.L. Concrete-filled circular steel tubes subjected to local bearing force: Finite element analysis. Thin-Walled Struct. 2014, 77, 109–119. [Google Scholar] [CrossRef]
- Yang, Y.F.; Hou, C.; Wen, Z.; Han, L.H. Experimental behaviour of square CFST under local bearing forces. Thin-Walled Struct. 2014, 74, 166–183. [Google Scholar] [CrossRef]
- Ma, Y.P.; Liu, Y.J.; Wang, K.; Liu, J.; Zhang, Z.J. Axial stiffness of concrete filled rectangular steel tubular (CFRST) truss joints. J. Constr. Steel Res. 2021, 184, 106820. [Google Scholar] [CrossRef]
- Xu, F.; Chen, J.; Jin, W.L. Experimental investigation of SCF distribution for thin-walled concrete-filled CHS joints under axial tension loading. Thin-Walled Struct. 2015, 93, 149–157. [Google Scholar] [CrossRef]
- Jiang, L.; Liu, Y.J.; Fam, A. Stress concentration factors in concrete-filled square hollow section joints with perfobond ribs. Eng. Struct. 2019, 181, 165–180. [Google Scholar] [CrossRef]
- Jiang, L.; Liu, Y.J.; Fam, A.; Wang, K.N. Fatigue behaviour of non-integral Y-joint of concrete-filled rectangular hollow section continuous chord stiffened with perfobond ribs. Eng. Struct. 2019, 191, 611–624. [Google Scholar] [CrossRef]
- Jiang, L.; Liu, Y.J.; Fam, A.; Liu, J.; Liu, B. Stress concentration factor parametric formulae for concrete-filled rectangular hollow section K-joints with perfobond ribs. J. Constr. Steel Res. 2019, 160, 579–597. [Google Scholar] [CrossRef]
- Jiang, L.; Liu, Y.J.; Liu, J.; Liu, B. Experimental and numerical analysis of the stress concentration factor for concrete-filled square hollow section Y-joints. Adv. Struct. Eng. 2020, 23, 869–883. [Google Scholar] [CrossRef]
- Tong, L.W.; Xu, G.; Yan, D.; Zhao, X. Fatigue tests and design of diamond bird beak SHS T-joints under axial loading in brace. J. Constr. Steel Res. 2016, 118, 49–59. [Google Scholar] [CrossRef]
- Jiang, L.; Liu, Y.J.; Amir, F. Stress concentration factors in joints of square hollow section (SHS) brace and concrete-filled SHS chord under axial tension in brace. Thin-Walled Struct. 2018, 132, 79–92. [Google Scholar] [CrossRef]
- Gao, L.; Jiang, L.; Wang, X.; Gao, S.; Cui, H.; Liu, J.; Zhou, H. Expressions for Stress Concentration Factors for T-Joints of Hollow and Concrete-Filled Square Cross-Sections for In-Plane Axial and Bending Loads. Symmetry 2024, 16, 1082. [Google Scholar] [CrossRef]
- Matti, F.; Mashiri, F. Stress Concentration Factors of Concrete-Filled T-Joints under In-Plane Bending: Experiments, FE Analysis and Formulae. Materials 2022, 15, 6421. [Google Scholar] [CrossRef] [PubMed]
- Matti, F.; Mashiri, F. Design formulae for predicting the stress concentration factors of concrete-filled T-joints under out-of-plane bending. Structures 2020, 28, 2073–2095. [Google Scholar] [CrossRef]
- Musa, I.; Mashiri, F.; Zhu, X.Q. Parametric study and equation of the maximum SCF for concrete filled steel tubular T-joints under axial tension. Thin-Walled Struct. 2018, 129, 145–156. [Google Scholar] [CrossRef]
- Musa, I.; Mashiri, F. Parametric study and equations of the maximum SCF for concrete filled steel tubular T-joints under in-plane and out-of-plane bending. Thin-Walled Struct. 2019, 135, 245–268. [Google Scholar] [CrossRef]
- Musa, I.; Mashiri, F.; Zhu, X.Q.; Tong, L.W. Experimental stress concentration factor in concrete-filled steel tubular T-joints. J. Constr. Steel Res. 2018, 150, 442–451. [Google Scholar] [CrossRef]
- Chen, J.; Chen, J.; Jin, W.L. Experiment investigation of stress concentration factor of concrete-filled tubular T joints. J. Constr. Steel Res. 2010, 66, 1510–1515. [Google Scholar] [CrossRef]
- Zheng, J.; Nakamura, S.; Ge, Y.J.; Chen, K.M.; Wu, Q. Formulation of stress concentration factors for concrete-filled steel tubular (CFST) T-joints under axial force in the brace. Eng. Struct. 2018, 170, 103–117. [Google Scholar] [CrossRef]
- Zhao, J.M.; Xiao, L.; Wei, X.; Li, X. Parametric study and neural network-based prediction for stress concentration factor of concrete-filled steel tubular T-joint. Ocean. Eng. 2024, 305, 117972. [Google Scholar] [CrossRef]
- Mashiri, F.; Zhao, X.; Tong, L.W. Fatigue tests and design of thin CHS-SHS Tjoints under cyclic in-plane bending. J. Civ. Struct. Health Monit. 2013, 3, 129–140. [Google Scholar] [CrossRef]
- Packer, J.; Mashiri, F.; Zhao, X.; Willibald, S. Static and fatigue design of CHS-to-RHS welded connections using a branch conversion method. J. Constr. Steel Res. 2007, 63, 82–95. [Google Scholar] [CrossRef]
- Yin, Y.; Liu, X.; Lei, P.; Zhou, L. Stress concentration factor for tubular CHS-to-RHS Y-joints under axial loads. J. Constr. Steel Res. 2018, 148, 768–778. [Google Scholar] [CrossRef]
- Tong, L.W.; Xu, G.W.; Yang, D.L.; Mashiri, F.; Zhao, X.L. Fatigue behavior and design of welded tubular T-joints with CHS brace and concrete-filled chord. Thin-Walled Struct. 2017, 120, 180–190. [Google Scholar] [CrossRef]
- Tong, L.W.; Yang, D.L.; Zhao, X.L. Tests for fatigue behavior of welded CHS-SHS-concrete filled T-joints. J. Vib. Shock 2013, 32, 99–105. [Google Scholar]
- Yang, D.L.; Tong, L.W. Calculation formula of SCF for CHS-CFSHS welded T-joints with brace under axial tension. J. Jilin Univ. (Eng. Technol. Ed.) 2019, 49, 1891–1899. [Google Scholar]
- Tong, L.W.; Xu, G.W.; Yang, D.L.; Mashiri, F.; Zhao, X.L. Stress concentration factors in CHS-CFSHS T-joints: Experiments, FE analysis and formulae. Eng. Struct. 2017, 151, 406–421. [Google Scholar] [CrossRef]
- Morgan, M.; Lee, M. Prediction of stress concentrations and degrees of bending in axially loaded tubular K-joints. J. Constr. Steel Res. 1998, 45, 67–97. [Google Scholar] [CrossRef]
- GB50017-2017; Chinese Standard: Standard for Design of Steel Structures. Ministry of Housing and Urban-Rural Development of the People’s Republic of China: Beijing, China, 2017.
- GB50010-2010; Chinese Standard: Code for Design of Concrete Structures. Ministry of Housing and Urban-Rural Development of the People’s Republic of China: Beijing, China, 2010.
- ANSI/AWS D1.1-96; Structural Welding Code-Steel. American Welding Society, Inc.: Miami, FL, USA, 1996.
- Wang, K. Stress Concentration Factors and Fatigue Behavior of Welded T-Joints with a CHS Brace and a CFCHS Chord. Ph.D. Thesis, Tongji University, Shanghai, China, 2008. [Google Scholar]
- IIW Doc. No. XV-582-85; Recommended Fatigue Design Procedure for Welded Hollow Section Joints, Part 1-Hot Spot Stress Method for Nodal Joints. IIW Subcommission XV-E: Strasburg, France, 1985.
- CIDECT Design Guide No.8; Design Guide for Circular and Rectangular Hollow Section Welded Joints Under Fatigue Loading. TÜV-Verlag: Cologne, Germany, 2000.
- American Petroleum Institute. Planning, Designing and Constructing Fixed Offshore Platforms—Working Stress Design, 22nd ed.; API RP 2A-WSD (R2020); American Petroleum Institute: Washington, DC, USA, 2014. [Google Scholar]
- DNVGL. Fatigue Design of Offshore Steel Structures; DNVGL-RP-C203; DNVGL: Oslo, Norway, 2016. [Google Scholar]
- Zhao, R.; Liu, Y.J.; Jiang, L.; Fu, Y.S.; Zhao, Y.D.; Zhao, X.D. Degree of bending of concrete-filled rectangular hollow section K-joints under balanced-axial loadings. Front. Struct. Civ. Eng. 2022, 16, 461–477. [Google Scholar] [CrossRef]
- Tong, L.W.; Zheng, H.; Mashiri, F.; Zhao, X. Stress-concentration factors in circular hollow section and square hollow section T-connections: Experiments, finite-element analysis, and formulas. J. Struct. Eng. 2013, 139, 1866–1881. [Google Scholar] [CrossRef]
- Liu, Y.J.; Zhao, R.; Jiang, L.; Fu, Y.S. Study on Calculation Method for Equivalent Stress Intensity Factor of Rectangular Hollow Section K-Joints. Eng. Mech. 2023, 40, 182–194. [Google Scholar]


| Parameter | Detail A Ψ = 180–135° | Detail B Ψ = 150–50° | Detail C Ψ = 75–30° | Detail D Ψ = 40–15° | |
|---|---|---|---|---|---|
| End preparation (ω) | |||||
| max. | 90° | Needed to obtain required Φ | |||
| min. | 10° or 45° for Ψ > 105° | 10° | |||
| Joint included angle (Φ) | |||||
| max. | 90° | 60° for Ψ ≤ 105° | 40°; If more use Detail B | ||
| min. | 45° | 37–1/2°; If less use Detail C | 1/2 Ψ | ||
| Completed weld | |||||
| tw | ≥tb | ≥tb for Ψ > 90° ≥tb/sin Ψ for Ψ < 90° | ≥tb/sin Ψ but need not exceed 1.75 tb | ≥2tb | |
| L | ≥tb/sin Ψ but need not exceed 1.75 tb | Weld may be built up to meet this | |||
| SCFFE/SCFText | Specimen T1 | Specimen T2 | Specimen T3 | Specimen T4 | Specimen T5 | Specimen T6 | Specimen T7 |
|---|---|---|---|---|---|---|---|
| Mean | 1.10 | 1.09 | 1.11 | 1.09 | 1.04 | 1.11 | 1.13 |
| COVs | 0.12 | 0.09 | 0.13 | 0.09 | 0.05 | 0.12 | 0.16 |
| SCFEquation/SCFFE | At Crown Toe in Brace | At 60° Location in Brace | At Saddle in Brace | At Crown Toe in Chord | At 60° Location in Chord | At Saddle in Chord |
|---|---|---|---|---|---|---|
| Mean | 0.97 | 0.98 | 0.97 | 1.00 | 1.01 | 0.99 |
| COVs | 0.18 | 0.16 | 0.16 | 0.13 | 0.12 | 0.14 |
Disclaimer/Publisher’s Note: The statements, opinions and data contained in all publications are solely those of the individual author(s) and contributor(s) and not of MDPI and/or the editor(s). MDPI and/or the editor(s) disclaim responsibility for any injury to people or property resulting from any ideas, methods, instructions or products referred to in the content. |
© 2025 by the authors. Licensee MDPI, Basel, Switzerland. This article is an open access article distributed under the terms and conditions of the Creative Commons Attribution (CC BY) license (https://creativecommons.org/licenses/by/4.0/).
Share and Cite
Fu, Y.; Diao, K. Stress Concentration Factors of CHS-to-CFRHS Y-Joints Under Axial Tension Loading. Buildings 2025, 15, 331. https://doi.org/10.3390/buildings15030331
Fu Y, Diao K. Stress Concentration Factors of CHS-to-CFRHS Y-Joints Under Axial Tension Loading. Buildings. 2025; 15(3):331. https://doi.org/10.3390/buildings15030331
Chicago/Turabian StyleFu, Yisheng, and Kuan Diao. 2025. "Stress Concentration Factors of CHS-to-CFRHS Y-Joints Under Axial Tension Loading" Buildings 15, no. 3: 331. https://doi.org/10.3390/buildings15030331
APA StyleFu, Y., & Diao, K. (2025). Stress Concentration Factors of CHS-to-CFRHS Y-Joints Under Axial Tension Loading. Buildings, 15(3), 331. https://doi.org/10.3390/buildings15030331