Abstract
The sling sheath plays an important protective role in the sling of suspension bridges, effectively preventing accidental damage to the sling caused by wind, fatigue and other impacts. To conduct a quantitative analysis of the apparent disease of suspension bridge slings, a method for segmenting and quantifying the apparent disease of the sling sheath using deep learning and image processing was proposed. A total of 1408 disease images were obtained after image acquisition of a suspension bridge following sling replacement. MATLAB 2021a Image Labeler software was used to establish a disease dataset by manual labelling. Then, the MobileNetV2 model was trained and tested on the dataset to determine disease segmentation; additionally, an area measurement algorithm was proposed based on the images’ projection relationships. Finally, the measurement results were compared with the manually acquired crack area. The results show that the accuracy of background and sheath category pixels in the MobileNetV2 model is above 97%, indicating that the model achieves satisfactory results in these classifications. However, the accuracy of crack category pixels and the intersection over union ratio only reaches 80%, which needs to be improved by setting model correction coefficients. When measuring directly, it was found that the area measurement error of the test image mainly ranged between 8% and 30%, and the measurement error of the crack area after correction mainly ranged between −3% and 15%, indicating that the area measurement method can achieve a higher degree of measurement accuracy. The method for segmenting and quantifying the apparent disease of the sling sheath based on deep learning and image processing fills the research gap in the measurement of the surface damage area caused by apparent disease and has the advantages of high efficiency and high recognition accuracy. Reducing the maintenance costs of suspension bridge slings is crucial for promoting comprehensive intelligent detection of bridges and advancing the smart transformation of the civil engineering industry.
1. Introduction
Sling sheaths play an important protective role in the sling of suspension bridges, effectively preventing rainwater and other corrosive media from contacting the steel wire. However, with the increase in service time, the surface of the sheath may appear cracked, aged, scratched, and with other diseases, causing weakening of its protective performance [1], which leads the internal steel wire of the sling to be exposed directly to the environment, resulting in corroded steel wires or even fracture. This seriously affects the safety of the sling. Therefore, it is necessary to establish a timely and accurate assessment model for the apparent disease of the sling sheath.
With the emergence of the AlexNet model in 2012, convolutional neural networks have made a breakthrough [2]. Compared with traditional machine learning methods, convolutional neural networks have more powerful feature learning and expression capabilities, and the extracted features are more diverse and detailed, and they can be used to deal with large-scale complex image classification tasks [3]. Previous studies have shown that [4,5,6,7] applying convolutional neural networks to structural health monitoring and damage detection can obtain higher recognition accuracy.
The success of deep learning in the field of visual detection inspired Zhang et al. [8], who applied deep convolutional neural networks to the crack detection task and provided a new idea for the intelligent detection of cracks. Hoang et al. [9] highlighted the excellent performance of deep learning by establishing and comparing two intelligent methods for the automatic identification of pavement cracks. Current image recognition algorithms based on deep learning can be categorized into three main groups: image classification, target detection, and image segmentation [10]. Image classification recognizes overall image categories in a simple and efficient way, where an image has only one category label suitable for large-scale standard tasks, but it cannot provide detailed location information and is not applicable to damage area measurement.
Compared to image classification, which only obtains category information, target detection techniques not only provide category information about defective targets but also pinpoint the location of the target by using rectangular boxes in the image to outline the boundaries of different targets, performing category determination for each target box [11]. Target detection techniques are categorized into two broad categories: two-stage detection and single-stage detection. Two-stage detection algorithms first generate candidate frames and then classify and localize targets on these candidate frames. Compared to single-stage detection algorithms, two-stage detection algorithms usually have higher computational complexity and longer inference times [12]. For apparent disease detection, Li and Li [13] proposed an improved Faster R-CNN model by fusing Faster R-CNN and Feature Pyramid Network (FPN), utilizing detailed shallow features; the results show that the improved Faster R-CNN model increases the accuracy of detecting notch and scratch defects by 2.485% and performs better in small target recognition. Cha et al. [14] proposed a structural visual inspection method based on Faster R-CNN and then compared it with the CNN-based concrete crack detection method [15]; the results show that the Faster R-CNN model exhibits higher computational efficiency and provides more flexible bounding box sizes that can be adapted to input images of different scales.
The single-stage detection algorithm achieves target detection and recognition directly through a network model without pre-generating candidate frames. The algorithm can predict the location and category of the target directly from the input image, avoiding the additional candidate frame generation and screening process, reducing the computational and time costs, and being suitable for real-time application scenarios [16]. Liao and Li [17] proposed an improved network model for YOLOv3 based on the Convolutional Neural Network Single-Stage Target Detection Algorithm for YOLOv3, and compared it with YOLOv1, SSD, and the original YOLOv3; the results show that under the same dataset and iteration conditions, the improved YOLOv3 network achieves excellent performance in crack detection with an accuracy of 93.02%. Yang et al. [18] used AlexNet, VGGNet13, and ResNet18 to classify the crack images and subsequently used the YOLOv3 model for crack target detection; the results show that the model can successfully detect the crack region in the video and exhibit good detection performance.
Compared with image classification and target detection, image segmentation has the ability to identify pixels within an image and assign appropriate labels to each pixel. Image segmentation can be categorized into semantic segmentation and instance segmentation. Semantic segmentation classifies image pixels according to semantic categories [19], enabling a deeper understanding of the image content. Xu et al. [20] proposed an enhanced FCNN structure and effectively applied it to the task of identifying cracks in steel box girders of bridges with complex interference backgrounds and handwriting; the results show that the trained fused convolutional neural network can automatically detect cracks, handwriting and background from the original image. Fei et al. [21] proposed a new architecture, CrackNet-V, by incorporating the Leaky Rectified Tanh activation function, which is suitable for pixel-level automatic crack detection in 3D asphalt pavement images, simultaneously enhancing the recognition accuracy and computational efficiency. Chen and Jahanshahi [22] introduced the plain Bayesian (NB) probability based on the FCN model and proposed the NB-FCN method, which realized real-time and high-precision crack detection. Instance segmentation has the capacity to differentiate among different individuals belonging to the same semantic category, which is essentially equivalent to introducing a higher level of target contour recognition based on target detection. The algorithm not only accurately detects the presence of objects, but also captures the contour boundaries of each target, thereby providing more detailed and crucial information about cracks [23]. To address the issue of the difficulty in quantifying traditional steel bridge surface defects, Zhu and Li [24] proposed a deep learning-based method for segmentation and quantification of steel bridge defects based on the SOLOv2 instance segmentation network, with the original ResNet network replaced by the VoVNet57 network. Hou et al. [25] proposed a Cascade dataset modelling based on transfer learning and a cable detection robot for automatic identification and measurement of surface defects on stay cables. This approach achieved optimal performance in terms of IoU (0.743) and F1-Score (85.1%) values. Although deep learning has yielded abundant research results in crack detection of concrete structures, there are relatively few studies on the identification of apparent diseases of sling sheaths; most existing research efforts focus on the identification of apparent diseases of slings [26]. Liu et al. [27] proposed a lightweight processing region-recommended convolutional neural network model. This model manages to reduce the demands for equipment performance during model training and prediction while maintaining recognition accuracy. As a result, it enables the efficient utilization of computing resources and time. However, it fails to take into account the quantitative analysis of sling sheath diseases. In light of this, this paper conducted transfer learning based on the MobileNetV2 model. Semantic segmentation was performed on the sling sheath images to obtain the binary images of the sling sheath and cracks. Subsequently, based on the image projection relationship, an area measurement method was proposed, and the model correction coefficient was employed to account for the impact of the model segmentation error on the recognition result of the quantity measurement method. Finally, the measurement results were compared with the manually obtained crack area. This comparison verified the segmentation and measurement effects of the semantic segmentation model and the area measurement method.
2. Dataset Establishment
2.1. Image Data Acquisition
In the realm of deep learning, the recognition accuracy of neural networks is chiefly contingent upon the quality of sample datasets. To acquire apparent disease images of sling sheaths that closely approximate the actual situation and possess a sufficient number of images, this paper undertakes the image acquisition work on the replaced slings of a suspension bridge. This paper comprehensively considers influencing factors such as model calculation and image clarity, with the aim of facilitating the training and testing of the neural network model. Moreover, through image scaling and cropping, the size of the sample dataset is adjusted to 224 × 224 pixels. In total, 176 images were obtained.
2.2. Data Augmentation
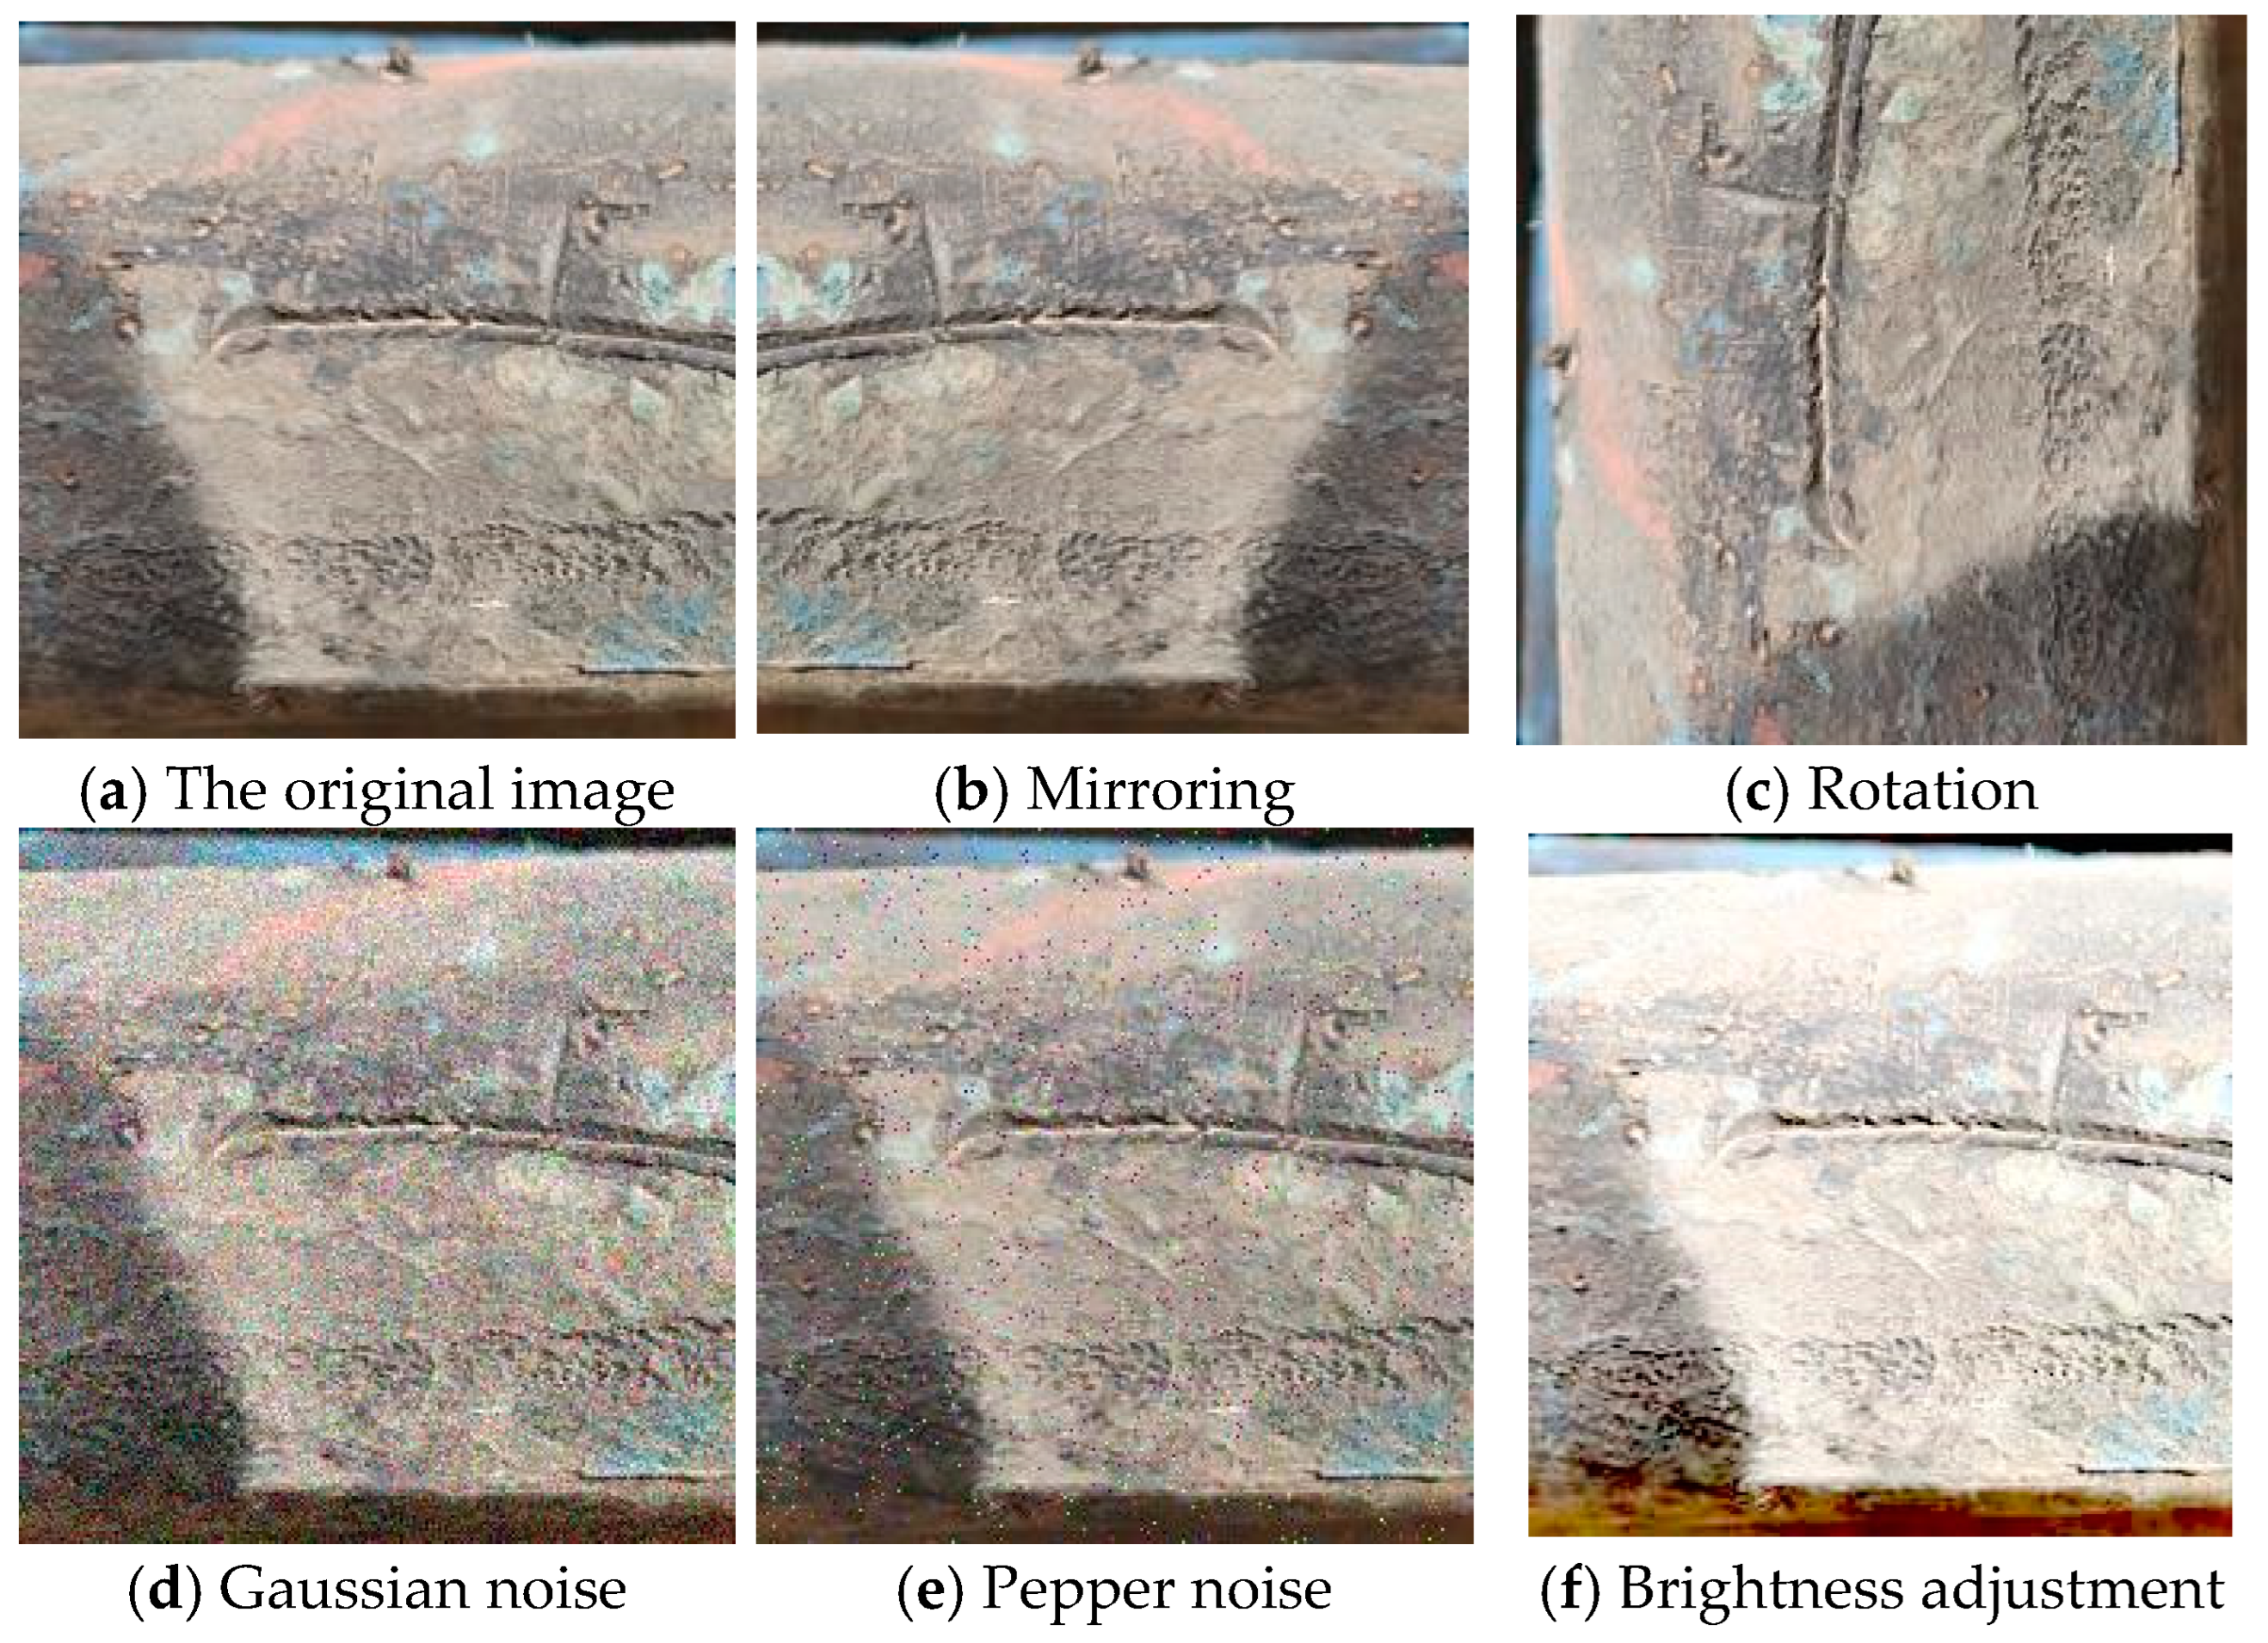
Based on the original images, this paper expands the dataset through techniques such as mirroring, rotation, blurring, brightness adjustment, thereby increasing the number of samples in the dataset and reducing the risk of model over-fitting. Some of the data augmentation effects are shown in Figure 1. After data augmentation, a total of 1408 images of apparent diseases of the sling sheath were acquired.

Figure 1.
Augmented images of apparent diseases of the sling sheath.
2.3. Data Labelling
To achieve the area measurement of the apparent damage on the sling sheath, it is necessary to label the acquired images of the sling sheath’s apparent damage. In this study, MATLAB 2021a Image Labeler software was utilized for the labelling task. During the labelling process, the pixel labels were categorized into three distinct classes: background, sheath and cracks (as shown in Figure 2, the background pixel labels are colored red, the sheath pixel labels are colored blue, and the cracks pixel labels are colored black). Upon the completion of the labelling, for each apparent disease image, a labelled image in image format is generated. Subsequently, the gTruth.mat file was exported from the MATLAB Image Labeler software. This step was crucial for establishing the correspondence between labelled images and original images, which is vital for the training and testing of the semantic segmentation model.
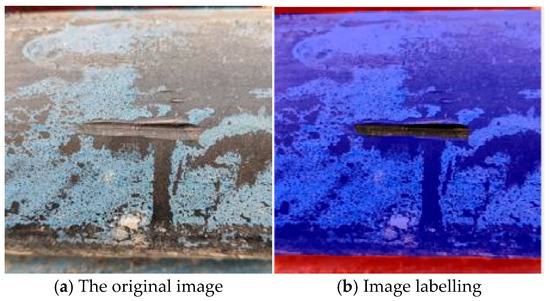
Figure 2.
Image labelling of sling sheath diseases.
When conducting analysis of the pixel data in the labelled images, it is necessary to separately count the number of background pixels, sheath pixels and crack pixels. By means of pixel data analysis, the ratio of the number of these three types of pixels is found to be 0.16:0.77:0.07. This ratio reflects the relative distribution of different pixel types within the entire labelled dataset. Such information is of great significance, as it aids in determining the weights of the model’s output layer, thereby ensuring that the model can be better tailored to diverse segmentation tasks.
3. Semantic Segmentation Model
Traditional neural networks demand a substantial amount of computing resources and memory when operating on mobile devices. Nevertheless, the computing power and storage capacity of mobile devices are limited. Therefore, lightweight models are necessary to achieve real-time inference and high-performance computing on these devices. MobileNetV2, a lightweight model proposed by Google in 2018, is specifically designed for scenarios with limited computing resources on mobile and embedded devices. The model decomposes standard convolution into depthwise convolution and pointwise convolution, which effectively alleviates the computational burden and reduces the number of parameters. As a result, the model can operate efficiently on various devices with constrained computing resources while maintaining a relatively compact size.
3.1. Model Training
In this paper, transfer learning is implemented using the MobileNetV2 model. The input layer of the model retains a size of 224 × 224 pixels, while the number of categories in the output layer is adjusted from 1000 to 3 (i.e., background, sheath and crack). The unbalanced weight for the semantic segmentation categories is computed based on the ratio of the number of background pixels, sheath pixels, and crack pixels (0.16:0.77:0.07). The calculation formula is presented in Equation (1) [28].
where weight is the output layer category weight, frequency is the ratio of the three pixel categories (0.16:0.77:0.07), and median is the median function.
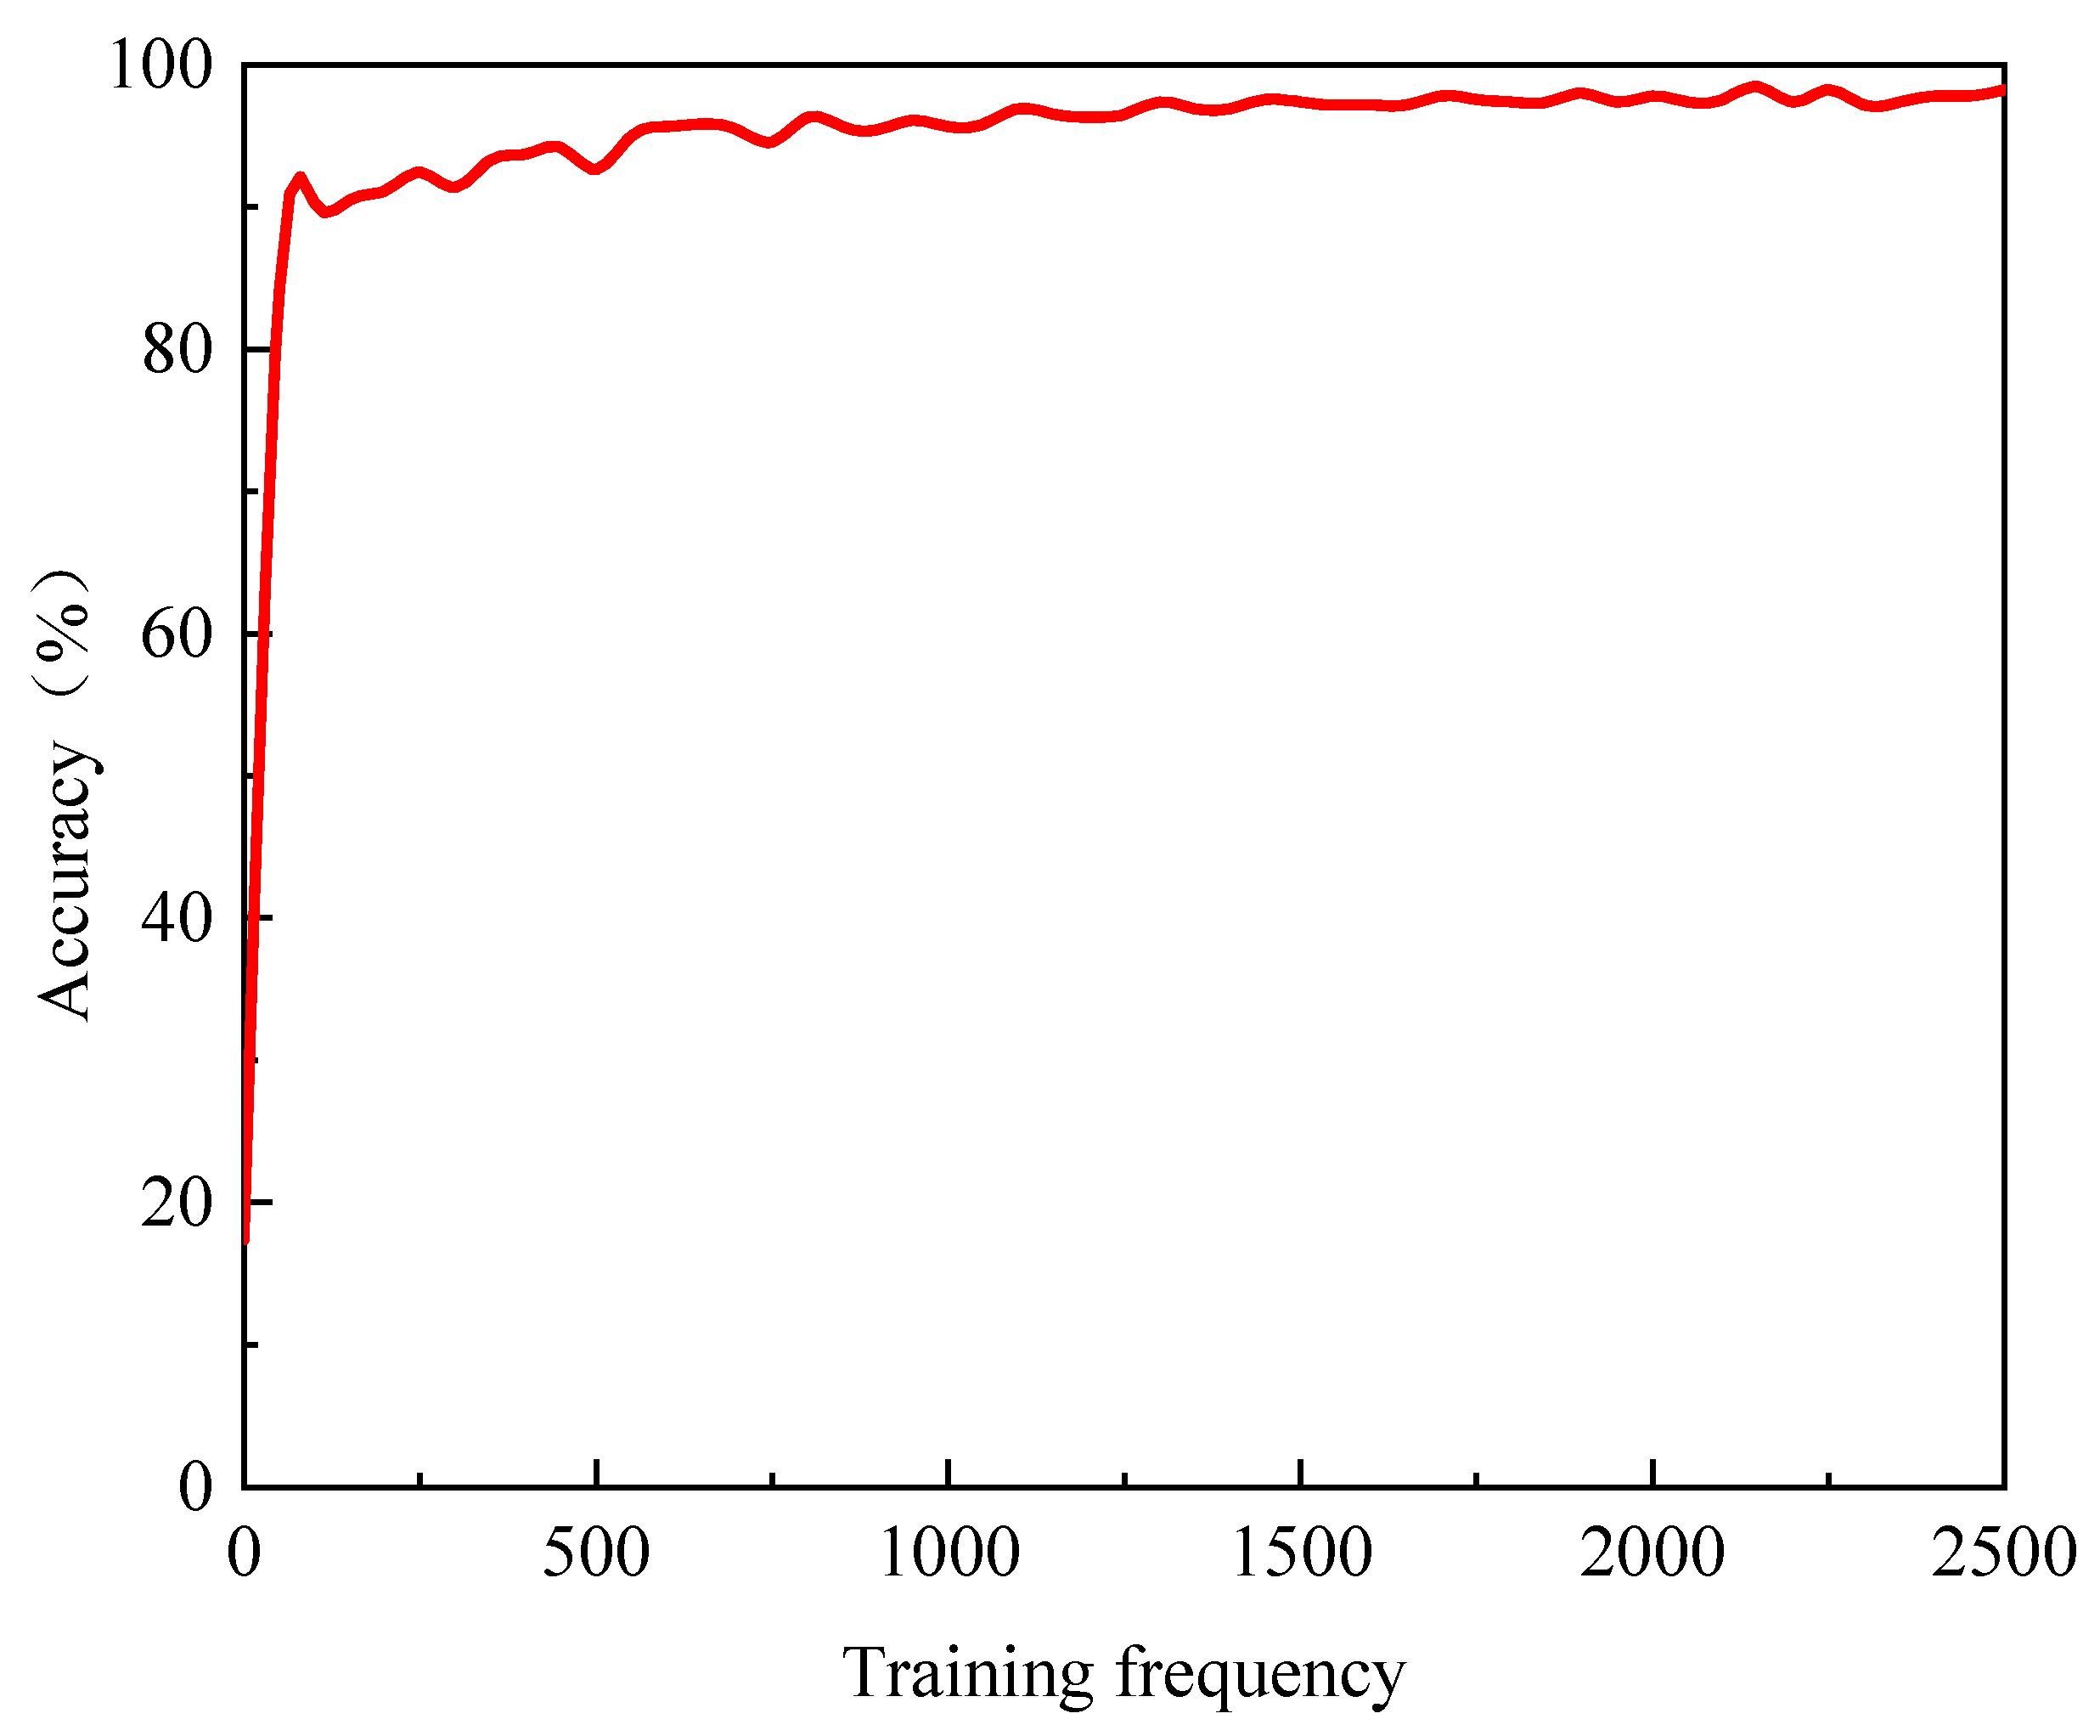
The training parameters for the semantic segmentation model based on the MobileNetV2 network are configured as follows. The Adam algorithm is selected as the training algorithm, the size of each batch is 128 samples, the maximum number of training epochs is 50, the initial learning rate is set at 0.001, the earning rate is scheduled to be reduced every 10 epochs, and the reduction factor for the learning rate is set to 0.1. The pre-trained model’s weight parameters are employed as the initial weight. Subsequently, the transfer learning model is trained on the dataset of the sling sheath’s apparent diseases. The training process is shown in Figure 3.
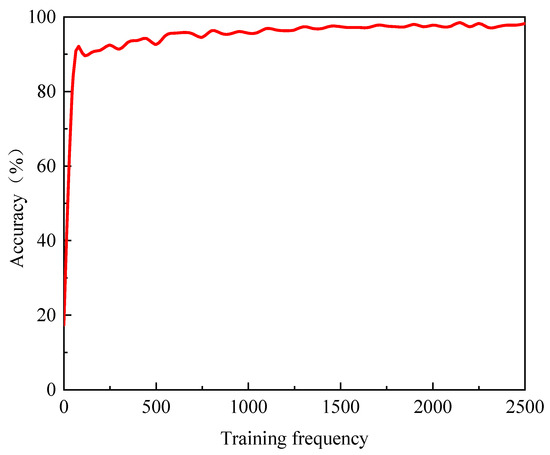
Figure 3.
Training process of semantic segmentation model.
When the number of iterations is fewer than 50, the training accuracy of the model exhibits a linear upward trend, climbing to approximately 83%, indicating that transfer learning effectively promotes the convergence of the target task by leveraging the initial weight parameters derived from the features and knowledge acquired in the source task. As the number of iterations ranges from 50 and 1500, the model’s training accuracy shows a steady growth trend, which implies that the model is gradually extracting the data features of the target task and enhancing its fit to the training set. Once the number of iterations exceeds 1500, the model’s training accuracy essentially stabilizes. By the end of the iterations, the training accuracy reaches about 98%, which suggests that additional training beyond 1500 iterations does not yield a significant positive impact on the model’s recognition performance and may even lead to overfitting. Consequently, in this paper, the number of iterations was adjusted to 1500, and the model was retrained. Figure 3 illustrates the model’s training process up to 2500 iterations, for the purpose of showing that after more than 1500 iterations of training, the model’s recognition accuracy does not increase substantially, and there is no necessity to further increase the number of iterations to enhance the model’s recognition accuracy.
3.2. Analysis of Results
Upon the completion of training the MobileNetV2 transfer learning model, the test set is categorized and the classification confusion matrix of the test results is generated, as presented in Table 1. In the classification confusion matrix, the number of sheath pixels misclassified as crack pixels is relatively large, accounting for 77% of the misclassified pixels. The root cause for this phenomenon lies in the uniform adjustment of the image size to 224 × 224 pixels during image processing. This adjustment leads to the blurring of the crack edge information in the images. As a result, the labelling of crack pixels is more conservatively classified, encompassing part of the sheath pixels. During the actual test process, the model struggles to clearly distinguish this fuzzy edge information, which causes a significant number of sheath pixels to be misclassified as crack pixels. To address this issue, this paper introduces a model correction coefficient into the crack area measurement method to reduce the calculated crack area, eliminating the influence of some sheath pixels on crack area identification, and obtains a more accurate three-dimensional surface area of the crack.

Table 1.
Classification confusion matrix (unit: pixel).
- (1)
- The overall performance of semantic segmentation models is typically evaluated using metrics such as Pixel Accuracy (PA), Category Pixel Accuracy (CPA), and Intersection and Union Ratio (IoU). Pixel Accuracy (PA): It is defined as the ratio of the sum of the diagonal elements in the confusion matrix to the sum of all the elements in the upper matrix. This metric intuitively reflects the overall classification accuracy of the model.
- (2)
- Category Pixel Accuracy (CPA): The diagonal value is compared with the total number of pixels in the corresponding column. The category pixel accuracy evaluates each category independently, which helps in comprehending the model’s performance on different categories and enables more effective handling of category imbalances.
- (3)
- Intersection and Union Ratio (IoU): It is the ratio related to the sum of the elements in the corresponding rows and columns of the diagonal values in the confusion matrix. The IoU metric offers a more in-depth understanding of the spatial coverage degree of the segmentation result, and is a widely used evaluation measure.
The key evaluation metrics of the model can be calculated through the classification confusion matrix to comprehensively evaluate the model’s performance. As presented in Table 2, the pixel accuracy of the background and sheath categories exceeds 97%, indicating that the model attains quite satisfactory results when categorizing pixels in these two categories. However, the category pixel accuracy and intersection over union ratio of crack category pixels are merely 80%, suggesting a relatively poor performance. This issue arises since, during the training of the dataset by the semantic segmentation model, crack pixels account for a relatively small proportion, and some sheath pixels are misclassified as crack pixels. This phenomenon is also in line with the overall tendency of pixel classification in the semantic segmentation model (where the number of misclassified crack pixels is relatively large). To address this, a model correction coefficient can be incorporated into the area measurement method. This coefficient serves to rectify the recognition results of the semantic segmentation model, eliminate the influence of some misclassified sheath pixels, and thereby obtain a more accurate three-dimensional surface area of the crack.
Table 2.
Model evaluation indicators.
4. Area Measurement Method
4.1. Measurement of Real Area
- (1)
- To validate the measurement efficacy of the area measurement method, it is necessary to manually determine the crack area for comparison with the outcomes of the area measurement method. The specific steps are as follows. Crack Depiction: Once a crack is identified on the surface of the sling sheath, it is traced onto a standard A4 paper and scanned to obtain a digital image.
- (2)
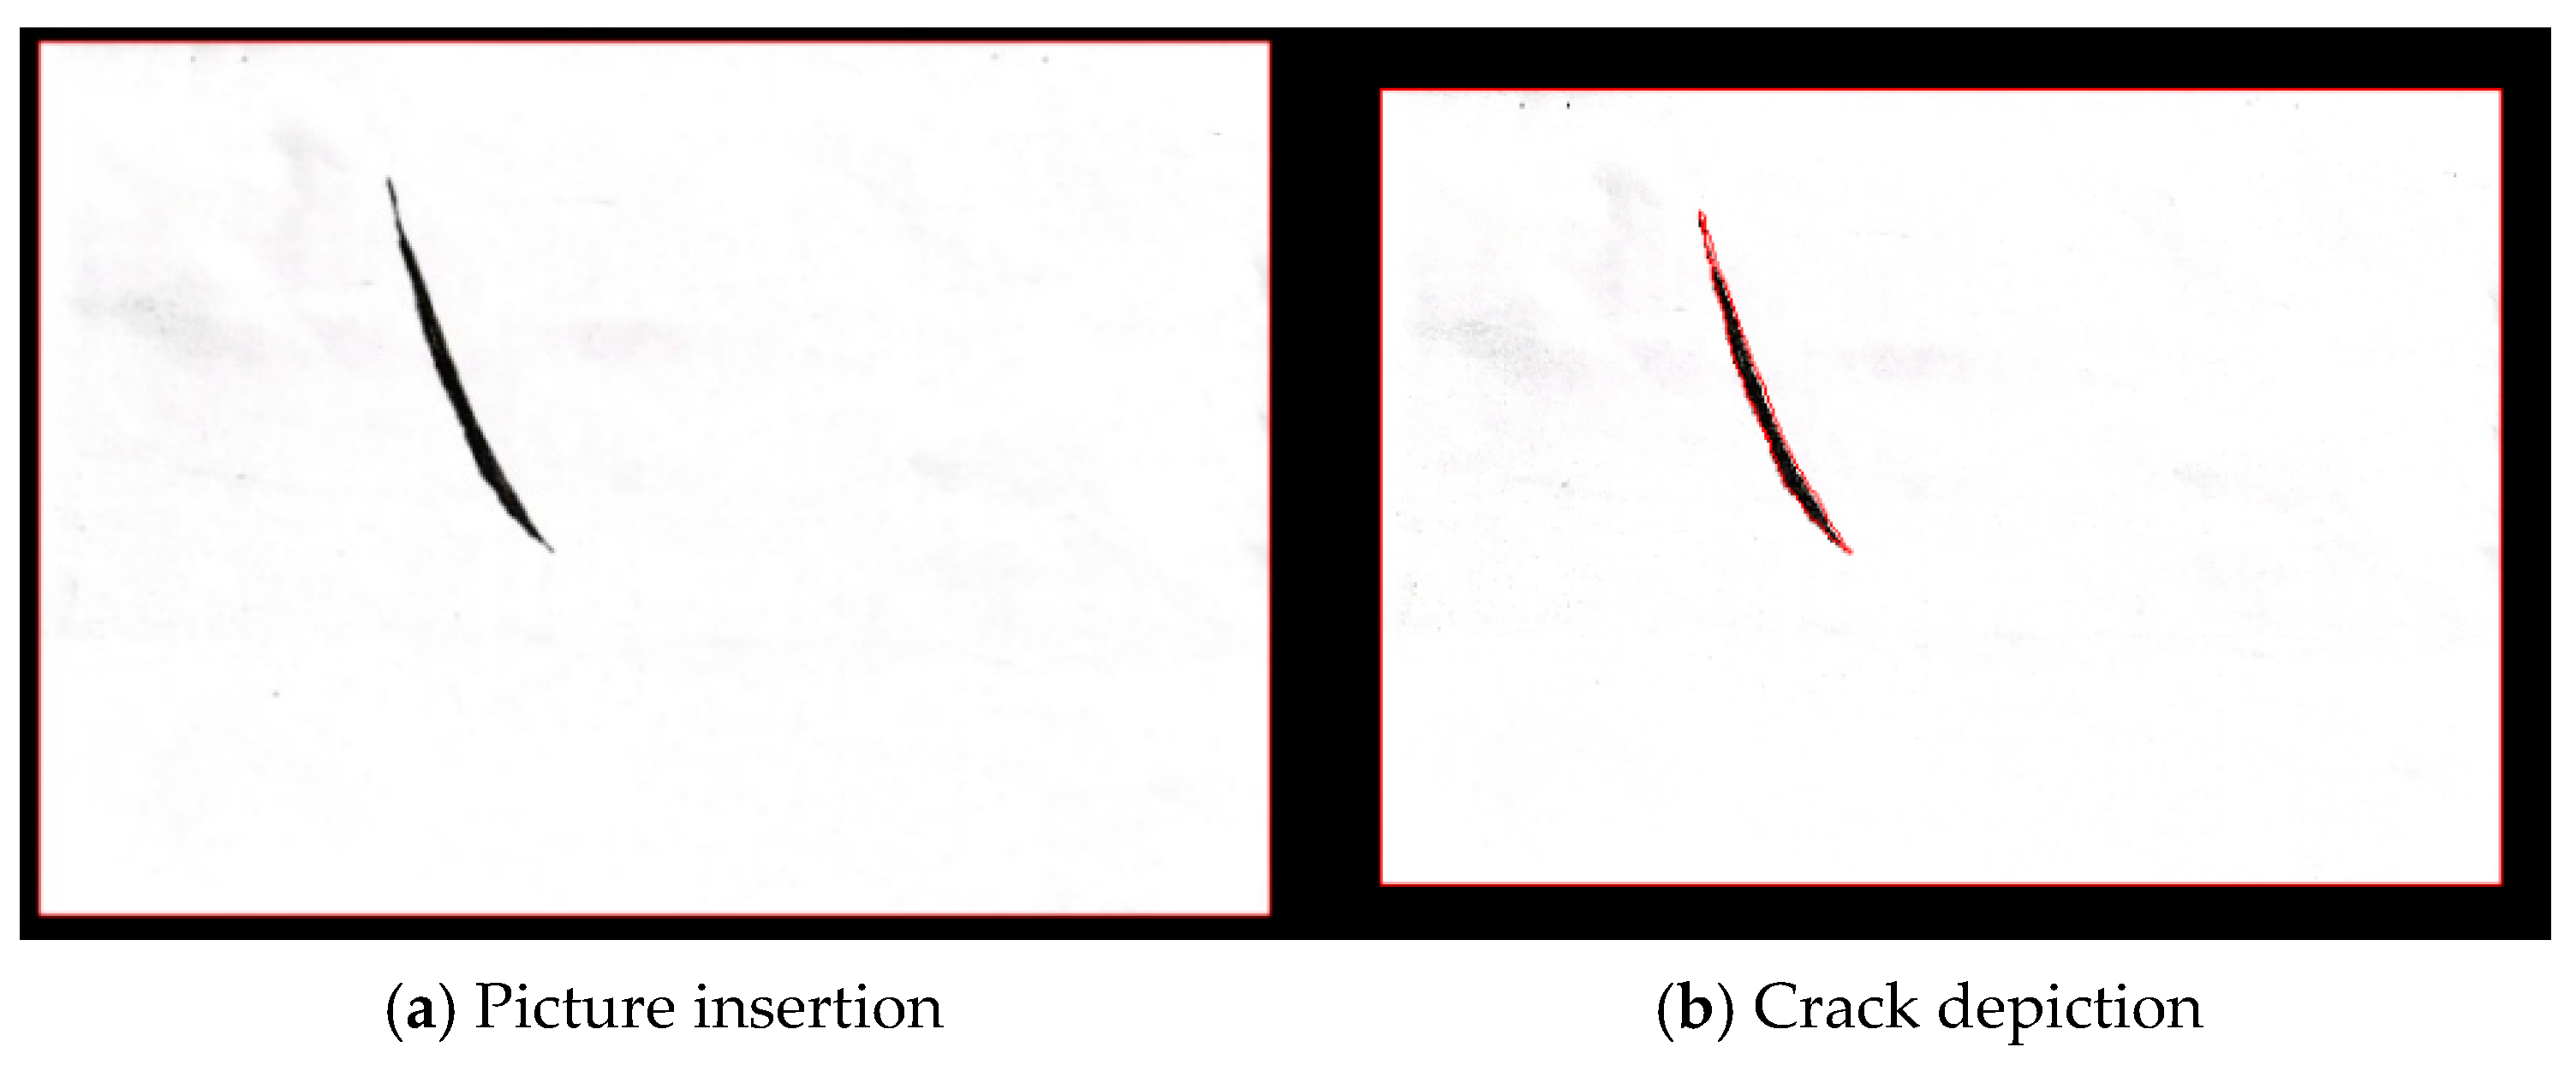
- Boundary Acquisition: The scanned crack image is imported into the AutoCAD 2021 software in the form of raster image reference (as shown in Figure 4a), and the crack is outlined using polylines to form a closed curve (as shown in Figure 4b). The closed curve should precisely represent the shape and boundary details of the crack. To minimize measurement errors, the shape of the closed curve should also take into account the labels in the dataset.
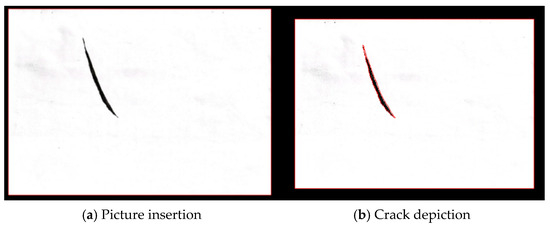 Figure 4. Measurement of the true area of cracks.
 - (3)
- Area Calculation: The closed curve in AutoCAD is selected and the characteristics of the enclosed graphic area can be retrieved. The obtained area value represents the three-dimensional surface area of the crack, determined manually.
This approach effectively addresses the challenge that cracks are situated on the sheath surface and their boundaries are often curved, making them difficult to measure with common equipment.
4.2. Image Area Measurement
When measuring the crack area of a sling sheath image, it is necessary to convert the pixel area of a two-dimensional crack image into the actual area of a three-dimensional surface. To realize the area conversion, the projection relationship between the sheath surface and the image plane needs to be determined. For the vertical sheath surface and the image plane, there is a linear transformation, and only a scale ratio relationship exists. In contrast, the transverse sheath surface is projected from a semi-circular arc to a horizontal line (as shown in Figure 5), where both a scale proportional relationship and a projection relationship are involved.
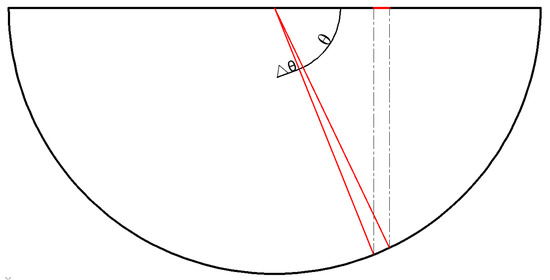
Figure 5.
Projection relations.
The proportional relationship between the image and the sheath scale can be established using the horizontal pixel length and the sheath diameter. Through an analysis of the geometric relationship between the image and the sheath, a mapping relationship between the sheath surface and the projection plane can be determined. By examining the scale proportional relationship between the image and the sheath as well as the projection relationship of the image in the horizontal direction, it is possible to establish the proportional relationship between a single pixel point in the two-dimensional image and the corresponding actual surface area in the real three-dimensional space (see Equation (2)). Ultimately, this enables the measurement of the area of the apparent disease on the sling.
where θ is the angle between a pixel point of a crack and the center of the sheath circle and the projection point of the pixel point, R is the radius of the sheath, and ∆θ takes a value that tends to zero. Equation (2) shows that the projection relationship of the image in the transverse direction is only related to the position (θ) of the crack in the sheath.
To determine θ, the center of the sheath should be found first, and the steps are as follows:
- (1)
- Conduct semantic segmentation on the image to classify the pixels into three categories: background, sheath, and crack.
- (2)
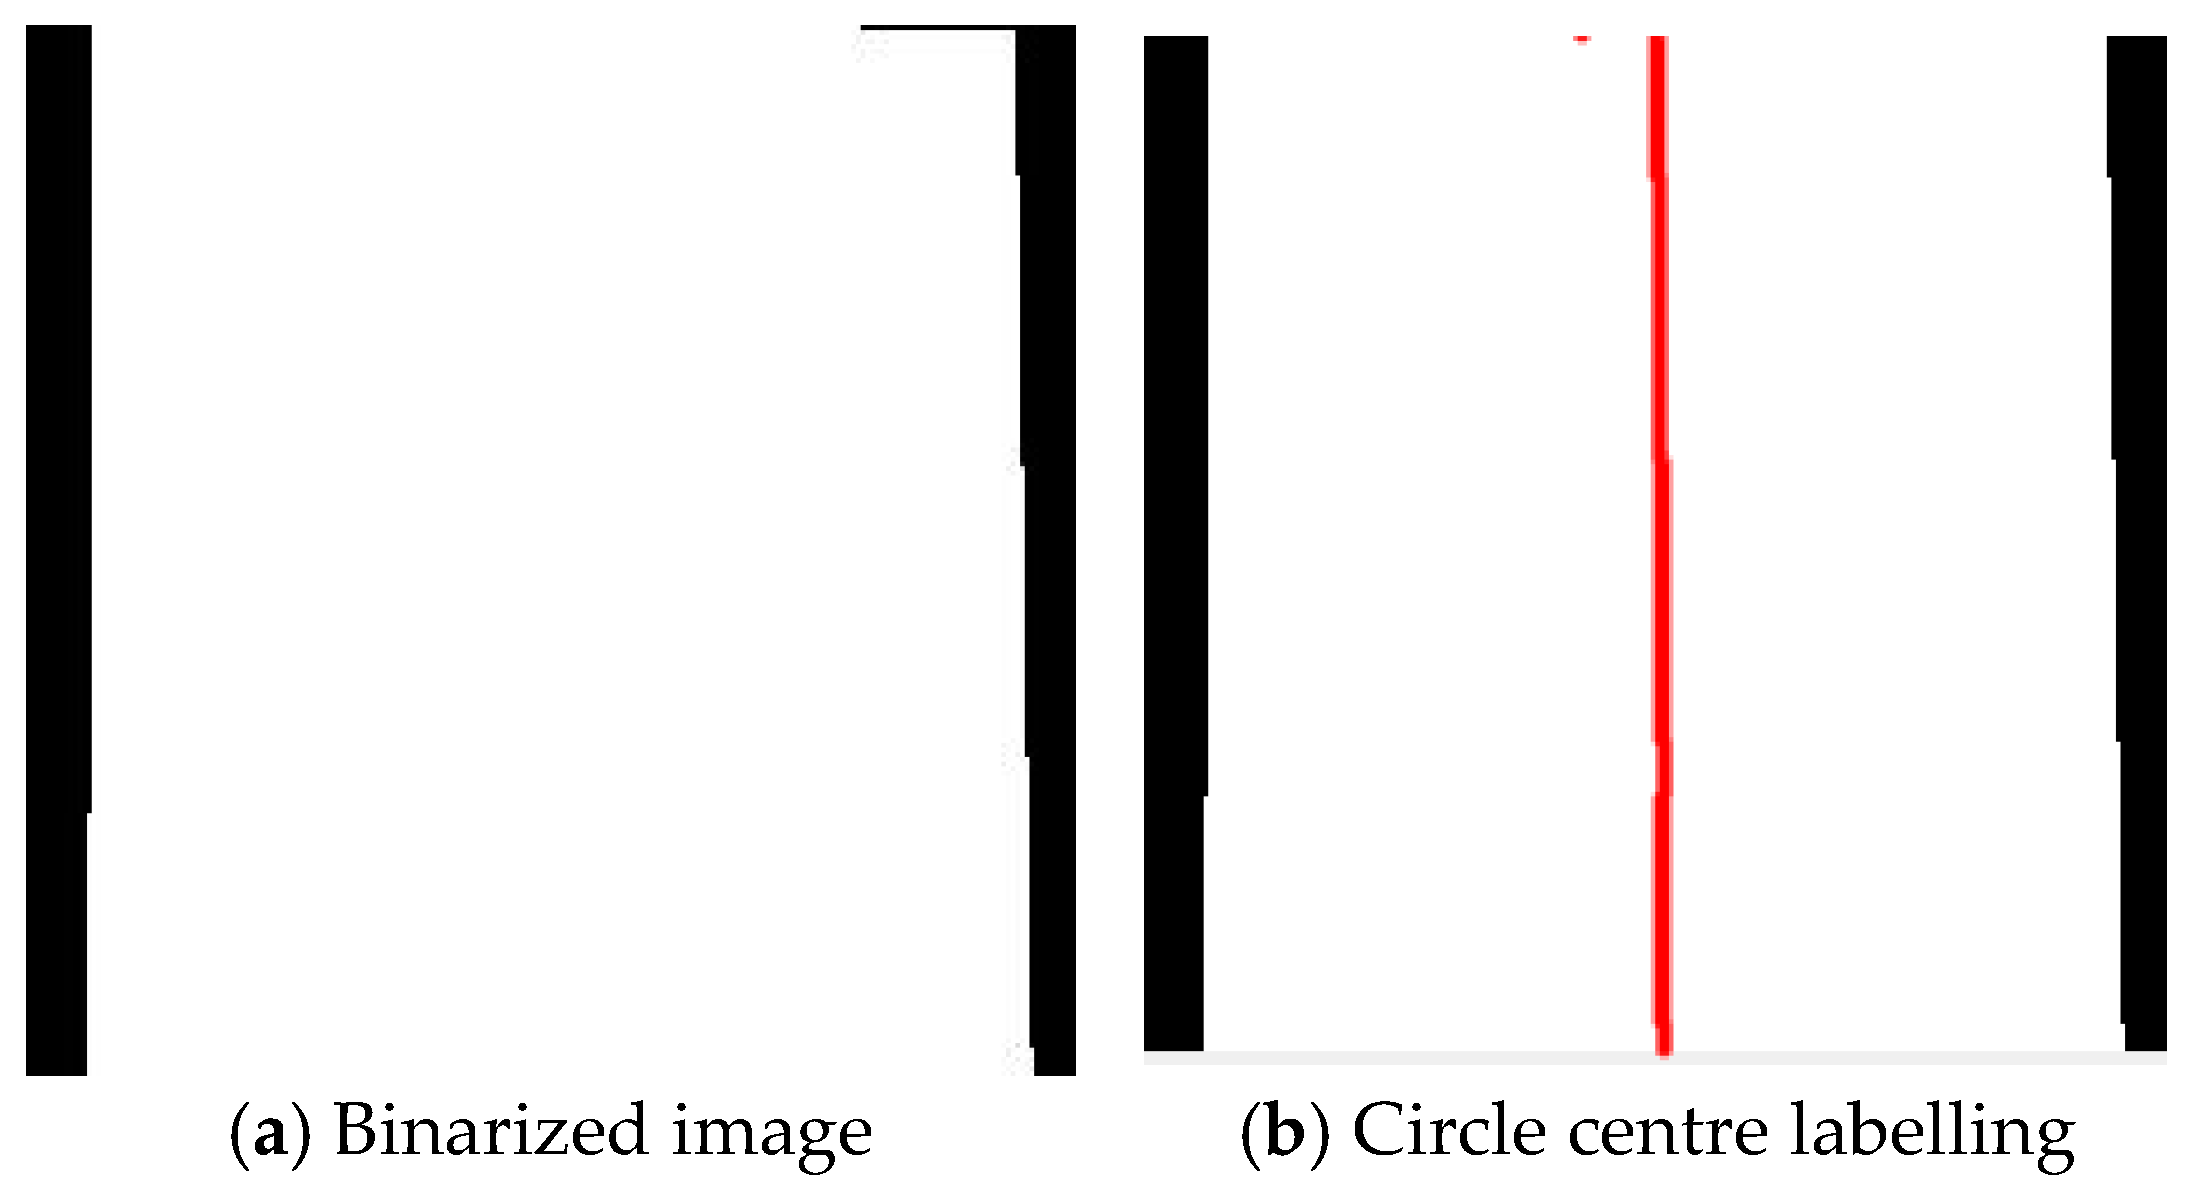
- Perform image binarization based on the pixel categories. Convert the background pixels to black, and set the sheath pixels and crack pixels to white (as shown in Figure 6a).
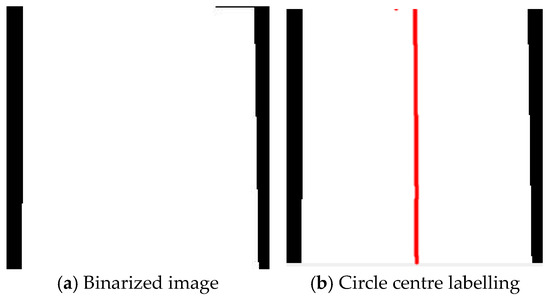 Figure 6. Center of sheath.
 - (3)
- Utilize the connected region method to obtain the coordinates of all white pixels. For all the white pixel coordinates at the same horizontal height, identify the left-most and right-most endpoints of the white area. Then, consider the pixel length from the left endpoint to the right endpoint as the diameter of the sheath at that horizontal height. Subsequently, take the midpoint of this diameter as the center of the sheath circle at that horizontal height (as shown in Figure 6b). Considering the impact of the shooting angle on the image (as shown in Figure 6a), the edges of the sheath in the image are not perpendicular, and the pixel diameters of the area close to the lens are larger, whereas those far from the lens are smaller. This phenomenon causes the apparent diameter of the sheath to vary at different horizontal heights in the image. To ensure the accuracy of the measurement results, this paper examines all horizontal heights to obtain 224 sheath centers (the red line in Figure 6b represents the center of the circle at each horizontal height) and 224 sheath diameters. Performing area conversion for different horizontal heights can effectively address the issue of pixel diameter variation, rendering the measurement results more precise and reliable.
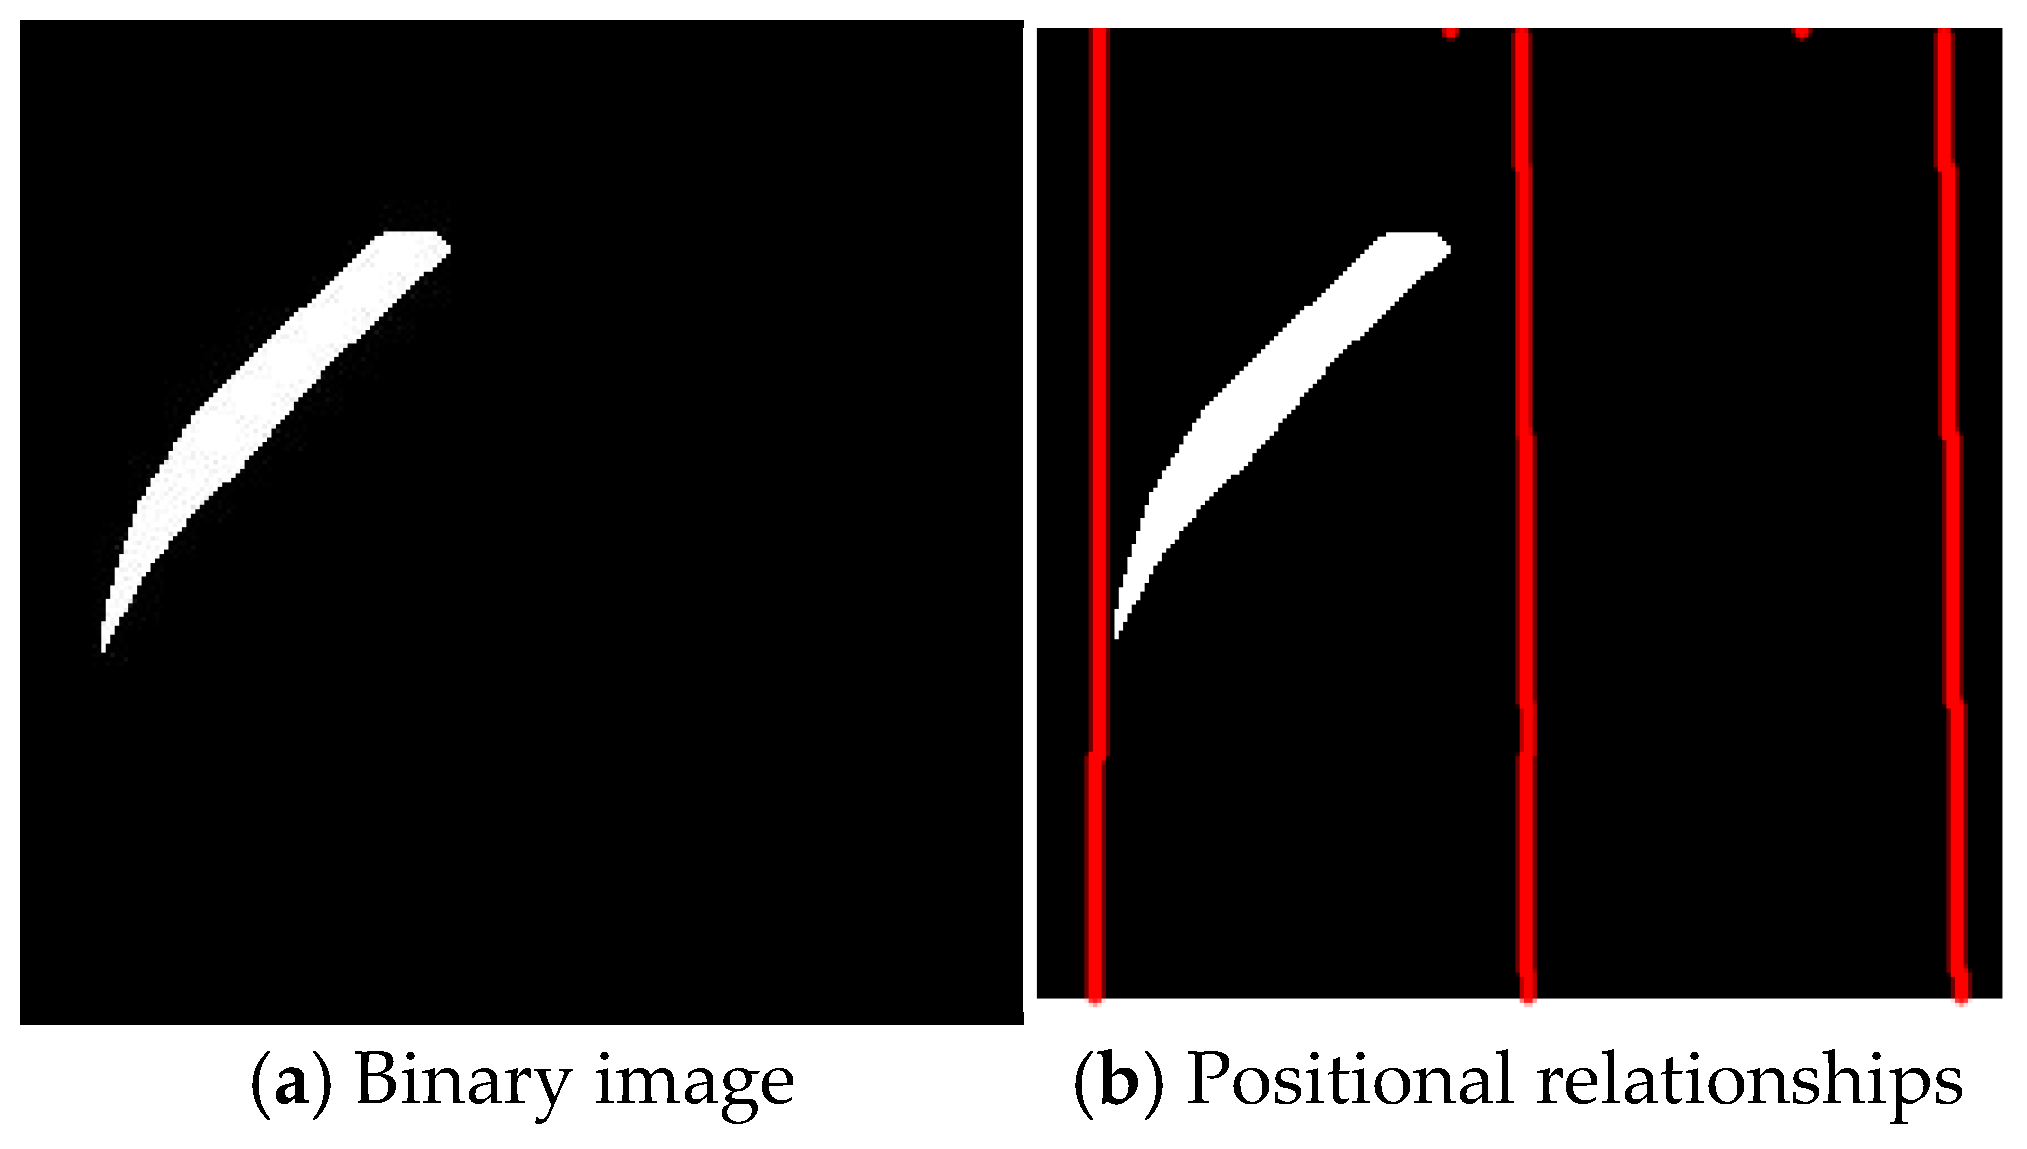
To pinpoint the crack location, the background pixels and sheath pixels are set to black, while the crack pixels are set to white (as shown in Figure 7a). Subsequently, the centerline and edges of the sheath are determined based on the 224 obtained sheath center positions and 224 sheath diameters (as shown in Figure 7b, where the first red vertical line represents the left edge of the sheath, the second red vertical line is the centerline of the sheath, and the third red vertical line represents the right edge of the sheath). By applying the connected region method, the coordinates of all white pixels are obtained. Then, the accurate position information of the crack in the image can be determined according to the pixel coordinates and the center coordinates of the sheath at the corresponding horizontal height.
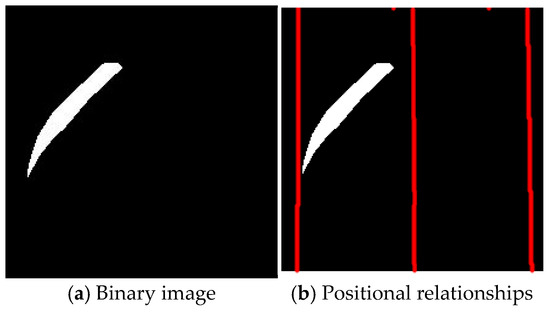
Figure 7.
Crack image.
To ensure the accuracy of measurement results, the areas of white crack pixel points are calculated first. Subsequently, the surface areas corresponding to all crack pixel points are summed up to ascertain the actual area of the crack. This operation is carried out on individual pixel points, which ensures an accurate mapping from the projection plane to the three-dimensional surface. For a single pixel point, first, the position of the circle’s center at its corresponding horizontal height and the sheath diameter are determined based on its vertical axis coordinates. Then, according to the pixel point’s horizontal axis coordinates, the horizontal axis coordinates of the circle’s center, and the sheath diameter, the mapping relationship between the horizontal projection of each pixel point and the circle’s arc is established (calculated using Equation (2)). Finally, area conversion is performed according to the proportional relationship between the projected length of the sheath diameter and its actual length (refer to Equation (3)). The area of the crack can ultimately be obtained by summing up the projected lengths and actual lengths of all the pixel points. Through the accumulation of the areas of all pixel points, the real area of the crack can be accurately determined.
where S is the area of the 3D surface corresponding to the pixel point, 1 represents the area of a single pixel point, R represents the radius of the sheath (set according to the specific project, which needs to be input manually), r represents the radius of the pixel of the sheath (measured directly by the algorithm), and θ is the angle between a certain pixel point of a crack and the center of the sheath circle and the point of projection of the pixel point (obtained by referring to Equation (2) based on the pixel point coordinates and the center coordinates and diameters at the height).
5. Validation
To assess the accuracy of the area measurement method, a comparison was made between the actual area and measured area of the cracks. This comparison aimed to expose the deviation of the area measurement method from the actual area.
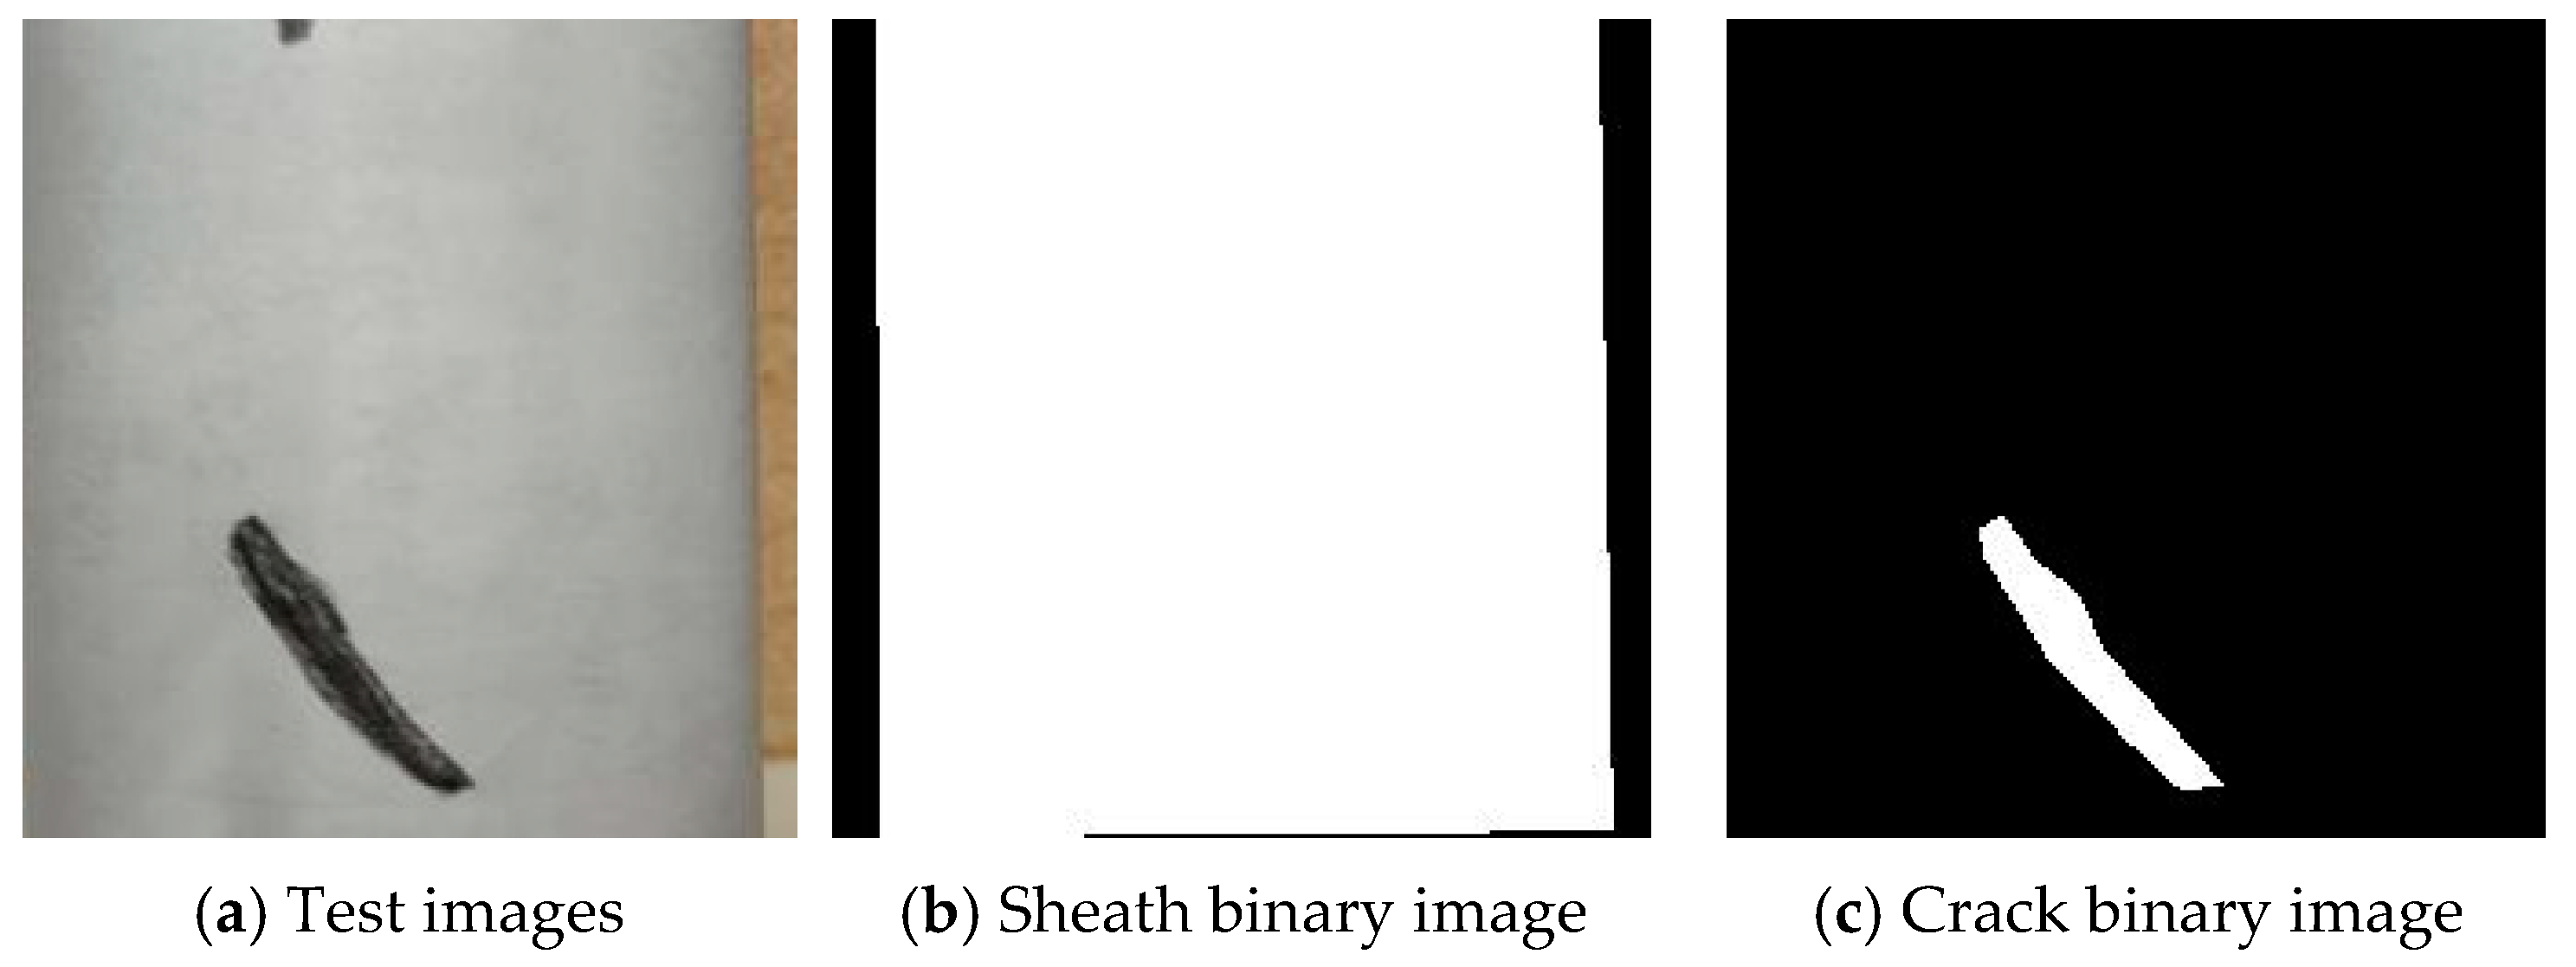
For the measurement of the actual area, A4 paper was wrapped around the surface of the sling sheath, as illustrated in Figure 8a. Subsequently, the crack area was determined using the area measurement method. Regarding the measurement of the image area, the semantic segmentation model for the sling’s apparent disease was employed to classify the pixels of the sheath image. Binary images of the sheath and the crack were then presented separately (as shown in Figure 8b,c). Finally, the measured area was obtained by calculating the image area.
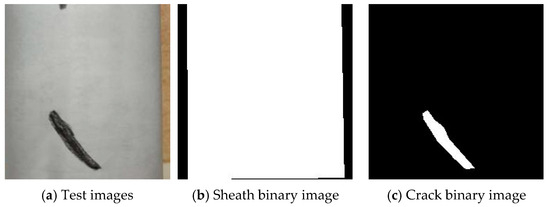
Figure 8.
Example of image semantic segmentation.
Table 3 presents the actual area, measured area, and the corrected area (measured area multiplied by the model correction coefficient) of the cracks, along with their corresponding errors. Initially, six crack images were used for measurement. To account for the impact of crack location on the recognition performance, a second set of test images was created by rotating the original six crack images by a specific angle. After measuring the 12 test images, it was discovered that the area recognition error of these test images was primarily distributed within the range of 8% and 30%. A further analysis of the classification confusion matrix of the semantic segmentation model for the sling’s apparent disease (refer to Table 1) revealed that the number of crack labels identified by the model was approximately 123% of the number of manually labelled cracks (i.e., the model identified about 1.23 times the number of crack labels compared to the manual labelling), which suggests that segmentation error of the semantic segmentation model in crack identification contributes approximately 23% to the measurement error of area. During the measurement process, the performance of the semantic segmentation model is affected by the image-taking angle (the projection and shape of the cracks may change). As the projection and shape of the cracks may vary with the angle, the model’s crack recognition performance differs across different images. This variation in performance leads to fluctuations in the measurement results, causing the error distribution to fluctuate around 23%.
Table 3.
Effectiveness of modified area measurement method of apparent disease.
To ensure that the measurement results are closer to the actual values and incorporate a certain safety margin, this paper considers the area measurement error stemming from the model’s segmentation effect by using a model correction coefficient. After conducting comparisons and corrections, the correction coefficient for the semantic segmentation model of the sling’s apparent diseases is set to 0.9 (considering a 10% safety margin, the correction coefficient is calculated as 1.1/1.2 ≈ 0.9). When the correction coefficient is set at 0.9, the area recognition error (correction error) of the test image is primarily distributed within the range of −3% and 15%, indicating that the modified area measurement method has achieved a higher level of measurement accuracy.
6. Conclusions
- (1)
- The MobileNetV2 transfer learning model was trained and tested on the sling apparent disease dataset. Subsequently, the model was evaluated using metrics of pixel accuracy (PA), category pixel accuracy (CPA), and intersection and union ratio (IoU). The pixel accuracies of the background and sheath categories exceeded 97%, suggesting that the model achieved quite satisfactory results in categorizing pixels for these two categories. However, the PA and IoU of the crack category only reached approximately 80%, indicating that there is room for further improvement.
- (2)
- Based on the projection relationship and scale ratio relationship between the sheath surface and the image plane, an area measurement method is proposed. By referring to the classification confusion matrix (Table 1) of the semantic segmentation model for the sling’s apparent diseases and considering the area measurement error, the model correction coefficient is determined. Subsequently, the model correction coefficient is applied to mitigate the influence of model errors on the identification results of the measurement method. Finally, the area measurement results are compared with the crack area obtained manually. The measurement error is predominantly distributed within the range of −3% and 15%, indicating that the area measurement method has achieved a relatively high level of measurement accuracy.
- (3)
- The proposed model successfully achieved the segmentation and quantification of the sling’s apparent diseases. Nevertheless, given the complexity and diversity inherent in engineering problems, the segmentation effect remains sub-optimal when dealing with multiple diseases simultaneously. It is necessary to collect a larger number of images for sling apparent disease detection to train the model. This approach will contribute to further enhancing the model’s performance.
- (4)
- Owing to the limited number of datasets, the model exhibits certain deficiencies in considering the impact of shooting angle, and further research is still required.
Author Contributions
Methodology, J.D.; Resources, H.L.; Investigation, Y.L., Z.X. and S.L. (Shunquan Lu); Software, Y.L. and S.L. (Sen Liu); Formal Analysis, S.L. (Shunquan Lu); Validation, Z.X.; Data curation, S.L. (Sen Liu); Supervision, H.L.; Funding acquisition, J.D.; Writing—original and final, S.L. (Shunquan Lu). All authors have read and agreed to the published version of the manuscript.
Funding
This research was funded by the National Natural Science Foundation of China (52308132) and Guangdong Provincial Department of Transportation Science and Technology Project (2024-G-05).
Data Availability Statement
The data presented in this study are available on request from the corresponding author.
Acknowledgments
The funders are gratefully acknowledged.
Conflicts of Interest
Author Haibin Liu was employed by the China Highway Engineering Consulting Corporation. Author Shunquan Lu was employed by the Fengtai Works Section, China Railway Beijing Bureau Group Corporation. The remaining authors declare that the research was conducted in the absence of any commercial or financial relationships that could be construed as a potential conflict of interest.
References
- Zhang, H.; Jiang, X.G.; Zhu, Z.W.; Xia, R.C.; Zhou, J.T. A review on intelligent recognition of apparent disease images of inclined cables. J. Southwest Jiaotong Univ. 2024, 60, 10–26. (In Chinese) [Google Scholar]
- Yan, B.; Xu, G.Y.; Luan, J.; Lin, D.; Deng, L. Pavement distress detection based on FasterR-CNN and morphological operations. China J. Highw. Transp. 2021, 34, 181–193. (In Chinese) [Google Scholar]
- Lu, H.T.; Zhang, Q.C. Applications of deep convolutional neural network in computer vision. J. Data Acquis. Process. 2016, 31, 1–17. (In Chinese) [Google Scholar]
- Huang, M.; Zhang, J.; Li, J.; Deng, Z.; Luo, J. Damage identification of steel bridge based on data augmentation and adaptive optimization neural network. Struct. Health Monit. Int. J. 2024, 1–26. [Google Scholar] [CrossRef]
- Zhang, J.W.; Huang, M.S.; Wan, N.; Deng, Z.; He, Z.; Luo, J. Missing measurement data recovery methods in structural health monitoring: The state, challenges and case study. Measurement 2024, 231, 114528. [Google Scholar] [CrossRef]
- Huang, M.S.; Wan, N.; Zhu, H.P. Reconstruction of structural acceleration response based on CNN-BiGRU with squeeze-and-excitation under environmental temperature effects. J. Civ. Struct. Health Monit. 2024, 1–19. [Google Scholar] [CrossRef]
- Shafighfard, T.; Kazemi, F.; Asgarkhani, N.; Yoo, D.Y. Machine-learning methods for estimating compressive strength of high-performance alkali-activated concrete. Eng. Appl. Artif. Intell. 2024, 136, 109053. [Google Scholar] [CrossRef]
- Zhang, L.; Yang, F.; Zhang, D.; Zhu, J. Road crack detection using deep convolutional neural network. In Proceedings of the 2016 IEEE International Conference on Image Processing (ICIP), Phoenix, AZ, USA, 25–28 September 2016; pp. 3708–3712. [Google Scholar]
- Hoang, N.-D.; Nguyen, Q.-L.; Tran, V.-D. Automatic recognition of asphalt pavement cracks using metaheuristic optimized edge detection algorithms and convolution neural network. Autom. Constr. 2018, 94, 203–213. [Google Scholar] [CrossRef]
- Dong, C.Z.; Catbas, F.N. A review of computer vision–based structural health monitoring at local and global levels. Struct. Health Monit. 2021, 20, 692–743. [Google Scholar] [CrossRef]
- Maslan, J.; Cicmanec, L. A system for the automatic detection and evaluation of the runway surface cracks obtained by unmanned aerial vehicle imagery using deep convolutional neural networks. Appl. Sci. 2023, 13, 6000. [Google Scholar] [CrossRef]
- An, H.; Liu, K.; Liang, Z.H.; Qin, M.; Huang, Y.; Guo, Z. Research review of object detection algorithms in vehicle detection. In Proceedings of the IEEE International Conference on Electrical Engineering, Big Data and Algorithms, Changchun, China, 25–27 February 2022; pp. 1337–1341. [Google Scholar]
- Li, D.J.; Li, R.H. Marker defect detection method based on improved Faster RCNN. Adv. Lasers Optoelectron. 2020, 57, 353–360. (In Chinese) [Google Scholar]
- Cha, Y.J.; Choi, W.; Suh, G.; Mahmoudkhani, S.; Büyüköztürk, O. Autonomous structural visual inspection using region-based deep learning for detecting multiple damage types. Comput.-Aided Civ. Infrastruct. Eng. 2018, 33, 731–747. [Google Scholar] [CrossRef]
- Cha, Y.J.; Choi, W.; Büyüköztürk, O. Deep learning-based crack damage detection using convolutional neural networks. Comput.-Aided Civ. Infrastruct. Eng. 2017, 32, 361–378. [Google Scholar] [CrossRef]
- Xu, D.G.; Wang, L.; Li, F. A review of research on typical target detection algorithms for deep learning. Comput. Eng. Appl. 2021, 57, 10–25. [Google Scholar]
- Liao, Y.N.; Li, W. Bridge crack detection method based on convolutional neural network. Comput. Eng. Des. 2021, 42, 2366–2372. [Google Scholar]
- Yang, C.; Chen, J.; Li, Z.; Huang, Y. Structural crack detection and recognition based on deep learning. Appl. Sci. 2021, 11, 2868. [Google Scholar] [CrossRef]
- Jiang, B.D.; An, X.Y.; Xu, S.F.; Chen, Z. Intelligent image semantic segmentation: A review through deep learning techniques for remote sensing image analysis. J. Indian Soc. Remote Sens. 2023, 51, 1865–1878. [Google Scholar] [CrossRef]
- Xu, Y.; Bao, Y.; Chen, J.; Zuo, W.; Li, H. Surface fatigue crack identification in steel box girder of bridges by a deep fusion convolutional neural network based on consumer-grade camera images. Struct. Health Monit. 2019, 18, 653–674. [Google Scholar] [CrossRef]
- Fei, Y.; Wang, K.C.P.; Zhang, A.; Chen, C.; Li, J.Q.; Liu, Y.; Yang, G.; Li, B. Pixel-level cracking detection on 3D asphalt pavement images through deep-learning-based CrackNet-V. IEEE Trans. Intell. Transp. Syst. 2019, 21, 273–284. [Google Scholar] [CrossRef]
- Chen, F.C.; Jahanshahi, M.R. NB-FCN: Real-time accurate crack detection in inspection videos using deep fully convolutional network and parametric data fusion. IEEE Trans. Instrum. Meas. 2020, 69, 5325–5334. [Google Scholar] [CrossRef]
- Fu, C.B.; Tang, X.Y.; Yang, Y.; Ruan, C.; Li, B. A survey of research progresses on instance segmentation based on deep learning. Int. Conf. Big Data Secur. 2023, 2099, 138–151. [Google Scholar] [CrossRef]
- Zhu, J.S.; Li, H. Deep learning-based segmentation and quantification of steel bridge diseases. J. Southeast Univ. 2022, 52, 516–522. (In Chinese) [Google Scholar]
- Hou, S.; Dong, B.; Wang, H.C.; Wu, G. Inspection of surface defects on stay cables using a robot and transfer learning. Autom. Constr. 2020, 119, 103382. [Google Scholar] [CrossRef]
- Lu, S.Q.; Su, H.; Xu, J.; Li, Q.; Hao, H.L.; Wei, L.Y.; Liu, S.; Du, J.S. Suspender apparent disease identification based on deep learning and voting strategy. Structures 2024, 70, 107919. [Google Scholar] [CrossRef]
- Liu, X.Y.; Huang, Y.; Xu, F.; Li, H. A lightweight convolutional neural network-based damage identification method for PE sheathing of bridge diagonal cables. J. Civ. Environ. Eng. 2022, 47, 167–178. (In Chinese) [Google Scholar]
- Zhao, X.C. Deep Learning Classic Case Analysis (Based on MATLAB); China Machine Press: Beijing, China, 2021. (In Chinese) [Google Scholar]


Disclaimer/Publisher’s Note: The statements, opinions and data contained in all publications are solely those of the individual author(s) and contributor(s) and not of MDPI and/or the editor(s). MDPI and/or the editor(s) disclaim responsibility for any injury to people or property resulting from any ideas, methods, instructions or products referred to in the content. |
© 2025 by the authors. Licensee MDPI, Basel, Switzerland. This article is an open access article distributed under the terms and conditions of the Creative Commons Attribution (CC BY) license (https://creativecommons.org/licenses/by/4.0/).