Article

Renewable Energy Integration and Energy Efficiency Enhancement for a Net-Zero-Carbon Commercial Building

Centre for Civil and Building Services Engineering (CCiBSE), School of the Built Environment and Architecture, London South Bank University, 103 Borough Road, London SE1 0AA, UK
*
Author to whom correspondence should be addressed.
Buildings 2025, 15(3), 414; https://doi.org/10.3390/buildings15030414
Submission received: 31 December 2024 / Revised: 22 January 2025 / Accepted: 26 January 2025 / Published: 28 January 2025
(This article belongs to the Section Building Energy, Physics, Environment, and Systems)

Abstract

:
Energy consumption in buildings is a major contributor to greenhouse gas emissions, primarily due to the extensive burning of fossil fuels. This study focuses on an innovatively designed building named The Clover and utilises IES-VE software (2024) to create a digital twin for the building’s performance prediction. The goal is to achieve a zero-carbon-emission building through energy-efficient strategies, including the use of air-source heat pumps and renewable energy systems for sustainable heating, cooling, and electricity. Dynamic simulations conducted with the software analyse key performance metrics, including annual heating and cooling demands, electricity consumption, carbon emissions, and renewable energy supply. The results indicate that a 53% reduction in CO2 emission is achieved when a heat pump system is applied instead of boiler and chiller systems. A total of 1243.96 MWh and 41.18 MWh of electricity can be generated by PV panels and wind energy systems. The net annual electricity generation from the energy system of the building is 191.64 MWh. Therefore, the results demonstrate that the building’s energy needs can be successfully met through on-site electricity generation using advanced perovskite–silicon tandem solar PV panels and wind turbines. This case study provides valuable insights for architects and building services engineers, offering a practical framework for designing green, energy-efficient, zero-carbon buildings and advancing the path to net zero.

1. Introduction

In today’s world, the continuous rise in energy demand, increasing carbon emissions, and reliance on non-renewable resources significantly elevate health, environmental, and economic risks [1]. Globally, energy consumption in buildings accounts for 16–50% of overall energy use [2], highlighting the critical importance of effective energy management in this sector. The pressing need to mitigate climate change has heightened the focus on reducing carbon emissions and improving energy efficiency in the built environment. The 2016 Paris Agreement established an ambitious goal of limiting the annual global ambient temperature increase to less than 1.5 K. Achieving this target requires a 45% reduction in global emissions from the 2010 levels by 2030 and reaching net-zero emissions by 2050 [3]. This will necessitate substantial cuts in global CO2 emissions alongside active measures to remove CO2 from the atmosphere. Therefore, this underscores the need for architects and decision-makers to prioritise sustainable and energy-efficient designs from the very outset of the planning process.
To reduce the reliance on non-renewable sources of energy, researchers have investigated the concept of passive design. A passive design approach can be implemented as a cost-effective strategy to reduce building energy consumption without a significant reliance on mechanical systems. Passive design strategies are design approaches that use natural environmental elements to achieve optimal indoor thermal comfort and lighting for buildings [4]. Thermal insulation, green roofs, green walls, shading, advanced glazing systems, natural ventilation, evaporative cooling, building shape and orientation optimisation, phase-change materials (PCMs), and Trombe walls are among the most extensively studied and widely adopted passive design strategies [5]. Natural ventilation and daylighting offer effective solutions for reducing energy consumption in buildings. Daylight, an abundant and renewable natural resource, not only reduces energy use but also enhances occupant health and productivity. Proper daylighting design improves illumination quality while lowering energy costs. Numerous strategies for incorporating and optimising daylighting in buildings have been developed and evaluated, as documented in various studies and publications [6,7,8]. Moreover, using glass for building façades, along with insulating roofing and walling materials, is an effective passive design strategy for reducing a building’s energy demand [9,10,11,12].
In addition to the development of passive design strategies, net-zero-carbon buildings have been gaining increasing attention. The concept of net-zero-carbon buildings has emerged as a pivotal solution to address the challenge of carbon emissions, defined by their ability to balance operational energy consumption with on-site renewable energy generation. Previous studies have demonstrated the feasibility of integrating renewable energy systems into building designs to achieve net-zero emissions. Ng et al. [13] demonstrated that Hong Kong’s “Zero-Carbon Building” successfully offset both operational and embodied carbon emissions over its 50-year lifespan through extensive on-site renewable energy generation. Aksamija [14] examined the feasibility of achieving net-zero operating energy in existing commercial buildings by enhancing envelope insulation, upgrading lighting and air conditioning systems, and incorporating renewable energy technologies such as PV panels, wind turbines, and biomass boilers. The research findings indicate that this commercial building can achieve net-zero energy use through targeted design modifications and the integration of multiple renewable energy sources. A study was developed by Rabani et al. [15] in which an optimisation method combining energy simulation and advanced controls was used to retrofit a typical office building in Norway towards nearly zero-energy-building status, achieving an up to 77% energy reduction while improving thermal and visual comfort through integrated PV panels and optimised shading and window controls. More case studies on building-integrated solar energy systems are summarised in Table 1.
The energy generation potential and technical feasibility of siting wind turbines in the built environment have been comprehensively assessed [22]. An example of a building-integrated wind turbine system is the 50-storey Bahrain World Trade Center (BWTC) in Manama, Bahrain. Completed in 2008, the BWTC comprises two 280 m sail-shaped towers connected by three bridges, each housing a horizontal-axis wind turbine (HAWT) with a diameter of 29 m and a capacity of 225 kW each. According to the designers, these turbines can generate 1.1–1.3 GWh annually, meeting approximately 11–15% of the building’s yearly energy demand [23]. On the other hand, vertical-axis wind turbines (VAWTs) are of the cross-flow type [24]. Compared to HAWTs, VAWTs are better suited for installation in urban areas with slow and turbulent wind conditions, as they can generate power even at low wind speeds. Additionally, VAWTs operate more quietly than HAWTs [25]. More case studies on building-integrated wind turbine systems are summarised in Table 2.
The annual operating and maintenance cost of VAWTs was anticipated to be slightly lower than that of HAWTs [33]. Furthermore, comparisons between the use of HAWTs and VAWTs in hybrid renewable energy systems have been conducted. The results showed that systems incorporating HAWTs achieved a cost of energy of 0.02 USD/kWh, a net present cost (NPC) of 85,905 USD, and a total system cost of 332,240 USD. In contrast, systems using VAWTs had higher values, with a COE of 0.06 USD/kWh, an NPC of 129,932 USD, and a total system cost of 502,511 USD [34]. It was concluded that HAWTs were more cost-effective and efficient for electrifying rural areas. However, the adoption of renewable energy technologies in commercial buildings continues to face several challenges. One of the primary barriers is the high upfront costs associated with retrofitting existing buildings or constructing new ones equipped with renewable energy systems, despite the potential for long-term savings. While renewable electricity has been rapidly integrated into buildings, the adoption of renewable thermal technologies, such as bioenergy, solar thermal, and geothermal technologies, has progressed at a slower pace [35].
In optimising energy performance and predicting the long-term environmental impacts of buildings, building modelling software ensures a proactive approach to designing sustainable, energy-efficient buildings, reducing reliance on trial-and-error methods and costly post-construction modifications. IES-VE is a comprehensive software platform offering various modules designed to address key aspects of building simulations, including heating, ventilation, and air conditioning (HVAC), daylighting, energy analysis, flow dynamics, and thermal performance assessment. Due to its versatility and accuracy, IES-VE is widely preferred by researchers for conducting energy and thermal simulation studies [36]. Lau et al. [37] investigated the cooling energy savings potential of various shading devices and glazing configurations for high-rise office buildings in Malaysia’s hot–humid climate using IES-VE simulations. The results show that shading devices, particularly egg-crate designs, are more effective for low-performance glazing, with annual cooling energy savings ranging from 1.0% to 10.4% depending on orientation and glazing type, emphasising the importance of shading for east and west façades. Alnaqbi et al. [38] investigated the energy-saving potential of green roofs as a retrofitting technique for residential houses in the UAE by using IES-VE, showing that green roofs can reduce cooling loads by 6% in the winter and 12% in the summer through evaporative cooling and soil insulation effects.
Despite the growing body of research on net-zero-energy buildings, significant gaps remain in understanding the integration of renewable energy systems in mid-rise office buildings, particularly in real-world commercial contexts. Existing studies tend to focus on individual technologies, such as PV panels or wind turbines, often neglecting the complex interactions and synergistic benefits that arise from combining multiple renewable energy systems. Furthermore, limited research explores the practical feasibility of such integrations in mid-rise commercial buildings, which have unique energy demand profiles and structural constraints compared to residential or high-rise buildings. This research addresses these gaps by focusing on the comprehensive integration of PV panels, wind turbines, and heat pumps in a mid-rise office building, tailored to the operational requirements and energy dynamics of commercial spaces. Through dynamic simulations conducted on IES-VE, this study examines critical performance metrics, including annual heating and cooling demand, electricity consumption, carbon emissions, and renewable energy supply. Unlike existing research, this work emphasises the combined efficiency and environmental benefits of these systems, offering practical design strategies that can be applied to similar commercial projects. The findings aim to provide actionable insights for architects, engineers, and decision-makers in the commercial building sector, contributing to a broader understanding of how integrated renewable systems can achieve net-zero-energy targets. This approach not only advances academic knowledge but also delivers a scalable and replicable model for reducing the carbon footprint of mid-rise commercial buildings while addressing growing energy demands and regulatory pressures for sustainability. Below are the key points highlighted in each section:
  • Section 2 provides a detailed description of the proposed building and outlines the assumptions used for dynamic modelling;
  • Section 3 outlines the methodology employed in the dynamic modelling, encompassing weather data, thermal comfort settings, building materials, the HVAC system, PV panels, and wind turbines;
  • Section 4 presents the results of the simulations, analysing solar energy, CO2 emissions, the annual space heating and cooling demand, the annual electricity demand, wind-generated electricity, and PV-generated electricity. Additionally, a comparison between the total electricity demand and on-site electricity generation is conducted;
  • Section 5 summarises the key outcomes achieved from the dynamic simulations, highlighting the critical findings and insights derived from the analysis.

2. Overview of the Building and Assumptions

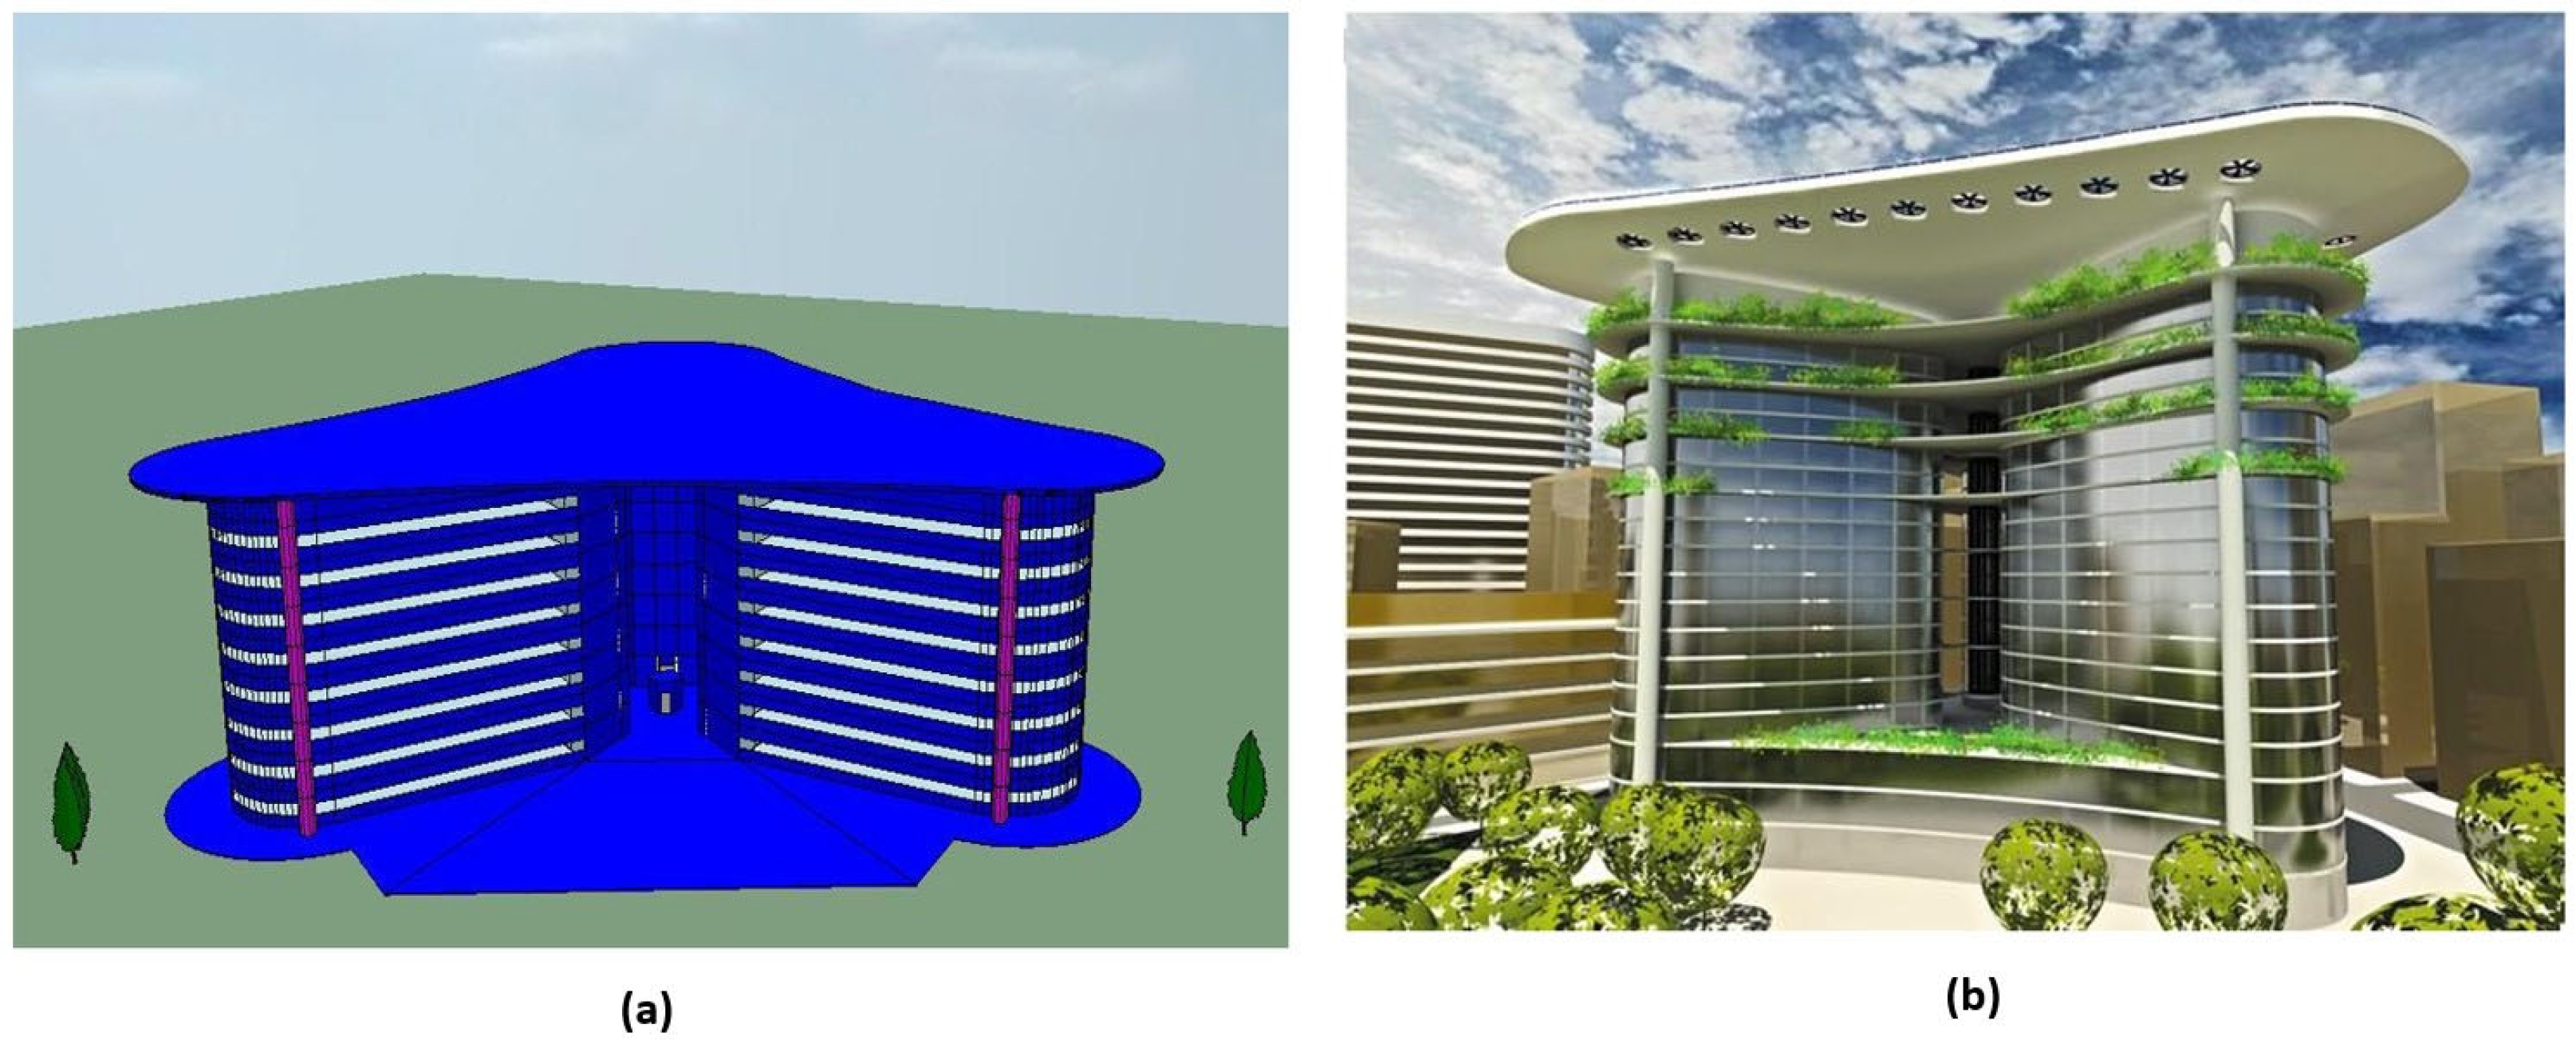
2.1. Description of the Building

A Ground (G) + 7 storey building named “The Clover” designed by Elemental Flow Towers (EFT) was proposed to investigate and execute innovative techniques to reach the target of zero carbon emissions. The Clover is a three-winged building, with its name inspired by the cloverleaf due to its distinctive shape. The total usable floor area spans approximately 13,300 m2. Originally designed as a four-winged structure, the layout was revised to a three-winged configuration to enhance occupant experience. This design ensures unobstructed views of the surrounding ambience, fostering a more people-friendly environment. The building has a ground level and seven additional floors, with each wing having a dedicated entry point for enhanced security. Below ground, a single level is allocated for car parking. The rooftop, located above the seventh floor, serves a dual purpose: it houses heat pumps and accommodates a large roof area of approximately 5460 m2 for solar photovoltaic panels. Additionally, building-integrated photovoltaic panels (BIPVs) will be installed on the exterior wall panels. The central space between the three wings is designated for the installation of VAWTs. Figure 1 illustrates the IES-VE building model of The Clover. Additionally, the ground level features a landscaping design incorporating panels of diverse grasses and shrubs. These green elements function as natural carbon dioxide sinks while also leveraging their ecological properties to provide cooling for the roof of the underground floor.

2.2. Design Assumptions

Before the design basis for this building was established, several key assumptions and considerations were made, as outlined below:
  • The selection of a location is explained in detail in Section 3.1. Though the location of the building eventually selected is outside of the UK, the design standards are taken from CIBSE Guides, UK National Calculation Methodology (NCM) templates, The Building Regulations 2010 Conservation of fuel and power Approved Document Part L Volume 2—Buildings other than dwellings, The Building Regulations 2010 Ventilation Approved Document Part F Volume 2—Buildings other than dwellings, the HM Government Non-Domestic Building Services Compliance Guide, etc;
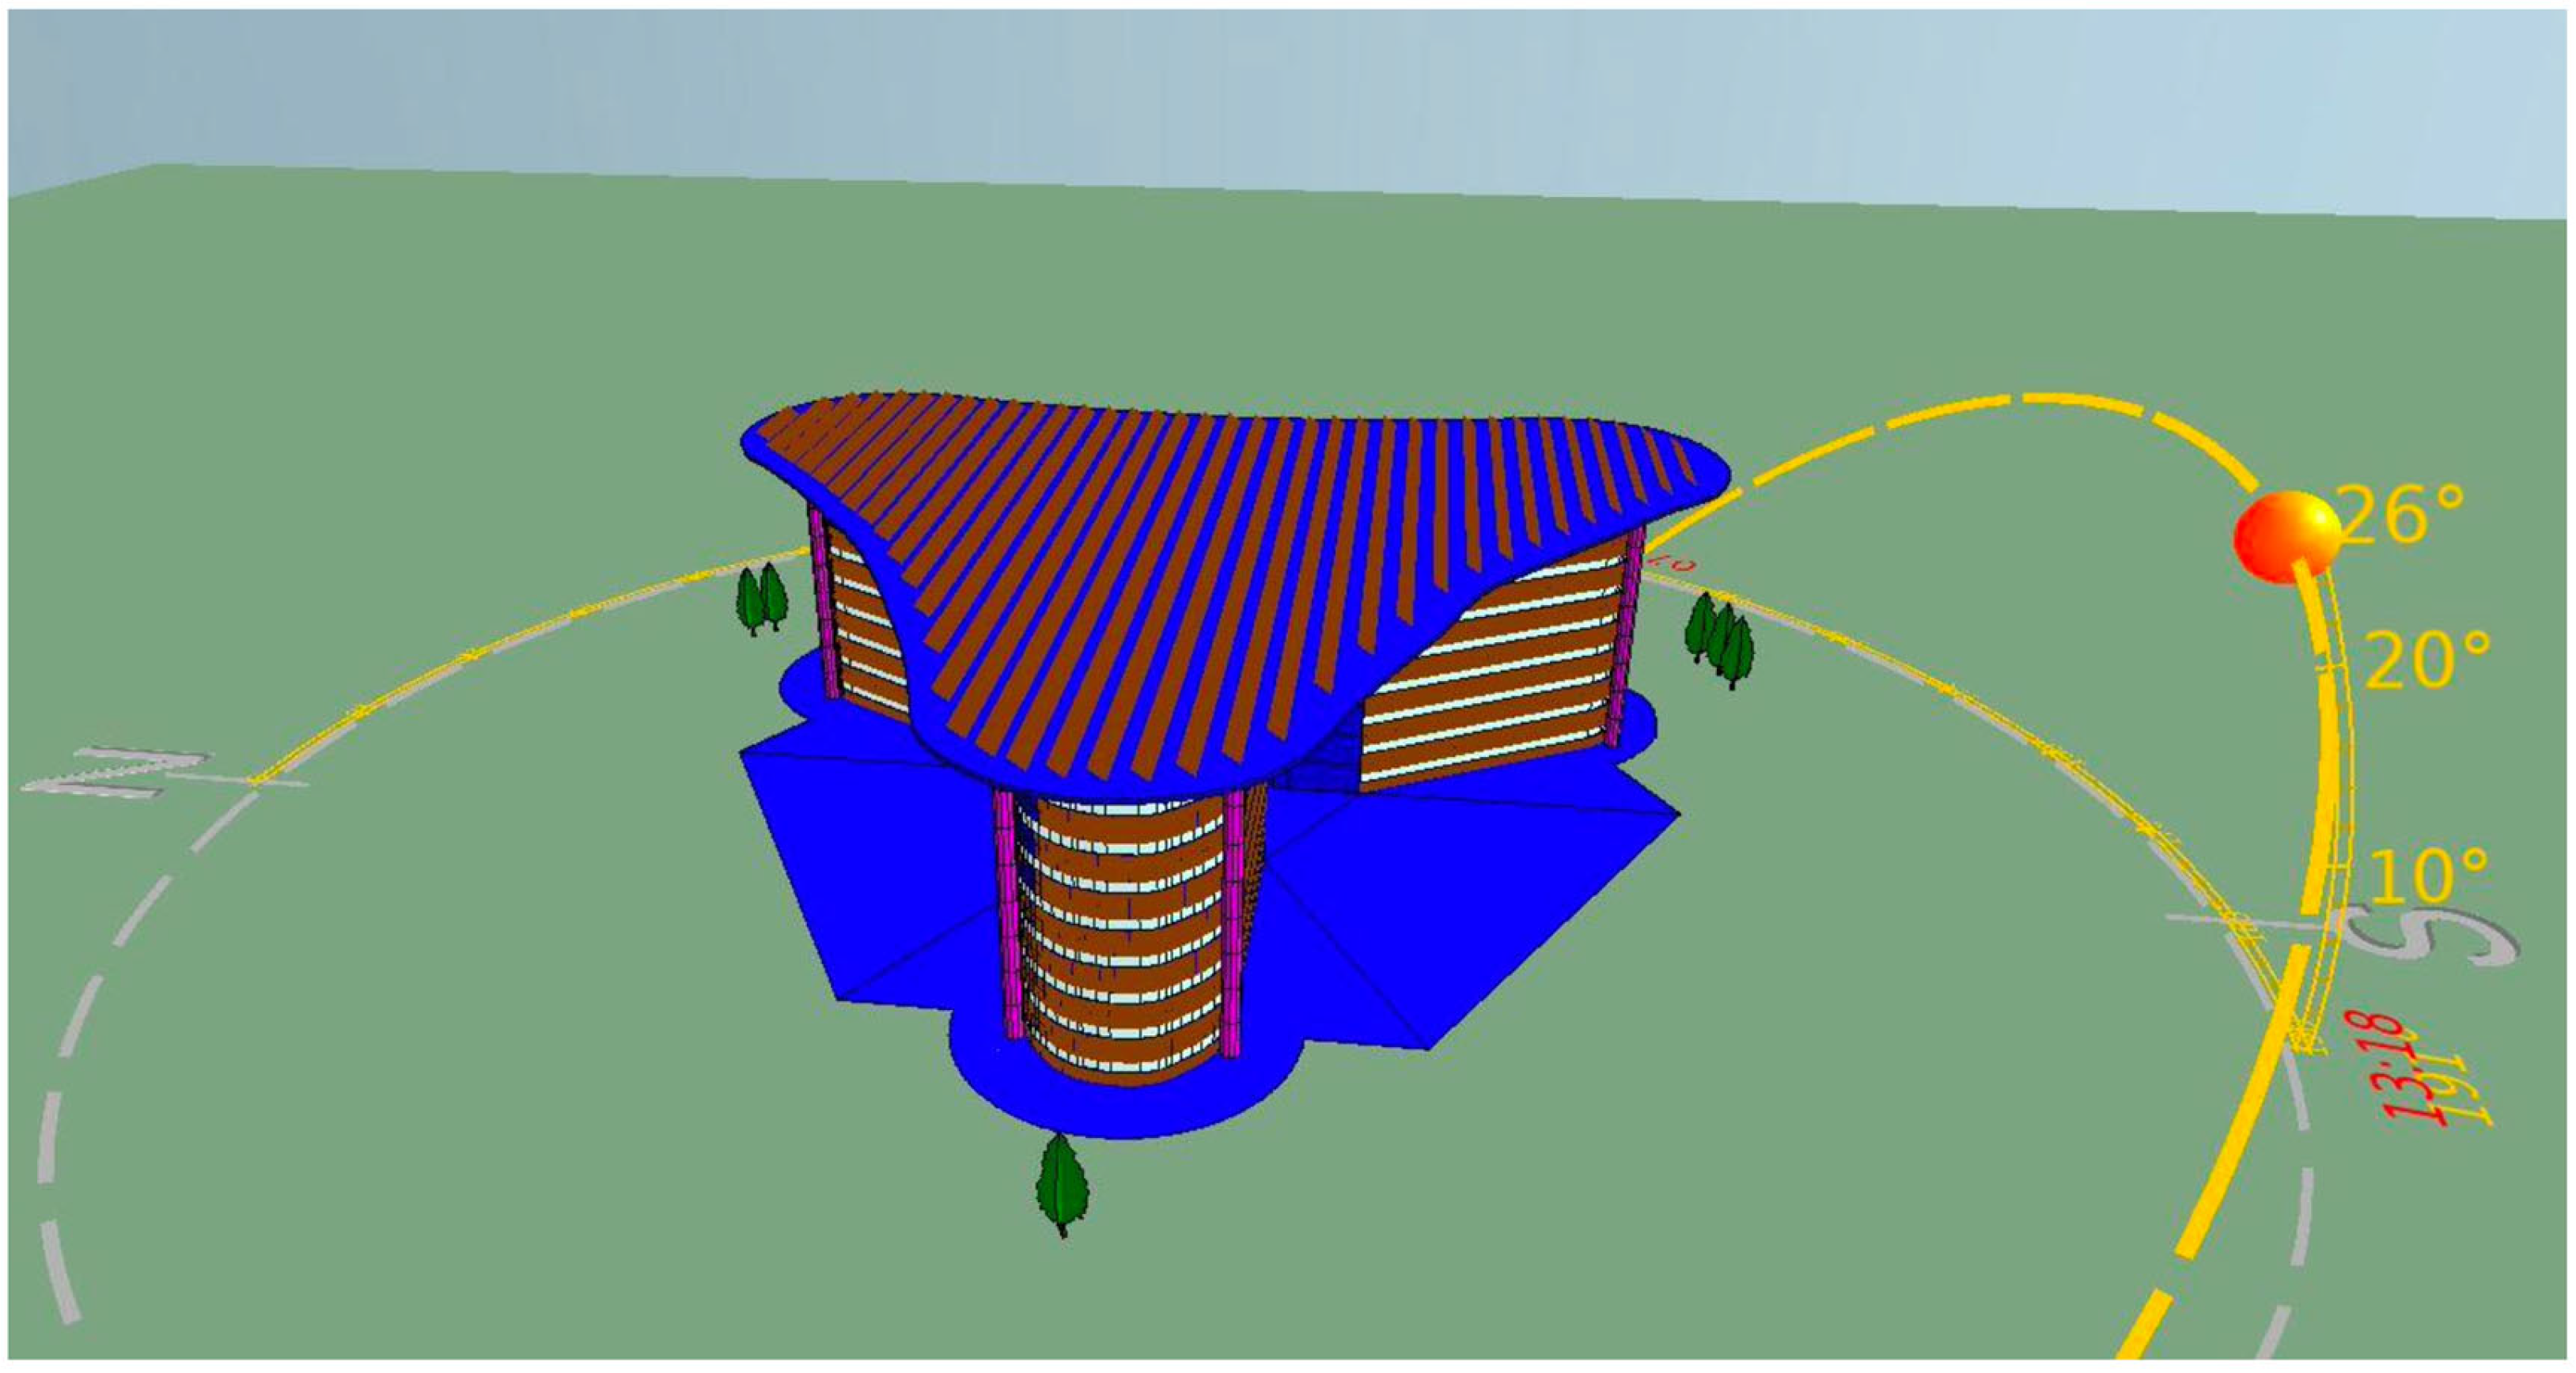
  • As the building is still not built and is in the conceptual stage, the orientation of the building is assumed to be as illustrated in Figure 2;
  • No adjacent/shading buildings are considered for the analysis of the Clover building model, since the goal of this study was to establish a baseline performance for the proposed design;
  • Domestic hot water is not considered in this research due to its relatively small contribution to the overall energy demand in commercial buildings, unlike in residential buildings, where domestic hot water typically accounts for a significant portion of energy use.

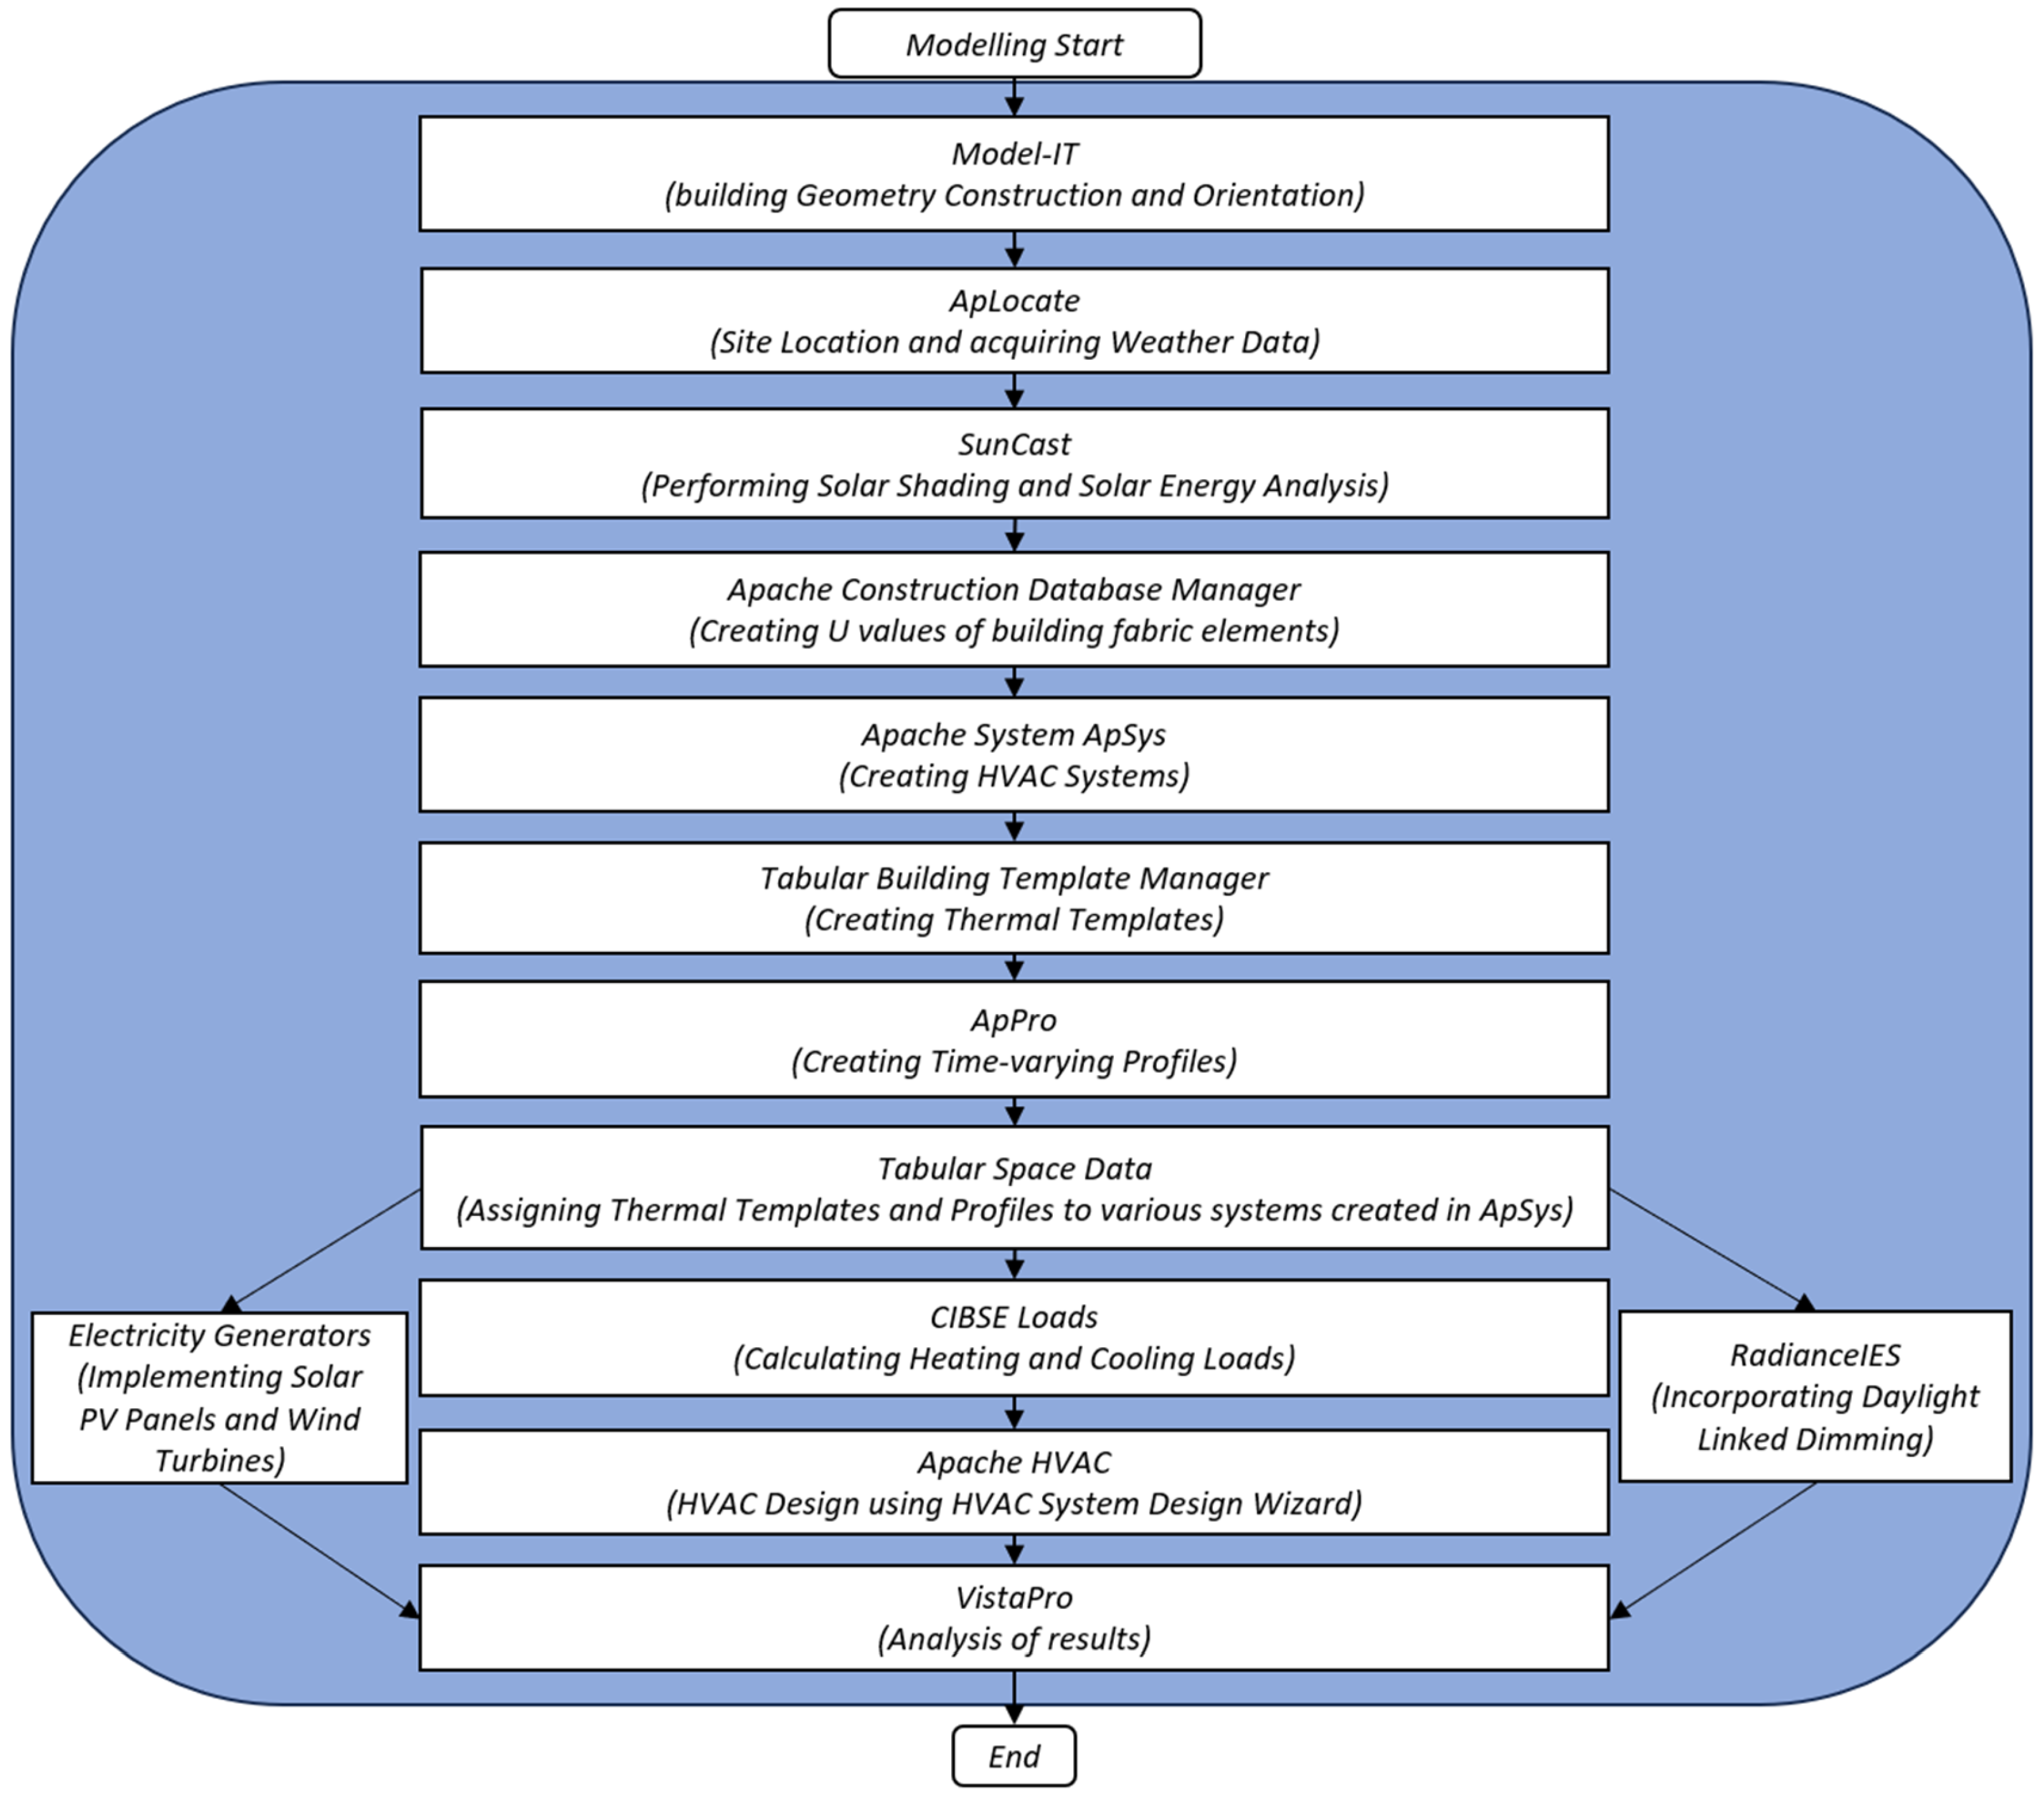
3. Methodology of the Dynamic Thermal Model
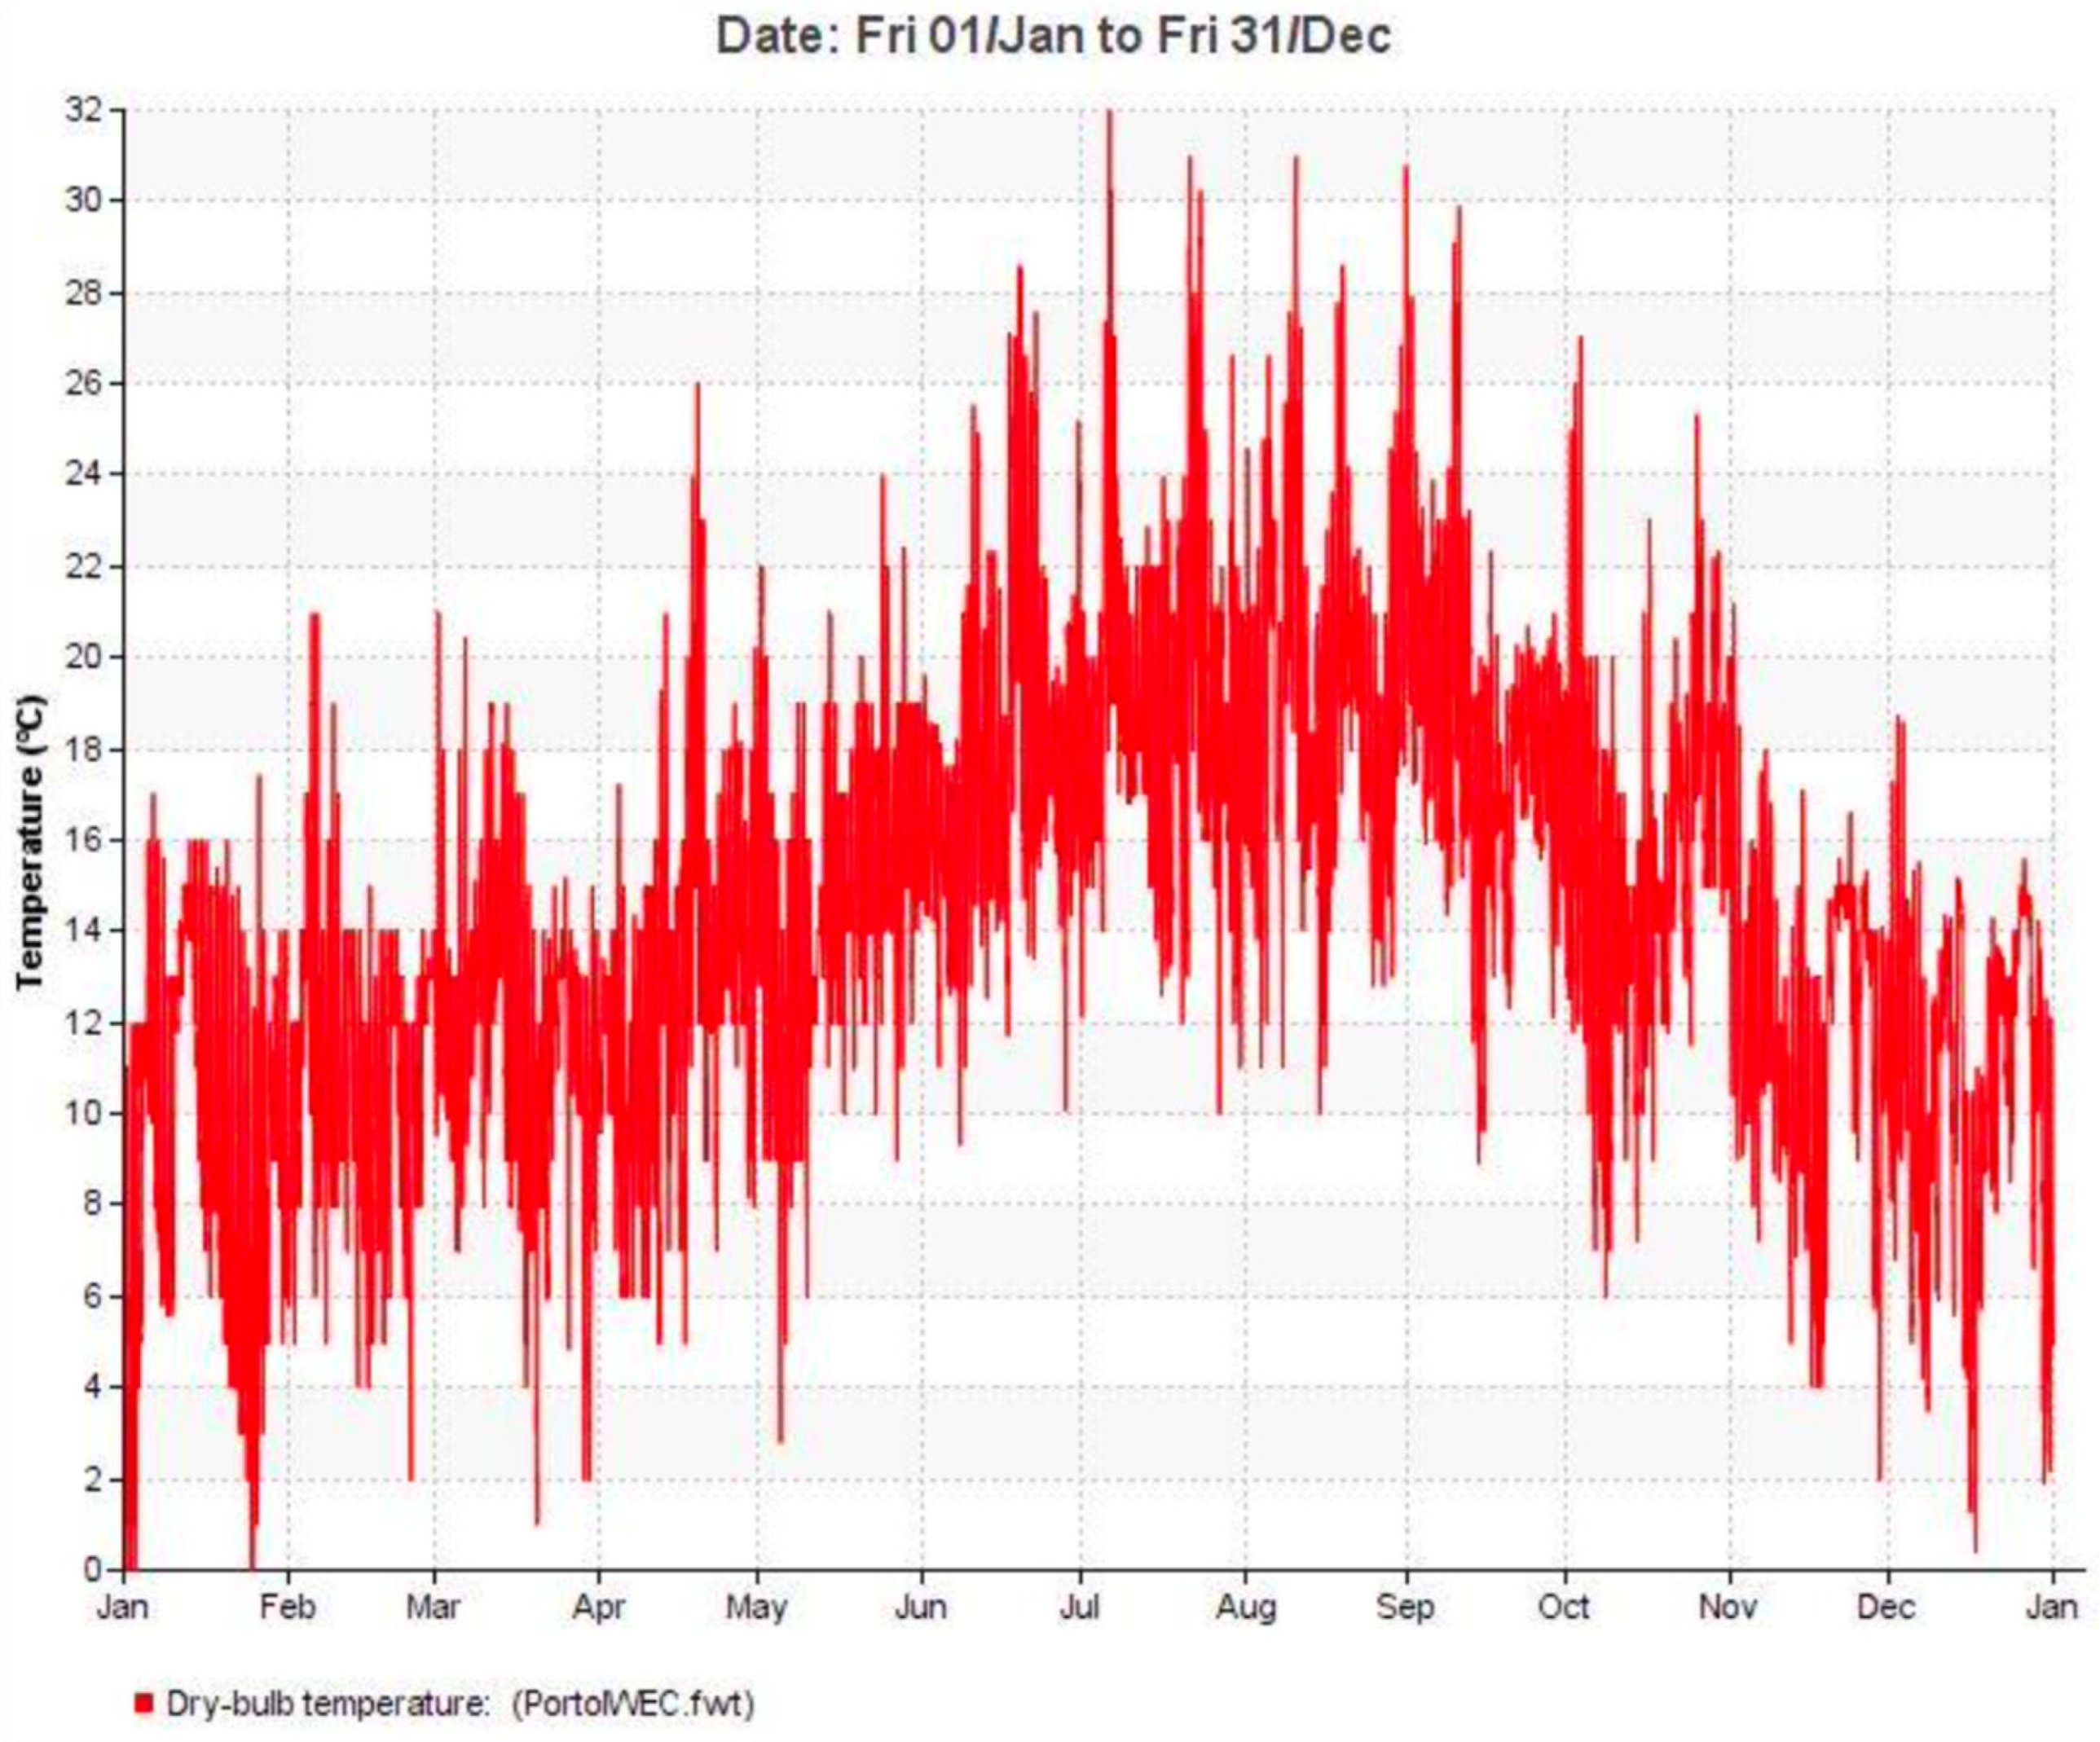
IES-VE is a globally recognised suite of integrated analysis tools used by building design experts. It facilitates the design and optimisation of buildings by providing advanced simulation capabilities. IES-VE enables the comprehensive analysis of various aspects, including annual energy consumption and daylighting conditions, for a given building. The software provides a comprehensive environment for evaluating building and system designs, allowing them to be optimised to meet comfort requirements while minimising energy consumption [39]. The software will incorporate key factors such as weather data, the optimisation of building material properties, passive design strategies like natural daylight utilisation, occupant behaviour, building operational profiles, and the integration of renewable energy systems, including solar and wind power. Through dynamic simulations, the software will analyse critical performance metrics, including annual heating and cooling demands, electricity consumption, carbon emissions, and the contribution from renewable energy sources. Figure 3 shows a flow chart of IES-VE modelling and analysis.

3.1. Weather Data

The site location was determined using ApLocate, 2024. Once the site location was selected, the weather data of the selected location were acquired through the ASHRAE database. London is, however, not an especially sunny location, which is relevant considering that the majority of the energy is to be generated from solar. Hence, the location of the building was decided based on where the sun is more vertical. In addition to this, it was important to analyse coastal locations with high wind speeds as wind turbines are also used to generate energy. Different locations were compared in terms of solar insolation on giant roofs and annual average wind speed, as shown in Table 3. Doha stands out for its high incident solar energy intensity but experiences extremely hot weather, resulting in significant cooling demands, along with high average wind speeds. In contrast, Singapore, Alicante, and Catania also receive high solar insolation but have relatively low annual average wind speeds. Between Perpignan and Peniche, Peniche benefits from both higher solar energy intensity and greater annual average wind speeds. Therefore, Peniche in Portugal was chosen as the ideal location due to its higher solar energy intensity and favourable annual average wind speeds. Additionally, its moderate temperatures throughout the year make it well suited for maximising the efficiency and benefits of renewable energy technologies. Figure 4 depicts the external dry bulb temperatures across the year in “Porto”, which was chosen as the nearest weather simulation location for this project. It can be seen that the winter temperatures are quite moderate, mostly in the range of 12 to 16 °C with occasional drops to 0 °C. On the other hand, the summer months see temperatures of around 20 to 22 °C most of the time, which occasionally rise to as high as 32 °C. Overall, the city experiences quite average temperatures, with neither harsh winters nor hot summers. Figure 5 illustrates the annual wind speed profile for “Porto”. It can be observed that the average wind speeds from October to May are very well above 4 m/s, whereas the mean wind speeds for the remaining four months are around 3 m/s. On average, the city has decent wind speeds annually, which is beneficial as far as generating electricity from wind generators is concerned.
A detailed summary of the building, location, daylight savings considerations, site, and design weather data is expressed in Table 4.

3.2. Thermal Comfort Model

The key factors affecting thermal comfort are those that influence heat gain and heat loss, such as metabolic rate, clothing insulation, air temperature, mean radiant temperature, airflow rate, and relative humidity. The thermal comfort temperature can vary significantly between individuals, depending on factors like activity level, clothing, and humidity, among others. The thermal comfort parameters considered in this study were air temperature, radiant temperature, relative humidity, air velocity, clothing insulation, and metabolic heat.

3.2.1. Operative Temperature and Humidity

Thermal comfort is generally considered the most important output of any design process. It is the primary outcome that the majority of clients care about, not the specifics of the heating or cooling system. Their main concern is how the building services design can ensure comfortable internal conditions that would enable their businesses to work effectively and efficiently. Ultimately, thermal comfort is about how people react to the thermal environment [40]. Occupants lose heat to a room through convection, radiation, and evaporation. For a heating system, heat loss through evaporation is not an issue as the heating system typically addresses the sensible heat loss in the room. This gave rise to the comfort temperature index, also known as the operative temperature (θc), defined by CIBSE as
θ c = θ a i + θ r 2
where θai and θr are the room air temperatures and room mean radiant temperatures, respectively. Thus, the operative temperature is the average of the room air and mean radiant air temperatures.
For the open office and lift lobby, winter and summer operative temperatures are 21 °C and 23 °C, respectively. The minimum relative humidity and maximum relative humidity are 40% and 60% each. For the toilet, the winter operative temperature is 19 °C. All selections are based on CIBSE Guide A. Controlling HVAC systems based on operative temperature significantly improves thermal comfort, particularly in warmer climates. However, this comes at the cost of increased energy usage (13–14%), demonstrating a trade-off between comfort and energy efficiency [41].

3.2.2. Internal Gains

Internal heat gains significantly impact cooling load calculations for any space. These gains originate from various sources, including occupancy, lighting, equipment, and appliances. The office operation hours considered were from 7 am to 7 pm. Time-varying profiles were set up, respectively. Additionally, the activity level within the space plays a critical role, as human metabolism varies with the type of activity performed. Humans emit sensible heat, which influences temperature, and latent heat, which affects humidity levels in the space [42]. Occupancy is primarily considered in open office areas; detailed parameters are shown in Table 5, as these spaces are actively populated, while other areas experience only passive occupant movement.

3.2.3. Air Exchange Rates

Introducing fresh air into indoor spaces is crucial for maintaining a healthy and comfortable environment. Fresh air helps to dilute indoor pollutants, such as carbon dioxide, volatile organic compounds (VOCs), and other contaminants that can accumulate due to activities, materials, and equipment. Proper ventilation improves air quality, reducing the risk of respiratory issues and enhancing overall well-being. Additionally, fresh air helps regulate indoor temperature and humidity levels, contributing to thermal comfort. In spaces with high occupancy, such as offices or classrooms, fresh air replenishment is essential to prevent the buildup of odours and ensure optimal oxygen levels, which can improve concentration and productivity. The infiltration rate based on permeability is assumed to be 0.25 air changes per hour (ACH) in all spaces. The auxiliary ventilation airflow rates for open offices, toilets, and car park garages are 1 L/s-m2, 6 ACH, and 6 ACH, respectively [43].

3.2.4. Metabolic Rates and Clothing Insulation

Human beings dissipate heat into space as per the activity level performed by them, and this is expressed in terms of “metabolic rate (met)”. The heat transfer from bodies depends on the types of clothes worn by the occupants, and this is termed the insulation of clothing, denoted in terms of “clothing insulation (clo)”. The met and clo for the open office are set as 1.2 and 0.9, while for the lift lobby, the values are 1.4 and 1.0.

3.3. Building Materials

Apache is a graphical user interface application within IES-VE. Its features allow users to modify the construction type and associated properties in the dynamic model, as well as generate building load calculations, including energy usage, heating, and cooling loads. The database used in Apache contains the current building regulation construction properties from CIBSE and ASHRAE. This database is tailored for each building element, such as glazing, external and internal walls, doors, roofs, skylights, and partition walls. The properties of each element can be viewed and edited, as shown in Table 6.

3.4. HVAC System

The HVAC design is modelled by integrating the heat pump into the building model using the Apache HVAC tool, 2024. In the dedicated outside air system (DOAS), air handling units (AHUs) are typically designed to filter, cool, and dehumidify air. Overhead air distribution systems are intended to mix the air in the space. Three identical reversible air-to-water heat pumps (“Trane” brand) were selected, each with a gross cooling capacity of 309.17 kW and a heating capacity of 254.82 kW, with one heat pump assigned to each wing. Additionally, the refrigerant used is R454B, which is considered a potential substitute for the traditionally used R410A, set to be phased out by 2025. R454B has a significantly lower Global Warming Potential (GWP) of 466, compared to the much higher GWP of 2088 for R410A. Furthermore, R454B offers advantages over R410A in terms of environmental impact and energy efficiency [44]. It is worth noting that the gross COP/EER values are 2.61 and 2.42, respectively, for the designed outside air dry bulb temperature (−4 °C/35 °C) when the heat pump runs at 100% load. For the dynamic analysis of the ASHP concerning the fluctuating temperatures, these COP and EER values were introduced in the heat pump model in the Apache HVAC tool. These COP and EER values are significant in determining the energy consumption of the building.

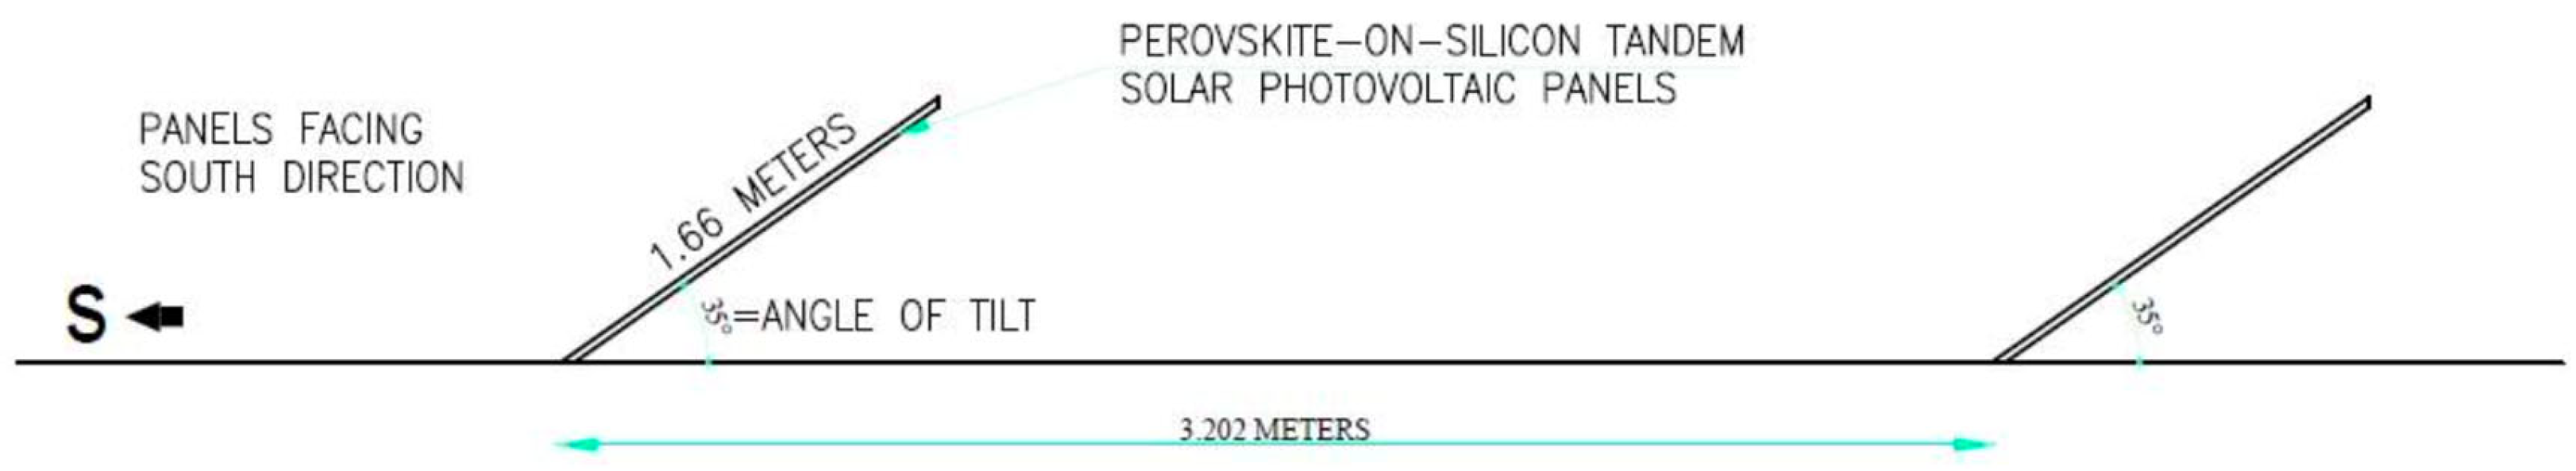
3.5. Photovoltaic Panels and Wind Turbines

The photovoltaic panels and wind turbines can be integrated into the building model using the “Electricity Generators” feature in Apache. Simulations can then be run to calculate the electricity generated by the PV panels and wind turbines, as well as the CO2 emissions offset by these renewable sources. For the PV panels, the “Oxford PV” brand was selected, as this brand is among the leading manufacturers of perovskite-on-silicon tandem solar cell technology. It is expected that a 1.68 m2 silicon–perovskite tandem PV panel delivers an output of 421 Watts, which translates into a power density of 0.25 KWdc/m2. These values are applied in IES-VE for simulating PV panel performance. As shown in Figure 6, the width of the panels is considered to be 1.66 m, with the optimum angle of tilt for the nearest weather simulation location of “Porto” set to 35°, which depends on the latitude of the site location. The module spacing distance of 3.202 m between the two arrays of panels is calculated using the EasySolar Shade Calculator, 2021 [45]. Considering the optimum tilt angle and module spacing distance, the PV panels were placed on the roof facing south, as depicted in Figure 7. The sun’s elevation angle at solar noon on the shortest day of the year for the building location is 26° as per the simulations run in IES-VE, which is very close to the value obtained through the EasySolar Shade Calculator. A clearance of 2 m is kept near the roof edges, allowing people to walk through them for maintenance purposes.
For the vertical-axis wind turbines, the “Ecorote” brand was chosen due to its simple design, compact size, high efficiency (42% in converting wind energy into electricity), quieter operation, low maintenance, and low starting speeds. It was expected, based on the manufacturer’s catalogue for the ECOROTE 9800 model, that 28,749.2 KWh is yielded annually at an annual average wind speed of 6.3 m/s. The turbine height is 5.6 m. The power generated at the original wind speeds was taken from the manufacturer’s catalogue. These wind speeds were then multiplied by 1.285 to obtain the compressed wind speeds at the building’s centre. The resulting power generation at compressed wind speeds was determined through interpolation between the wind speed values and their corresponding power output values as listed in the manufacturer’s catalogue. Since VAWTs of the same model were used for all four units, the power output from four such turbine units could be derived by multiplying the power output from a single turbine by four. The power output fraction was then computed, which is the ratio of the power generated by turbine units at a particular wind speed to the maximum power output capacity of these units. The maximum power output capacity was calculated to be 53.672 kW. The power output fraction curve is shown in Figure 8, which is correlated with Equation (2).
f p = 0                   i f   v < 1 0.00114 v 3 0.00186 v 2 + 0.00080 v + 0.00014       i f   1 v 10 1                i f   v > 10
Additionally, the Radiance IES tool was used to incorporate daylight-linked dimming in the office spaces, helping to reduce lighting loads. The positioning of the daylight sensors is shown in Figure 9. Five sensors are positioned at a working plane height of 0.7 m above the ground and are placed 1.5 m away from the window in each open office.

4. Results

4.1. Validation of Internal Heat Gains

These dynamic simulations have been validated in terms of internal heat gains to ensure that they align with their setpoint values or defined profiles. The sensible internal heat gain values, as shown in the graphs in Figure 10, correspond with the setpoint values calculated in Table 7. Therefore, this dynamic model has been successfully validated, and the final results can be interpreted.

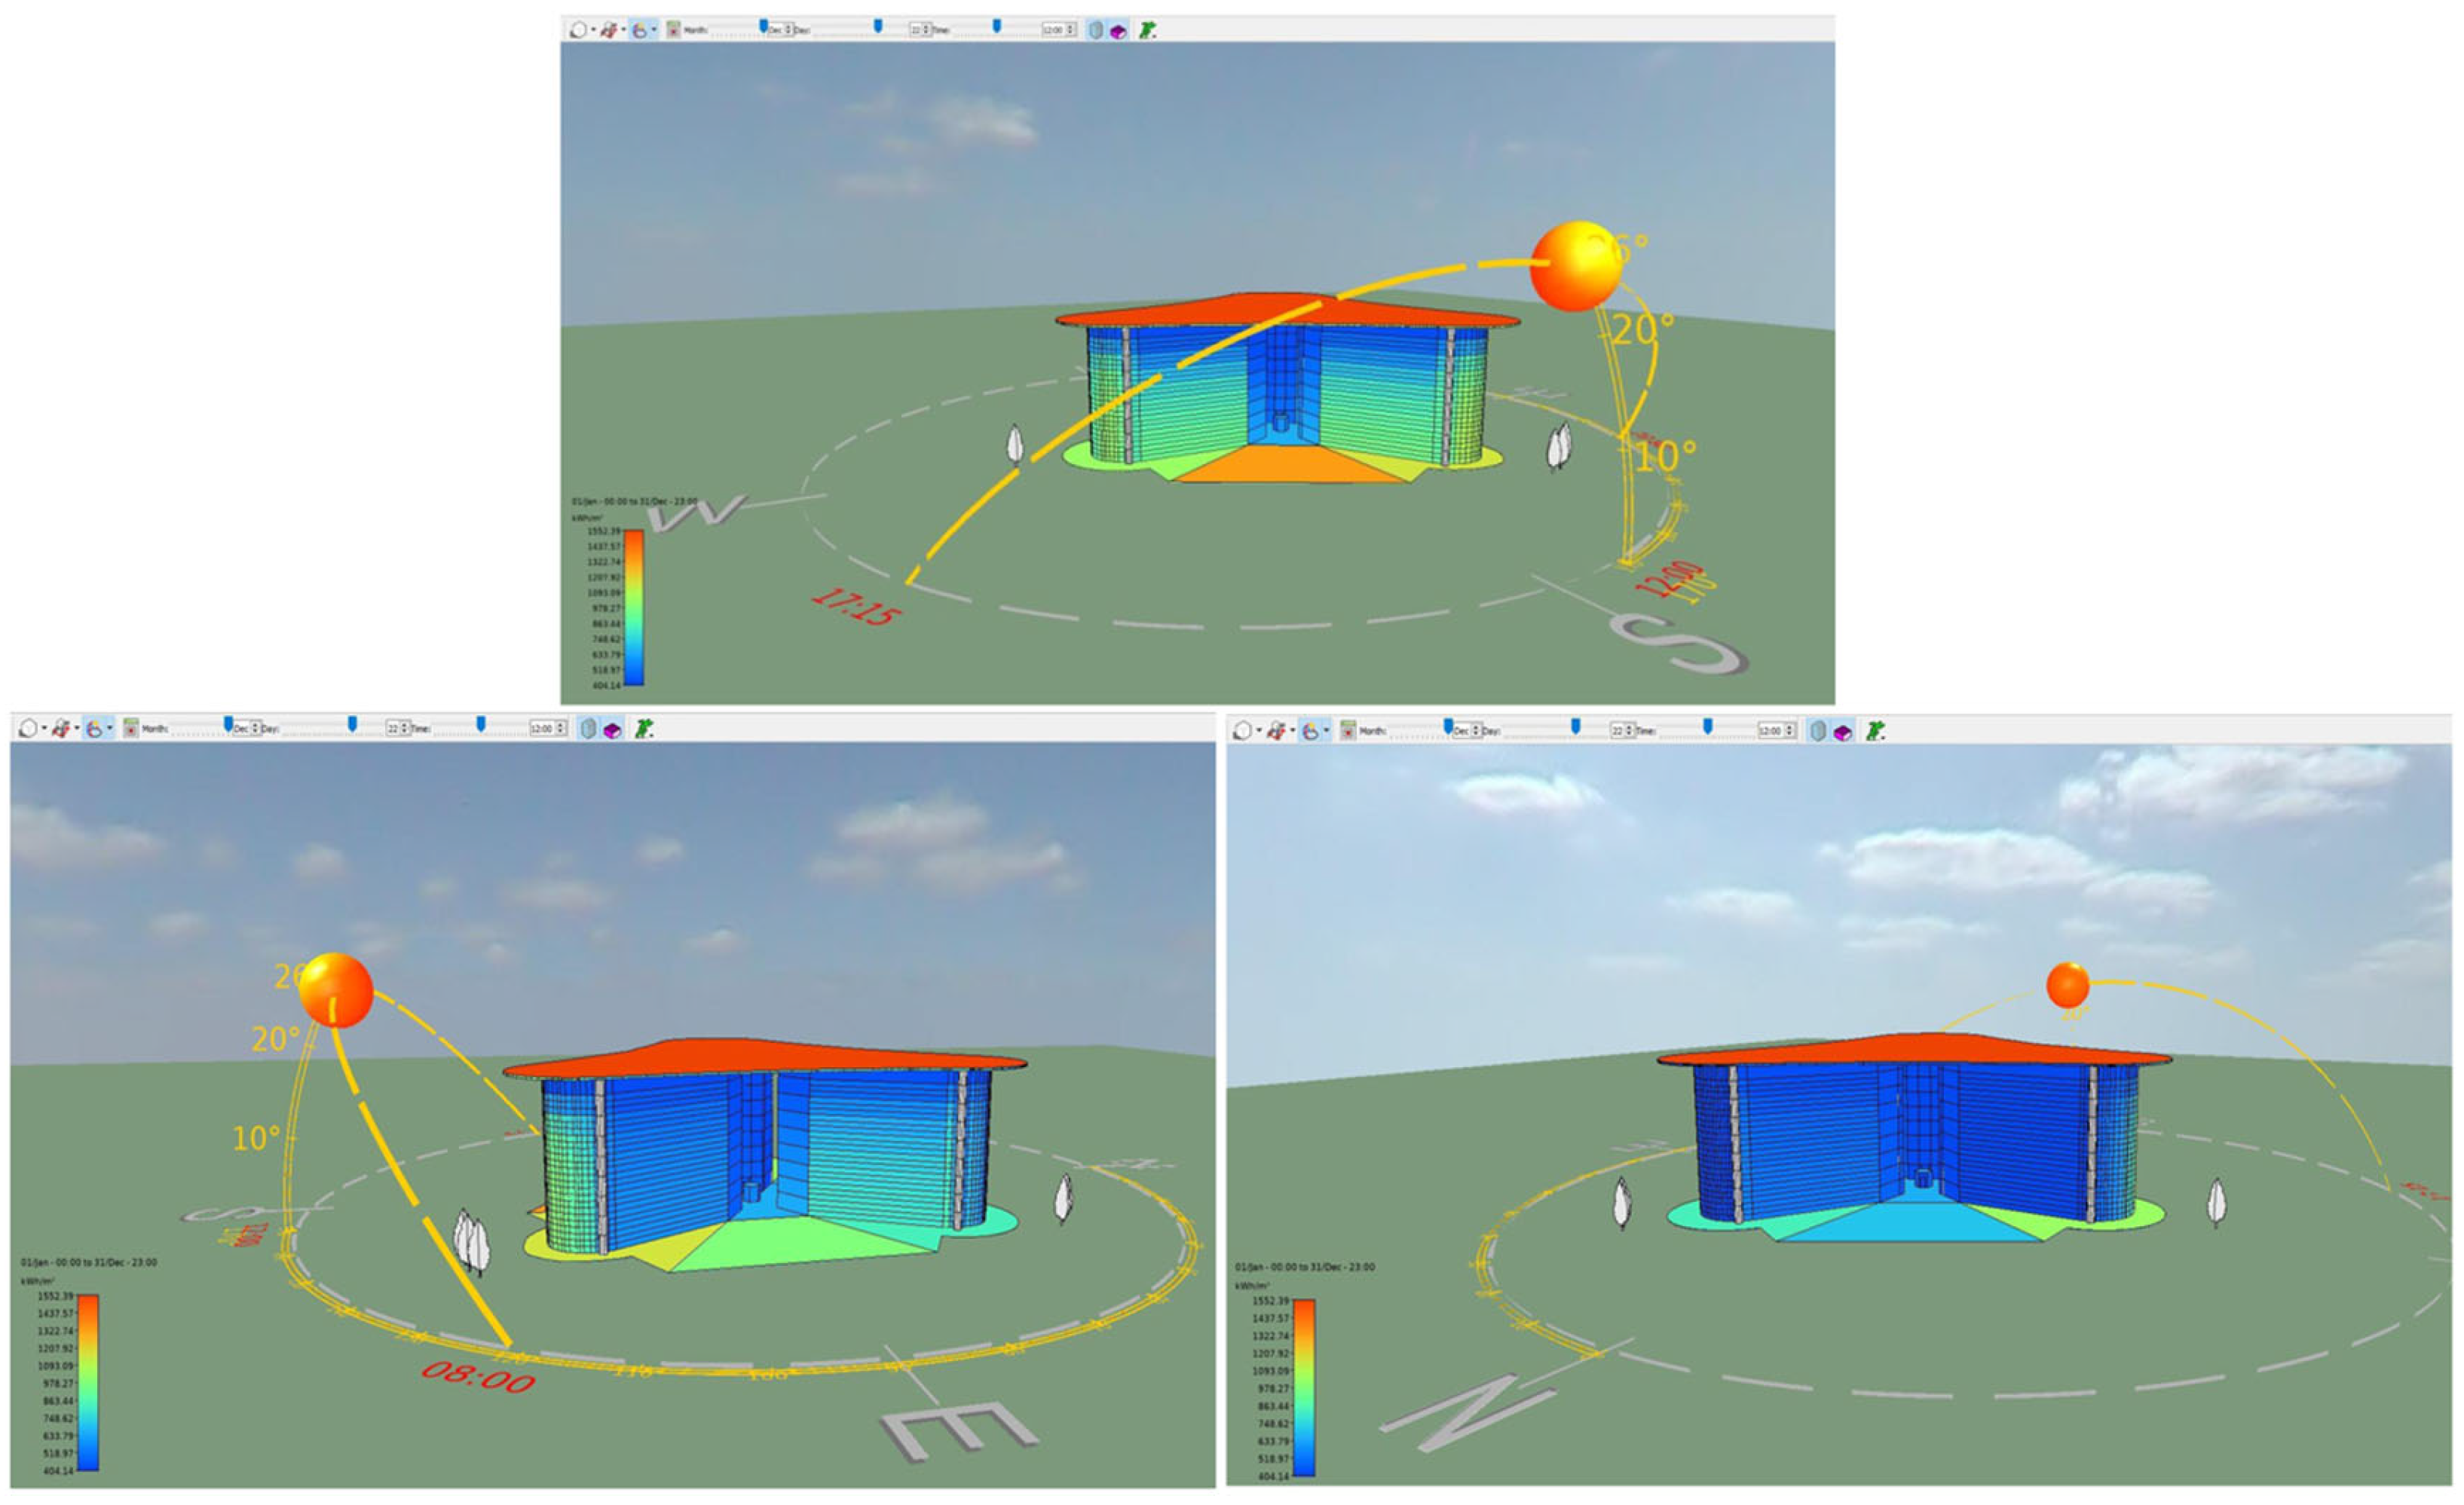
4.2. Solar Energy Analysis

Solar energy analysis in IES-VE, utilising SunCast, evaluates a building model to assess and visualise the incident solar energy on various surfaces, including façades, roofs, and other architectural elements. This analysis evaluates the building’s solar exposure over an entire year, determining the annual incident solar energy intensity in kWh/m2. The results of SunCast solar energy analysis from different orientations are shown in Figure 11. The extensive roof of the building serves as the primary site for solar energy generation, with an annual incident solar energy intensity of 1552.39 kWh/m2. This significant value highlights its suitability for the installation of advanced perovskite-on-silicon tandem solar photovoltaic panels, known for their high efficiency. Furthermore, due to the building’s location in the Northern Hemisphere, the south-facing façade exhibits the highest incident solar energy intensity, underscoring its potential for supplementary energy harvesting applications.

4.3. Comparative Analysis for CO2 Emissions

Analysing CO2 emissions in building simulations is essential for assessing the environmental impact and sustainability of the design. Buildings are significant contributors to global CO2 emissions through their energy consumption and reliance on non-renewable energy sources. Annual CO2 emissions from traditional boiler and chiller systems and heat pump systems are compared, as shown in Figure 12a and Figure 12b, respectively. The total CO2 emissions from the boiler and chiller systems amount to 485,042 kgCO2, whereas the heat pump systems produce 255,879 kgCO2. This indicates that the emissions from the boiler and chiller systems are nearly double those of the heat pump systems. In other words, a 53% reduction in CO2 emissions is achieved when heat pump systems are used instead of boiler and chiller systems. Additionally, this building incorporates heat pump systems integrated with turbines and photovoltaic panels to provide heating, cooling, and a power supply. As indicated in Figure 12c, the CO2 emissions offset by renewable energy sources amount to approximately 300 tonnes, exceeding the emissions produced by the heat pump system. In sum, the Clover building is capable of achieving its goal of net-zero carbon emissions.

4.4. Annual Space Heating and Cooling Demand

As illustrated in Figure 13a, the peak space heating demand occurs in December, reaching approximately 20.5 MWh, followed by January, February, March, and November, due to the colder external temperatures during these months. In contrast, the space heating demand during the summer months from June to September is minimal, highlighting the significant influence of external climatic conditions on internal space heating requirements. This trend demonstrates that buildings consume more energy for space heating during colder months to maintain comfortable indoor environments. The building’s total annual space heating demand is approximately 106 MWh. As shown in Figure 13b, the peak space cooling demand occurs in July and August, followed by September and June, which align with the typical summer months. Conversely, during the winter months from December to February, the space cooling demand is minimal, generally less than 2 MWh per month. This analysis underscores that buildings consume significantly more energy for space cooling during the summer when outdoor temperatures are higher. Overall, the building’s total annual energy consumption for space cooling amounts to 225 MWh. Comparing Figure 13a and Figure 13b highlights that the space cooling demand significantly exceeds the space heating demand, particularly during the summer months, underscoring the dominant energy requirement for cooling in this period.

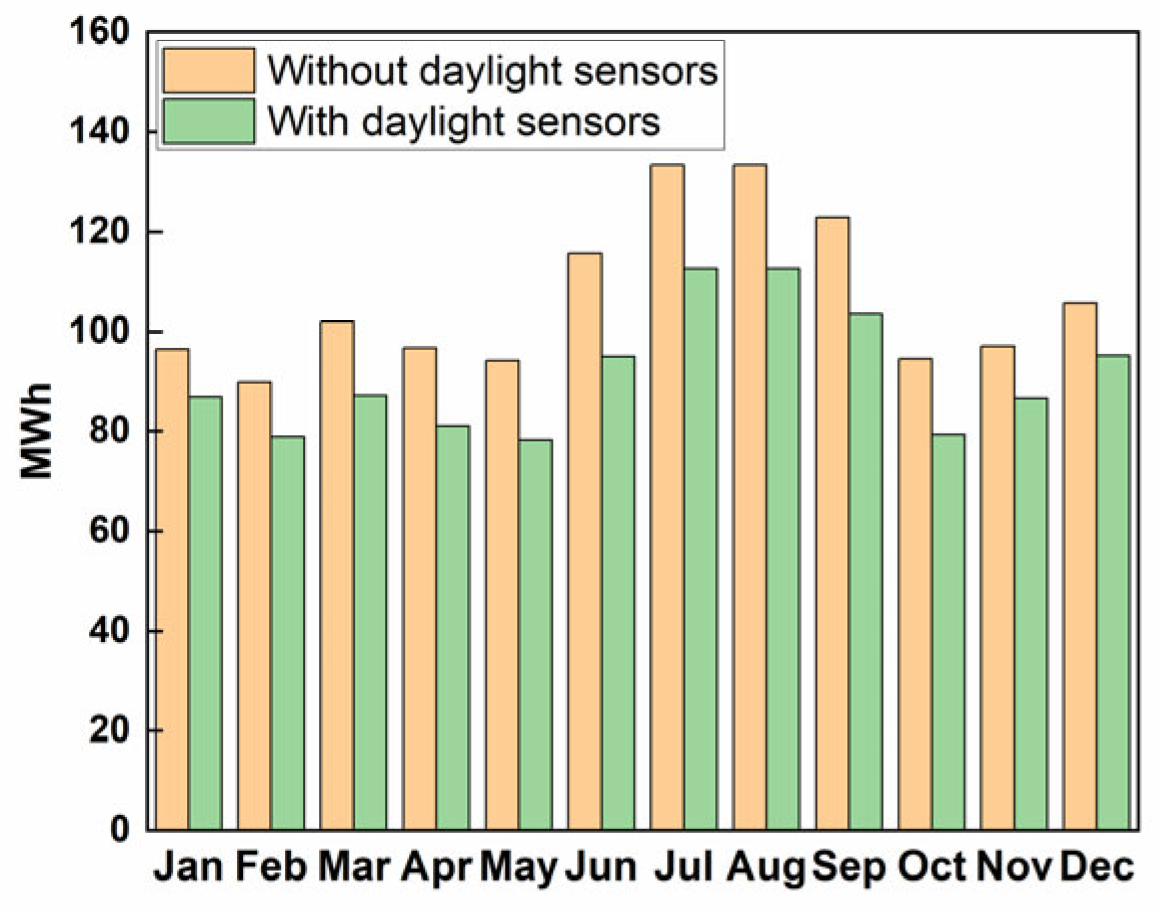
4.5. Annual Electricity Demand

The electricity demand fluctuates throughout the year, with a total annual consumption of 1280 MWh, as shown in Figure 14a. Demand is particularly high in July and August, driven by peak space cooling requirements. Electricity is utilised across various components, including equipment, lighting, and systems. The energy required for space heating, cooling, and auxiliary ventilation is categorised as system energy. Of the total annual electricity demand of 1280 MWh, the HVAC system consumes approximately 512.47 MWh, accounting for 40% of the building’s total energy needs, as shown in Figure 14b. This aligns with the typical energy consumption value of 40% attributed to HVAC systems in the commercial sector [46]. The remaining energy is utilised by lighting (31.25%) and equipment (28.72%), which also represent significant portions of the demand. The higher equipment loads can be attributed to an elevated equipment load density of 11.77 W/m2, reflecting the building’s function as a commercial office space equipped with numerous computers, laptops, scanners, printers, and similar devices.
To reduce energy consumption, the building can leverage natural daylight by incorporating daylight sensors; the locations of the sensors are mentioned in Section 3.5. These sensors would automatically dim interior lighting when adequate natural illuminance is available, reducing the reliance on artificial lighting and subsequently lowering the building’s annual electricity demand. Figure 15 illustrates this reduction, showing a drop from 1280 MWh to 1093.5 MWh, resulting in annual electricity savings of 14.57% for the building.

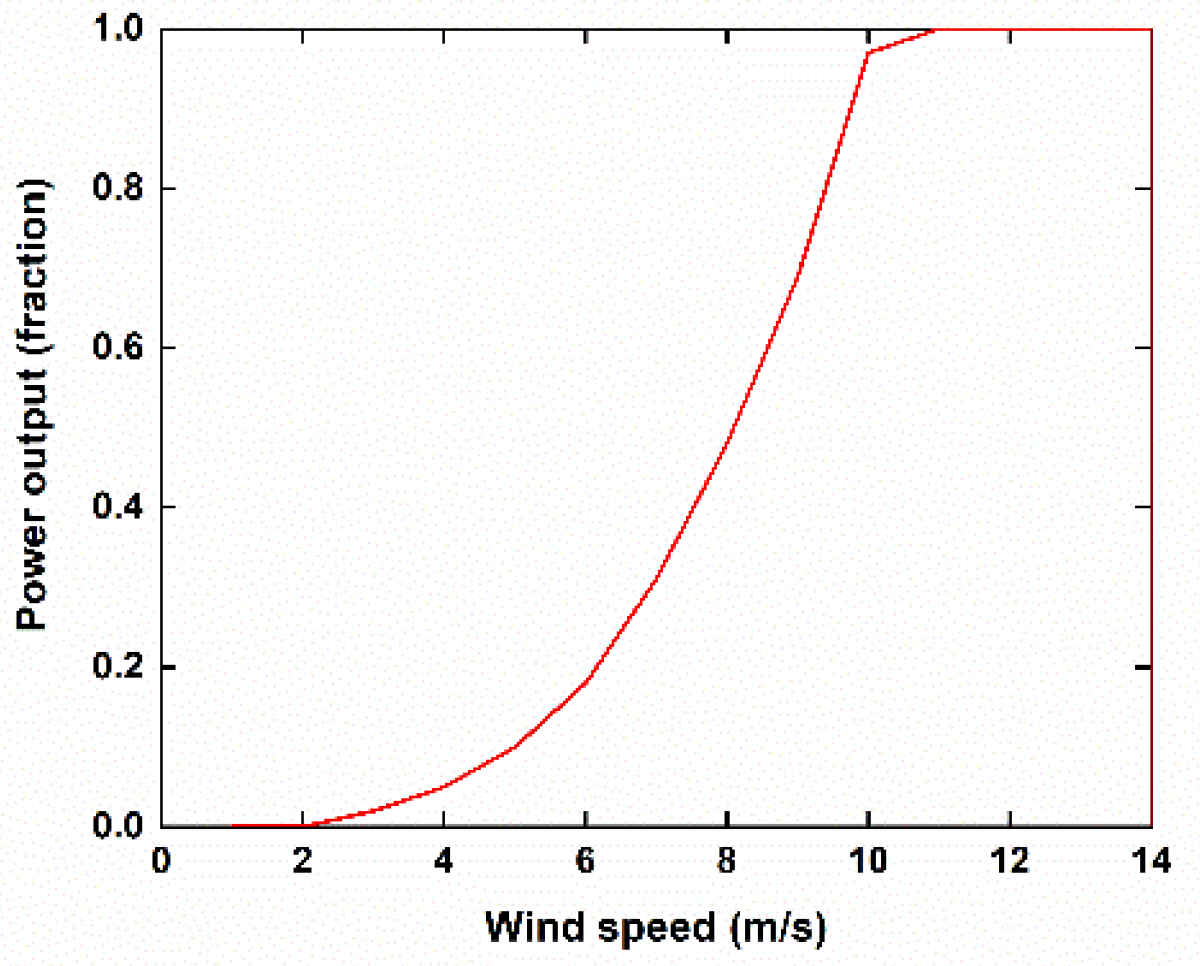
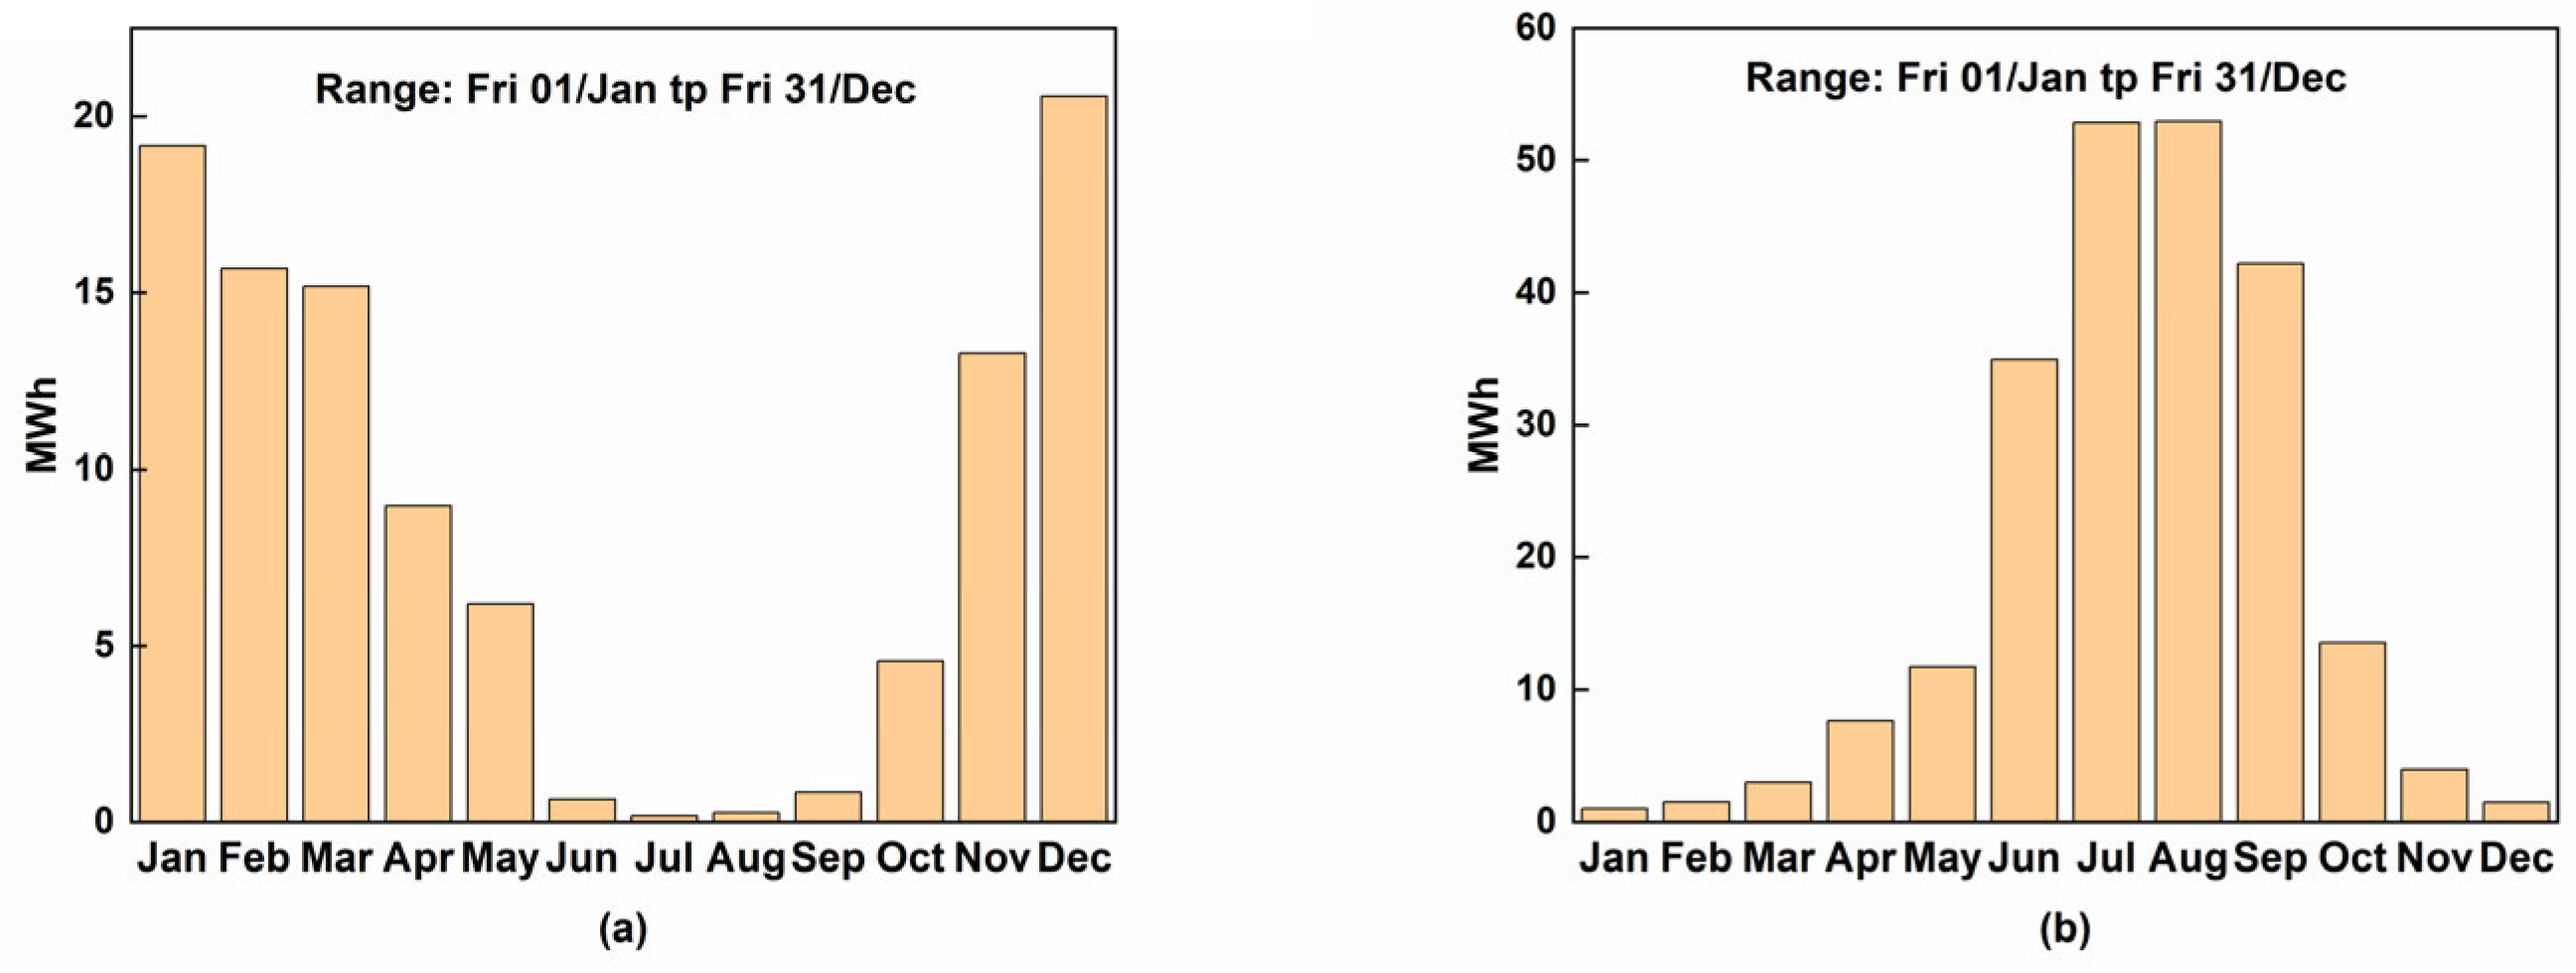
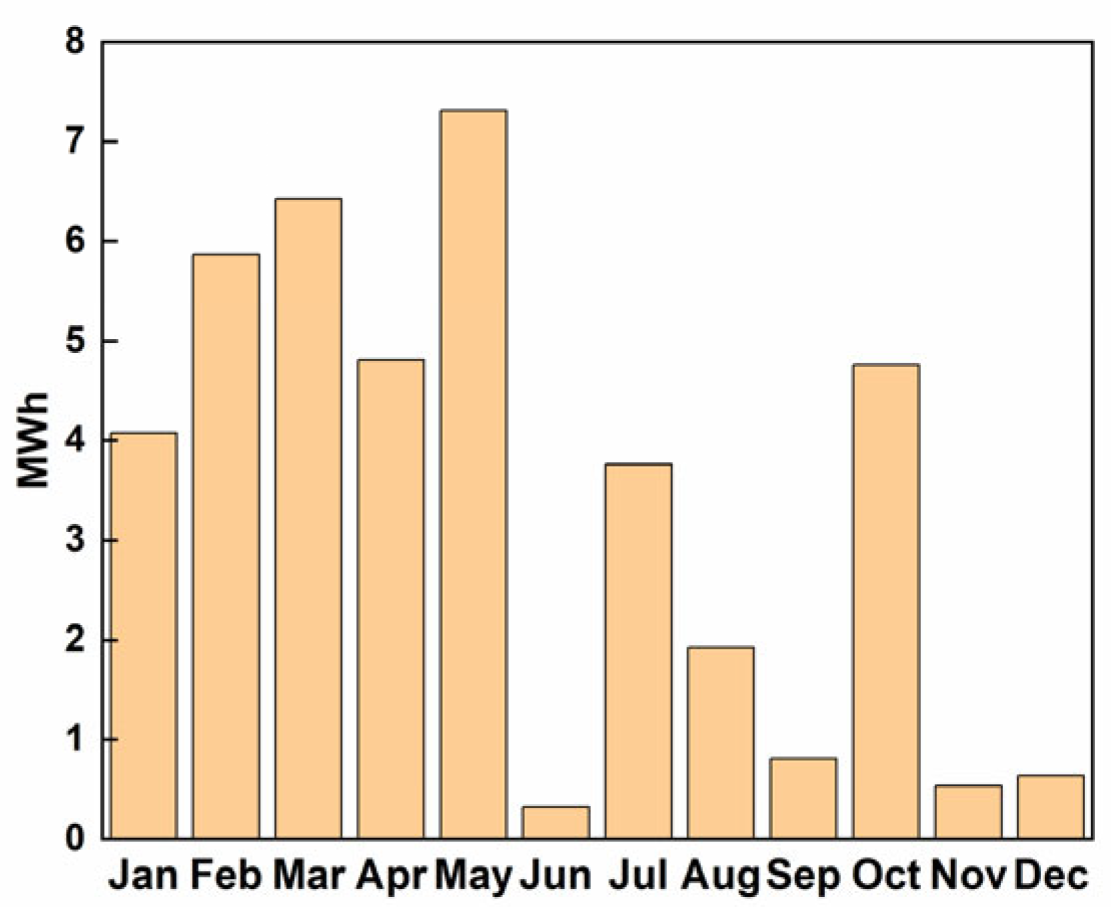
4.6. Wind-Generated Electricity

As depicted in Figure 16, wind energy production is higher during the winter months of January and February. Spring also sees significant electricity generation, with the peak occurring in May, with approximately 7.3 MWh produced. The total annual clean energy output from the wind turbines amounts to 41.18 MWh, which remains substantially lower than the building’s total annual electricity demand.

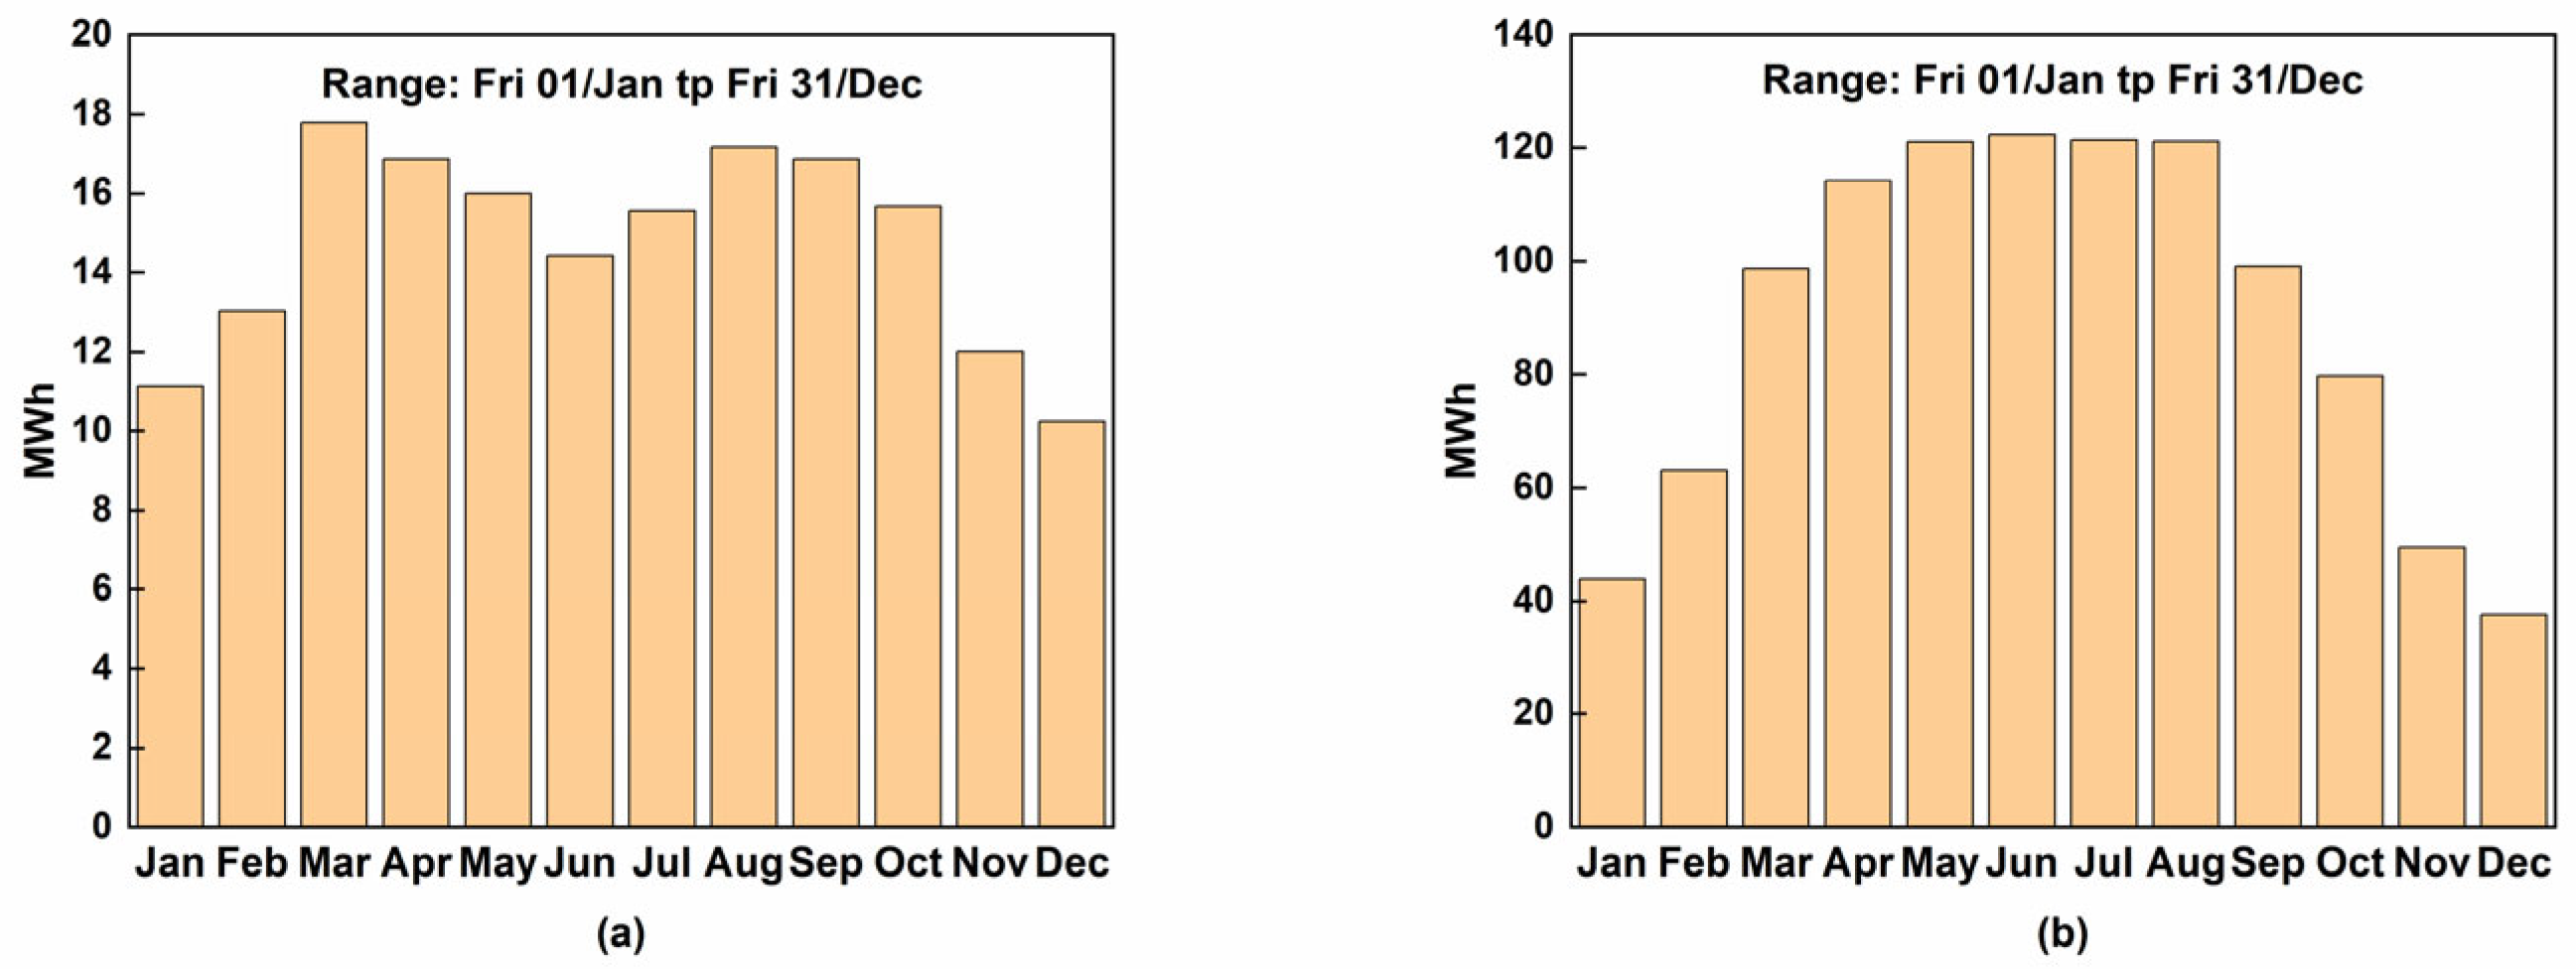
4.7. PV-Generated Electricity

As shown in Figure 17a, electricity generation is lower during the winter months. During the remaining months, the peak electricity generation from the building façade occurs in March, reaching approximately 17.8 MWh, which translates to an annual electricity generation density of 41.84 kWh/m2. Overall, the annual electricity generation from the BIPV panels installed on the façade amounts to 175.21 MWh, representing 14% of the total annual electricity generated by all PV panels. The electricity generated by the PV panels on the façade is less than optimal due to the shading caused by the giant roof and the minimal contribution from the north-facing façade, as highlighted in the SunCast solar energy analysis. Nevertheless, the electricity generation from the façade is still higher than that produced by the wind energy system. As can be observed in Figure 17b, electricity generation from the roof-mounted PV panels peaks during the summer, with the highest output of 122 MWh recorded in June, closely followed by other warm months. While electricity generation during the winter months is lower, it remains significantly higher than the façade panels’ output, as the roof is unaffected by shading. The annual electricity generation from the roof-mounted PV panels is an impressive 1068.75 MWh, which accounts for 86% of the annual electricity generated by PV panels. Covering an area of 2849 m2, the inclined panels achieve an exceptional annual electricity generation density of 375.13 kWh/m2, which is nearly nine times greater than that of the façade panels. Therefore, a total of 1243.96 MWh of electricity is generated annually through the PV panels.

4.8. Comparison of Total Electricity Demand vs. On-Site Electricity Generation

As shown in Figure 18, it is evident that the on-site electricity generation from renewable sources, such as wind and solar, exceeds the building’s annual electricity demand. However, due to the intermittent nature of solar and wind energy generation, integrating a Battery Energy Storage System (BESS) is essential. A BESS stores surplus electricity as chemical energy and discharges it as electrical energy when needed, effectively mitigating the fluctuations between energy demand and on-site generation. This system not only ensures a consistent power supply by storing excess electricity and releasing it during peak demand but also supports and stabilises the national electricity grid. By providing backup power and smoothing out demand fluctuations, the BESS is particularly valuable during power outages or grid unavailability. Furthermore, it enhances the utilisation of renewable energy sources, reducing the reliance on fossil fuels and promoting a cleaner, greener energy mix. This contributes to a decreased dependence on the national grid and minimises the building’s carbon footprint. The net annual electricity generation from these systems is 191.64 MWh. This shows that 85.09% of the annual electricity generation is used to meet the building’s demand, while 14.91% represents the net electricity surplus.

5. Conclusions

This study examined the feasibility of achieving a zero-carbon-emission building using an advanced dynamic simulation modelling approach with IES-VE. The simulations incorporated key parameters, including weather data, building material properties, occupant behaviour patterns, operational profiles, heat pump systems, PV panels, wind turbines, and passive design strategies, to ensure accurate predictions. The simulation results were comprehensively analysed, focusing on CO2 emissions, annual heating and cooling demand, electricity demand, and electricity generation from renewable energy sources. The key findings are summarised as follows:
  • This study compared the CO2 emissions of three building system configurations: traditional boiler and chiller systems, heat pump systems, and heat pumps integrated with PV panels and wind turbines. A 53% reduction in CO2 emissions was achieved when using the heat pump system instead of the boiler and chiller systems. Moreover, the CO2 emissions offset by renewable energy sources totalled approximately 300 tonnes, surpassing the emissions produced by the heat pump system. Consequently, the building design is capable of achieving net-zero carbon emissions;
  • The implementation of passive design techniques, such as daylight sensors, significantly reduced the building’s annual electricity demand by 14.57%;
  • The building’s total annual electricity demand was calculated to be 1093.5 MWh, while the combined annual electricity generation from PV panels and wind turbines reached 1285.14 MWh, resulting in a net electricity surplus of 191.64 MWh. This demonstrates that 100% on-site renewable energy generation is achievable, reducing the reliance on fossil fuels and contributing to the stability of the national electricity grid;
  • “The Clover” is a net-zero-carbon building.

Author Contributions

Conceptualisation, Y.G.; Methodology, R.V.P.; Software, R.V.P.; Validation, X.Z.; Formal analysis, R.V.P.; Investigation, X.Z., Y.G. and R.V.P.; Writing—original draft, X.Z. and R.V.P.; Writing—review and editing, Y.G.; Supervision, Y.G.; Project administration, Y.G. All authors have read and agreed to the published version of the manuscript.

Funding

This research received no external funding.

Data Availability Statement

The data presented in this study are available on request from the corresponding author. The data are not publicly available due to [the reason of technical confidentiality].

Acknowledgments

The authors would like to acknowledge the support received from Elemental Flow Towers Ltd. for this research project.

Conflicts of Interest

The authors declare no conflict of interest.

Abbreviations

ACHair changes per hour
BESSBattery Energy Storage System
BIPVsbuilding-integrated photovoltaic panels
COPCoefficient of Performance
Cloclothing insulation
DOASdedicated outside air system
EEREnergy Efficiency Ratio
GWPGlobal Warming Potential
HAWThorizontal-axis wind turbine
HVACheating, ventilation, and air conditioning
IES-VEIntegrated Environmental Solutions Virtual Environment
Metmetabolic rate
NCMNational Calculation Methodology
PVphotovoltaic
VAWTvertical-axis wind turbine
VOCsvolatile organic compounds

References

  1. Sangkakool, T.; Techato, K.; Zaman, R.; Brudermann, T. Prospects of green roofs in urban Thailand—A multi-criteria decision analysis. J. Clean. Prod. 2018, 196, 400–410. [Google Scholar] [CrossRef]
  2. Monna, S.; Juaidi, A.; Abdallah, R.; Albatayneh, A.; Dutournie, P.; Jeguirim, M. Towards sustainable energy retrofitting, a simulation for potential energy use reduction in residential buildings in palestine. Energies 2021, 14, 3876. [Google Scholar] [CrossRef]
  3. Bouckaert, S.; Pales, A.F.; McGlade, C.; Remme, U.; Wanner, B.; Varro, L.; D’Ambrosio, D.; Spencer, T. Net Zero by 2050: A Roadmap for the Global Energy Sector; OECD Publishing: Paris, France, 2021. [Google Scholar]
  4. Altan, H.; Hajibandeh, M.; Tabet Aoul, K.A.; Deep, A. Passive Design. ZEMCH: Toward the Delivery of Zero Energy Mass Custom Homes; Springer: Berlin/Heidelberg, Germany, 2016; pp. 209–236. [Google Scholar]
  5. Elaouzy, Y.; El Fadar, A. Energy, economic and environmental benefits of integrating passive design strategies into buildings: A review. Renew. Sustain. Energy Rev. 2022, 167, 112828. [Google Scholar] [CrossRef]
  6. Krarti, M. Optimal Design and Retrofit of Energy Efficient Buildings, Communities, and Urban Centers; Butterworth-Heinemann: Oxford, UK, 2018. [Google Scholar]
  7. Chen, X.; Yang, H. Combined thermal and daylight analysis of a typical public rental housing development to fulfil green building guidance in Hong Kong. Energy Build. 2015, 108, 420–432. [Google Scholar] [CrossRef]
  8. Stevens, R.G.; Blask, D.E.; Brainard, G.C.; Hansen, J.; Lockley, S.W.; Provencio, I.; Rea, M.S.; Reinlib, L. Meeting report: The role of environmental lighting and circadian disruption in cancer and other diseases. Environ. Health Perspect. 2007, 115, 1357–1362. [Google Scholar] [CrossRef]
  9. Bui, V.; Liu, H.; Low, Y.; Tang, T.; Zhu, Q.; Shah, K.; Shidoji, E.; Lim, Y.; Koh, W. Evaluation of building glass performance metrics for the tropical climate. Energy Build. 2017, 157, 195–203. [Google Scholar] [CrossRef]
  10. Nandapala, K.; Chandra, M.S.; Halwatura, R.U. A study on the feasibility of a new roof slab insulation system in tropical climatic conditions. Energy Build. 2020, 208, 109653. [Google Scholar] [CrossRef]
  11. Rawat, M.; Singh, R.N. A study on the comparative review of cool roof thermal performance in various regions. Energy Built Environ. 2022, 3, 327–347. [Google Scholar] [CrossRef]
  12. Andric, I.; Kamal, A.; Al-Ghamdi, S.G. Efficiency of green roofs and green walls as climate change mitigation measures in extremely hot and dry climate: Case study of Qatar. Energy Rep. 2020, 6, 2476–2489. [Google Scholar] [CrossRef]
  13. Ng, T.S.; Yau, R.M.; Lam, T.N.; Cheng, V.S. Design and commission a zero-carbon building for hot and humid climate. Int. J. Low-Carbon Technol. 2016, 11, 222–234. [Google Scholar] [CrossRef]
  14. Aksamija, A. Regenerative design and adaptive reuse of existing commercial buildings for net-zero energy use. Sustain. Cities Soc. 2016, 27, 185–195. [Google Scholar] [CrossRef]
  15. Rabani, M.; Madessa, H.B.; Nord, N. Achieving zero-energy building performance with thermal and visual comfort enhancement through optimization of fenestration, envelope, shading device, and energy supply system. Sustain. Energy Technol. Assess. 2021, 44, 101020. [Google Scholar] [CrossRef]
  16. Aguacil, S.; Lufkin, S.; Rey, E. Active surfaces selection method for building-integrated photovoltaics (BIPV) in renovation projects based on self-consumption and self-sufficiency. Energy Build. 2019, 193, 15–28. [Google Scholar] [CrossRef]
  17. Chen, X.; Yang, H.; Peng, J. Energy optimization of high-rise commercial buildings integrated with photovoltaic facades in urban context. Energy 2019, 172, 1–17. [Google Scholar] [CrossRef]
  18. Sornek, K.; Filipowicz, M.; Jasek, J. The use of fresnel lenses to improve the efficiency of photovoltaic modules for building-integrated concentrating photovoltaic systems. J. Sustain. Dev. Energy Water Environ. Syst. 2018, 6, 415–426. [Google Scholar] [CrossRef]
  19. Wang, M.; Peng, J.; Li, N.; Yang, H.; Wang, C.; Li, X.; Lu, T. Comparison of energy performance between PV double skin facades and PV insulating glass units. Appl. Energy 2017, 194, 148–160. [Google Scholar] [CrossRef]
  20. Bunthof, L.; Kreuwel, F.; Kaldenhoven, A.; Kin, S.; Corbeek, W.; Bauhuis, G.; Vlieg, E.; Schermer, J. Impact of shading on a flat CPV system for façade integration. Sol. Energy 2016, 140, 162–170. [Google Scholar] [CrossRef]
  21. Smyth, M.; Pugsley, A.; Hanna, G.; Zacharopoulos, A.; Mondol, J.; Besheer, A.; Savvides, A. Experimental perfor-mance characterisation of a hybrid photovoltaic/solar thermal façade module compared to a flat integrated collector storage solar water heater module. Renew. Energy 2019, 137, 137–143. [Google Scholar] [CrossRef]
  22. Dutton, A.G.; Halliday, J.A.; Blanch, M.J. The Feasibility of Building-Mounted/Integrated Wind Turbines (BUWTs): Achieving Their Potential for Carbon Emission Reductions; Energy Research Unit: Oxford, UK; CCLRC: Oxford, UK, 2005; pp. 77–83. [Google Scholar]
  23. Hyams, M.A. Wind energy in the built environment. In Metropolitan Sustainability; Woodhead Publishing: Cambridge, UK, 2012; pp. 457–499. [Google Scholar]
  24. Boyle, G. Renewable Energy Power for a Sustainable Future, 2nd ed.; Oxford University Press: Oxford, UK, 2004. [Google Scholar]
  25. Johari, M.K.; A Jalil, M.A.; Shariff, M.F.M. Comparison of horizontal axis wind turbine (HAWT) and vertical axis wind turbine (VAWT). Int. J. Eng. Technol. 2018, 7, 74–80. [Google Scholar] [CrossRef]
  26. Park, J.; Jung, H.J.; Lee, S.W.; Park, J. A new building-integrated wind turbine system utilizing the building. Energies 2015, 8, 11846–11870. [Google Scholar] [CrossRef]
  27. Singh, R.K.; Ahmed, M.R. Blade design and performance testing of a small wind turbine rotor for low wind speed applications. Renew. Energy 2013, 50, 812–819. [Google Scholar] [CrossRef]
  28. Arumugam, P.; Ramalingam, V.; Bhaganagar, K. A pathway towards sustainable development of small capacity horizontal axis wind turbines—Identification of influencing design parameters & their role on performance analysis. Sustain. Energy Technol. Assess. 2021, 44, 101019. [Google Scholar] [CrossRef]
  29. Sari, D.P.; Cho, K.P. Performance Comparison of Different Building Shapes Using a Wind Tunnel and a Computa-tional Model. Buildings 2022, 12, 144. [Google Scholar] [CrossRef]
  30. Chaudhry, H.N.; Calautit, J.K.; Hughes, B.R. The Influence of Structural Morphology on the Efficiency of Building Integrated Wind Turbines (BIWT). AIMS Energy 2014, 2, 219–236. [Google Scholar] [CrossRef]
  31. Mao, Z.; Yang, G.; Zhang, T.; Tian, W. Aerodynamic performance analysis of a building-integrated savonius turbine. Energies 2020, 13, 2636. [Google Scholar] [CrossRef]
  32. Mohammed, G.; Ibrahim, A.; Kangiwa, U.M.; Wisdom, J.B. Design and testing of building integrated hybrid vertical axis wind turbine. J. Electr. Electron. Eng. 2021, 9, 69. [Google Scholar] [CrossRef]
  33. Nguyen, L.; Metzger, M. Optimization of a vertical axis wind turbine for application in an urban/suburban area. J. Renew. Sustain. Energy 2017, 9, 043302. [Google Scholar] [CrossRef]
  34. Irshad, A.S.; Kargar, N.; Elkholy, M.H.; Ludin, G.A.; Elias, S.; Hilali, A.; Senjyu, T.; Gamil, M.M.; Pinter, G. Tech-no-economic evaluation and comparison of the optimal PV/Wind and grid hybrid system with horizontal and vertical axis wind turbines. Energy Convers. Manag. X 2024, 23, 100638. [Google Scholar]
  35. Weeks, D. LAUNCH: RENEWABLES 2024 GLOBAL STATUS REPORT-GLOBAL OVERVIEW-REN21 Secretariat. 2024. Available online: https://policycommons.net/artifacts/12092387/launch/12986140/ (accessed on 22 January 2025).
  36. Attia, S.G.; Beltrán, L.; De Herde, A.; Hensen, J.L.M. “Architect friendly”: A comparison of ten different building performance simulation tools. In Proceedings of the 11th International IBPSA Building Simulation Conference (BS 2009), Glasgow, UK, 27–30 July 2009; International Building Performance Simulation Association (IBPSA): Brisbane, Australia, 2009; pp. 204–211. [Google Scholar]
  37. Lau, A.K.K.; Salleh, E.; Lim, C.H.; Sulaiman, M.Y. Potential of shading devices and glazing configurations on cooling energy savings for high-rise office buildings in hot-humid climates: The case of Malaysia. Int. J. Sustain. Built Environ. 2016, 5, 387–399. [Google Scholar] [CrossRef]
  38. Alnaqbi, A.K. Investigating Energy Savings Due to Implementing Green Roof on Existing Residential Buildings in UAE. Master’s Thesis, The British University in Dubai, Dubai, United Arab Emirates, 2013. [Google Scholar]
  39. Zoure, A.N.; Genovese, P.V. Implementing natural ventilation and daylighting strategies for thermal comfort and energy efficiency in office buildings in Burkina Faso. Energy Rep. 2023, 9, 3319–3342. [Google Scholar] [CrossRef]
  40. Race, G.L. How to Design a Heating System; CIBSE Publications: London, UK, 2006. [Google Scholar]
  41. Olesen, B.W.; Wang, H.; Kazanci, B.O. The Effect of Room Temperature Control By Air-or Operative Temperature on Thermal Comfort and Energy Use. In Proceedings of the Building Simulation 2019: 16th Conference of IBPSA Building Simulation 2019: 16th Conference of IBPSA, Rome, Italy, 2–4 September 2019; Volume 16, pp. 2086–2093. [Google Scholar]
  42. Race, G.L.; Mitchell, S. A Practical Guide to HVAC Building Services Calculations; BSRIA: Bracknell, UK, 2003. [Google Scholar]
  43. HM Government. The Building Regulations 2010 Ventilation Approved Document F Volume 2: Buildings Other than Dwellings. 2021. Available online: https://assets.publishing.service.gov.uk/media/62a761edd3bf7f03667c667e/ADF2_revised.pdf (accessed on 26 December 2024).
  44. Shen, B.; Li, Z.; Gluesenkamp, K.R. Experimental study of R452B and R454B as drop-in replacement for R410A in split heat pumps having tube-fin and microchannel heat exchangers. Appl. Therm. Eng. 2022, 204, 117930. [Google Scholar] [CrossRef]
  45. EasySolar. Shade Calculator—EasySolar. 2021. Available online: https://easysolar.app/en/shade-calculator/ (accessed on 3 April 2024).
  46. Ruya, E.; Augenbroe, G. Exploring thermal comfort acceptance criteria in energy modeling. In Proceedings of the 2018 Building Performance Analysis Conference and SimBuild Co-Organized by ASHRAE and IBPSA-USA, Chicago, IL, USA, 26–28 September 2018; pp. 258–265. [Google Scholar]
Figure 1. (a) IES-VE building model of The Clover; (b) architectural perspective of The Clover.
Buildings 15 00414 g001
Figure 2. Auto-CAD (2024)layout of the building.
Buildings 15 00414 g002
Figure 3. Flow chart for IES-VE modelling and analysis.
Buildings 15 00414 g003
Figure 4. External dry bulb temperatures.
Buildings 15 00414 g004
Figure 5. Wind speeds.
Buildings 15 00414 g005
Figure 6. PV panel placement on the giant roof.
Buildings 15 00414 g006
Figure 7. Inclined PV panels on the roof.
Buildings 15 00414 g007
Figure 8. Wind power curve.
Buildings 15 00414 g008
Figure 9. Daylight sensor positioning in open office.
Buildings 15 00414 g009
Figure 10. Internal heat gains in open office.
Buildings 15 00414 g010
Figure 11. SunCast solar energy analysis results for different orientations.
Buildings 15 00414 g011
Figure 12. (a) Annual CO2 emissions from boiler and chiller systems, (b) annual CO2 emissions from heat pump systems, and (c) carbon emissions displaced through renewables.
Buildings 15 00414 g012
Figure 13. (a) Annual space heating demand; (b) annual space cooling demand.
Buildings 15 00414 g013
Figure 14. (a) Annual electricity demand; (b) breakdown of total annual electricity demand.
Buildings 15 00414 g014
Figure 15. Comparison of annual electricity demand with and without daylight sensors.
Buildings 15 00414 g015
Figure 16. Electricity generated by wind energy systems in the building.
Buildings 15 00414 g016
Figure 17. Electricity generated by PV systems on (a) the façade and (b) the giant roof.
Buildings 15 00414 g017
Figure 18. Comparison of annual electricity demand and on-site electricity generation.
Buildings 15 00414 g018
Table 1. Some case studies of building-integrated solar energy systems.
System TypeSimulation ToolElectrical Efficiency
BIPV [16]BIM, 20180.17
BIPV [17]EnergyPlus, je
+, R, GenOpt, 2018
0.06–0.15
BIPV with Fresnel
lens [18]
TRNSYS, 20160.22
PV double-skin
façade and PV
insulating glass [19]
EnergyPlus0.05–0.07
Concentrator solar
PV [20]
0.24
Hybrid
photovoltaic/
solar thermal
(HyPV/T)
façade [21]
0.08–0.23
Table 2. Some case studies of building-integrated wind turbine systems.
System TypeMethodKey Findings
HAWT [26]CFDThe system contributed to 6.3% of building electricity supply.
HAWT [27]TestsThe peak power coefficient attained by the 2-bladed rotor design at 6 m/s wind speed was 0.29.
HAWT [28]QBlade software, 2016The design of a small horizontal wind turbine with three blades is suitable for low-wind-speed areas.
HAWT [29]Experimental and CFDRound-cornered buildings increased wind velocity by up to 34% compared to sharp-cornered structures, highlighting the significance of building shape in enhancing wind turbine performance.
HAWT [30]CFDA circular cross-section is the most viable building orientation, particularly suited to regions with a dominant prevailing wind direction, as a mean wind speed augmentation of 5% was achieved at the turbines.
VAWT [31]CFDAn edge-mounted Savonius turbine has a higher coefficient of power than that operating in uniform flows; the average Cp of the turbine under 360-degree wind angles is 92.5% higher than that of the turbine operating in uniform flows.
VAWT [32]ExperimentalThe building-integrated hybrid VAWT produced up to 63% more energy compared to a standalone hybrid VAWT, demonstrating the benefits of integration with building structures.
Table 3. Comparison of various site locations.
LocationNearest Weather StationSolar Insolation on Giant Roof (kWh/m2)Annual Average Wind Speed (m/s)
LondonLondon Heathrow922.164
AlicanteAlicante Ap1613.643.2
PenicheCabo Carvoeiro1552.394.9
CataniaCatania Fontanarossa1664.913.4
PerpignanPerpignan Sud de France Ap1482.314.3
SingaporeSingapore Paya Lebar1660.8225
DohaDoha International2171.763.8
Table 4. Building synopsis matrix.
Building Data
NameThe Clover
Number of StoreysBasement + ground + 7
Application Commercial office
Total Floor Area of Building20,250 m2
Location Data
LocationPeniche, Portugal
Nearest Weather StationCabo Carvoeiro, Portugal
Latitude39.36° N
Longitude9.41° W
Altitude/Elevation from Sea Level32 m
Time Zone0 h ahead of GMT
Daylight Saving Time
Time Adjustment1 h
Span of MonthsApril to October
Site Data
Summer Ground Reflectance0.2
Winter Ground Reflectance0.2
Terrain TypeSuburbs
External CO2 Concentration400 ppm
Wind ExposureNormal
Design Weather Data
Monthly Percentile for Heating Loads99.60%
Monthly Percentile for Cooling Loads0.40%
Barometric Pressure100,949.7 Pa
Reference Air Density1.2 kg/m3
Air Specific Heat1.019 KJ/kg-K
Table 5. Heat gains for different spaces.
Occupancy Heat Gains
Typical ApplicationActivityInternal Dry Bulb Temperature (°C)Sensible Heat (Watts/Person)Latent Heat (Watts/Person)ReferencesOccupant Density (m2/Person)References
OfficeSeated, moderate work238555CIBSE Guide A Table 6.3 page 344 of 40412CIBSE Guide A Table 6.2 page 331 of 404
Lighting Heat Gains from Different Spaces
Typical ApplicationMinimum Illuminance (lux)Maximum Illuminance (lux)ReferencesSensible Heat (Watts/person)ReferencesRadiant Fraction
Open office300500CIBSE Guide A Table 1.5 page 34 of 4048CIBSE Guide A Table 6.2 page 331 of 4040.45
Lift lobby100200CIBSE Guide A Table 1.5 page 34 of 4045.2UK NCM template imported in IES-VE0.45
Toilet200200CIBSE Guide A Table 1.5 page 34 of 4047.5UK NCM template imported in IES-VE0.45
Car park garage7575CIBSE Guide A Table 1.5 page 34 of 4043.9UK NCM template imported in IES-VE0.45
Equipment Heat Gain from Open Office
Typical ApplicationSensible Heat Gain (Watts/m2)ReferencesRadiant Fraction
Open office11.77UK NCM template imported in IES-VE0.22
Table 6. Building material parameters.
External Wall
ElementThickness (mm)Thermal Conductivity (W/m-K)Density (kg/m3)Specific Heat Capacity (J/kg-K)Thermal Resistance (m2-K/W)
Outer film of air 0.04
Brickwork outer leaf1050.841700800125
Polyurethane foam1000.0253014004
Brickwork inner leaf1000.6217008000.161
Gypsum plasterboard12.50.168008400.078
Inner film of air 0.13
Overall heat transfer coefficient of external wall0.22 (W/m2-K)
Floor/Ceiling
ElementThickness (mm)Thermal Conductivity (W/m-K)Density (kg/m3)Specific Heat Capacity (J/kg-K)Thermal Resistance
(m2-K/W)
Inner film of air 0.1
Chipboard flooring180.1460017000.129
Cellular polyurethane insulation1000.0232416004.35
Cast concrete750.143708400.536
Gypsum plasterboard12.50.168008400.078
Inner film of air 0.1
Overall heat transfer coefficient of external wall0.18 (W/m2-K)
Roof
ElementThickness (mm)Thermal Conductivity (W/m-K)Density (kg/m3)Specific Heat Capacity (J/kg-K)Thermal Resistance (m2-K/W)
Outer film of air 0.04
Asphalt mastic roofing201.1523308400.017
Polyurethane foam1500.0253014006
Screed500.46120010000.109
Concrete deck1502240010000.075
Gypsum plasterboard12.50.168008400.078
Inner film of air 0.1
Overall heat transfer coefficient of external wall0.16 (W/m2-K)
Glazing
ElementThickness (mm)Thermal Conductivity (W/m-K)GasConvection Coefficient (W/m2-K)Thermal Resistance (m2-K/W)TransmittanceOutside ReflectanceInside ReflectanceRefractive IndexOutside EmissivityInside Emissivity
Outer pane61.06 0.00570.4090.2890.4141.5260.8370.042
Cavity12 Argon1.40330.6182
Inner pane61.06 0.00570.7830.0720.0721.5260.8370.837
Cavity12 Argon1.40330.196
Inner pane61.06 0.00570.7830.0720.0721.5260.8370.837
Overall heat transfer coefficient of glass only0.9988 (W/m2-K)
Table 7. Internal heat gains in open office—sensible loads.
Internal Heat GainsAreaOccupancy DensityNo. of PeopleSensible Heat Gains (Watts/People)Total Sensible Load
WattskW
People553.91246853923.463.92
Internal heat gainsArea-Sensible heat gains (Watts/m2)Total sensible load
WattskW
Lighting553.9-84431.24.43
Equipment11.776519.46.52
Total internal heat gains (sensible)14,874.0614.87
Disclaimer/Publisher’s Note: The statements, opinions and data contained in all publications are solely those of the individual author(s) and contributor(s) and not of MDPI and/or the editor(s). MDPI and/or the editor(s) disclaim responsibility for any injury to people or property resulting from any ideas, methods, instructions or products referred to in the content.

