
Insights into the Diagnosis and Prognosis of the Alkali–Silica Reaction (ASR) in Concrete Dams, Highlighting the Case of the Demolished Alto Ceira Dam in Portugal

 ,
,  ,
,  , ,
, ,
Abstract
:1. Introduction
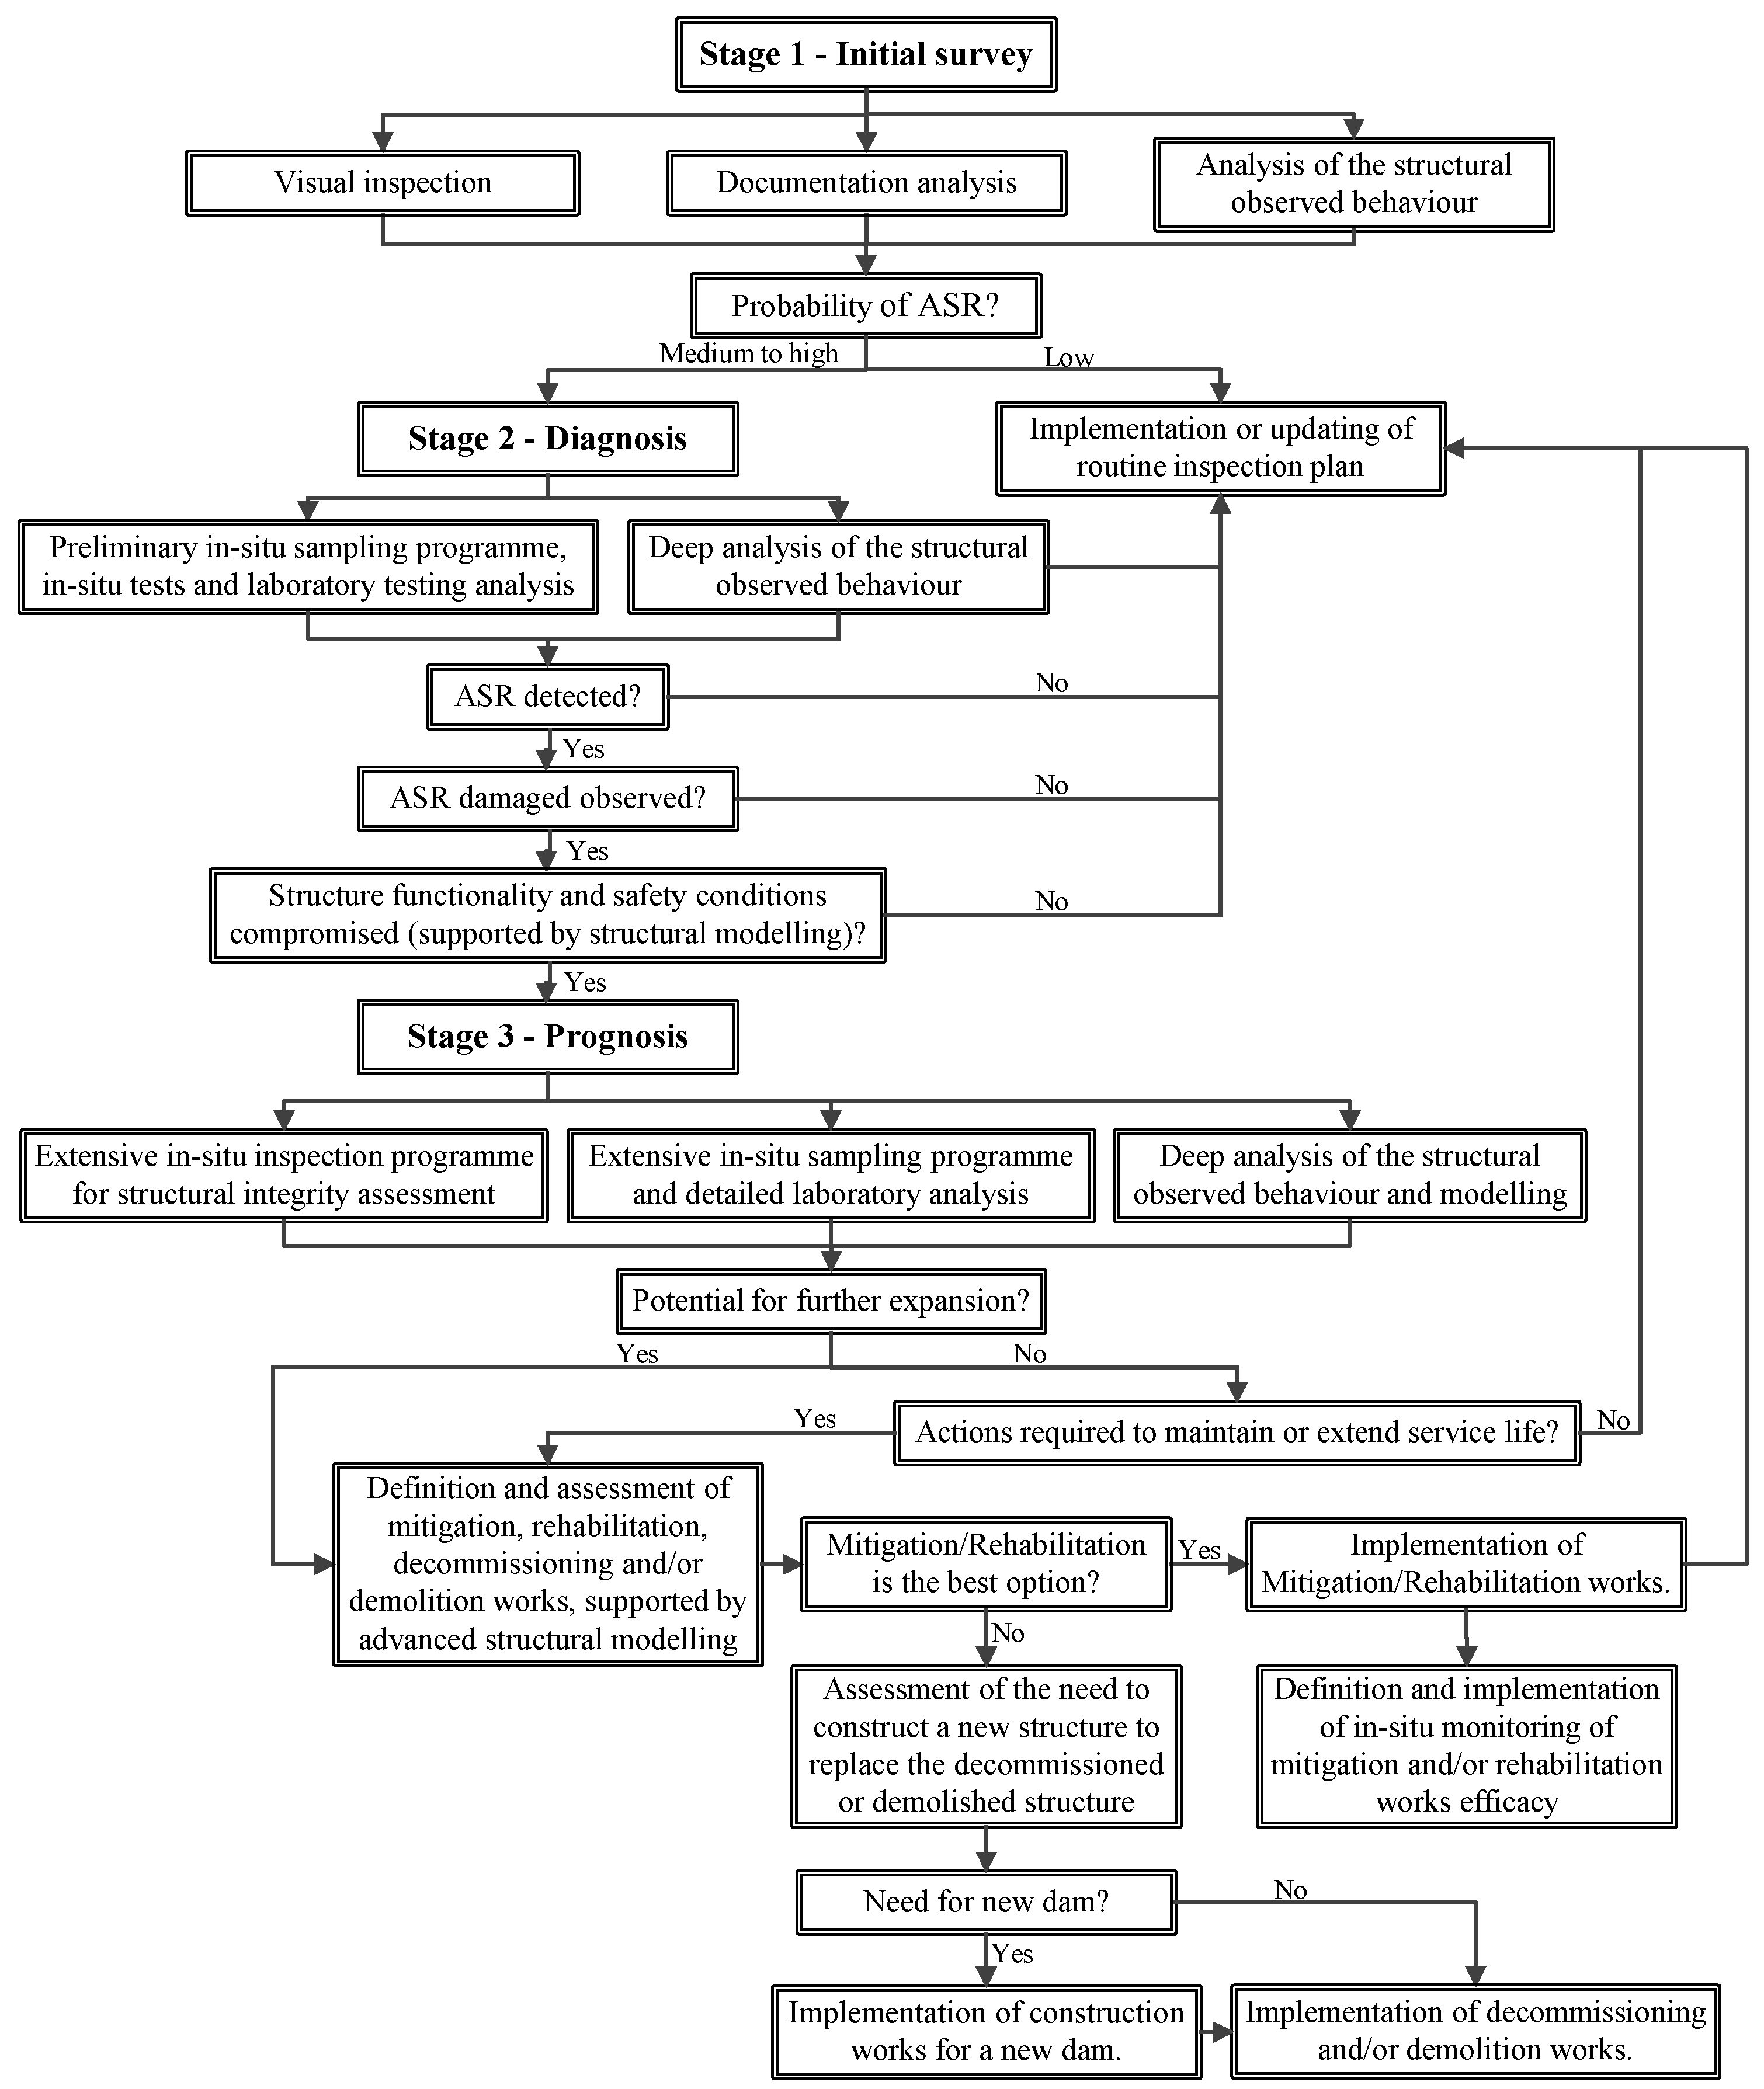
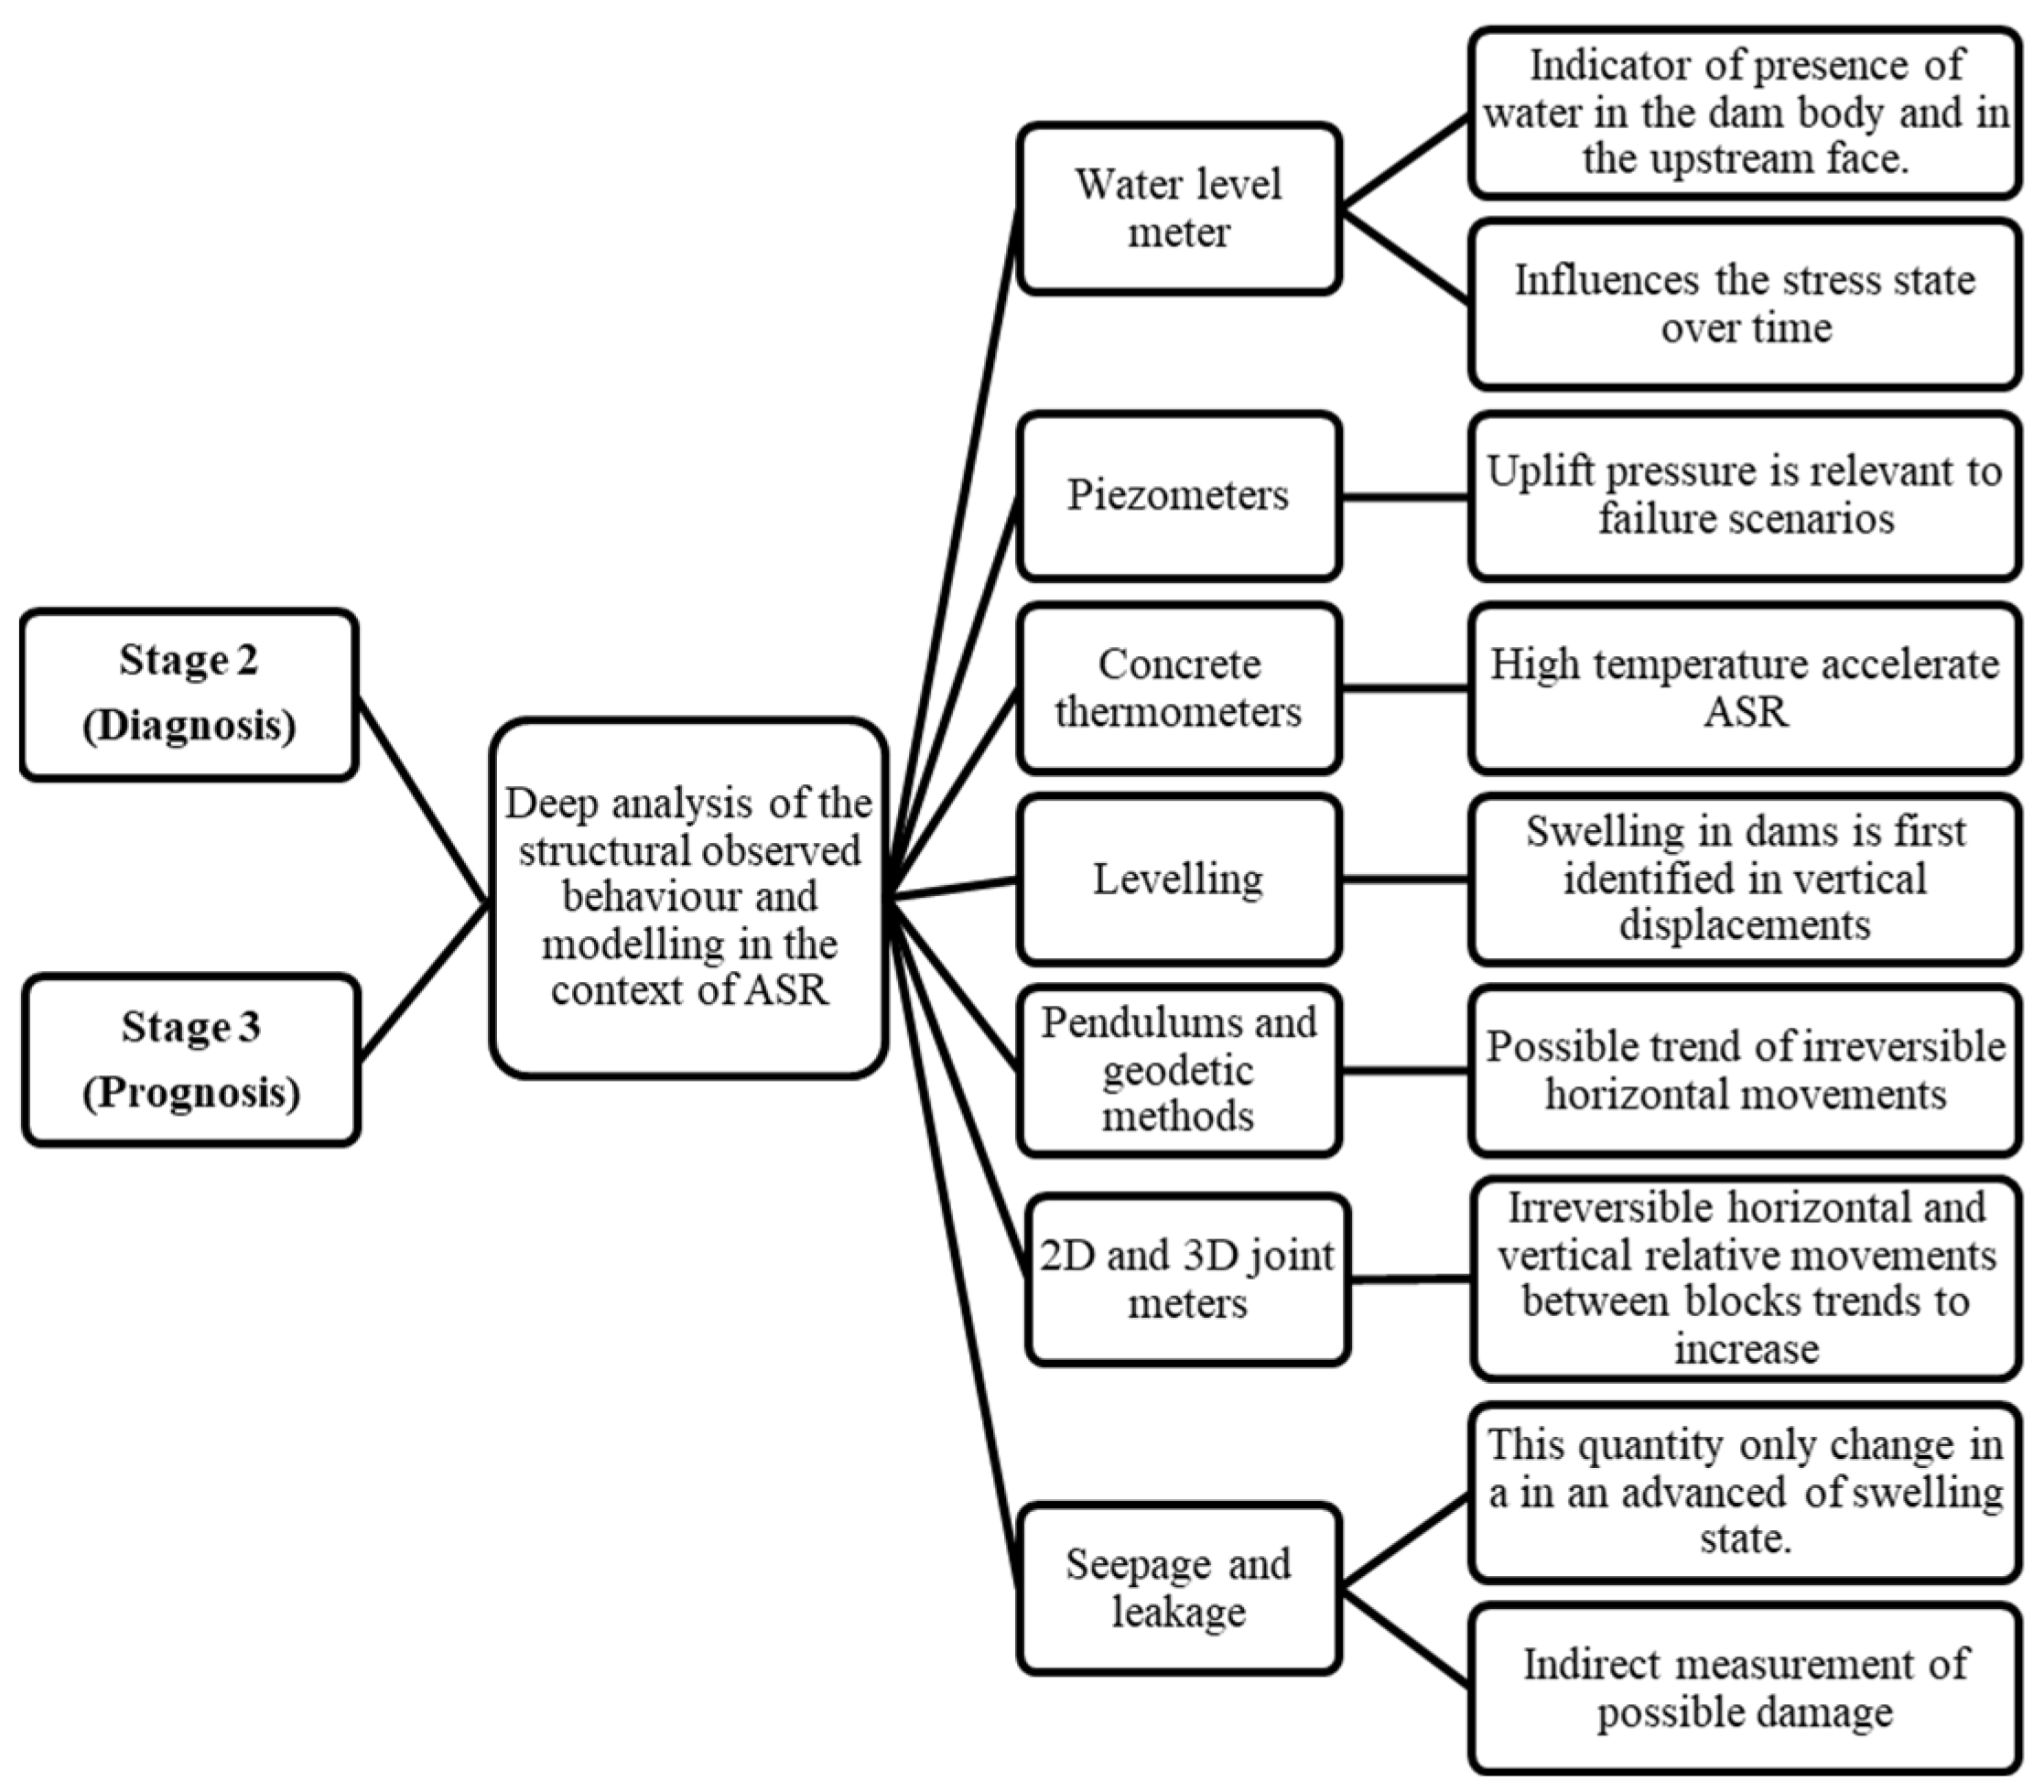
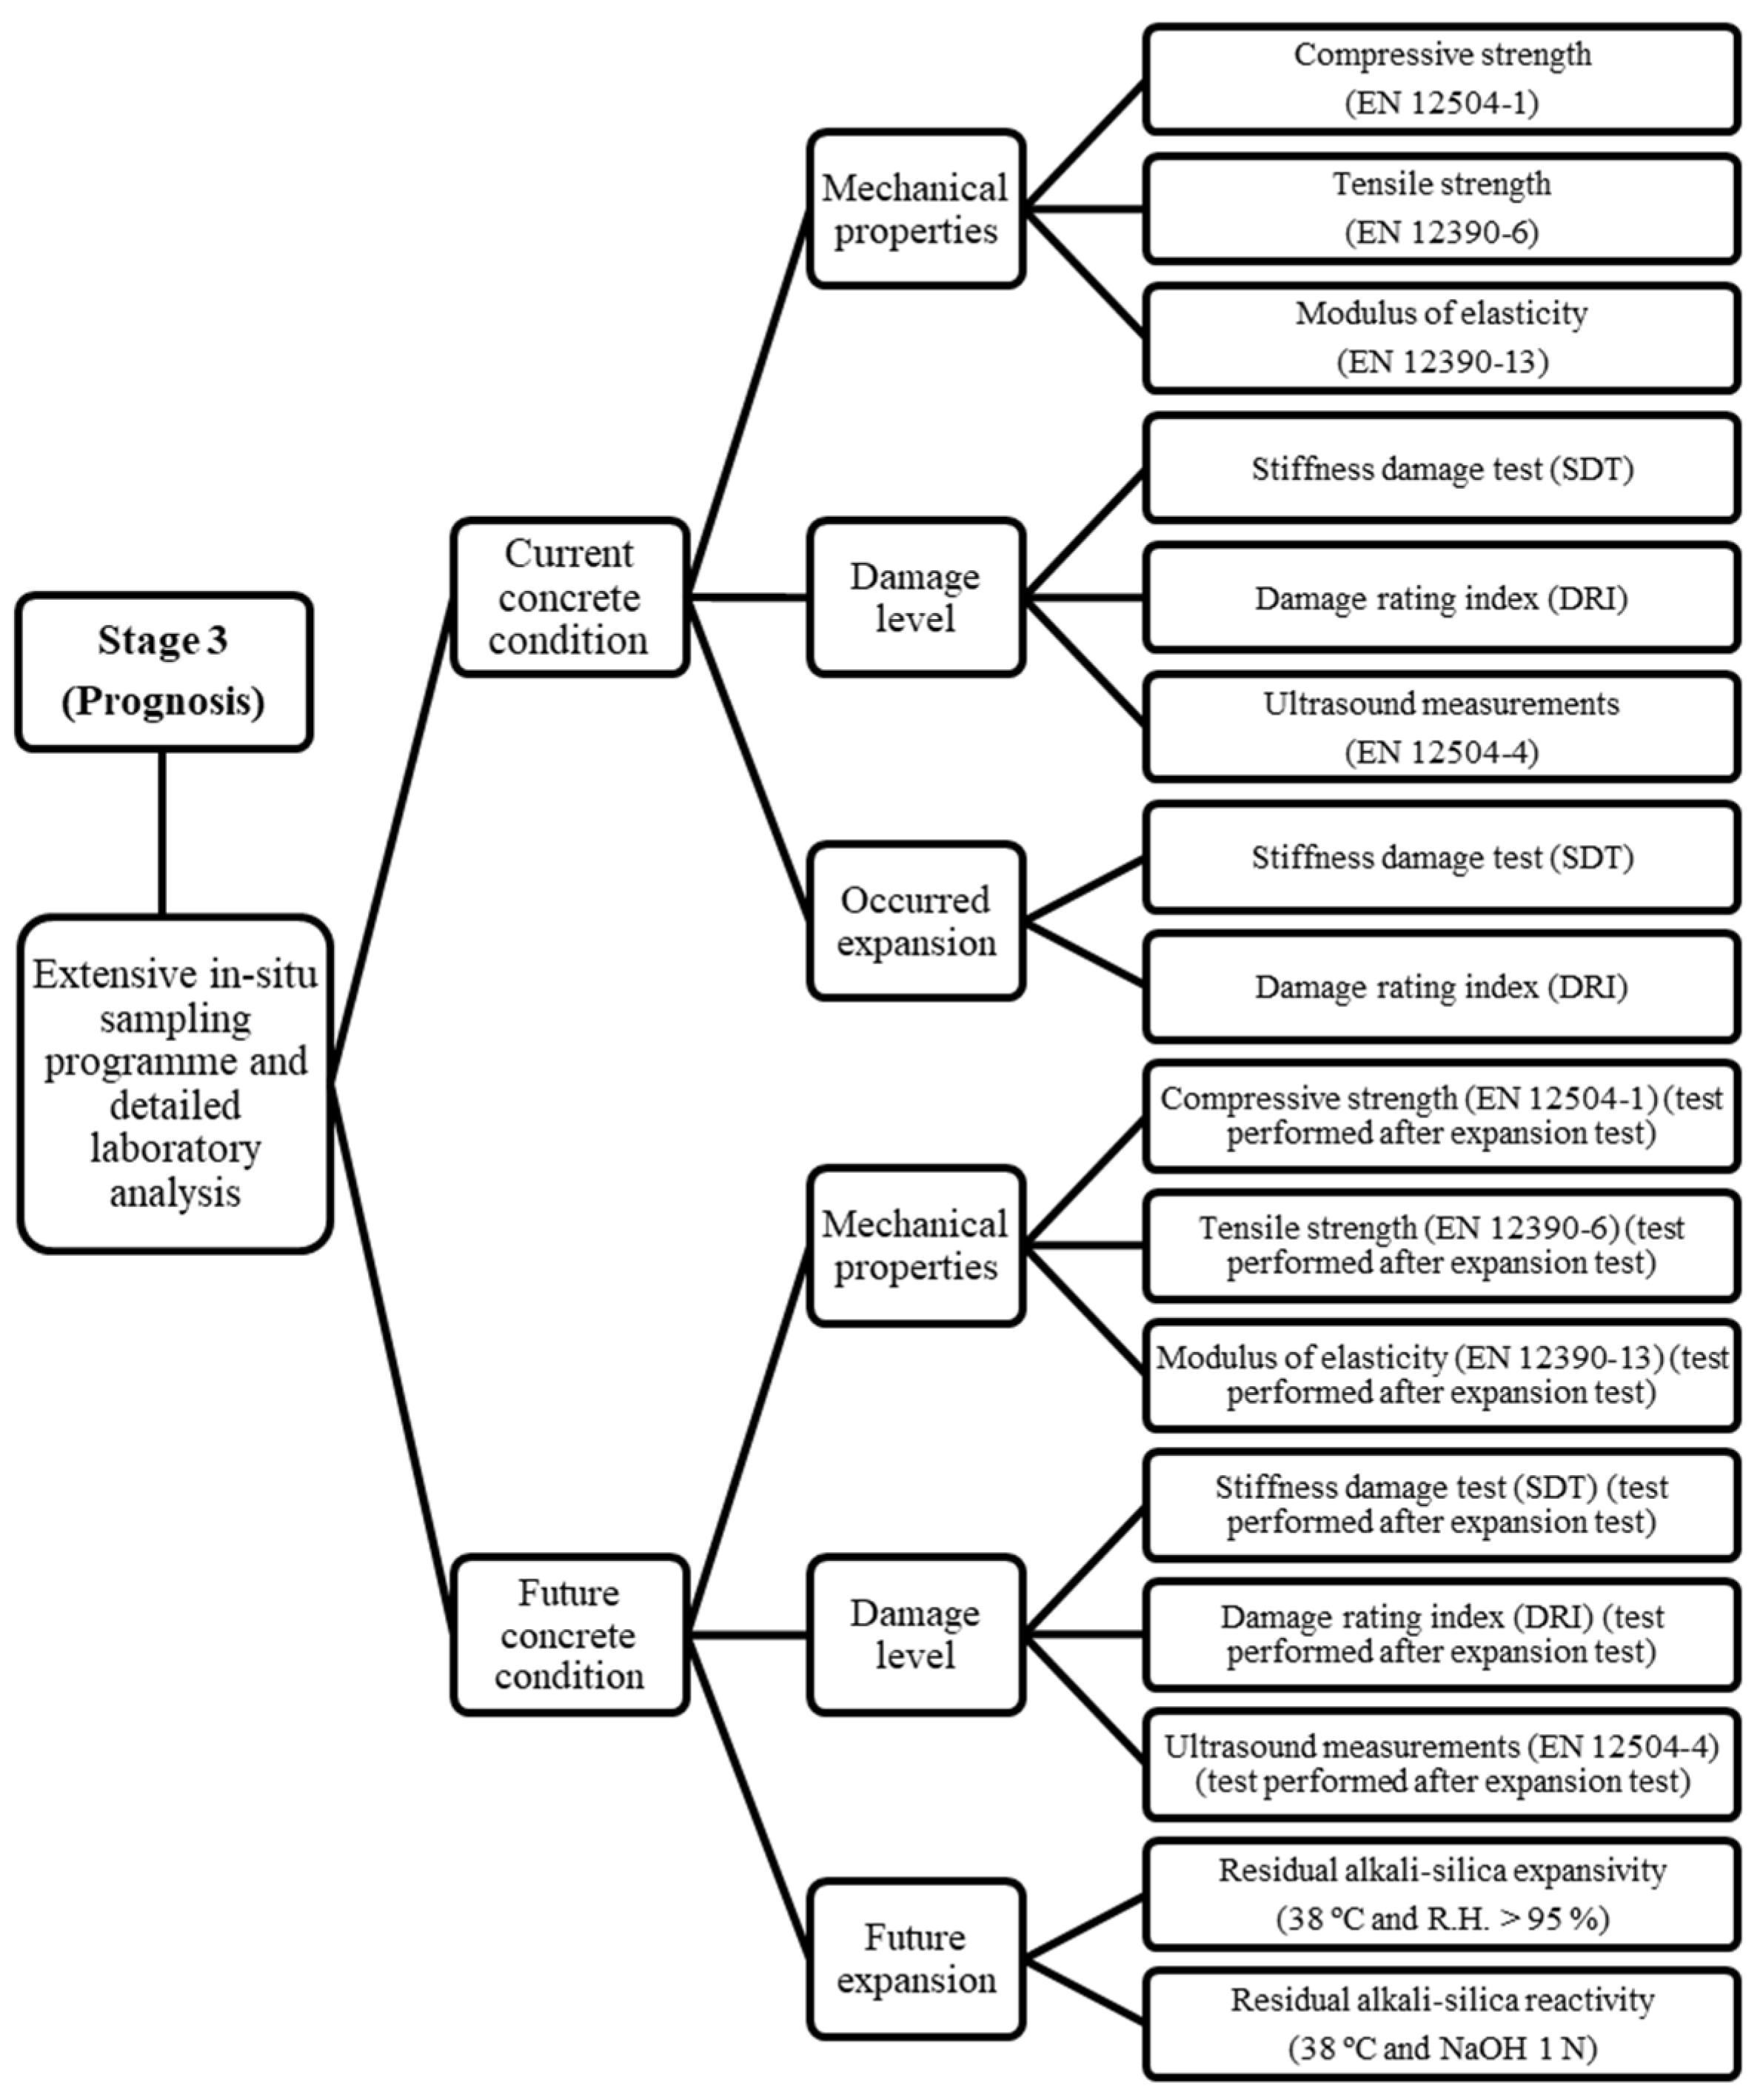
2. Diagnosis and Prognosis of ASR in Concrete Dams
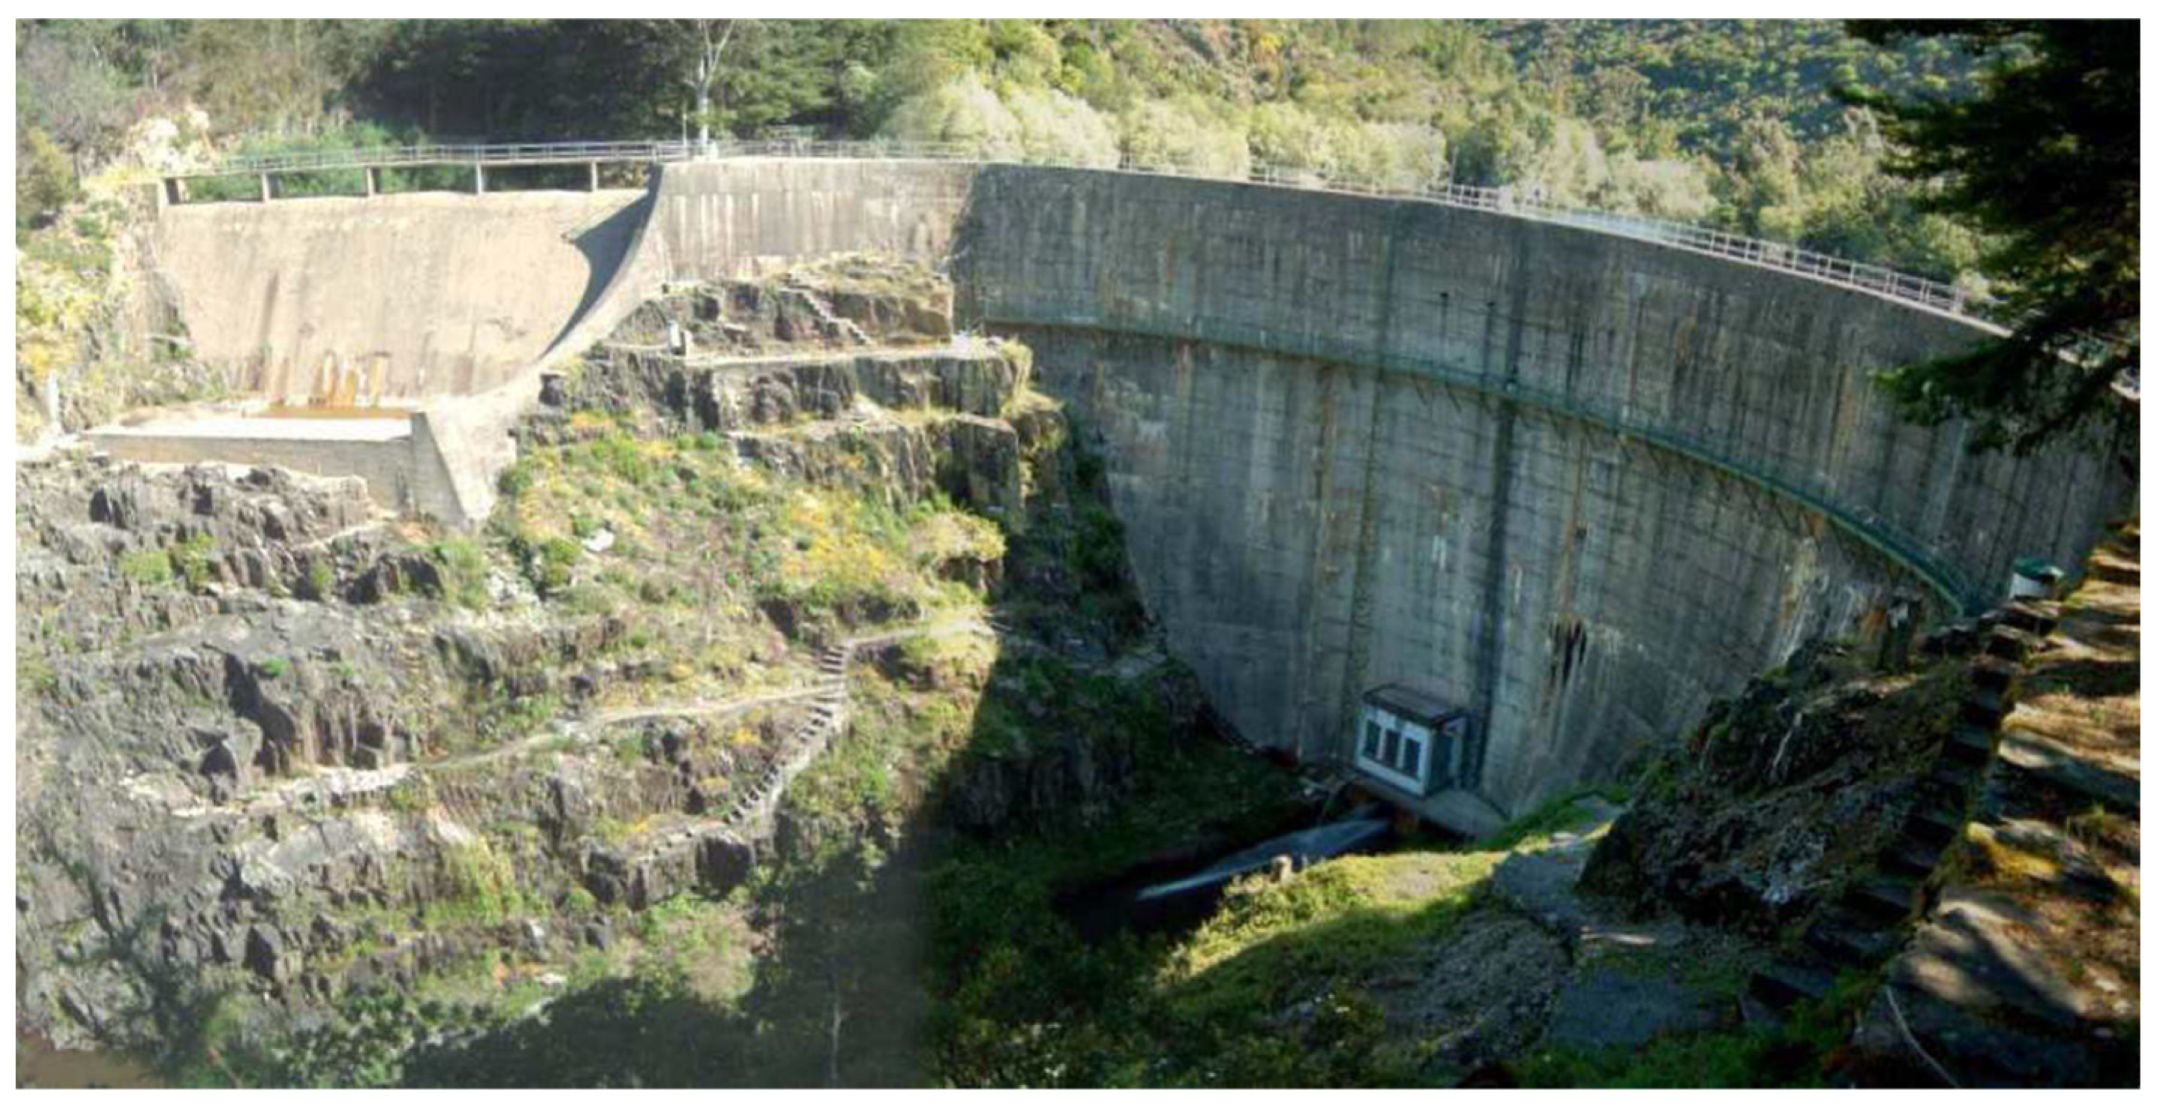
3. Case Study—The (Demolished) Alto Ceira Dam
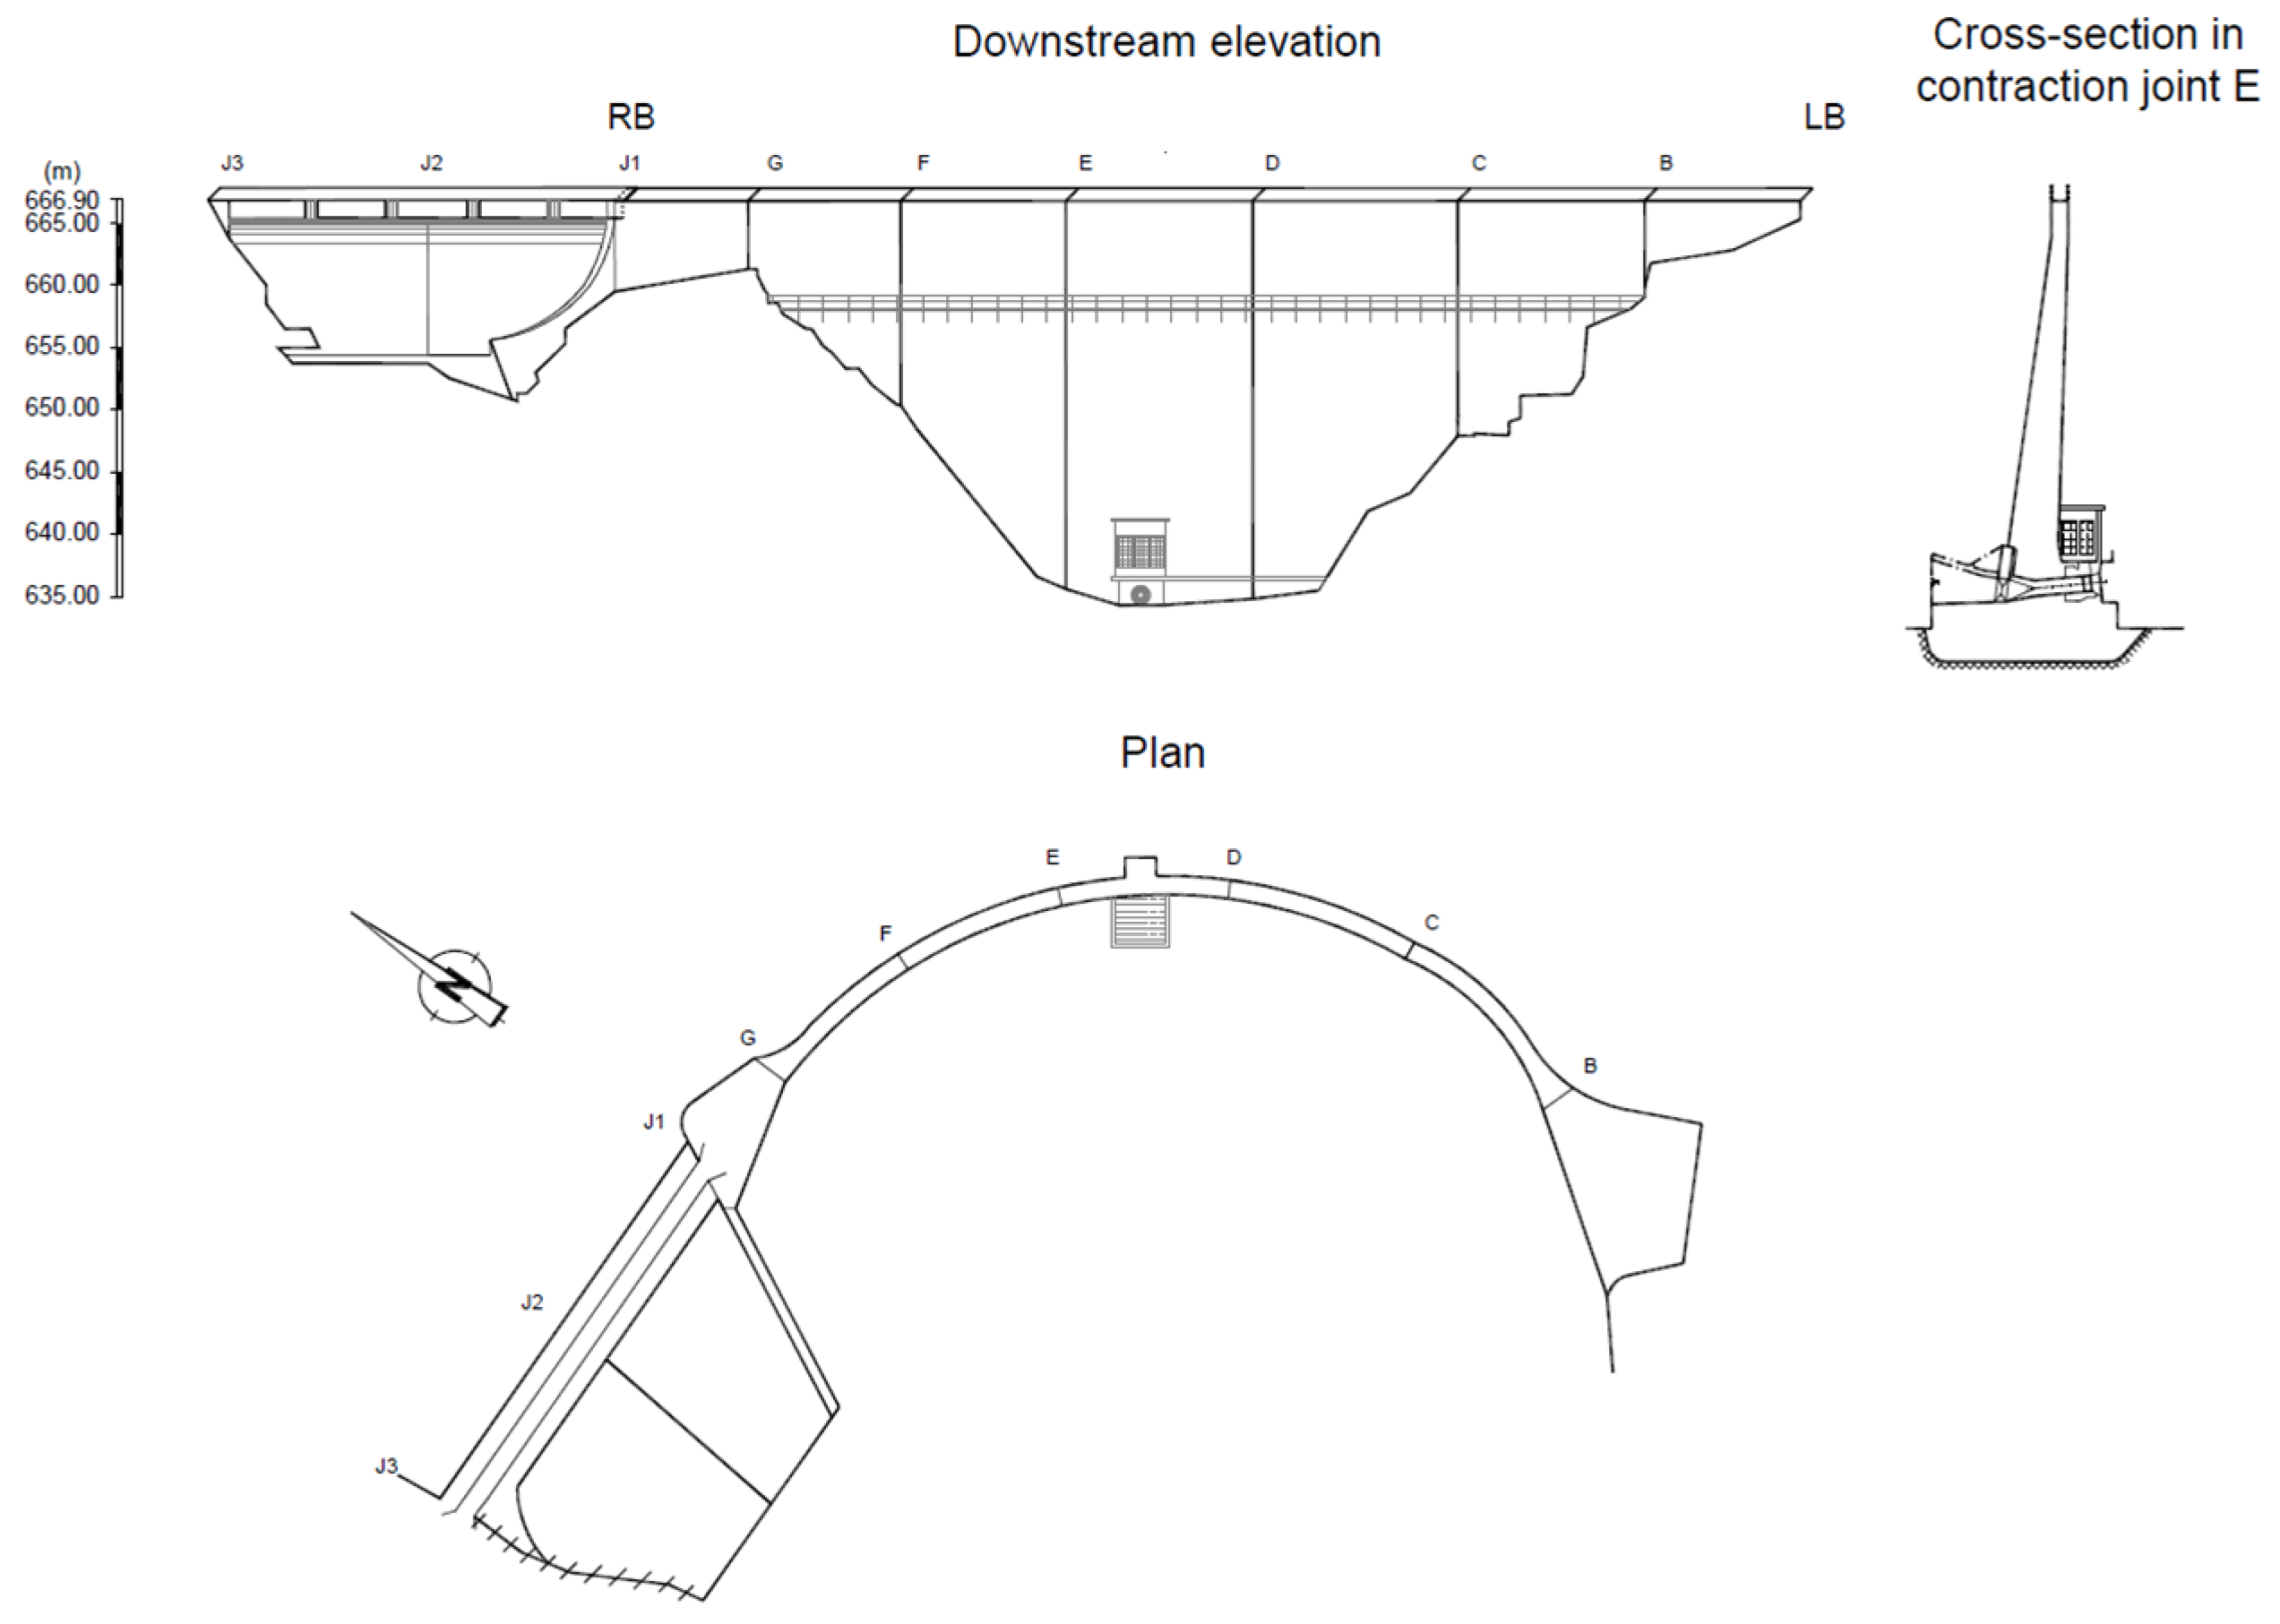
3.1. Introduction
3.2. An Analysis of the Structural Observed Behaviour Due to Swelling Phenomenon
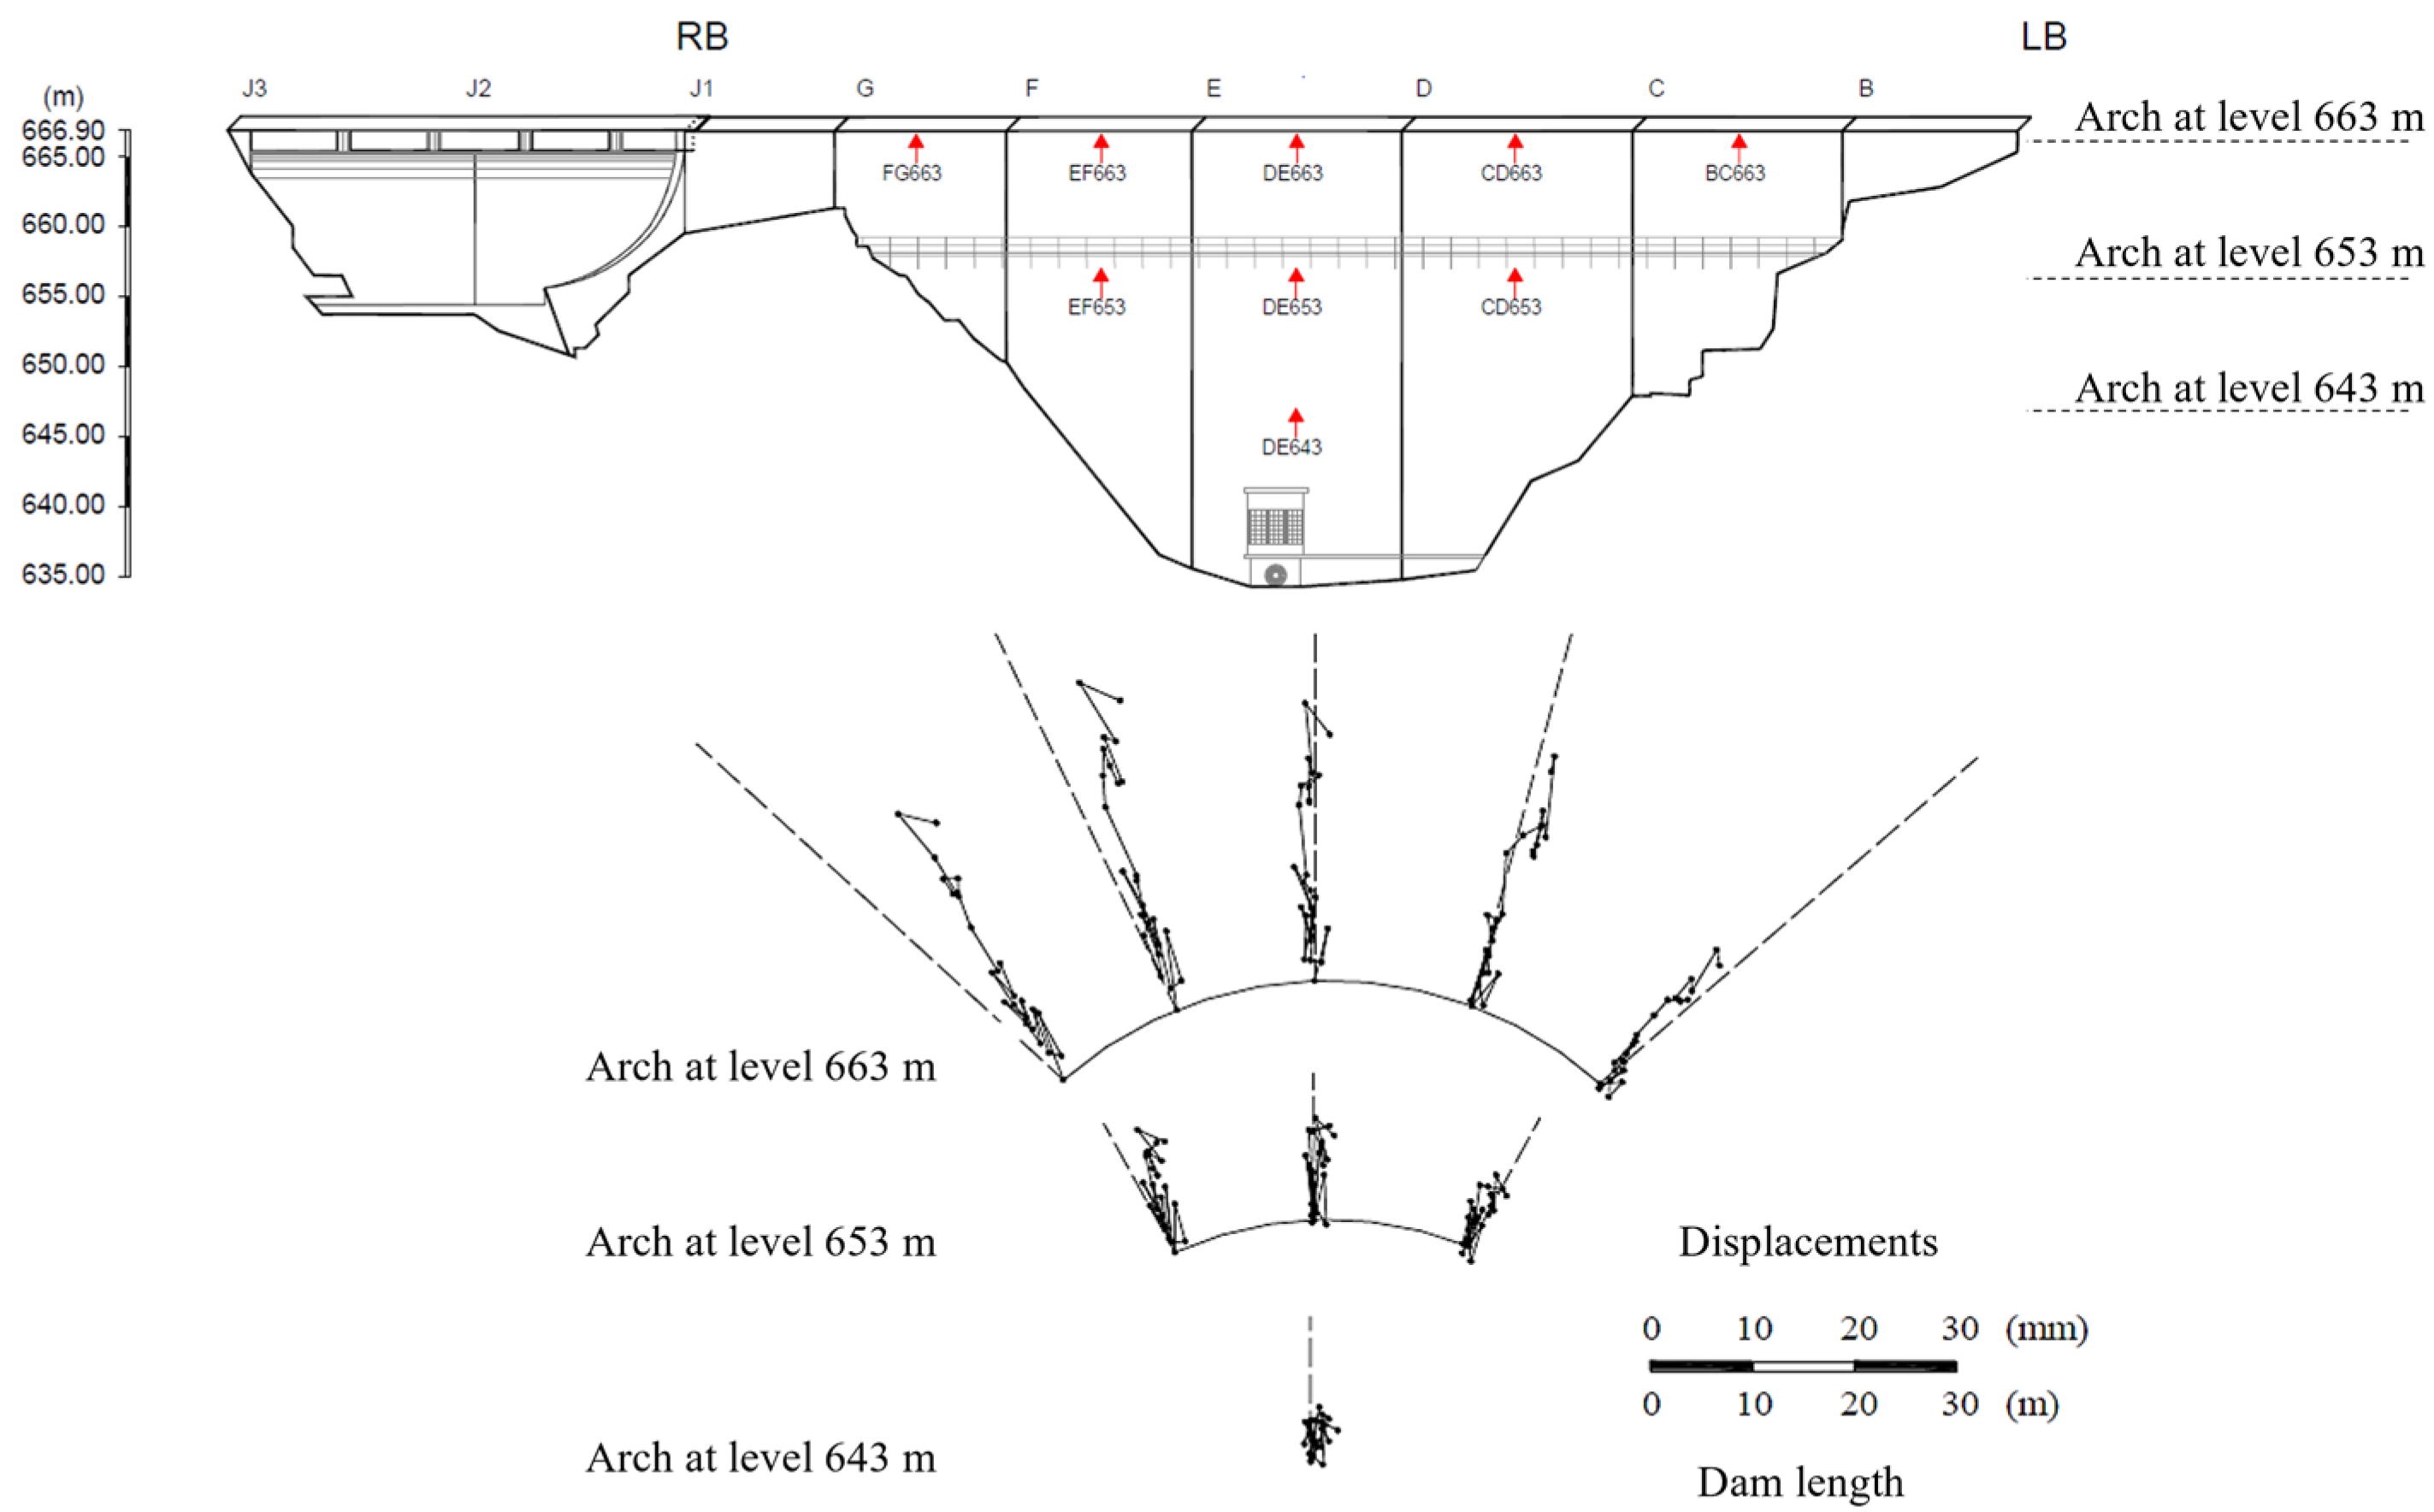
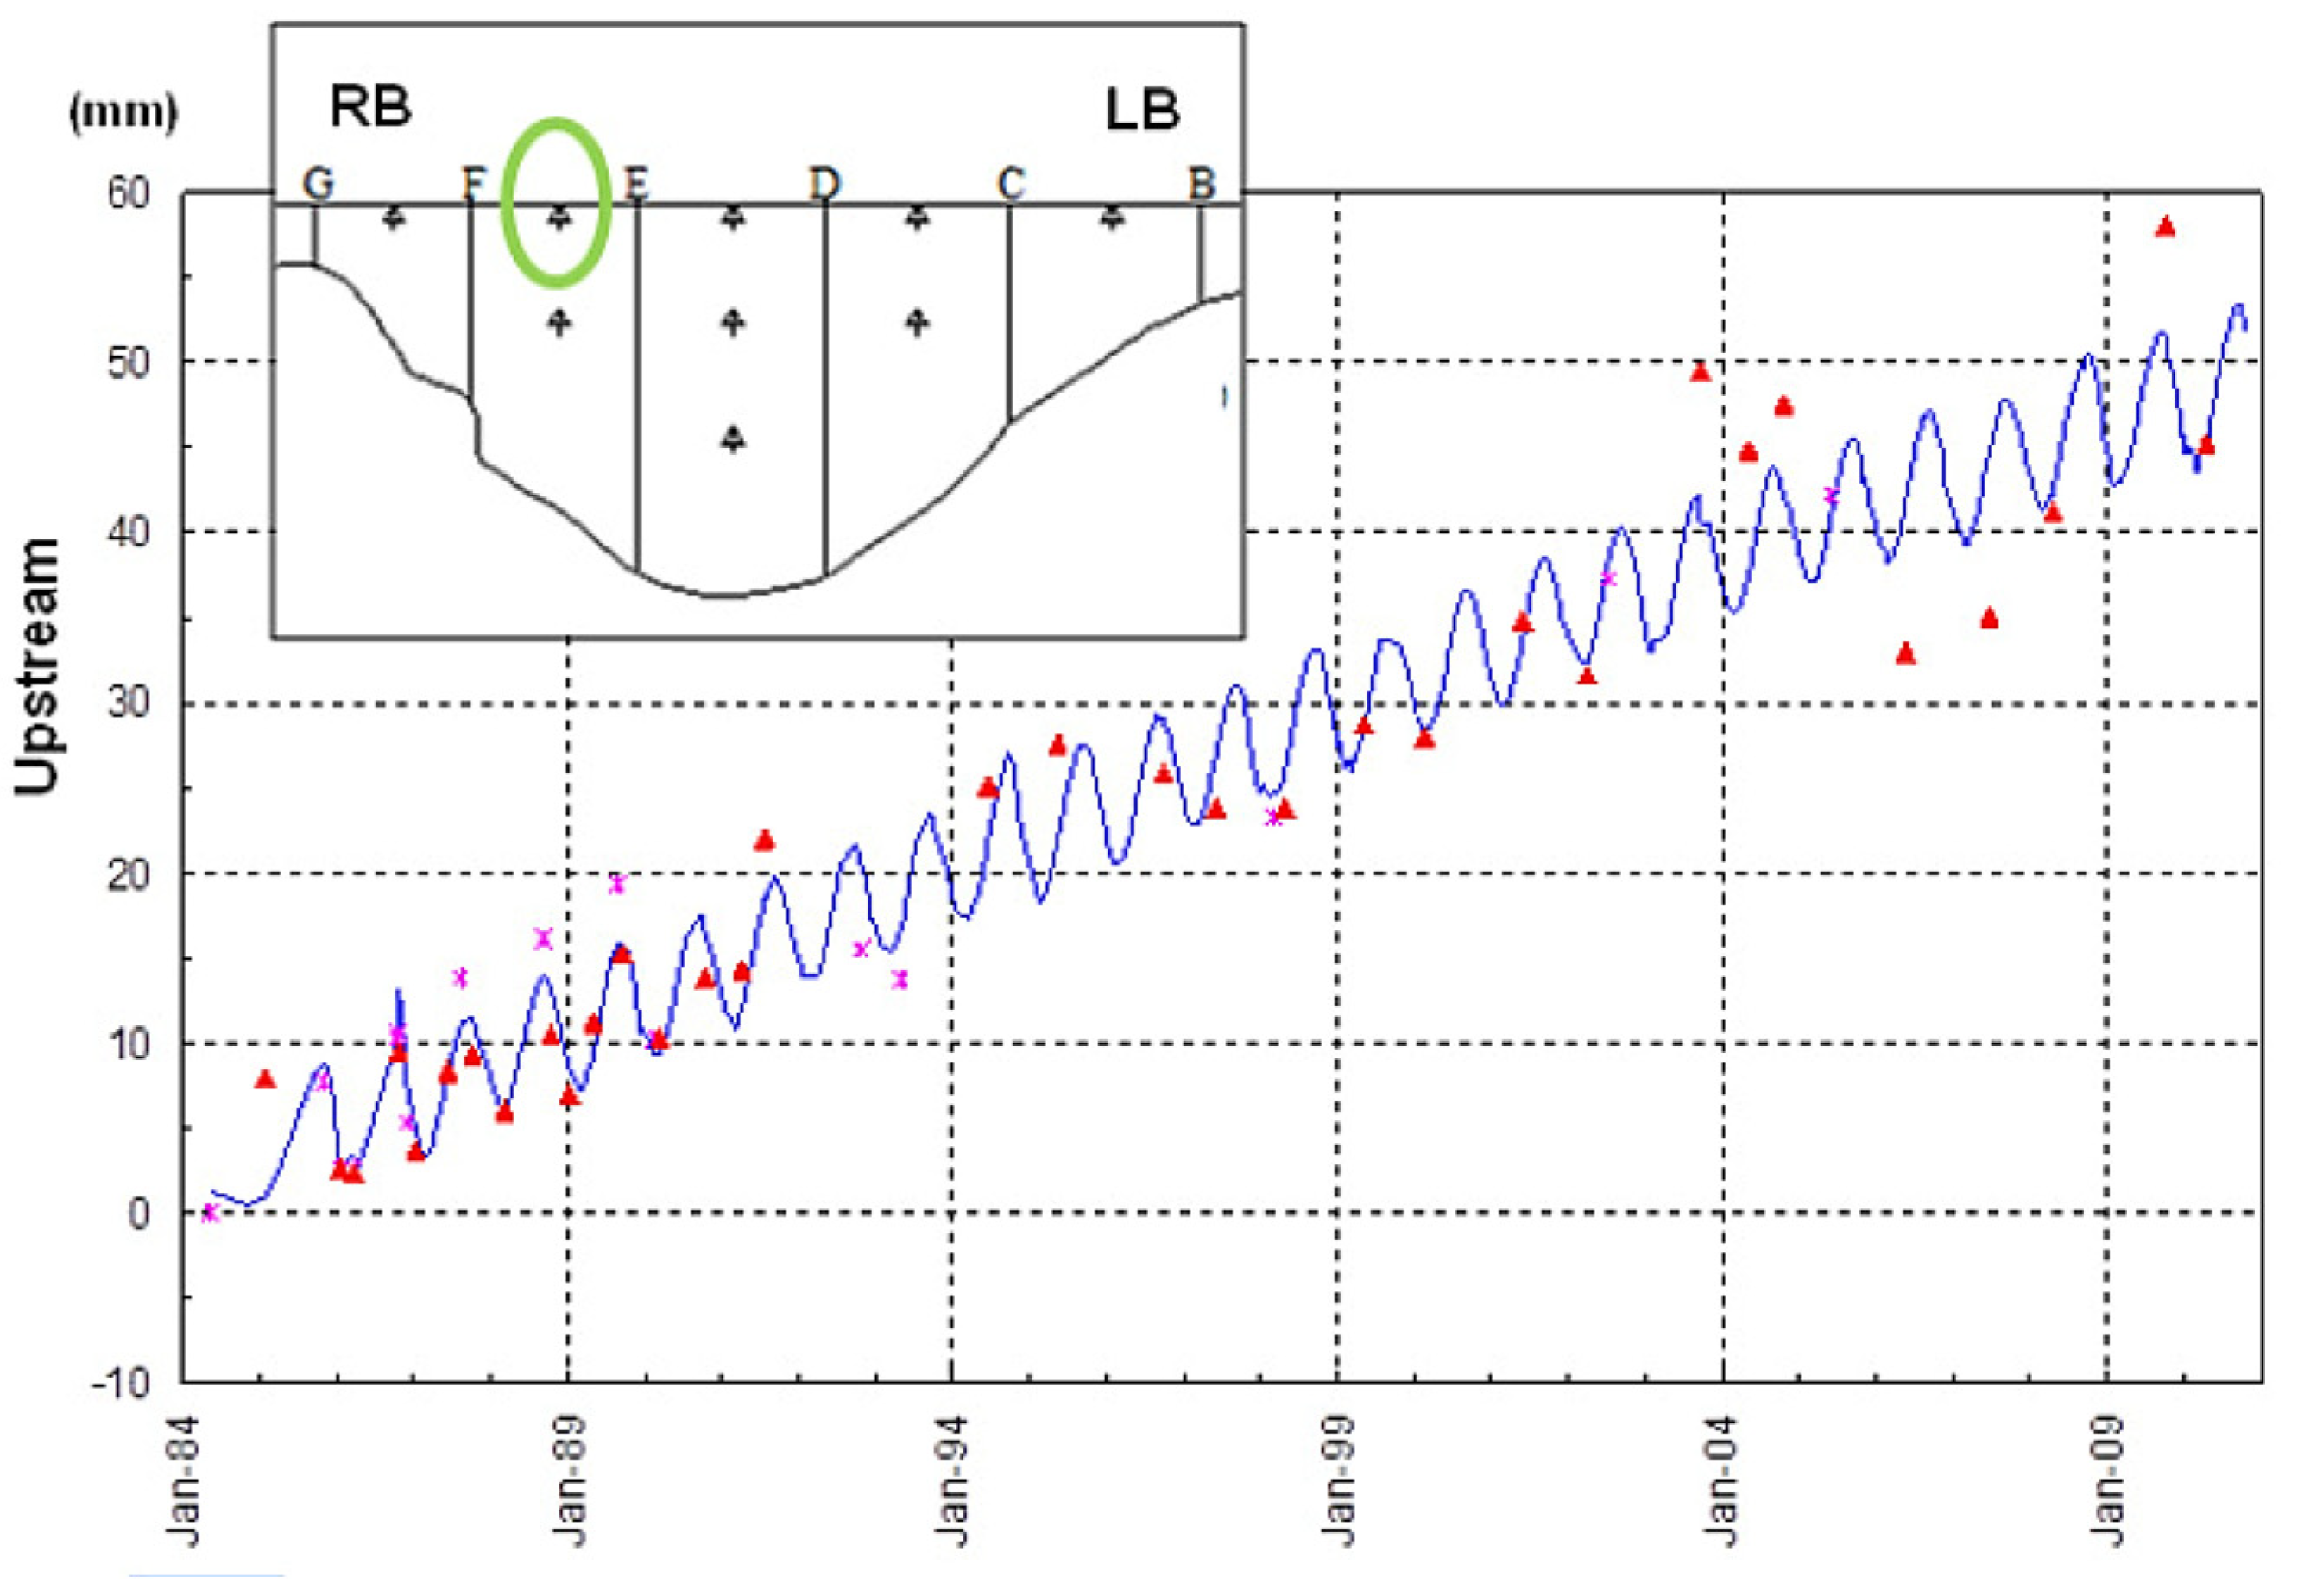
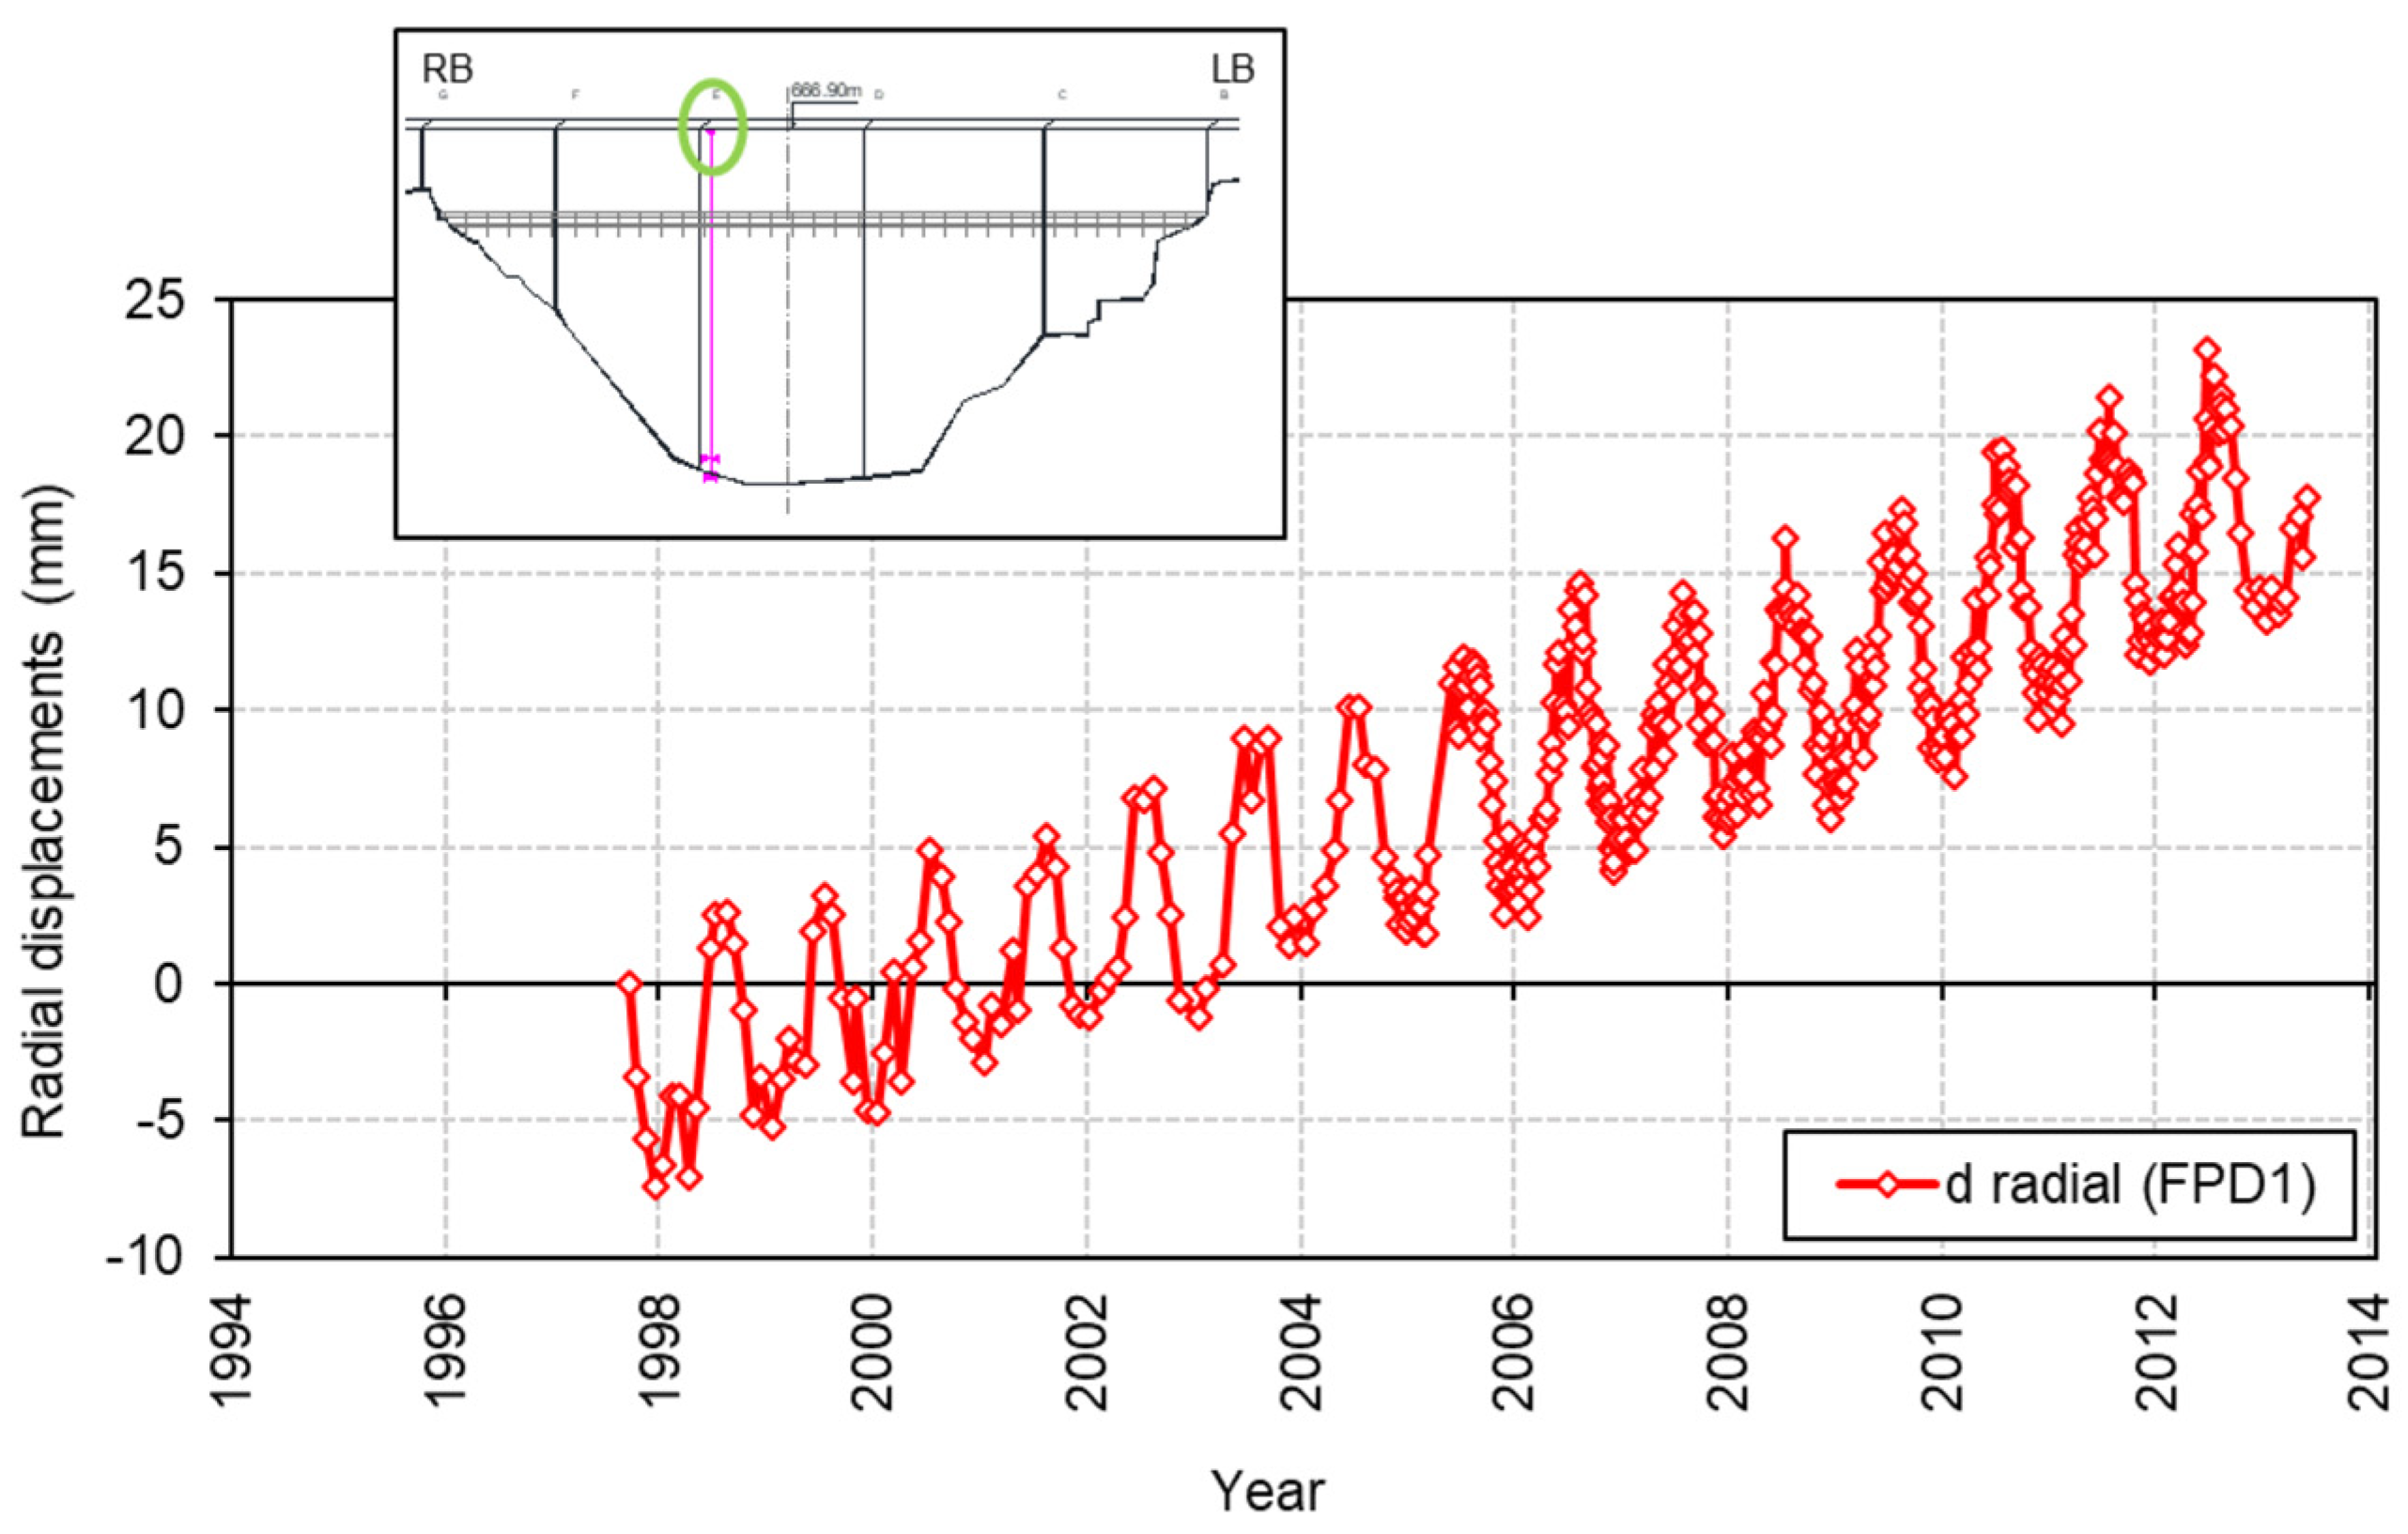
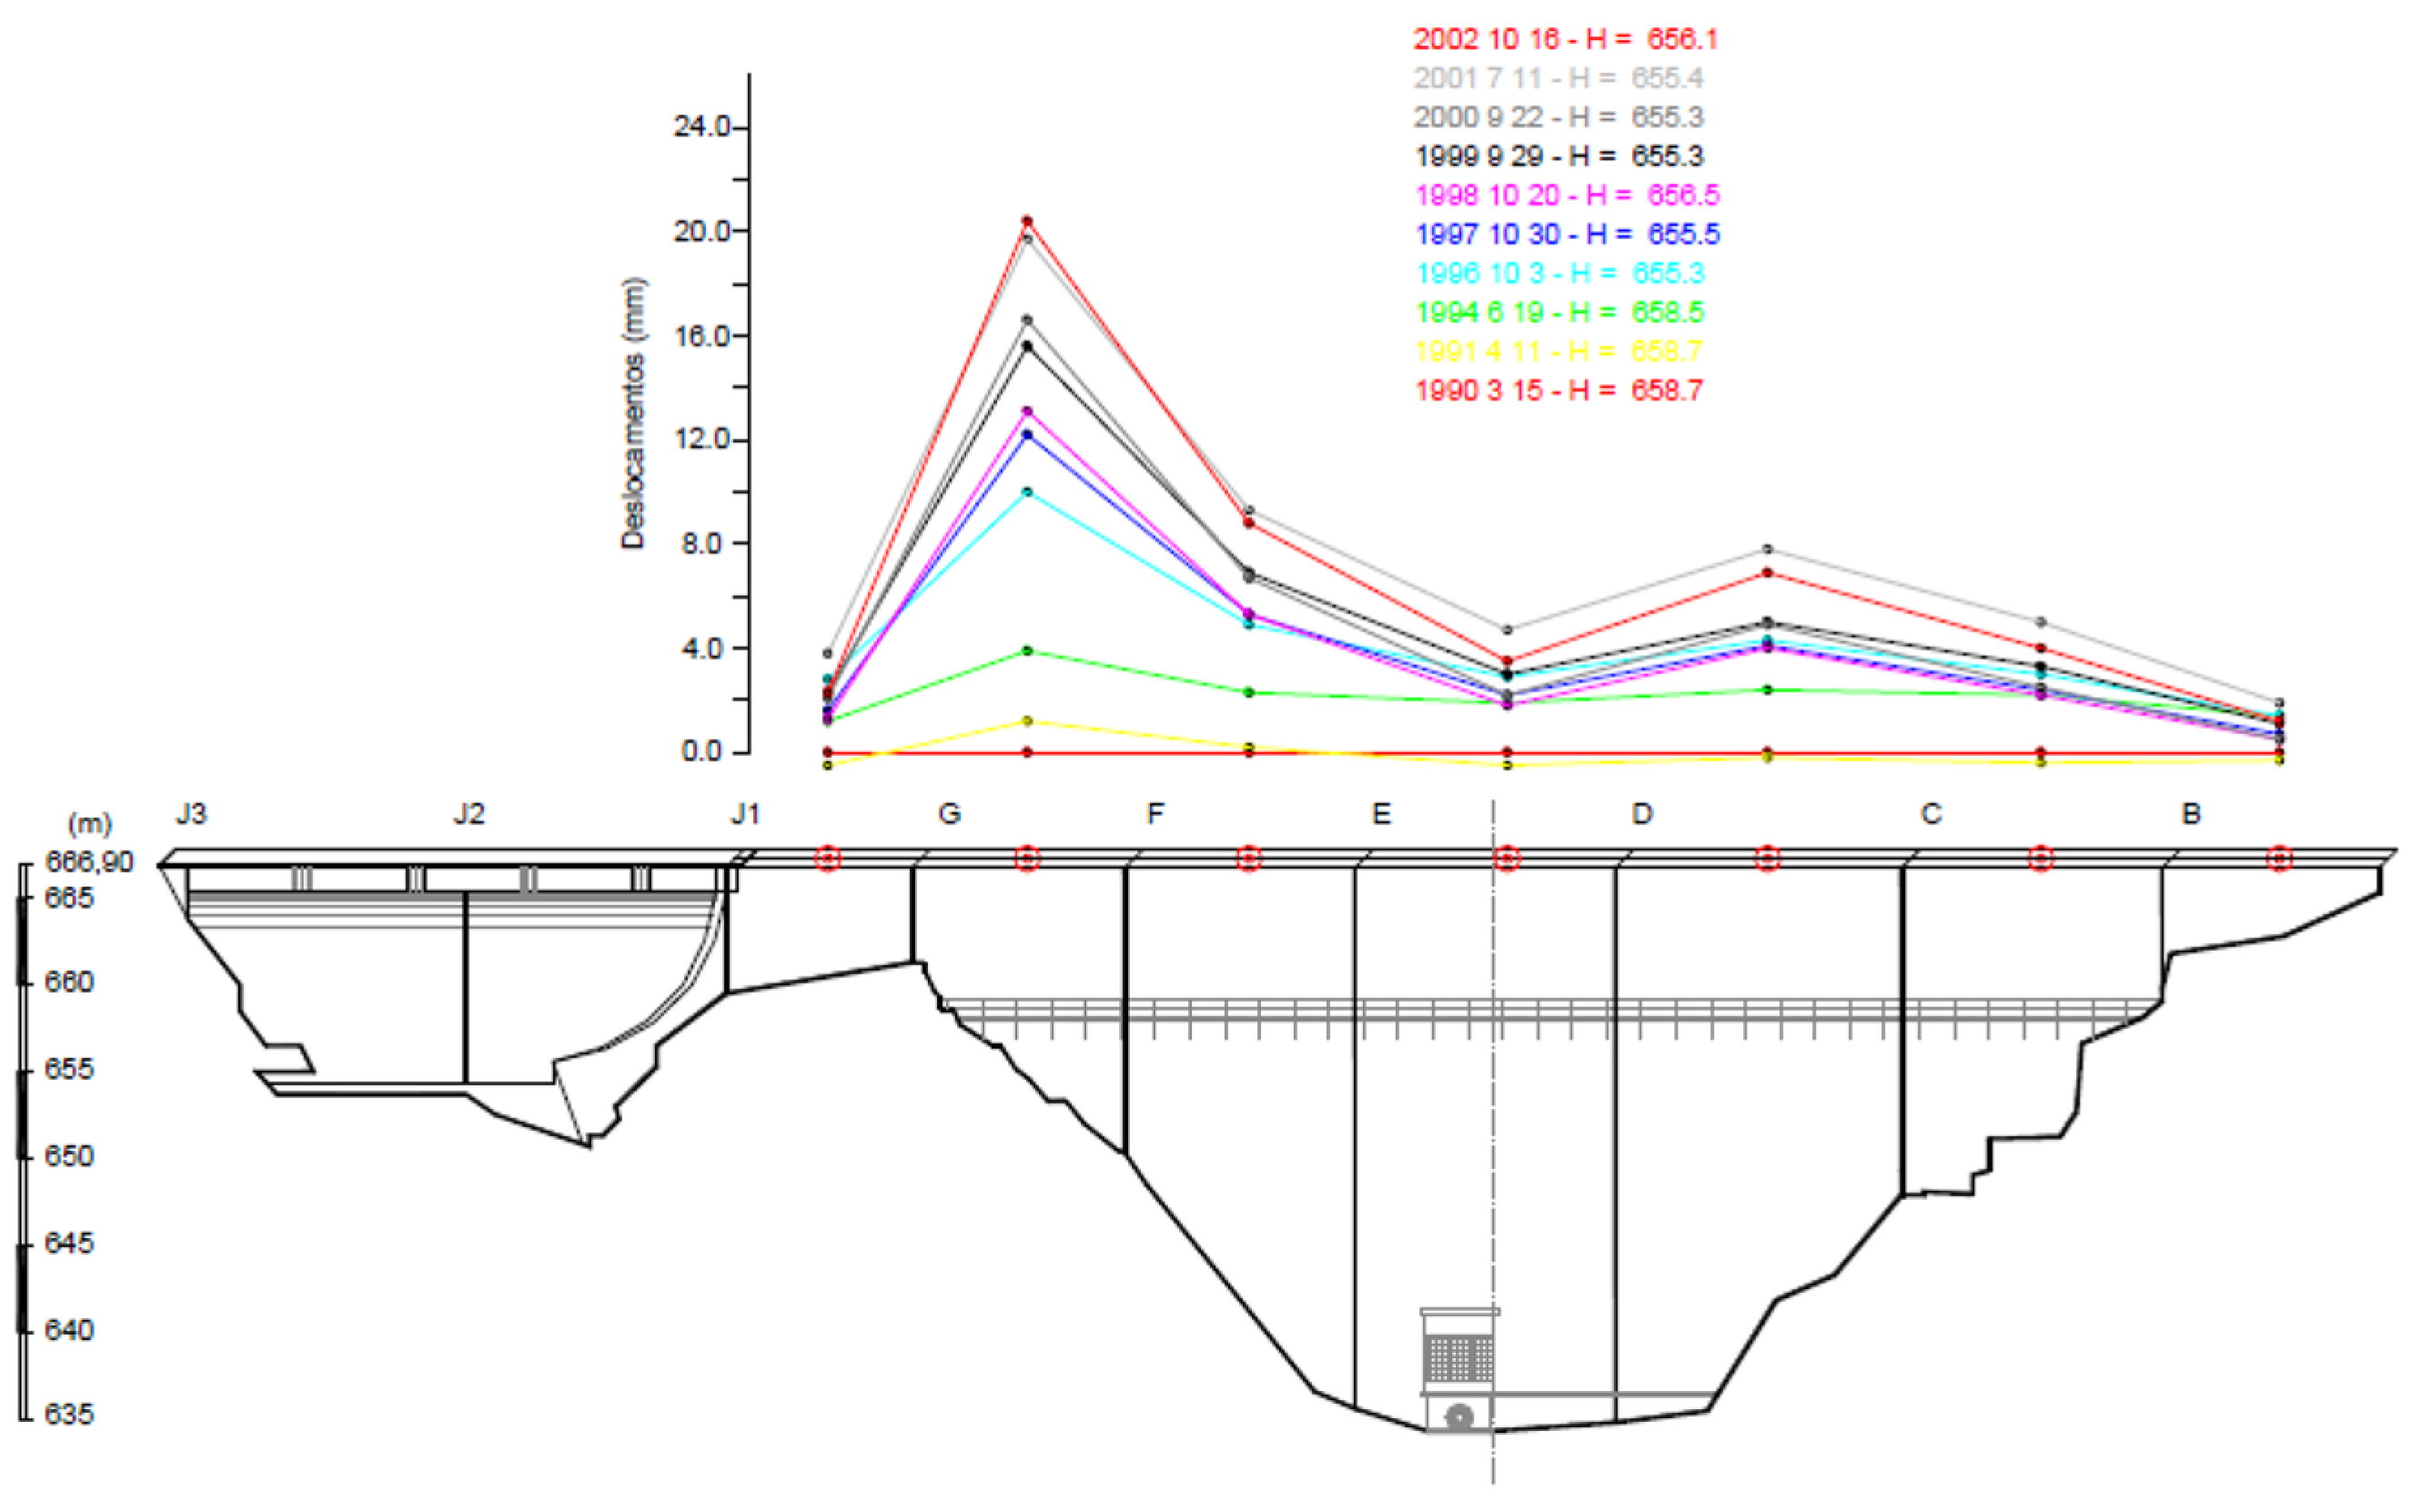
3.2.1. Observed Horizontal Displacements
3.2.2. Observed Vertical Displacements
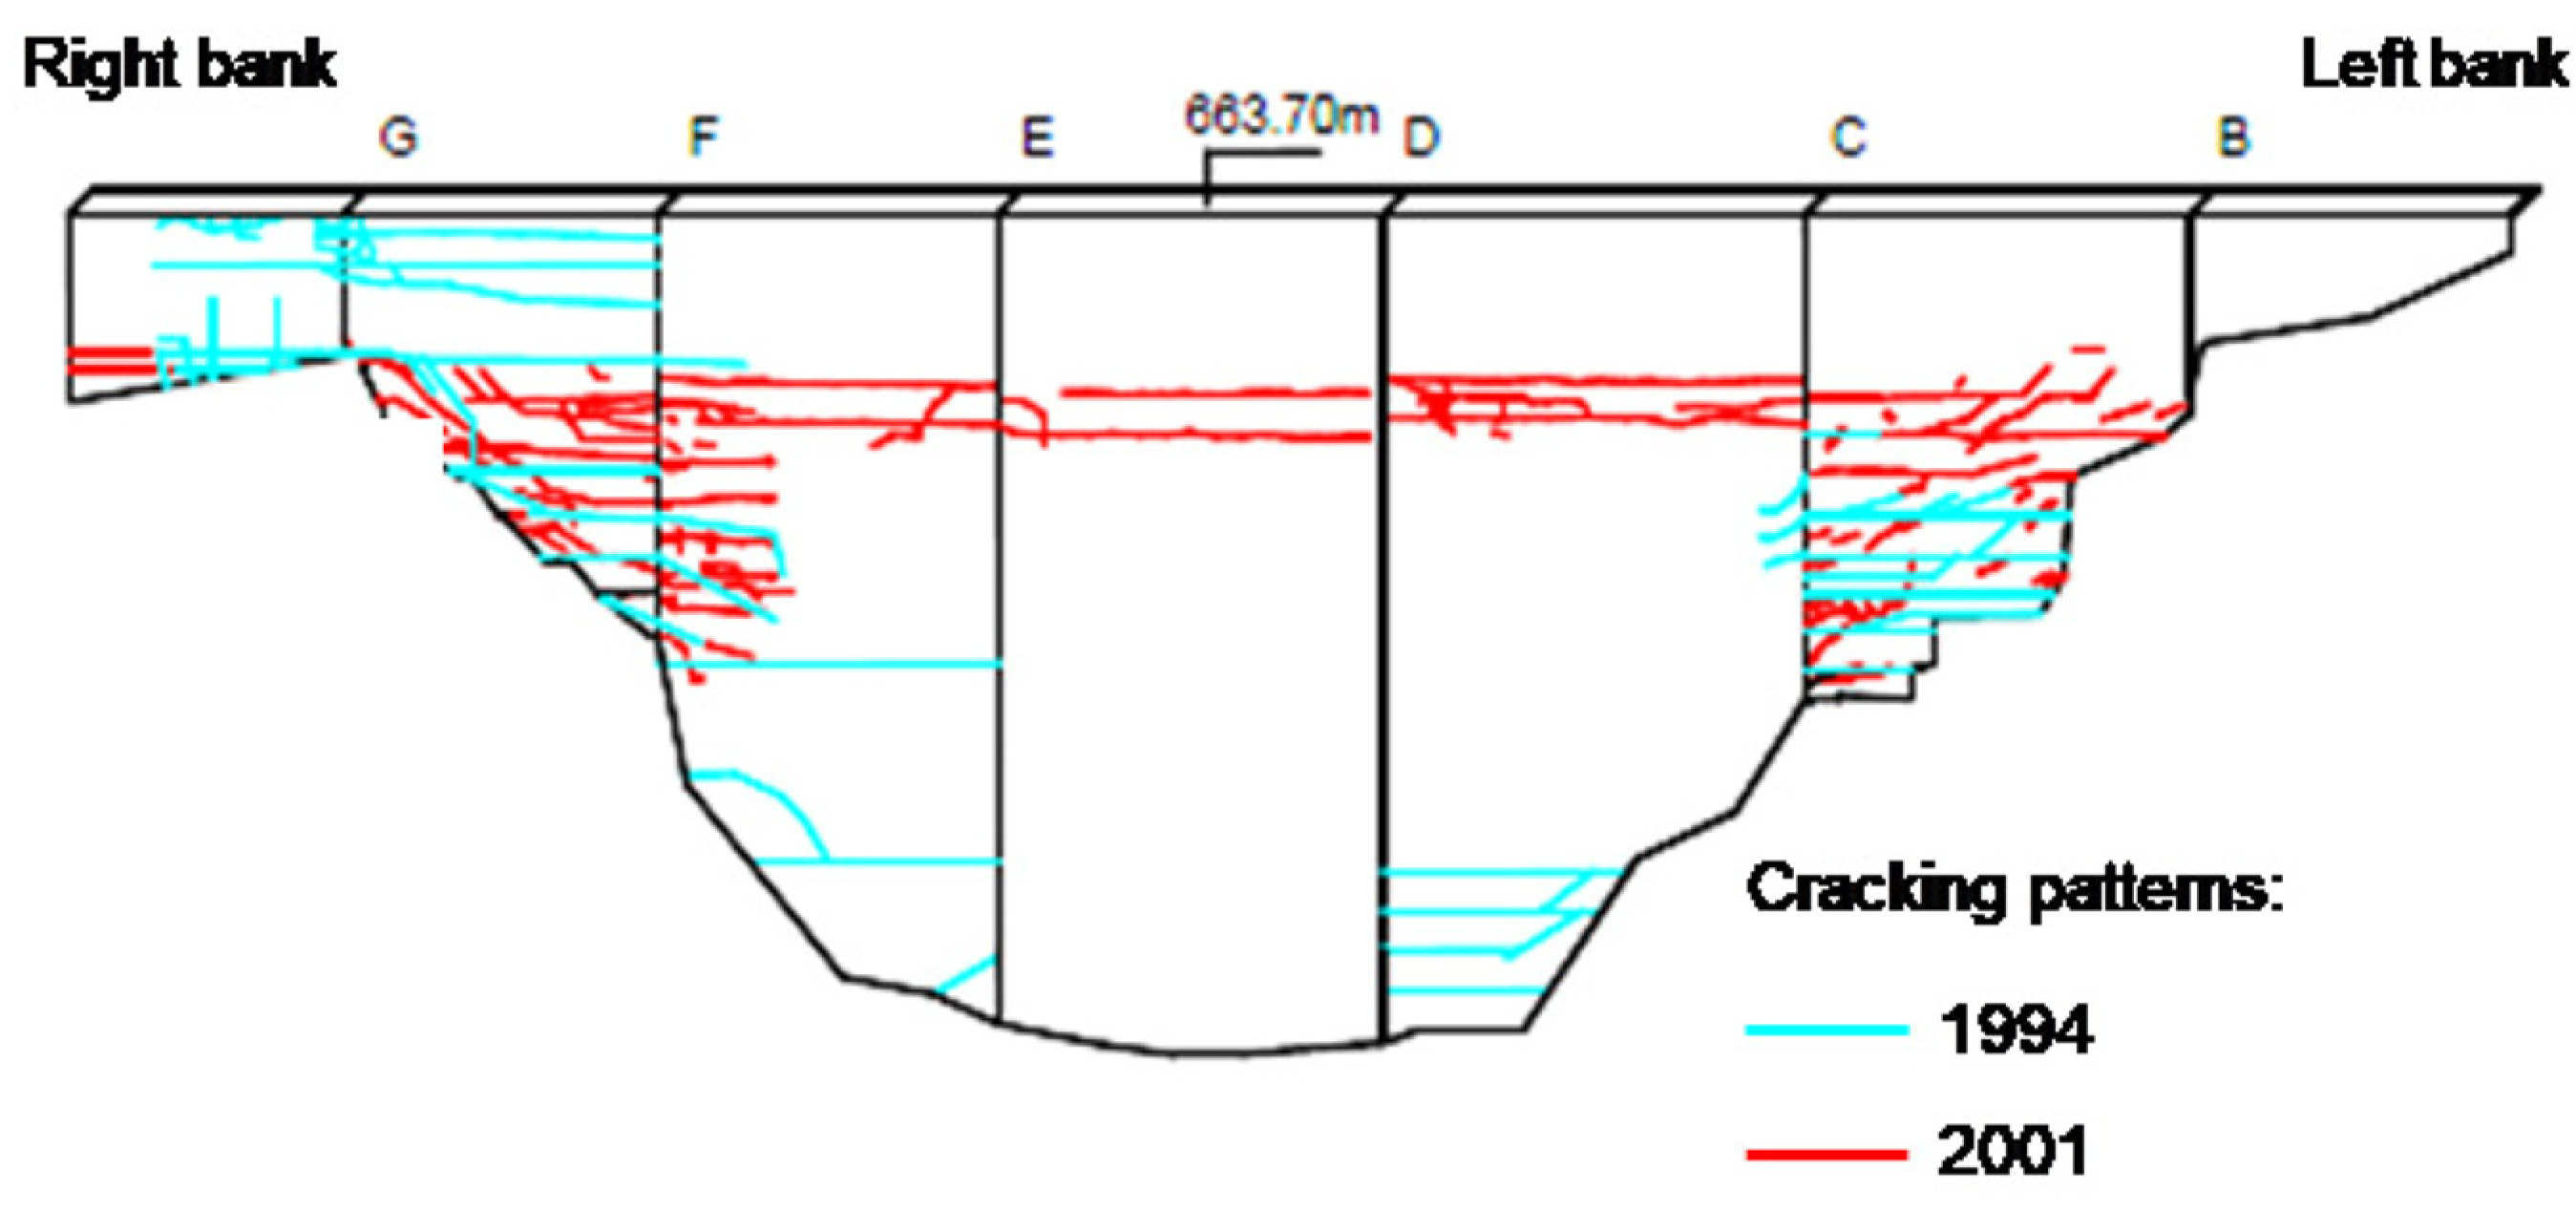
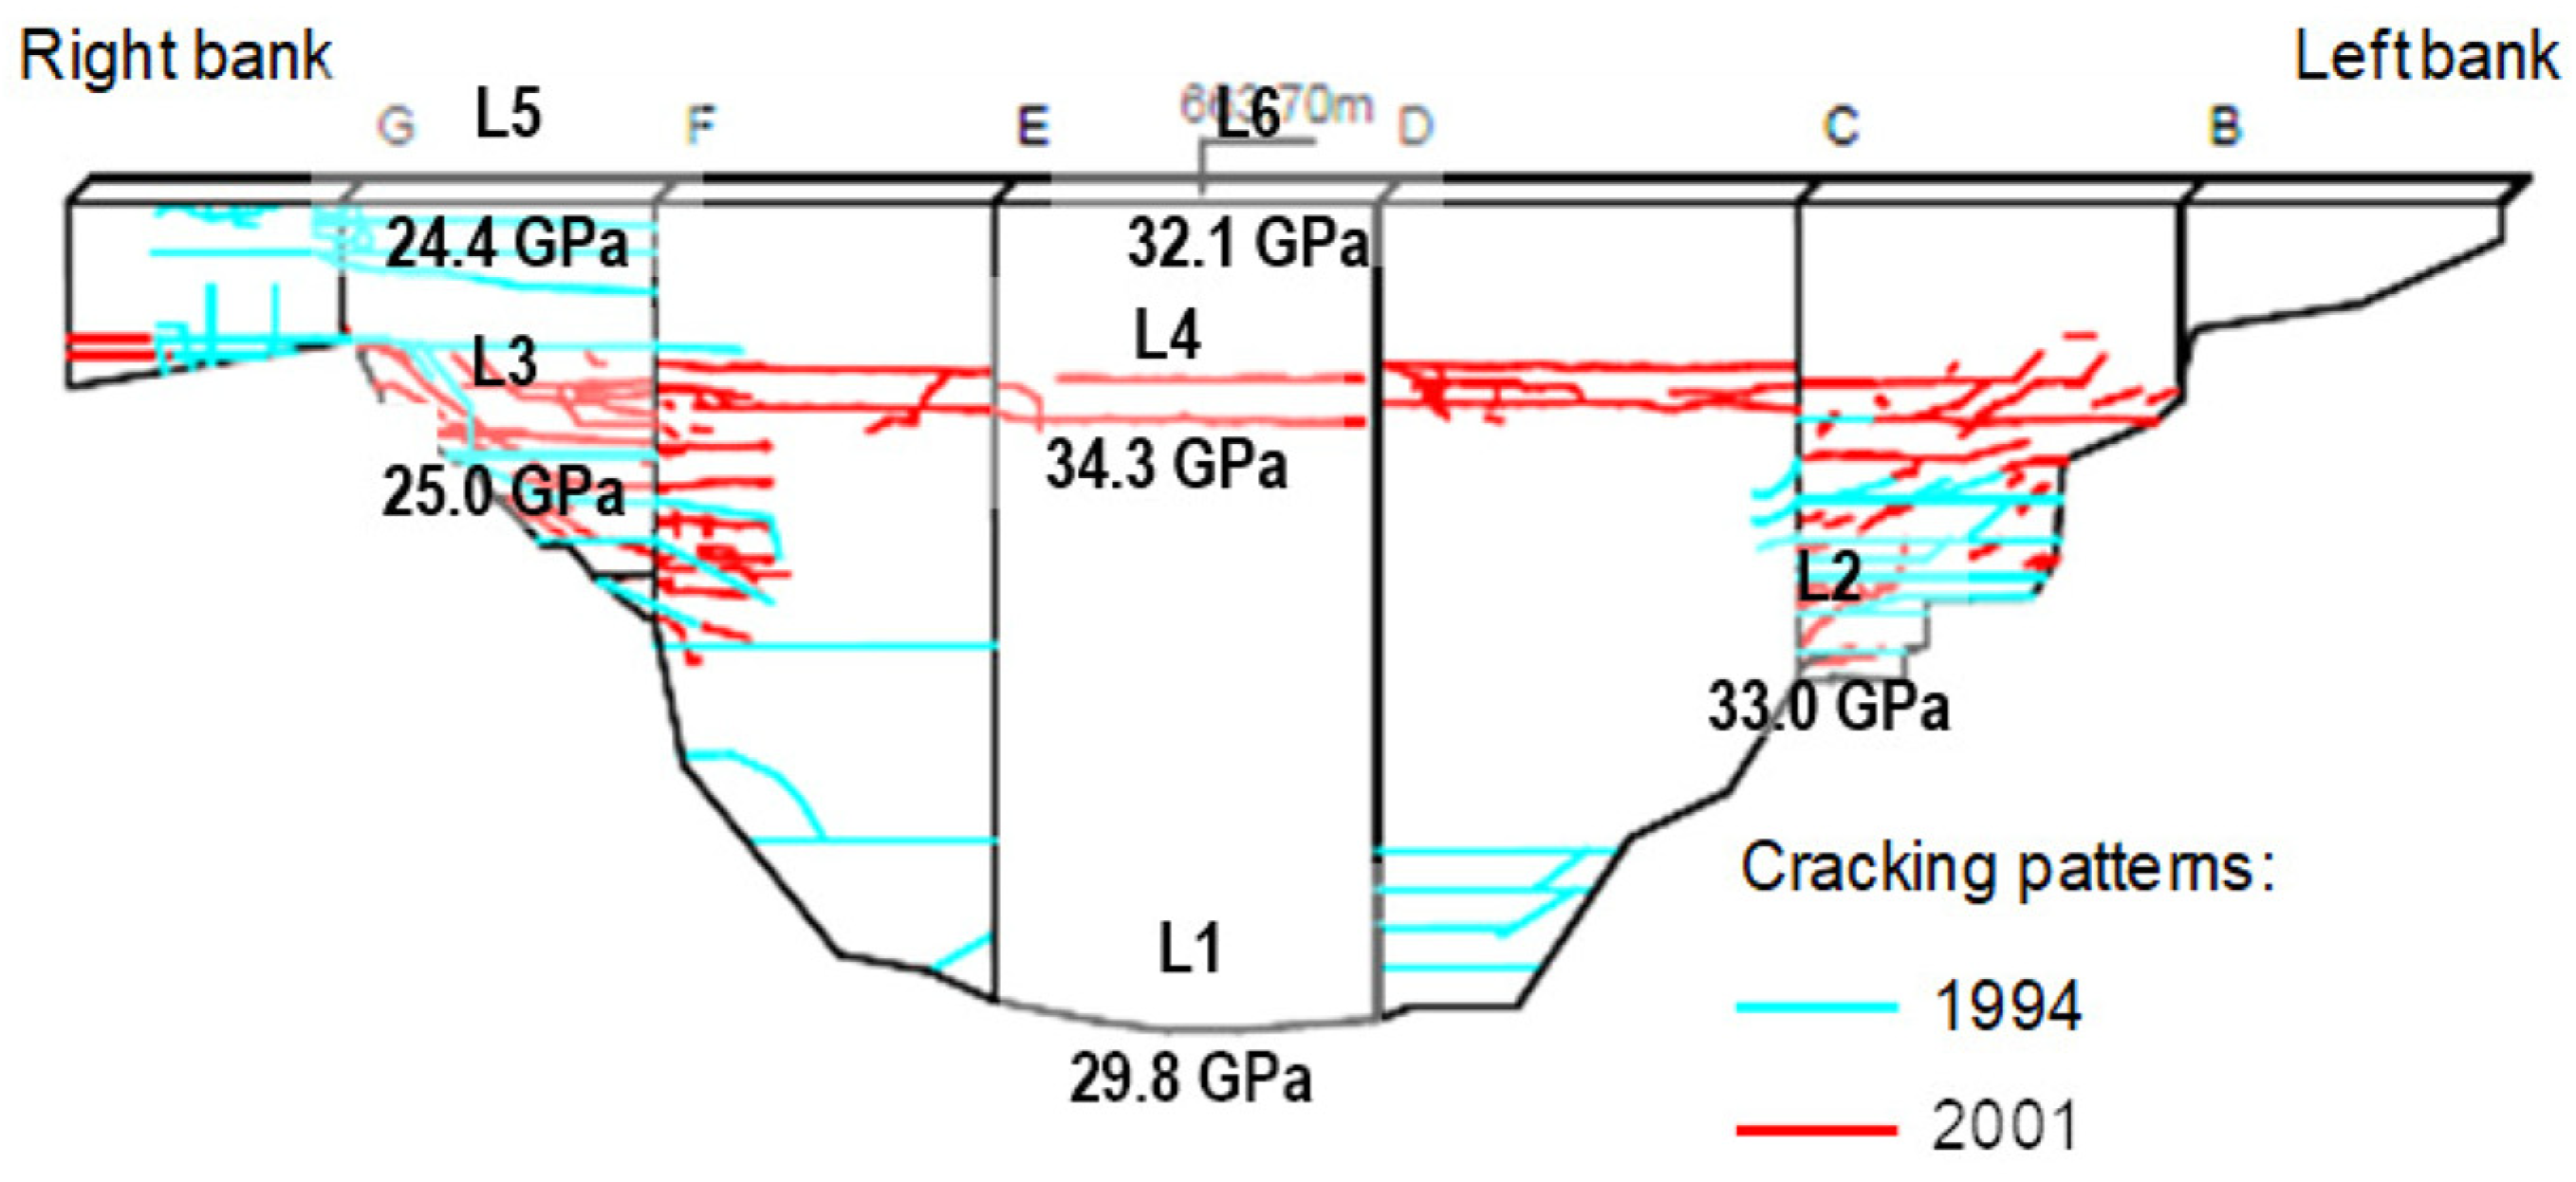
3.2.3. Structural Cracking Observed Through Visual Inspections and In Situ Tests
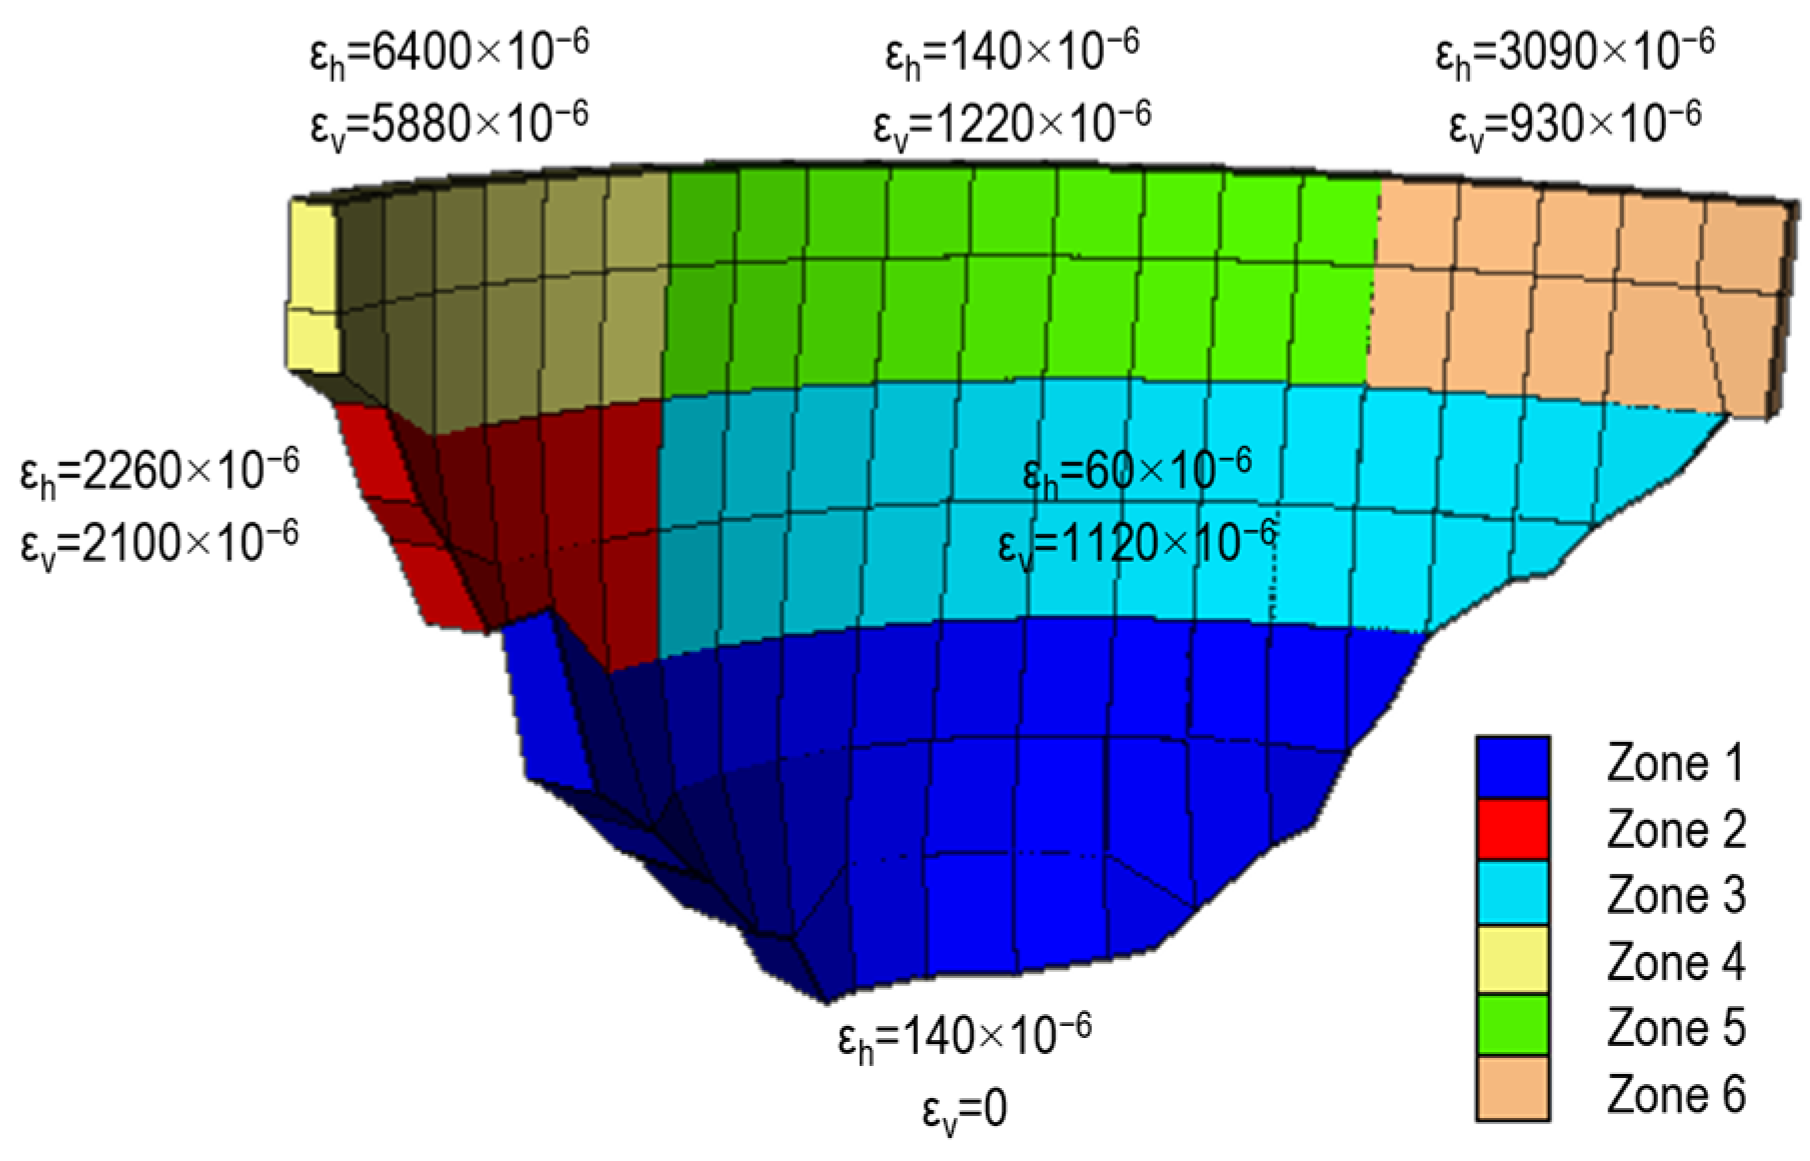
3.2.4. Numerical Modelling Studies Carried out for the Analysis of the Structural Dam Behaviour
3.3. Material Assessment
3.3.1. Initial Survey
3.3.2. Diagnosis and Prognosis
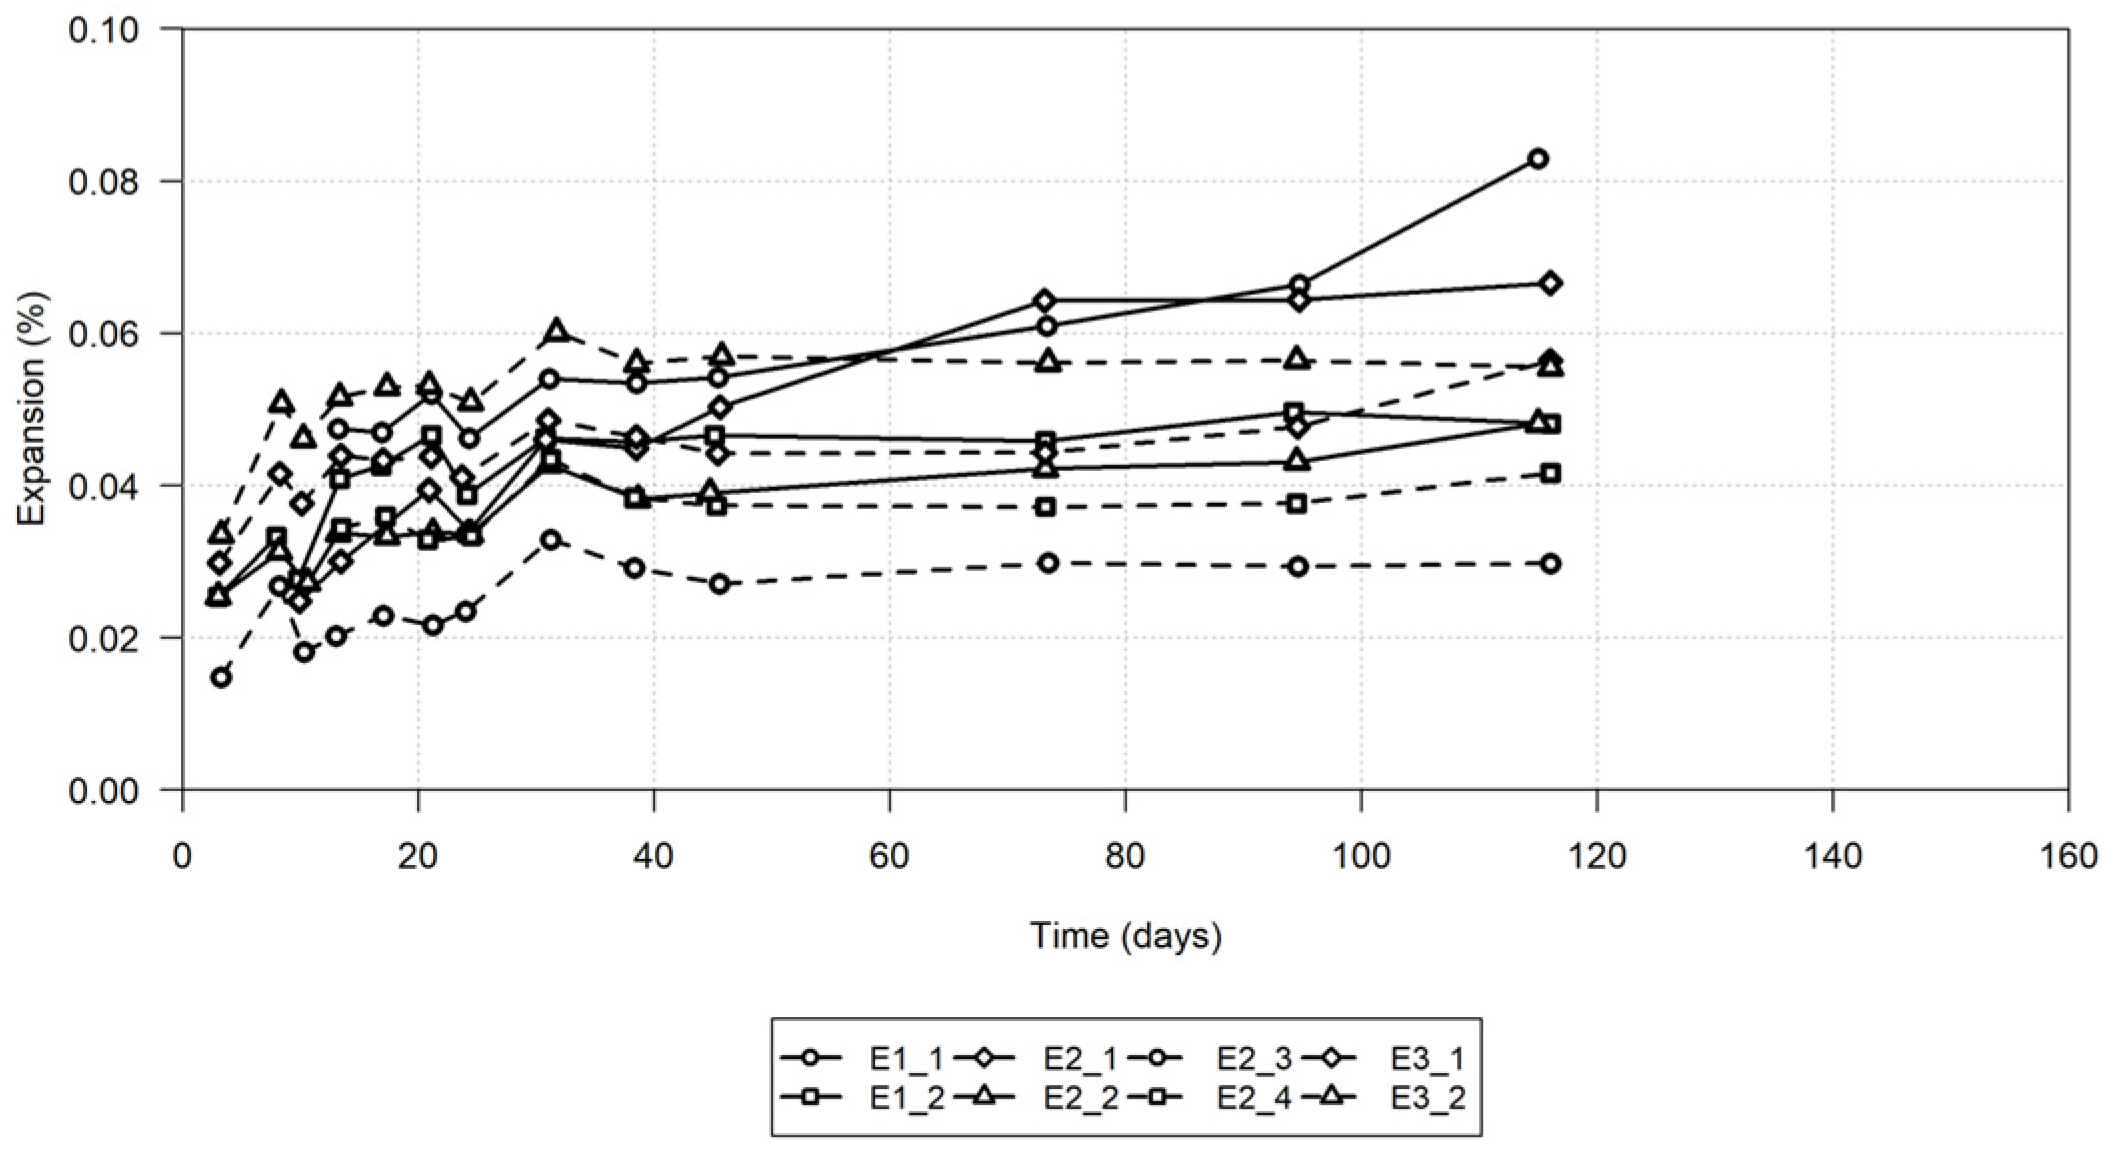
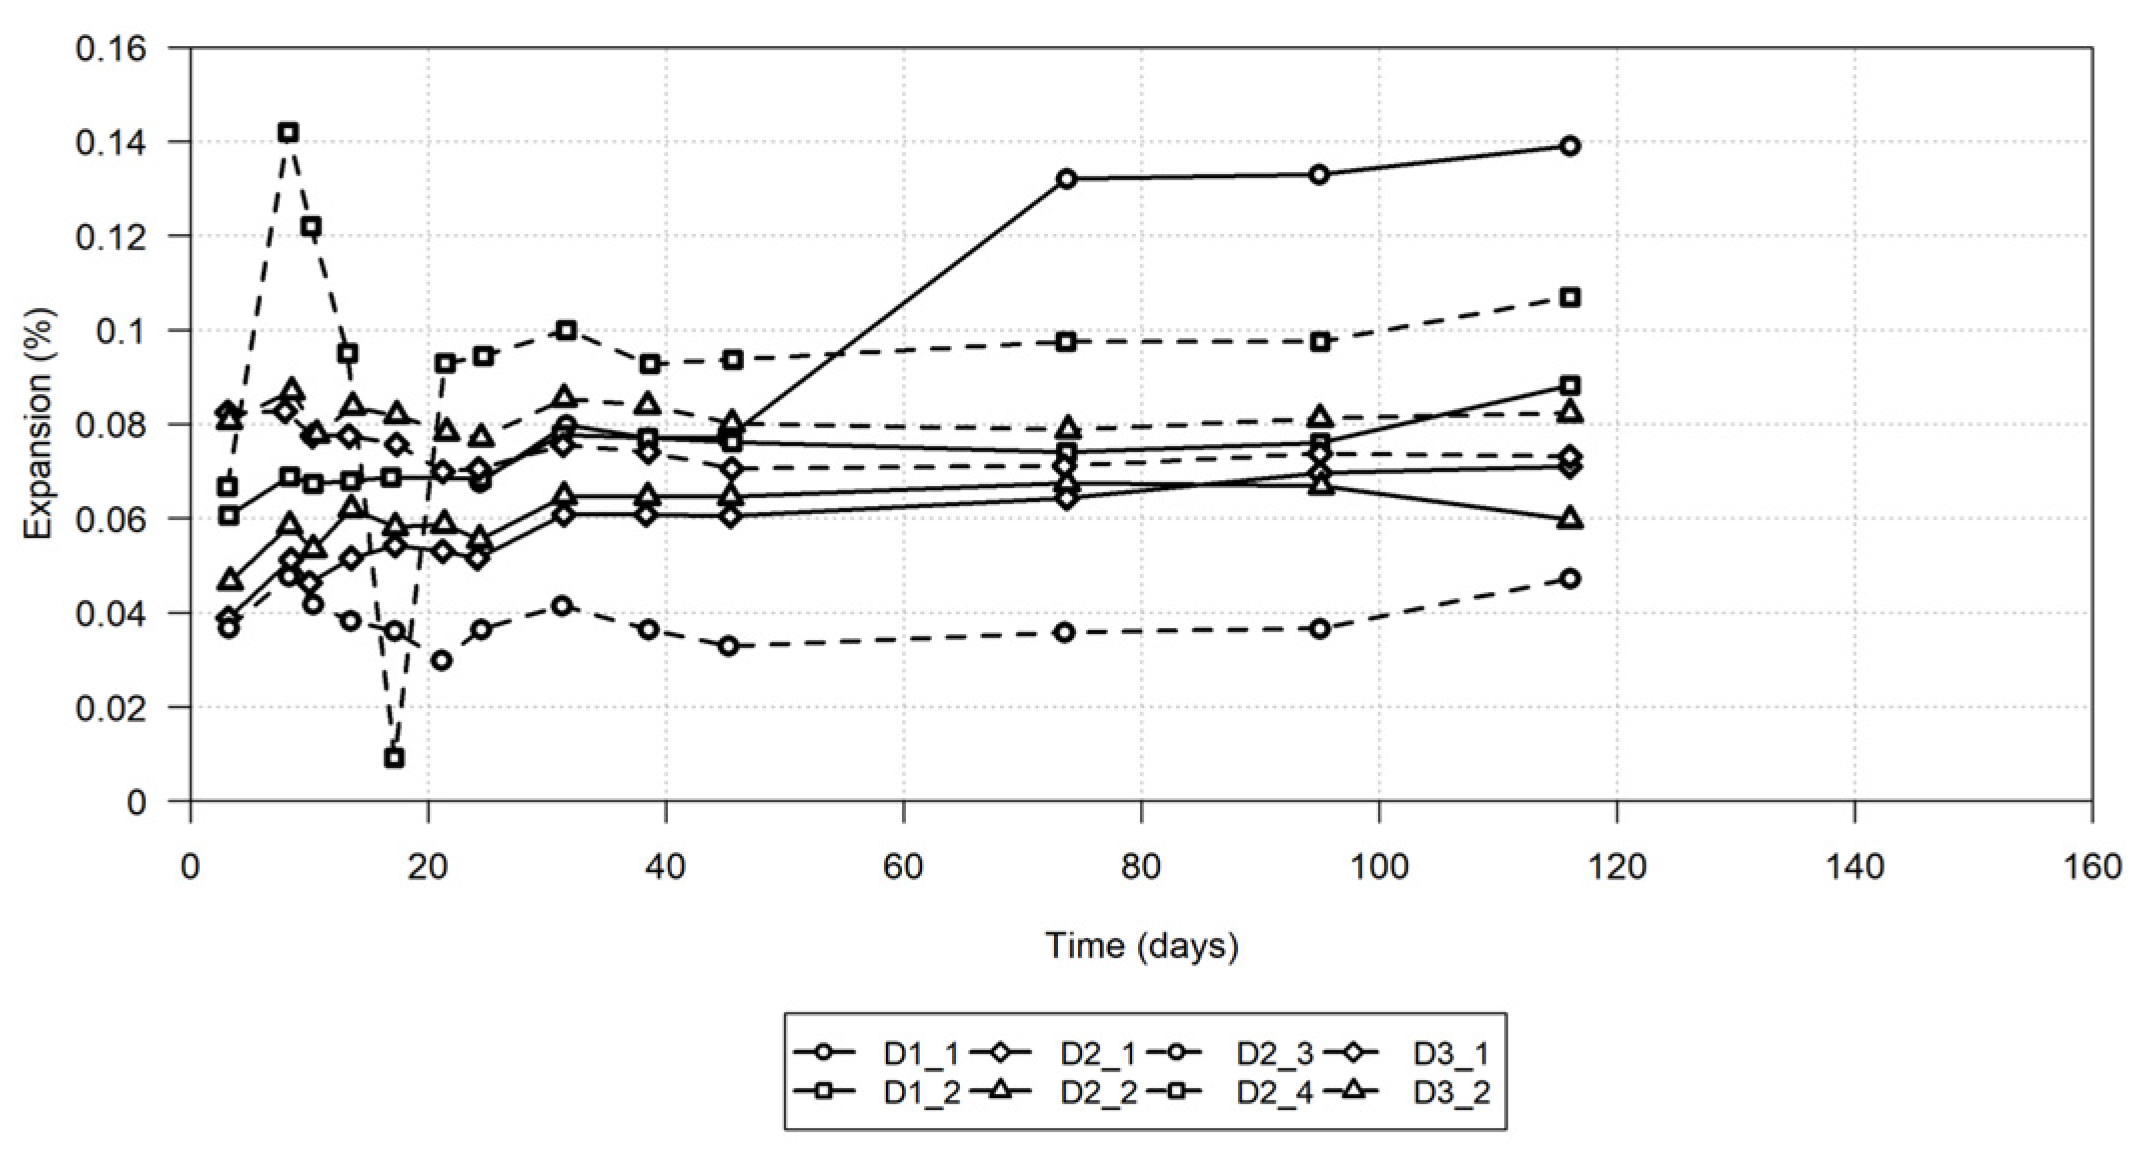
- The specimens from block EF exhibited a higher residual expansion;
- The residual expansion tended to cease after 30–40 days of testing;
- The residual expansion values obtained in the sodium chloride solution are higher than those verified in water, the exception being specimen D2/4 (which showed abnormal behaviour at the beginning of the test);
- The specimens from zone II (the height between the minimum and maximum exploration level) registered a smaller residual expansion, and the specimens from zone I (the height above the maximum retention level of the dam) registered a higher residual expansion.
3.3.3. Final Assessment
Physical Testing

| Location | Specimen | Mass (g) | Diameter (mm) | Length (mm) | Density (kg/m3) | Pulse Velocity, V (km/s) | ||||
|---|---|---|---|---|---|---|---|---|---|---|
| L1 | AC-1.0B | 13,683 | 153 | 308 | 2410 | 4.66 | 4.66 | (0.07) | 4.69 | (0.14) |
| AC-1.1B | 13,727 | 153 | 309 | 2400 | 4.71 | |||||
| AC-1.2B | 13,848 | 153 | 312 | 2410 | 4.71 | |||||
| AC-1.3B | 34,305 | 217 | 384 | 2420 | 4.56 | |||||
| L2 | AC-2.0B | 10,824 | 144 | 272 | 2450 | 4.92 | 4.86 | (0.05) | ||
| AC-2.1B | 12,032 | 144 | 301 | 2460 | 4.81 | |||||
| AC-2.2B | 11,508 | 144 | 290 | 2440 | 4.89 | |||||
| AC-2.3B | 11,403 | 144 | 290 | 2410 | 4.83 | |||||
| L3 | AC-3.0B | 11,471 | 144 | 291 | 2430 | 4.50 | 4.52 | (0.04) | ||
| AC-3.1B | 12,115 | 144 | 306 | 2430 | 4.55 | |||||
| AC-3.2B | 11,426 | 144 | 290 | 2420 | 4.56 | |||||
| AC-3.3B | 21,051 | 192 | 304 | 2400 | 4.47 | |||||
| L4 | AC-4.0B | 13,981 | 153 | 303 | 2500 | 4.62 | 4.74 | (0.08) | ||
| AC-4.1B | 13,915 | 153 | 312 | 2420 | 4.76 | |||||
| AC-4.2B | 13,463 | 153 | 300 | 2440 | 4.81 | |||||
| AC-4.3B | 13,913 | 153 | 312 | 2430 | 4.77 | |||||
| L5 | AC-5.1B | 7044 | 123 | 255 | 2320 | 4.53 | 4.56 | (0.09) | 4.65 | (0.13) |
| AC-5.2B | 7555 | 144 | 196 | 2370 | 4.67 | |||||
| AC-5.3D | 9217 | 153 | 211 | 2380 | 4.45 | |||||
| AC-5.4B | 7002 | 144 | 183 | 2350 | 4.58 | |||||
| L6 | AC-6.0B | 13,753 | 153 | 313 | 2390 | 4.73 | 4.75 | (0.06) | ||
| AC-6.1B | 13,639 | 153 | 310 | 2390 | 4.83 | |||||
| AC-6.2B | 13,563 | 153 | 310 | 2380 | 4.71 | |||||
| AC-6.3B | 37,263 | 217 | 414 | 2430 | 4.73 | |||||
Mechanical Testing
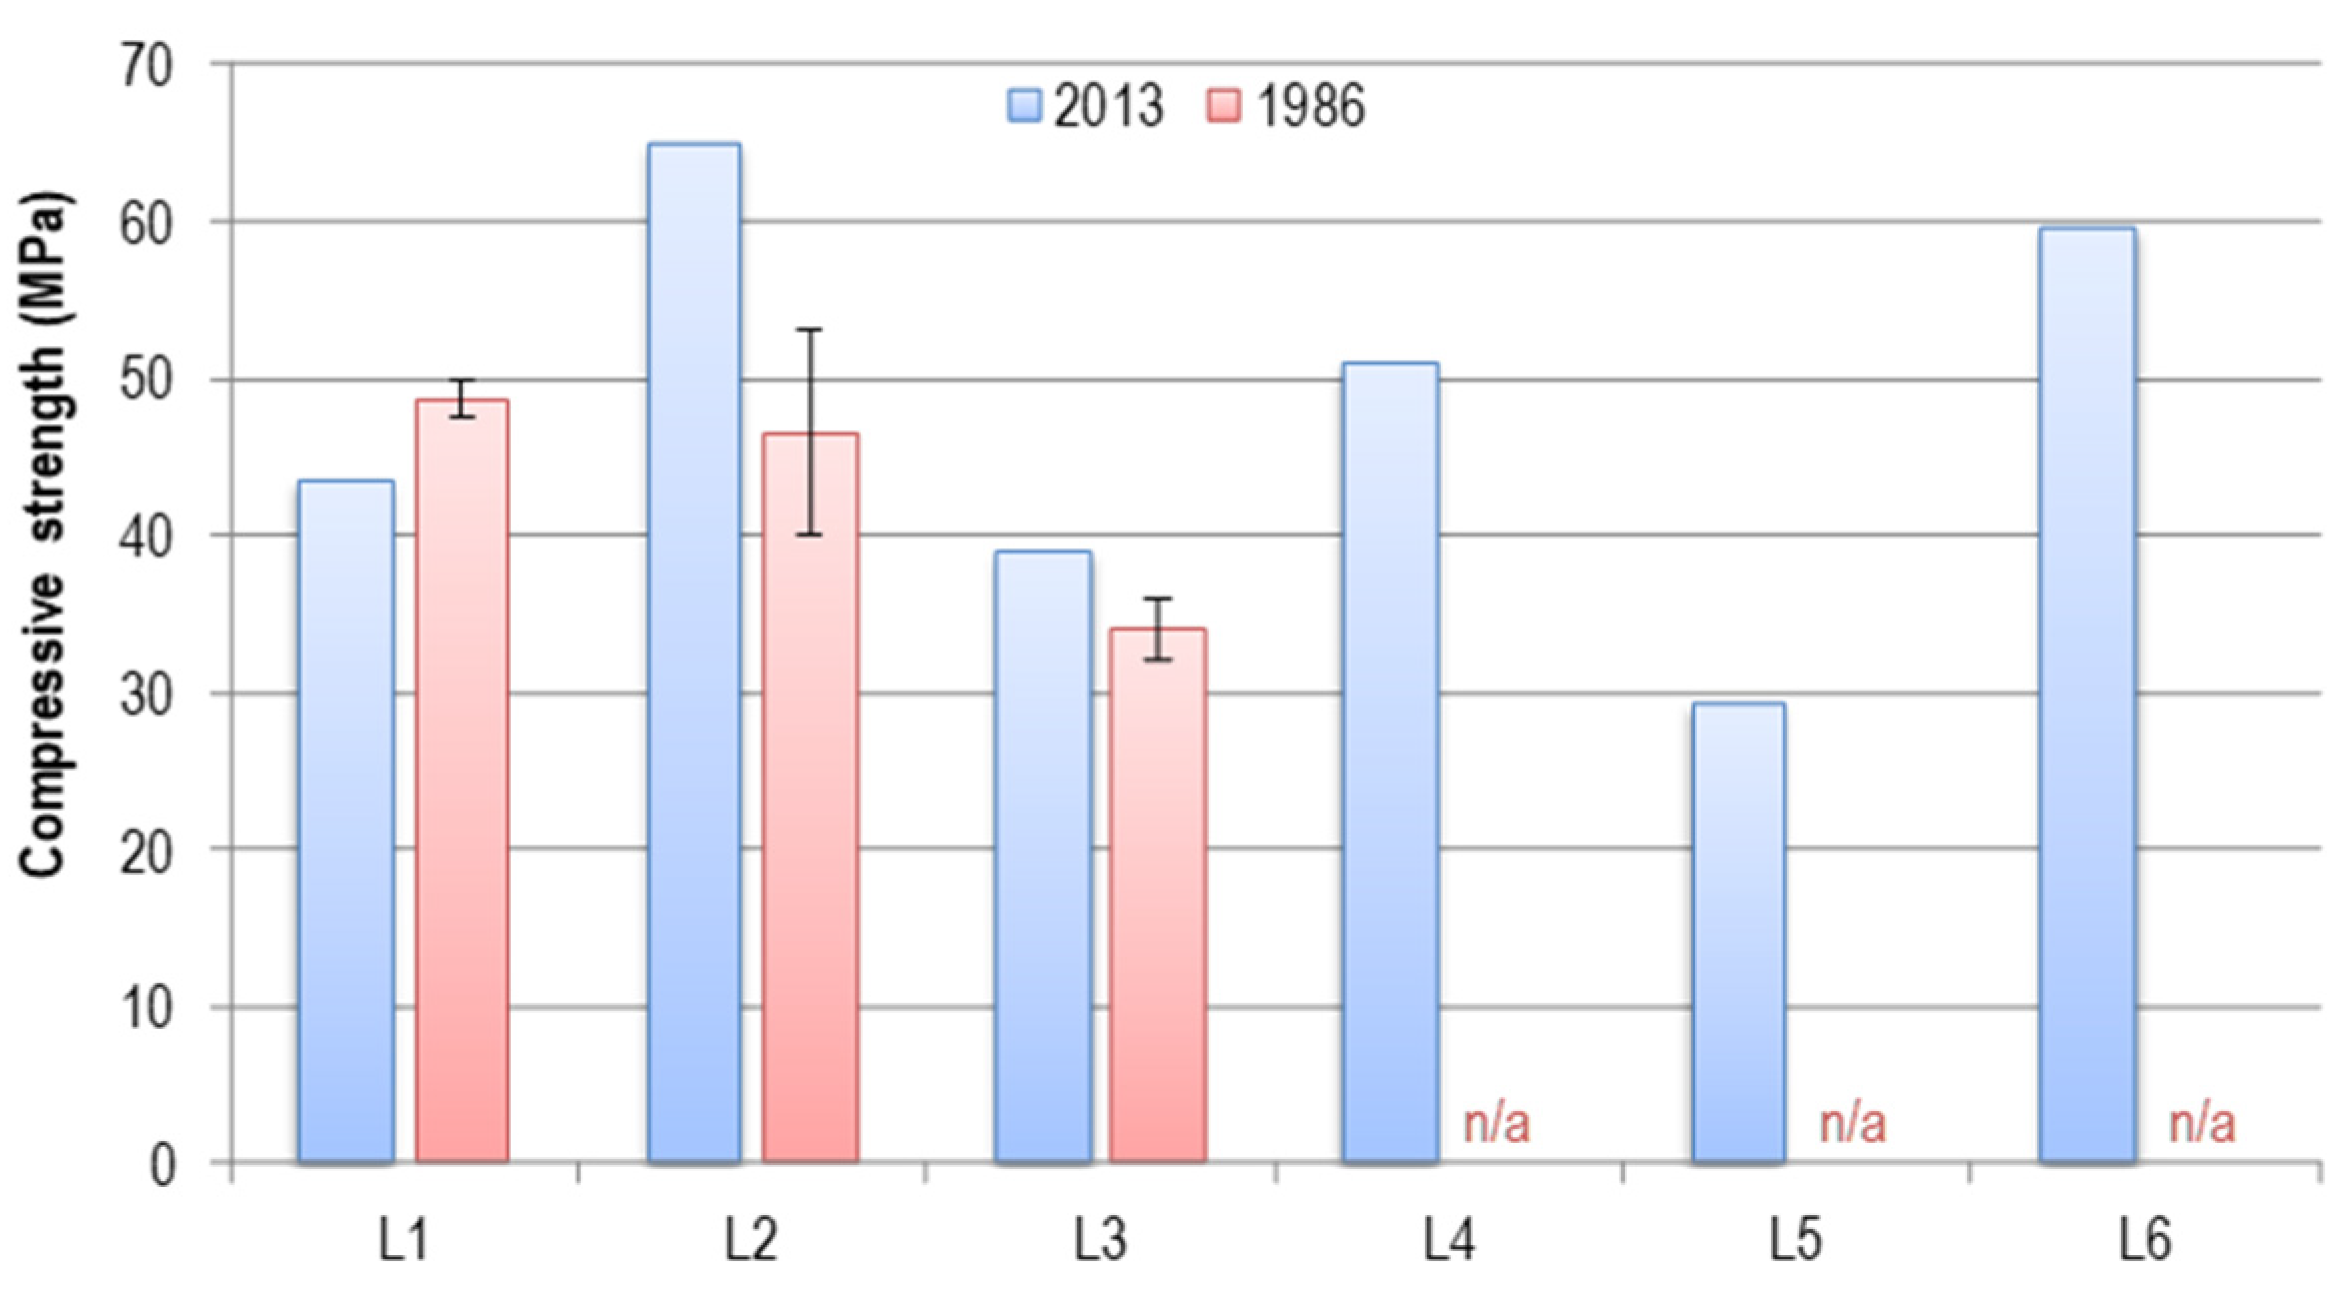
Compressive Strength Test
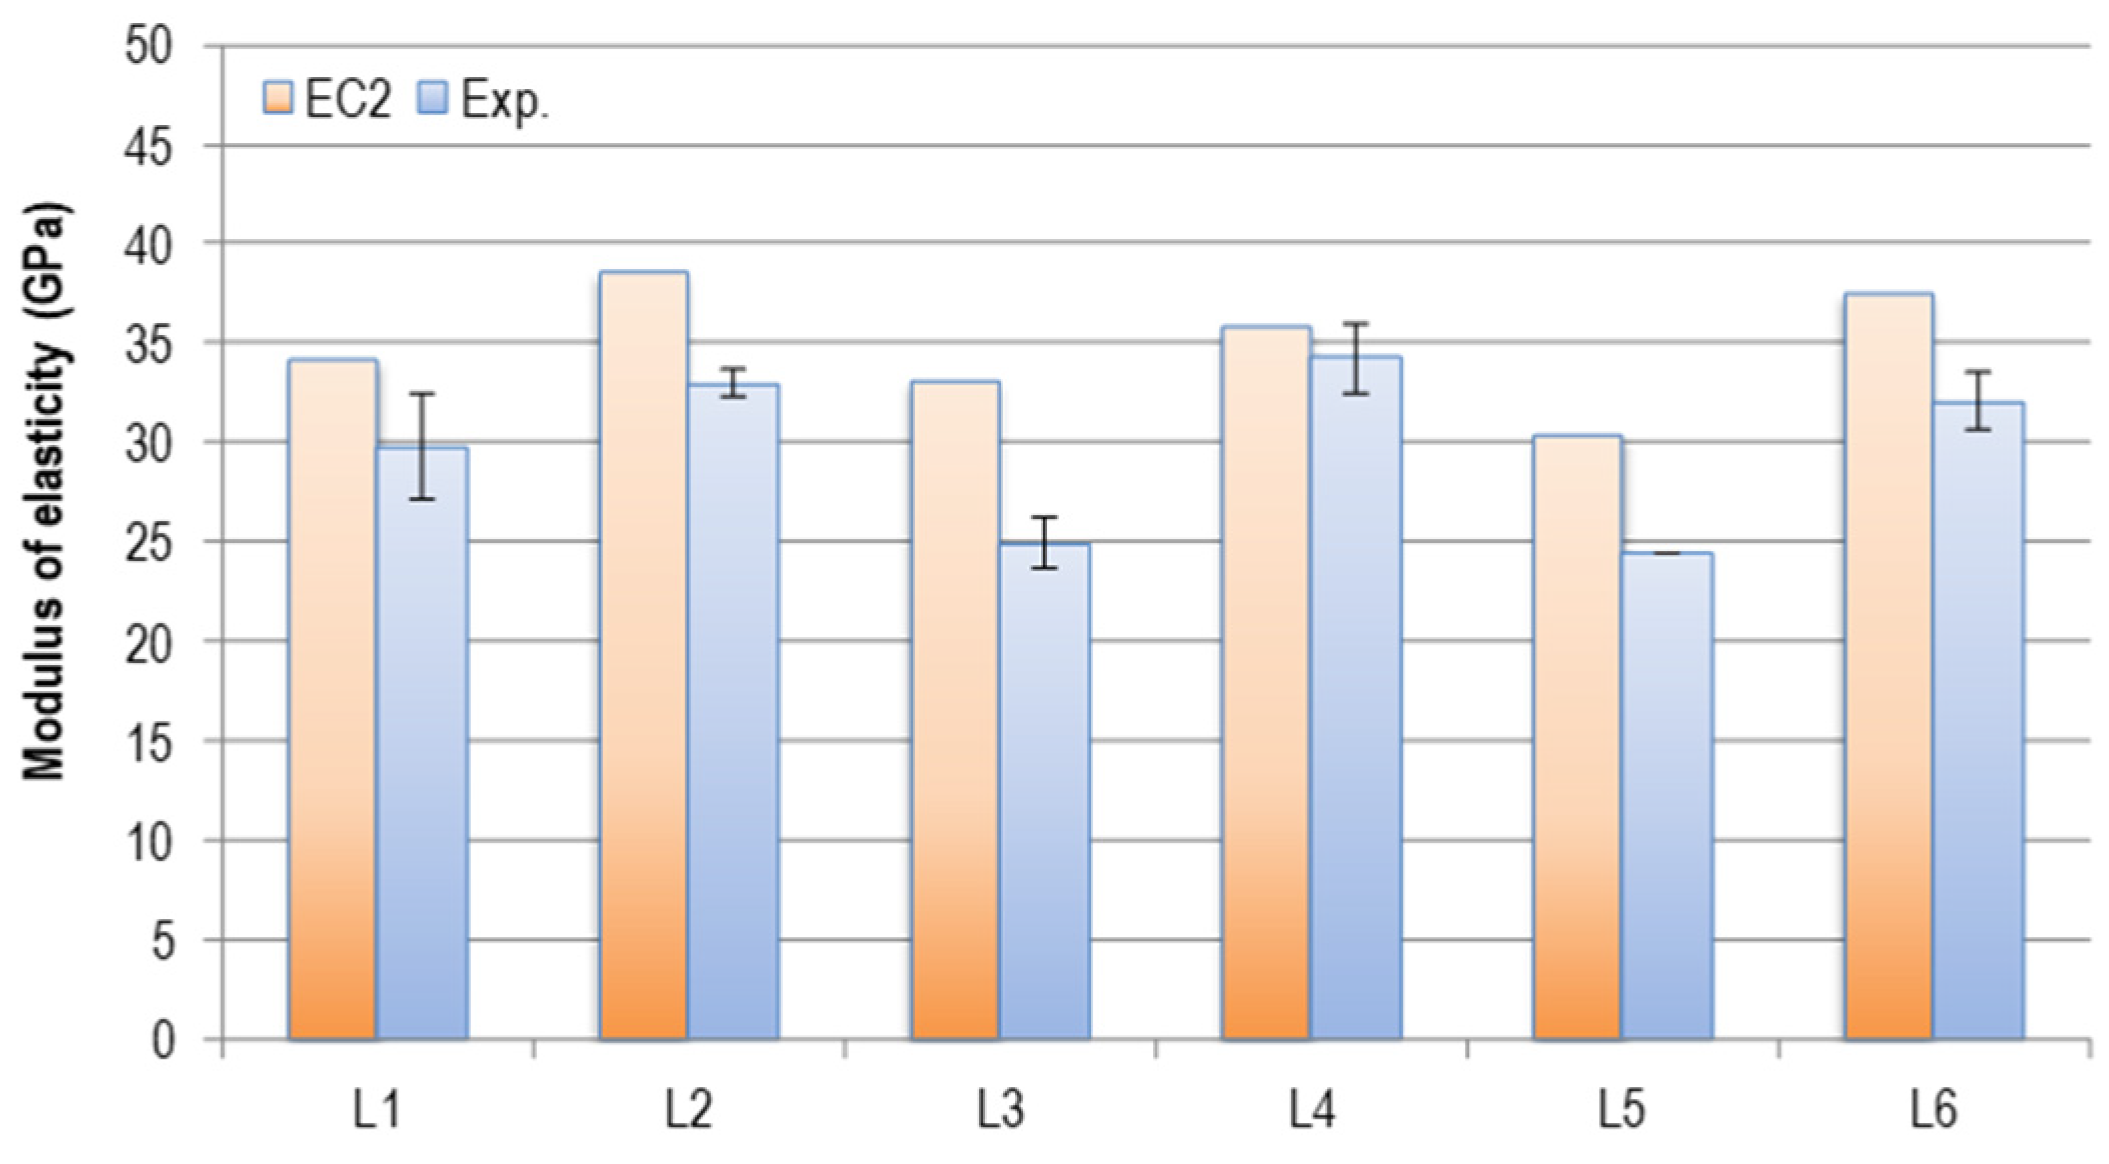
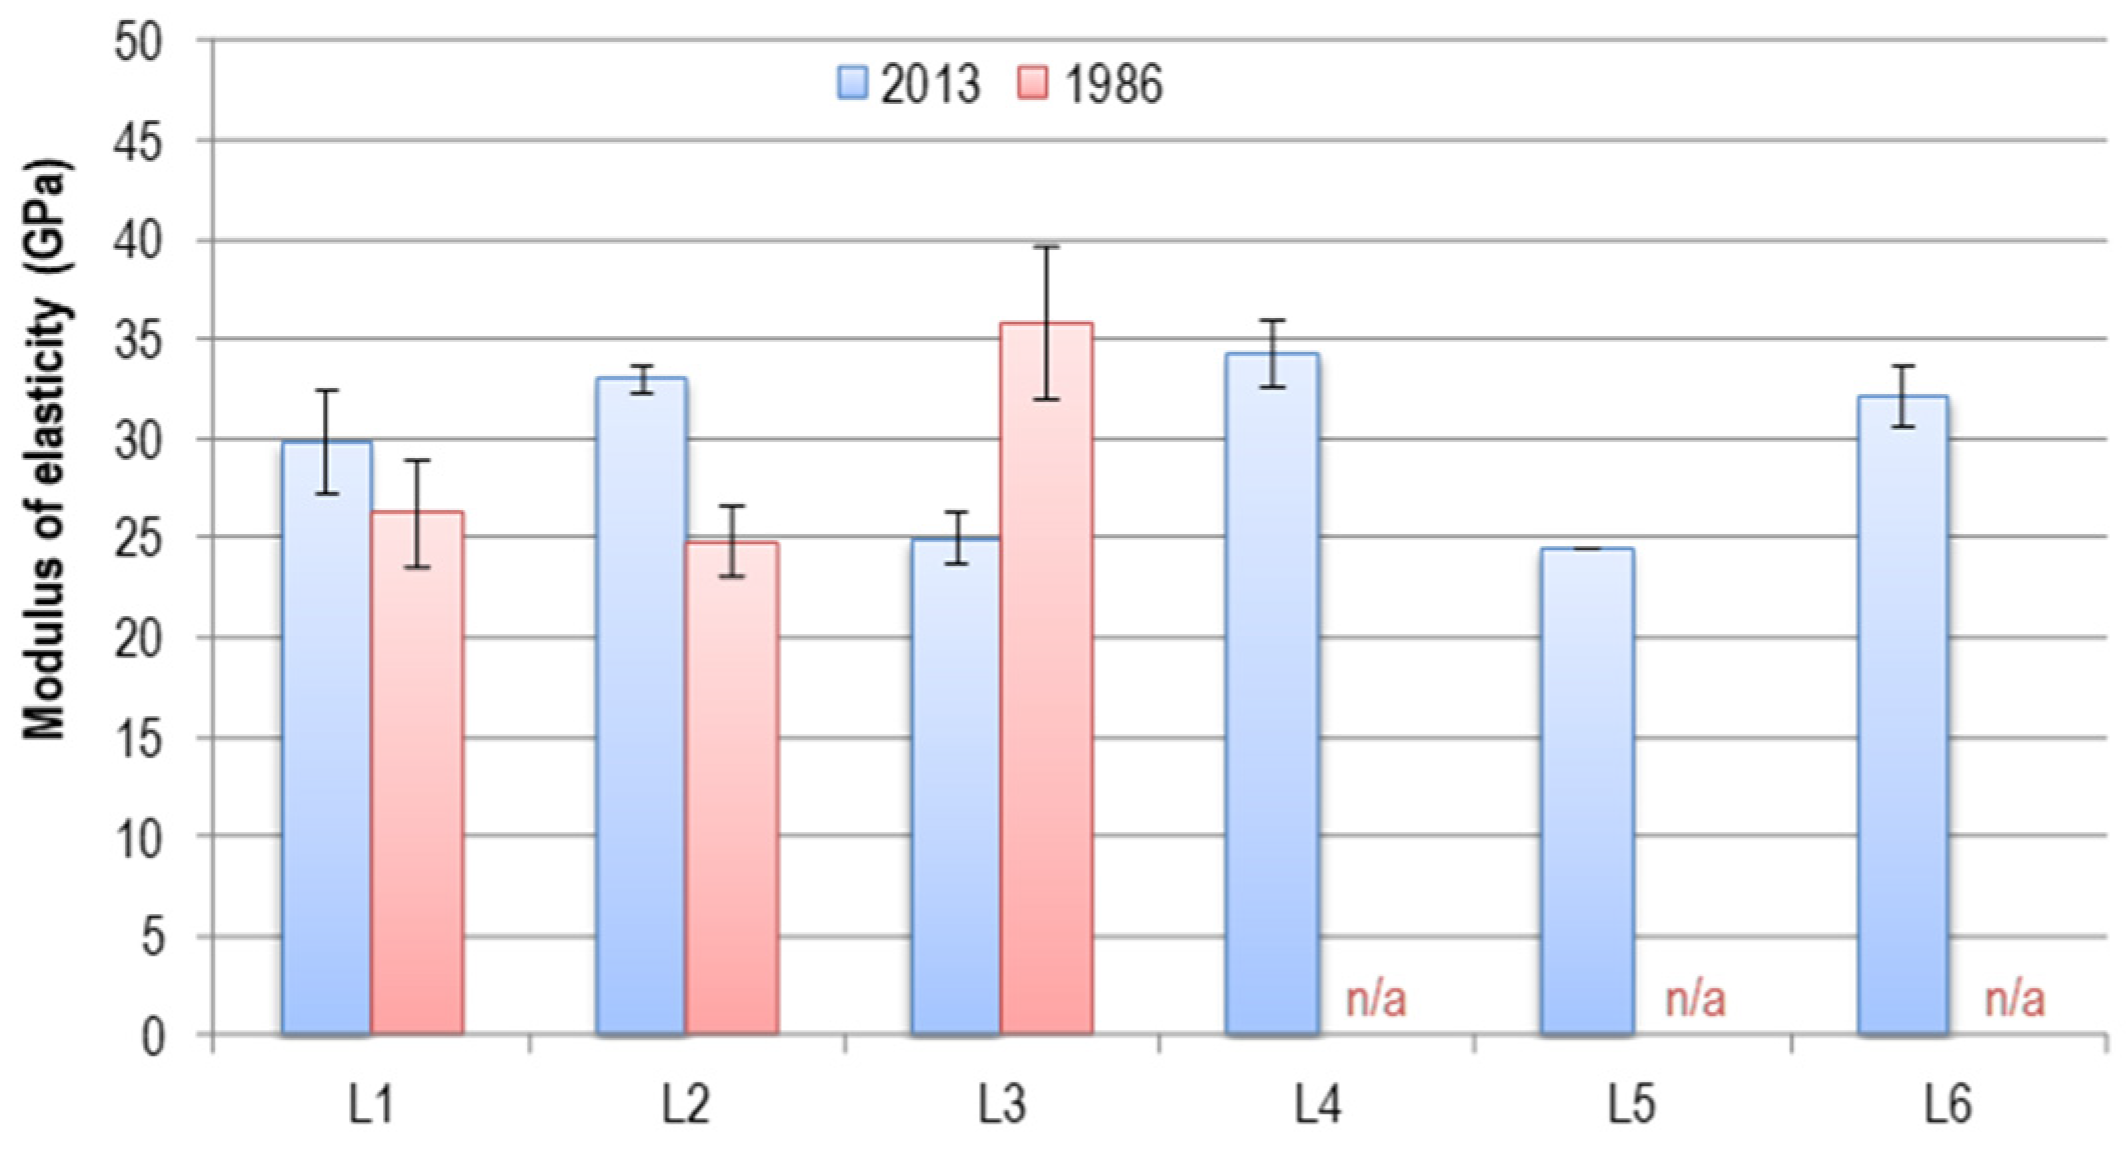
Stiffness Damage Test
4. Final Remarks
- The observed horizontal and vertical displacements presented an irreversible pattern over time, corresponding to horizontal movements to the upstream direction (accumulated values greater than 50 mm) and vertical displacements to the upward direction (accumulated values greater than 8 mm in the left bank and 20 mm in the right bank);
- An important number of structural cracks existed and some had significant openings (mainly between 1 and 3 mm) and depths (mainly up to 600 mm). Several cracks were wet, revealing leakage problems throughout the structure;
- The aggregate had potentially alkali-reactive constituents and also constituents that may release alkalis into the concrete pore solution, which in turn will promote ASR development;
- Although the petrographic analysis indicated the aggregate was potentially alkali-reactive, the aggregate used in the dam passed the chemical test method for the potential alkali–silica reactivity of aggregates performed in 1990, illustrating the lack of the reliability of that method, which was eventually withdrawn by ASTM in 2016;
- The swelling observed in the dam was due to the deleterious development of the ASR in the concrete;
- The residual expansion tests, carried out in 1990, showed that the concrete still had residual expansion potential, a behaviour which was corroborated later by the intensification of cracking in the structure, by ultrasonic testing and structural monitoring;
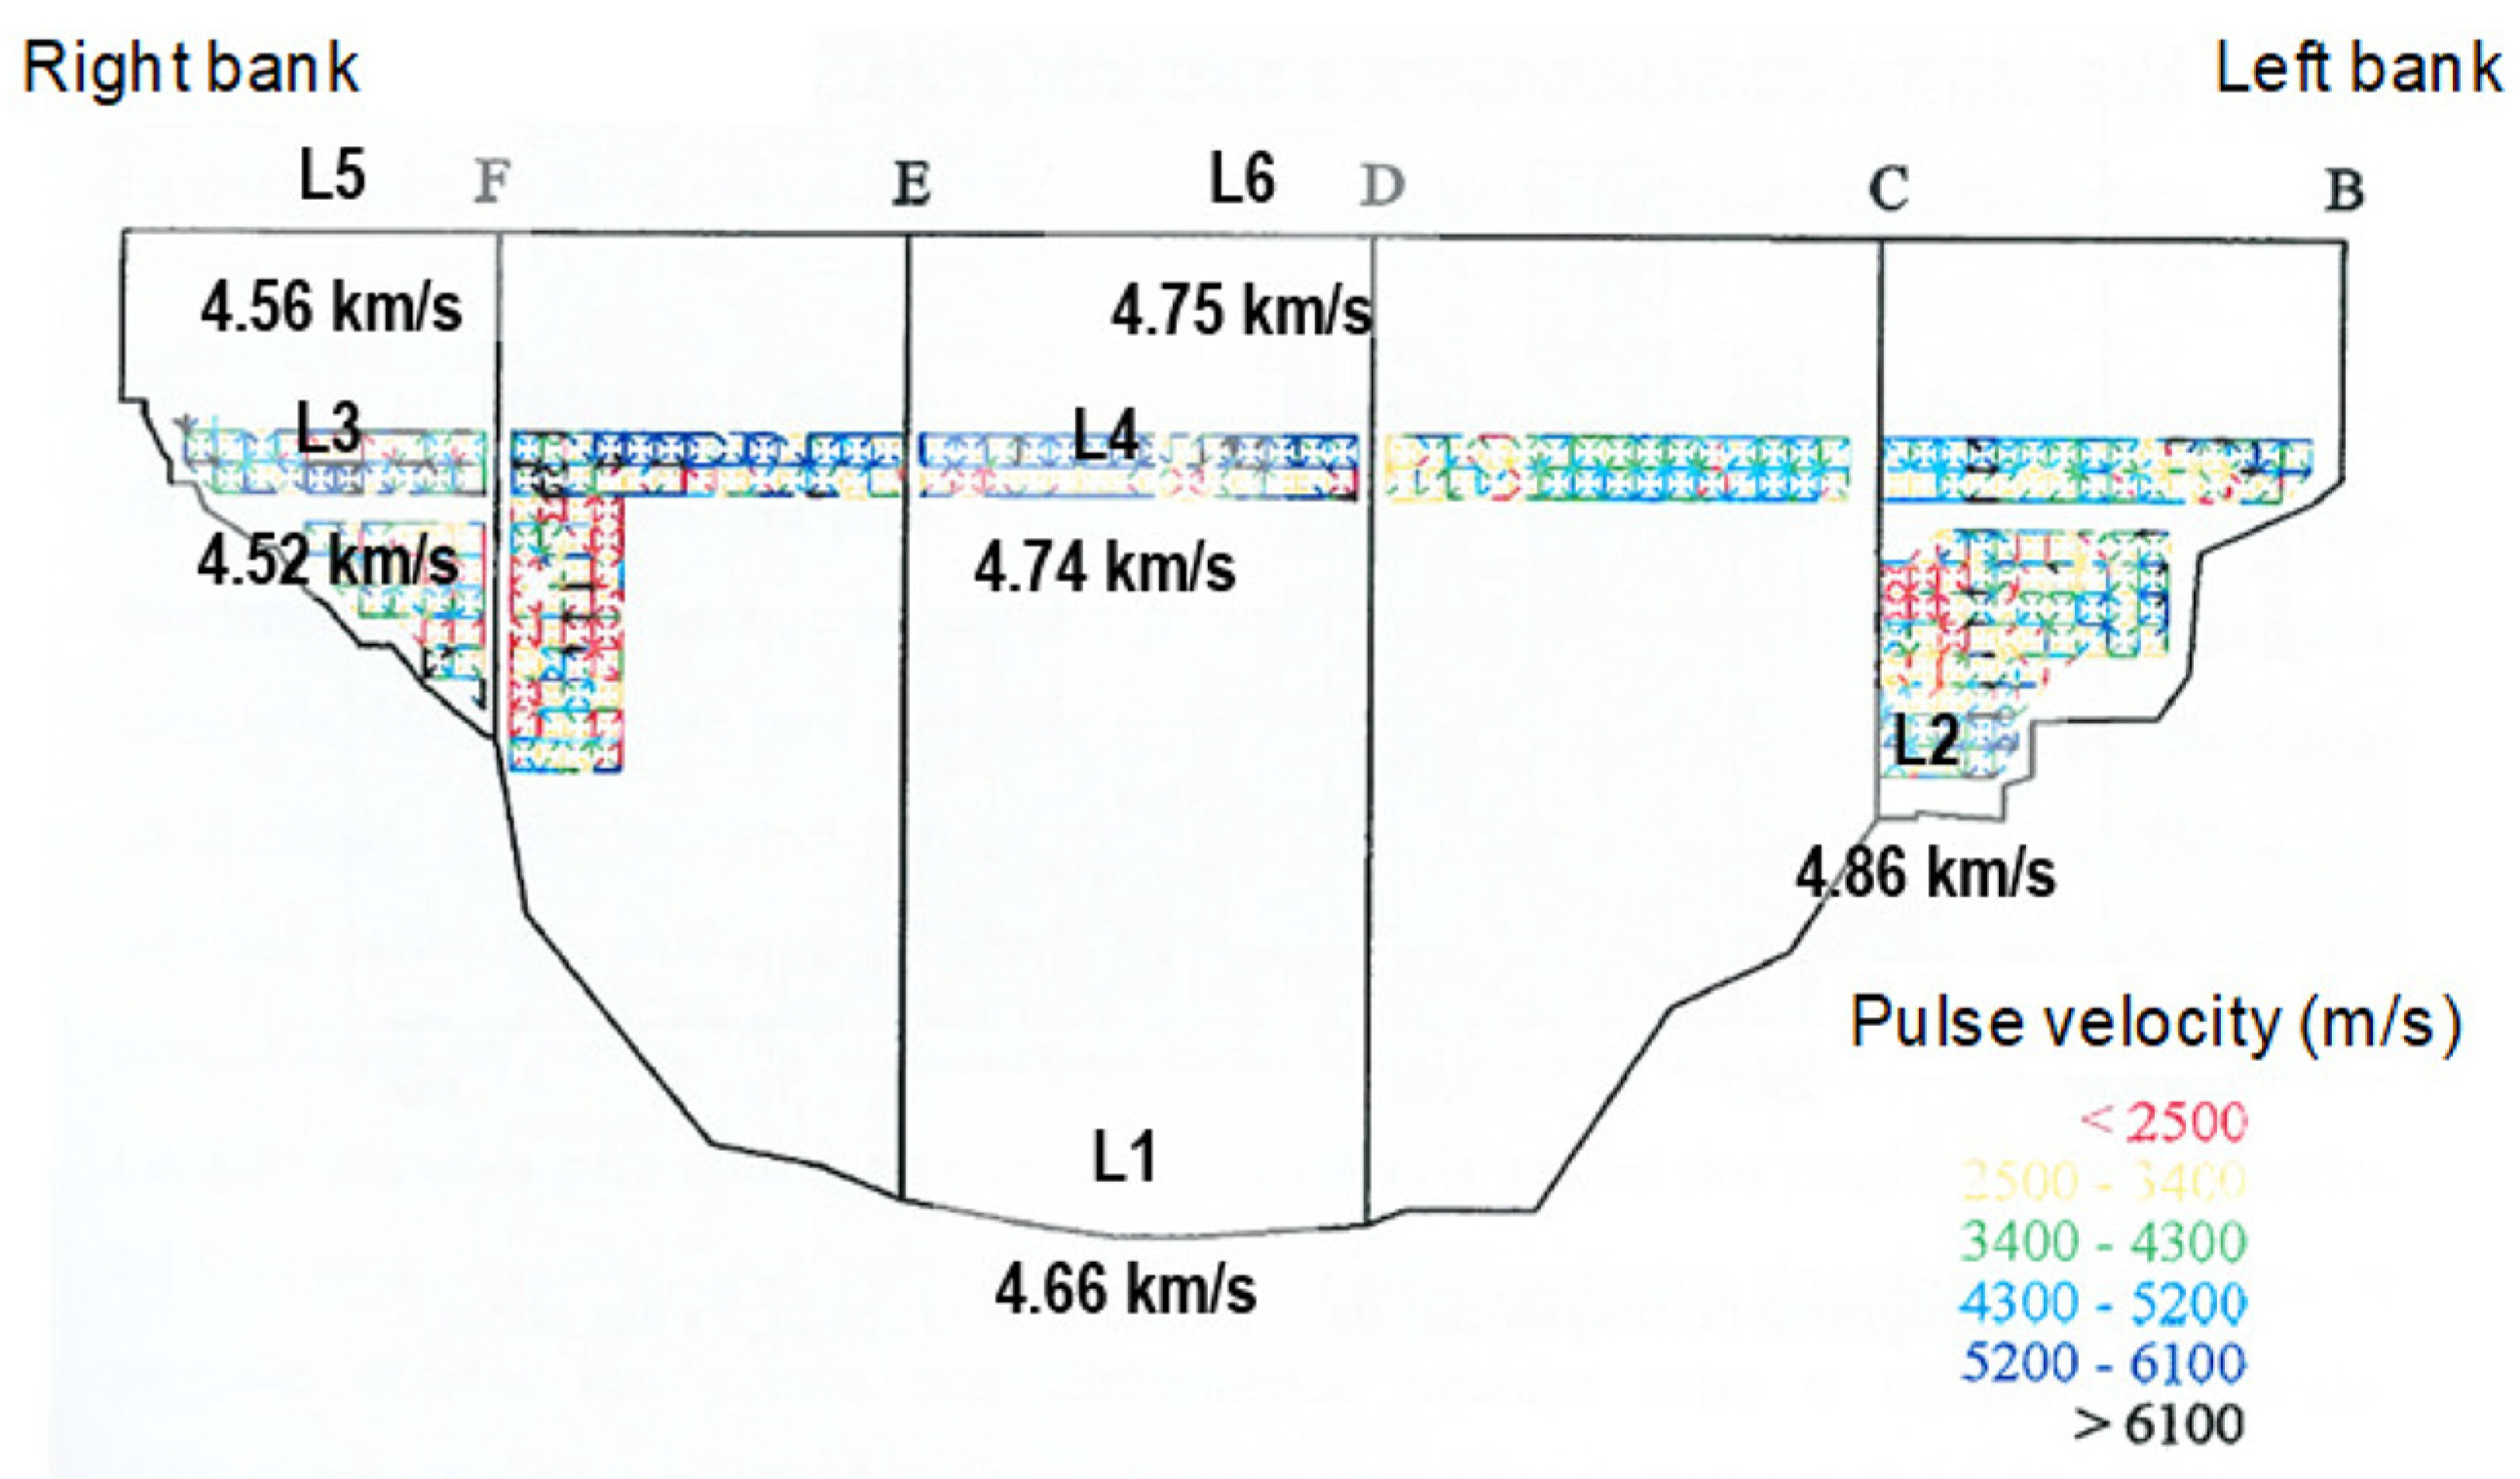
- ASR development has resulted in a relevant increase in the travel time of the ultrasonic wave pulse between the transducers, which evolved throughout the dam’s service life;
- The ASR has evolved to an extent so that it resulted in a detectable reduction of the concrete compressive strength in some of the assessed locations;
- The SDT evidenced that the ASR has resulted in a relevant decrease in the modulus of the elasticity of the concrete in all of the locations sampled;
- In terms of the concrete alteration, it was found that, from all of the sampled locations, the most altered concrete was that from locations L3 and L5 (in block FG);
- The SDT allowed us to estimate that, on average, the ASR is likely to have caused, in the sampled concrete, an expansion that, in unrestrained conditions, would reach 1900 × 10−6;
- Core sampling in non-cracked locations can result in some bias between what is estimated based on sampling and what actually occurs on site;
- The ASR-induced expansion and cracking of the concrete, which has led to a reduction in the service life of the structure.
- Structural monitoring techniques are likely to advance, with the introduction of dynamic behaviour monitoring.
- Visual inspection methods may improve through the use of drones for inspections and laser scanning to survey the dam’s geometry. This includes the measurement of relative movements between blocks when such movements are significant.
- Machine learning models could be developed to classify the different types of cracking that are observed.
- Numerical modelling may become more sophisticated, with an explicit representation of the ASR phenomenon and a detailed simulation of the discrete behaviour resulting from contraction joints and cracking.
Author Contributions
Funding
Acknowledgments
Conflicts of Interest
References
- Swamy, R.N. (Ed.) The Alkali-Silica Reaction in Concrete, 1st ed.; Blackie and Son Ltd.: Glasgow/London, UK, 1992; p. 336. [Google Scholar]
- Sims, I.; Poole, A. (Eds.) Alkali-Aggregate Reaction in Concrete. A World Review; CRC Press: London, UK, 2017. [Google Scholar]
- Sims, I.; Poole, A. Despite Stanton: AAR from denial to remedy in the UK, Europe & the World. In Proceedings of the 16th International Conference on Alkali-Aggregate Reaction—ICAAR 2020–2022, Lisbon, Portugal, 31 May–2 June 2022. [Google Scholar]
- Batista, A.L.; Santos Silva, A.; Fernandes, I.; Santos, L.O.; Custódio, J.; Serra, C. (Eds.) Proceedings of the 16th International Conference on Alkali-Aggregate Reaction in Concrete (16th ICAAR), Lisbon, Portugal, 31 May–2 June 2022, 2nd ed.; Laboratório Nacional de Engenharia Civil, I.P. (LNEC): Lisboa, Portugal, 2022; Volume I, p. 1485. [Google Scholar]
- Batista, A.L.; Santos Silva, A.; Fernandes, I.; Santos, L.O.; Custódio, J.; Serra, C. (Eds.) Proceedings of the 16th International Conference on Alkali-Aggregate Reaction in Concrete (16th ICAAR), Lisbon, Portugal, 31 May–2 June 2022, 1st ed.; Laboratório Nacional de Engenharia Civil, I.P. (LNEC): Lisboa, Portugal, 2022; Volume II, p. 562. [Google Scholar]
- Sanchez, F.M.L.; Trottier, C. (Eds.) Proceedings of the 17th International Conference on Alkali-Aggregate Reaction in Concrete (17th ICAAR), Ottawa, ON, Canada, 18–24 May 2024; ICAAR 2024—Volume I, 2nd ed.; Springer: Cham, Switzerland, 2022; Volume I, p. 679. [Google Scholar]
- Sanchez, F.M.L.; Trottier, C. (Eds.) Proceedings of the 17th International Conference on Alkali-Aggregate Reaction in Concrete (17th ICAAR), Ottawa, ON, Canada, 18–24 May 2024; ICAAR 2024—Volume II, 2nd ed.; Springer: Cham, Switzerland, 2022; Volume II, p. 729. [Google Scholar]
- Ideker, J.H. International Conference on Alkali-Aggregate Reaction Proceedings; Oregon State University: Corvallis, OR, USA; Available online: https://icaarconcrete.org/ (accessed on 20 December 2024).
- Geng, G.; Barbotin, S.; Shakoorioskooie, M.; Shi, Z.; Leemann, A.; Sanchez, D.F.; Grolimund, D.; Wieland, E.; Dähn, R. An in-situ 3D micro-XRD investigation of water uptake by alkali-silica-reaction (ASR) product. Cement Concrete Res. 2021, 141, 106331. [Google Scholar] [CrossRef]
- Leemann, A.; Góra, M.; Lothenbach, B.; Heuberger, M. Alkali silica reaction in concrete–Revealing the expansion mechanism by surface force measurements. Cem. Concr. Res. 2024, 176, 107392. [Google Scholar] [CrossRef]
- Olajide, O.D.; Nokken, M.R.; Sanchez, L.F.M. Alkali–Silica Reactions: Literature Review on the Influence of Moisture and Temperature and the Knowledge Gap. Materials 2024, 17, 10. [Google Scholar] [CrossRef]
- Rajabipour, F.; Giannini, E.; Dunant, C.; Ideker, J.H.; Thomas, M.D.A. Alkali–silica reaction: Current understanding of the reaction mechanisms and the knowledge gaps. Cem. Concr. Res. 2015, 76, 130–146. [Google Scholar] [CrossRef]
- Leemann, A.; Sanchez, L. Internal alkali transport in recycling concrete and its impact on alkali-silica reaction. Cem. Concr. Res. 2023, 174, 107334. [Google Scholar] [CrossRef]
- Godart, B.; de Rooij, M.; Wood, J.G.M. (Eds.) Guide to Diagnosis and Appraisal of AAR Damage to Concrete in Structures. Part 1: Diagnosis (AAR 6.1) (State-of-the-Art Report of the RILEM Technical Committee 191-ARP); Springer: Dordrecht, The Netherlands, 2013. [Google Scholar]
- ICOLD. Management of Expansive Chemical Reactions in Concrete Dams & Hydroelectric Projects (Bulletin Preprint 184); International Commission on Large Dams (ICOLD): Paris, France, 2019. [Google Scholar]
- Saouma, V.E. (Ed.) Diagnosis & Prognosis of AAR Affected Structures (State-of-the-Art Report of the RILEM Technical Committee 259-ISR); Springer: Dordrecht, The Netherlands, 2021. [Google Scholar]
- SCD. Concrete Swelling of Dams in Switzerland. Report of the Swiss Committee on Dams on the State of Concrete Swelling in Swiss Dams (AAR Working Group); Swiss Committee for Dams (SCD): Luzern, Switzerland, 2017. [Google Scholar]
- Jones, A.E.K.; Clark, L.A. The effects of ASR on the properties of concrete and the implications for assessment. Eng. Struct. 1998, 20, 785–791. [Google Scholar] [CrossRef]
- Ben Ftima, M.; Joder, M.; Yildiz, E. Creep modelling for multi-physical simulation of mass concrete structures using the explicit finite element approach. Eng. Struct. 2020, 212, 110538. [Google Scholar] [CrossRef]
- Hariri-Ardebili, M.A.; Saouma, V.E.; Hayes, N.W. A hybrid FE-based predictive framework for ASR-affected structures coupled with accelerated experiments. Eng. Struct. 2021, 234, 111709. [Google Scholar] [CrossRef]
- Sanchez, L.F.M. Internal Swelling Reactions in Concrete–Mechanisms and Condition Assessment; CRC Press–Taylor & Francis Group, LLC: Boca Raton, FL, USA, 2024. [Google Scholar]
- IStructE. Appraisal of Existing Structures, 3rd ed.; The Institution of Structural Engineers: London, UK, 2011. [Google Scholar]
- Sellier, A.; Grimal, É.; Multon, S.; Bourdarot, É. (Eds.) Swelling Concrete in Dams and Hydraulic Structures: DSC 2017; ISTE, Ltd.–John Wiley & Sons, Inc.: London, UK; Hoboken, NJ, USA, 2017. [Google Scholar]
- Trottier, C.; Sanchez, L.F.M.; Martin, R.P.; Toutlemonde, F. Capturing Internal Swelling Reactions (ISR) Damage in Concrete Through the Damage Rating Index (DRI). In Smart & Sustainable Infrastructure: Building a Greener Tomorrow–Proceedings of the 1st Interdisciplinary Symposium on Smart & Sustainable Infrastructure (ISSSI 2023); Banthia, N., Soleimani-Dashtaki, S., Mindess, S., Eds.; RILEM Book series; Springer: Berlin/Heidelberg, Germany, 2024; Volume 48, pp. 940–951. [Google Scholar]
- Lindgård, J.; Andiç-Çakir, Ö.; Fernandes, I.; Ronning, T.F.; Thomas, M.D.A. Alkali-silica reactions (ASR): Literature review on parameters influencing laboratory performance testing. Cem. Concr. Res. 2012, 42, 223–243. [Google Scholar] [CrossRef]
- Shakoorioskooie, M.; Griffa, M.; Leemann, A.; Zboray, R.; Lura, P. Quantitative analysis of the evolution of ASR products and crack networks in the context of the concrete mesostructure. Cem. Concr. Res. 2022, 162, 106992. [Google Scholar] [CrossRef]
- Fernandes, I.; Leemann, A.; Fournier, B.; Menendez, E.; Lindgård, J.; Borchers, I.; Custódio, J. PARTNER project post-documentation study. Condition assessment of field exposure site cubes. Results of microstructural analyses. Cem. Concr. Res. 2022, 162, 107006. [Google Scholar] [CrossRef]
- Custódio, J.; Lindgård, J.; Fournier, B.; Santos Silva, A.; Thomas, M.D.A.; Drimalas, T.; Ideker, J.H.; Martin, R.-P.; Borchers, I.; Johannes Wigum, B.; et al. Correlating field and laboratory investigations for preventing ASR in concrete—The LNEC cube study (Part I—Project plan and laboratory results). Constr. Build. Mater. 2022, 343, 128131. [Google Scholar] [CrossRef]
- Olajide, O.D.; Nokken, M.R.; Sanchez, L.F.M. Evaluation of the induced mechanical deterioration of ASR-affected concrete under varied moisture and temperature conditions. Cem. Concr. Comp. 2025, 157, 105942. [Google Scholar] [CrossRef]
- Pourbehi, M.S.; van Zijl, G.P.A.G. Seismic Analysis of the Kleinplaas Dam Affected by Alkali-Silica Reaction Using a Chemo-Thermo-Mechanical Finite Element Numerical Model Considering Fluid Structure Interaction. J. Adv. Concr. Technol. 2019, 17, 462–473. [Google Scholar] [CrossRef]
- Silva, H.S. Estudo do Envelhecimento das Barragens de Betão e de Alvenaria. Alteração Físico-Química dos Materiais (Study of the Ageing of Concrete and Masonry Dams); LNEC: Lisboa, Portugal, 1992. (In Portuguese) [Google Scholar]
- Castro, A.T.; Ramos, J.M.; Oliveira, S.M. Evaluation of the behaviour of an arch dam affected by a swelling process in the concrete. In Proceedings of the 5th ICOLD European Symposium, Geiranger, Norway, 25–27 June 2001. [Google Scholar]
- LNEC. Barragem do Alto Ceira. Avaliação do Estado de Fissuração com Base em Ensaios de Ultra-Sons Realizados em Novembro/Dezembro de 2001 (Alto Ceira Dam. Evaluation of the Fissuration Condition Using Ultrasound Testing Carried out on November/December 2001) (Confidential Technical Report in Portuguese); LNEC–Proc. 043/01/6619; Laboratório Nacional de Engenharia Civil (LNEC): Lisboa, Portugal, 2004. [Google Scholar]
- Batista, A.L.; Piteira-Gomes, J. Practical assessment of the structural effects of swelling processes and updated inventory of the affected Portuguese concrete dams. In Proceedings of the 54° Congresso Brasileiro do Concreto (Fifty-Fourth Brazilian Conference on Concrete)–CBC 2012, Maceió, Alagoas, Brasil, 8–11 October 2012. [Google Scholar]
- LNEC. Estudos de Avaliação da Segurança Estrutural da Barragem do Alto Ceira (Studies for the Evaluation of Alto Ceira Dam Structural Safety) (Confidential Technical Report in Portuguese); LNEC–Proc. 0403/01/6619; Laboratório Nacional de Engenharia Civil (LNEC): Lisboa, Portugal, 2004. [Google Scholar]
- Castro, A.T.; Barateiro, J.; Serra, C. Overview on the multi-decade database of Portuguese large concrete dams monitoring data. In Proceedings of the Interdisciplinary Approaches for Cement-based Materials and Structural Concrete: Synergizing Expertise and Bridging Scales of Space and Time–SynerCrete’18, Funchal, Portugal, 24–26 October 2018; pp. 887–892. [Google Scholar]
- Gomes, J.C.P. Modelação do Comportamento Estrutural de Barragens de Betão Sujeitas a Reacções Expansivas (Structural Behaviour Modeling of Concrete Dams Subject to Swelling Reactions). Ph.D. Thesis, Faculdade de Ciências e Tecnologia da Universidade Nova de Lisboa (FCTUNL) & Laboratório Nacional de Engenharia Civil (LNEC), Lisbon, Portugal, 2008. (In Portuguese). [Google Scholar]
- LNEC. Observação da Barragem do Alto Ceira. Estudo da Fissuração no Betão da Estrutura (Levantamento Efectuado em Novembro 1986) (Confidential Technical Report in Portuguese); LNEC–Proc. 043/1/6619. Relatório 41/91–NO; Laboratório Nacional de Engenharia Civil (LNEC): Lisboa, Portugal, 1991. [Google Scholar]
- LNEC. Observação da Barragem do Alto Ceira. Avaliação do Estado de Fissuração Com Base em Ensaios de Ultrassons (Observation of Alto Ceira Dam. Evaluation of the Fissures Condition by Ultrasonic Tests) (Confidential Technical Report in Portuguese); LNEC–Proc. 043/01/6619. Relatório 111/95–NO; Laboratório Nacional de Engenharia Civil (LNEC): Lisboa, Portugal, 1995. [Google Scholar]
- Castro, A.T. Métodos de Retroanálise na Interpretação do Comportamento de Barragens de Betão (Retro-Analysis Methods in the Interpretation of the Behaviour of Concrete Dams). Ph.D. Thesis, Instituto Superior Técnico da Universidade de Lisboa (IST-UL) & Laboratório Nacional de Engenharia Civil (LNEC), Lisbon, Portugal, 1998. (In Portuguese). [Google Scholar]
- Henriques, M.J.; Ramos, P. Thermal imagining of concrete dam surfaces to support the control of the evolution of pathologies. In Second International Dam World Conference; Pina, C., Portela, E., Caldeira, L., Batista, A.L., Dias, I.F., Santos, R., Eds.; Laboratório Nacional de Engenharia Civil: Lisboa, Portugal, 2015. [Google Scholar]
- LNEC. Observação da Barragem do Alto Ceira. Avaliação da Segurança Estrutural (Observation of Alto Ceira Dam. Evaluation of the Structural Safety) (Confidential Technical Report in Portuguese); LNEC–Proc. 043/01/6619. Relatório 111/95–NO; Laboratório Nacional de Engenharia Civil (LNEC): Lisboa, Portugal, 1995. [Google Scholar]
- LNEC. Barragem do Alto Ceira. Primeiro Ensaio de Vibração Forçada (Alto Ceira Dam. First Forced Vibration Test) (Confidential Technical Report in Portuguese); LNEC–Proc. 043/01/6619. Relatório 111/95–NO; Laboratório Nacional de Engenharia Civil (LNEC): Lisboa, Portugal, 1997. [Google Scholar]
- LNEC. Observação da Barragem do Alto Ceira (Alto Ceira Dam Monitoring) (Confidential Technical Report in Portuguese); LNEC–Proc. 105-II. Relatório–Segundo Serviço/Secção de Barragens; Laboratório Nacional de Engenharia Civil (LNEC): Lisboa, Portugal, 1951. [Google Scholar]
- LNEC. Determinação de Tensões e Caracterização do Betão na Barragem do Ceira (Stress Determination and Concrete Characterisation at the Ceira Dam) (Confidential Technical Report in Portuguese); LNEC–Proc. 043/01/6619. Relatório 101/87–NFR; Laboratório Nacional de Engenharia Civil (LNEC): Lisboa, Portugal, 1987. [Google Scholar]
- MHOPT. Decreto-Lei n.º 349-C/83 de 30 de Julho–Regulamento de Estruturas de Betão Armado e Pré-Esforçado (REBAP); Diário da República, Série I, Número 174, 30 de Julho de 1983; Ministério da Habitação, Obras Públicas e Transportes: Lisboa, Portugal, 1983. (In Portuguese) [Google Scholar]
- EN 1992-1-1:2004/A1:2014; Eurocode 2. Design of Concrete Structures. General Rules and Rules for Buildings. European Committee for Standardization (CEN): Brussels, Belgium, 2004.
- CS. Concrete Society Technical Report No. 11 Including Addendum (1987)–Concrete Core Testing for Strength; The Concrete Society: London, UK, 1987; p. 38. [Google Scholar]
- BS EN 13791:2007; Assessment of In-Situ Compressive Strength in Structures and Precast Components. British Standards Institution (BSI): London, UK, 2007.
- LNEC. Estudo dos Betões do Alto Ceira. Análise Petrográfica (Study of the Concretes of Alto Ceira Dam. Petrographic Analysis) (Confidential Technical Report in Portuguese); LNEC–Proc. 043/01/6619. Relatório 5/91–NO/GERO; Laboratório Nacional de Engenharia Civil (LNEC): Lisboa, Portugal, 1990. [Google Scholar]
- LNEC. Estudo do Betão da Barragem do Alto Ceira. Colaboração do Núcleo de Química (Study of the Concrete of Alto Ceira Dam. Collaboration of the Chemistry Division) (Confidential Technical Report in Portuguese); LNEC–Proc. 024/53/541. Relatório 170/91–NQ; Laboratório Nacional de Engenharia Civil (LNEC): Lisboa, Portugal, 1991. [Google Scholar]
- LNEC. Especificação LNEC E 159:1964 Agregados. Determinação da Reatividade Potencial–Método Absorciométrico (Aggregates. Determination of Potential Reactivity. Chemical Method); Laboratório Nacional de Engenharia Civil, I.P. (LNEC): Lisboa, Portugal, 1964. (In Portuguese) [Google Scholar]
- ASTM C289-87; Standard Test Method for Potential Alkali-Silica Reactivity of Aggregates (Chemical Method). ASTM International: West Conshohocken, PA, USA, 1987.
- Idorn, G.M.; Rostam, S. (Eds.) Proceedings of the Sixth International Conference on Alkali-Aggregate Reaction–ICAAR 1983, Copenhagen, Denmark, 22–25 Juned 1983; Danish Concrete Association (DBF): Copenhagen, Denmark, 1983. [Google Scholar]
- Okada, K.; Nishibayashi, S.; Kawamura, M. (Eds.) Proceedings of the Eighth International Conference on Alkali-Aggregate Reaction–ICAAR, Kyoto, Japan, 7–20 July 1989; Elsevier Applied Science: London, UK, 1989. [Google Scholar]
- EN 12504-4:2004; Testing Concrete. Part 4: Determination of Ultrasonic Pulse Velocity. European Committee for Standardization (CEN): Brussels, Belgium, 2004.
- Custódio, J. ENHANCE—Enhancing Diagnosis, Prognosis and Mitigation of Internal Expansive Reactions in Concrete Structures (2017–2021); Project final report; LNEC–Proc. 0202/111/21202. Relatório 256/2022–DM/NBPC; Laboratório Nacional de Engenharia Civil (LNEC): Lisboa, Portugal, 2022. [Google Scholar]
- NP EN 12390-7:2009; Testing Hardened Concrete. Part 7: Density of Hardened Concrete. Instituto Português da Qualidade, I.P. (IPQ): Caparica, Portugal, 2009.
- Tomsett, H.N. The practical use of ultrasonic pulse velocity measurements in the assessment of concrete quality. Mag. Concr. Res. 1980, 32, 7–16. [Google Scholar] [CrossRef]
- Custódio, J.; Ribeiro, A.B. Evaluation of damage in concrete from structures affected by internal swelling reactions—A case study. Procedia Struct. Integr. 2019, 17, 80–89. [Google Scholar] [CrossRef]
- EN 12504-1:2009; Testing Concrete in Structures. Part 1: Cored Specimens. Taking, Examining and Testing in Compression. European Committee for Standardization (CEN): Brussels, Belgium, 2009.
- EN 12390-3:2009; Testing Hardened Concrete. Part 3: Compressive Strength of Test Specimens. European Committee for Standardization (CEN): Brussels, Belgium, 2009.
- Custódio, J. FCT Research, Development and Innovation Project “Enhancing Diagnosis, Prognosis and Mitigation of Internal Expansive Reactions in Concrete Structures (IF/00595/2015)”; Fundação para a Ciência e a Tecnologia (FCT): Lisboa, Portugal, 2017–2021. [Google Scholar]
- Custódio, J. LNEC Research, Development and Innovation Project “Concrete Degradation Due to Internal Swelling Reactions: Diagnosis and Prognosis”; Laboratório Nacional de Engenharia Civil, I. P. (LNEC): Lisboa, Portugal, 2015–2019. [Google Scholar]
- Custódio, J.; Ribeiro, A.B. Internal Expansive Reactions in Concrete Structures–Quantifying the extent of internal damage. In Proceedings of the 1st International Conference on Structural Integrity—ICSI 2015, Funchal, Portugal, 1–4 September 2015. [Google Scholar]
- Custódio, J.; Ribeiro, A.B. Internal Expansive Reactions in Concrete Structures—Deterioration of the mechanical properties. In Proceedings of the 2nd International Conference of the International Journal of Structural Integrity—IJSI 2014, Madeira, Portugal, 1–4 September2014. [Google Scholar]


| Date | Activity | Comments |
|---|---|---|
| 1940–1949 | Dam construction | - |
| 1950 | First filling and the beginning of the monitoring plan with measurements of horizontal and vertical displacements | - |
| 1951 | Concrete testing of the cores for mechanical characterisation (modulus of elasticity) | Testing programme for obtaining reference values |
| Stage 1—Initial Survey and Stage 2—Diagnosis | ||
| 1951–1986 | Periodic structural assessments based on monitoring results | Reported anomalous structural behaviour in the later years |
| 1986 | Concrete testing of the cores for mechanical characterisation (modulus of elasticity and compressive strength) | Reported a reduction of the modulus of elasticity values in some core locations |
| 1986 | In situ ultrasonic testing for deterioration assessment (crack length and depth) | Testing programme for obtaining reference values |
| 1986 | The installation of new instruments to reinforce the monitoring system (additional geodetic network, a plumbline, rod extensometers in the foundation and the dam body, and weirs and piezometers) | The introduction of new instruments to validate the obtained monitoring results and aid the structural safety analysis |
| 1990 | Concrete testing of the cores for petrographic analysis and the assessment of the potential alkali-reactivity of two aggregates | Reported potentially alkali-reactive aggregates |
| 1994 | In situ ultrasonic testing for deterioration assessment (crack length and depth) | Testing programme for assessment |
| 1995 | The development of a numerical model to estimate swelling rates in different areas of the dam | First numerical model of the dam |
| 1996 | Forced vibration tests to characterise the dynamic behaviour | Testing programme for obtaining reference values |
| Stage 3—Prognosis | ||
| 1995–2004 | Periodic structural assessments based on monitoring results and numerical model results (back analysis to estimate swelling rates in different areas of the dam) | Reported anomalous structural behaviour and new values for swelling rates were obtained |
| 2001 | In situ ultrasonic testing for deterioration assessment (crack length and depth) | Reported increase in travel time of the ultrasonic wave pulse |
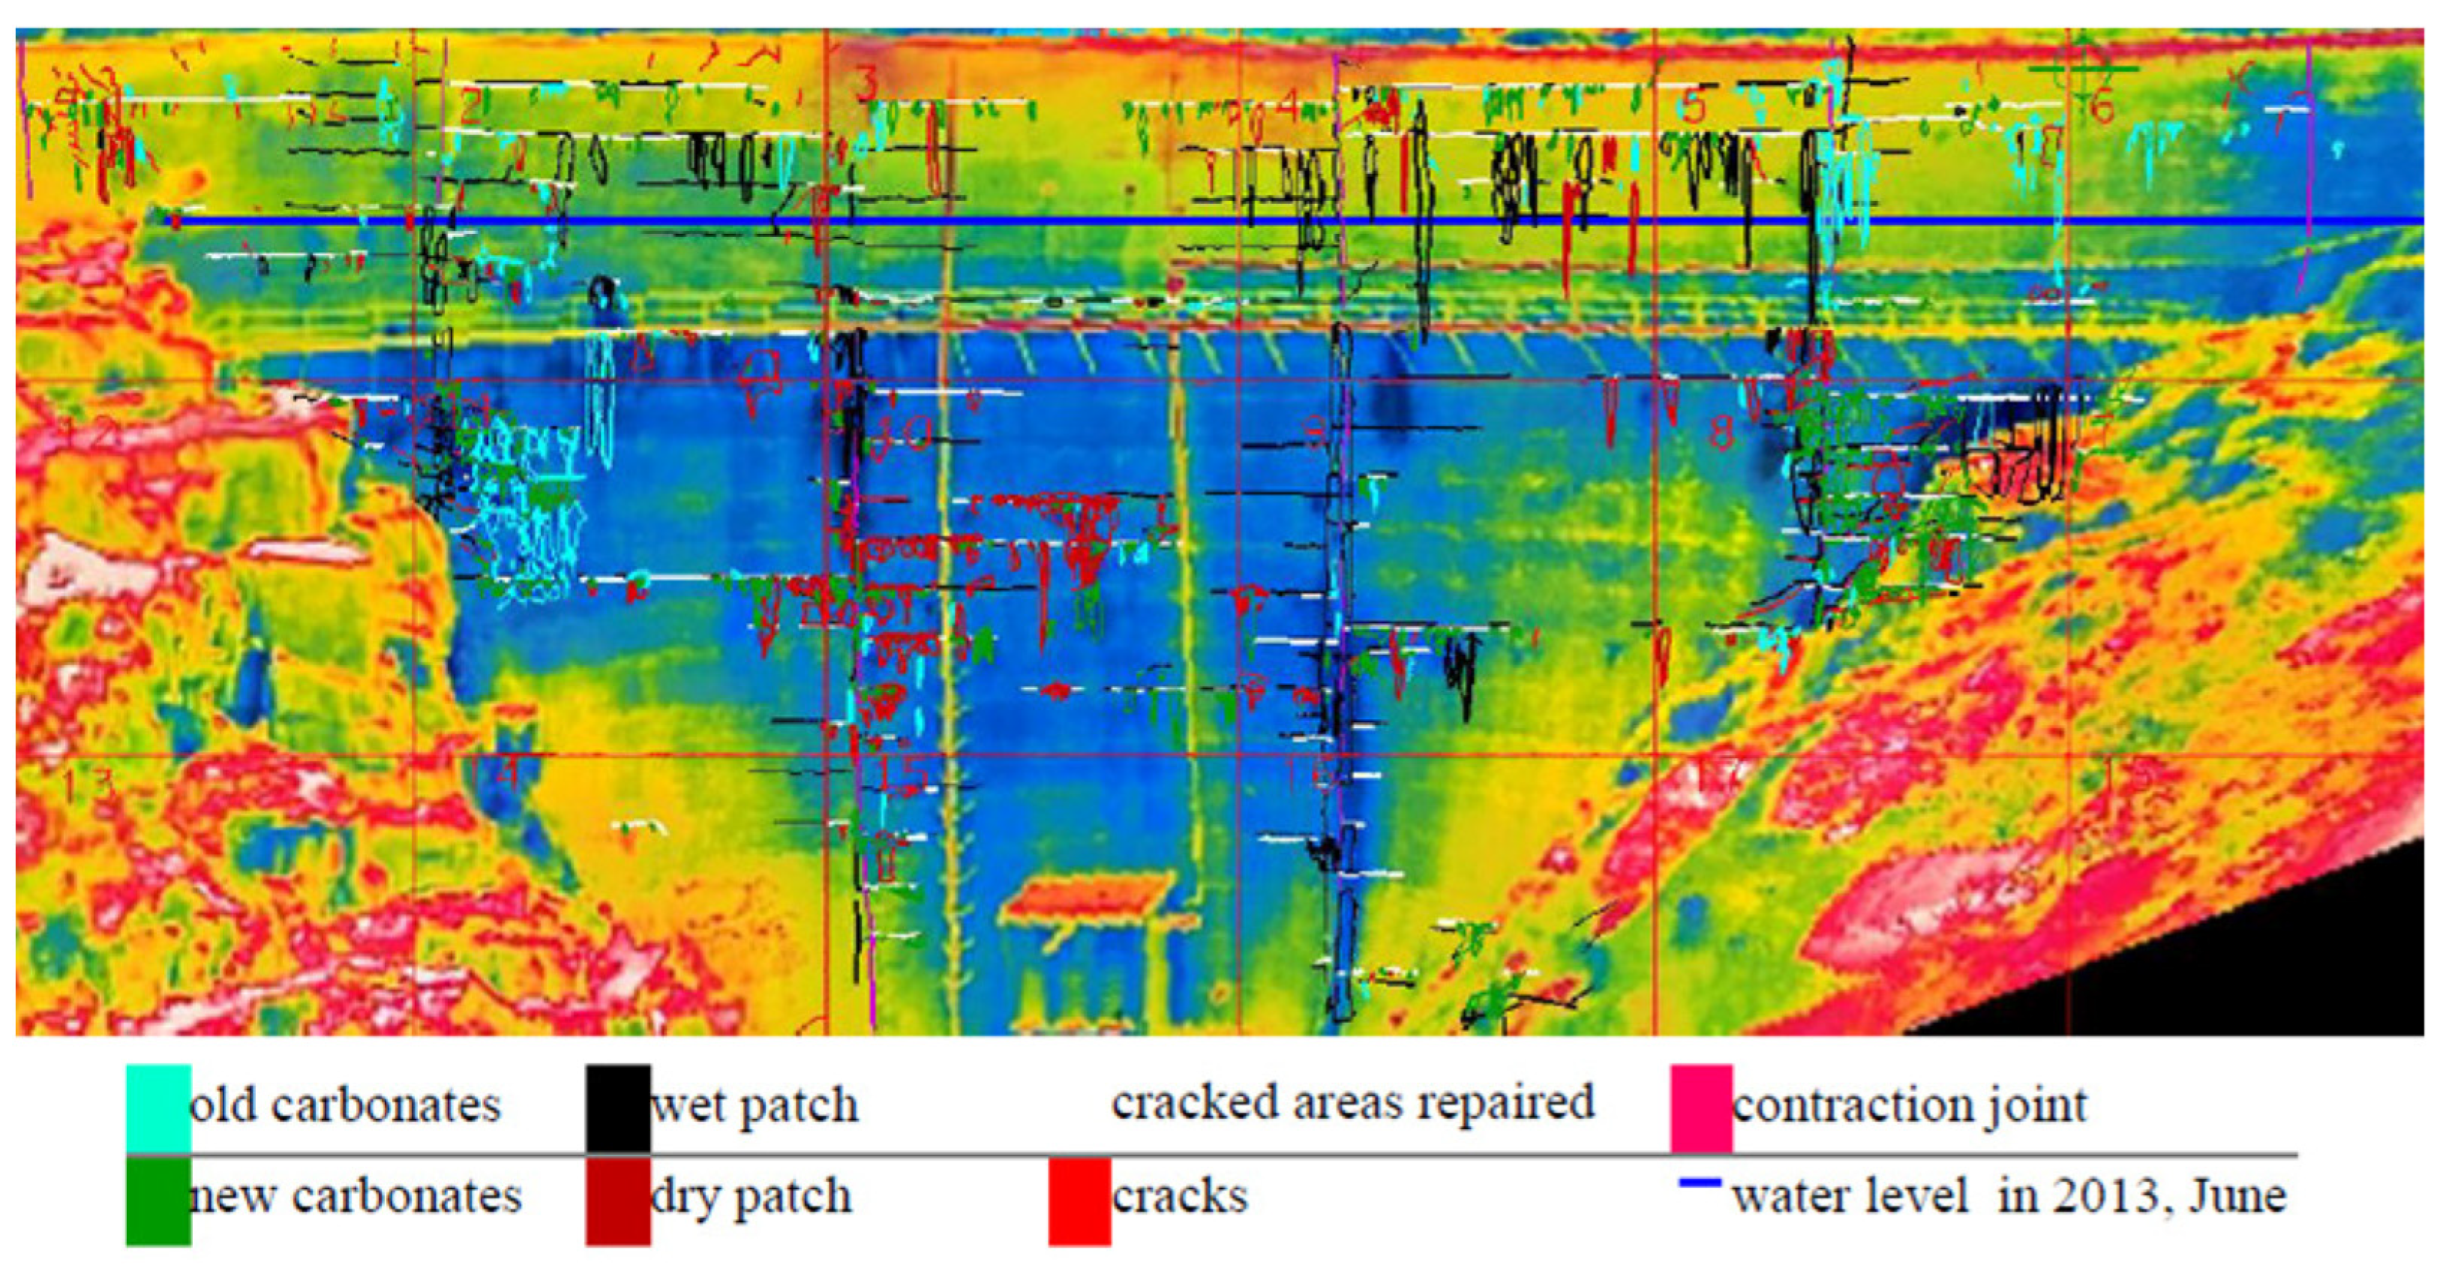
| 2013 | Use of thermal images of the downstream face of the dam to evaluate and quantify anomalies (cracks and leakage) | Reported correlation of wet areas with severe cracking patterns |
| 2013–2020 | Concrete testing of the cores for petrographic, microstructural, and chemical analysis, concrete ultimate expansivity tests, laboratory ultrasonic tests, and mechanical tests, including stiffness damage tests | A reduction of the concrete modulus of elasticity and compressive strength. SDT revealed a potential expansion of 1900 × 10−6 |
| 2014 | Decommission and replacement by a new dam downstream | - |
| Specimen | Height (mm) | With (mm) | Length (mm) | Modulus of Elasticity (GPa) | ||
|---|---|---|---|---|---|---|
| 1 | 300 | 300 | 725 | 32.8 | 30.9 | 1.4 |
| 2 | 200 | 200 | 600 | 30.6 | ||
| 3 | 200 | 200 | 600 | 30.7 | ||
| 4 | 200 | 200 | 600 | 29.6 | ||
| Location | Specimen | Diameter, Ø (mm) | Height, h (mm) | Modulus of Elasticity (GPa) | Compressive Strength (MPa) | ||||||
|---|---|---|---|---|---|---|---|---|---|---|---|
| L1 | 1 | 150 | 400 | 23.6 | 24.8 | 27.3 | 6.1 | 39.3 | 43.6 | 39.4 | 6.5 |
| 2 | 150 | 400 | 26.1 | 47.9 | |||||||
| L2 | 3 | 150 | 400 | 28.1 | 26.3 | 44.9 | 45.6 | ||||
| 4 | 150 | 400 | 24.4 | 46.4 | |||||||
| L3 | 5 | 150 | 400 | 33.1 | 35.8 | 33.1 | 31.9 | ||||
| 6 | 150 | 400 | 38.5 | 30.6 | |||||||
| L5 | 7 | 150 | 400 | 25.7 | 22.2 | 38.2 | 36.5 | ||||
| 8 | 150 | 400 | 18.7 | 34.7 | |||||||
| Test Sample | Sc (mmol/L) | Rc (mmol/L) | Classification |
|---|---|---|---|
| “Q” | 26.5 | 16.0 | Aggregate considered innocuous |
| “A” | 37.1 | 17.6 | Aggregate considered innocuous |
| Block | Hole | Location | Specimen | Extraction Height (m) |
|---|---|---|---|---|
| CD | SE | Left bank | E1/1; E1/2 | 0–0.20; 1.80–1.70 |
| E2/1; E2/2; E2/3 *; E2/4 * | 1.90–2.20 | |||
| E3/1; E3/2 | 6.42–6.80 | |||
| EF | SD | Right bank | D1/1; D1/2 | 0.60–1.00 |
| D2/1; D2/2; D2/3; D2/4 * | 2.20–2.38; 4.35–4.60 | |||
| D3/1; D3/2 * | 6.95–7.40 |
| Element | Block | Location | Cores Ø123 mm | Cores Ø144 mm | Cores Ø153 mm | Cores Ø192 mm | Cores Ø217 mm |
|---|---|---|---|---|---|---|---|
| Downstream face | DE | L1 | - | - | 3 | 2 | |
| BC | L2 | - | 4 | - | - | - | |
| FG | L3 | - | 3 | - | 1 | - | |
| DE | L4 | - | - | 4 | - | - | |
| Crest | FG | L5 | 1 | 2 | 2 | - | - |
| DE | L6 | - | - | 3 | - | 1 |
| Location | Specimen | Diameter, d (mm) | Height, h (mm) | h/d | Compressive Strength, fc (MPa) | ||||
|---|---|---|---|---|---|---|---|---|---|
| L1 | AC-1.0B | 153 | 308 | 2.0 | 43.4 | 49.6 | (11.4) | 47.8 | (13.3) |
| L2 | AC-2.0B | 144 | 272 | 1.9 | 64.9 | ||||
| L3 | AC-3.0B | 144 | 291 | 2.0 | 38.9 | ||||
| L4 | AC-4.0B | 153 | 303 | 2.0 | 51.0 | ||||
| L5 | AC-5.1B | 123 | 255 | 2.1 | 29.3 | 44.4 | (21.3) | ||
| L6 | AC-6.0B | 153 | 313 | 2.0 | 59.5 | ||||
| Location | Specimen | Elasticity Modulus, Ec (GPa) | Accumulated Final Extension, εc (×10−6) | Dissipated Energy, DE (J/m3) | |||||||||
|---|---|---|---|---|---|---|---|---|---|---|---|---|---|
| L1 | AC-1.0B | 28.0 | 29.8 | 30.5 | 30.2 | 33 | 26 | 24 | 23 | 305 | 254 | 250 | 252 |
| AC-1.1B | 31.7 | 20 | 204 | ||||||||||
| L2 | AC-2.0B | 33.5 | 33.0 | 21 | 21 | 188 | 186 | ||||||
| AC-2.1B | 32.5 | 21 | 184 | ||||||||||
| L3 | AC-3.0B | 25.9 | 25.0 | 28 | 35 | 338 | 401 | ||||||
| AC-3.1B | 24.0 | 42 | 463 | ||||||||||
| L4 | AC-4.0B | 35.5 | 34.3 | 13 | 13 | 141 | 157 | ||||||
| AC-4.1B | 33.0 | 13 | 174 | ||||||||||
| L5 | AC-5.1B | 24.4 | 24.4 | 29.5 | 41 | 41 | 20 | 500 | 500 | 260 | |||
| L6 | AC-6.0B | 31.0 | 32.1 | 13 | 10 | 138 | 140 | ||||||
| AC-6.1B | 33.1 | 7 | 141 | ||||||||||
| Location | Specimen | Total Non-Restrained Expansion, Method A (×10−6) | Total Non-Restrained Expansion, Method B (×10−6) | ||||||
|---|---|---|---|---|---|---|---|---|---|
| L1 | AC-1.0B | 1000 | 700 | 700 | 700 | 600 | 400 | 400 | 400 |
| AC-1.1B | 500 | 200 | |||||||
| L2 | AC-2.0B | 300 | 300 | 300 | 300 | ||||
| AC-2.1B | 300 | 300 | |||||||
| L3 | AC-3.0B | 1400 | 1600 | 700 | 900 | ||||
| AC-3.1B | 1900 | 1100 | |||||||
| L4 | AC-4.0B | 100 | 200 | 0 | 100 | ||||
| AC-4.1B | 300 | 100 | |||||||
| L5 | AC-5.1B | 1900 | 1900 | 800 | 800 | 800 | 400 | ||
| L6 | AC-6.0B | 400 | 300 | 300 | 300 | ||||
| AC-6.1B | 200 | 200 | |||||||
Disclaimer/Publisher’s Note: The statements, opinions and data contained in all publications are solely those of the individual author(s) and contributor(s) and not of MDPI and/or the editor(s). MDPI and/or the editor(s) disclaim responsibility for any injury to people or property resulting from any ideas, methods, instructions or products referred to in the content. |
© 2025 by the authors. Licensee MDPI, Basel, Switzerland. This article is an open access article distributed under the terms and conditions of the Creative Commons Attribution (CC BY) license (https://creativecommons.org/licenses/by/4.0/).
Share and Cite
Custódio, J.; Mata, J.; Serra, C.; Ribeiro, A.B.; Tavares de Castro, A.; Batista, A.L. Insights into the Diagnosis and Prognosis of the Alkali–Silica Reaction (ASR) in Concrete Dams, Highlighting the Case of the Demolished Alto Ceira Dam in Portugal. Buildings 2025, 15, 460. https://doi.org/10.3390/buildings15030460
Custódio J, Mata J, Serra C, Ribeiro AB, Tavares de Castro A, Batista AL. Insights into the Diagnosis and Prognosis of the Alkali–Silica Reaction (ASR) in Concrete Dams, Highlighting the Case of the Demolished Alto Ceira Dam in Portugal. Buildings. 2025; 15(3):460. https://doi.org/10.3390/buildings15030460
Chicago/Turabian StyleCustódio, João, Juan Mata, Carlos Serra, António Bettencourt Ribeiro, António Tavares de Castro, and António Lopes Batista. 2025. "Insights into the Diagnosis and Prognosis of the Alkali–Silica Reaction (ASR) in Concrete Dams, Highlighting the Case of the Demolished Alto Ceira Dam in Portugal" Buildings 15, no. 3: 460. https://doi.org/10.3390/buildings15030460
APA StyleCustódio, J., Mata, J., Serra, C., Ribeiro, A. B., Tavares de Castro, A., & Batista, A. L. (2025). Insights into the Diagnosis and Prognosis of the Alkali–Silica Reaction (ASR) in Concrete Dams, Highlighting the Case of the Demolished Alto Ceira Dam in Portugal. Buildings, 15(3), 460. https://doi.org/10.3390/buildings15030460