
Sustainable Design of a Tiny House: Using a Life Cycle Assessment Approach to Compare the Environmental Performance of Industrial and Earth-Based Building Systems

 ,
,  ,
,  and
and 
Abstract
1. Introduction
2. Materials and Methods
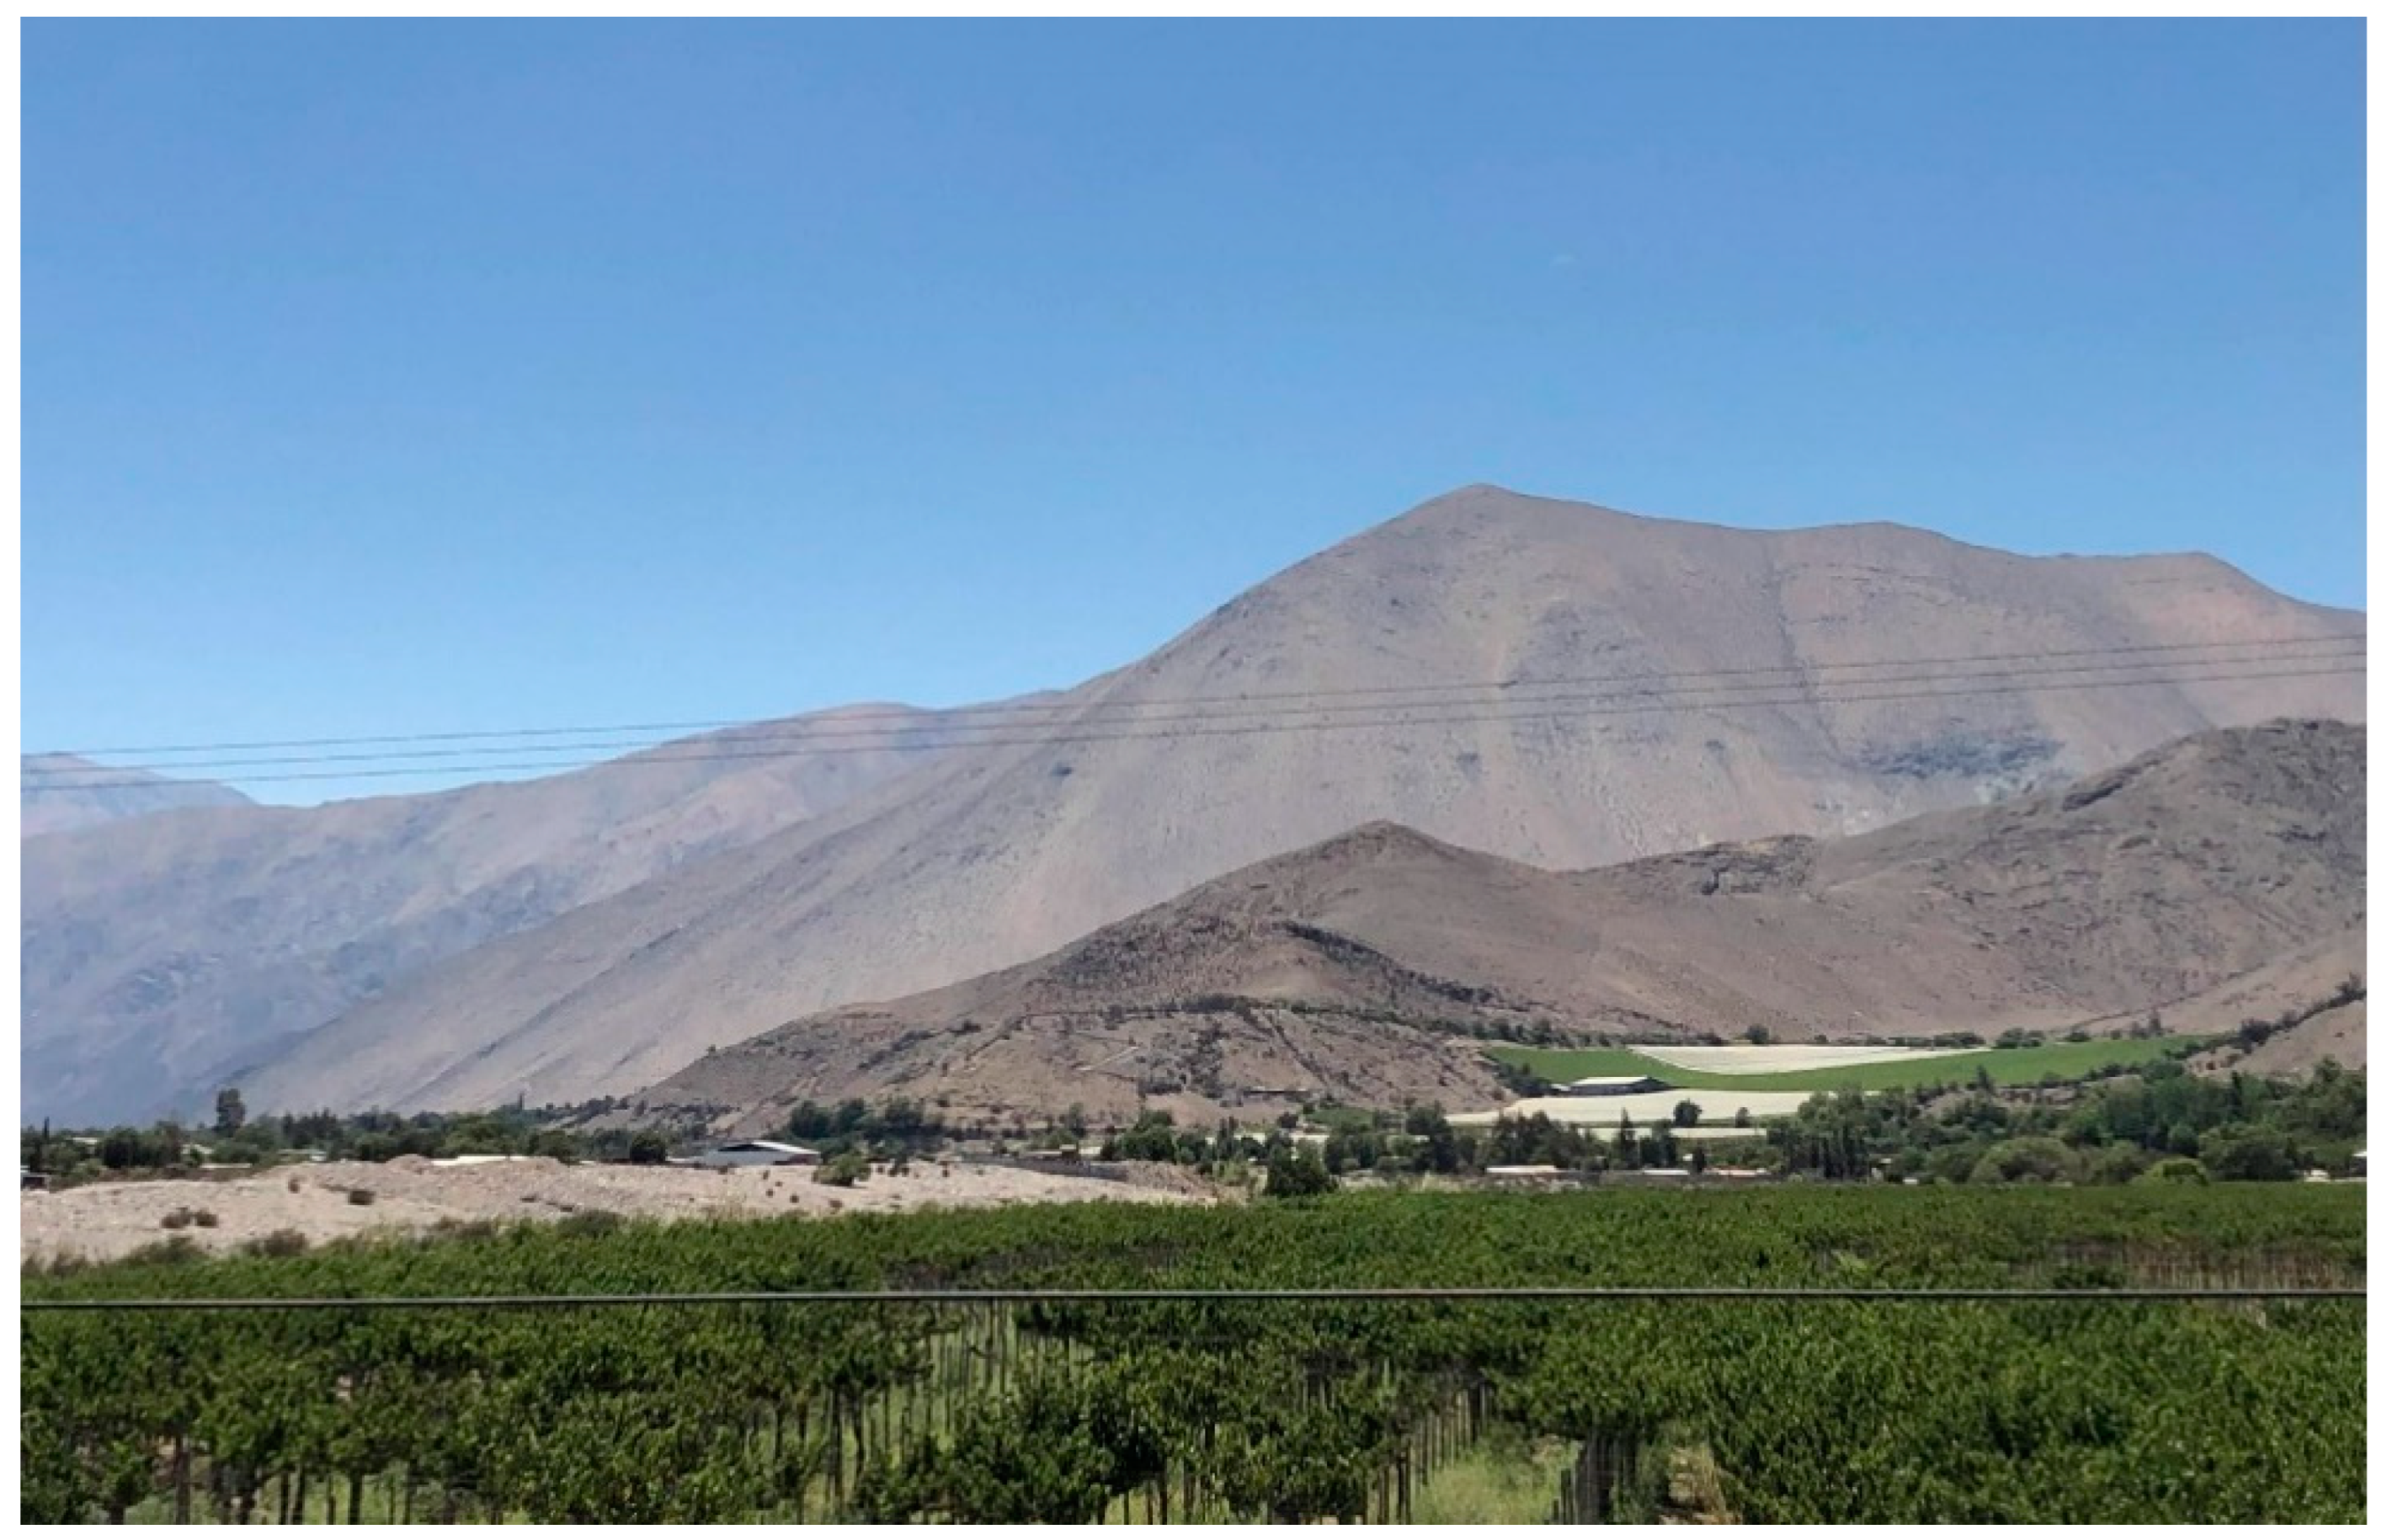
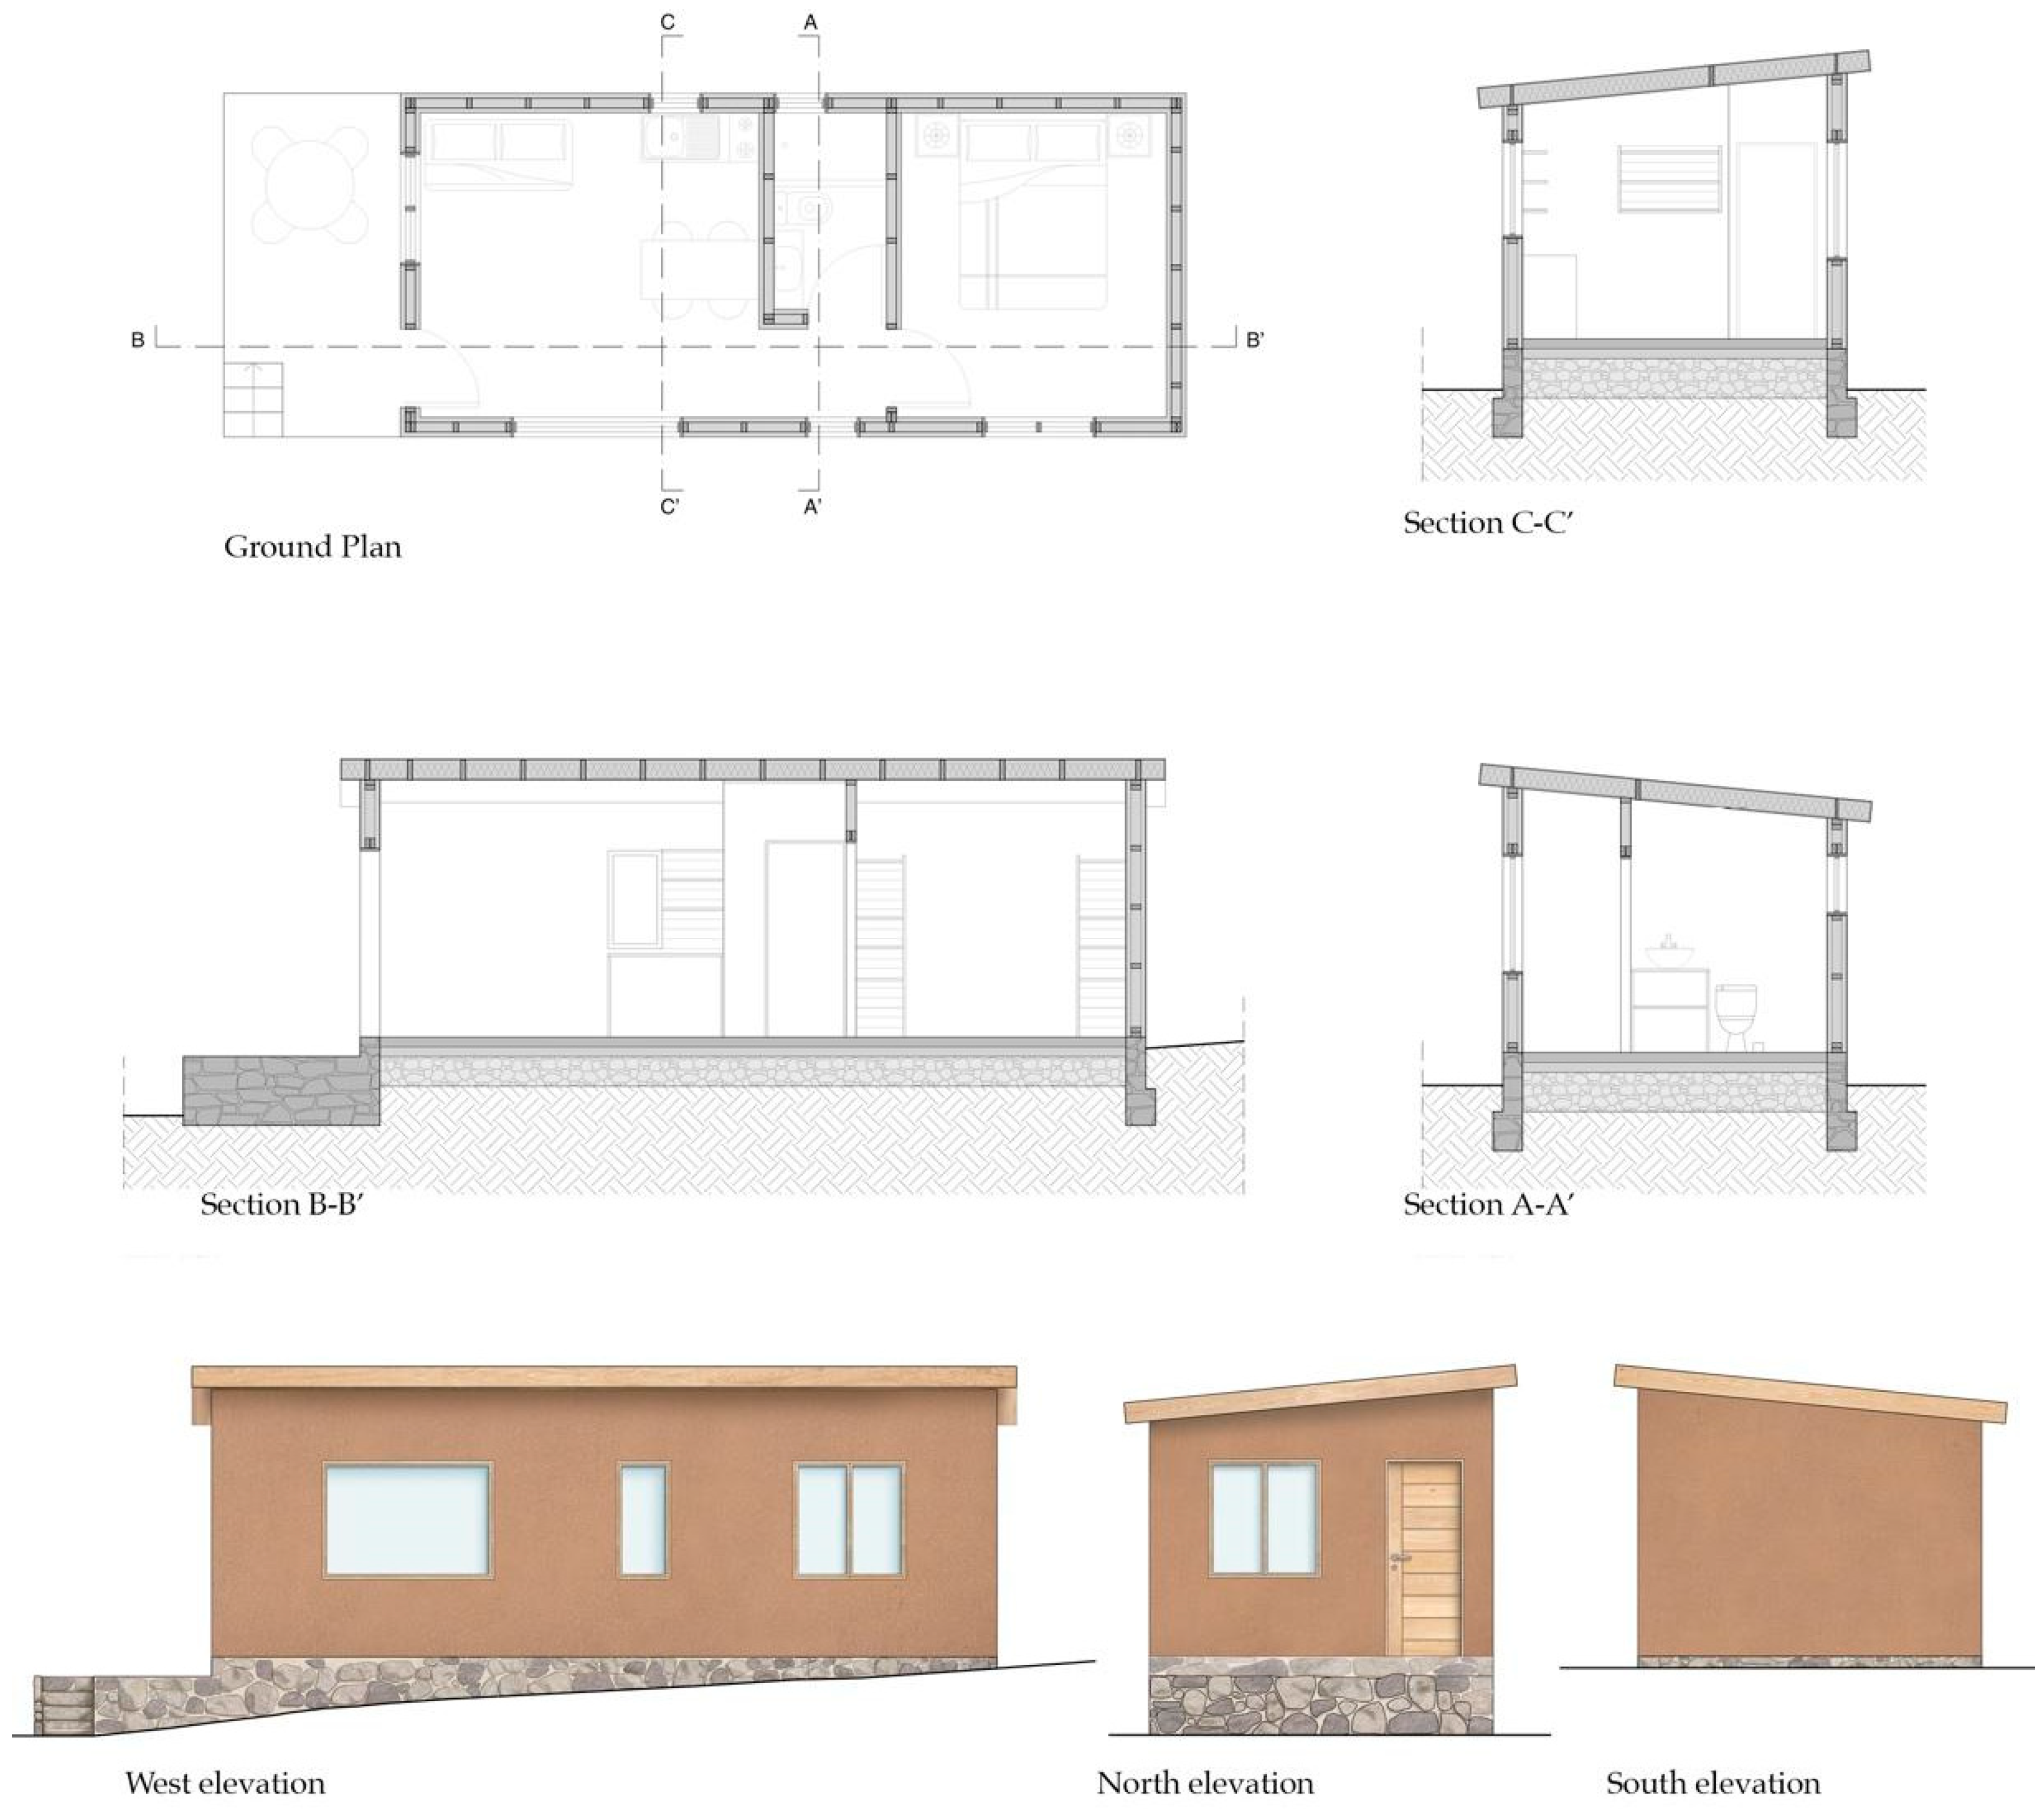
2.1. Case Study Description
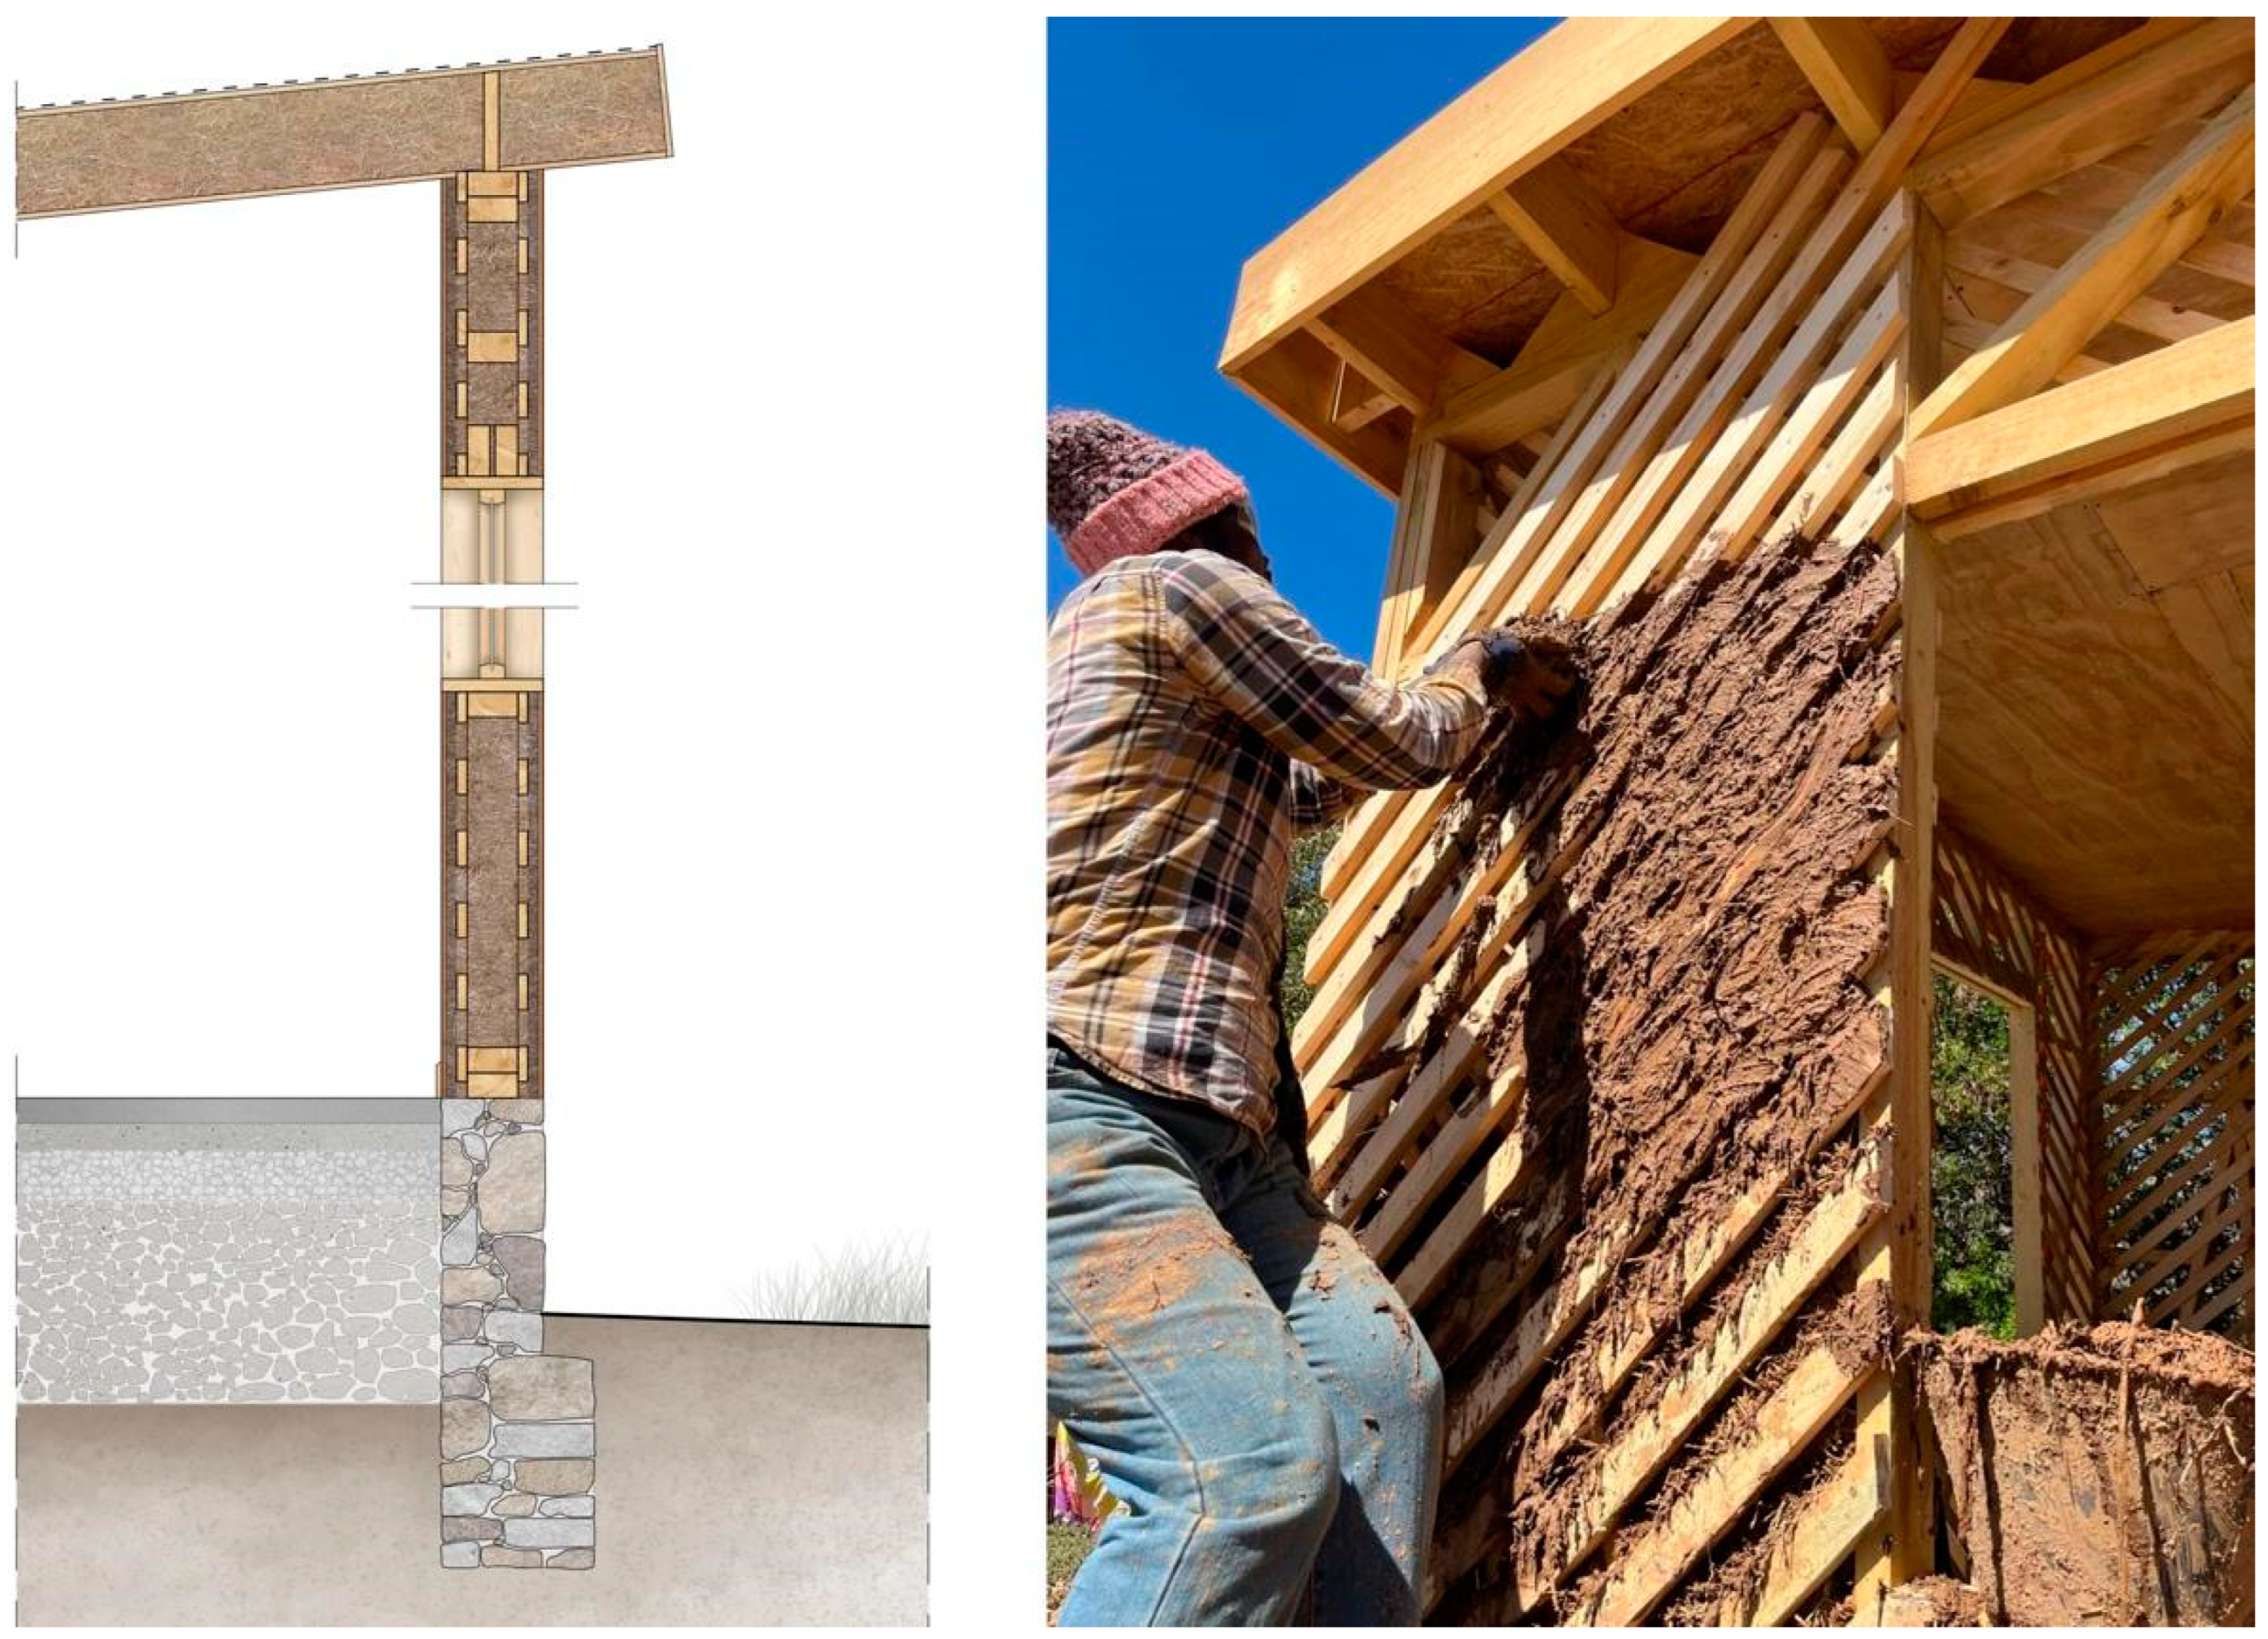
2.2. Construction Systems Used for Comparison
2.2.1. Wooden Prefabricated House System (W1 and W2)
2.2.2. Light Steel Frame Prefabricated System (LSF)
2.2.3. Concrete Panel System with EPS Insulation (CPS)
2.3. Thermal Performance Assessment of Enclosure Components
2.4. Life Cycle Assessment at the Building Scale
- Upstream: the production of materials and construction components, starting from raw material extraction.
- Transportation: the delivery of raw materials and construction elements to the building site.
- Core: the construction phase of the tiny house.
- Maintenance: material replacements over time, based on the estimated lifespan of key building components.
- End of Life: the disassembly, transport, disposal, or treatment of waste materials at the building’s end of life.
3. Results and Discussion
3.1. Expected Thermal Performance
3.1.1. Foundations
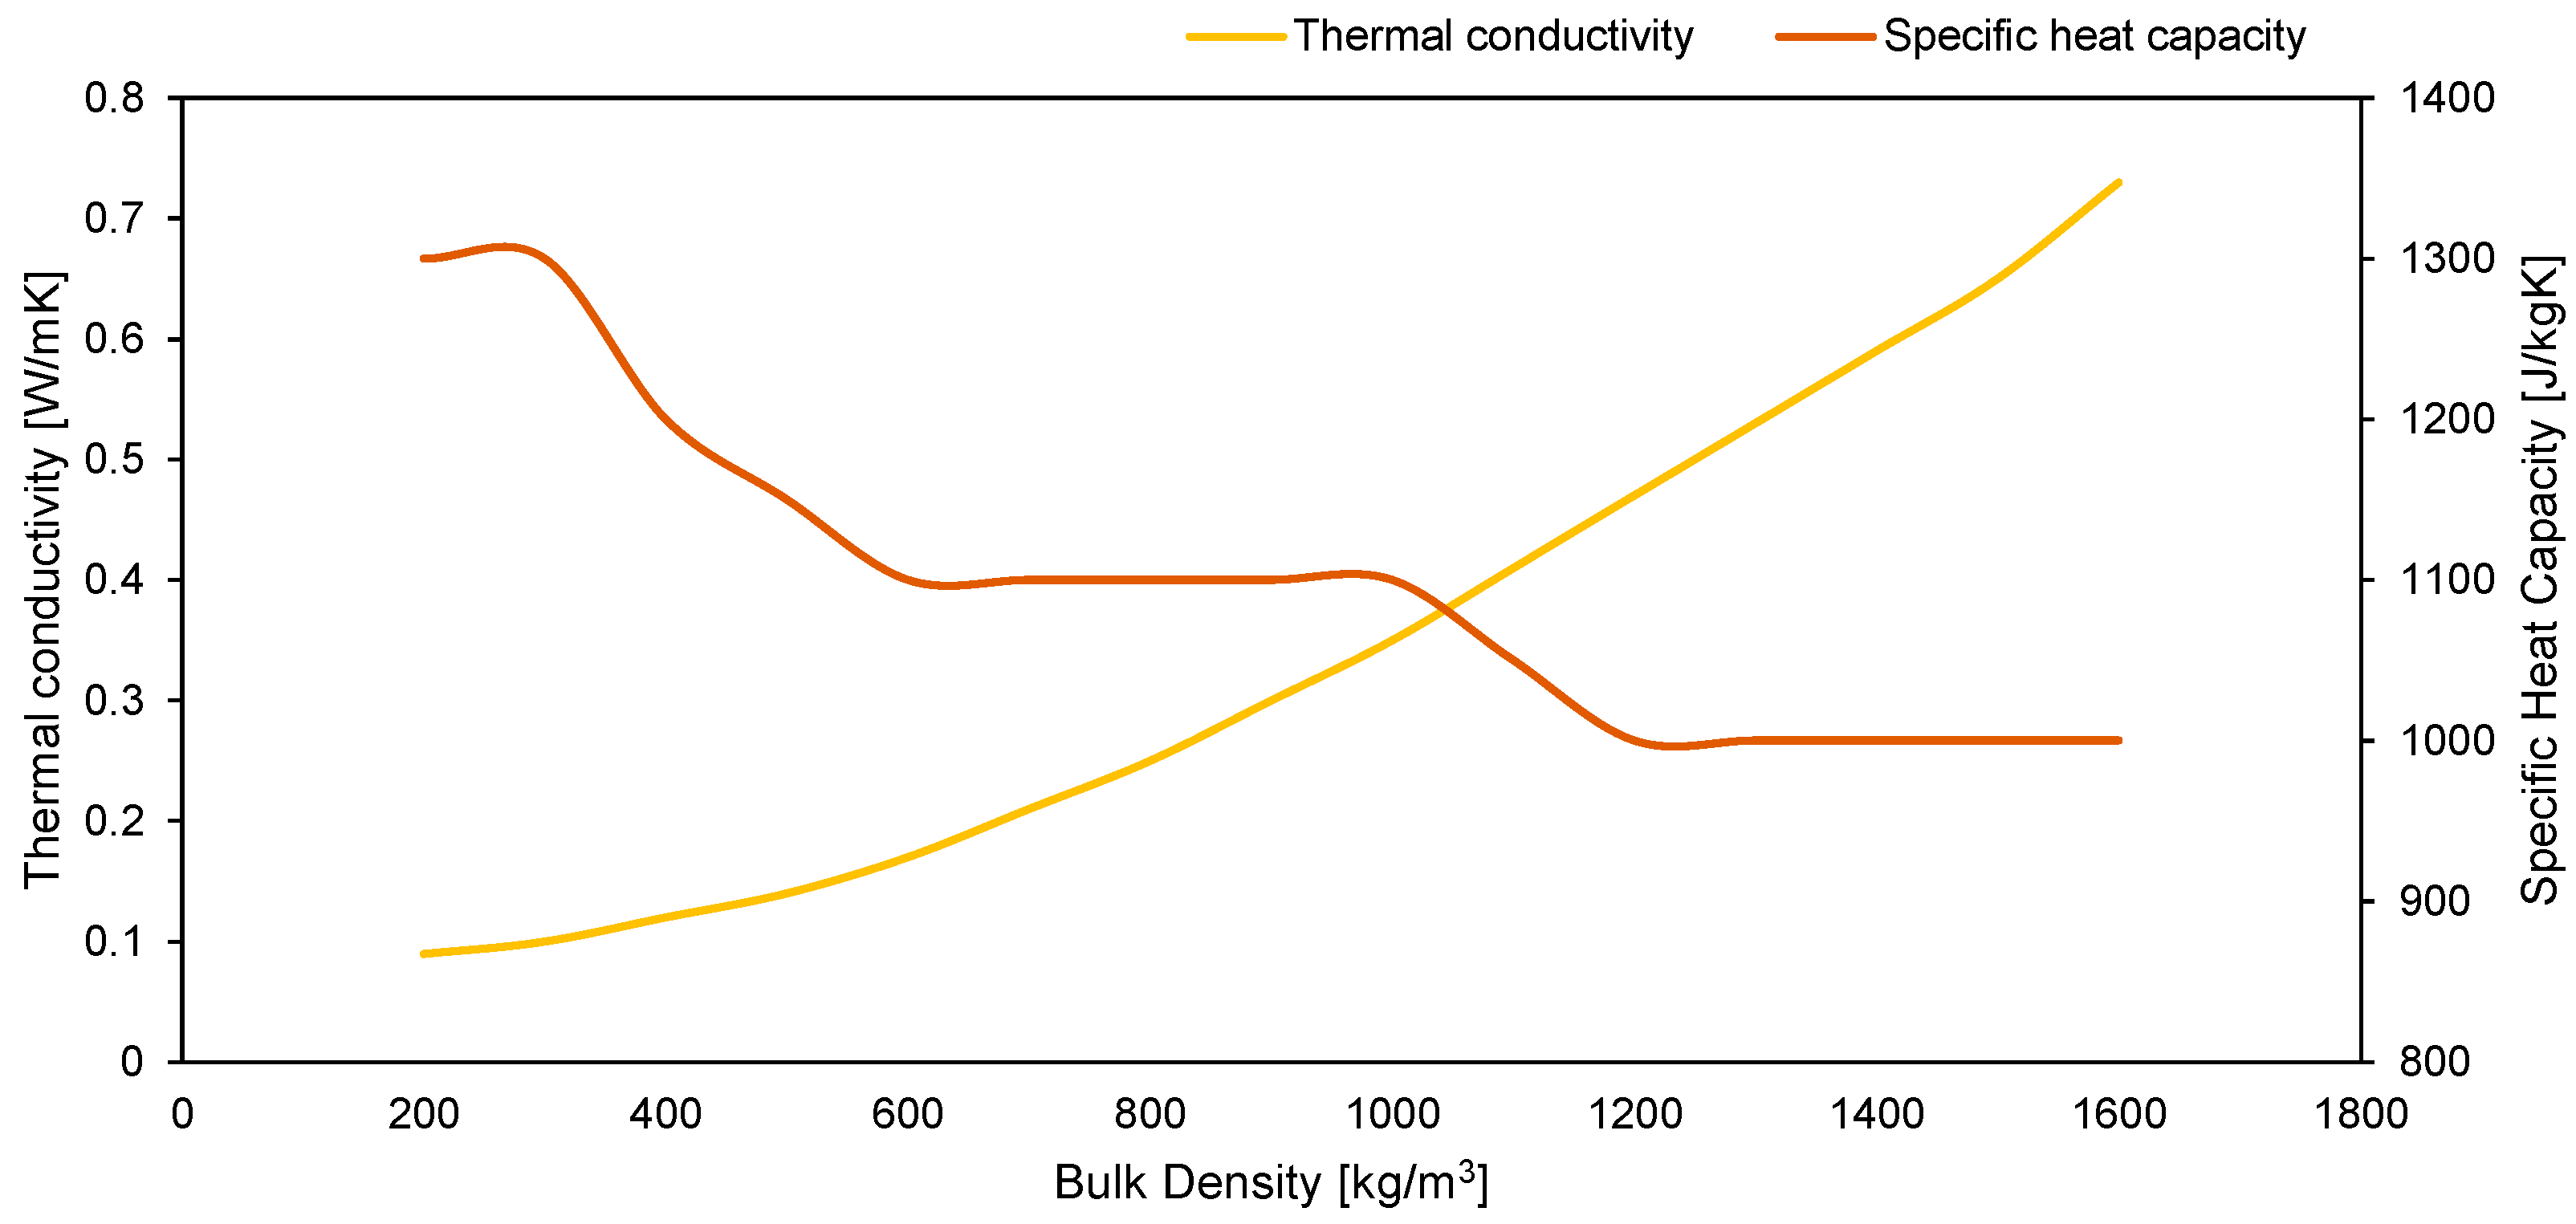
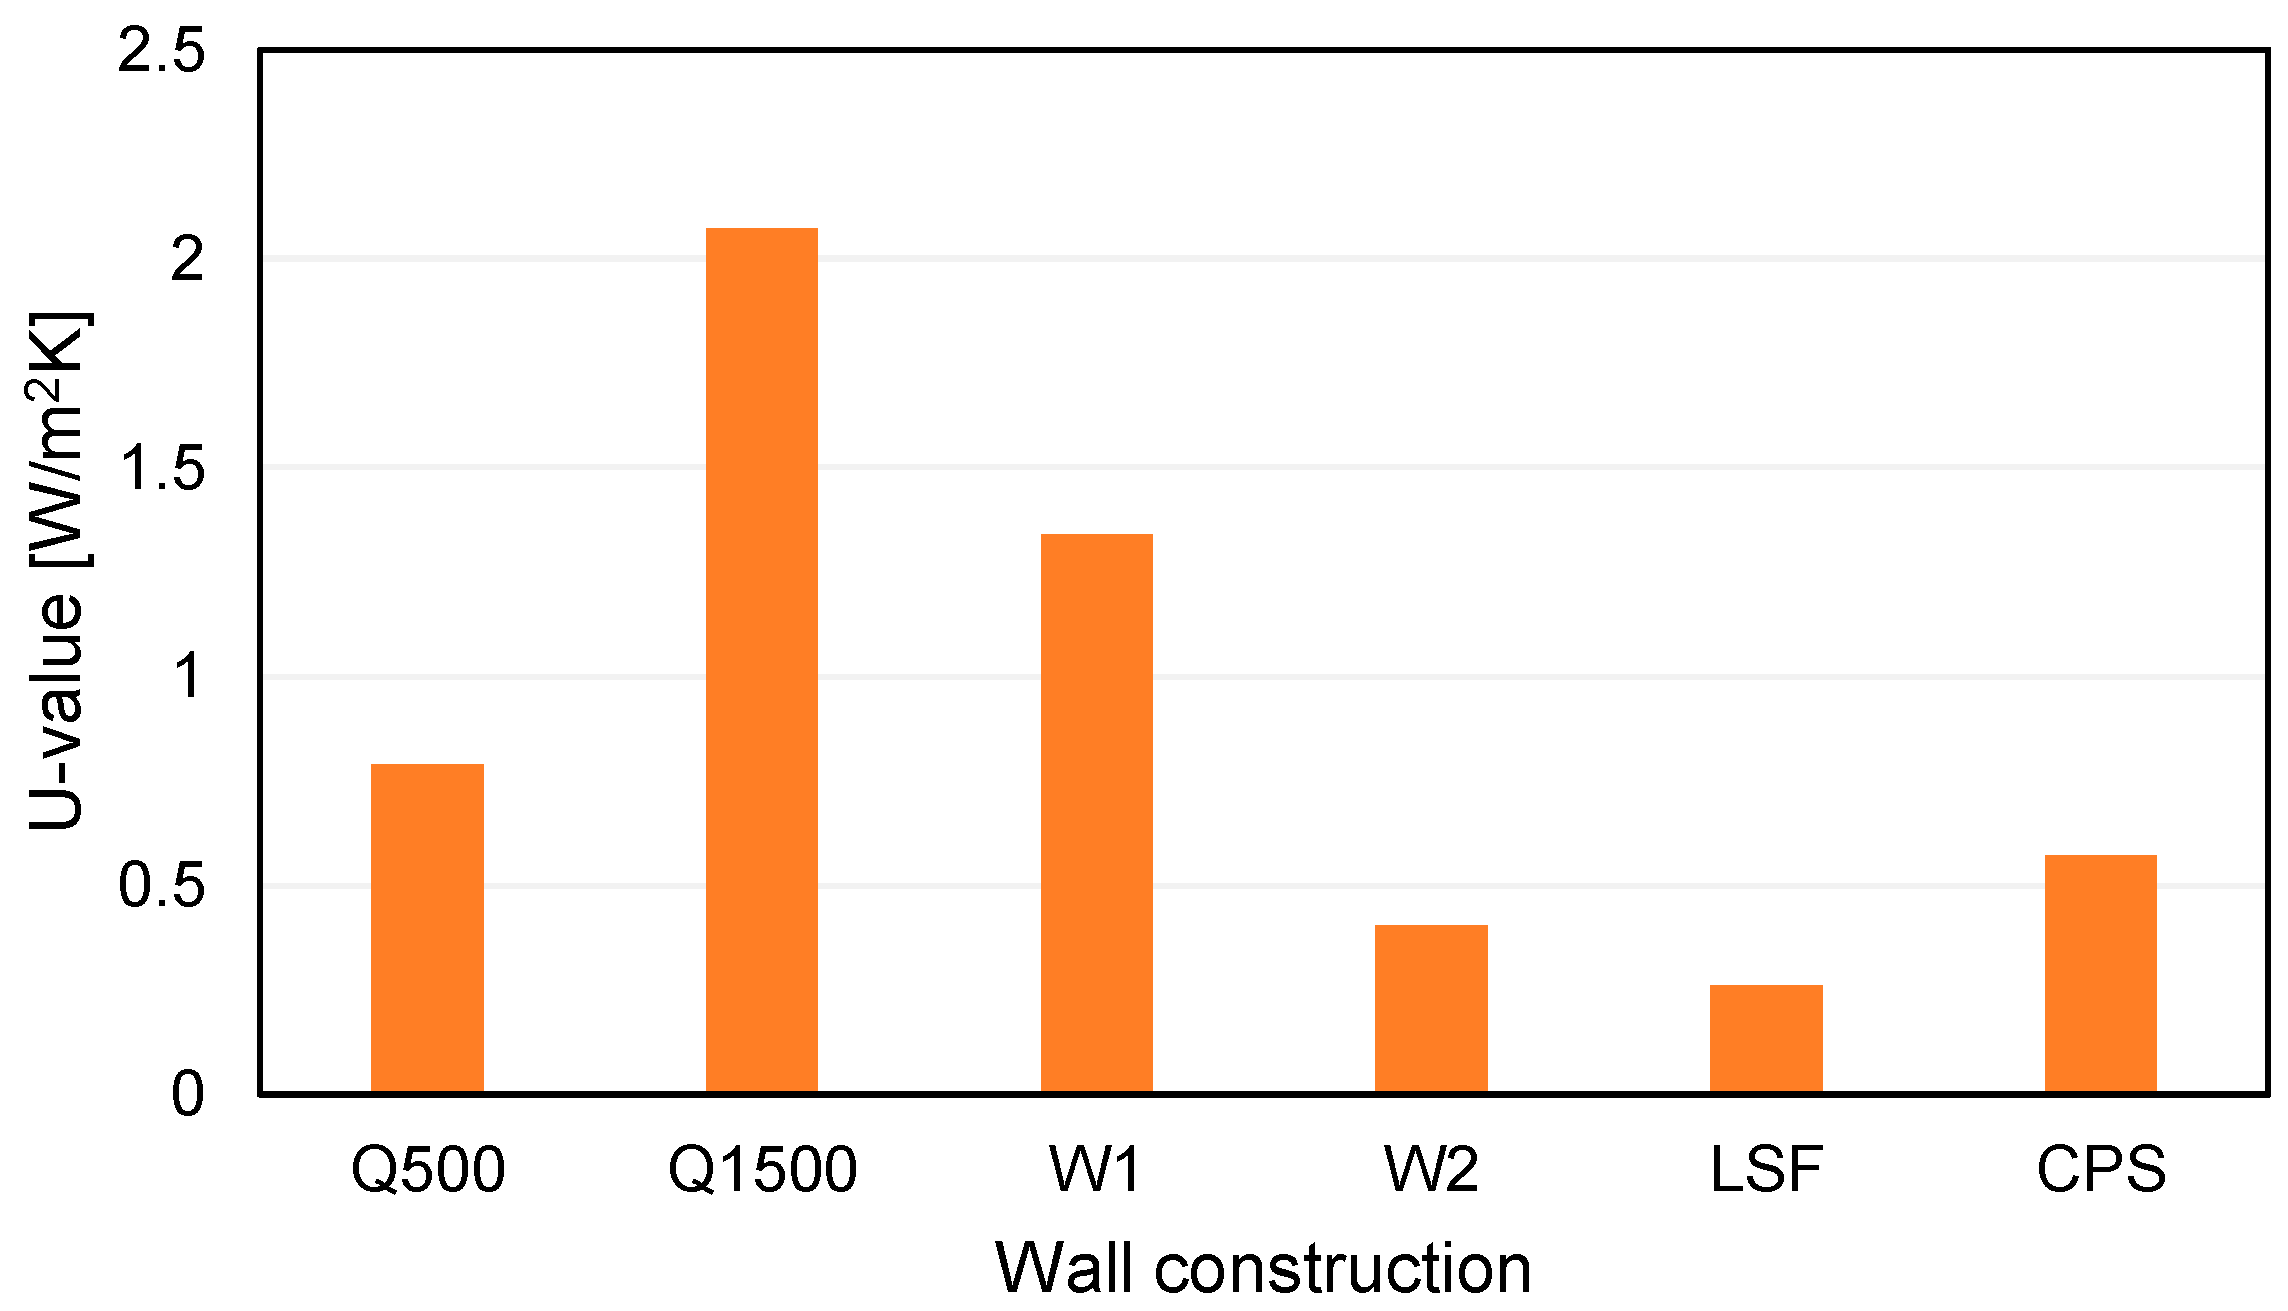
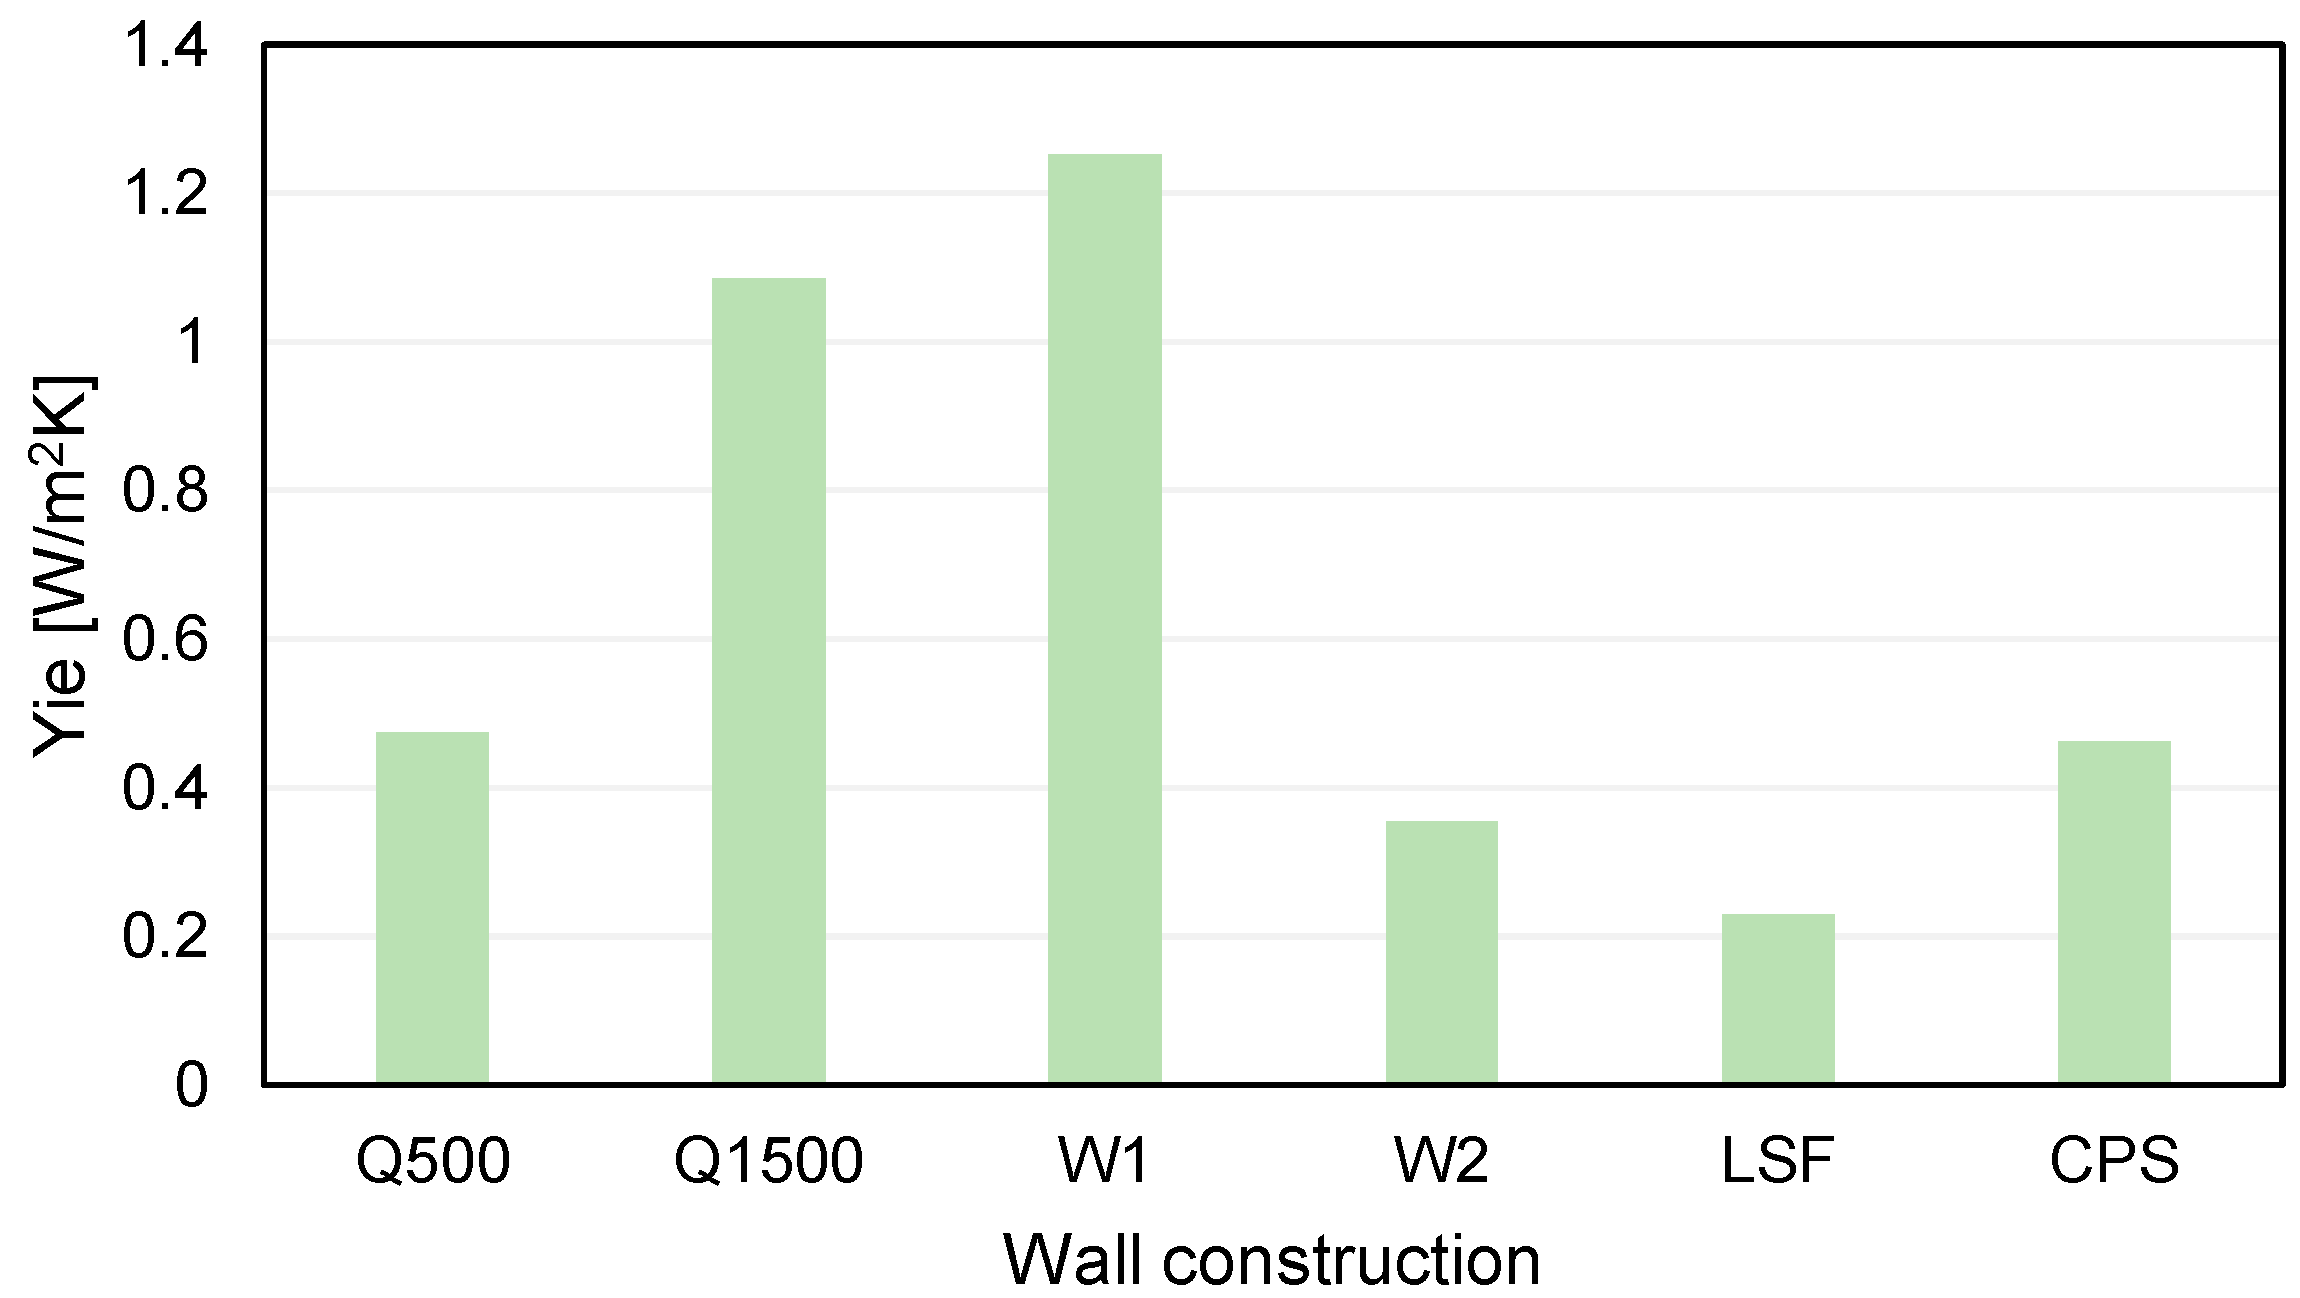
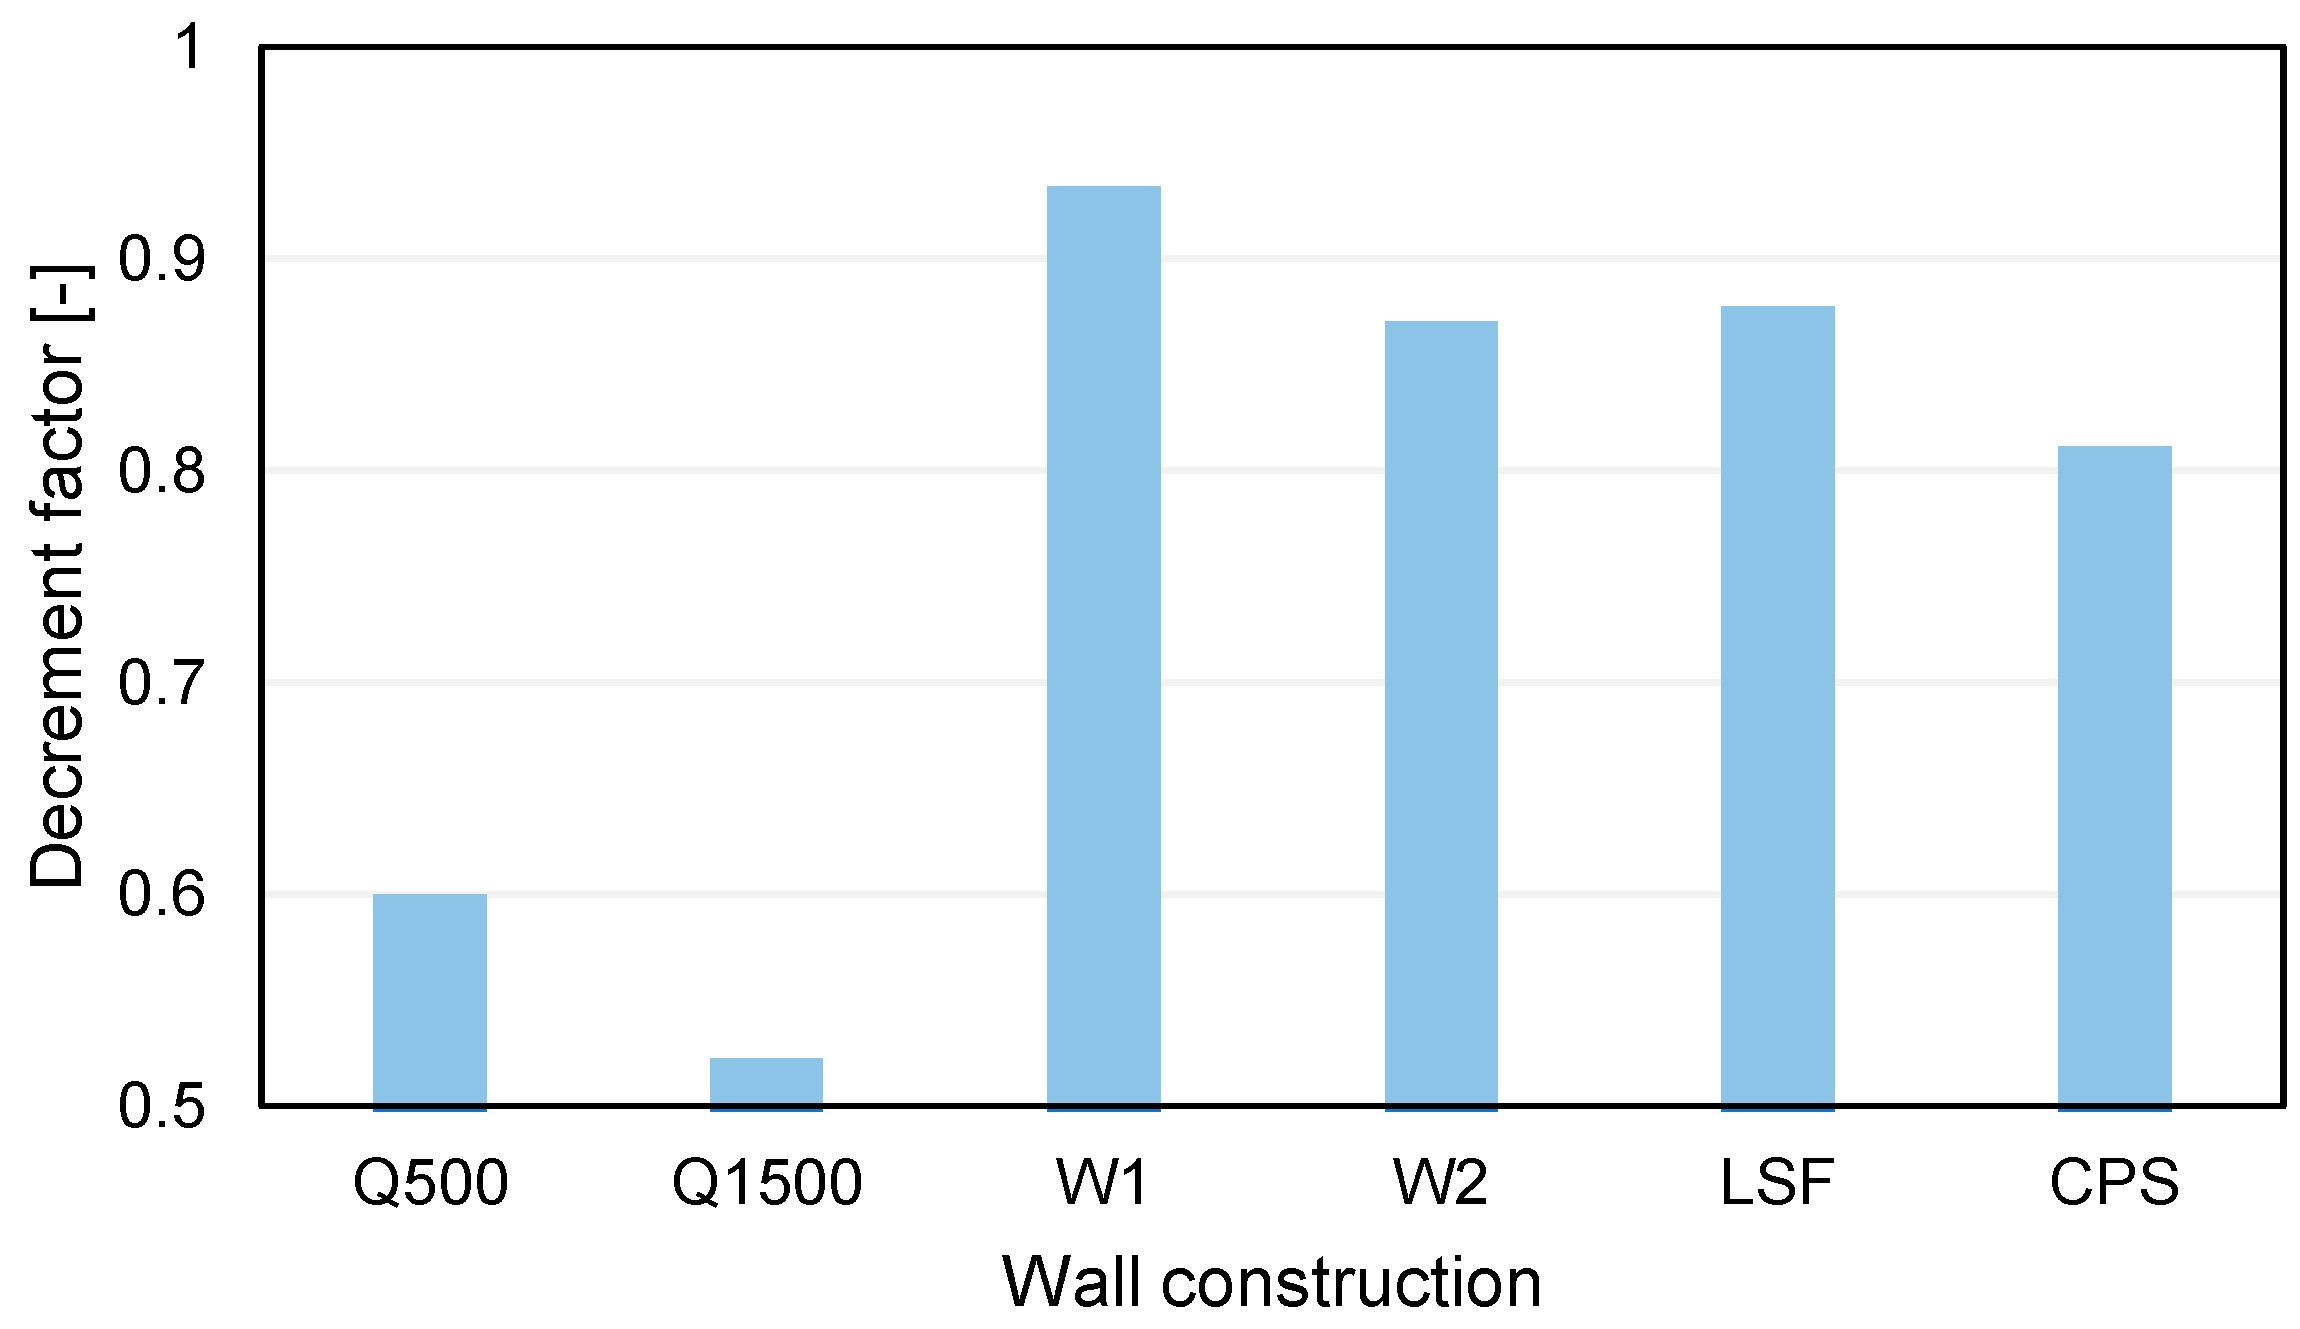
3.1.2. Walls
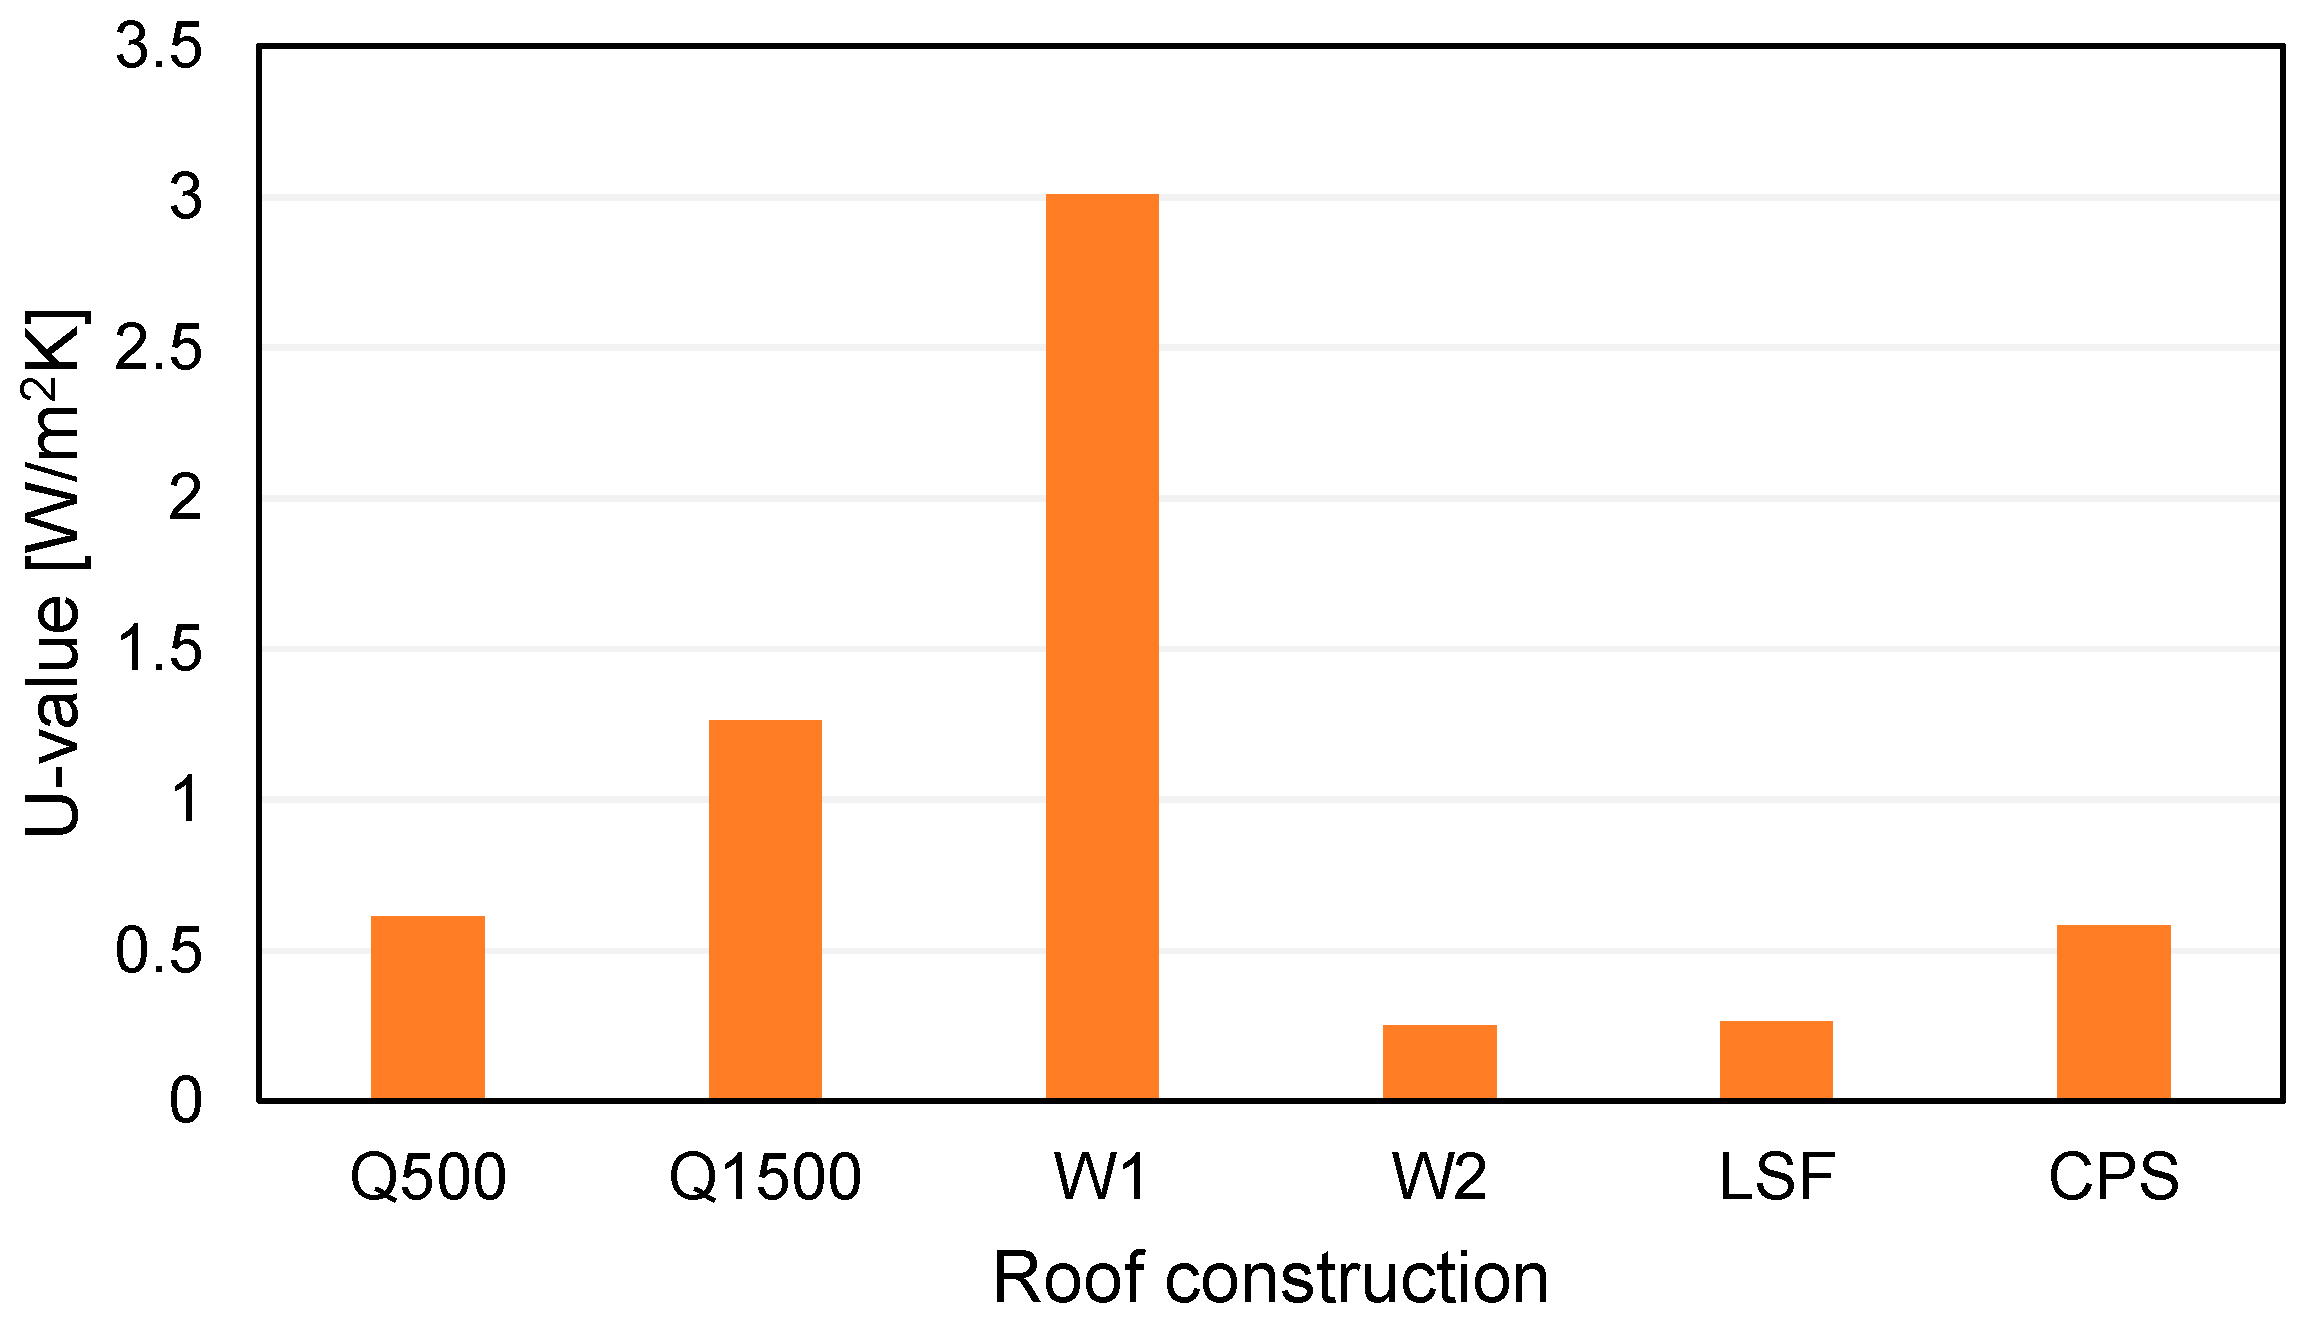
3.1.3. Roofs
3.2. Environmental Performance Levels
3.3. Carbon Footprint Results: Comparison with the Literature
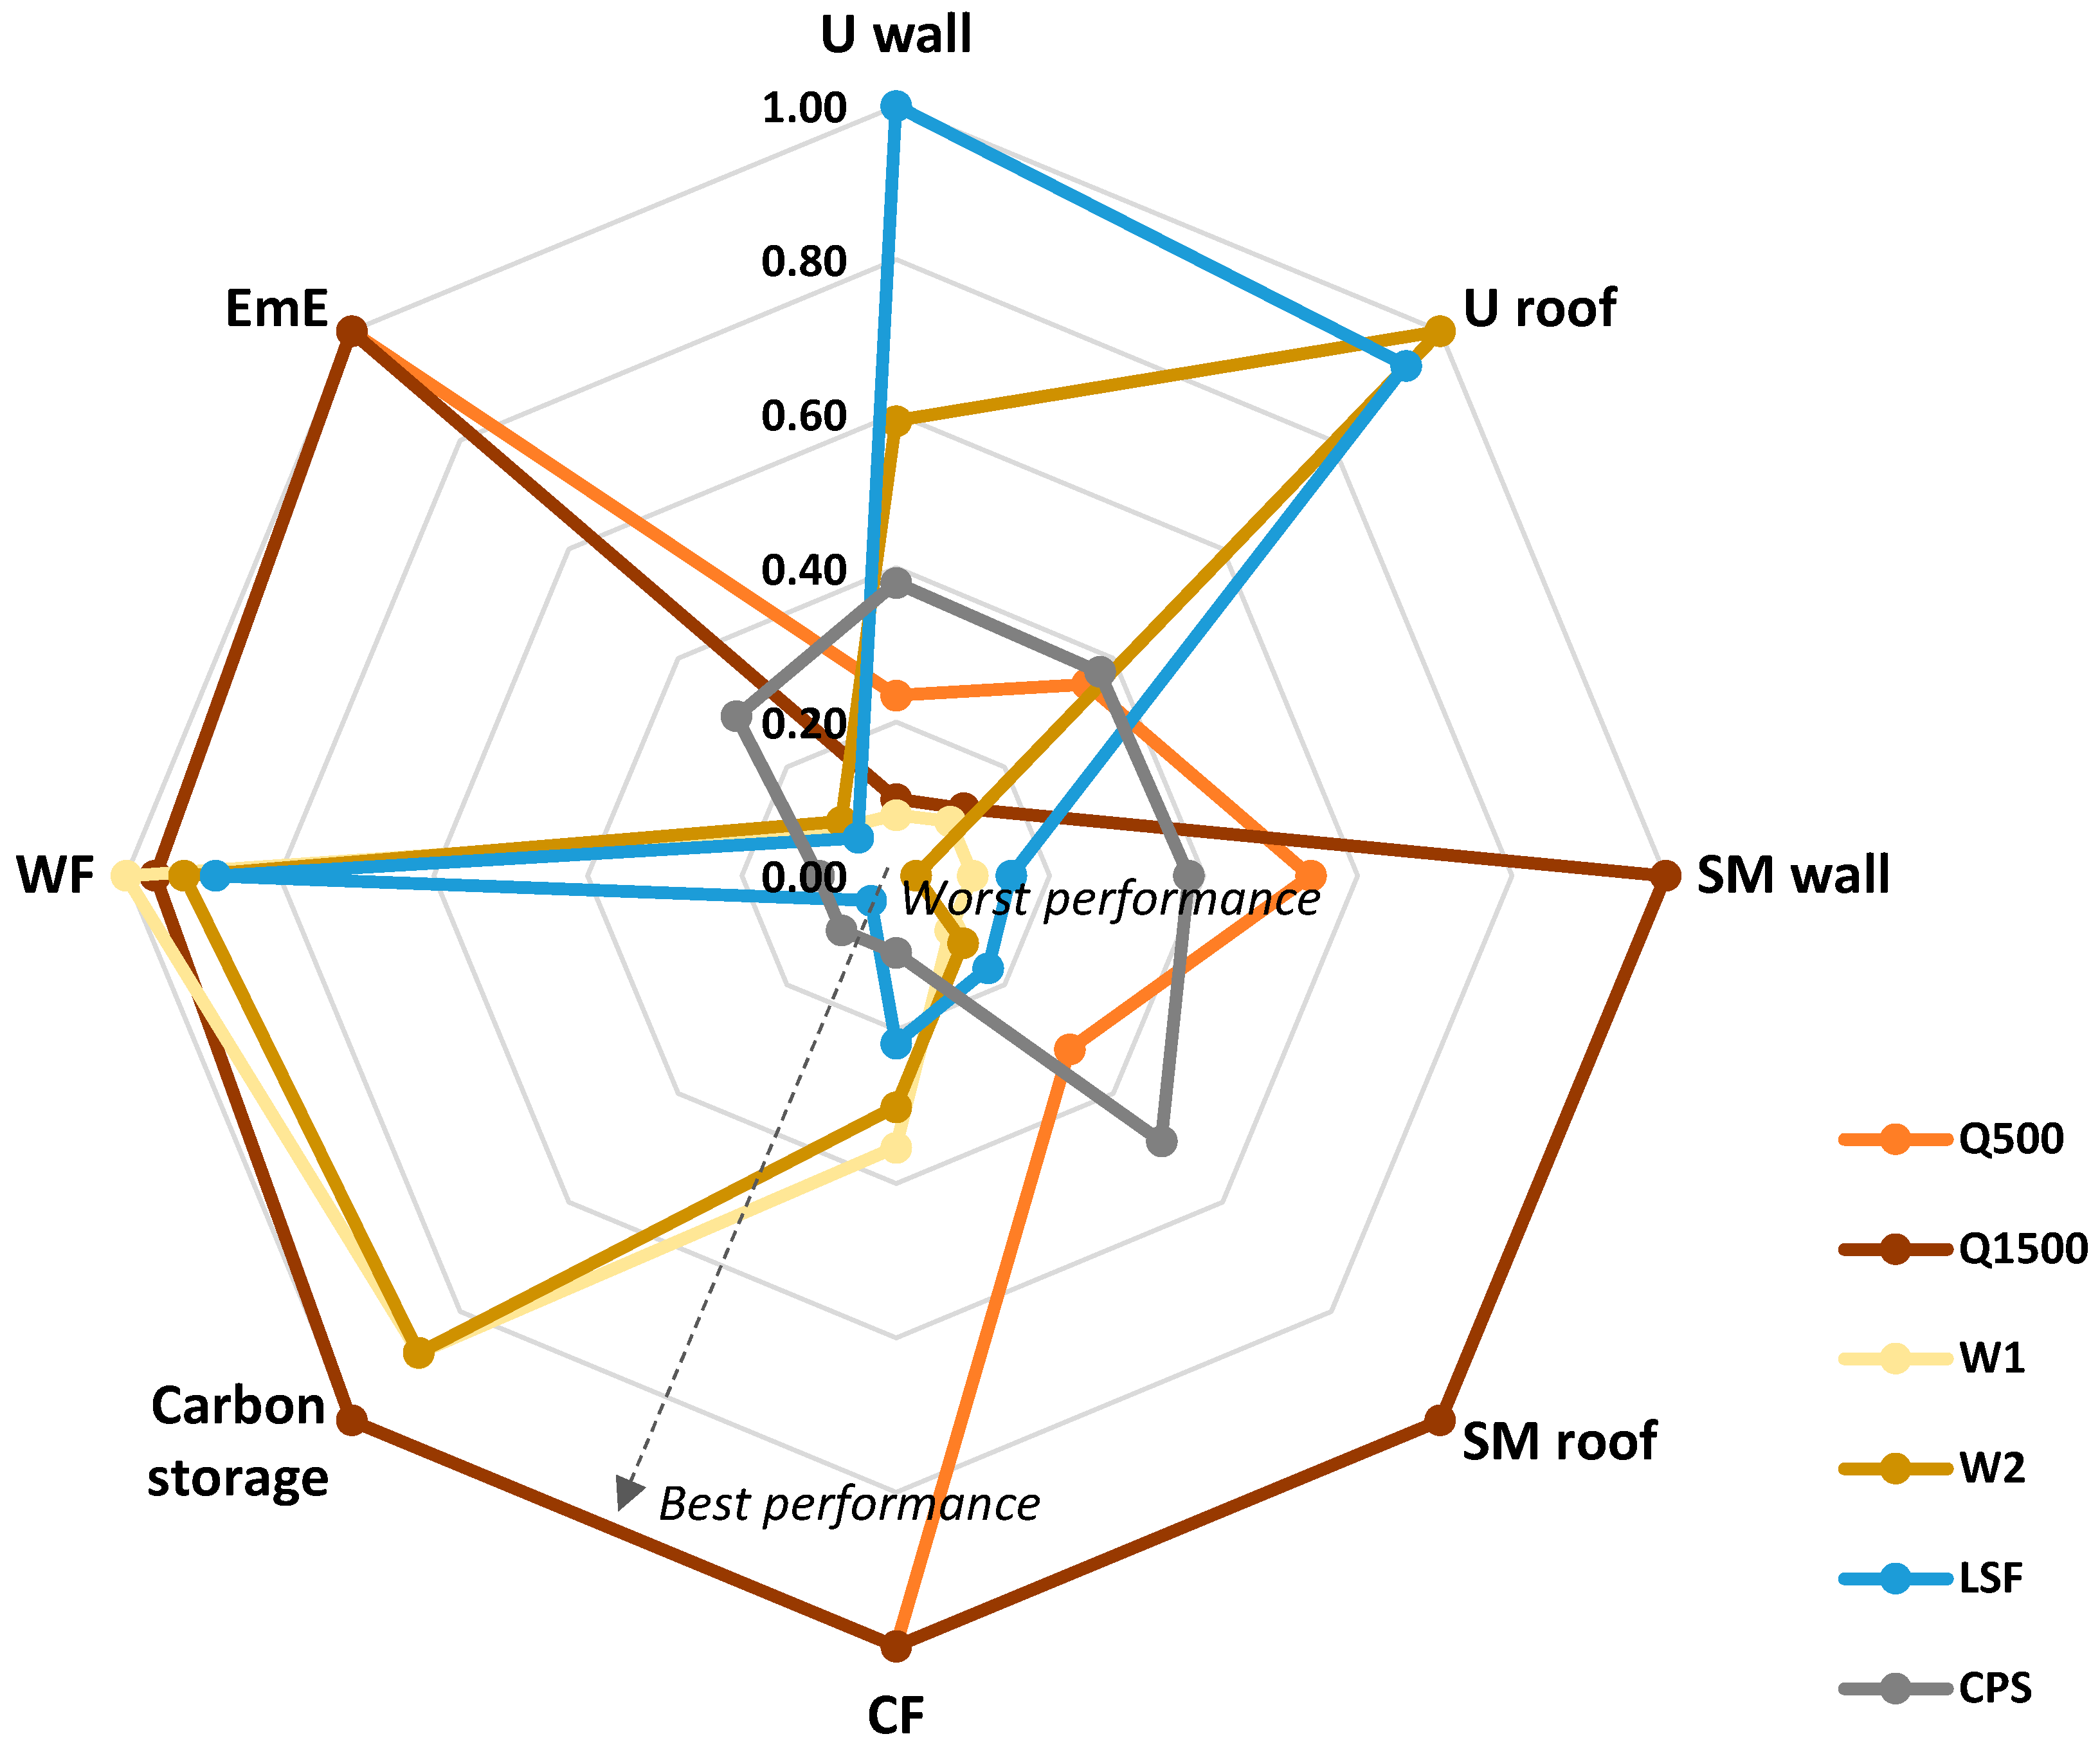
3.4. Comparison of Thermal and Environmental Performance Levels
4. Conclusions
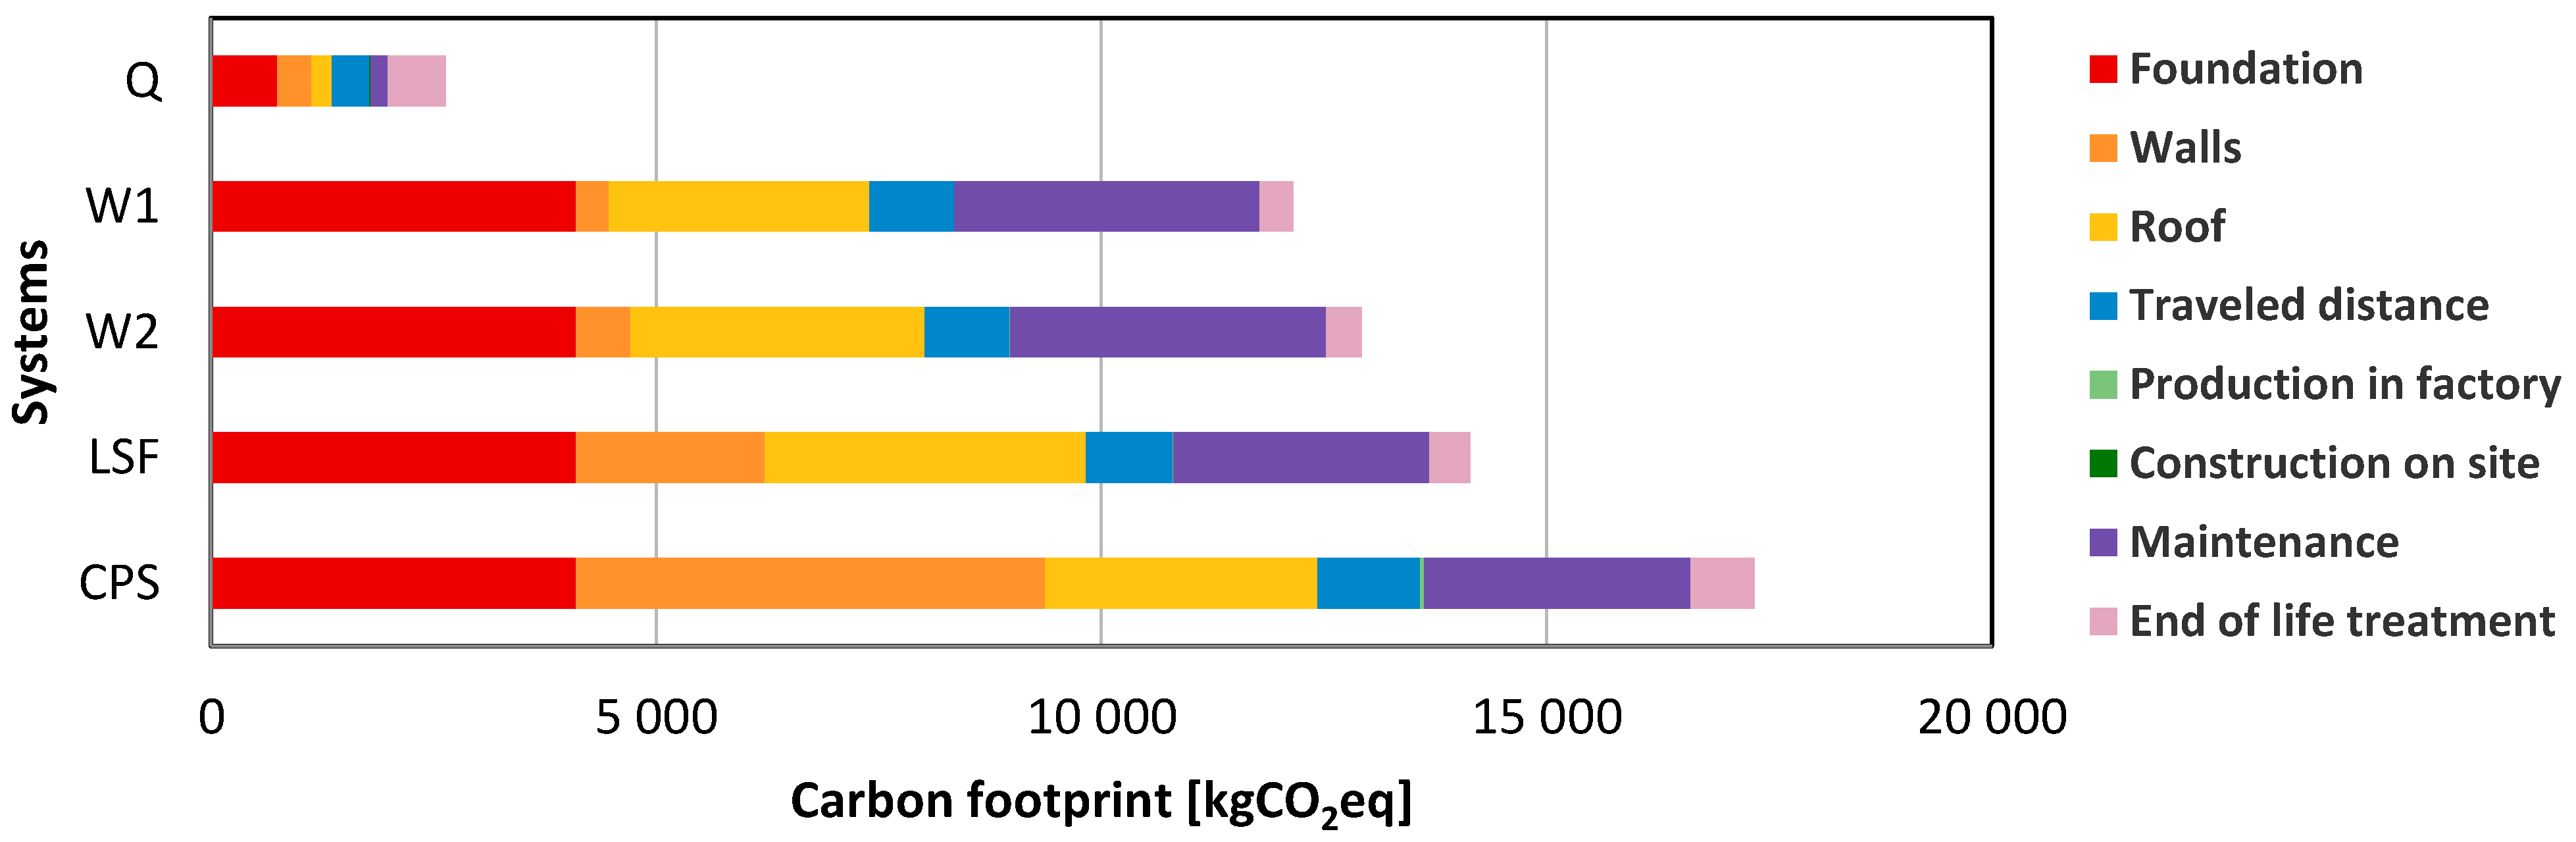
- The carbon footprint (CF) of the quincha system is the lowest in absolute terms at 2635.47 kgCO2eq. The second-lowest CF belongs to the wooden prefabricated system W1, at 12,152.61 kgCO2eq, while the highest is that of the Concrete Panel System with EPS insulation (CPS), at 17,338.58 kgCO2eq. The quincha system reduces the carbon footprint by up to 85% compared to the other systems using synthetic or industrial materials.
- The water footprint (WF) of the W1 system is the lowest in absolute terms at 2141.09 m3. The second-lowest WF belongs to the Q system (2303.07 m3), while the highest is that of the CPS system, at 6441.90 m3. Compared to systems using concrete and EPS panels (CPS), the quincha system reduces the water footprint by up to 64%.
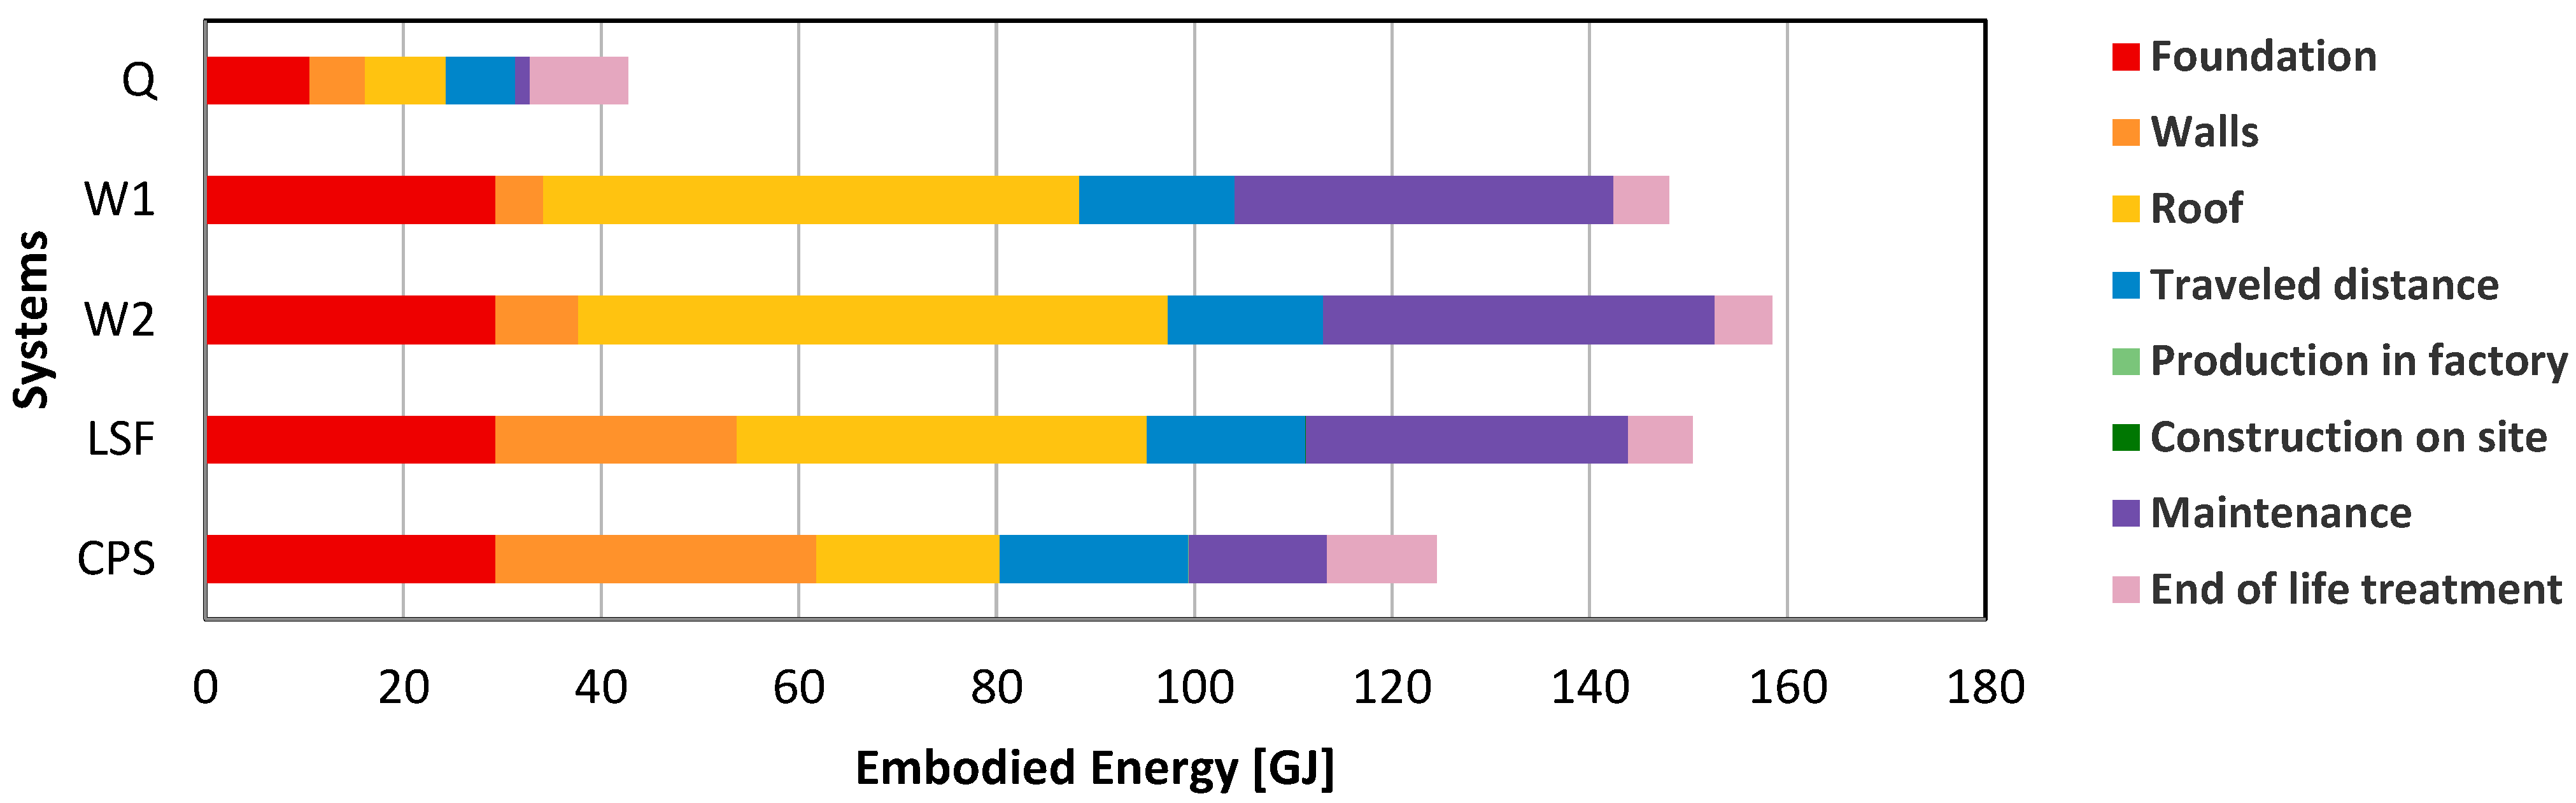
- The embodied energy (EE) of the quincha system is the lowest in absolute terms at 42.70 GJ. The second-lowest EE belongs to the CPS system, at 124.60 GJ, while the highest in absolute terms is that of the wooden prefabricated system with glass wool insulation (W2), at 158.40 GJ. The quincha system reduces the embodied energy by up to 73% compared to the other prefabricated systems.
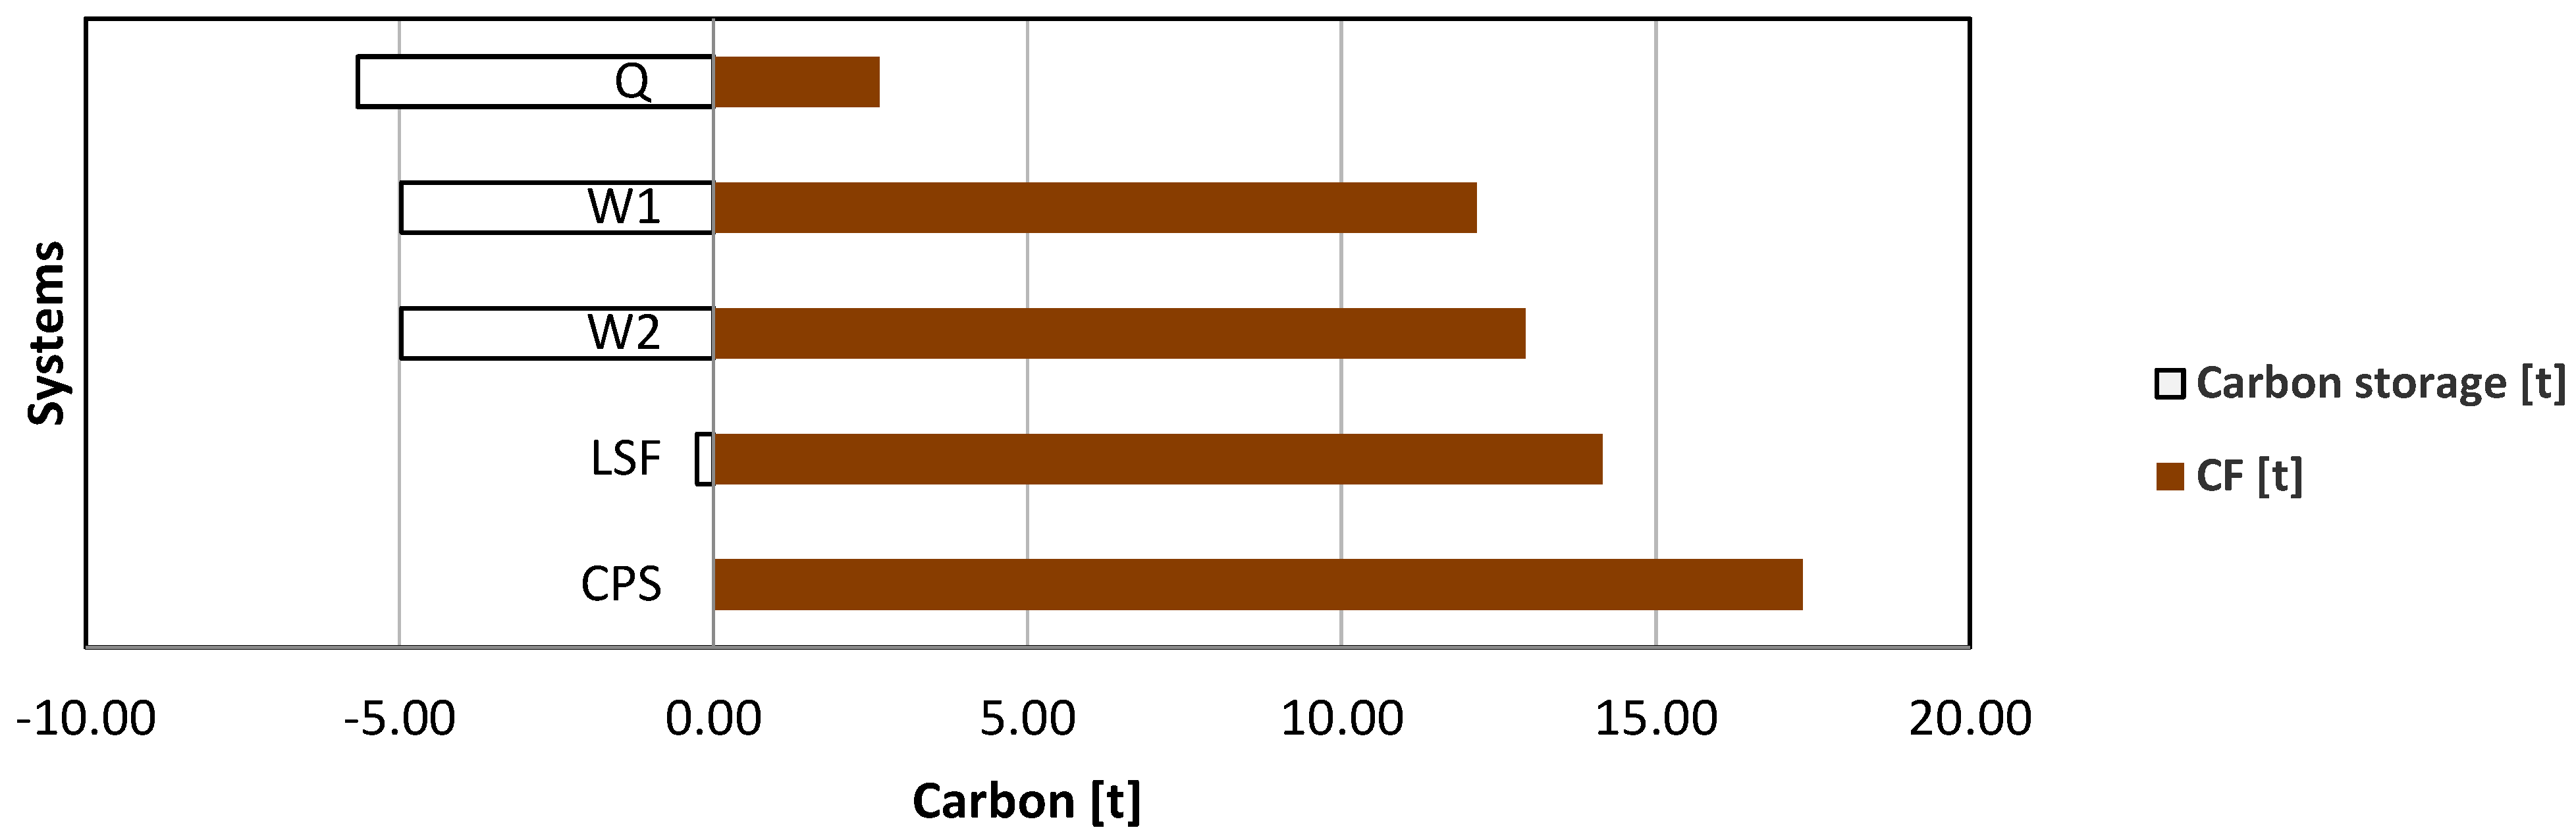
- Due to the high amount of wood and straw involved in its construction, the carbon storage of the quincha system is −5670.21 kgCO2eq, making it the only system that can compensate, theoretically, for its carbon footprint, thus reaching carbon neutrality. The wooden prefabricated systems W1 and W2 present carbon sequestration potential (at −4970.21 kgCO2eq and −4968.33 kgCO2eq, respectively), but not enough to compensate for their CFs.
- The systems that provide the best thermal insulation are the LSF (Uwall,roof = 0.26 W/m2K) and W2 (Uwall = 0.41 W/m2K Uroof = 0.25 W/m2K) systems, while both the quincha (Uwall = 0.79 W/m2K, Uroof = 0.61 W/m2K) and CPS (Uwall = 0.57 W/m2K, Uroof = 0.58 W/m2K) systems have higher U-values.
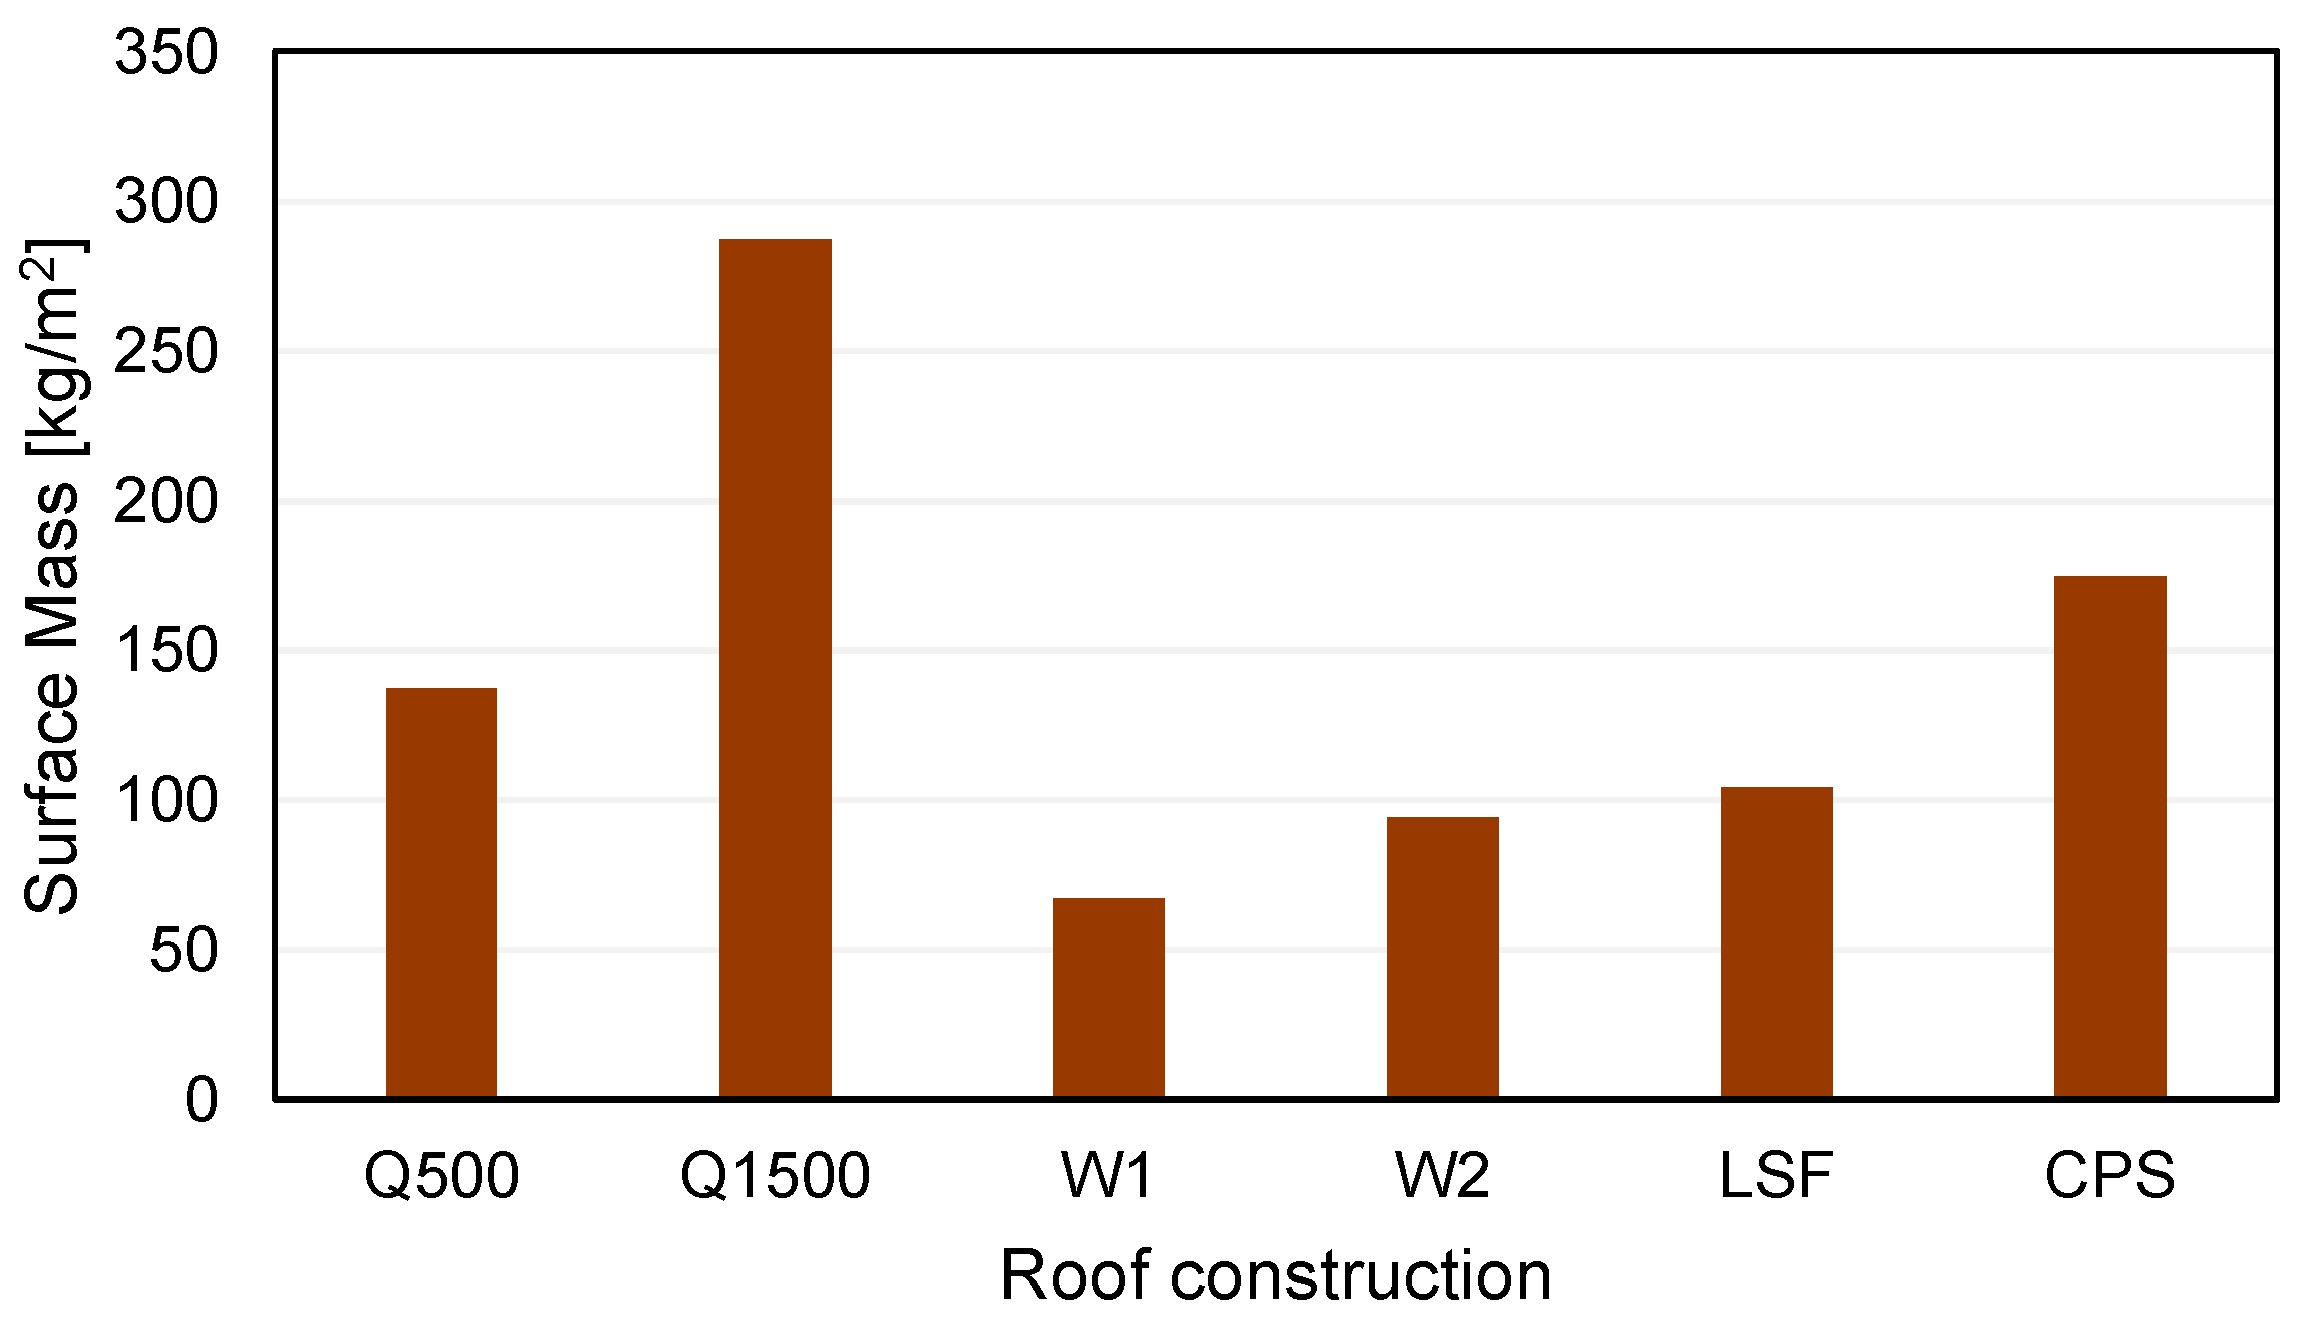
- The systems with higher surface mass are the quincha system Q500 (SMwall = 186.00 kg/m2, SMroof = 137.36 kg/m2) and the CPS system (SMwall = 137.93 kg/m2, SMroof = 174.53 kg/m2), while the lightweight prefabricated systems (W1, W2, and LSF) have lower SM values.
- The expected time lag and decrement factor of the quincha system Q500 walls (DF = 6.97 h and TL = 0.60, respectively) are better than the corresponding values for all the lightweight prefabricated systems (W1, W2, and LSF) and even for the medium-weight CPS system, which all have TL values below 4 h and DF values higher than 0.81.
- Prioritizing locally sourced and natural materials can significantly reduce the environmental impact of construction while supporting local economies.
- Incorporating traditional building techniques like quincha can enhance thermal performance and provide sustainable alternatives to modern construction practices.
- Implementing Life Cycle Assessment (LCA) during the design process facilitates the identification of strategies to reduce environmental impacts, hence promoting sustainability throughout the building’s life cycle.
Author Contributions
Funding
Data Availability Statement
Acknowledgments
Conflicts of Interest
References
- United Nations Environment Programme; Yale Center for Ecosystems + Architecture. Building Materials and the Climate: Constructing a New Future. Available online: https://wedocs.unep.org/20.500.11822/43293 (accessed on 6 December 2024).
- Meadows, D.H.; Meadows, D.L.; Randers, J.; Behrens, W.W. The Limits to Growth; Universe Books: New York, NY, USA, 1972. [Google Scholar]
- Park, S.; Cho, K.; Choi, M. A Sustainability Evaluation of Buildings: A Review on Sustainability Factors to Move towards a Greener City Environment. Buildings 2024, 14, 446. [Google Scholar] [CrossRef]
- Akbarnezhad, A.; Xiao, J. Estimation and minimization of embodied carbon of buildings: A review. Buildings 2017, 7, 5. [Google Scholar] [CrossRef]
- Chen, Z.; Chen, L.; Zhou, X.; Huang, L.; Sandanayake, M.; Yap, P.-S. Recent Technological Advancements in BIM and LCA Integration for Sustainable Construction: A Review. Sustainability 2024, 16, 1340. [Google Scholar] [CrossRef]
- Eichner, M.J.; Elsharawy, H.H. Life Cycle Assessment (LCA) Based Concept Design Method for Potential Zero Emission Residential Building. IOP Conf. Ser. Earth Environ. Sci. 2020, 410, 012031. [Google Scholar] [CrossRef]
- Faludi, J.; Lepech, M.D.; Loisos, G. Using life cycle assessment methods to guide architectural decision-making for sustainable prefabricated modular buildings. J. Green Build. 2012, 7, 151–170. [Google Scholar] [CrossRef]
- Arowoiya, V.A.; Onososen, A.O.; Moehler, R.C.; Fang, Y. Influence of Thermal Comfort on Energy Consumption for Building Occupants: The Current State of the Art. Buildings 2024, 14, 1310. [Google Scholar] [CrossRef]
- Giuffrida, G.; Detommaso, M.; Nocera, F.; Caponetto, R. Design optimisation strategies for solid rammed earth walls in Mediterranean climates. Energies 2021, 14, 325. [Google Scholar] [CrossRef]
- Minke, G. Building with Earth: Design and Technology of a Sustainable Architecture; Birkhäuser: Berlin, Germany, 2006. [Google Scholar]
- Guillaud, H.; Houben, H.; CRAterre; Dethier, J. Traité de Construction en Terre; Parenthèses Editions: Marseille, France, 2006. [Google Scholar]
- Marcom, A. Construire en Terre-Paille; Terre Vivante: Mens, France, 2011. [Google Scholar]
- Acevedo, R.; Carrillo, O.; Broughton, J. Construcción en Quincha Liviana: Sistemas Constructivos Sustentables de Reinterpretación Patrimonial; Publication resulting from research funded by the Depto de Estudios, División Técnica de Estudios y Fomento Habitacional (DITEC) del Ministerio de Vivienda y Urbanismo y Fondart Nacional; Ministerio de Vivienda y Urbanismo y Fondart Nacional: Santiago, Chile, 2017. [Google Scholar]
- Fiebig-Wittmaack, M.; Pérez, C.V.; Lazo, E.B. Aspectos climaticos del Valle del Elqui. In Los Sistemas Naturales de la Cuenca del Río Elqui (Región de Coquimbo, Chile): Vulnerabilidad y Cambio del Clima; Cepeda, P.J., Ed.; Ediciones Universidad de La Serena: La Serena, Chile, 2008; pp. 41–62. [Google Scholar]
- Crawford, R.H.; Stephan, A. Tiny House, Tiny Footprint? The Potential for Tiny Houses to Reduce Residential Greenhouse Gas Emissions. IOP Conf. Ser. Earth Environ. Sci. 2020, 588, 022073. [Google Scholar] [CrossRef]
- Chang, A. Evaluating Tiny Houses as a Solution to the Housing Affordability and Environmental Crises. Aleth. Arts Sci. Acad. J. 2023, 3, 11–15. [Google Scholar] [CrossRef]
- Ford, J.; Gomez-Lanier, L. Are Tiny Homes Here to Stay? A Review of Literature on the Tiny House Movement. Fam. Consum. Sci. Res. J. 2017, 45, 394–405. [Google Scholar] [CrossRef]
- Saxton, M.W. Environmental Impacts of Tiny Home Downsizers: A Call for Research; Research Monograph Series; Virginia Polytechnic Institute and State University: Blacksburg, VA, USA, 2019; Chapter 2; pp. 16–29. [Google Scholar]
- Hooper, N.; Moreno-Beals, M. Pathways for Lifecycle Building Practices: Material Reuse in Tiny Home Construction, Co-Learning Plan—2019 Michigan State University. Available online: https://reicenter.org/upload/documents/colearning/tiny-houses_web.pdf (accessed on 6 December 2024).
- Mukhopadhyay, J. Observations of Energy Consumption and IEQ in a ‘Tiny House’. Build. Res. Inf. 2020, 48, 613–631. [Google Scholar] [CrossRef]
- Sabobeh, L.; Al Hassani, R.; Alomar, L.; Atabay, S.; Mortula, M.M.; Ali, T.A.; Taher, A.M. Life cycle assessment of the tiny house initiative in the United Arab Emirates. Front. Sustain. Cities 2024, 6, 1488269. [Google Scholar] [CrossRef]
- Ruiz-Pastor, L.; Altavilla, S.; Nezzi, C.; Borgianni, Y.; Orzes, G. Life Cycle Assessment of a Mobile Tiny House Made with Sustainable Materials and Design Implications. In Advances on Mechanics, Design Engineering and Manufacturing IV, Proceedings of the International Joint Conference on Mechanics, Design Engineering & Advanced Manufacturing, JCM 2022, 1–3 June 2022, Ischia, Italy; Gerbino, S., Lanzotti, A., Martorelli, M., Mirálbes Buil, R., Rizzi, C., Roucoules, L., Eds.; Lecture Notes in Mechanical Engineering; Springer: Cham, Switzerland, 2023. [Google Scholar] [CrossRef]
- Kuittinen, M.; Ruuska, K.; Viriyaroj, B.; Zubillaga, L. Are ‘tiny homes’ good for the environment? Focus on materials, land-use, energy and carbon footprint. J. Archit. 2023, 28, 698–722. [Google Scholar] [CrossRef]
- Tavares, V.; Lacerda, N.; Freire, F. Embodied energy and greenhouse gas emissions analysis of a prefabricated modular house: The “Moby” case study. J. Clean. Prod. 2019, 212, 1044–1053. [Google Scholar] [CrossRef]
- Tavares, V.; Freire, F. Life cycle assessment of a prefabricated house for seven locations in different climates. J. Build. Eng. 2022, 53, 104504. [Google Scholar] [CrossRef]
- Ben-Alon, L.; Loftness, V.; Harries, K.A.; Cochran Hameen, E. Life Cycle Assessment (LCA) of Natural vs. Conventional Building Assemblies. Renew. Sustain. Energy Rev. 2021, 144, 110951. [Google Scholar] [CrossRef]
- Mateus, R.; Fernandes, J.E.P.; Teixeira, E.R. Environmental Life Cycle Analysis of Earthen Building Material. In Encyclopedia of Renewable and Sustainable Materials; Elsevier Inc.: Amsterdam, The Netherlands, 2019. [Google Scholar] [CrossRef]
- Arduin, D.; Caldas, L.R.; Paiva, R.d.L.M.; Rocha, F. Life Cycle Assessment (LCA) in Earth Construction: A Systematic Literature Review Considering Five Construction Techniques. Sustainability 2022, 14, 13228. [Google Scholar] [CrossRef]
- Melià, P.; Ruggieri, G.; Sabbadini, S.; Dotelli, G. Environmental impacts of natural and conventional building materials: A case study on earth plasters. J. Clean. Prod. 2014, 80, 179–186. [Google Scholar] [CrossRef]
- Cabeza, L.F.; Barreneche, C.; Miró, L.; Morera, J.M.; Bartolí, E.; Fernandez, A.I. Low carbon and low embodied energy materials in buildings: A review. Renew. Sustain. Energy Rev. 2013, 23, 536–542. [Google Scholar] [CrossRef]
- Narayanaswamy, A.H.; Walker, P.; Reddy, B.V.V.; Heath, A.; Maskell, D. Mechanical and thermal properties, and comparative life-cycle impacts of stabilised earth building products. Constr. Build. Mater. 2020, 243, 118096. [Google Scholar] [CrossRef]
- Prudente, L.T. Life-Cycle Assessment of the Environmental Impact of Earthen Buildings versus Conventional Buildings on Human Health. In Sustainability and Toxicity of Building Materials; Petrović, E.K., Gjerde, M., Chicca, F., Marriage, G., Eds.; Woodhead Publishing Series in Civil and Structural Engineering; Woodhead Publishing: Sawston, UK, 2024; pp. 289–306. [Google Scholar] [CrossRef]
- Caldas, R.L.; de Lima Moura Paiva, R.; Paiva de Souza Martins, A.; Dias Toledo Filho, R. Argamassas de terra versus convencionais: Avaliação do desempenho ambiental considerando o ciclo de vida. MIX Sustent. 2020, 6, 115–128. [Google Scholar] [CrossRef]
- Curth, A.; Pearl, N.; Castro-Salazar, A.; Mueller, C.; Sass, L. 3D printing earth: Local, circular material processing, fabrication methods, and Life Cycle Assessment. Constr. Build. Mater. 2024, 421, 135714. [Google Scholar] [CrossRef]
- Dipasquale, L.; Ammendola, J.; Montoni, L.; Ferrari, E.P.; Zambelli, M. Harnessing Vernacular Knowledge for Contemporary Sustainable Design through a Collaborative Digital Platform. Heritage 2024, 7, 5251–5267. [Google Scholar] [CrossRef]
- Ojeda, V.; Vega-Jorquera, P.; De La Barra, E.; Palma-Chilla, L.; Vidal, L.; Saavedra, J.; Pizarro, A. Characterization of Seismicity and Seismic Hazard in the Coquimbo Region, Chile: A Probabilistic Study. Pure Appl. Geophys. 2024, 181, 1427–1454. [Google Scholar] [CrossRef]
- The World Bank. La Construcción de Viviendas en Madera en Chile: Un Pilar para el Desarrollo Sostenible y la Agenda de Reactivación. 2020. Available online: https://documents1.worldbank.org/curated/en/224671607109191179/pdf/The-Construction-of-Timber-Houses-in-Chile-A-Pillar-of-Sustainable-Development-and-the-Agenda-for-Economic-Recovery.pdf (accessed on 6 December 2024).
- Ramírez, C.F.; Casares, M. Sistemas constructivos no tradicionales. Modelos para armar. BIT 2011, 79, 14–23. [Google Scholar]
- Convitec. Manual Tecnico. Available online: https://sjnavarro.wordpress.com/wp-content/uploads/2008/08/manual-tecnico-covintec-2011.pdf (accessed on 6 December 2024).
- ISO 10456:2007; Building Materials and Products—Hygrothermal Properties—Tabulated Design Values and Procedures for Determining Declared and Design Thermal Values. International Standard Organization: Geneva, Switzerland, 2023.
- Giuffrida, G.; Dipasquale, L.; Pulselli, R.M.; Caponetto, R. Compared Environmental Lifecycle Performances of Earth-Based Walls to Drive Building Envelope Design. Sustainability 2024, 16, 1367. [Google Scholar] [CrossRef]
- Giuffrida, G.; Caponetto, R.; Nocera, F. Hygrothermal Properties of Raw Earth Materials: A Literature Review. Sustainability 2019, 11, 5342. [Google Scholar] [CrossRef]
- Volhard, F. Light Earth Building: A Handbook for Building with Wood and Earth, 1st ed.; Birkhäuser: Basel, Switzerland, 2016. [Google Scholar]
- Wieser, M.F.; Onnis, S.; Meli, G. Conductividad Térmica de la Tierra Alivianada con Fibras Naturales en Paneles de Quincha. En Seminario Iberoamericano de Arquitectura y Construcción con Tierra. SIACOT 2018 Red Iberoamericana de Arquitectura y Construcción con Tierra. pp. 199–208. Available online: http://siacot.ingenieria.usac.edu.gt/index.php/memorias (accessed on 6 December 2024).
- ISO 13786:2018; Thermal Performance of Building Components—Dynamic Thermal Characteristics—Calculation Methods. International Standard Organization: Geneva, Switzerland, 2018.
- Taylor, T.J. The role of thermal mass in low-slope roof design. International Institute of Building Enclosre Consultants. IIBEC Interface 2022, 26–31. Available online: https://iibec.org/wp-content/uploads/2022-01-taylor.pdf (accessed on 6 December 2024).
- Ulgen, K. Experimental and theoretical investigation of effects of wall’s thermophysical properties on time lag and decrement factor. Energy Build. 2002, 34, 273–280. [Google Scholar] [CrossRef]
- ISO 14040:2006; Environmental Management. Life Cycle Assessment: Principles and Framework. International Standard Organization: Geneva, Switzerland, 2006.
- UNI EN ISO 14044:2020; Gestione Ambientale-Valutazione del Ciclo di Vita-Requisiti e Linee Guida. International Standard Organization: Geneva, Switzerland, 2020.


| Abbr. | Layer | ttot | t | λ | cp | ρ |
|---|---|---|---|---|---|---|
| [m] | [m] | [W/mK] | [J/kgK] | [kg/m3] | ||
| Foundations | ||||||
| W1, W2, LSF, CPS | Concrete footing | 0.400 | 0.400 | 1.60 | 1000 | 2300 |
| Q | Stone footing | 0.400 | 0.400 | 1.50 | 900 | 2750 |
| Walls | ||||||
| Q500 | Raw earth render | 0.200 | 0.030 | 0.62 | 800 | 1939 |
| Light earth | 0.140 | 0.14 | 1150 | 500 | ||
| Raw earth render | 0.030 | 0.62 | 800 | 1939 | ||
| Q1500 | Raw earth render | 0.200 | 0.030 | 0.62 | 800 | 1939 |
| Straw clay | 0.140 | 0.65 | 1000 | 1500 | ||
| Raw earth render | 0.030 | 0.62 | 800 | 1939 | ||
| W1 | Wood cladding | 0.125 | 0.025 | 0.12 | 2700 | 450 |
| Air gap | 0.075 | - | - | - | ||
| Wood cladding | 0.025 | 0.12 | 2700 | 450 | ||
| W2 | Wood cladding | 0.125 | 0.025 | 0.12 | 2700 | 450 |
| Glass wool | 0.075 | 0.04 | 850 | 105 | ||
| Wood cladding | 0.025 | 0.12 | 2700 | 450 | ||
| LSF | Cement plaster | 0.184 | 0.010 | 0.90 | 1000 | 1800 |
| Plasterboard | 0.012 | 0.25 | 1000 | 900 | ||
| Glass wool | 0.140 | 0.04 | 850 | 105 | ||
| OSB panel | 0.012 | 0.13 | 1600 | 530 | ||
| Cement plaster | 0.010 | 0.90 | 1000 | 1800 | ||
| CPS | Cement plaster | 0.125 | 0.010 | 0.90 | 1000 | 1800 |
| Cement mortar | 0.025 | 1.40 | 1000 | 2000 | ||
| EPS panel | 0.055 | 0.036 | 1480 | 35 | ||
| Cement mortar | 0.025 | 1.40 | 1000 | 2000 | ||
| Cement plaster | 0.010 | 0.90 | 1000 | 1800 | ||
| Roofs | ||||||
| Q500 | Wooden plank | 0.214 | 0.012 | 0.13 | 1600 | 500 |
| Light earth | 0.150 | 0.14 | 1150 | 500 | ||
| OSB panel | 0.012 | 0.13 | 1600 | 530 | ||
| Bituminous membrane | 0.040 | 0.17 | 1700 | 1250 | ||
| Q1500 | Wooden plank | 0.214 | 0.012 | 0.13 | 1600 | 500 |
| Straw–clay | 0.150 | 0.65 | 1000 | 1500 | ||
| OSB panel | 0.012 | 0.13 | 1600 | 530 | ||
| Bituminous membrane | 0.040 | 0.17 | 1700 | 1250 | ||
| W1 | Wooden plank | 0.032 | 0.025 | 0.13 | 1600 | 500 |
| Corrugated metal sheet | 0.007 | 50.00 | 450 | 7800 | ||
| W2 | Wooden plank | 0.197 | 0.025 | 0.13 | 1600 | 500 |
| Glass wool panel | 0.140 | 0.04 | 850 | 105 | ||
| Wooden plank | 0.025 | 0.13 | 1600 | 500 | ||
| Corrugated metal sheet | 0.007 | 50.00 | 450 | 7800 | ||
| LSF | Cement plaster | 0.181 | 0.010 | 0.90 | 1000 | 1800 |
| Plasterboard | 0.012 | 0.25 | 1000 | 900 | ||
| Glass wool panel | 0.140 | 0.04 | 850 | 105 | ||
| OSB panel | 0.012 | 0.13 | 1600 | 530 | ||
| Corrugated metal sheet | 0.007 | 50.00 | 450 | 7800 | ||
| CPS | Cement plaster | 0.122 | 0.010 | 0.90 | 1000 | 1800 |
| Cement mortar | 0.025 | 1.40 | 1000 | 2000 | ||
| EPS panel | 0.055 | 0.036 | 1480 | 35 | ||
| Cement mortar | 0.025 | 1.40 | 1000 | 2000 | ||
| Corrugated metal sheet | 0.007 | 50.00 | 450 | 7800 | ||
| Phase | Inputs | Unit | Q | W1 | W2 | LSF | CPS |
|---|---|---|---|---|---|---|---|
| mq | 28.00 | 28.00 | 28.00 | 28.00 | 28.00 | ||
| UPSTREAM: Raw materials | Foundation | ||||||
| Stone | kg | 49,600.00 | - | - | - | - | |
| Lime | kg | 4364.80 | - | - | - | - | |
| Cement mortar | kg | 1820.00 | - | - | - | - | |
| Sand | kg | 7140.00 | - | - | - | - | |
| Concrete | kg | - | 12.14 | 12.14 | 12.14 | 12.14 | |
| Walls | |||||||
| Wood | m3 | 3.50 | 4.02 | 4.02 | - | - | |
| Earth (soil) | kg | 2500.00 | - | - | - | - | |
| Straw | kg | 300.00 | - | - | - | - | |
| Linseed oil | kg | 16.50 | - | - | - | - | |
| Glass wool insulation | kg | - | - | 93.90 | 181.05 | - | |
| Lime | kg | 196.43 | - | - | - | - | |
| Plasterboard | kg | - | - | - | 512.11 | - | |
| Steel | kg | - | - | - | 645.00 | 105.55 | |
| OSB | m3 | - | - | - | 0.78 | - | |
| Cement plaster | kg | - | - | - | 1681.2 | 5736.64 | |
| EPS | kg | - | - | - | - | 86.68 | |
| Roof | |||||||
| Wood | m3 | 0.83 | 1.40 | 1.40 | - | - | |
| Earth (soil) | kg | 625.00 | - | - | - | - | |
| Straw | kg | 300.00 | - | - | - | - | |
| OSB | m3 | 0.50 | - | - | - | - | |
| Plasterboard | kg | - | - | - | 266.11 | - | |
| Plywood | kg | 0.36 | - | - | - | 87.50 | |
| Bituminous membrane | kg | 133.60 | - | - | - | - | |
| Glass wool insulation | kg | - | - | 141.00 | 94.10 | - | |
| Corrugated sheet metal | kg | - | 1800.00 | 1800.00 | 1764.00 | - | |
| Steel | kg | - | - | - | 176.40 | 56.26 | |
| Cement plaster | kg | - | - | - | 436.80 | 3276.00 | |
| Concrete | kg | - | - | - | - | 87.50 | |
| EPS | kg | - | - | - | - | 46.20 | |
| Transport | Traveled distance | ||||||
| From extraction to factory | t km | 113.45 | 1045.83 | 1052.55 | 1098.03 | 1192.04 | |
| From supplier to factory | t km | - | 1355.51 | 1355.51 | - | 1986.74 | |
| From extraction to building yard | t km | 18.63 | - | - | - | - | |
| From factory to building yard | t km | 1134.50 | 271.10 | 271.10 | 1252.21 | 397.00 | |
| From supplier to building yard | t km | 1367.17 | 3215.00 | 3228.10 | 3660.10 | 3973.48 | |
| Return of machineries | t km | 1.60 | 25.80 | 25.80 | 25.80 | 25.80 | |
| CORE: manufacturing | Production in factory | ||||||
| Cutting | m3 | 5.42 | 5.42 | 15.65 | - | - | |
| Screwing | m3 | 5.42 | 5.42 | 16.51 | - | - | |
| Loading | m3 | - | 5.66 | 13.49 | 17.69 | 12.30 | |
| Construction on-site | |||||||
| Wooden cutting | m3 | 4.32 | - | - | - | - | |
| Wooden screwing | m3 | 4.32 | - | - | 8.10 | - | |
| Earth mixing | m3 | 9.71 | - | - | 1.29 | - | |
| Maintenance | Maintenance (replaced covering materials) | ||||||
| Earth cladding | m3 | 0.80 | - | - | - | - | |
| Lime mortar | kg | 225.00 | - | - | - | - | |
| Cement mortar | kg | 728.00 | - | - | - | 3605.06 | |
| Bituminous membrane | kg | 1202.40 | - | - | - | - | |
| Corrugated sheet metal | kg | - | 1800.00 | 1800.00 | 1764.00 | - | |
| Wood paint | kg | - | 77.11 | 96.39 | - | - | |
| Cement plaster | kg | - | - | - | 12.85 | - | |
| End-of-Life | End-of-life treatment | ||||||
| Demolition and loading | m3 | 27.42 | 12.14 | 12.14 | 12.14 | 24.44 | |
| Disassembling and loading | m3 | 4.32 | 5.66 | 13.49 | 17.69 | - | |
| Transport to landfill | t km | 6.68 | 90.00 | 101.75 | 313.05 | 1986.74 | |
| Transport to incineration plant | t km | - | - | - | - | - | |
| Transport to composting plant | t km | 186.25 | 135.55 | 135.50 | - | - | |
| Transport to inert landfill (direct reuse) | t km | 3146.24 | 1334.96 | 1334.96 | 1517.00 | 1517.00 | |
| Transport to recycling | t km | 1037.60 | - | - | - | - | |
| Landfill | kg | 133.60 | 1800.00 | 2034.90 | 6261.04 | 9394.83 | |
| Incineration | kg | - | - | - | - | - | |
| Compost | kg | 3725.00 | 2711.03 | 2710.00 | - | - | |
| Inert landfill (direct reuse) | kg | 13,324.80 | 26,699.20 | 30,340.00 | 30,340.00 | 30,340.00 | |
| System | Environmental Impacts | |||
|---|---|---|---|---|
| CF | Carbon Storage | WF | EE | |
| kgCO2eq | kgCO2eq | m3 | GJ | |
| Q | 2635.47 | −5670.21 | 2303.07 | 42.70 |
| W1 | 12,152.61 | −4970.21 | 2141.09 | 148.01 |
| W2 | 12,927.00 | −4968.33 | 2466.00 | 158.40 |
| LSF | 14,142.00 | −258.87 | 2640.00 | 150.40 |
| CPS | 17,338.58 | - | 6441.90 | 124.60 |
| REF | Main Building Materials | m2 | Location | Stages | CF [kg CO2eq/m2] |
|---|---|---|---|---|---|
| This study | Q system (wood, earth, straw) | 28 | Chile | Upstream, Transport, Construction, Maintenance, End of Life | 94.12 |
| This study | W1 system (wood) | 28 | Chile | Upstream, Transport, Construction, Maintenance, End of Life | 434.02 |
| This study | W2 system (wood, stone wool) | 28 | Chile | Upstream, Transport, Construction, Maintenance, End of Life | 461.69 |
| This study | LSF system (steel, stone wool) | 28 | Chile | Upstream, Transport, Construction, Maintenance, End of Life | 505.07 |
| This study | CPS system (steel, EPS, concrete) | 28 | Chile | Upstream, Transport, Construction, Maintenance, End of Life | 619.24 |
| [15] | Wood, steel | 12.2 | Australia | Upstream, Transport, Construction, Maintenance, End of Life | 418.85 |
| [21] | Steel, concrete panels | 18 | United Arab Emirates | Upstream, Transport, Construction, Maintenance, End of Life | 2640.00 |
| [23] | Wood (CLT), metal sheet slate | 16 | Finland | Upstream, Transport, Construction, Maintenance, End of Life | 486.50 |
| [24] | Steel | 56 | Portugal | Upstream, Transport, Construction | 375.00 |
| [24] | Concrete | 56 | Portugal | Upstream, Transport, Construction | 482.14 |
| [24] | Timber | 56 | Portugal | Upstream, Transport, Construction | 303.57 |
| [24] | LSF | 56 | Portugal | Upstream, Transport, Construction | 312.50 |
| [25] | PVC, PU, PVC, rockwool, plasterboard | 56 | Portugal | Upstream, Transport, Construction | 625.00 |
Disclaimer/Publisher’s Note: The statements, opinions and data contained in all publications are solely those of the individual author(s) and contributor(s) and not of MDPI and/or the editor(s). MDPI and/or the editor(s) disclaim responsibility for any injury to people or property resulting from any ideas, methods, instructions or products referred to in the content. |
© 2025 by the authors. Licensee MDPI, Basel, Switzerland. This article is an open access article distributed under the terms and conditions of the Creative Commons Attribution (CC BY) license (https://creativecommons.org/licenses/by/4.0/).
Share and Cite
Dipasquale, L.; Giuffrida, G.; Jorquera Silva, N.; Pulselli, R.M.; Caponetto, R. Sustainable Design of a Tiny House: Using a Life Cycle Assessment Approach to Compare the Environmental Performance of Industrial and Earth-Based Building Systems. Buildings 2025, 15, 491. https://doi.org/10.3390/buildings15030491
Dipasquale L, Giuffrida G, Jorquera Silva N, Pulselli RM, Caponetto R. Sustainable Design of a Tiny House: Using a Life Cycle Assessment Approach to Compare the Environmental Performance of Industrial and Earth-Based Building Systems. Buildings. 2025; 15(3):491. https://doi.org/10.3390/buildings15030491
Chicago/Turabian StyleDipasquale, Letizia, Giada Giuffrida, Natalia Jorquera Silva, Riccardo Maria Pulselli, and Rosa Caponetto. 2025. "Sustainable Design of a Tiny House: Using a Life Cycle Assessment Approach to Compare the Environmental Performance of Industrial and Earth-Based Building Systems" Buildings 15, no. 3: 491. https://doi.org/10.3390/buildings15030491
APA StyleDipasquale, L., Giuffrida, G., Jorquera Silva, N., Pulselli, R. M., & Caponetto, R. (2025). Sustainable Design of a Tiny House: Using a Life Cycle Assessment Approach to Compare the Environmental Performance of Industrial and Earth-Based Building Systems. Buildings, 15(3), 491. https://doi.org/10.3390/buildings15030491