Article

Assessment of RC Columns Under Axial Compression for Un-Corroded and Corroded Stirrups Scenarios: A Practice-Oriented Numerical Approach

1
Department of Civil Engineering, South Eastern University of Sri Lanka, Oluvil 32360, Sri Lanka
2
School of Civil & Environmental Engineering, Queensland University of Technology, Brisbane, QLD 4000, Australia
*
Author to whom correspondence should be addressed.
Buildings 2025, 15(4), 579; https://doi.org/10.3390/buildings15040579
Submission received: 27 January 2025 / Revised: 7 February 2025 / Accepted: 11 February 2025 / Published: 13 February 2025
(This article belongs to the Special Issue Research on Corrosion Resistance of Reinforced Concrete)

Abstract

:
This paper presents a practice-oriented numerical modelling procedure to assess the loadbearing capacity of reinforced concrete (RC) columns under axial compression loading. A simplified procedure was incorporated to analyse the performance of RC columns with corroded stirrups, a prevalent deterioration phenomenon in corroded RC columns. The modelling framework incorporates material and geometric nonlinearities caused by material and buckling failure under axial compression, utilising the Arc-length algorithm with integrated geometric imperfections. Stirrup corrosion scenarios were incorporated by removing stirrups and modifying core concrete confinement properties, providing a practice-oriented approach to assess the loadbearing capacity of corroded columns. The study focused on square RC columns that are commonly used in low-rise buildings with nominal reinforcement detailing. The modelling method was validated against experimental data, and it showed a good agreement. A comprehensive parametric analysis was then conducted to examine the effects of critical design parameters, including (1) slenderness, (2) eccentricity, (3) stirrup corrosion, and (4) material properties, on axial compression performance. Parametric analyses demonstrated that the developed modelling technique appropriately predicted the axial compression behaviour of un-corroded RC columns in alignment with analytical design rules. For stirrup-corroded RC columns, the absence of confinement for up to 300 mm length near the base, due to stirrup corrosion, led to premature buckling. Based on the analysed cases, the reduction in bearing capacity of the stirrup-corroded RC columns could range between 4.9 and 18.6% (higher for slender columns) as compared to corresponding un-corroded RC columns.

1. Introduction

The braced reinforced concrete (RC) columns are conventionally designed to resist only gravity actions in low- to medium-rise buildings; as a result, they are invariably subjected to axial and bending effects. Since columns are the primary elements that transfer gravity actions to the foundations, their failure may lead to partial/complete failure of the structure. Due to their importance in transferring loading in buildings, most of the studies in the past on RC columns were focused on extreme loading scenarios, such as seismic, impact (e.g., vehicles), and blast loadings [1,2,3]. Nonetheless, reinforcement corrosion is one of the prominent factors that contributes to the deterioration of RC elements. The corrosions in RC elements are initiated either by carbonation or ingress of chloride [4,5]. Consequently, corrosion in reinforcement causes the spalling of cover concrete, decreased cross-sectional area and strength of reinforcement, and a reduction in bond stress between reinforcement and surrounding concrete, thereby leading to the reduced overall loadbearing capacity of RC elements [6]. Particularly, in RC columns, the spalling of cover concrete and the corrosion of stirrups, as shown in Figure 1, are commonly observed in aged buildings. The corrosion of stirrups in the RC columns reduce the confinement of core concrete and the lateral restraint of the vertical reinforcement bars, which may lead to the premature buckling of vertical reinforcement bars, leading to failure. It is vital to understand the behaviour of corroded RC columns, to assess their residual loadbearing capacities for any mitigation measures to restore their intended capacity.
Numerous researchers have evaluated the behaviour of corroded RC columns subjected to various loading conditions [7,8,9]. For instance, Vu and Li [7] experimentally analysed the seismic performance of corroded and un-corroded RC columns, demonstrating that corrosion significantly reduces shear strength and deformation capacity. Firouzi et al. [8] developed a time-dependent reliability model, revealing increased failure probabilities due to corrosion but lacking experimental validation. Li et al. [9] investigated the effects of non-uniform corrosion on seismic performance and proposed a new failure criterion. Nevertheless, a considerable number of these studies primarily focused on examining the response of short RC columns subjected to axial compression in the presence of induced corrosion [10,11,12,13,14]. Wu et al. [10] investigated the combined effects of sustained load and corrosion on the mechanical properties of RC columns using 250 mm × 250 mm × 600 mm axial compression members. Chotickai et al. [11] explored the effectiveness of carbon fibre-reinforced polymer (CFRP) in strengthening corroded RC columns under eccentric loading, with the specimens subjected to accelerated corrosion through submersion in a 5% NaCl solution. However, these studies are limited to material scale testing of corroded RC elements. Li et al. [15] tested 10 750 mm high RC columns and attempted to simulate the effect of reinforcement corrosion phenomena on the loadbearing capacities under axial compression. It was concluded that as the level of corrosion increased, both the stiffness and ultimate compressive strengths of the columns was reduced by about 42% compared to corresponding un-corroded RC columns. Zhang et al. [16] analysed the stirrup corrosion scenarios of short RC columns and their impact on losses of confinement. They proposed a modified Mander’s model [17] to predict the bearing capacity and stress–strain correlation of concrete constrained by corroded stirrups. Although few studies have looked into comprehending the moment capacities of full-scale corroded columns, by applying in-plane cyclic loads to simulate the seismic loading [18,19,20,21], the loadbearing capacities of full-scale columns under axial compression with different corrosion scenarios are not well explored. Full-scale columns may experience second-order buckling failure, rather than crushing caused by material failure under axial compression [22].
Experimental studies on full-scale RC columns are challenging due to logistical and laboratory constraints. In addition, investigating specific corrosion scenarios (in stirrups or main reinforcement bars) for RC elements is difficult to implement through laboratory experiments. Therefore, alternate approaches such as analytical or numerical methods can be considered to assess the loadbearing behaviour of full-scale corroded RC columns. With the advancement of numerical methods, limited efforts have been made in the past to explore the behaviour of corroded RC elements [23,24,25]. Rao et al. [23] developed a simplified nonlinear analytical model to assess the deterioration of RC bridge piers due to chloride-induced reinforcement corrosion. In another study, Mohammed et al. [25] introduced a nonlinear finite element analysis framework for assessing the residual capacity of corroded RC beam-columns, incorporating material degradation and bond damage effects. Although the model demonstrated high numerical stability and convergence, its application was primarily limited to slab-on-girder bridge columns. However, most of these studies were focused on the behaviour of corroded RC beams [26,27,28] using finite element (FE) methods. For instance, Alabduljabbar et al. [26] introduced a novel approach that combines neural network (NN) modelling with FE analysis to predict the flexural behaviour of corrosion-damaged concrete beams. BaniAsad and Dehestani [28] developed a simplified FE modelling methodology to incorporate corrosion-induced bond-slip effects into the analysis of RC beams. For RC columns, the main interest was numerically assessing the lateral loading response in situations such as under seismic (or cyclic) and impact conditions [24,29,30]. Vu et al. [24] proposed a three-dimensional nonlinear finite element (FE) model to predict the strength and drift capacity of corroded RC columns under seismic loading. While the study provided insights into lateral load resistance and deformation capacity, it did not focus on the axial loadbearing capacity of corroded columns, which is a critical parameter in structural performance assessment. It can be said that there is a need for a proper numerical modelling method to predict the axial behaviour of full-scale RC columns, particularly for the corroded RC columns. This highlights the necessity of a systematic approach to gain a comprehensive understanding of the axial compression behaviour of RC columns. As mentioned earlier, the RC columns under axial compression are susceptible to material crushing or buckling failure, where the failure depends on the slenderness of the member. The load eccentricity and boundary conditions (support restraint at top and bottom) also influence the axial compression. In addition, the material properties (strengths of concrete and reinforcement in RC columns) also affect the overall compressive strength and deformability. A numerical modelling approach must be developed to evaluate the axial compression behaviour of RC columns to capture the above-mentioned phenomena, so that the realistic performance can be evaluated.
In this study, the FE modelling concept developed by Asad et al. [31] for analysing the axial compression characteristics of reinforced masonry wall segment was extended to evaluate RC columns subjected to axial compression behaviour. A practice-oriented simplified approach was used to evaluate the loadbearing capacities of RC columns in this study. The concept of stirrup corrosion scenarios in RC columns was simulated by removing the lateral constraints provided to the vertical reinforcement bars and modifying the confined concrete strength properties assigned to the core concrete. This can be considered as a practice-oriented approach to assess the loadbearing capacities of corroded columns, as incorporating the actual corrosion profiles of bars and spalled concrete cover portions is difficult to measure and model. The details of the FE modelling procedure and the validation of the modelling method with the experimental results are given in Section 2 and Section 3, respectively. The validated modelling approach was extended to systematically evaluate the factors (eccentricity, slenderness, and material properties) that impact the axial compression behaviour of both un-corroded and corroded columns, and the results are given in Section 4.

2. Finite Element Modelling Method

A 3D-FE modelling technique for RC columns was developed to analyse the RC columns under axial compression using the ABAQUS FE 2019 version [32]. The details of the modelling procedures are given in following sub-sections.

2.1. Modelling Procedure

The material failure of the RC column under axial compression was incorporated using nonlinear constitutive models of the materials (concrete and steel). The constitutive behaviour of concrete was assigned using the Concrete Damage Plasticity (CDP) model available in ABAQUS [32]. The CDP model is widely used to simulate the damage behaviour of concrete under compression and tension stress states. The degradation of the stiffnesses under these under compression and tension stress states is defined by two damage variables, dc and dt, which are considered to be functions of the respective inelastic strains in concrete [33,34,35]. The material characteristics of steel bar were represented using an elasto-plastic stress–strain model. To account for the buckling failure, both the eigenvalue buckling algorithm, which is employed for linear elastic buckling analyses, and the arc-length method utilised for nonlinear elastic-plastic buckling analyses were used to capture the buckling failure of the elements. To simulate the axial compression behaviour of RC columns incorporating material and buckling failure phenomena, the Modified Riks method in ABAQUS [32] was used. The axial load–displacement relationship under buckling is characterised by a critical point (bifurcation point). The general definition of the critical point can be defined as per Equation (1).
K N M V M = K 0 N M + λ i K Δ M N V i M = 0 ,
where the tangential stiffness matrix and trivial displacement solution of buckling modes are denoted by KNM and VM, respectively. The eigenvalue of an ith mode (λi) represents a linear perturbation of the base state. Then, the critical buckling load (Pcr) for total axial load (Q) can be found from Equation (2).
P c r = λ i Q ,
The critical elastic buckling load and the respective modes of buckling can be determined from the eigenvalue buckling algorithm. The geometric imperfection was introduced, by using a linear eigenvalue perturbation buckling analysis through linear superposition of the buckling Eigenmodes in the models. The initial imperfection values were required to incorporate buckling phenomena into the model. The modelling of the buckling behaviour was executed in three stages. First, the eigenvalue buckling modes were determined using the elastic model. Then, parameters for scaling the initial irregularities were determined through a systematic parametric study. Once the scaling parameters were determined, a combination of scaled modes of buckling was used as the initial geometric imperfection to run the Modified Riks model in ABAQUS [32]. The buckling analysis procedure was firstly implemented with a steel reinforcement bar only. A 16 mm diameter steel reinforcement bar with yield stress of 550 MPa and length of 2000 mm was considered to demonstrate the modelling as shown in Figure 2a. Bar geometry was meshed using 3D solid elements with eight integration points (C3D8R) available in ABAQUS [32]. Poisson’s ratio and Young’s modulus of steel bars were set to 0.3 and 200 GPa, respectively. The bar was supported as pinned at the bottom, with rotation allowed at both ends. The critical buckling load computed for the modelled bar using Equation (2) was compared with Euler’s buckling load obtained from Equation (3) to quantitatively verify the accuracy of the buckling prediction from the eigenvalue buckling algorithm. Table 1 gives the predicted buckling loads against the analytical buckling loads. The buckling modes obtained are shown in Figure 2b. The errors of the numerically predicted values were less than 1%, proving the accuracy of buckling analyses conducted on the single bar. The modelling concept was then extended to analyse full-scale RC columns incorporating the bar buckling phenomenon.
σ c r = n 2 Π 2 E I L e 2 ,
where n, I, E, and le are the restraint factor, second moment of area, Young’s modulus, and effective length of the column, respectively.

2.2. FE Model of RC Column

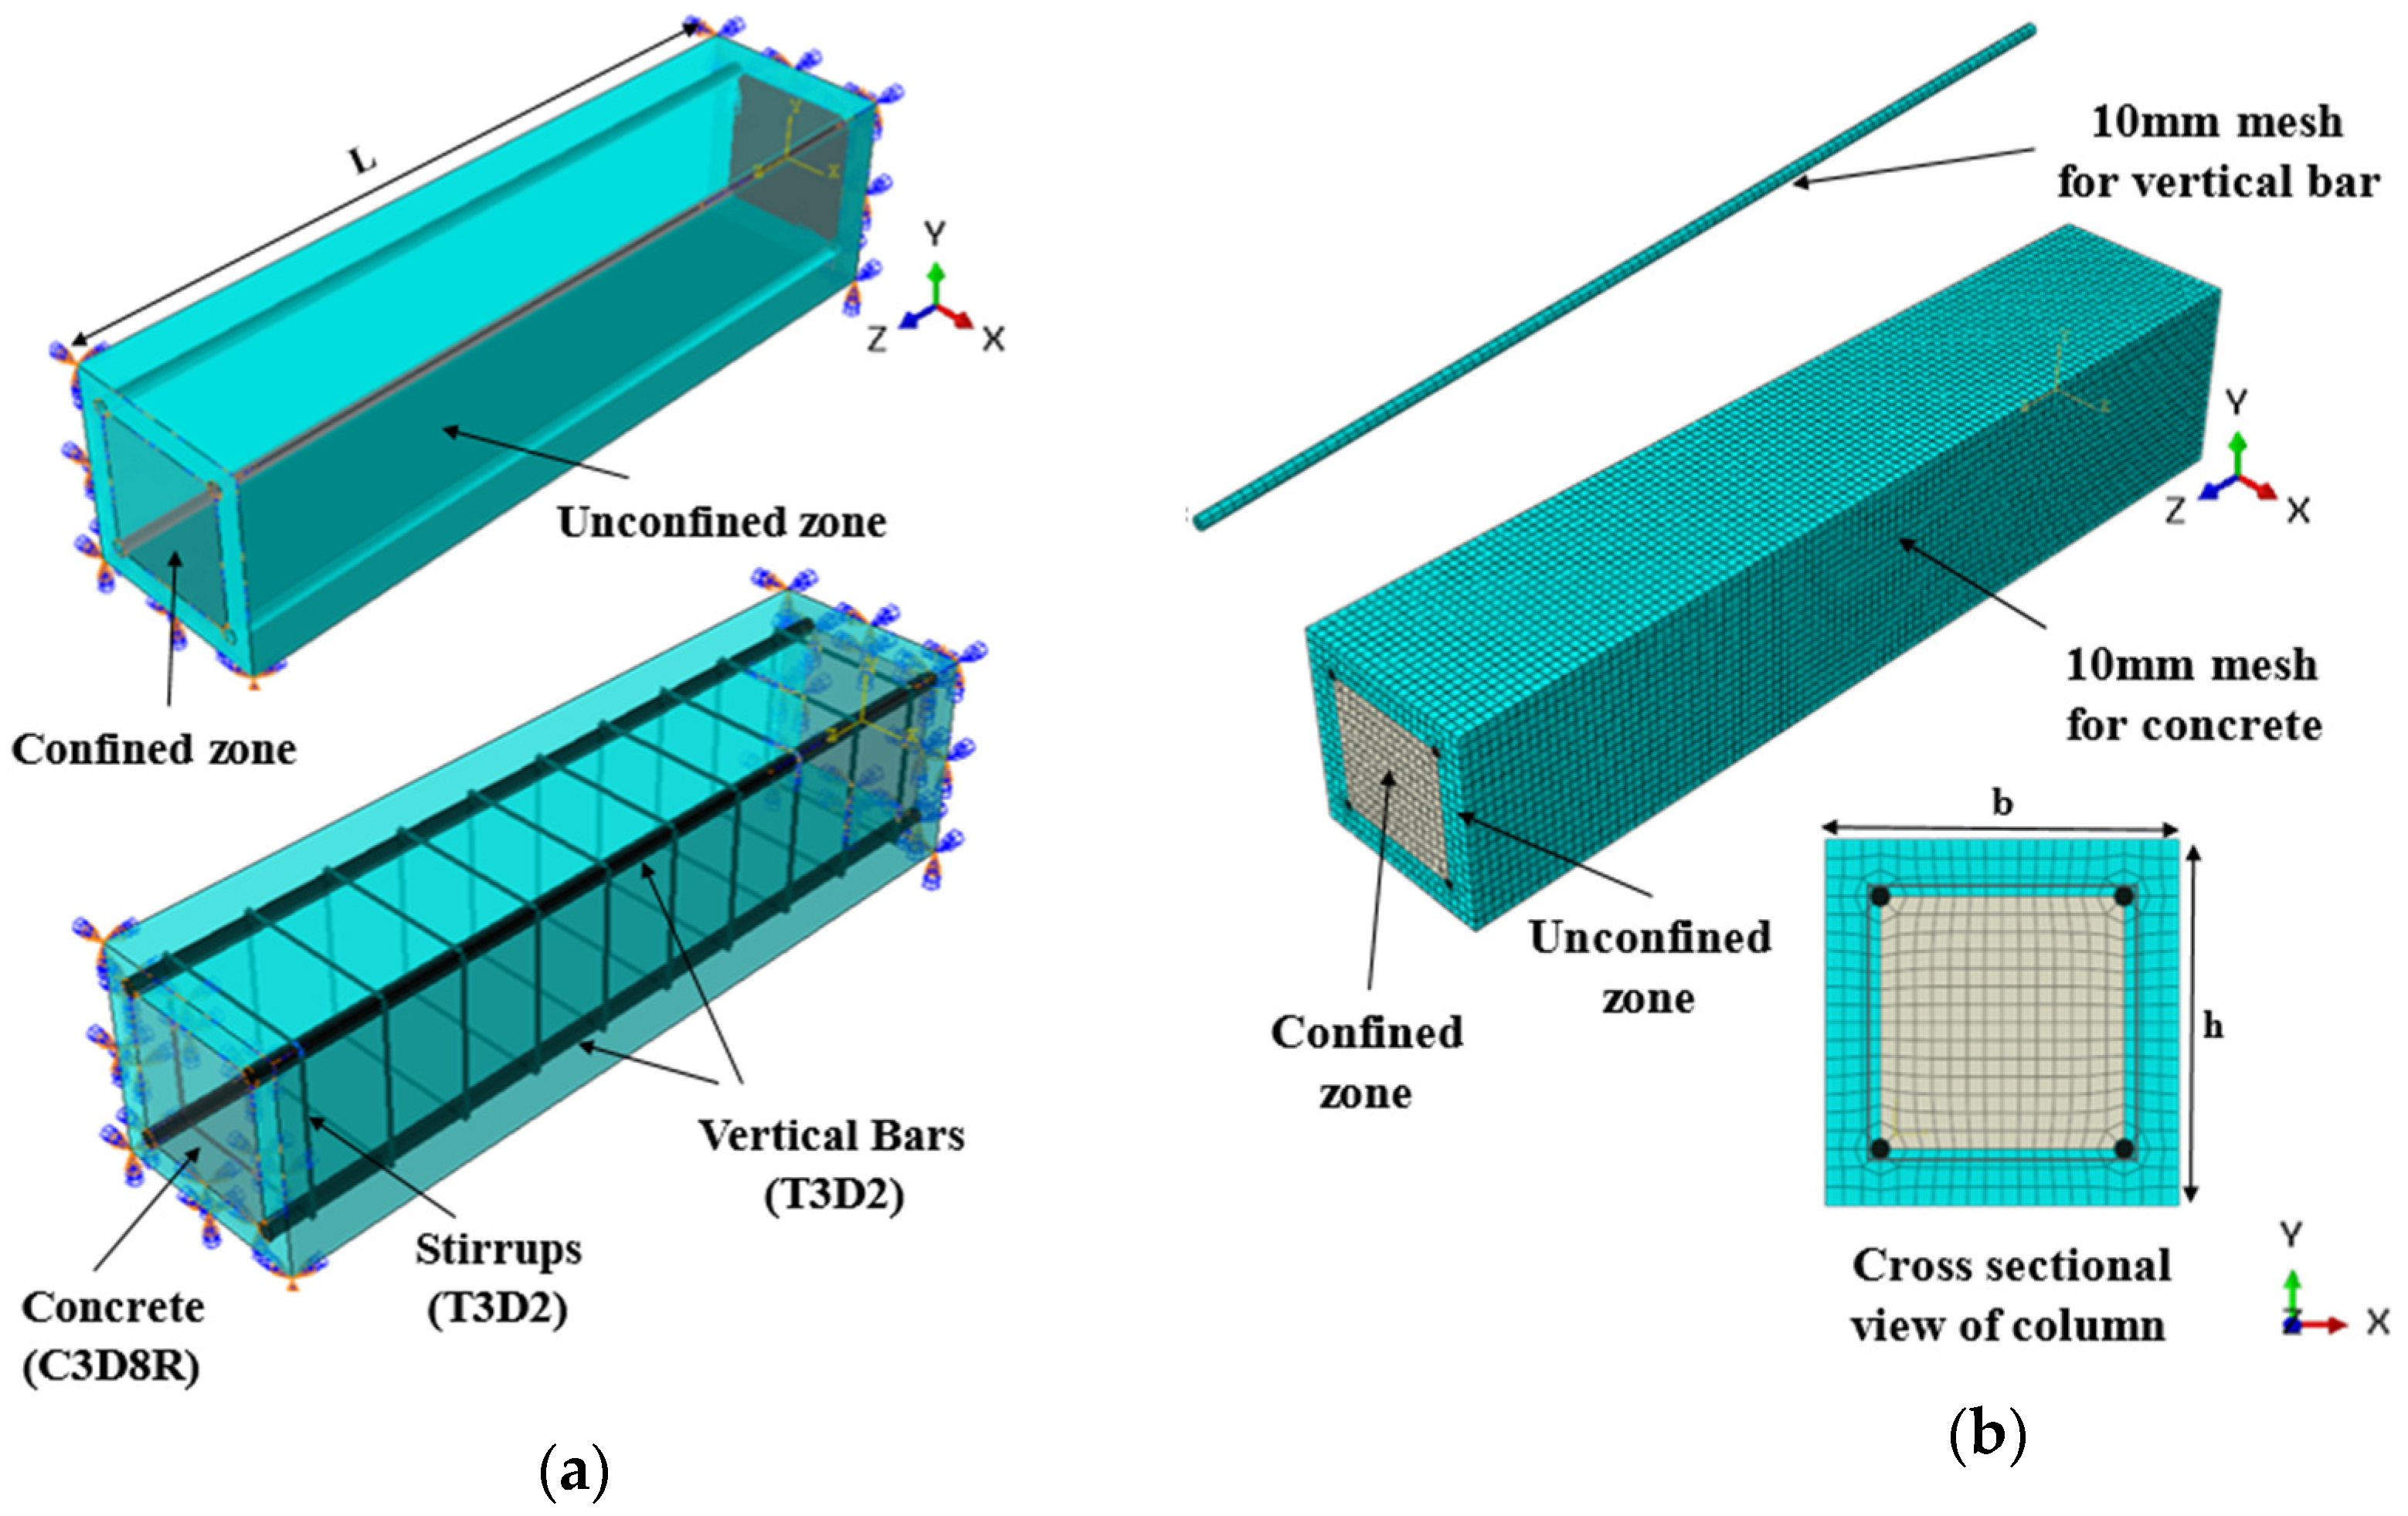
Once the single reinforcement bar model was calibrated under axial buckling, a complete full-scale column comprising of concrete, stirrups, and reinforcement bars was developed. Figure 3 shows the typical RC column model developed in ABAQUS [32]. The concrete section in the column was partitioned into confined (core) and unconfined (cover) segments (the sections were divided into different portions) as shown in Figure 3a, using the partitioning technique available in ABAQUS [32]. Usually, the unconfined compressive strength of concrete is determined in experimental studies (either by testing concrete cylinders or cubes). From these values, the confined concrete properties were derived using the Mander’s model [17]; more details about the derivation of confined properties are given in Section 3.1. The elasto-plastic material model was assigned to the reinforcement bars and stirrups, and details of the assigned material properties are given in Section 3.2. Both concrete and steel bars were modelled as 3D solid elements (C3D8R), with eight integration points. The stirrups were modelled using truss elements (T3D2). Mesh sensitivity analysis was carried out using different global mesh sizes (8 mm, 10 mm, 12 mm, 14 mm, and 16 mm) to determine suitable mesh size and a structured meshing method was used to generate an appropriate mesh configuration for the instances. The results showed that the global mesh sizes ranging from 8 mm to 16 mm predicted the same capacity when compared to each other. Therefore, it can be said that the mesh sizes in this range have a negligible influence on the FE results of this model. Subsequently, concrete and steel sections were modelled with 10 mm square size elements as shown in Figure 3b.
Although the bond between reinforcement and concrete is not uniform, for simplicity, a perfect bond assumption (assuming no relative displacement between concrete and reinforcement) was considered and a perfect bond through embedment option in ABAQUS [32] was used [36,37]. It was presumed that under axial effects, the assumption of a perfect bond between reinforcement bars and concrete could be rational, as the shear stresses at the reinforcement bars and concrete interface are minimal. Moreover, the contact between the vertical reinforcement bars and stirrups was provided by tie constraints throughout the column height as shown in Figure 3 to provide buckling restraint to the vertical reinforcement bars. Initially, eigenvalue buckling analysis was performed on the full-scale RC column model to predict the critical buckling load, which was considered as the maximum load that a column could sustain until it experienced elastic buckling failure. Hence, a suitable initial imperfection configuration was calibrated using a trial-and-error method, which was then assigned to the model.

2.3. Modelling the Corroded Stirrup RC Columns

The corrosion of stirrups in the RC columns is conventionally followed by cracking or spalling of cover concrete (vice versa also happens, where corrosions of stirrups inside the concrete can also trigger cracking and spalling of cover concrete). In order to numerically simulate the stirrup corrosion scenario in RC columns, the cover concrete at the corroded stirrup location of the columns was removed from the model as shown in Figure 4a. It can be noted that the removed cover concrete portion is at the bottom of the column, as spalling of cover concrete (i.e., 300 mm on one face of the column) at the bottom of the columns is commonly observed in real practices (see Figure 1). As corrosion reduces the area of cross-section and tensile strength of the stirrups, it would effectively reduce the confinement of the core concrete, as well as the restraint provided to the vertical reinforcement bars against axial buckling. In order to simulate such conditions, the stirrups were removed in the RC column model only in the corroded portions considered. Since the stirrups were removed, the properties of core concrete in this section were considered similar to those of cover concrete (unconfined) as presented in Figure 4b.
This approach of completely removing the corroded stirrups can be an over-conservative way of assessing the capacities of such columns, as there can be certain portions of corroded stirrups that exist, with reduced cross-sectional area and strength and some confinement. However, numerically modelling such conditions is very complex, and not prudent. In practice, it is conventionally assumed that the confinement is lost due to corrosion and jacketing is normally recommended (using RC section enlargement or fibre-reinforced polymers), and designs are carried out presuming such scenarios to retrofit these columns. Complete removal of stirrups to simulate corroded stirrups could be an over-simplification, as the corroded stirrups would have residual tensile strength and a reduced level of confinement. However, estimating the exact level of corrosion in steel stirrups is difficult to quantify. Therefore, the performance of corroded stirrup columns was evaluated by assuming complete removal of the corroded stirrups and, thereby, reduced confinement and lateral restraint to the vertical bars in that portion. These assumptions enabled a conservative prediction of the overall residual loadbearing capacity of the stirrup-corroded RC column. The differences between the modelling of un-corroded and stirrup-corroded RC columns were (1) the deletion of cover concrete, (2) the removal of stirrups, and (3) the assignment of unconfined properties to core concrete (for the stirrup-corroded region considered).

3. Verification of the Modelling Method

The FE modelling procedure was verified against the experimental results to recognise their predictability in terms of failure patterns and axial capacities. As mentioned earlier, not many experimental studies are available on assessing the axial compression behaviour of full-scale RC columns, as a majority of the studies focused on the compression behaviour of short RC columns and flexural behaviour of full-scale columns. While some studies have reported the corroded behaviour of RC columns under axial compression, the exact corrosion scenarios, especially the stirrup corrosion scenarios, were not explicitly investigated through experimental studies [10,11,12]. Therefore, the verification of the established numerical modelling procedure was made with the limited experimental data available. A brief description of the experimental study used for model validation, details of the representative FE models, and the FE model predictions in terms of failure modes and axial strength and displacement characteristics are given in the following sub-sections.

3.1. Experimental Description

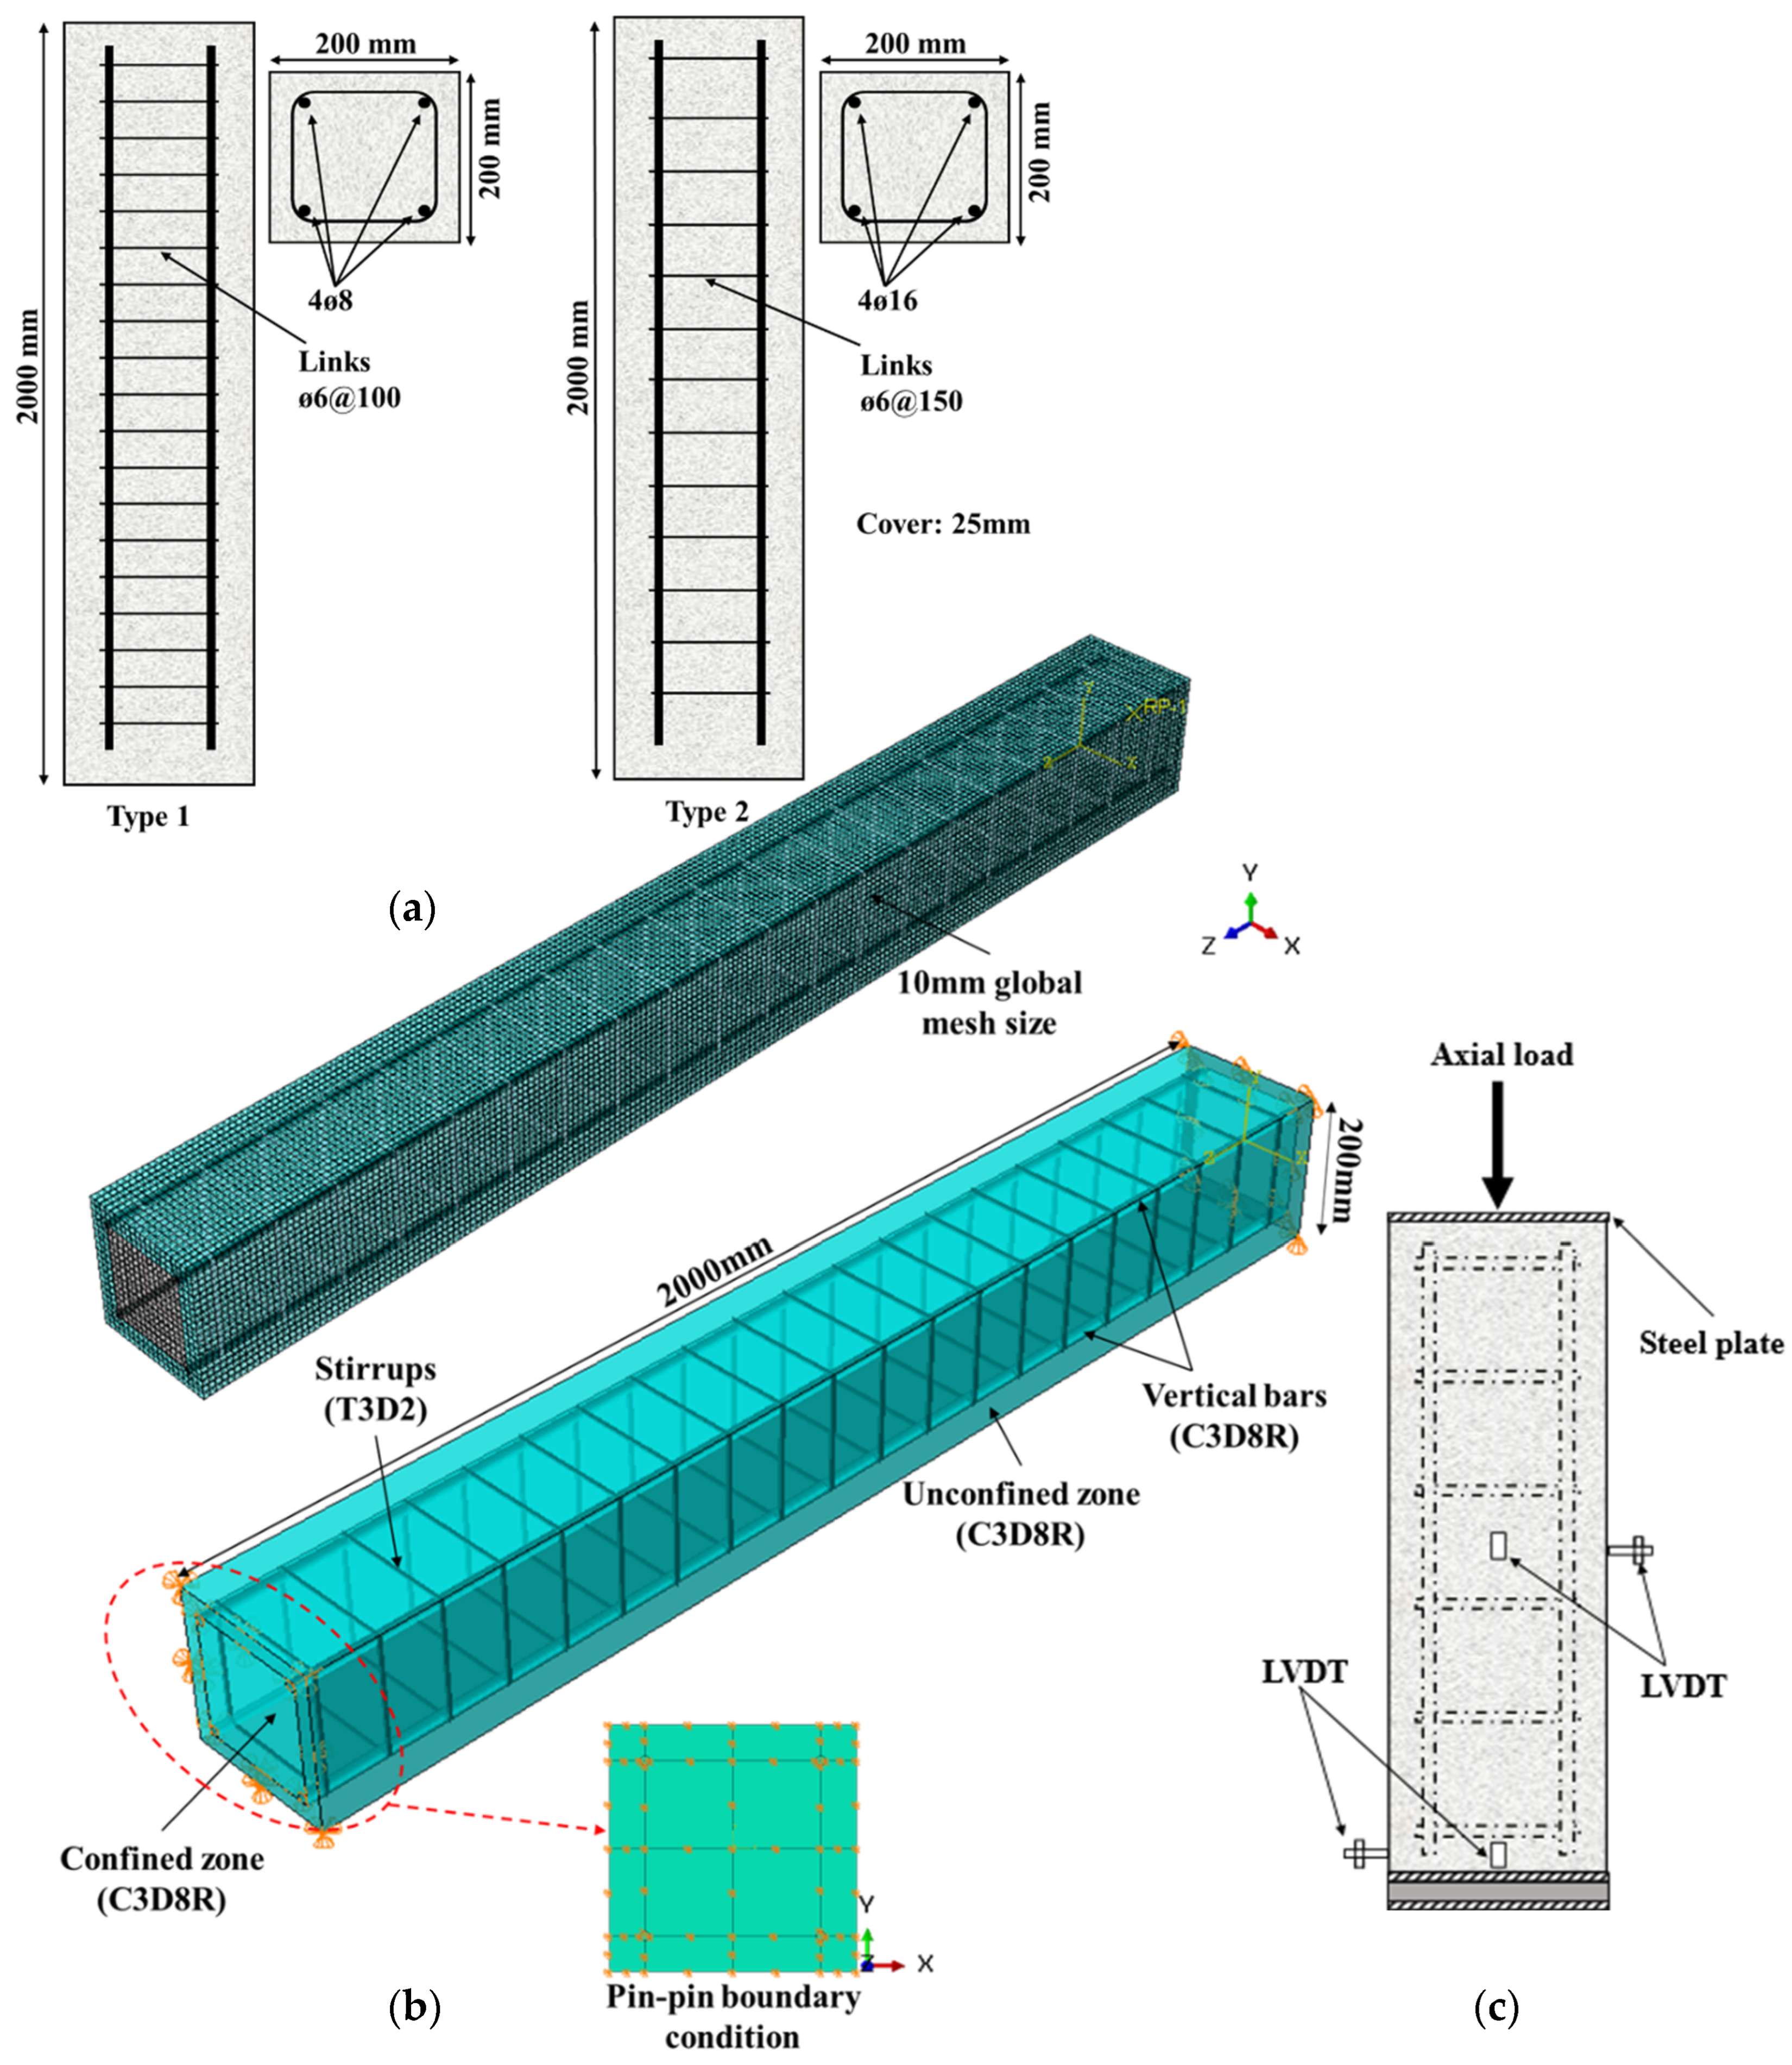
The experimental study conducted by Rodriguez et al. [38] was considered to validate the developed FE model procedure. In this study, two types of RC columns referred to as Type 1 and Type 2 were tested. The properties of the materials and the configurations of the tested columns and their axial loading test set-up adopted in this experimental study were considered to model the RC columns. The predicted failure patterns and load-deflection responses from the FE model were compared with the experimentally obtained results. The experimental configurations of the Type 1 and Type 2 columns are shown in Figure 5a. The differences between the Type 1 and Type 2 columns were the sizes of vertical reinforcement bars; the Type 1 column comprised 8 mm bars, while Type 2 had 16 mm bars. Additionally, 6 mm stirrups were provided at 100 mm and 150 mm spacing for Type 1 and Type 2 columns, respectively. The height of both column types was 2 m.
The yield stress of the main reinforcement bar and stirrups used in the experimental study ranged between 550 and 590 MPa. The unconfined compressive strengths of concrete used in Type 1 and Type 2 columns were 30 MPa and 34 MPa, respectively. The columns were tested with a pinned-pinned support condition (i.e., lateral translations were fixed and rotations were allowed). The exact experiment configurations of the RC columns of Type 1 and Type 2 were created using the FE modelling concept described earlier. Figure 5b represents the FE models of the RC column reported in Rodríguez et al. [38]. All nodes of the stirrup in contact with the vertical steel bar were connected to the nodes of the vertical steel bar at tangent points, employing the tie constraints available in ABAQUS [32]. The remaining nodes of the stirrup were integrated into the adjacent 3D solid elements of concrete to model the interaction between stirrups and concrete.
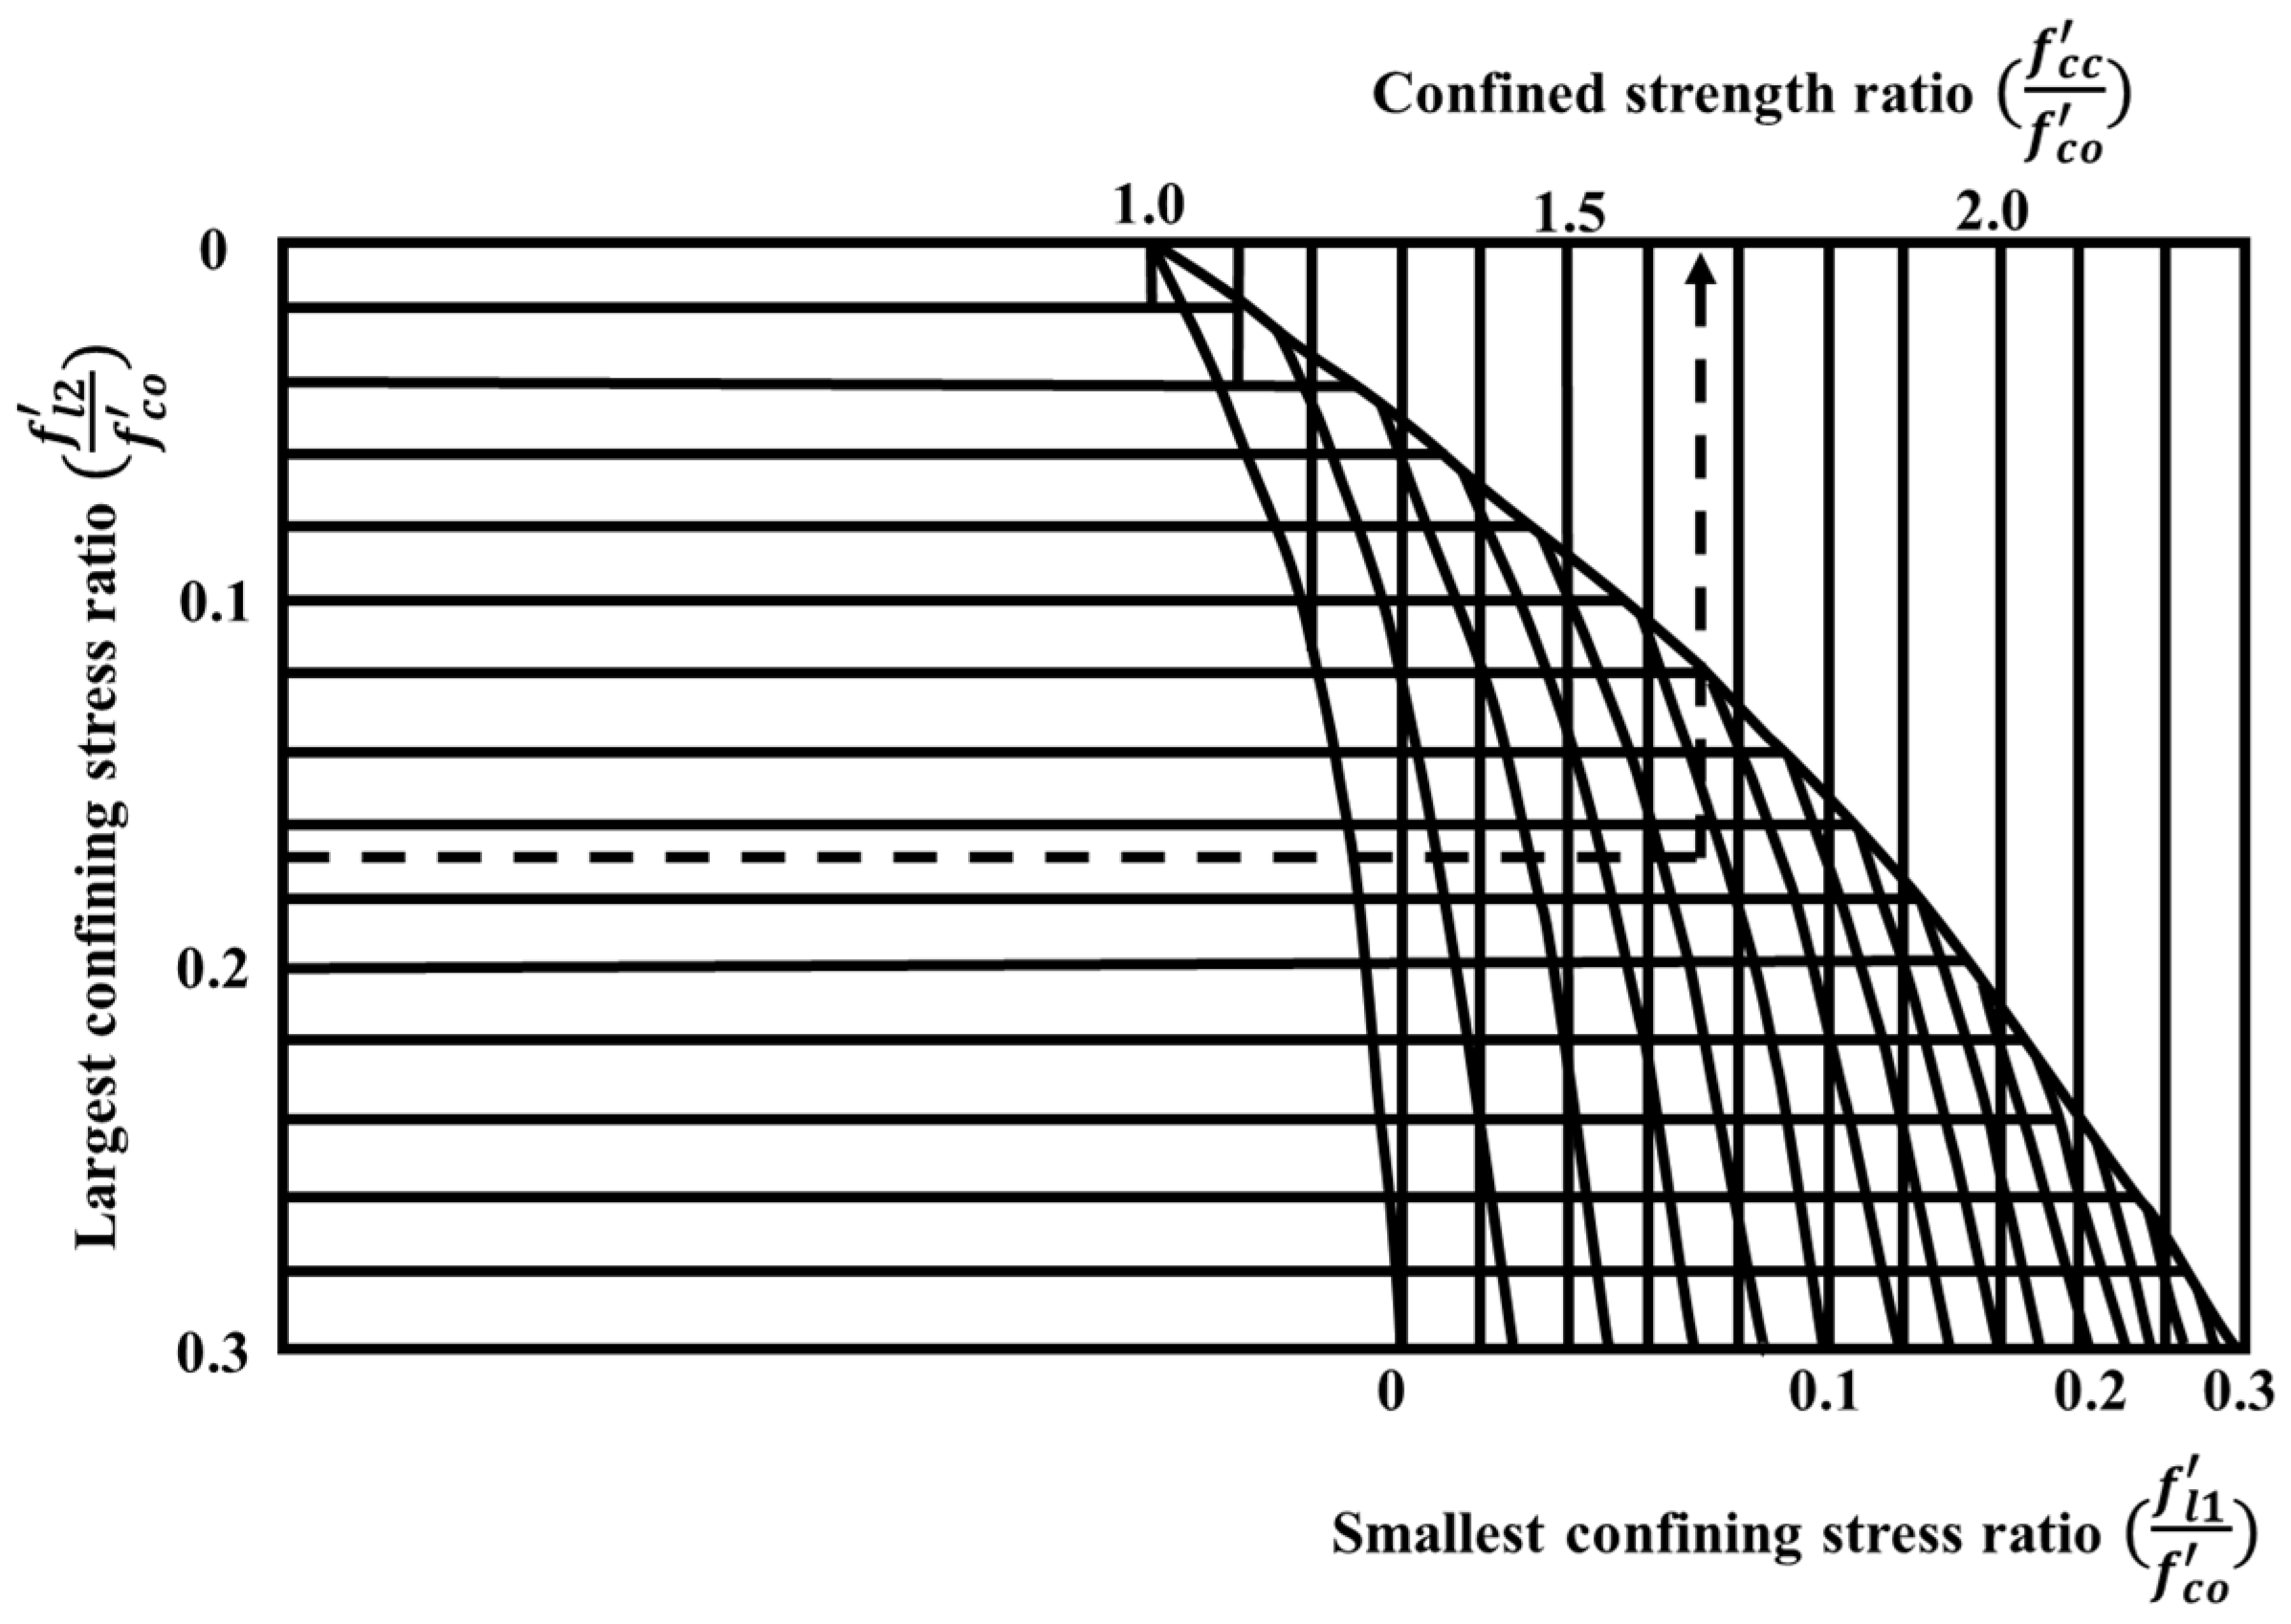
The material parameters employed within the FE model are presented in Table 2. It is important to highlight that only unconfined concrete properties were provided in Rodriguez et al. [38]. However, in the adopted modelling concept, the cover and core concrete portions of the column section were considered as unconfined and confined, respectively. The confined properties of the concrete were deduced using the formulations given in Mander et al. [17], using the general solution of the multiaxial failure criterion in terms of lateral confining stresses and unconfined strength properties as illustrated in Figure 6. The equations used to determine the effective lateral confining stresses (fr, eff) are given in Equations (4)–(6).
f r = A tr f y s d C ,
k e = A e A C C ,
f r , e f f = k e f r ,
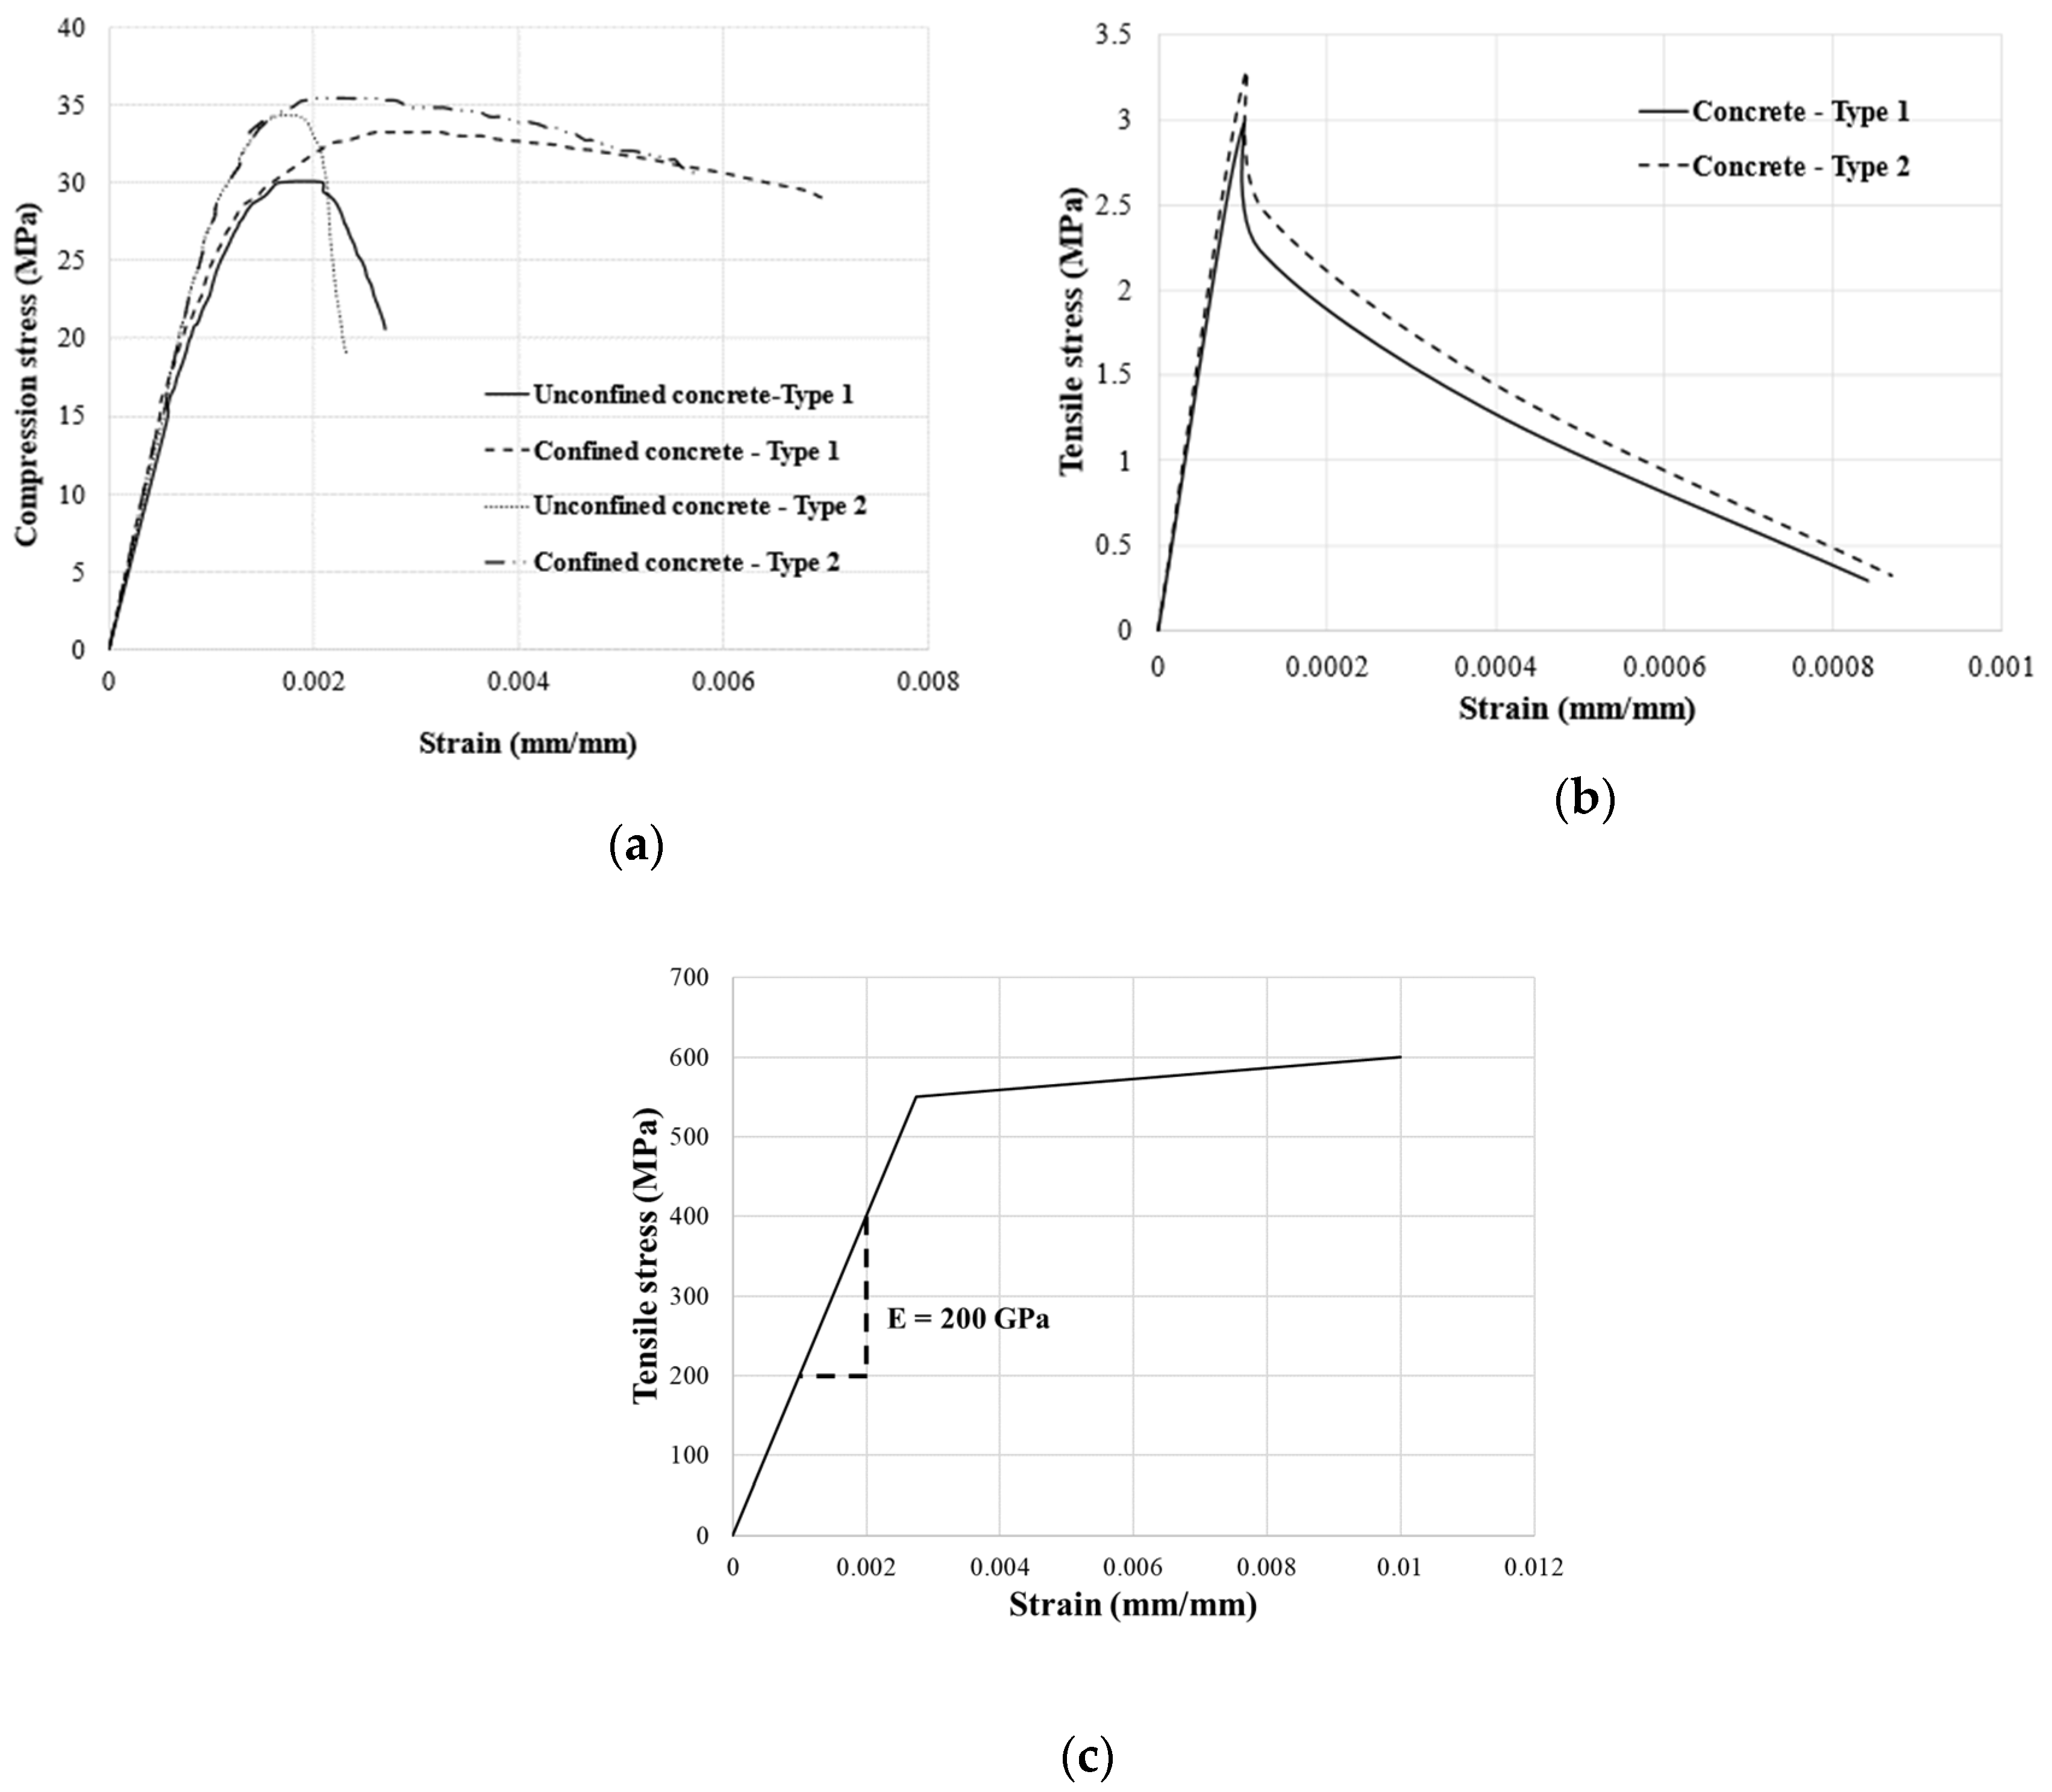
where ke, Ae, ACC, fr, Atr, fy, s, and dC are the confinement effectiveness co-efficient, area of effectively confined concrete core, area of concrete core, lateral confining stress, total area of transverse bars running in the respective directions (x and y), yield strength of the transverse reinforcement, centre-to-centre spacing of stirrups, and core dimensions to centrelines of perimeter hoop, respectively [39]. Figure 7 gives the constitutive stress–strain responses assigned in the FE models based on the experimental data provided for the concrete and steel sections. Using the unconfined concrete strengths given in the experimental study, the complete stress–strain curves under axial compression of the concretes were established based on EN 1992-1-1 [40]. The corresponding confined stress–strain curves under axial compression were developed using the methodology outlined by Mander et al. [41] as given in Equations (7)–(9), where f c c , and εcc are the maximum concrete stress and corresponding strain, while fc, εc, and Ec are the confined concrete stress, longitudinal compressive concrete strain, and tangent elasticity modulus of concrete, respectively. The stress–strain profiles of the concrete under axial tension were derived using the tension-softening curve suggested by Massicotte et al. [42]. Rigid body constraint was used to represent all the nodes on the top surface of the column and the displacement control method was used to simulate the loading, where a displacement due to axial compression was assigned to the reference point, reproducing the experimental testing method as shown in Figure 5c.
f c = f c c x r r 1 + x r ,
r = E c E c f c c ε c c ,
x = ε c ε c c ,

3.2. Validation Results

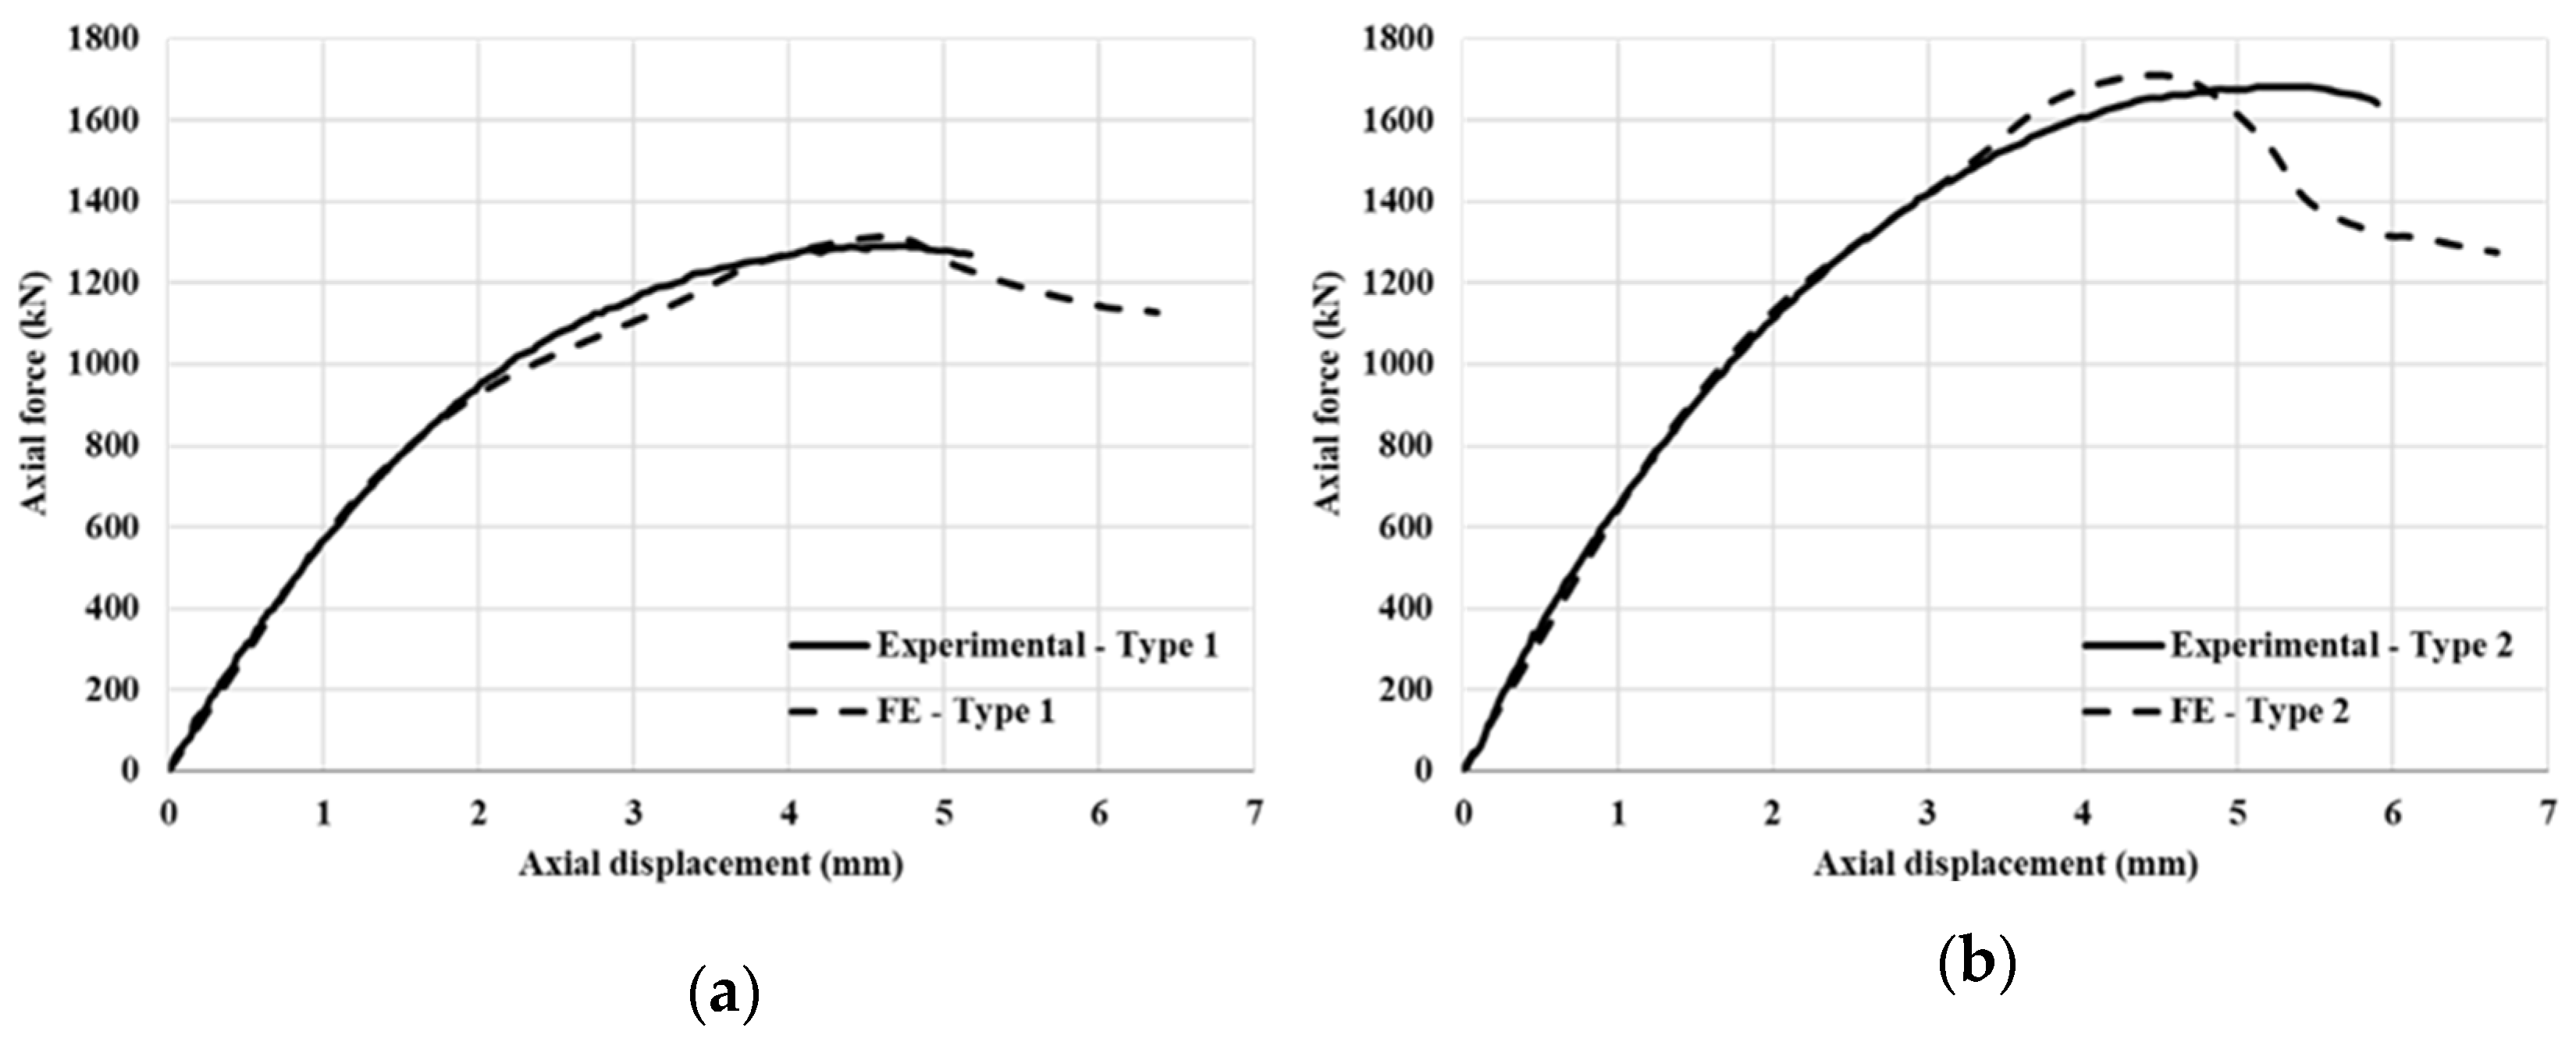
Figure 8 shows the failure patterns of RC columns observed in the experimental testing as well as from the analysed FE models. Apparently, RC columns tested under axial compression failed by cracks developed vertically on the faces, parallel to the loading; similarly, the failure patterns of the FE models also revealed that the tensile stresses developed on the faces of the column due to dilation under axial loading. Since the height of the tested columns was only 2 m, the buckling failure was not prominent (i.e., they were short columns). No notable distinctions in the failure pattern were observed between Type 1 and Type 2 columns, indicating that the reinforcement detailing did not significantly influence the axial compression behaviour of the columns tested. Figure 9 shows the experimental and numerical axial load–displacement responses of the RC columns. The experimental peak loads of Type 1 and Type 2 RC columns were 1292 kN and 1683 kN, respectively, whereas the numerically predicted peak axial loads were 1236 kN and 1699 kN, respectively. It could be noted that the experimental and numerical load-deflection responses follow similar pattern, which proves the accuracy of the established numerical modelling method to simulate the axial compression behaviour of full-scale columns.

4. Parametric Analyses

The verified FE modelling method to assess the axial compression behaviour of RC columns was extended to assess the various factors that affect the axial compression behaviour of RC columns. In the absence of experimental studies on the stirrup-corroded RC columns under axial compression, the developed modelling method was used to parametrically analyse the performance of the stirrup-corroded RC columns. The parametric analyses were implemented in two stages: (1) assessing the performances of un-corroded columns and (2) assessing the performances of corroded columns. The variables considered in the first stage of parametric analyses were (a) the grade of concrete (20 MPa and 40 MPa), with this being an unconfined property (respective confined properties are provided in Appendix A), (b) vertical reinforcement detailing (using T16 and T20 bars), (c) slenderness ratios (which correspond to column heights of 3 m and 4 m), and (d) eccentricity (0, h/3, and h/6), where h is considered as the width of the column. Only two levels of eccentricity were analysed to compare the results against the concentric loading results obtained and, thereby, to derive the moment–axial load (M–N) interaction diagrams to deduce the performance of eccentric loaded RC columns. In the second stage of the corroded stirrup analyses, the same variables were considered with stirrup-corrosion scenarios using the concepts explained in Section 4.2.
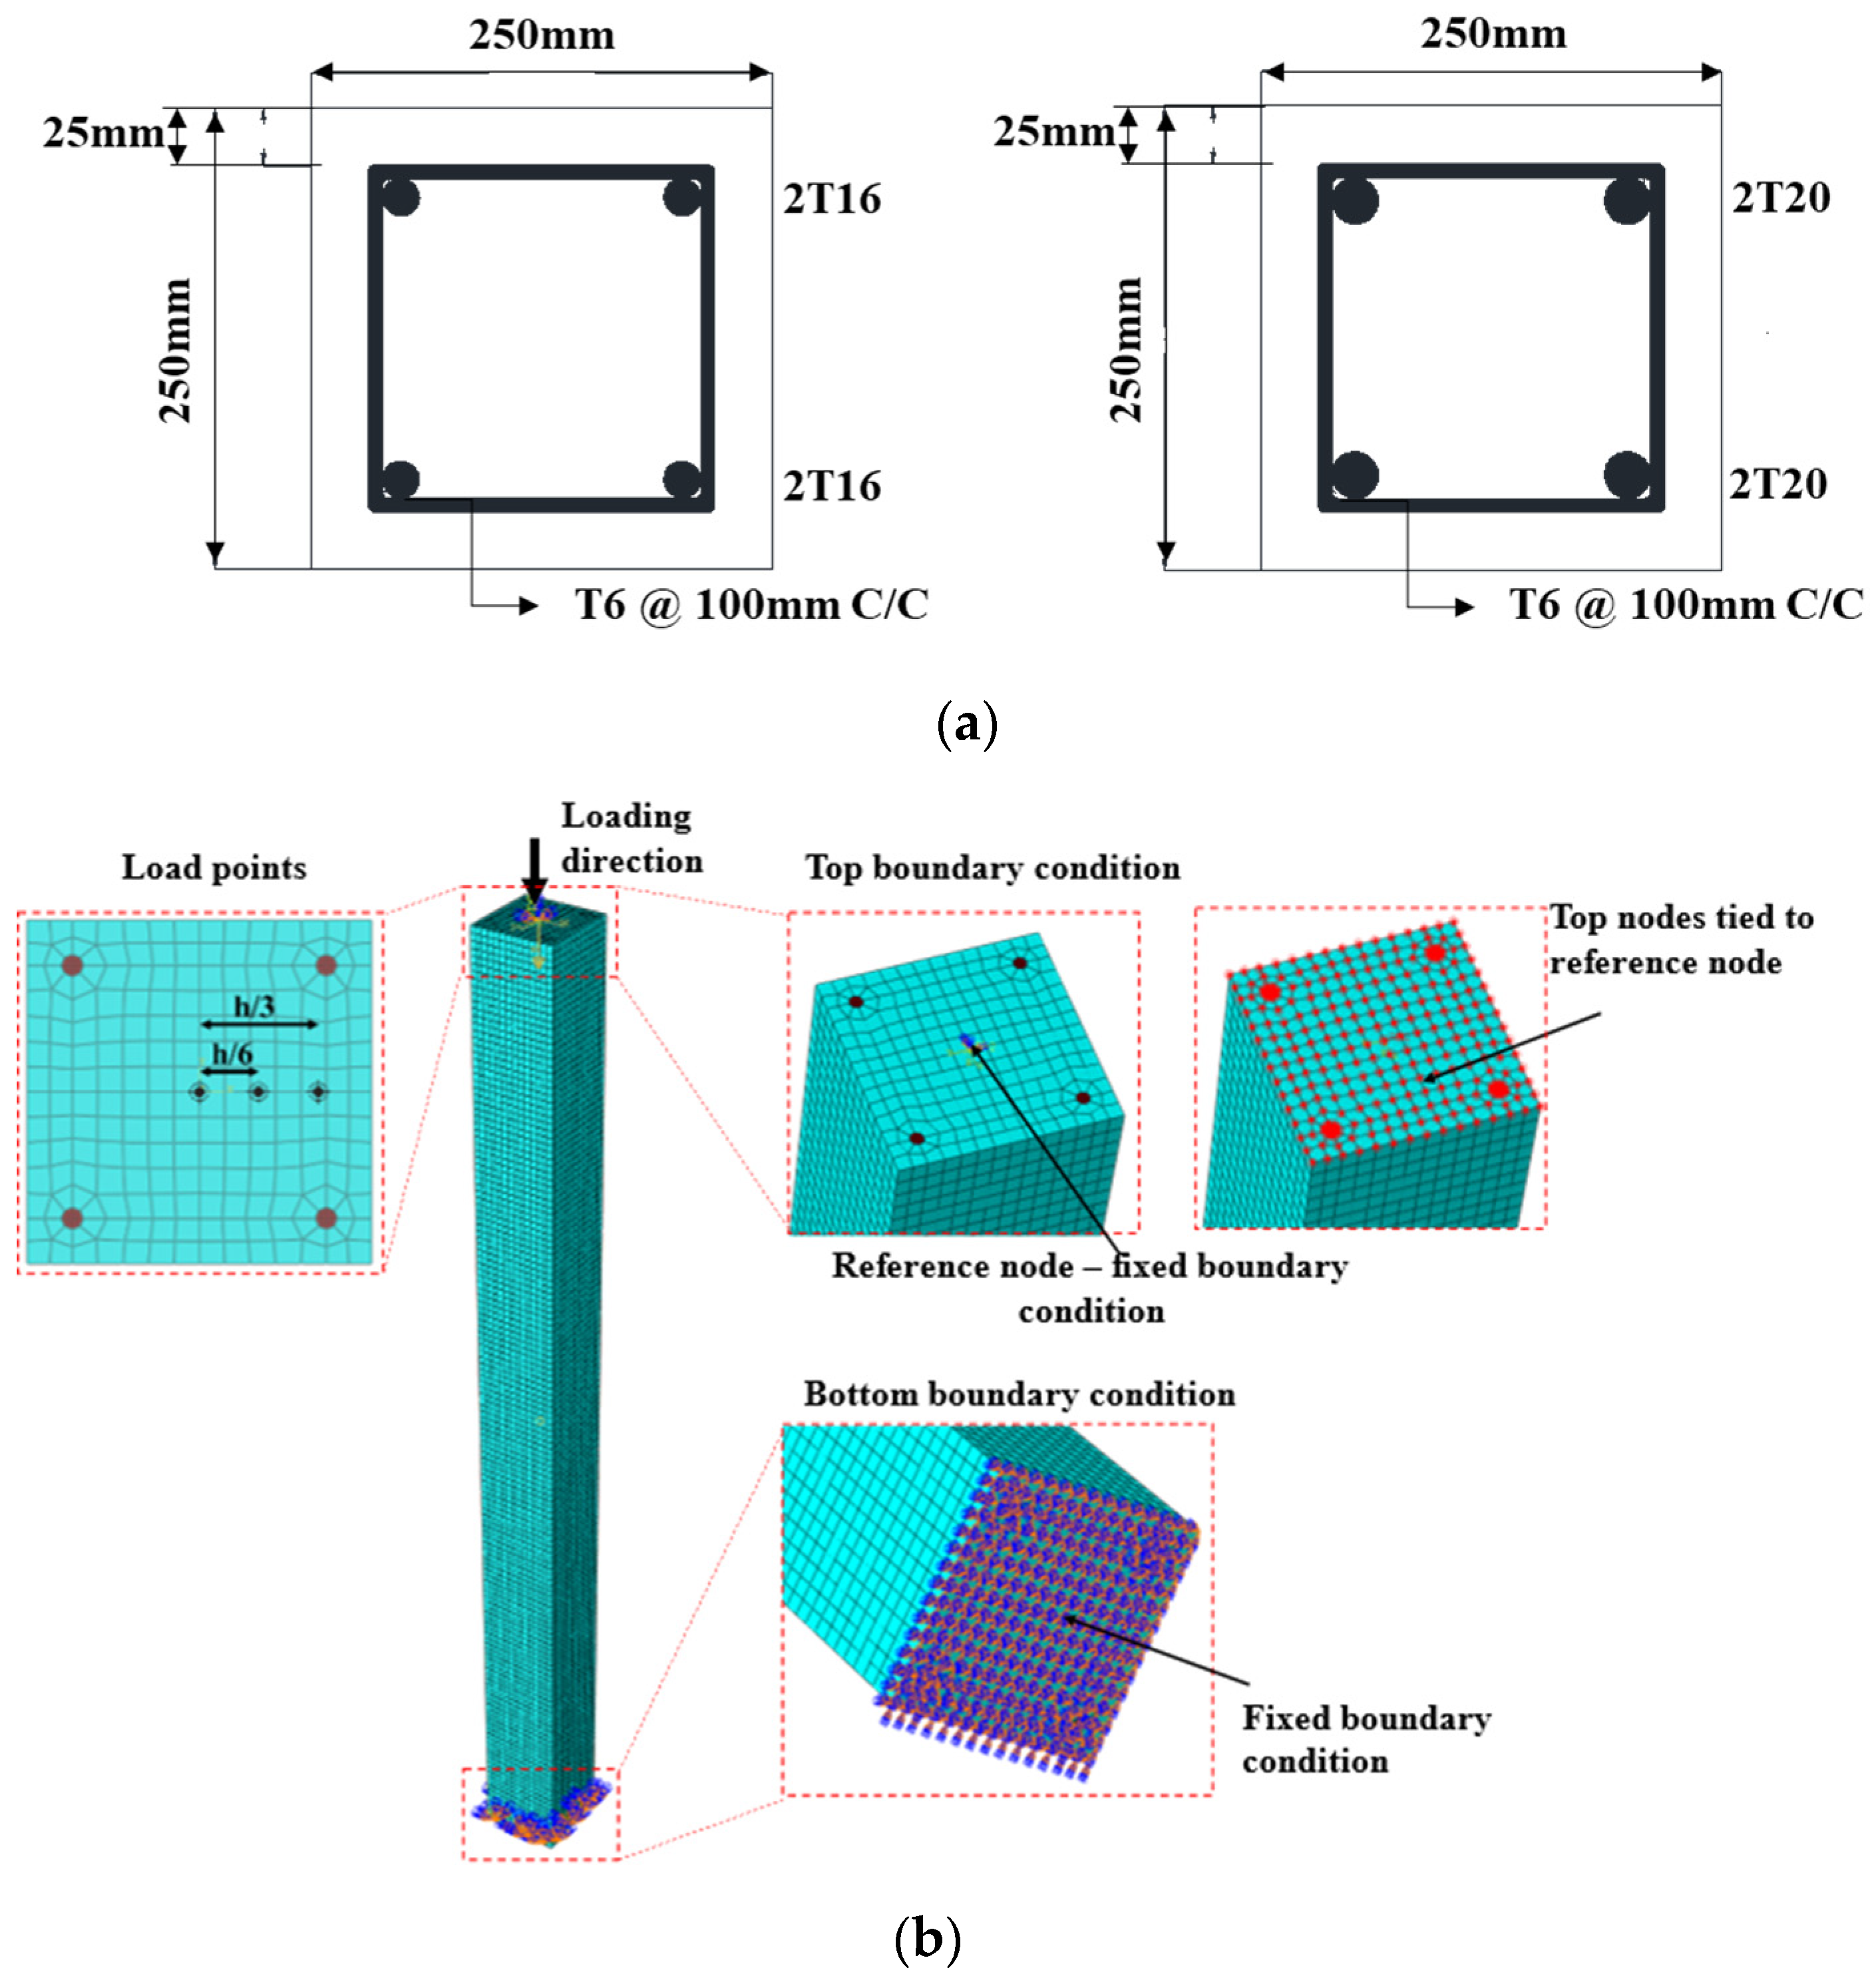
It must be mentioned that influence of various reinforcement detailing was not considered; however, it was limited regarding the RC column configurations found in low-rise RC buildings’ gravity load combinations. The stirrup arrangement used was 6 mm bars at 100 mm uniform spacing throughout the heights of the RC columns analysed. The considered RC column cross-sections with reinforcement arrangement are shown in Figure 10a. No variation in the stirrup spacing was considered in this study (particularly closer to ends), resembling the end of beam and slab as per EN 1992-1-1 [40]. The uniform stirrup spacing considered was based on the criterion of minimum {12ϕ; min {0.6 h; 0.6 b}; 240 mm}, where the ϕ, h, and b are the diameter of the vertical bar, width, and length of the column, respectively. The adopted stirrup spacing of 100 mm was within this range. The influence of various other reinforcement configurations could be addressed in future studies. The end boundary conditions at the bottom of the RC columns analysed were fully restrained as shown in Figure 10b; thus, lateral and vertical translations, as well as the rotations of the column at the bottom, were restrained. At the top, lateral translations and rotations were restrained, and only vertical translation was allowed for the application of axial compressive loading.
In order to denote the analysed RC column cases, an alpha-numeric nomenclature was used. The first set of letters in the nomenclature indicates the corrosive state (un-corroded column/UC and corroded column/CC), the second set of letters represents the unconfined compressive strength of concrete (20 MPa and 40 MPa), and the third set of letters represents the vertical reinforcement bars used (T16 and T20). The final notation reveals the height of the column analysed. For example, UC-C40-T16-4 implies a 4 m tall, un-corroded RC column made of concrete with a 40 MPa unconfined strength (cover portion) and reinforced using 16 mm vertical bars. In total, 72 column cases were analysed, taking into consideration the corrosion at tensile and compressive regions. The results obtained were assessed with the analytically derived interaction diagrams of the analysed RC columns, which were modified to account for the confined and unconfined concrete properties as well as the stirrup corrosion scenarios. The results of the parametric analyses are given in detail in Appendix B for each case along with the nomenclature used. The analytical derivation procedure for the un-corroded and corroded RC column capacities is given in the following sub-section.

4.1. Modified (M–N) Interaction Diagrams

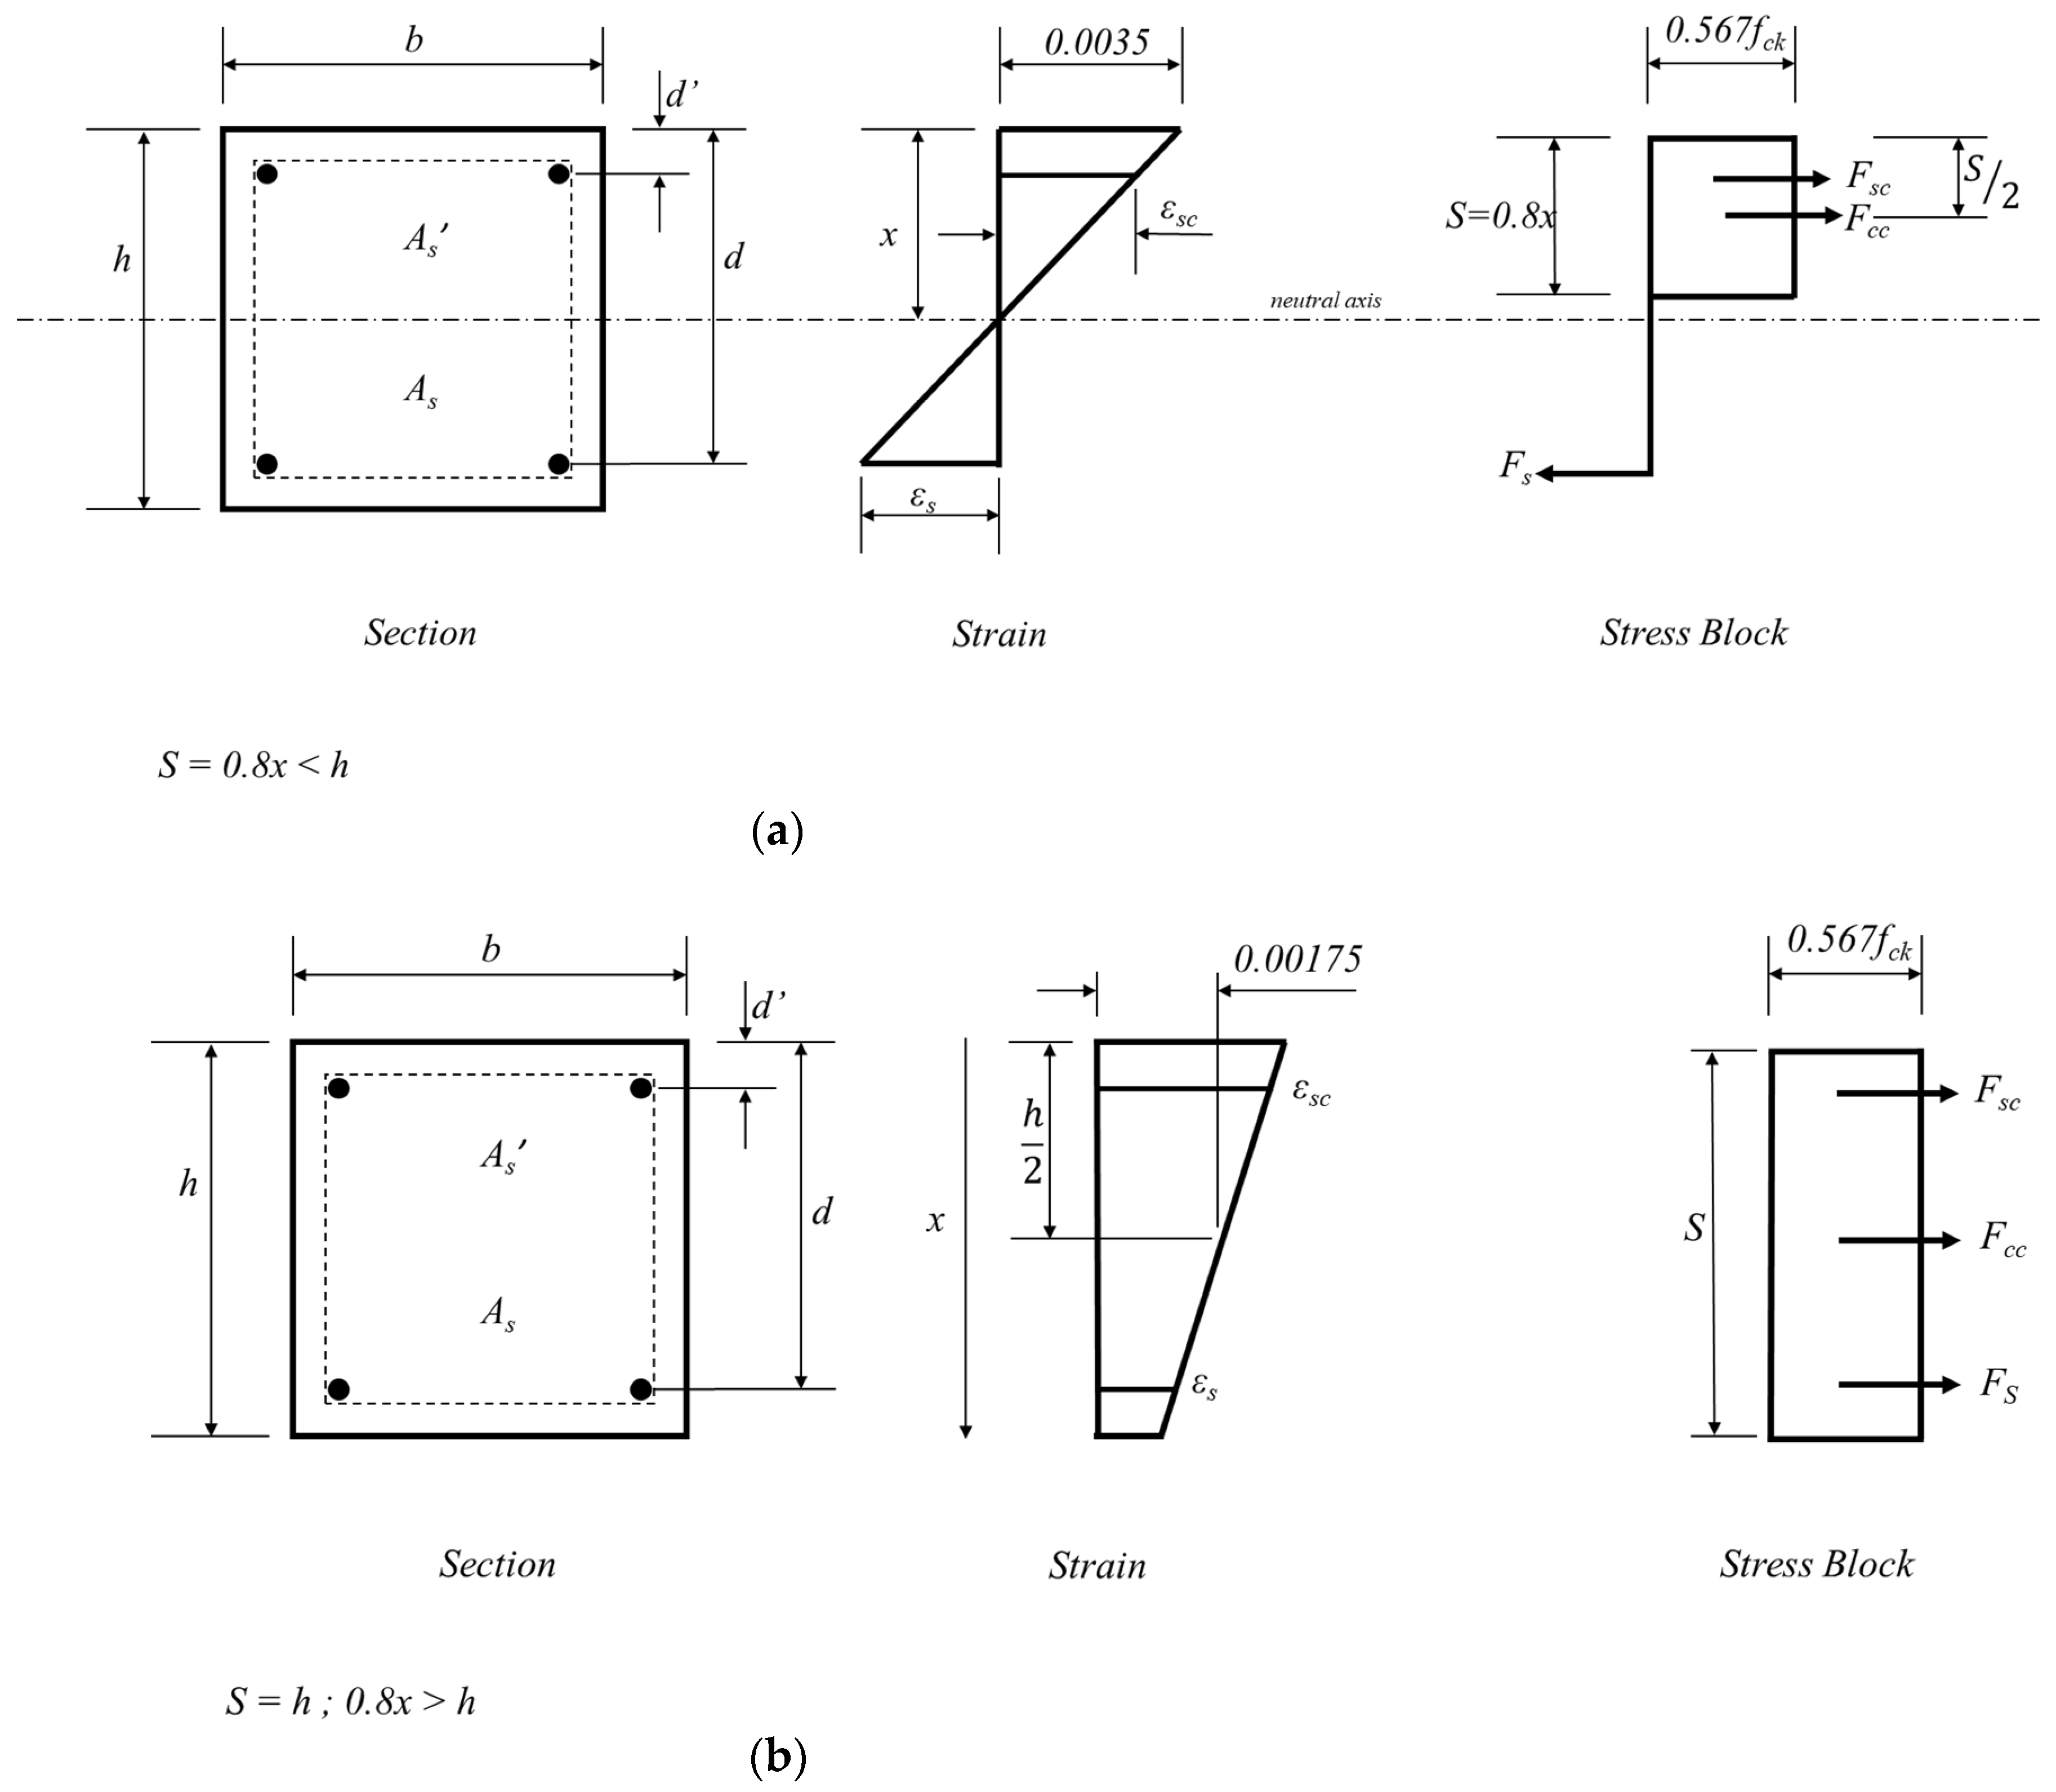
The conventional method to develop the interaction diagrams based on strain compatibility was modified to account for the confinement of concrete in un-corroded RC columns, while the absence of stirrups and confinement was considered for the corroded RC column cases. Figure 11 depicts the cross-sectional representation of a member with the distribution of normal stress and strain for varying locations of the neutral axis and the cross-section is subjected to a moment (M) and an axial compressive force (N). The direction of the moment illustrated in Figure 11a induces compression in the upper portion of the section and tension in the lower portion. For instances, where the section experiences tension, the maximum allowable concrete strain is taken as 0.0035. Conversely, when the section is not subjected to tension (Figure 11b), the maximum allowable strain was considered as 0.00175 at half the depth of the section [43].
The formulations developed to derive the interaction diagrams at different depths of neutral axis incorporating confined and unconfined regions of concrete are given in Equations (10)–(15):
Considering the equilibrium of the section,
N = F c c + F s c + F s ,
where Fcc, Fsc, and Fs are the compressive force in concrete, which acts through the centroid of the stress block; the compressive force in the reinforcement area A s , which acts through its centroid; and the tensile or compressive force in the reinforcement area As, which acts through its centroid; respectively. Fcc comprises both compression due to unconfined and confined region and, for simplicity, it is assumed to be acting at the centroid of the stress block.
0.8 x < h ;   F c c = f c k , u n c o n A u n c o n + f c k , c o n f i n e d   A c o n ,
N = F c c + f s c A s + f s A s ,
0.8 x h ;   N = f c k , u n c o n A u n c o n + f c k , c o n A c o n + f s c A s + f s A s ,
Taking moments about the plastic centroid
0.8 x < h ;   M = F c c x ¯ p 0.8 x 2 + F s c x ¯ p d + F s d x ¯ p ,
0.8 x < h ;   M = F c c x ¯ p h 2 + F s c x ¯ p d + F s d x ¯ p ,

4.2. Comparison of Analytical and FE Predicted Results

The M–N diagrams developed using the analytical formulations are compared with the numerically predicted capacities of the RC column cases (un-corroded and corroded) considered in the parametric analyses and discussed in this section.

4.2.1. Un-Corroded RC Columns

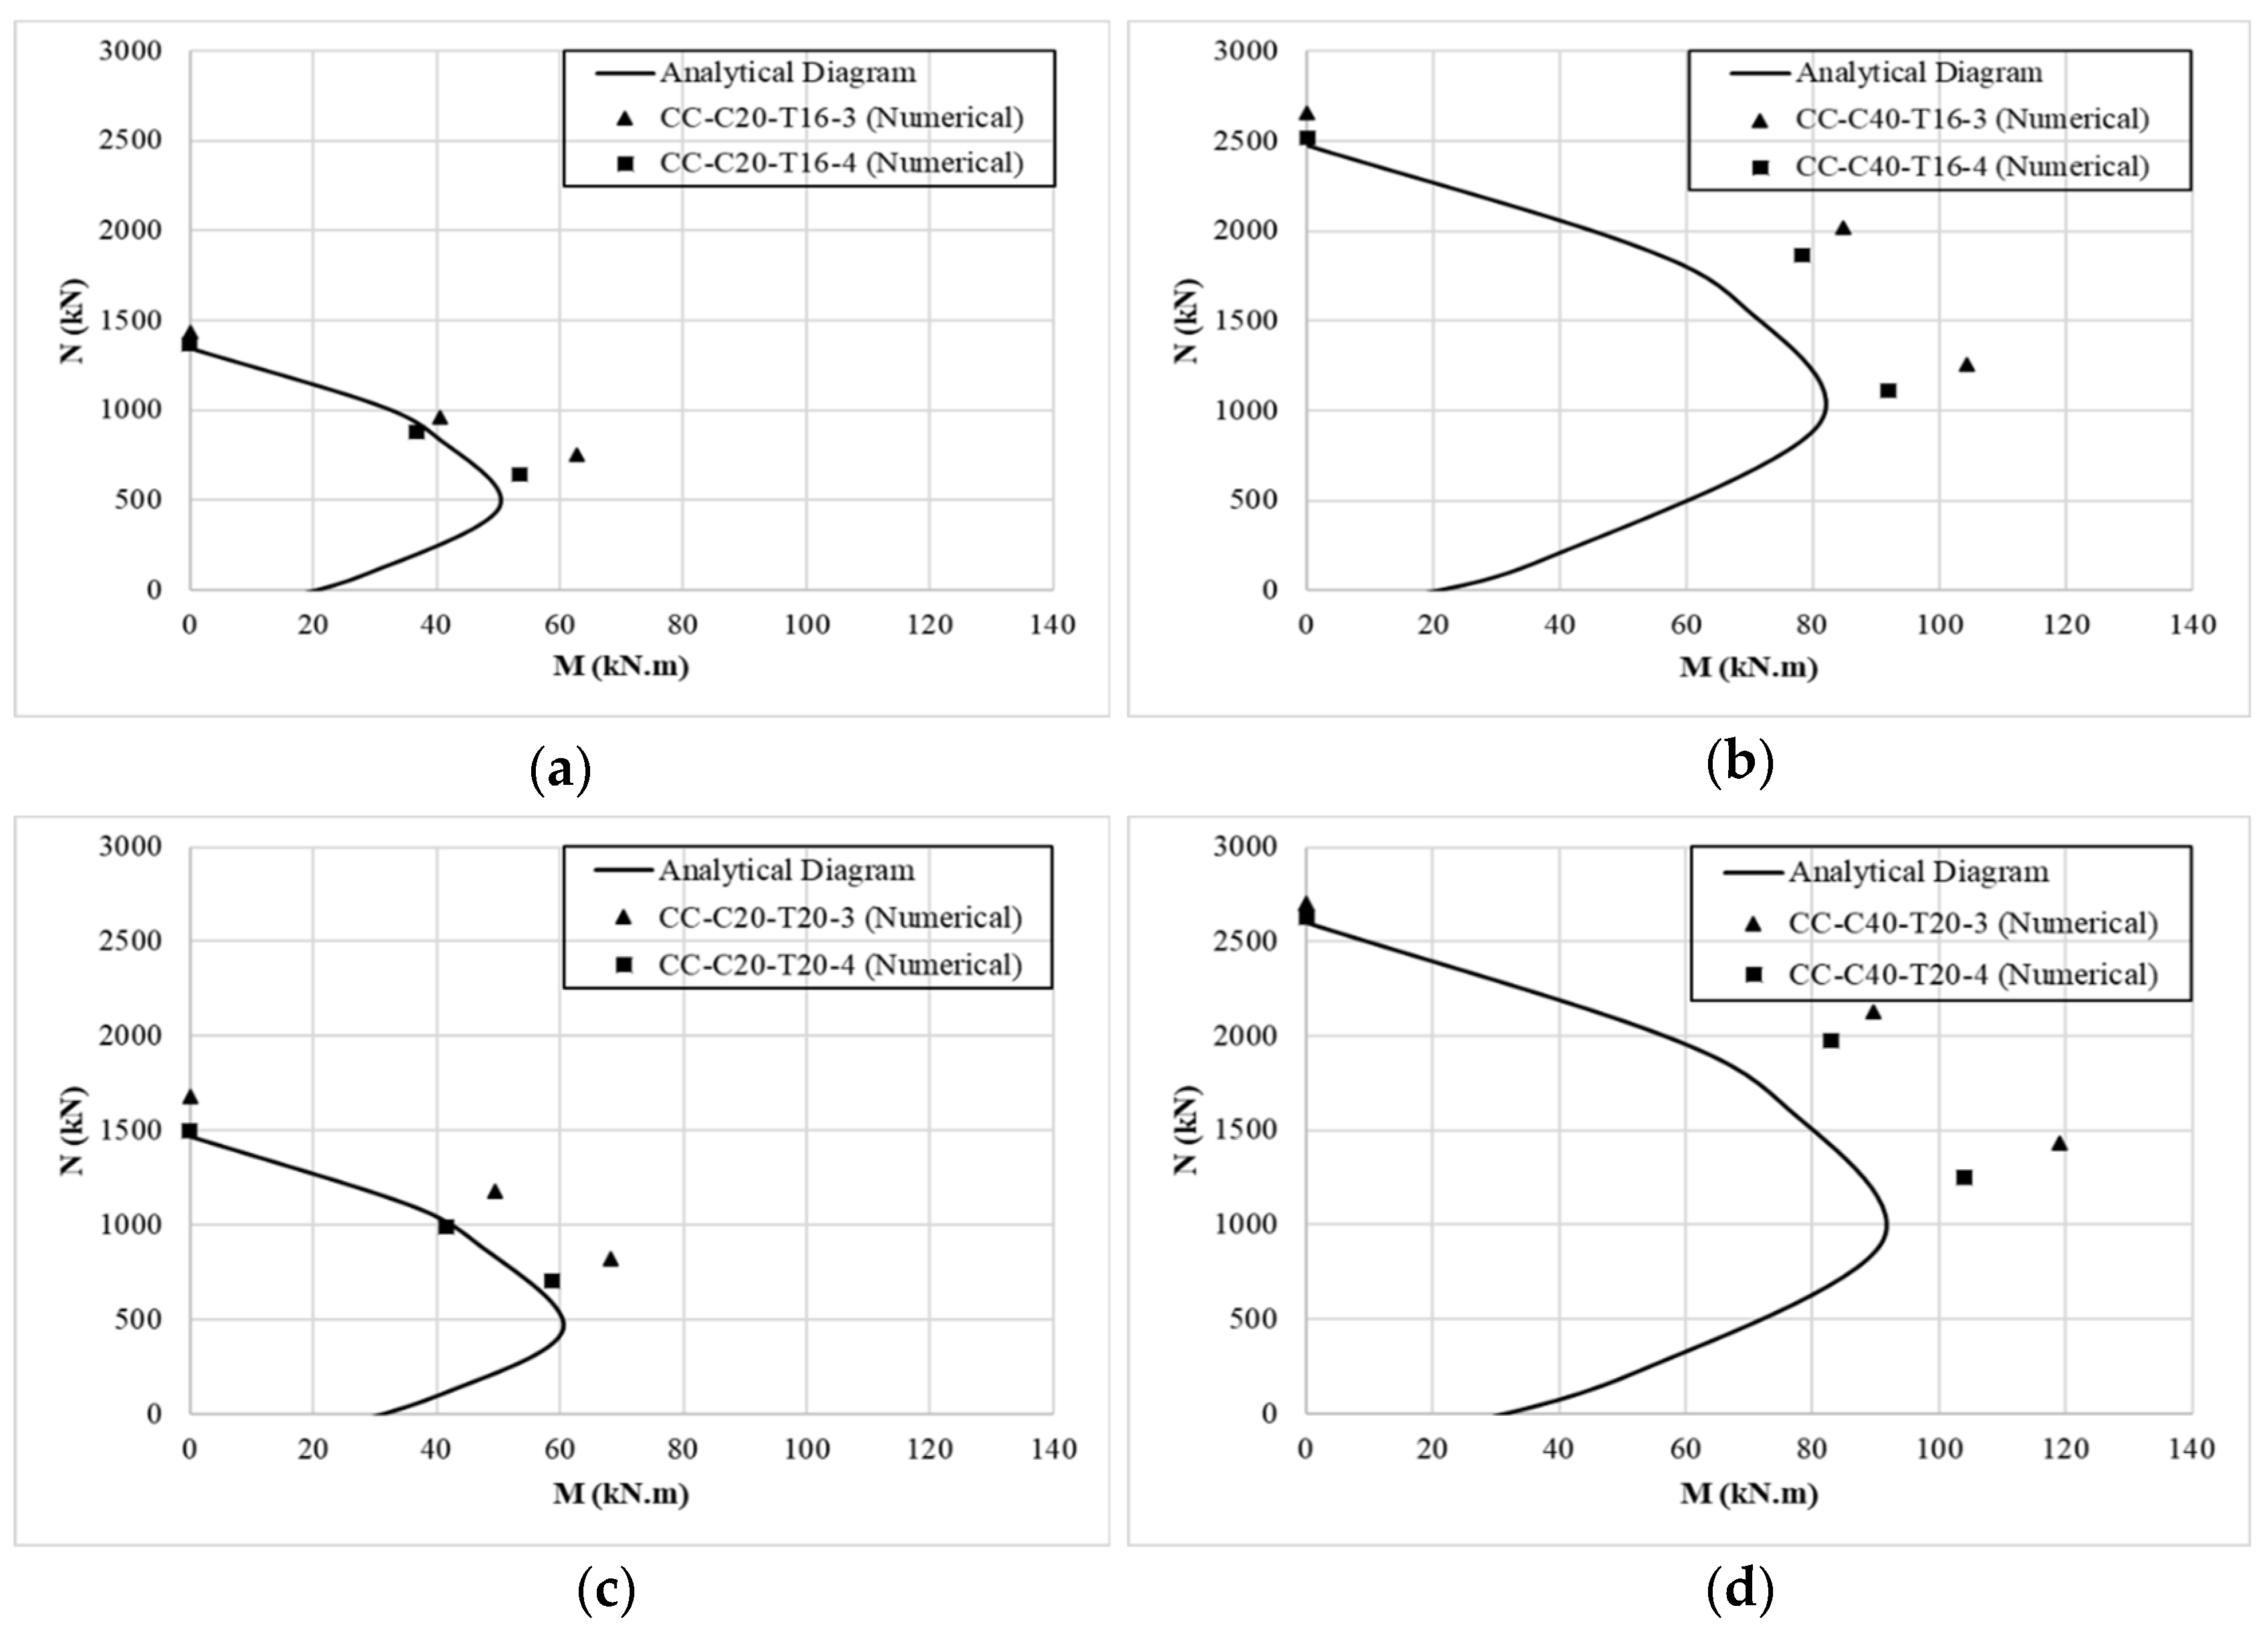
In total, 24 un-corroded RC column models were created and analysed under concentric and eccentric axial loading conditions with different variables (concrete strengths, reinforcement detailing, and slenderness). The results obtained in the parametric analyses are given in Figure 12. The slenderness of the columns was computed as per Equation (22), where r and lo are the radius of gyration and effective height, respectively. The lo was taken as 0.75l, as both ends of the columns fully restrained, where both lateral translation and rotations were fixed in the columns, resembling monolithic construction. Thus, the slenderness ratios computed for 3 m and 4 m column cases considered were 31.2 and 41.6, respectively.
λ s = l 0 r ,
It can be noted from Figure 12 that the axial resistance of the columns decreased as the slenderness ratios increased for the cases analysed, despite the changes in the compressive strengths of concrete and reinforcement detailing considered. When the slenderness ratios changed from 31.2 to 41.6, the axial resistances were reduced in the range of 4% to 10%. This phenomenon was noted in the eccentric loaded column cases as well. For instance, when the slenderness ratios were increased from 31.2 to 41.6, the axial resistances of the eccentric loaded columns were reduced by 9%, to 16%. The increase in concrete strength in the column tended to significantly increase the axial compression capacity of the columns. The increase in concrete strength from 20 MPa to 40 MPa resulted in a notable increase in axial capacities, ranging from 60% to 75%. This percentage of increase in the axial resistance due to the increase in concrete strength was similar for eccentric loaded column cases. Also, an increase in the bar diameters (or reinforcement ratio) caused a marginal increase (in the range of 2% to 4%) in the axial capacities of the columns. The numerical predictions closely aligned with the analytical interaction curves, which implies that the numerical modelling procedure developed to analyse RC columns under concentric and eccentric conditions is rational.

4.2.2. Corroded RC Columns

In order to understand the reduction in the capacities of corroded RC columns under axial compression, the analysis was carried out on a set of 48 deteriorated RC column under concentric and eccentric axial loading conditions with different variables (concrete strengths, reinforcement detailing, and slenderness) and different corrosion scenarios, namely, the corrosion in the compressive and tension regions as illustrated in Figure 13. It should be noted that the stirrup corrosion was considered through reduced core concrete strength and a reduction in concrete section by cover loss. As the tensile strength of concrete is theoretically considered as zero, the loss of section in tension did not affect the capacity of the RC column critically. However, a significant effect was observed for corroded column cases where the corrosion was prevalent in the compressive region. The numerical predictions obtained in the parametric analyses of corroded columns in the compressive region are illustrated in Figure 14, with the respective modified corroded analytical interaction diagrams. From the results, it can be noted that the numerical predictions are slightly over-predicting the capacities of corroded columns compared to analytical derivations. This can be attributed to the fact that numerical predictions consider the non-linearities in the system and the theoretical interaction diagrams are derived based on conservative assumptions for stress blocks, neutral axis positions, and zero concrete tensile strength. Moreover, only part of the bottom portion of the numerical model is considered corroded, while the rest of the column is un-corroded; hence, the numerical model considers the member behaviour of the column in addition to the sectional behaviour, whereas analytical predictions are derived solely based on sectional analysis of the corroded section.
It can be understood from Figure 14 that the axial resistances of the corroded columns reduce as the slenderness ratios increase for the cases analysed, despite changes in the compressive strengths of concrete, reinforcement detailing considered. When, the slenderness ratios were changed from 31.2 to 41.6, the axial resistances were reduced in the range of 5% to 10% as compared to corroded. This phenomenon was noted in the eccentric loaded column cases as well. For instance, when the slenderness ratios were increased from 31.2 to 41.6, the axial resistances of the eccentric loaded columns reduced by 10% to 16%. The increase in concrete strength in the column tend to significantly increase the axial compression capacity of the columns regardless of the column being subjected to corrosion. Specifically, the increase in concrete strength from 20 MPa to 40 MPa has generally resulted in a 60% to 90% increase in axial capacities. This percentage of increase in the axial resistance due to increase in concrete strength was consistent for eccentric loaded column cases as well. Also, an increase in the bar diameters (or reinforcement ratio) had an insignificant effect with an increase in the range of 5% to 8% in the axial capacities of the columns.

4.2.3. Comparisons of Un-Corroded and Corroded Columns

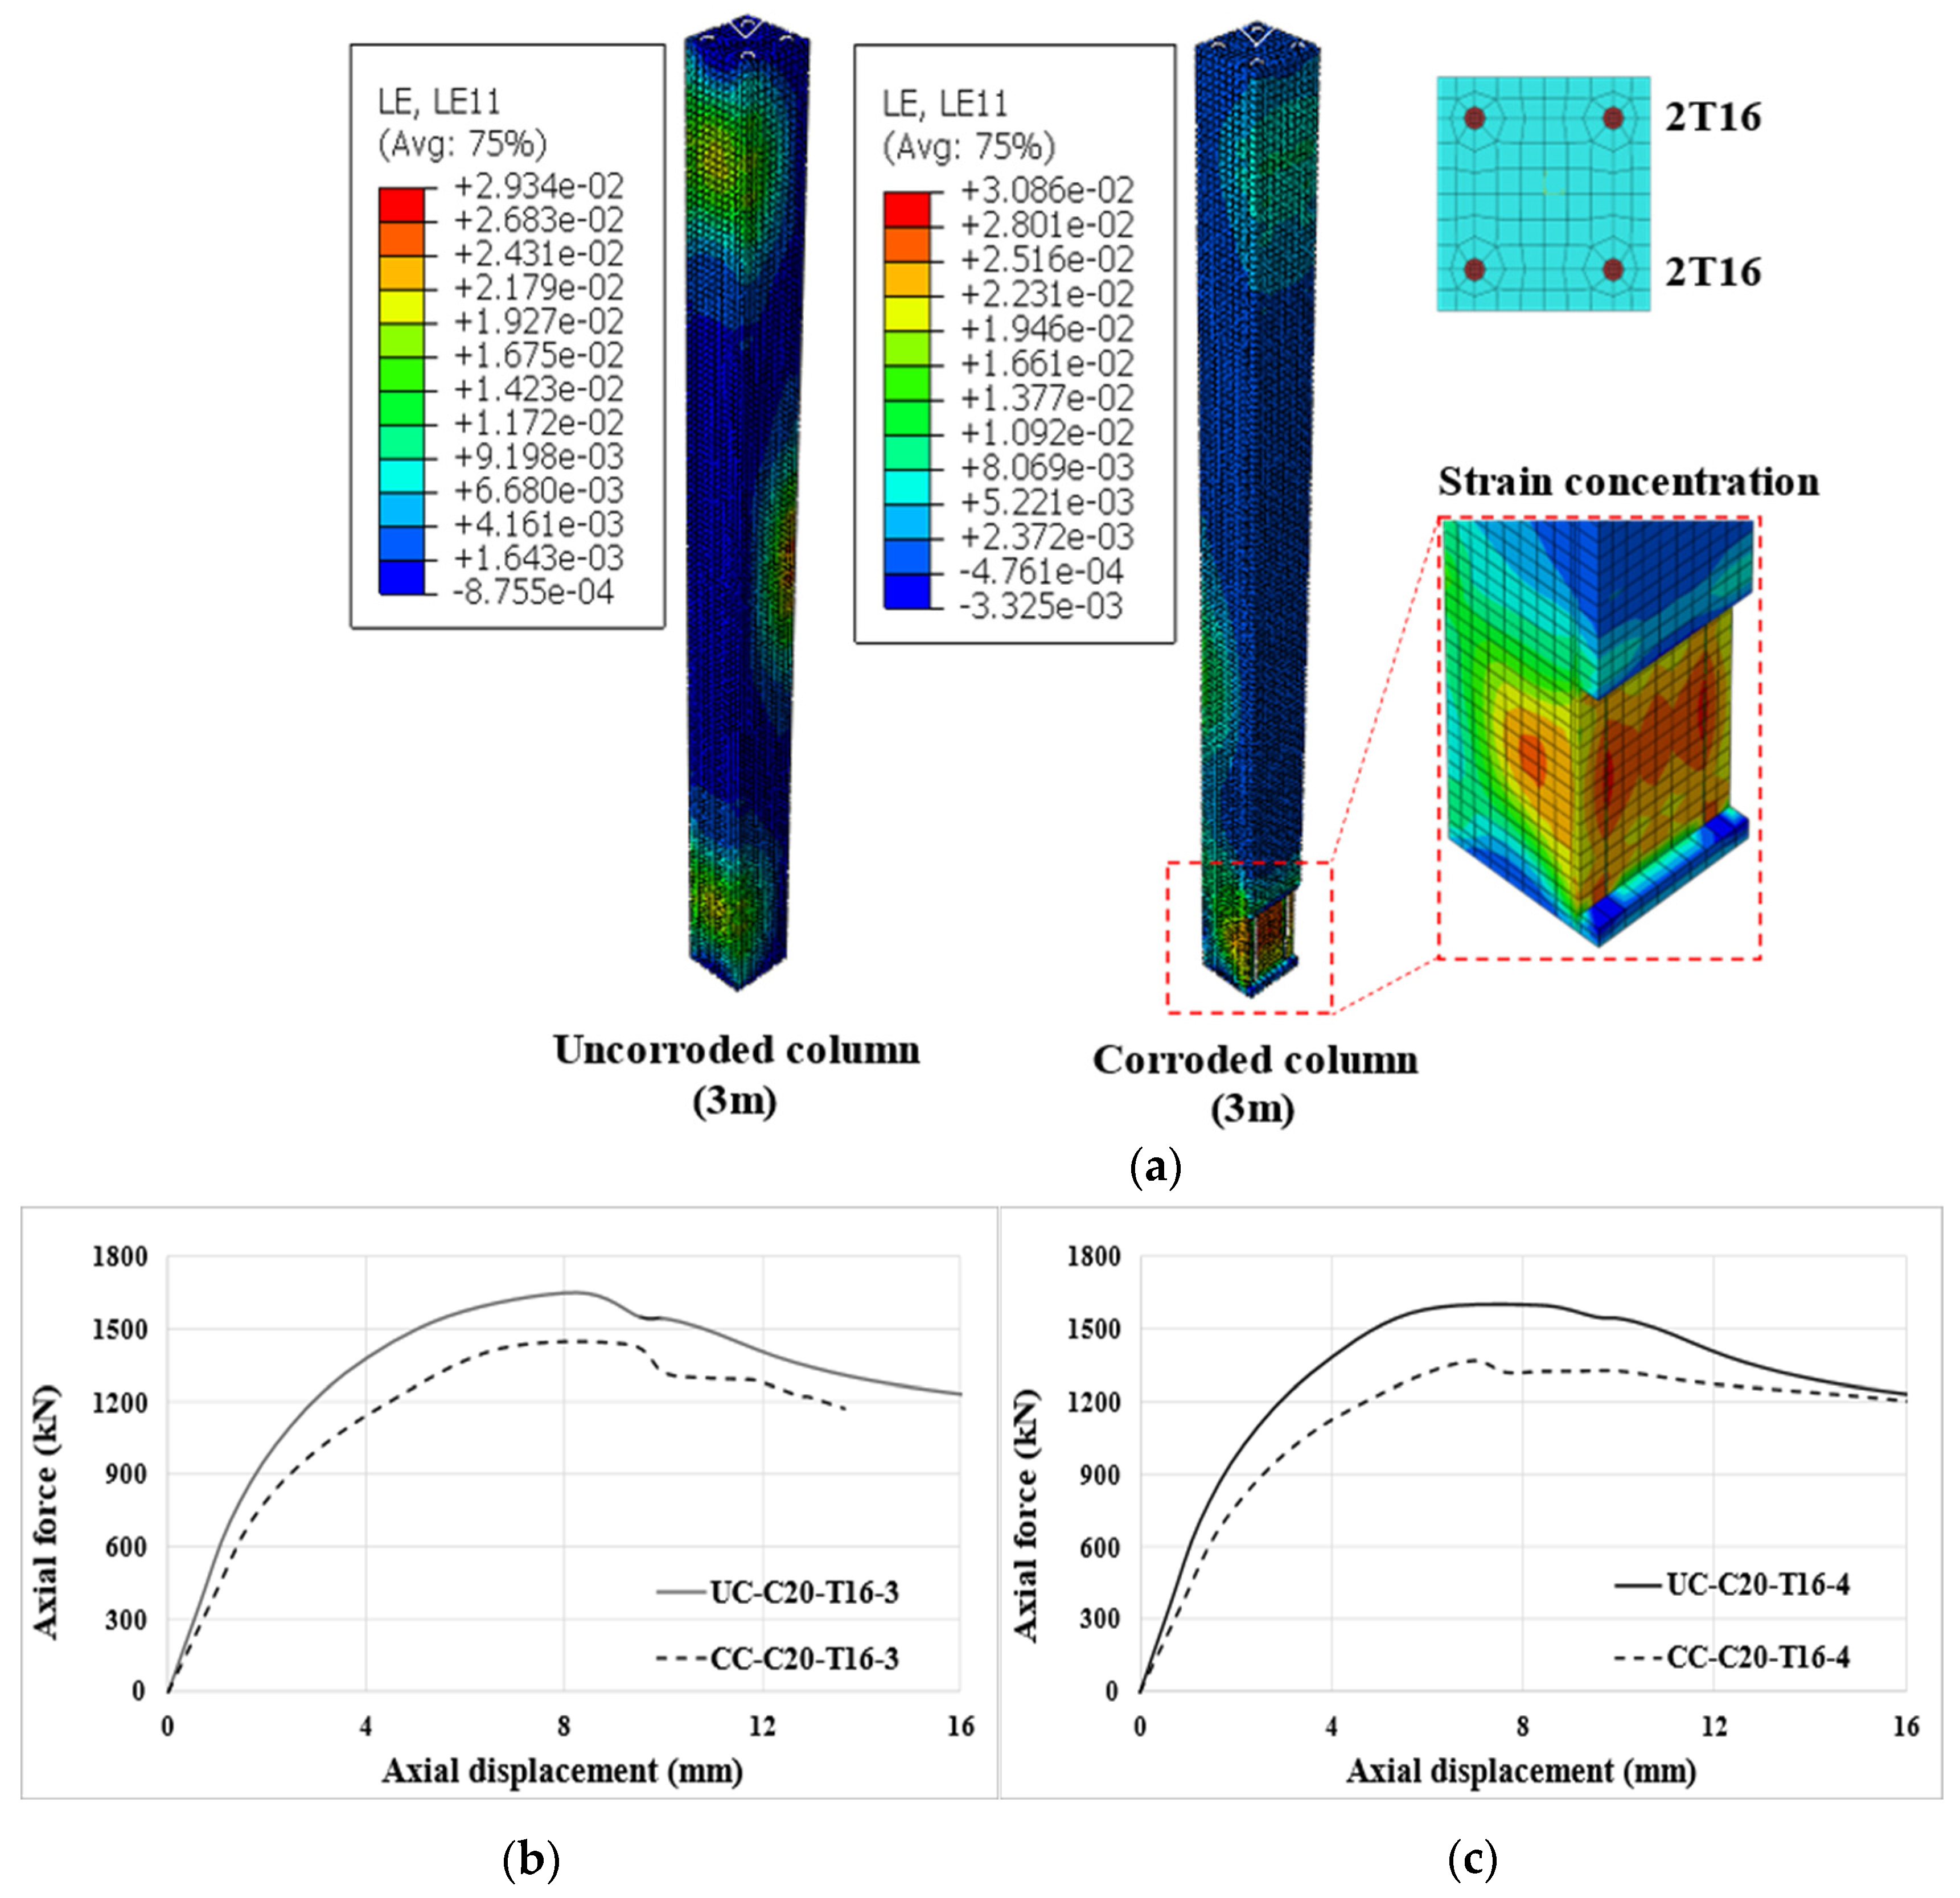
From the parametric analysis results, it is evident that the removal of cover concrete and lateral restrainers (i.e., stirrups) has reduced the axial capacities of the columns in the range of 5% to 20% under concentric loading. A similar pattern was observed for the eccentric load cases as well. For an elaborate understanding, the failure patterns, as well as the load-deflection responses of the parametrically analysed concentrically loaded un-corroded column and the corresponding corroded RC column cases, are shown together in Figure 15 for comparison. Figure 15a shows the failure pattern of 3 m high simulated RC columns (un-corroded and corroded). It can be noted that the stress state of the un-corroded column is quite uniform with strain concentrations equally distributed between the top and bottom corners, whereas in the corroded column, high-stress concentrations are noted around the region where the cover concrete and lateral ties were removed.
The axial load-deflection curves of both un-corroded and corroded RC columns are depicted in Figure 15b,c. It can be observed that for the same parameters investigated, the corroded RC columns show lower deformity than the corresponding un-corroded columns, highlights that the deficiency in axial capacity created due to the corrosion induced subsequently led to the lack of confinement to vertical bars, which may induce premature buckling at lesser axial capacities. The simulations of corroded scenarios considered are limited to cases (i.e., corrosion of stirrups about 300 mm from the bottom of the column). However, different corrosion scenarios can be expected in real practices and their influences should be examined to assess the structural behaviour of RC columns in future studies.

5. Summary and Conclusions

A 3D finite element-based numerical approach was developed to determine the axial capacities of square RC columns. A method was established to assess the capacities of RC columns with the stirrup corrosion scenarios. The methodology developed to evaluate the axial capacities of square RC columns incorporated the material failure as well as the buckling phenomenon under concentric and eccentric compression loading. The stirrup corrosion phenomenon was incorporated by removing the stirrups from the vertical reinforcement bars and assigning unconfined compressive strength properties to the core concrete. The developed numerical procedure was validated with an experimental study reported on the testing of un-corroded square RC columns under axial compression. Fairly good agreements were noted between the experimental and numerically predicted failure modes and axial capacities of validated RC columns.
Parametric analyses were conducted by varying the slenderness, the unconfined compressive strength of concrete, main steel reinforcement sizes, and eccentric loading conditions. An analytical solution for moment–axial compression interaction curves was derived (for un-corroded and corroded columns) and compared with the numerical predictions. In general, the numerically analysed cases slightly over-predicted the analytically determined M–N values; however, a similar trend was obtained to that of analytical predictions with different variables considered. The reason for the slight over-prediction could be due to the consideration of nonlinear properties in the numerical analysis, while in the analytical solution, the most conservative values were used. The parametric analyses of corroded square columns showed that the corrosion at the bottom (i.e., about 300 mm) of the columns (on either side) can reduce the axial and moment capacities in the range of 5% to 20% with different variables considered, such as slenderness, the unconfined compressive strength of concrete, and eccentric loading conditions.
The developed 3D numerical modelling method of RC columns has enabled to analyse the concentric and eccentric axial performances, along with the conservative analytical solutions. Also, the stirrup corrosion scenarios considered in this study are quite common deterioration phenomenon in RC columns; hence, this procedure can be used to assess the residual capacities of such columns to verify the risk of occupancy and the possible mitigation/strengthening method needed to restore the column capacities. The cases in the parametric studies considered were limited to certain variables, such as column cross-section shapes, reinforcement arrangements, corroded lengths, and slenderness. Also, it has to be mentioned that the analyses were carried out using an over-simplified approach of completely removing the stirrups when they were considered corroded. However, more detailed localised modelling can be carried at corroded locations to further verify the local behaviour of these corroded columns. In addition, more parametric analyses can be carried out using the method developed to assess the different stirrup corrosion scenarios observed in practice.

Author Contributions

Formal analysis, A.A., F.N. and J.T.; data curation, A.A., F.N., J.T. and T.Z.; writing—original draft, A.A., F.N. and J.T.; conceptualization, J.T.; investigation, M.A.; writing—review and editing, M.A. and T.Z. All authors have read and agreed to the published version of the manuscript.

Funding

This research received no external funding.

Data Availability Statement

The original contributions presented in the study are included in the article, further inquiries can be directed to the corresponding author.

Acknowledgments

The authors like to sincerely thank the technical support given by the Department of Civil Engineering, South Eastern University of Sri Lanka, Sri Lanka and high performance computer laboratory of School of Civil & Environmental Engineering, Queensland University of Technology, Australia.

Conflicts of Interest

The authors declare no conflicts of interest.

List of Notations

The following abbreviations are used in this manuscript:
RCReinforced concrete
FEFinite element
CDPConcrete damage plasticity
KNMTangential stiffness matrix
VMTrivial displacement solution of buckling modes
λiEigenvalue of an ith mode
PcrCritical buckling load
QTotal axial load
σcr Euler’s critical buckling load
nRestraint factor
EYoung’s modulus
IMoment of inertia
leEffective length of the column
fr,eff Effective lateral confining stresses
keConfinement effectiveness coefficient
Ae Area of effectively confined concrete core
ACC Area of core concrete
fr Lateral confining stress
Atr Total area of transverse bars running in the respective directions (x and y)
fy Yield strength of the transverse reinforcement
s Centre-to-centre spacing of stirrups
dC Core dimensions to centrelines of perimeter hoop
fcc′ Maximum concrete stress
εcc Strain corresponding to maximum concrete stress
fc Confined concrete stress
εc Longitudinal compressive concrete strain
Ec Tangent modulus of elasticity of concrete
hWidth of the column
ϕDiameter of the vertical bar
bLength of the column cross-section
As′ Cross-sectional area of compression reinforcement
As Cross-sectional area of tension reinforcement
εsc Compressive strain in reinforcement As′
εs Tensile or compressive strain in reinforcement As
x Neutral axis depth
d′Depth of compression reinforcement
d Effective depth of tension reinforcement
Fcc Compressive force acting through the centroid of the stress block
Fsc Compressive force in the reinforcement area As′ and acting through its centroid
Fs Tensile or compressive force in the reinforcement acting through its centroid
fck,uncon Characteristic unconfined concrete compressive strength
fck,confined Characteristic confined concrete compressive strength
Auncon″ Area corresponding to unconfined concrete zone
Acon″Area corresponding to confined concrete zone
N Axial compressive force
M Moment
x ¯ p Plastic centroid depth
l0Effective height of column
r Radius of gyration
λs Slenderness of the column

Appendix A

Table A1. Bar properties used.
Grade of Concrete
Unconfined Strength (MPa)
16 mm Bar20 mm Bar
2024.425
4044.846

Appendix B

Table A2. Parametric results of RC columns under concentric compression.
NomenclatureAxial Capacity (kN)Lateral Deflection (mm)NomenclatureAxial Capacity (kN)Lateral Deflection (mm)
UC-C20-T16-316532.02CC-C20-T16-314362.32
UC-C20-T16-416022.49CC-C20-T16-413672.91
UC-C40-T16-328992.16CC-C40-T16-326542.65
UC-C40-T16-427272.92CC-C40-T16-425133.14
UC-C20-T20-318572.16CC-C20-T20-316782.74
UC-C20-T20-416873.05CC-C20-T20-414973.28
UC-C40-T20-329761.96CC-C40-T20-327032.69
UC-C40-T20-427652.85CC-C40-T20-426303.33
Table A3. Parametric results of RC columns under eccentric compression (h/6).
NomenclatureAxial Capacity (kN)Lateral Deflection (mm)NomenclatureAxial Capacity (kN)Lateral Deflection (mm)
UC-C20-T16-3-h/611252.81CC-C20-T16-3-h/69653.03
UC-C20-T16-4-h/610143.35CC-C20-T16-4-h/68763.69
UC-C40-T16-3-h/622782.72CC-C40-T16-3-h/620193.12
UC-C40-T16-4-h/620573.20CC-C40-T16-4-h/618673.82
UC-C20-T20-3-h/613082.95CC-C20-T20-3-h/611782.99
UC-C20-T20-4-h/611563.26CC-C20-T20-4-h/69873.81
UC-C40-T20-3-h/623762.55CC-C40-T20-3-h/621323.16
UC-C40-T20-4-h/621073.02CC-C40-T20-4-h/619764.05

References

  1. Li, J.; Hao, H.; Wu, C. Numerical study of precast segmental column under blast loads. Eng. Struct. 2017, 134, 125–137. [Google Scholar] [CrossRef]
  2. Li, C.; Bi, K.; Hao, H. Seismic performances of precast segmental column under bidirectional earthquake motions: Shake table test and numerical evaluation. Eng. Struct. 2019, 187, 314–328. [Google Scholar] [CrossRef]
  3. Thilakarathna, H.M.I.; Thambiratnam, D.P.; Dhandasekar, M.; Perera, N. Numerical simulation of axially loaded concrete columns under transverse impact and vulnerability assessment. Int. J. Impact Eng. 2010, 37, 1100–1112. [Google Scholar] [CrossRef]
  4. Chauhan, A.; Sharma, U.K. Influence of temperature and relative humidity variations on non-uniform corrosion of reinforced concrete. Structures 2019, 19, 296–308. [Google Scholar] [CrossRef]
  5. Li, D.; Wei, R.; Li, L.; Guan, X.; Mi, X. Pitting corrosion of reinforcing steel bars in chloride contaminated concrete. Constr. Build. Mater. 2019, 199, 359–368. [Google Scholar] [CrossRef]
  6. Suzuki, A.; Liao, W.; Shibata, S.; Yoshino, Y.; Kimura, Y.; Shimoi, N. Structural damage detection technique of secondary building components using piezoelectric sensors. Buildings 2023, 13, 2368. [Google Scholar] [CrossRef]
  7. Vu, N.S.; Li, B. Seismic performance assessment of corroded reinforced concrete short columns. Eng. Struct. 2018, 144, 04018018. [Google Scholar] [CrossRef]
  8. Firouzi, A.; Abdolhosseini, M.; Ayazian, R. Service life prediction of corrosion-affected reinforced concrete columns based on time-dependent reliability analysis. Eng. Fail. Anal. 2020, 117, 104944. [Google Scholar] [CrossRef]
  9. Li, D.; Wei, R.; Xing, F.; Sui, L.; Zhou, Y.; Wang, W. Influence of Non-uniform corrosion of steel bars on the seismic behavior of reinforced concrete columns. Constr. Build. Mater. 2018, 167, 20–23. [Google Scholar] [CrossRef]
  10. Wu, X.; Chen, L.; Li, H.; Xu, J. Experimental study of the mechanical properties of reinforced concrete compression members under the combined action of sustained load and corrosion. Constr. Build. Mater. 2019, 202, 11–22. [Google Scholar] [CrossRef]
  11. Chotickai, P.; Tongya, P.; Jantharaksa, S. Performance of corroded rectangular RC columns strengthened with CFRP composite under eccentric loading. Constr. Build. Mater. 2021, 268, 121134. [Google Scholar] [CrossRef]
  12. Tapan, M.; Aboutaha, R.S. Effect of steel corrosion and loss of concrete cover on strength of deteriorated RC Columns. Constr. Build. Mater. 2011, 25, 2596–2603. [Google Scholar] [CrossRef]
  13. Li, P.; Ren, Y.; Zhou, Y.; Zhu, Z.; Chen, Y. Experimental study on the mechanical properties of corroded RC columns repaired with large rupture strain FRP. J. Build. Eng. 2022, 54, 104413. [Google Scholar] [CrossRef]
  14. Cao, Q.; Jia, J.; Zhang, L.; Ye, H.; Lv, X. Experimental study of axial compression of reinforced concrete columns made by environment-friendly post-filling coarse aggregate process. Struct. Concr. 2021, 22, 1671–1687. [Google Scholar] [CrossRef]
  15. Li, Q.; Huang, L.; Ye, H.; Fu, C.; Jin, X. Mechanical degradation of reinforced concrete columns corroded under sustained loads. Int. J. Civ. Eng. 2020, 18, 883–901. [Google Scholar] [CrossRef]
  16. Zhang, G.; Cao, X.; Fu, Q. Experimental study on residual strength of concrete confined with corroded stirrups. Can. J. Civ. Eng. 2016, 43, 583–590. [Google Scholar] [CrossRef]
  17. Mander, J.B.; Priestley, M.J.; Park, R. Observed stress-strain behavior of confined concrete. J. Struct. Eng. 1988, 114, 1827–1849. [Google Scholar] [CrossRef]
  18. Rajput, A.S.; Sharma, U.K. Corroded reinforced concrete columns under simulated seismic loading. Eng. Struct. 2018, 171, 453–463. [Google Scholar] [CrossRef]
  19. Yang, S.Y.; Song, X.B.; Jia, H.X.; Chen, X.; Liu, X.L. Experimental research on hysteretic behaviors of corroded reinforced concrete columns with different maximum amounts of corrosion of Rebar. Constr. Build. Mater. 2016, 121, 319–327. [Google Scholar] [CrossRef]
  20. Feng, R.; Zhang, J.; Li, Y.; Zhu, J.H. Experimental study on hysteretic behavior for corroded circular RC columns retrofitted by ICCP-SS. Structures 2022, 35, 421–435. [Google Scholar] [CrossRef]
  21. Guo, L.; Guo, W.; Chen, D.; Wang, K.; Yu, L. Experimental study on reinforced concrete small-eccentricity compressive column after acid rain corrosion. J. Build. Eng. 2024, 83, 108331. [Google Scholar] [CrossRef]
  22. Suzuki, A.; Shibata, D.; Zhong, X.; Kimura, Y. Buckling strength of compression members considering mechanical performance variations by heat exposure. J. Constr. Steel Res. 2025, 226, 109269. [Google Scholar] [CrossRef]
  23. Rao, A.S.; Lepech, M.D.; Kiremidjian, A.S.; Sun, X.Y. Simplified structural deterioration model for reinforced concrete bridge piers under cyclic loading. Struct. Infrastruct. Eng. 2016, 13, 55–66. [Google Scholar] [CrossRef]
  24. Vu, N.S.; Yu, B.; Li, B. Prediction of strength and drift capacity of corroded reinforced concrete columns. Constr. Build. Mater. 2016, 115, 304–318. [Google Scholar] [CrossRef]
  25. Mohammed, A.; Almansour, H.; Martín-Pérez, B. Simplified finite element model for evaluation of ultimate capacity of corrosion-damaged reinforced concrete beam-columns. Int. J. Adv. Struct. 2018, 10, 381–400. [Google Scholar] [CrossRef]
  26. Alabduljabbar, H.; Haido, J.H.; Alyousef, R.; Yousif, S.T.; McConnell, J.; Wakil, K.; Jermsittiparsert, K. Prediction of the flexural behavior of corroded concrete beams using combined method. Structures 2020, 25, 1000–1008. [Google Scholar] [CrossRef]
  27. Kagermanov, A.; Markovic, I. An overview on finite element-modelling techniques for structural capacity assessment of corroded reinforced concrete structures. Struct. Infrastruct. Eng. 2022, 19, 1585–1599. [Google Scholar] [CrossRef]
  28. BaniAsad, E.; Dehestani, M. Incorporation of corrosion and bond-slip effects in properties of reinforcing element embedded in concrete beams. Structures 2019, 20, 105–115. [Google Scholar] [CrossRef]
  29. Kyaure, M.; Abed, F. Finite element parametric analysis of RC columns strengthened with FRCM. Compo. Struct. 2021, 275, 114498. [Google Scholar] [CrossRef]
  30. Li, Y.; Liu, J.; Wang, Z.; Su, Y. Axial compression mesoscale modelling of RC columns after reinforcement-electrochemical chloride extraction. Structures 2021, 31, 876–890. [Google Scholar] [CrossRef]
  31. Asad, M.; Zahra, T.; Thamboo, J.; Song, M. Finite element modelling of reinforced masonry walls under axial compression. Eng. Struct. 2022, 252, 113594. [Google Scholar] [CrossRef]
  32. ABAQUS, Finite Element Software Documentation; Dassault Systèmes, Simulia: Johnston, RI, USA, 2017.
  33. Mohamed, M.S.; Thamboo, J.A.; Jeyakaran, T. Experimental and numerical assessment of the flexural behaviour of semi-precast-reinforced concrete slabs. Adv. Struct. Eng. 2020, 23, 1865–1879. [Google Scholar] [CrossRef]
  34. Le Minh, H.; Khatir, S.; Abdel Wahab, M.; Cuong-Le, T. A concrete damage plasticity model for predicting the effects of compressive high-strength concrete under static and dynamic loads. J. Build. Eng. 2021, 44, 103239. [Google Scholar] [CrossRef]
  35. Halahla, A.M.; Abu Tahnat, Y.B.; Almasri, A.H.; Voyiadjis, G.Z. The effect of shape memory alloys on the ductility of exterior reinforced concrete beam-column joints using the damage plasticity model. Eng. Struct. 2019, 200, 109676. [Google Scholar] [CrossRef]
  36. Kang, S.B.; Tan, K.H. Bond–slip behaviour of deformed reinforcing bars embedded in well-confined concrete. Mag. Concr. Res. 2016, 68, 515–529. [Google Scholar] [CrossRef]
  37. ElMandooh Galal, K.; Ghobarah, A. Flexural and shear hysteretic behaviour of reinforced concrete columns with variable axial load. Eng. Struct. 2003, 25, 1353–1367. [Google Scholar] [CrossRef]
  38. Rodriguez, J.; Ortega, L.M.; Casal, J. Load bearing capacity of concrete columns with corroded reinforcement. In Proceedings of the 4th International Symposium on Corrosion of Reinforcement in Concrete Construction, Cambridge, UK, 1–4 July 1996; pp. 220–230. [Google Scholar]
  39. Liu, Y.; Hao, H.; Hao, Y. Damage prediction of RC columns with various levels of corrosion deteriorations subjected to blast loading. J. Build. Eng. 2023, 83, 108019. [Google Scholar] [CrossRef]
  40. EN 1992-1-1; Eurocode 2. Design of Concrete Structures—Part 1–1: General Rules and Rules for Buildings. British Standards Institution: London, UK, 2004.
  41. Mander, J.B.; Priestley, M.J.; Park, R. Theoretical stress-strain model for confined concrete. J. Struct. Eng. 1988, 114, 1804–1826. [Google Scholar] [CrossRef]
  42. Massicotte, B.; Elwi, A.E.; MacGregor, J.G. Tension-stiffening model for planar reinforced concrete members. J. Struct. Eng. 1990, 116, 3039–3058. [Google Scholar] [CrossRef]
  43. Mosley, W.H.; Bungey, J.H.; Hulse, R. Reinforced Concrete Design; Macmillan: Basingstoke: UK, 1999. [Google Scholar]
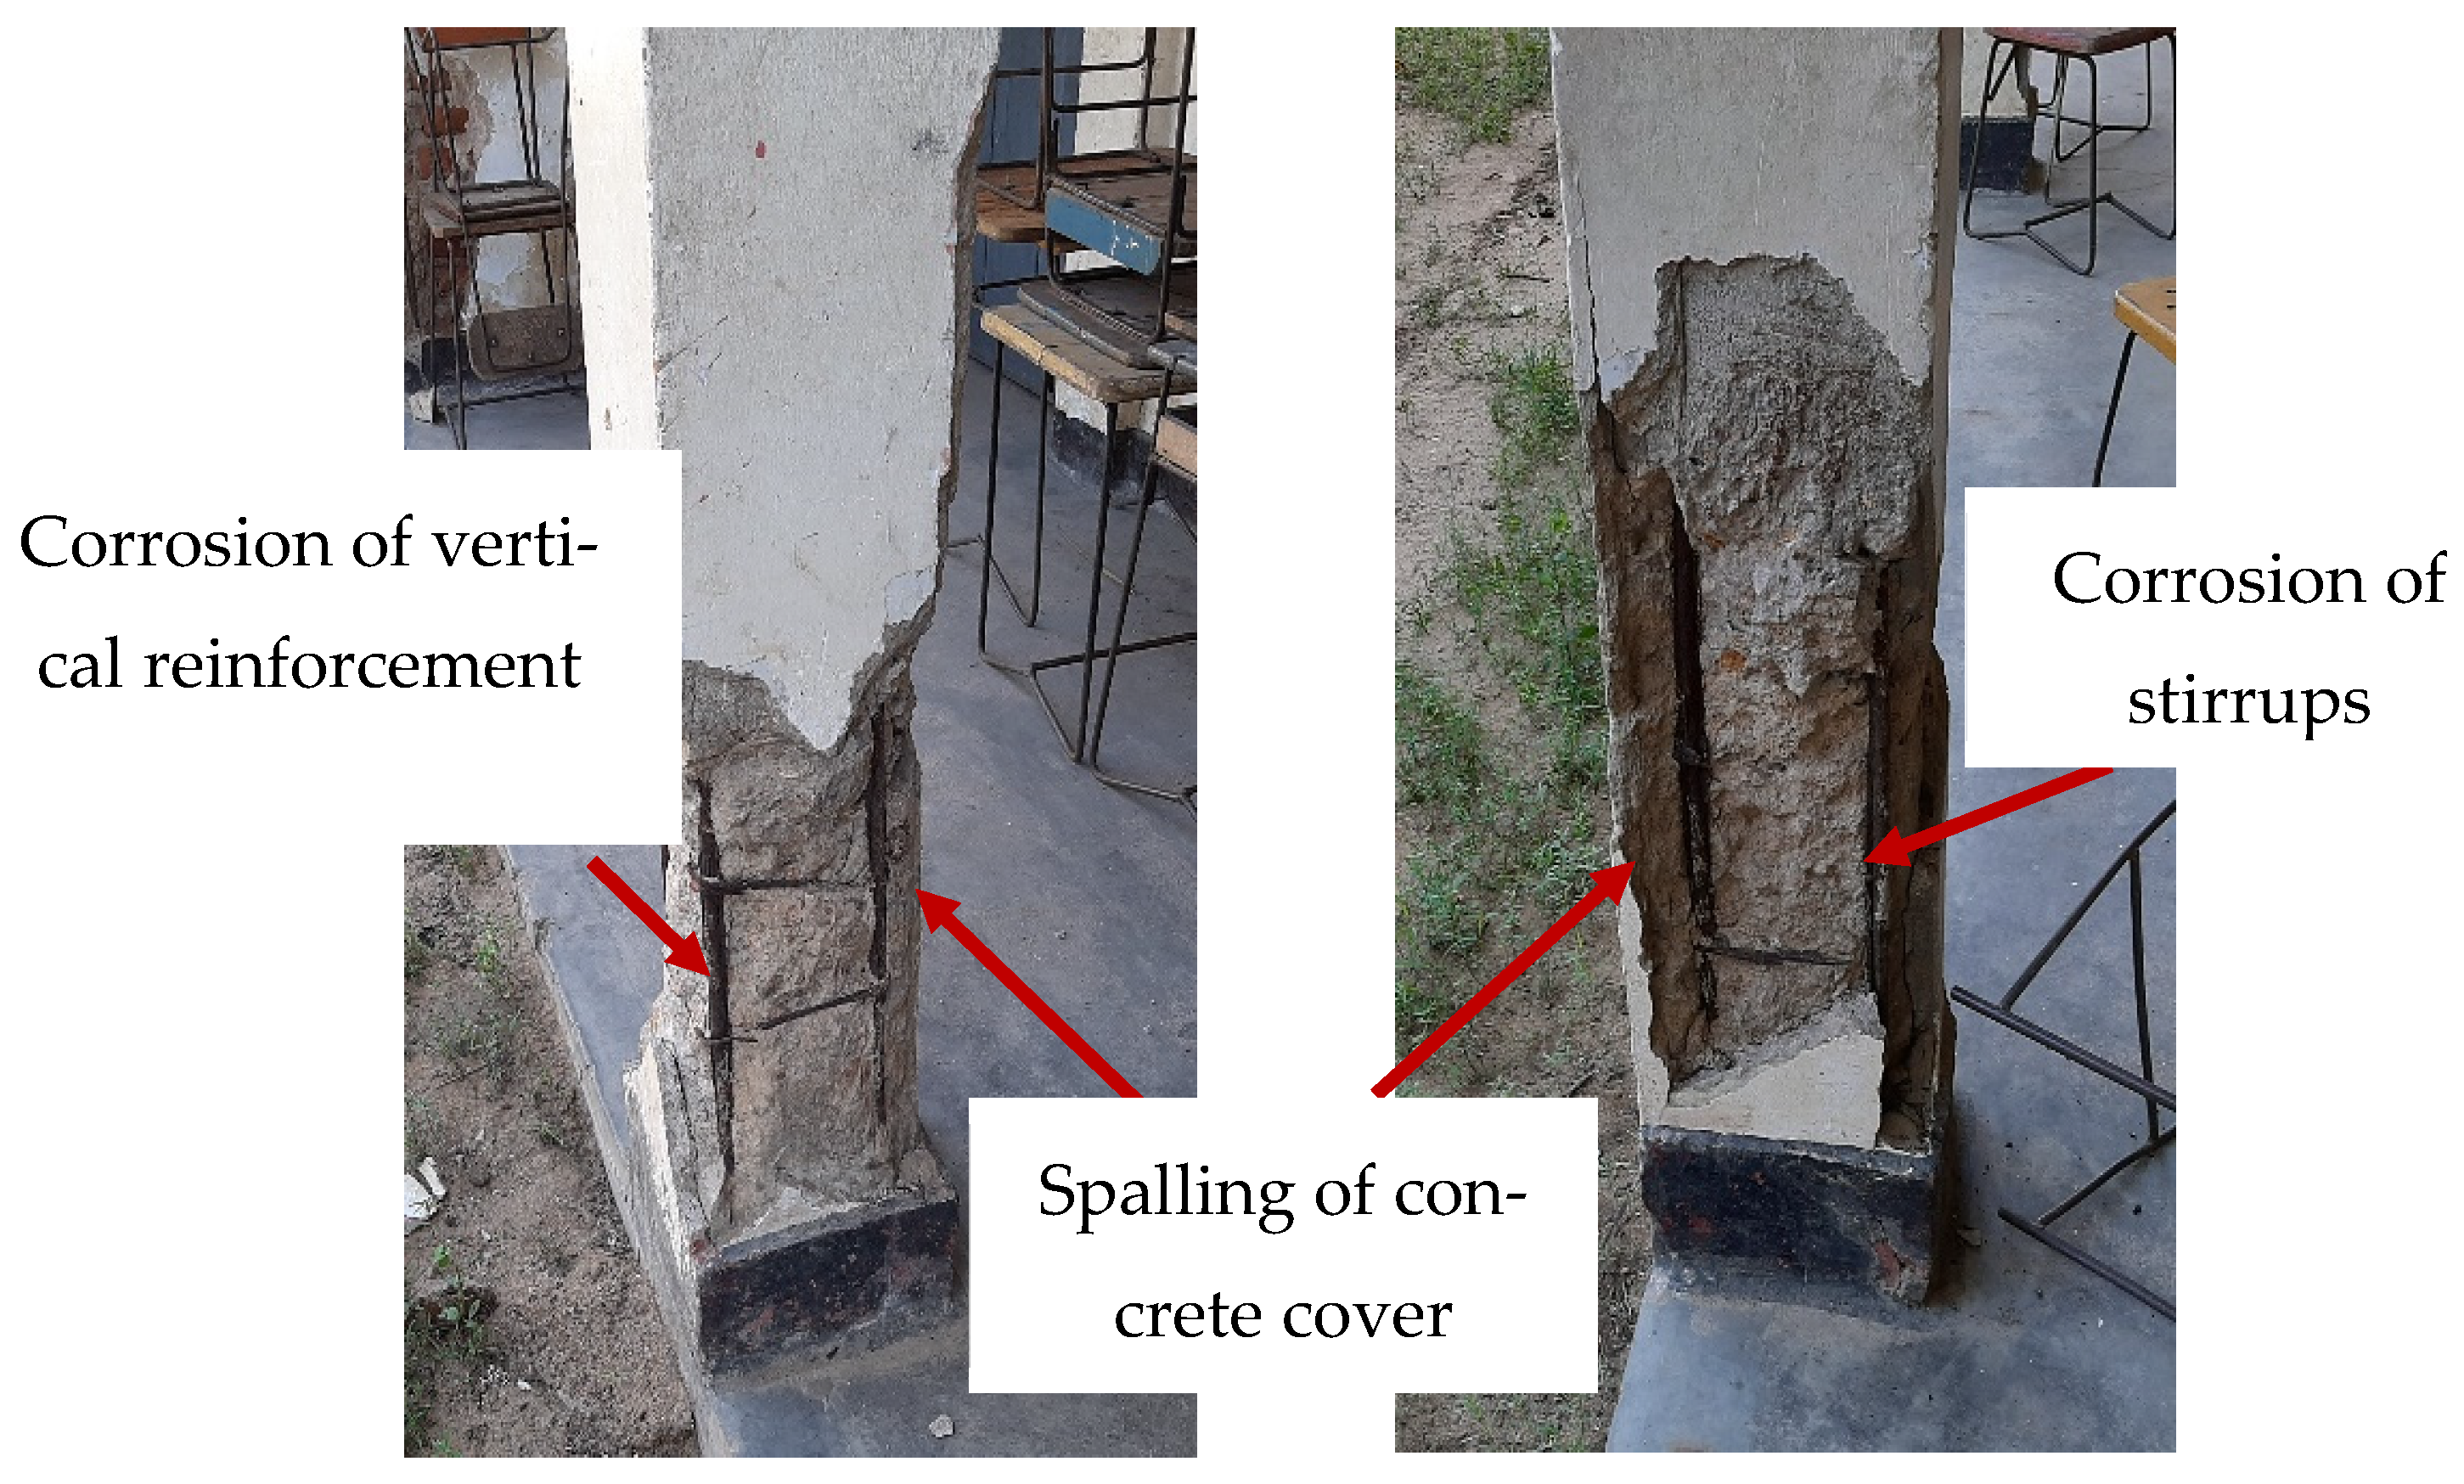
Figure 1. Corrosions noticed in RC columns.
Buildings 15 00579 g001
Figure 2. Buckling analysis of steel bar: (a) model geometry; (b) buckling modes.
Buildings 15 00579 g002
Figure 3. Details of the model: (a) model geometry; (b) meshing.
Buildings 15 00579 g003
Figure 4. Concept of modelling stirrup-corroded RC columns: (a) deletion of cover concrete; (b) removal of lateral restrainers.
Buildings 15 00579 g004
Figure 5. Scheme of column specimen: (a) Type 1 and Type 2; (b) FE models; (c) loading arrangement.
Buildings 15 00579 g005
Figure 6. Confined strength determination for a rectangular section from lateral confining stresses [37].
Buildings 15 00579 g006
Figure 7. Constitutive material models assigned to (a) compression behaviour of concrete; (b) tensile behaviour of concrete; (c) steel.
Buildings 15 00579 g007
Figure 8. Comparisons of experimental and FE model failure modes: (a) experimental testing; (b) FE model.
Buildings 15 00579 g008
Figure 9. Comparison of experimental and FE axial load-deflection response of columns (a) Type 1 and (b) Type 2.
Buildings 15 00579 g009
Figure 10. RC column configurations analysed: (a) column cross-sections; (b) boundary conditions with respective loading points.
Buildings 15 00579 g010
Figure 11. Cross-section of the member with stress and strain profile: (a) S < h; (b) S > h.
Buildings 15 00579 g011
Figure 12. Comparisons of theoretical interaction (N–M) diagrams with numerical simulations of un-corroded columns of (a) 20 MPa concrete strength with 16 mm reinforcement bars, (b) 40 MPa concrete strength with 16 mm reinforcement bars, (c) 20 MPa concrete strength with 20 mm reinforcement bars, and (d) 40 MPa concrete strength with 20 mm reinforcement bars.
Buildings 15 00579 g012
Figure 13. Corrosion scenarios considered in the numerical simulations: (a) cover lost and stirrup corrosion in compression; (b) cover lost and stirrup corrosion in tension.
Buildings 15 00579 g013
Figure 14. Comparisons of theoretical interaction (N–M) diagrams with numerical simulations of corroded columns of (a) 20 MPa concrete strength with 16 mm reinforcement bars, (b) 40 MPa concrete strength with 16 mm reinforcement bars, (c) 20 MPa concrete strength with 20 mm reinforcement bars, and (d) 40 MPa concrete strength with 20 mm reinforcement bars.
Buildings 15 00579 g014
Figure 15. Load deflection behaviour of the analysed RC columns: (a) failure patterns of un-corroded and corroded columns; (b) load displacement relationship of un-corroded and corroded columns of 3 m height; (c) load displacement relationship of un-corroded and corroded columns of 4 m height.
Buildings 15 00579 g015
Table 1. Comparison of predicted buckling load and Euler’s theoretical buckling load.
Mode of BucklingAxial Load Q (kN)Eigenvalue ( λ i ) P c r FE Result (kN) P c r Theoretical (kN)Error (%)
10.2017.91.581.590.77
20.20131.46.316.360.79
30.20170.614.1914.300.82
Table 2. Material parameters used in the FE model of RC columns.
MaterialParameters (MPa)Values
Type 1Type 2
Unconfined concreteCompressive strength3034
Tensile strength2.93.2
Young’s modulus26,00028,000
Confined concreteCompressive strength3335.4
Tensile strength2.93.2
Young’s modulus30,00030,000
Main reinforcementYield strength550550
Young’s modulus200,000200,000
StirrupsYield strength550550
Young’s modulus200,000200,000
CDP model parameters
ConcreteDilation angle36°36°
Eccentricity0.10.1
Strength ratio1.161.16
Shape factor0.670.67
Viscosity0.0020.002
Disclaimer/Publisher’s Note: The statements, opinions and data contained in all publications are solely those of the individual author(s) and contributor(s) and not of MDPI and/or the editor(s). MDPI and/or the editor(s) disclaim responsibility for any injury to people or property resulting from any ideas, methods, instructions or products referred to in the content.