
Thermal Resilience of Public Building Atriums Under Different States During Heatwaves


Abstract
:1. Introduction
1.1. Literature Review
1.2. Research Gaps and Objectives
- Analyzing the temperature variation characteristics of atrium spaces in closed and open states during heatwaves.
- Investigating the differences in thermal resilience across the various regions of the atrium space under different conditions.
- Analyzing the performance of thermal resilience indicators under different states and their interrelationships with various environmental data.
2. Materials and Methods
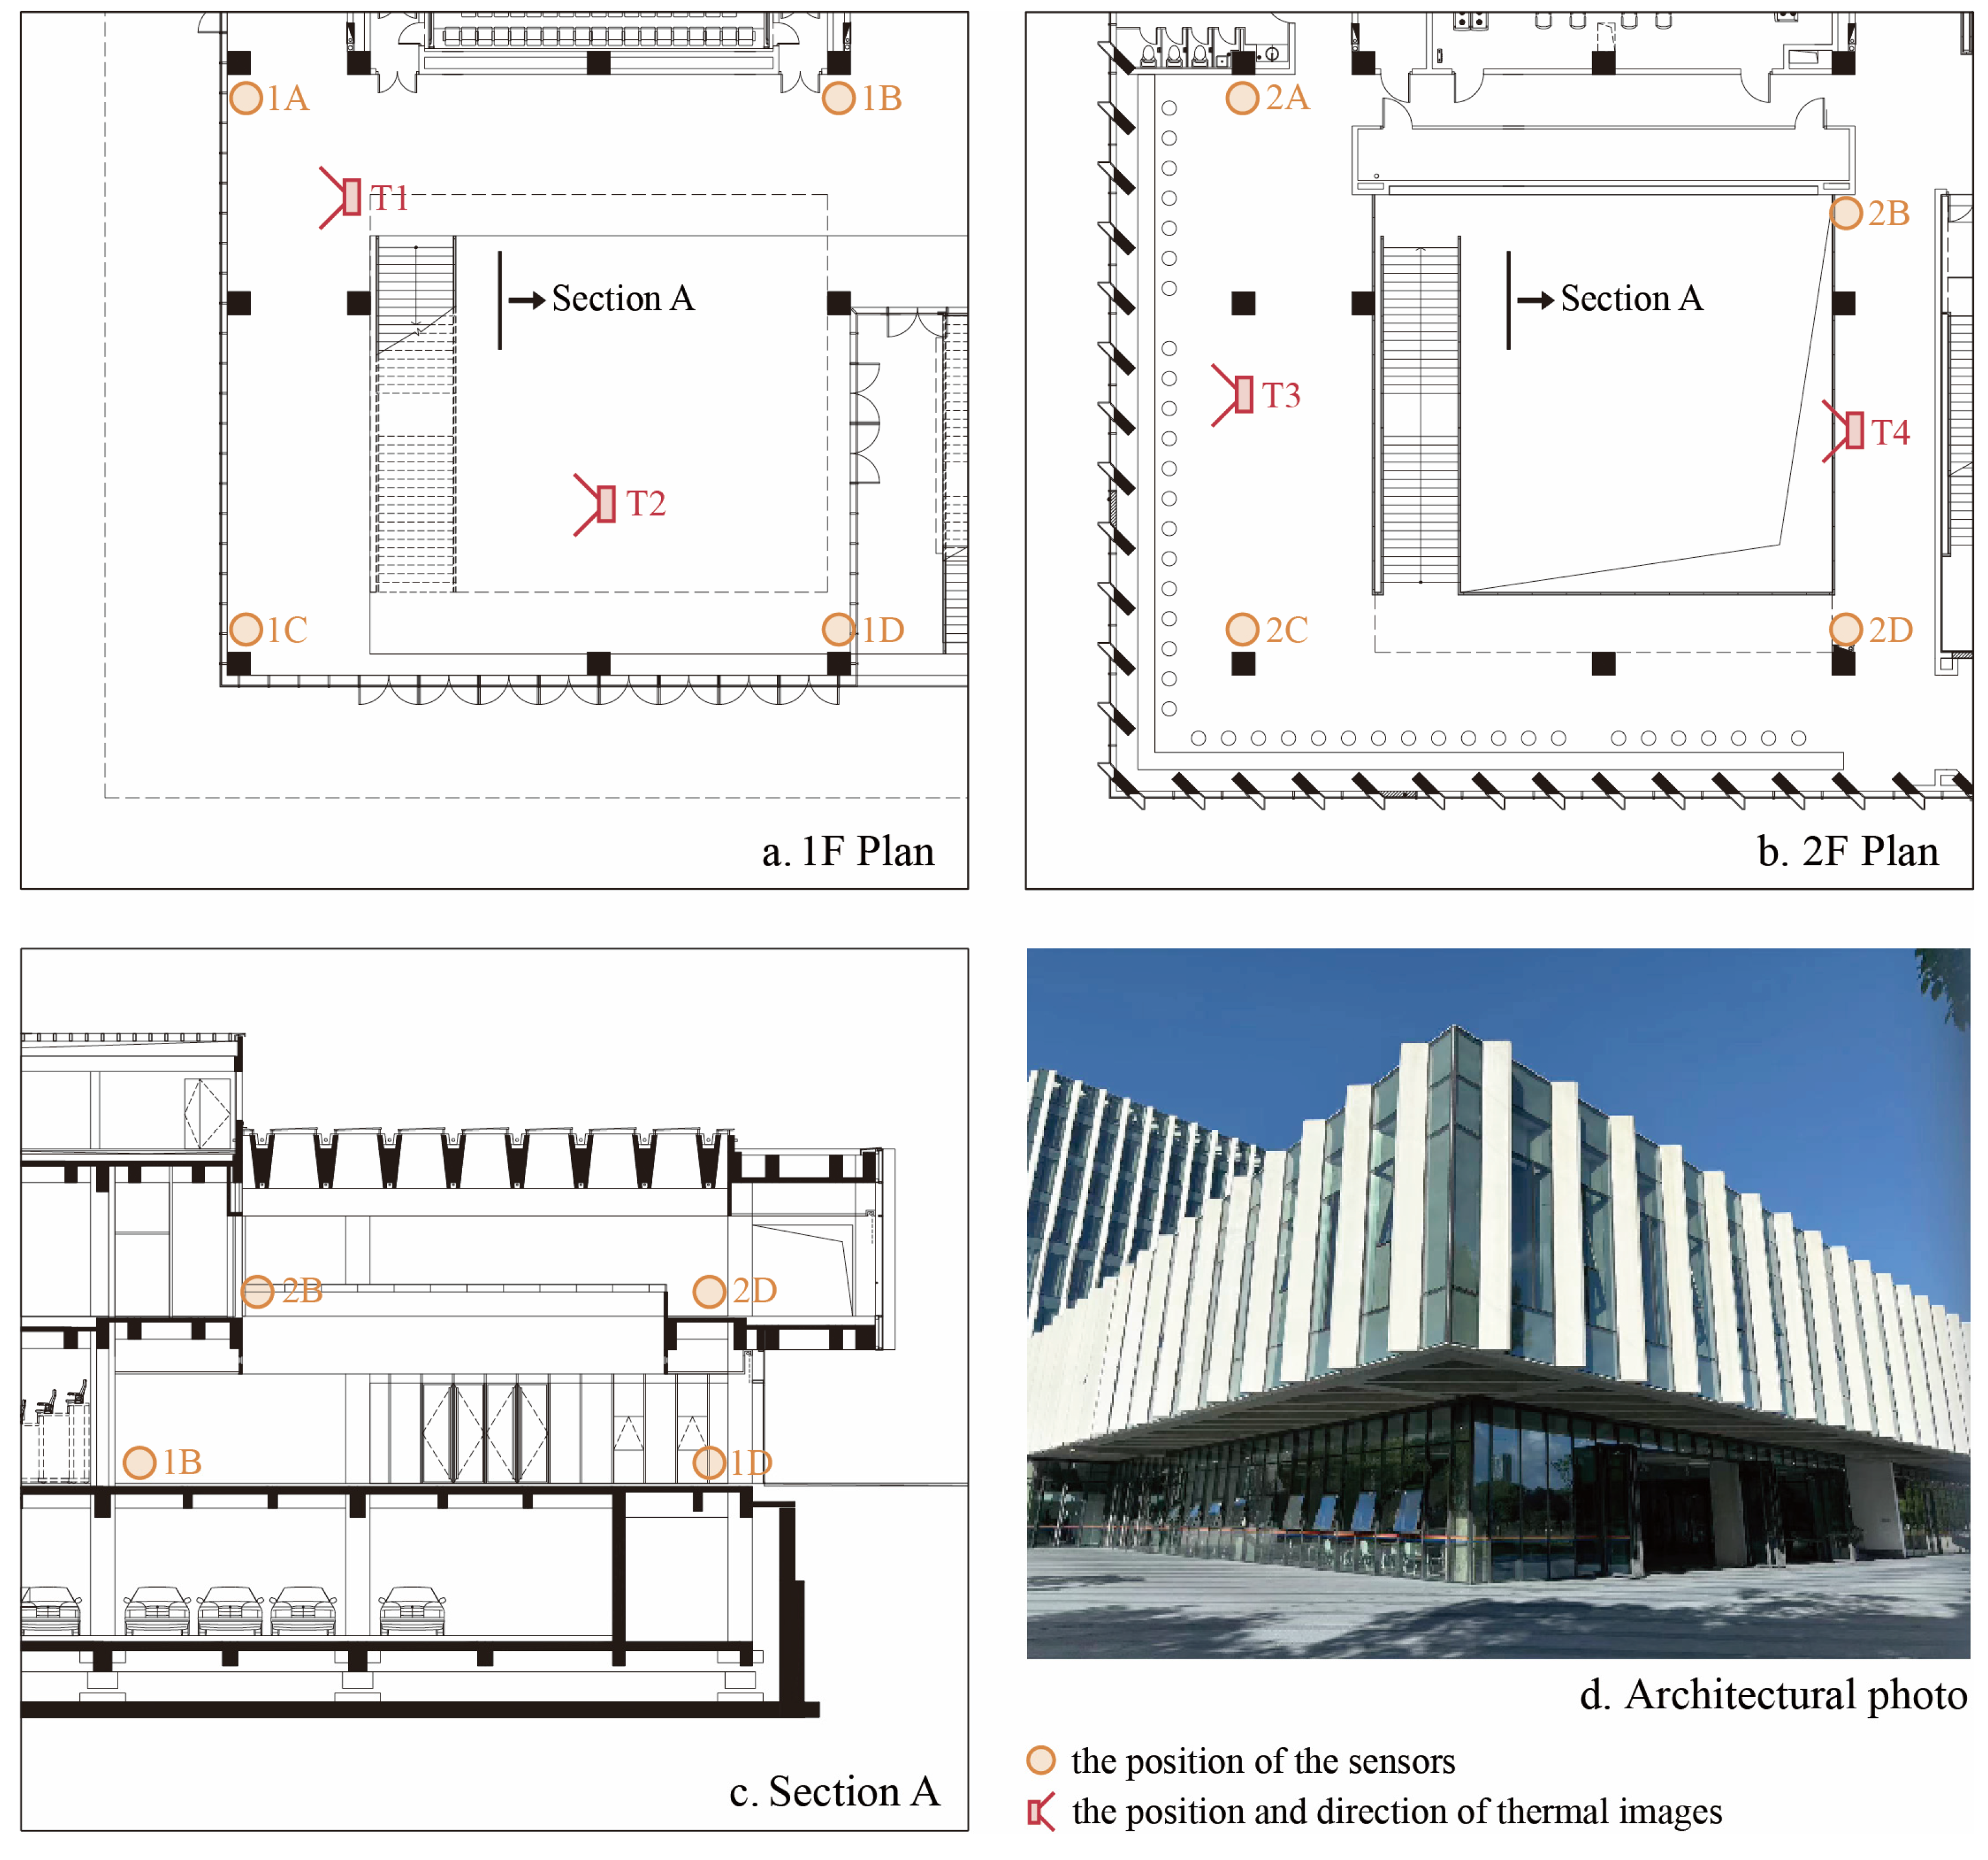
2.1. Building and Climate Description
2.2. Data Acquisition
2.2.1. Standards for Heatwaves
2.2.2. Measured Indoor Temperatures
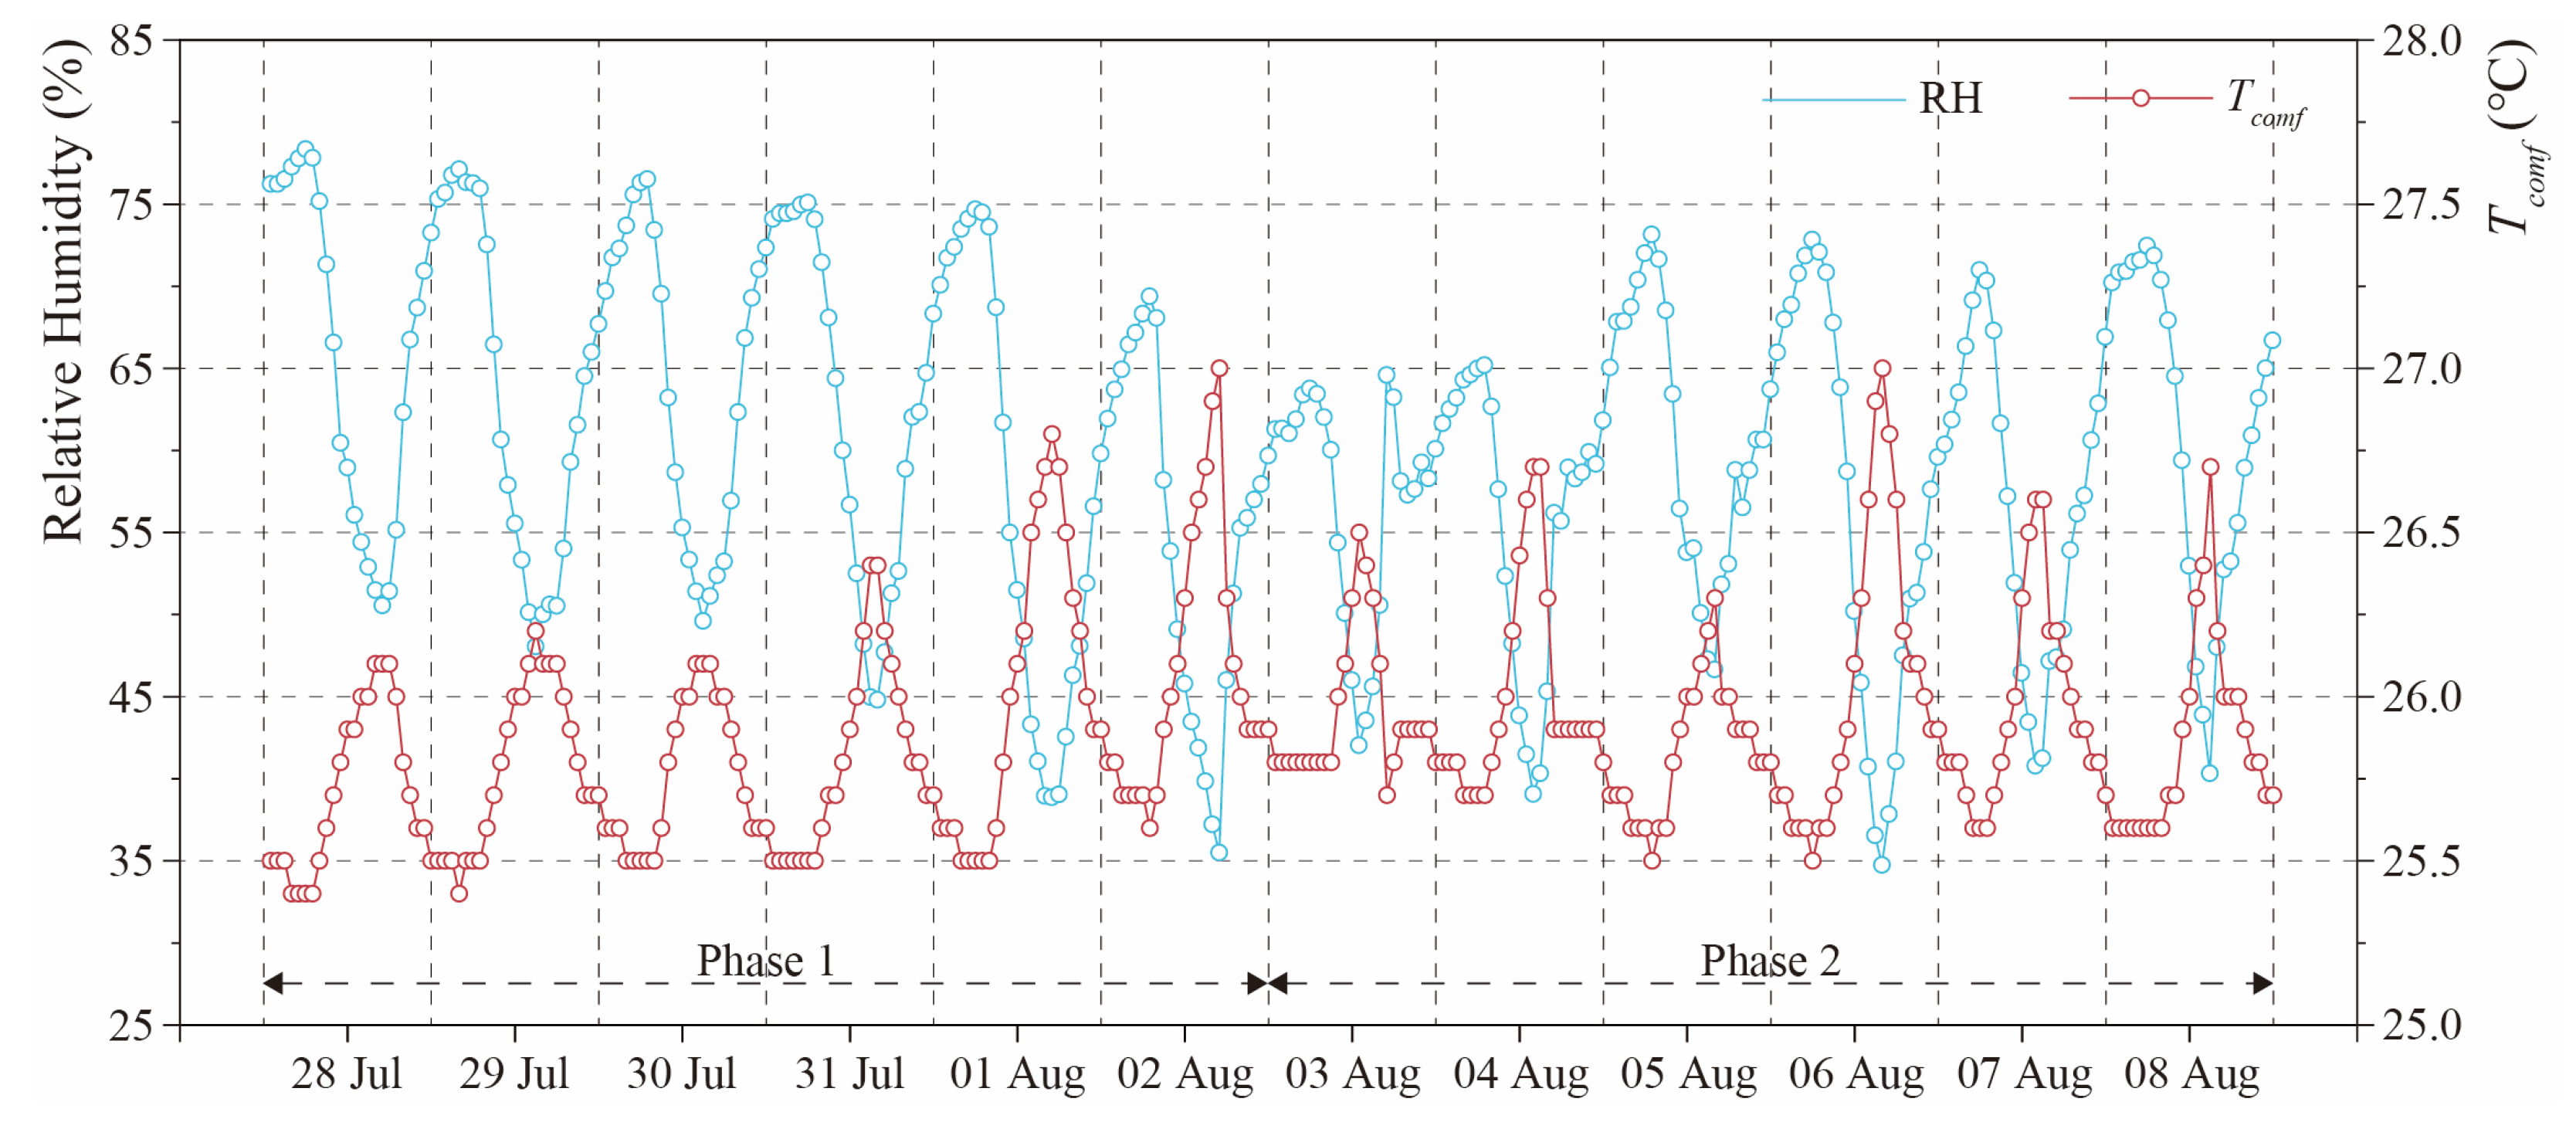
2.3. Building Thermal Resilience Indicators
2.3.1. Indoor Overheating Degree (IOD) Indicator
2.3.2. Ambient Warmness Degree (AWD) Indicator
2.3.3. Overheating Escalation Factor (αIOD)
3. Results
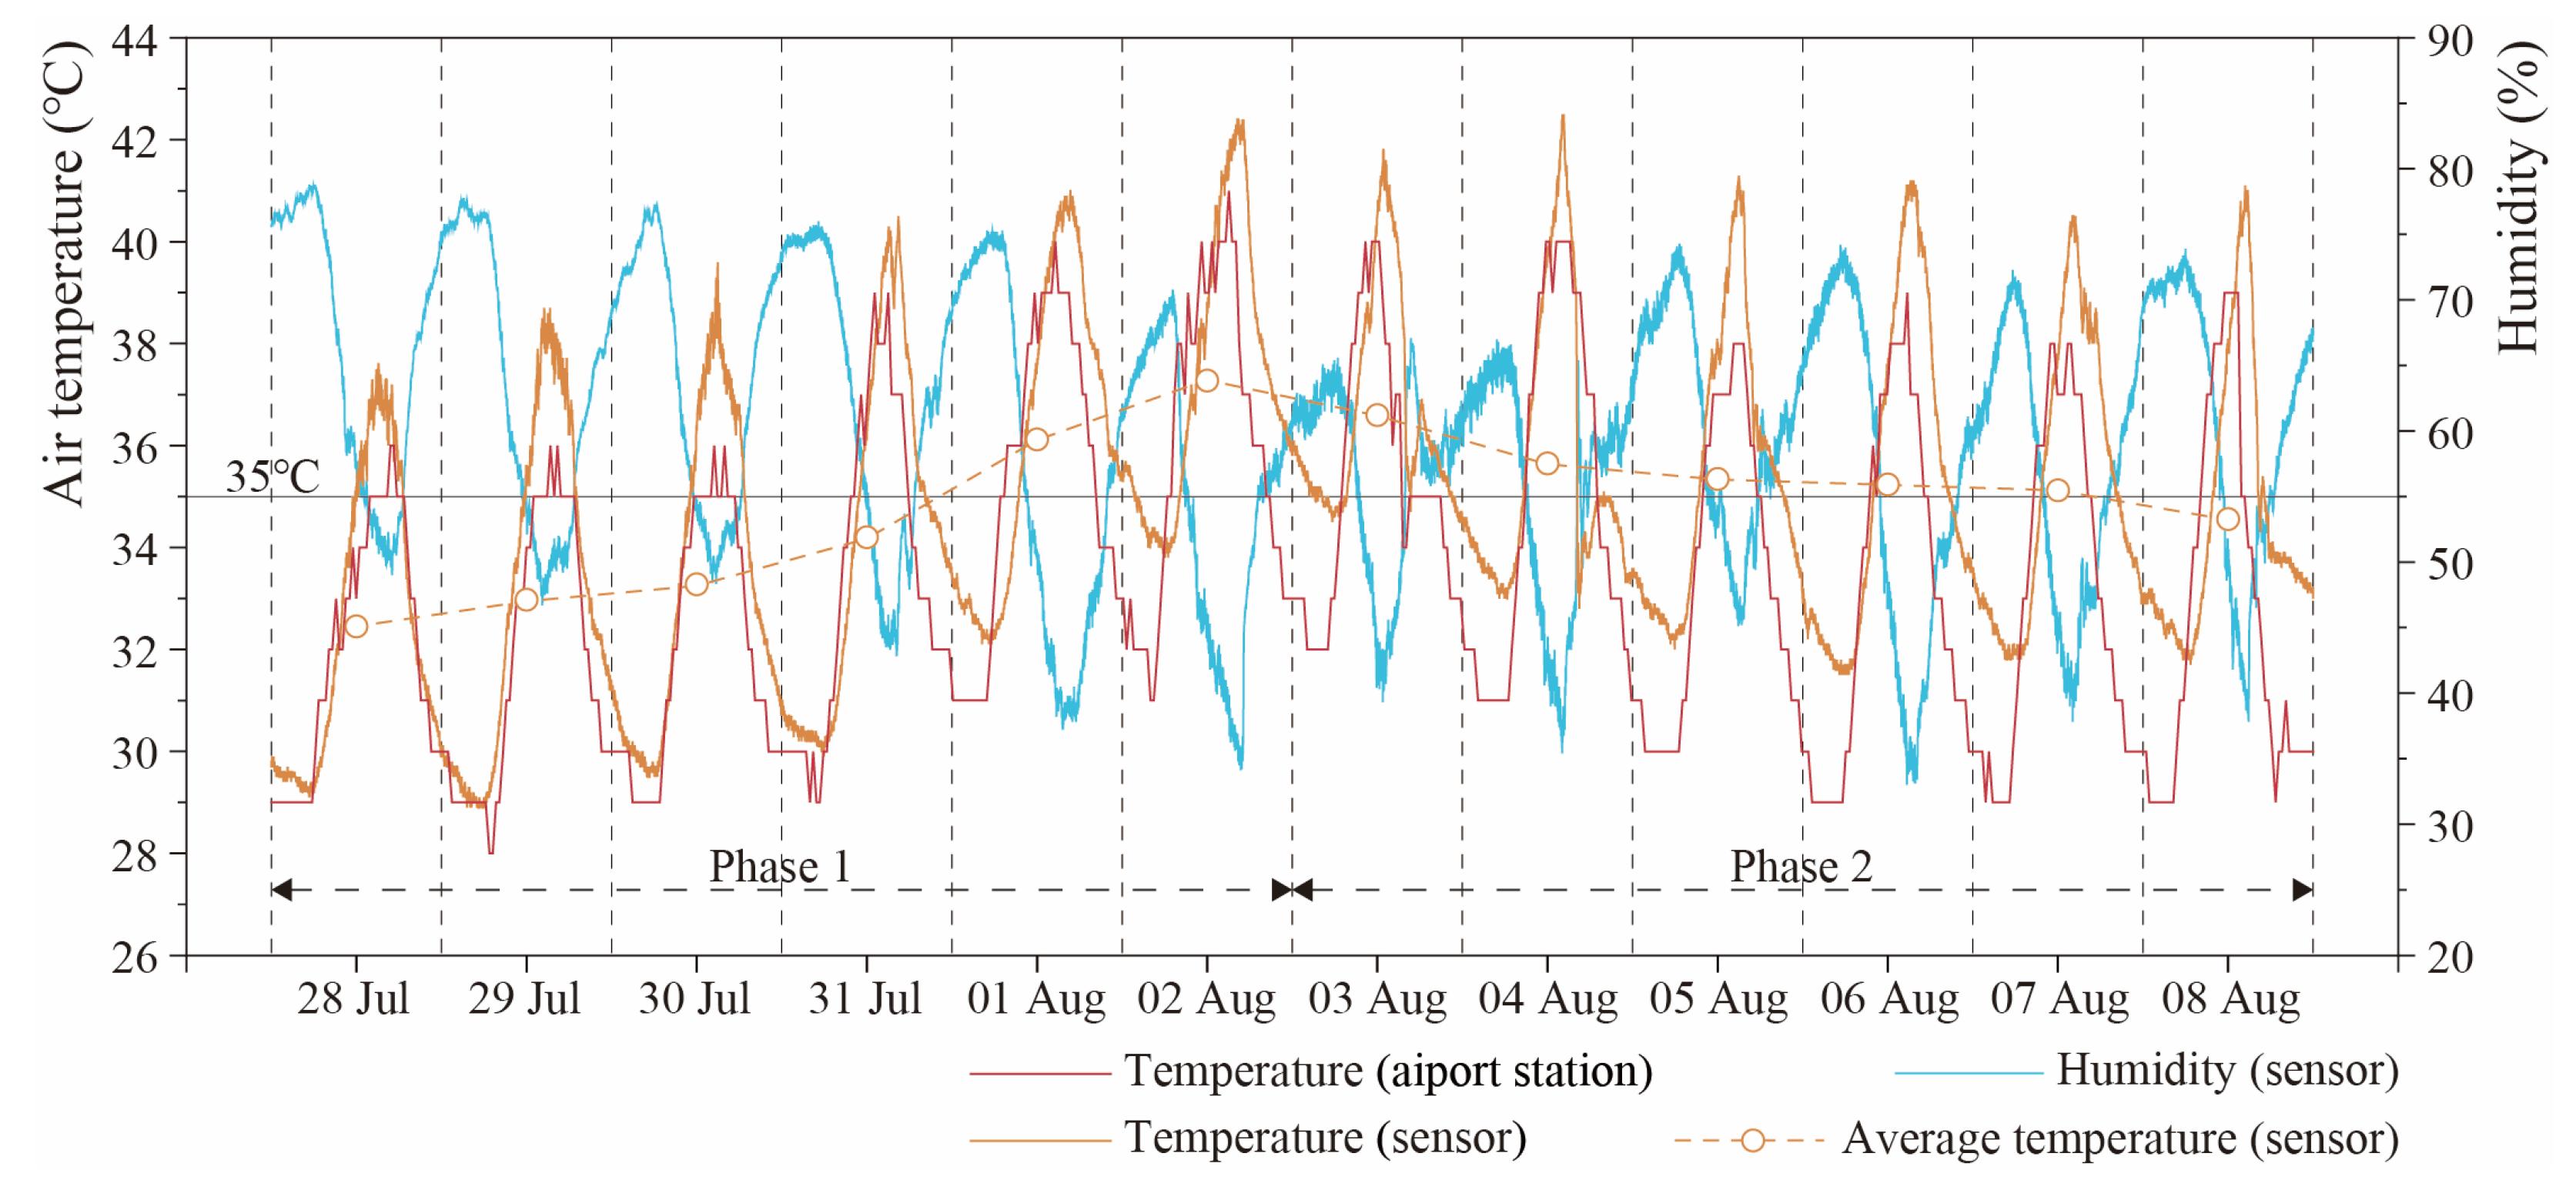
3.1. The Detected Heatwave
3.2. Measured Indoor Environment
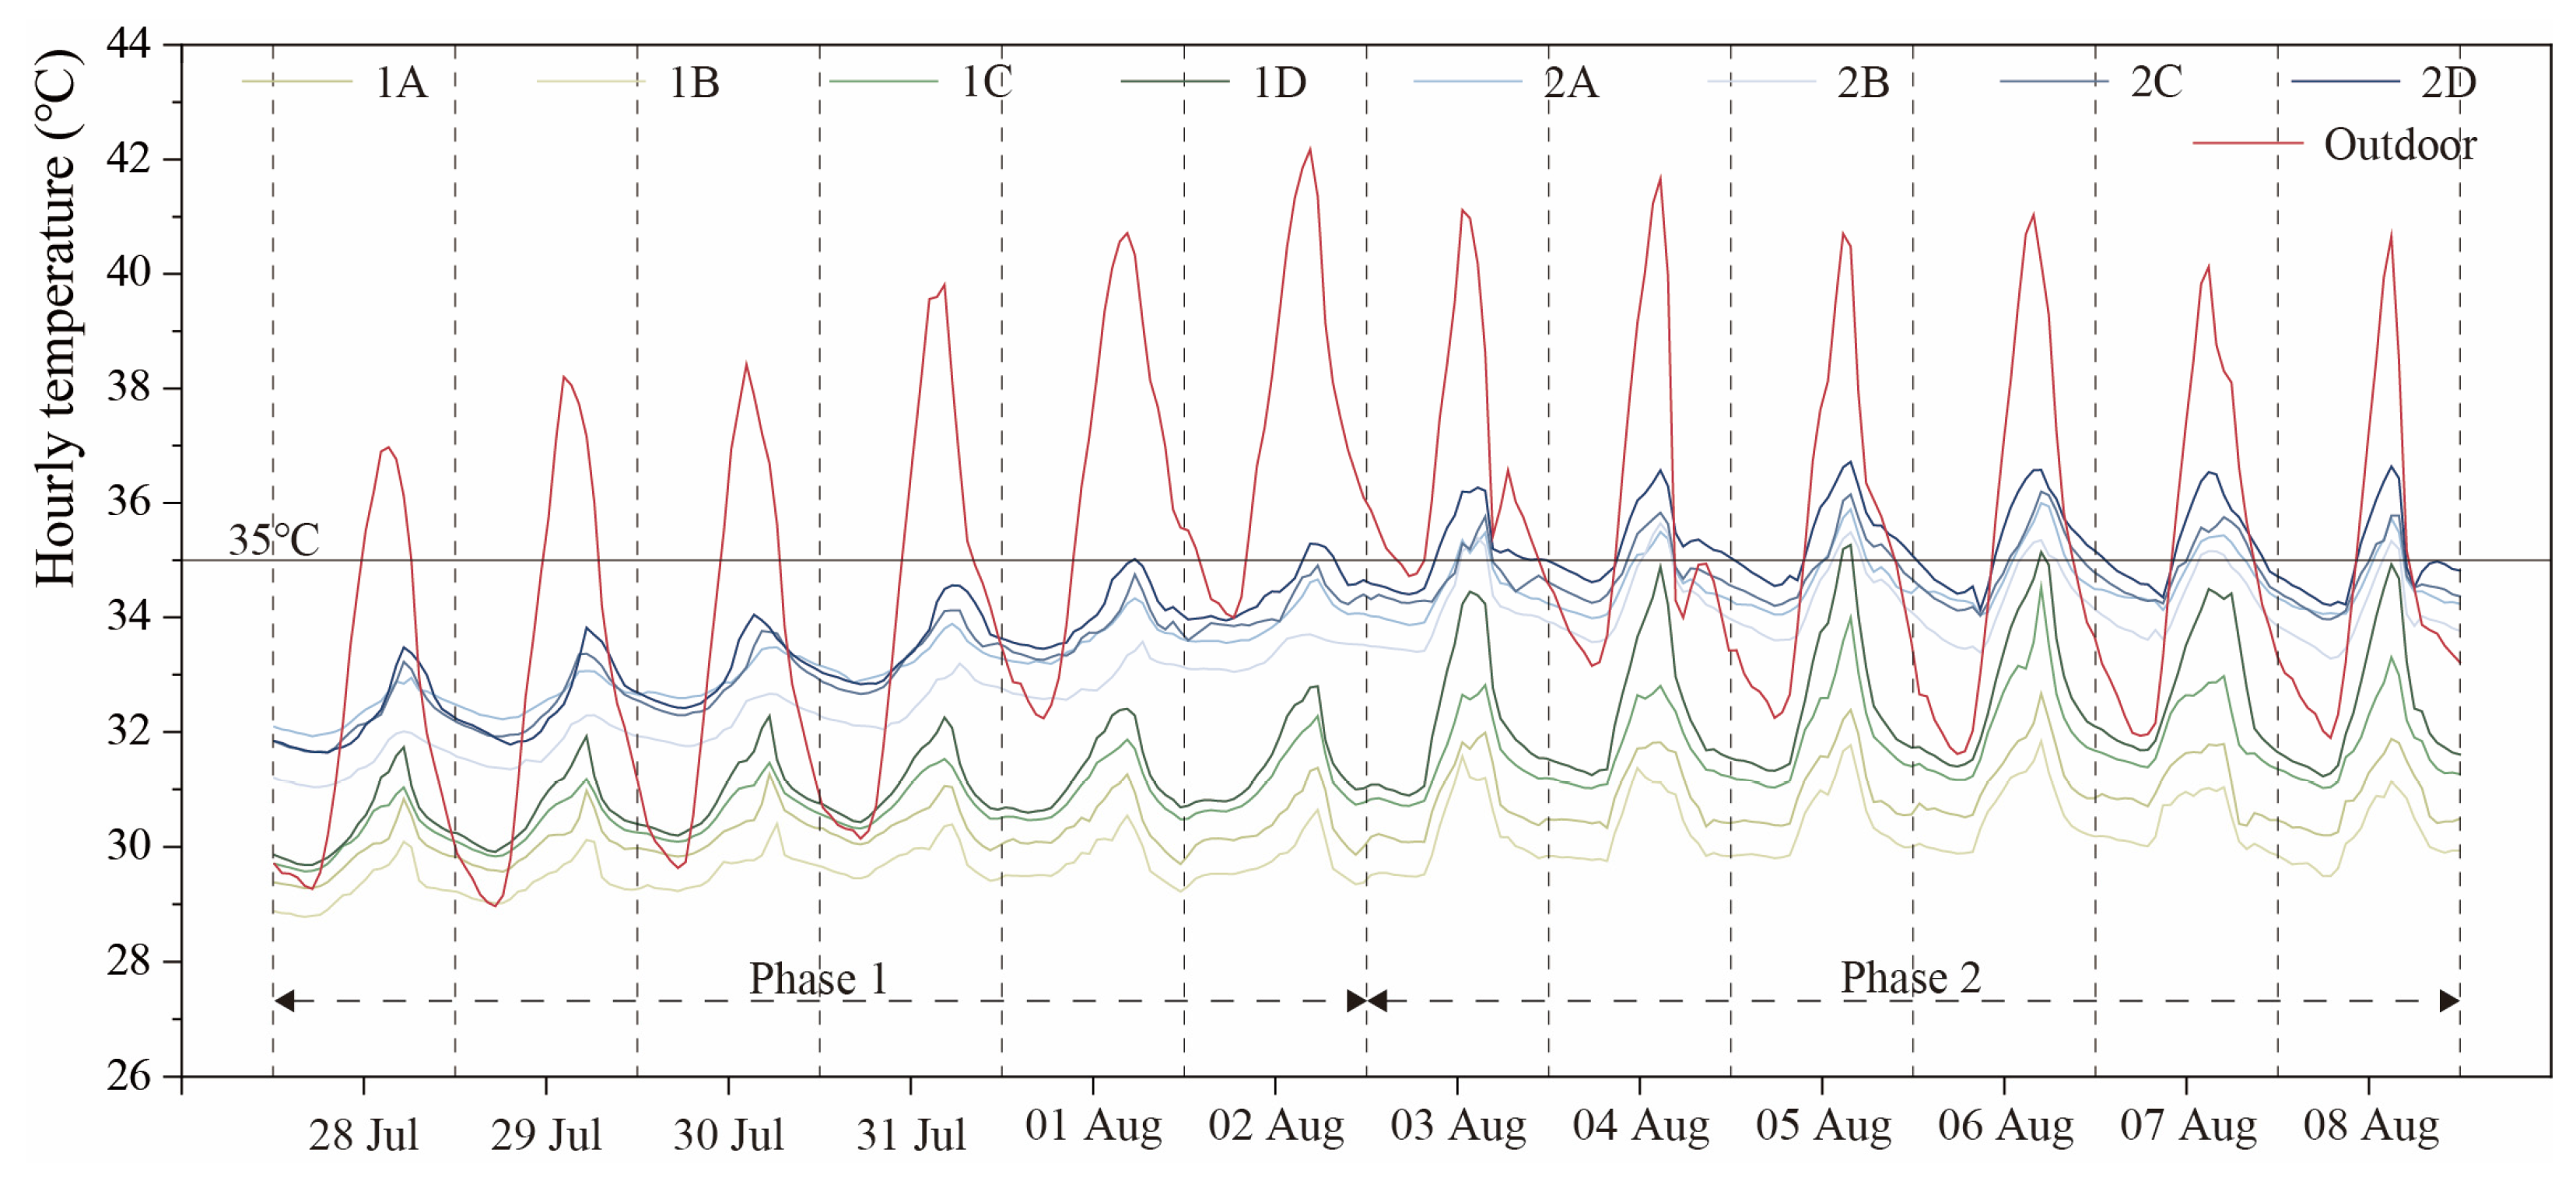
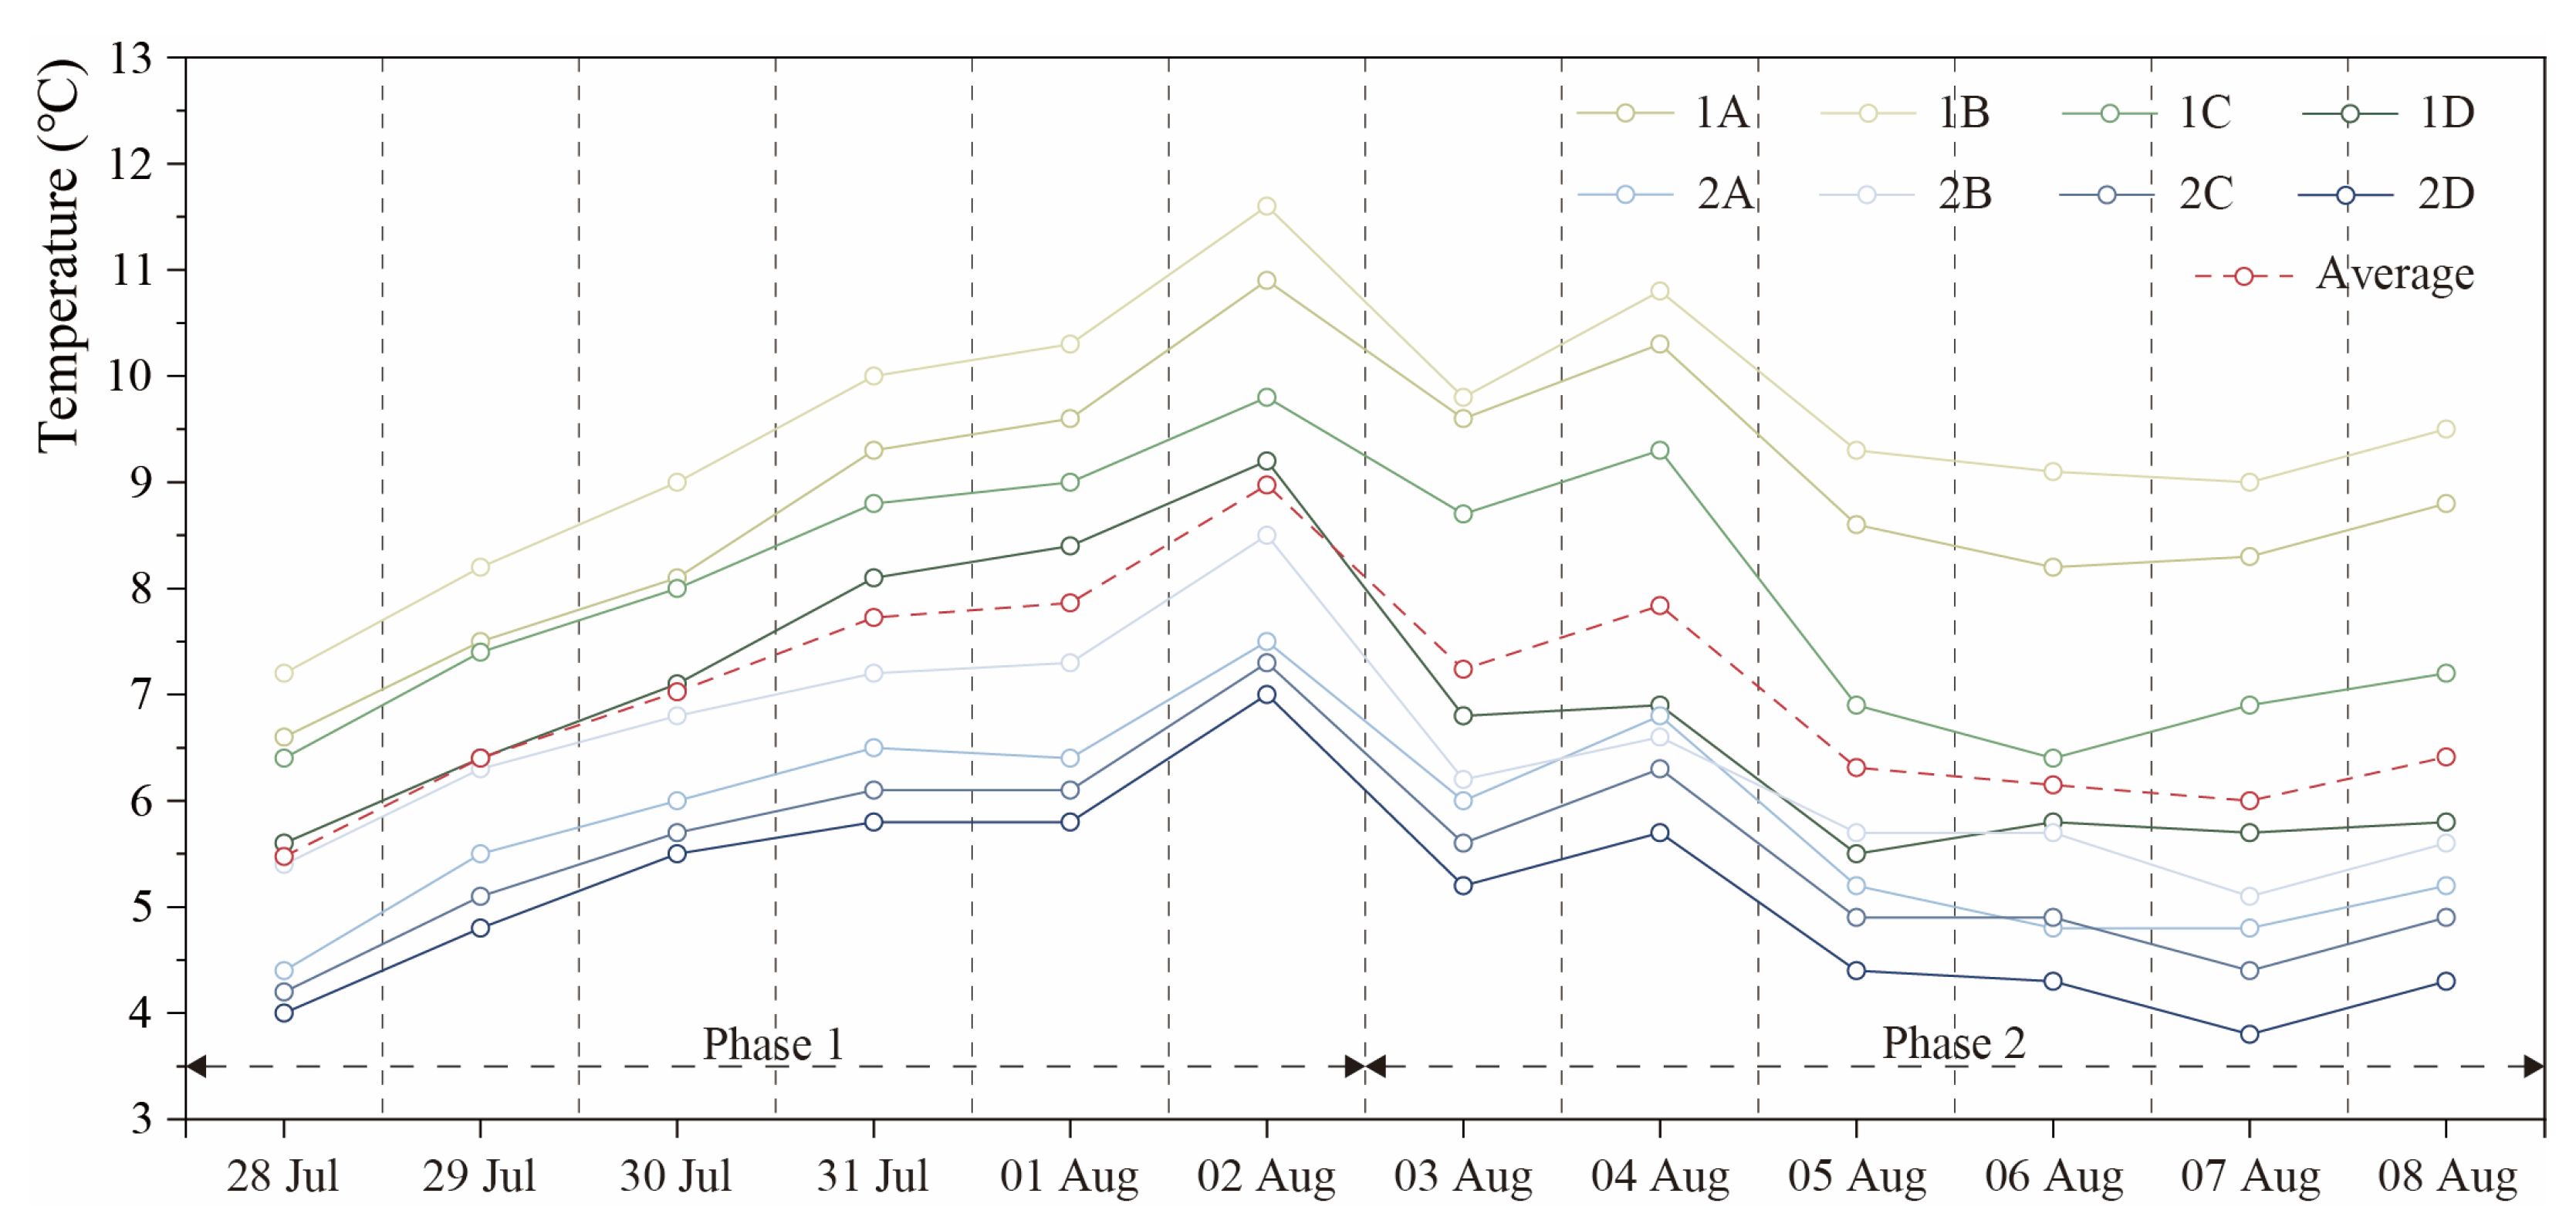
3.2.1. Indoor Air Temperature
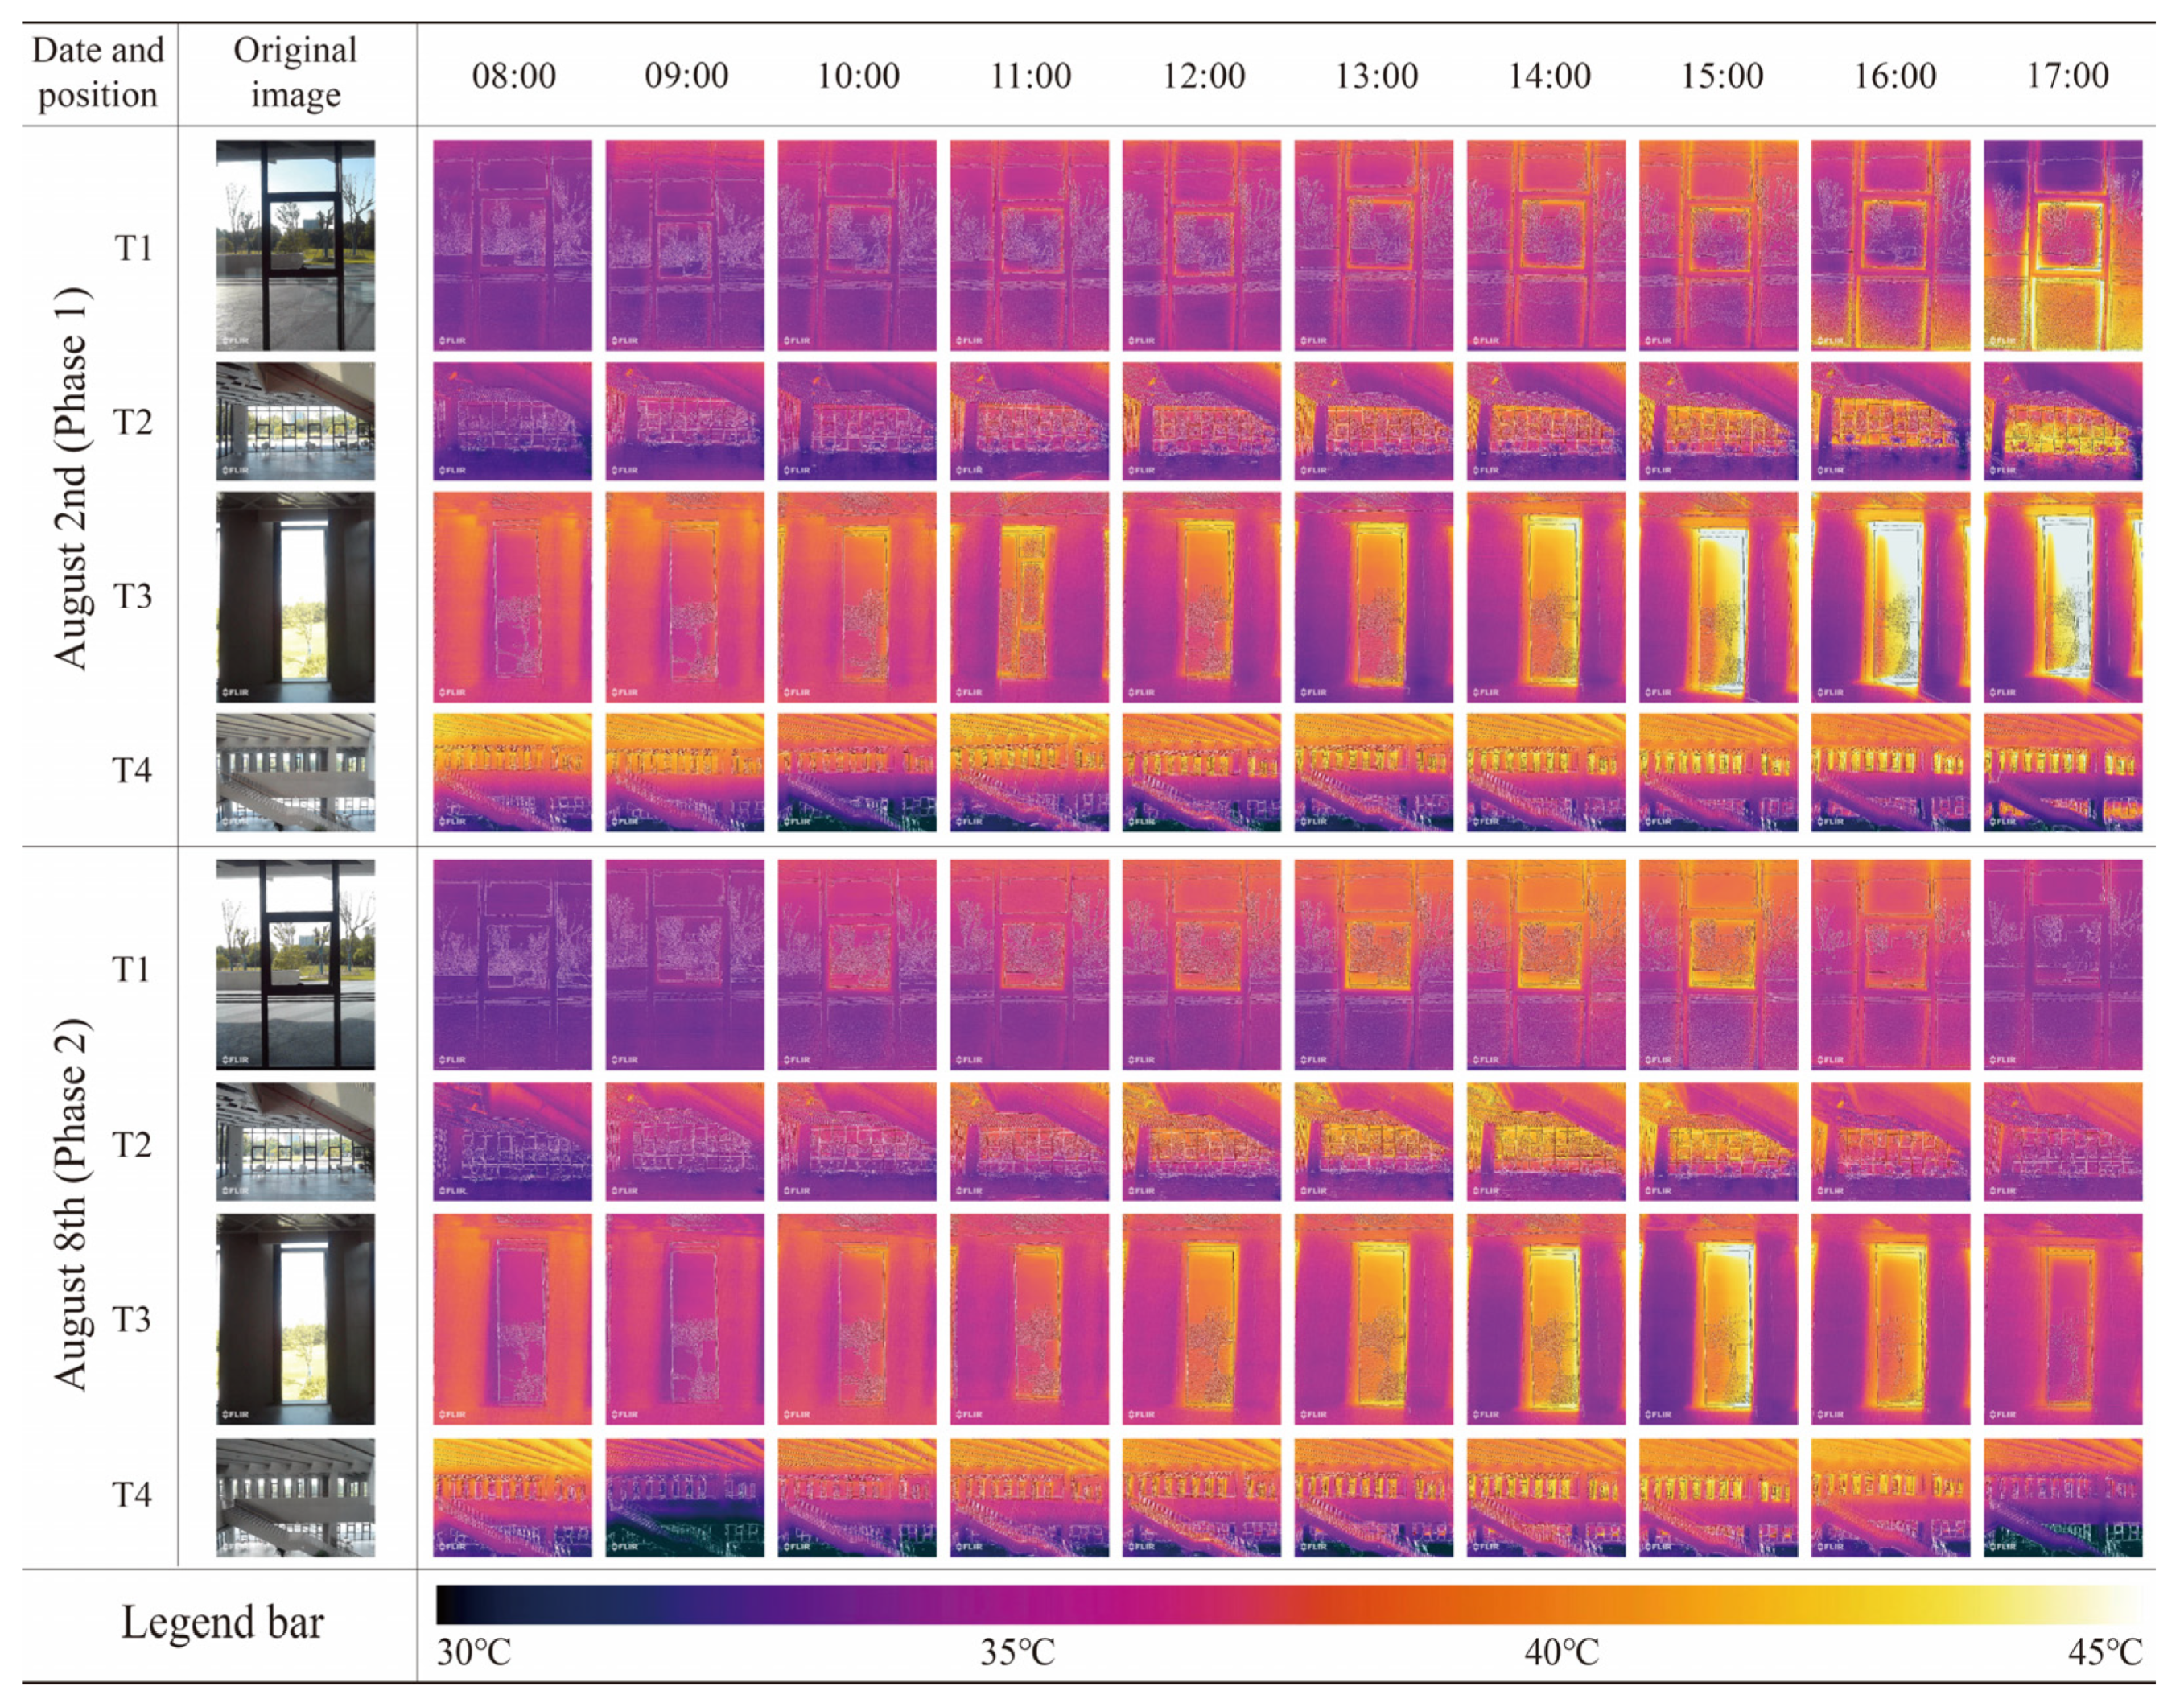
3.2.2. Thermal Images
- The images for T2 show that the indoor temperature peaks around 2:00–3:00 P.M., consistent with the previous conclusion.
- The surface temperature of the wall at T3 reaches its minimum when the outdoor temperature reaches its maximum, which is contrary to the general pattern.
- The images at T4 demonstrate a clear vertical temperature unevenness: the temperature at the top of the atrium is significantly higher than that at the bottom.
3.3. Building Thermal Resilience Analysis
4. Discussion
4.1. Data Analysis and Comparison
4.1.1. Euclidean Distance
4.1.2. Excess Kurtosis
- In the closed state during the first phase, the kurtosis of the second floor is generally 0.5 lower than that of the first floor. In contrast, during the second phase when the space is open, the situation is reversed. The kurtosis of the first floor is typically 0.5 lower than that of the second floor. This suggests that after normalizing the data fluctuations, in the absence of natural ventilation during a heatwave, the temperature data distribution on the second floor of the atrium is much flatter, with a thinner tail and a lower probability of extreme values compared to the first floor. However, once the doors and windows are opened in the second phase, the temperature data distribution on the second floor becomes steeper, with a higher probability of extreme values compared to the first floor. In other words, natural ventilation causes the temperature data on the upper floors of the atrium to become more unstable.
- In the first phase, the data from points A and B on the first floor show positive standardized kurtosis values on three separate days. This suggests that in the closed state, positions closer to the interior (further from the boundaries) on the bottom floor of the atrium are more likely to experience extreme values. It is important to note that this does not contradict the conclusions from Section 4.1.1. While the positions of A and B on the plan help maintain stability, they also make these points somewhat more vulnerable. A more uniform temperature data distribution is more sensitive to sudden environmental changes, which can significantly impact the kurtosis values. A similar situation is observed at point C in the second phase, which further supports the previous discussion on thermal unevenness.
4.2. Correlation Analysis
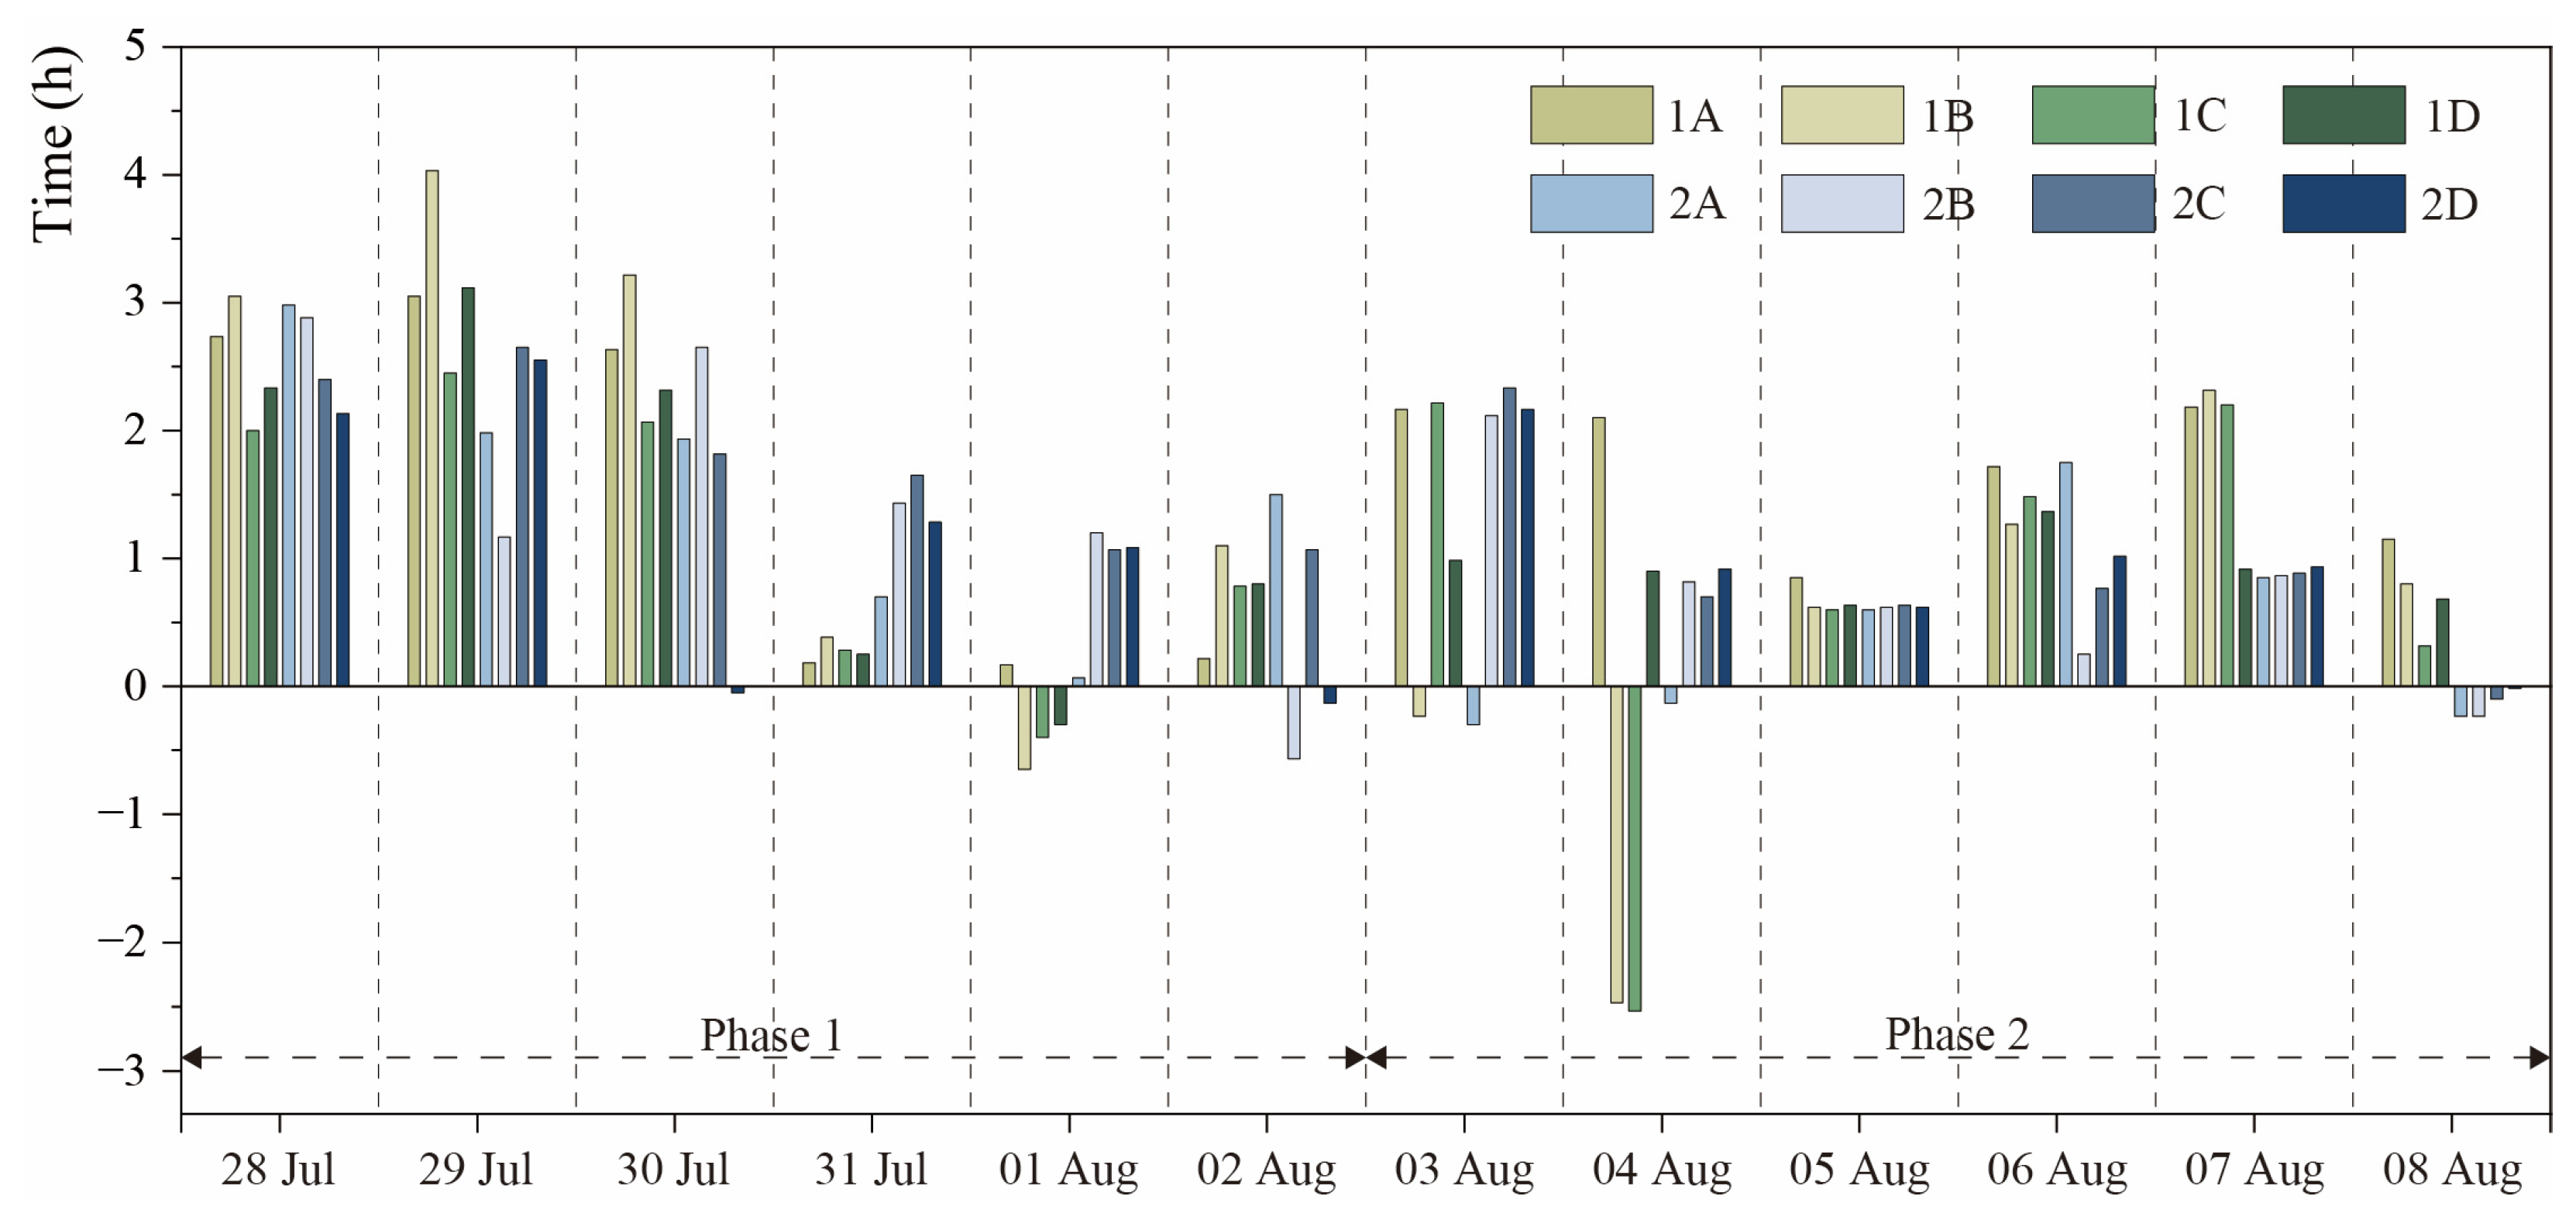
4.3. Peak Clipping and Delayed Effects
5. Conclusions
- The thermal resilience of the atrium space shows significant differences under different conditions, with distinct vertical and horizontal temperature distribution non-uniformity:
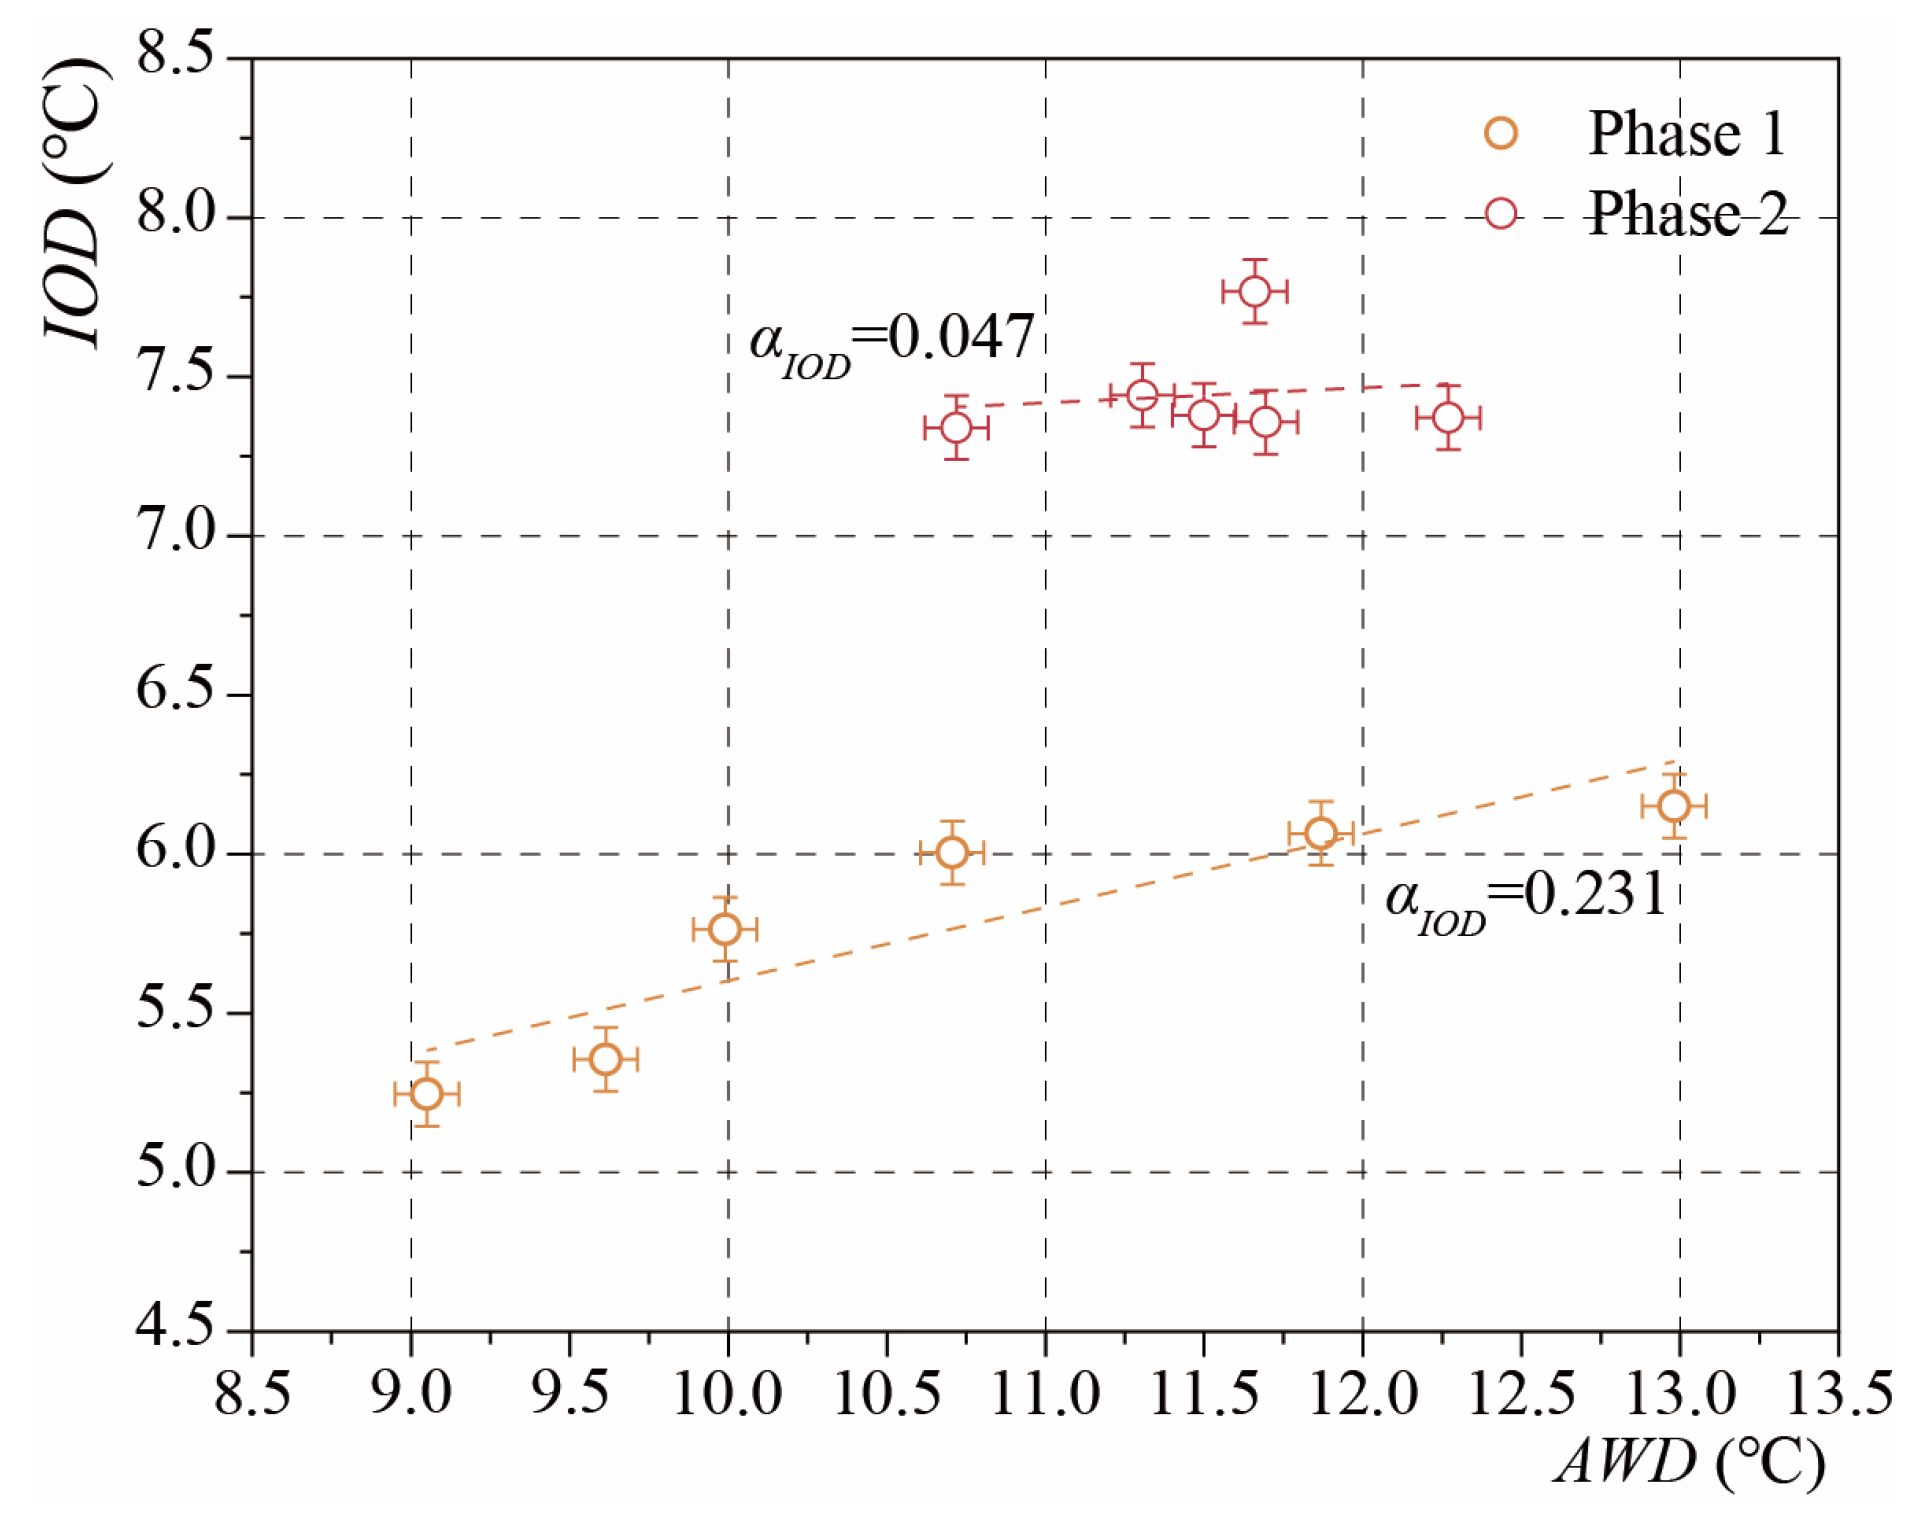
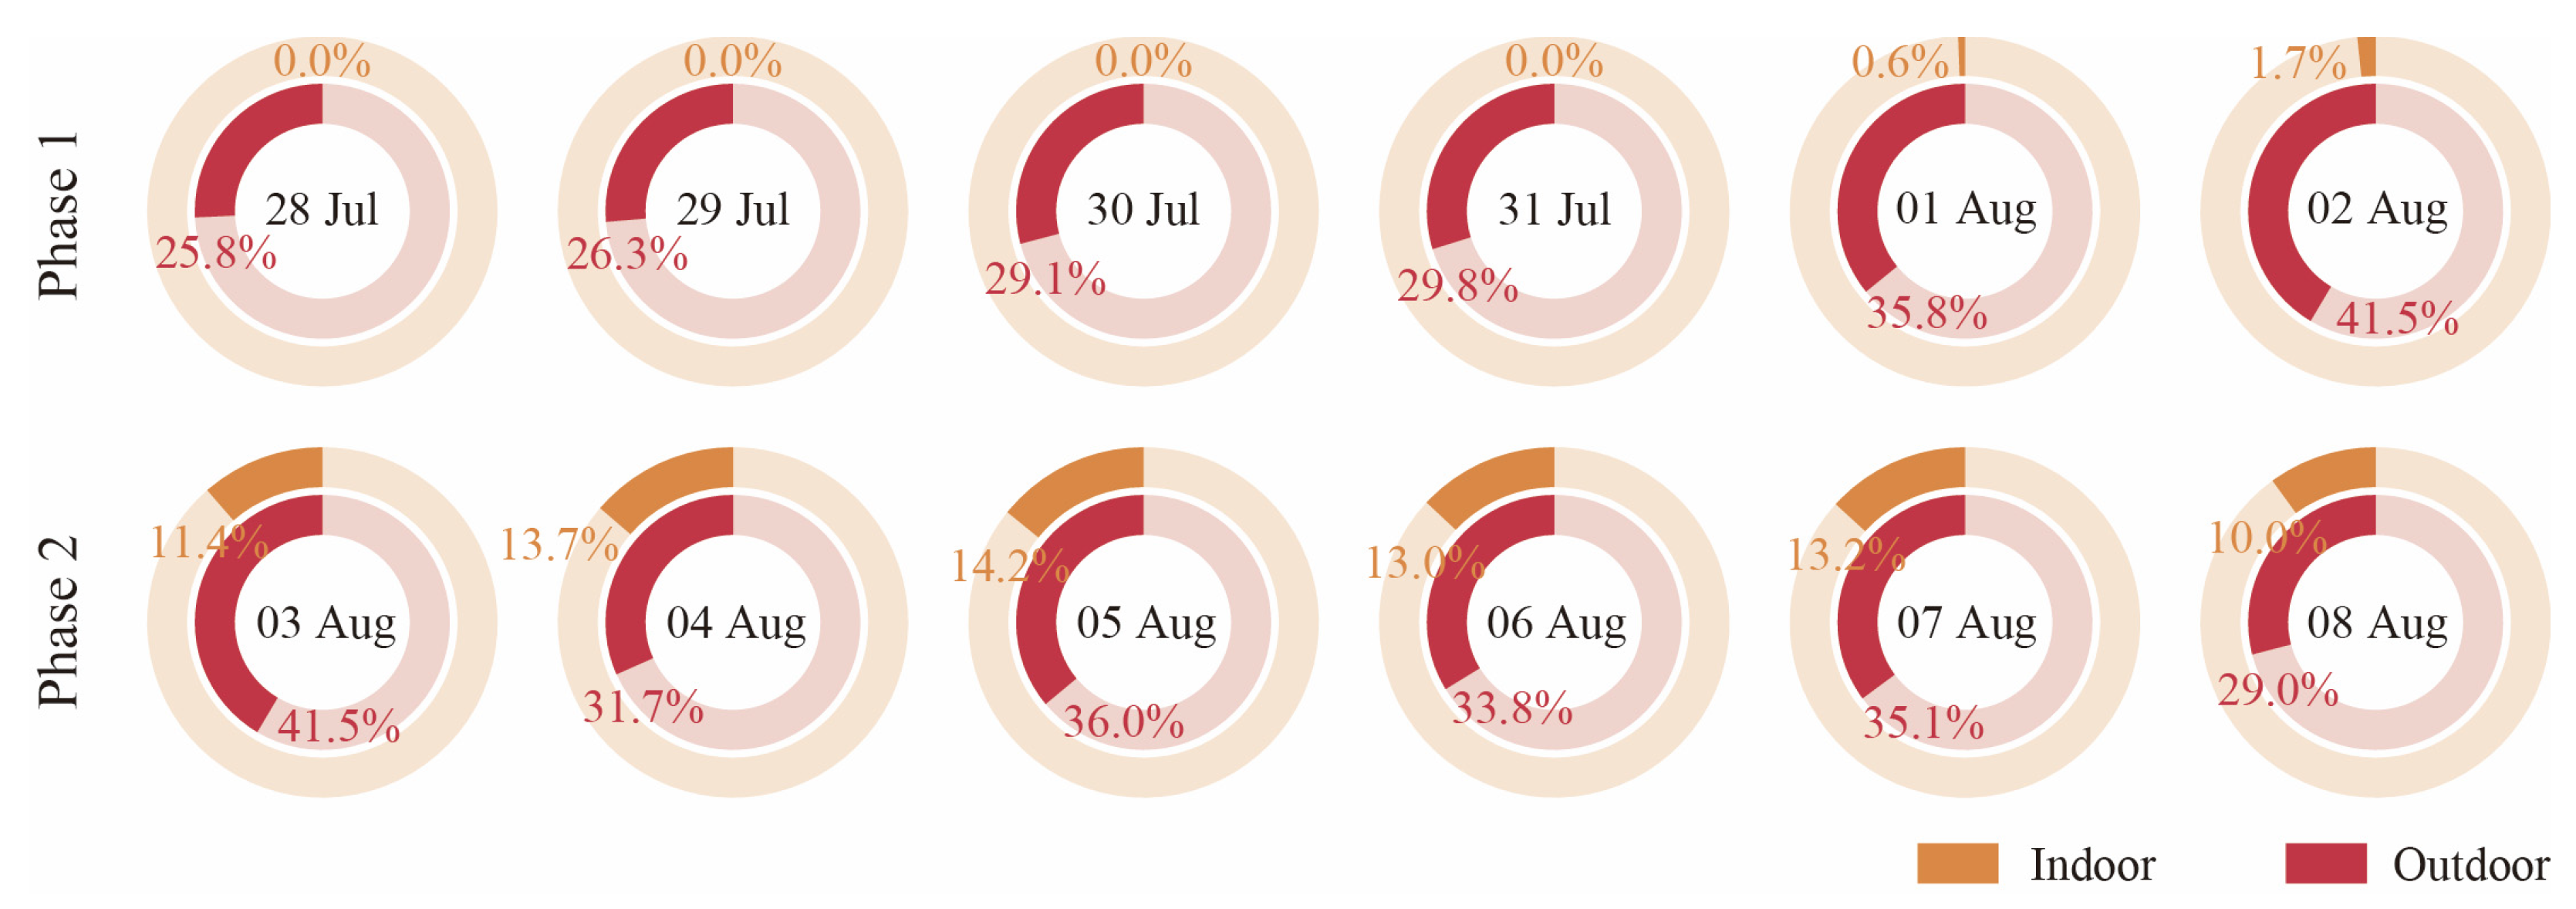
- In the closed state, the temperature distribution within the atrium remains relatively stable, but the thermal resilience is relatively weak. For example, from 28 July to 2 August, as the outdoor daily average temperature gradually increased, both the and in the atrium followed an upward trend, indicating a limited buffering capacity against high temperatures. Specifically, when the outdoor temperature peaked on 2 August, the in the atrium was 12.98 °C and the was 6.15 °C. Moreover, the temperature increase on the second floor was greater than that on the first floor, and the temperature difference between the two floors gradually increased, with the second floor experiencing a slightly higher temperature rise, showing a stronger sensitivity to external temperature changes in the closed state.
- In the open state, natural ventilation significantly enhanced the thermal resilience of the atrium, but also increased the temperature distribution non-uniformity. From August 3 to August 8, the outdoor average temperature decreased daily; however, the and in the atrium did not follow the same trend as the closed state. For instance, on 5 August, the reached its maximum value of 11.66 °C, even though the outdoor average temperature was not the highest. This suggests that in the natural ventilation state, indoor temperature fluctuations are influenced by various factors, including outdoor temperature, ventilation effects, and the thermal inertia of the indoor space. Additionally, the thermal imaging data showed that, in the natural ventilation state, the temperature at the top of the atrium was significantly higher than at the bottom, with higher temperatures near the southern side, further confirming the distinct vertical and horizontal temperature distribution irregularities in the atrium under different states.
- The calculation of the thermal resilience indicators is dynamic and complex, with a significant correlation with the environmental data:
- This study finds that the relationship between the and is not a simple linear relationship and is influenced by various factors. In the open state, the relationship between the and became more complex. Although natural ventilation enhanced the thermal resilience of the atrium to some extent, the changing trends between the and the environmental data became complicated. For instance, the maximum of 7.77 °C on 5 August occurred when the outdoor average temperature was not the highest, suggesting that in the natural ventilation state, indoor temperature fluctuations are influenced by various factors, including fluctuations in outdoor temperature, ventilation effects, and the thermal inertia of the space.
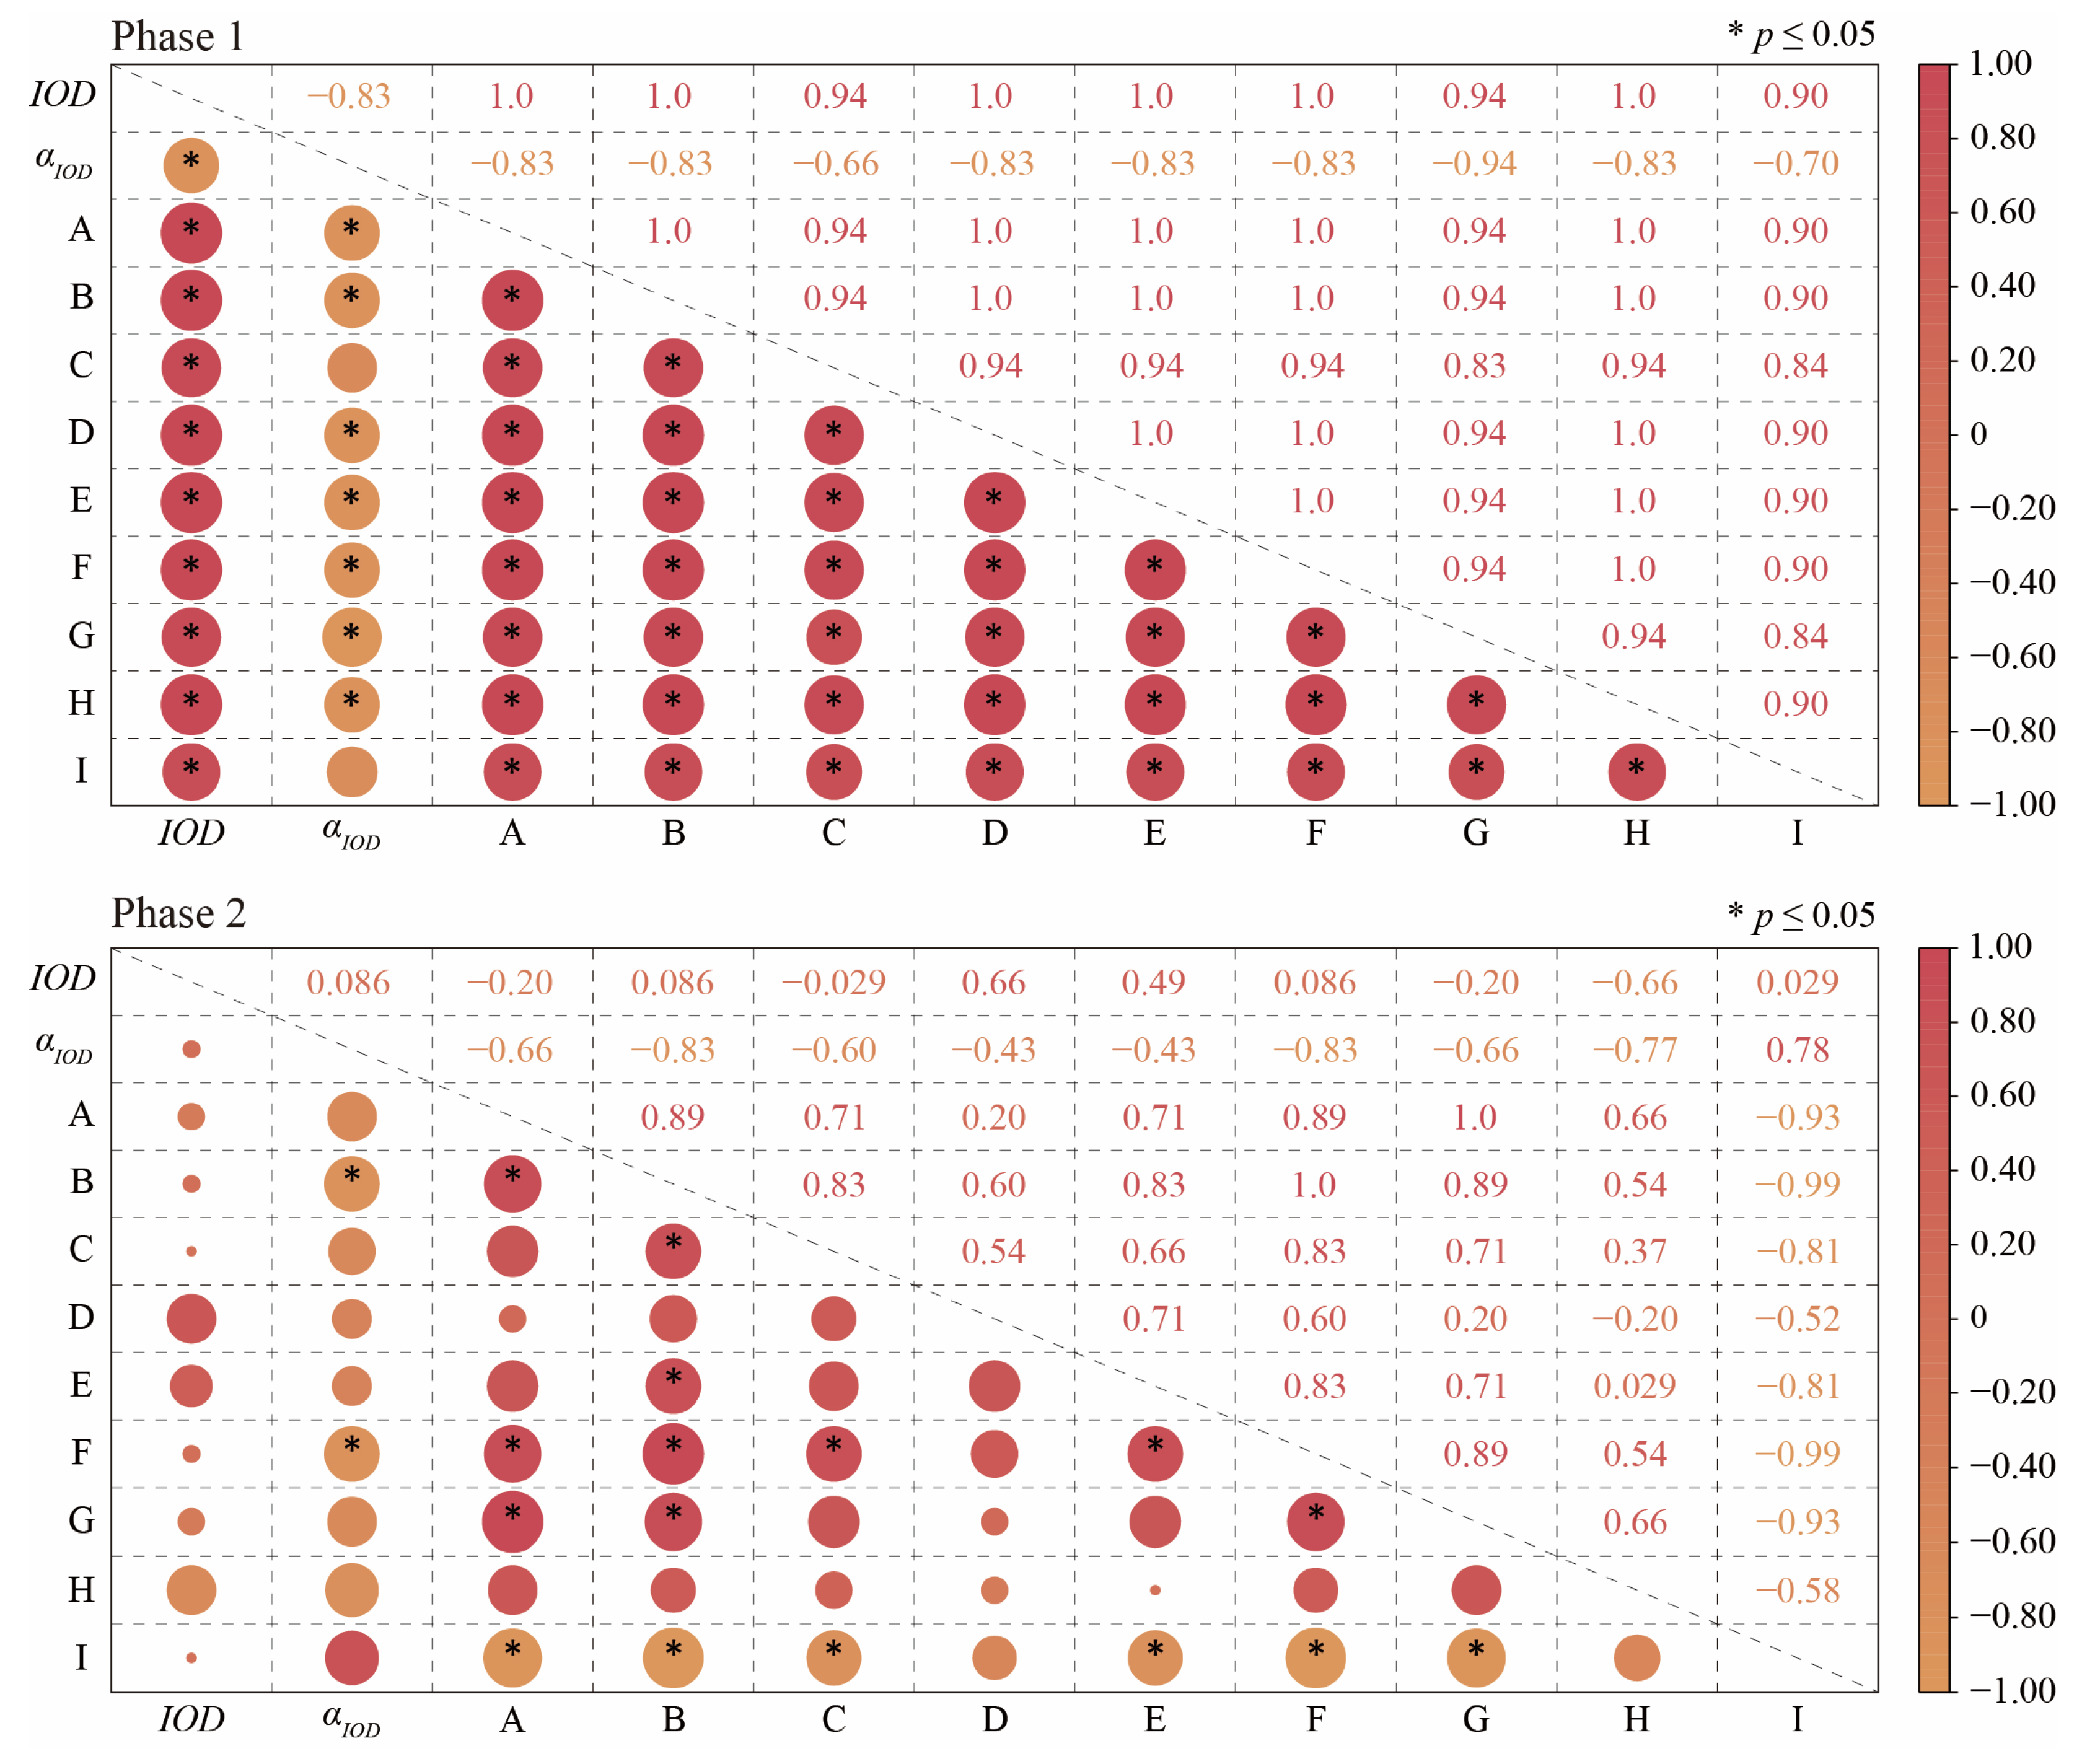
- Additionally, this study reveals that the thermal resilience indicators have a significant correlation with the environmental data. For example, the Spearman correlation analysis showed that in the closed state, the exhibited a significant positive correlation with the daily maximum outdoor temperature, average outdoor temperature, and the previous day’s minimum outdoor temperature. In the open state, this correlation was weakened, indicating that the indoor temperature fluctuations were influenced by more factors in the natural ventilation state, and the interactions between these factors became more complex.
- The impact of natural ventilation on the thermal resilience of the atrium space is significant but may lead to localized temperature non-uniformity:
- Natural ventilation showed a marked effect at improving the thermal resilience of the atrium space. The improved from 0.23 (closed state) to 0.05 (open state), confirming natural ventilation’s effectiveness. However, the open state introduced variability. For instance, the statistical analysis revealed that in the open state, the temperature data distribution at different locations in the atrium became steeper, with the probability of extreme values increasing. In particular, the temperature fluctuation on the second floor was more severe, with an increase of about 1 °C, and the local temperature instability was more prominent.
- These results suggest that when designing and managing atrium spaces, it is essential to fully consider the pros and cons of natural ventilation. On the one hand, optimizing ventilation design can enhance the thermal resilience of an atrium space; on the other hand, appropriate measures should be taken to minimize the localized temperature non-uniformity and instability caused by natural ventilation, thereby improving indoor thermal comfort. For instance, shading devices can be reasonably set, and the location and size of ventilation openings can be optimized to improve the thermal environmental performance of an atrium space.
- Standardizing and unifying the thermal resilience indicators: A more unified approach to calculating and analyzing the various thermal resilience indicators is needed. This would involve ensuring methodological consistency and exploring the relationships among the various indicators to provide a more comprehensive understanding of building thermal resilience.
- Examining the impact of ventilation strategies: Further research could explore the effects of different ventilation strategies (e.g., natural ventilation, mechanical ventilation, and hybrid systems) on thermal resilience, as these strategies could significantly influence the thermal comfort and resilience of buildings under extreme heat conditions.
- Expanding case studies and monitoring periods: To improve the generalizability of the findings, future studies could consider a broader set of case studies across different building types and locations, with a longer monitoring period. This would help assess how thermal resilience may vary across different contexts and provide stronger insights for optimizing building designs.
Author Contributions
Funding
Data Availability Statement
Acknowledgments
Conflicts of Interest
Abbreviations
| Indoor Overheating Degree | |
| Ambient Warmness Degree | |
| Overheating Escalation Factor | |
| Thermal Comfort Limit | |
| HI | Heat Index |
| Base Temperature |
References
- Mora, C.; Dousset, B.; Caldwell, I.R.; Powell, F.E.; Geronimo, R.C.; Bielecki, C.R.; Counsell, C.W.W.; Dietrich, B.S.; Johnston, E.T.; Louis, L.V.; et al. Global risk of deadly heat. Nat. Clim. Change 2017, 7, 501–506. [Google Scholar] [CrossRef]
- Russo, S.; Sillmann, J.; Sterl, A. Humid heat waves at different warming levels. Sci. Rep. 2017, 7, 7477. [Google Scholar] [CrossRef] [PubMed]
- Wedler, M.; Pinto, J.G.; Hochman, A. More frequent, persistent, and deadly heat waves in the 21st century over the Eastern Mediterranean. Sci. Total. Environ. 2023, 870, 161883. [Google Scholar] [CrossRef]
- Yang, Q.; Peng, H.; Li, Q. Study on urban heatwave characteristics and thermal stress scenarios based on China’s heatwave hazard zoning. Urban Clim. 2024, 55, 101957. [Google Scholar] [CrossRef]
- Zhang, S.; Zhang, C.; Cai, W.; Bai, Y.; Callaghan, M.; Chang, N.; Chen, B.; Chen, H.; Cheng, L.; Dai, H.; et al. The 2023 China report of the Lancet Countdown on health and climate change: Taking stock for a thriving future. Lancet Public Health 2023, 8, e978–e995. [Google Scholar] [CrossRef]
- Borghero, L.; Clèries, E.; Péan, T.; Ortiz, J.; Salom, J. Comparing cooling strategies to assess thermal comfort resilience of residential buildings in Barcelona for present and future heatwaves. Build. Environ. 2023, 231, 110043. [Google Scholar] [CrossRef]
- Kovats, R.S.; Hajat, S.; Wilkinson, P. Contrasting patterns of mortality and hospital admissions during hot weather and heat waves in Greater London, UK. Occup. Environ. Med. 2004, 61, 893–898. [Google Scholar] [CrossRef]
- Paneru, S.; Xu, X.; Wang, J.; Chi, G.; Hu, Y. Assessing building thermal resilience in response to heatwaves through integrating a social vulnerability lens. J. Build. Eng. 2024, 98, 111219. [Google Scholar] [CrossRef]
- Sengupta, A.; Al Assaad, D.; Kazanci, O.B.; Shinoda, J.; Breesch, H.; Steeman, M. Building and system design’s impact on thermal resilience to overheating during heatwaves: An uncertainty and sensitivity analysis. Build. Environ. 2024, 265, 112031. [Google Scholar] [CrossRef]
- Toesca, A.; David, D.; Johannes, K.; Lussault, M. Generation of weather data for the assessment of building performances under future heatwave conditions. Build. Environ. 2023, 242, 110491. [Google Scholar] [CrossRef]
- Klein, R.J.; Nicholls, R.J.; Thomalla, F. Resilience to natural hazards: How useful is this concept? Glob. Environ. Change Part B Environ. Hazards 2003, 5, 35–45. [Google Scholar] [CrossRef]
- Hong, T.; Malik, J.; Krelling, A.; O’Brien, W.; Sun, K.; Lamberts, R.; Wei, M. Ten questions concerning thermal resilience of buildings and occupants for climate adaptation. Build. Environ. 2023, 244, 110806. [Google Scholar] [CrossRef]
- Krelling, A.F.; Lamberts, R.; Malik, J.; Zhang, W.; Sun, K.; Hong, T. Defining weather scenarios for simulation-based assessment of thermal resilience of buildings under current and future climates: A case study in Brazil. Sustain. Cities Soc. 2024, 107, 105460. [Google Scholar] [CrossRef]
- Siu, C.Y.; O’Brien, W.; Touchie, M.; Armstrong, M.; Laouadi, A.; Gaur, A.; Jandaghian, Z.; Macdonald, I. Evaluating thermal resilience of building designs using building performance simulation—A review of existing practices. Build. Environ. 2023, 234, 110124. [Google Scholar] [CrossRef]
- Attia, S.; Levinson, R.; Ndongo, E.; Holzer, P.; Kazanci, O.B.; Homaei, S.; Zhang, C.; Olesen, B.W.; Qi, D.; Hamdy, M.; et al. Resilient cooling of buildings to protect against heat waves and power outages: Key concepts and definition. Energy Build. 2021, 239, 110869. [Google Scholar] [CrossRef]
- Chen, Z.; Cui, Y.; Zheng, H.; Wei, R.; Zhao, S. A Case Study on Multi-Objective Optimization Design of College Teaching Building Atrium in Cold Regions Based on Passive Concept. Buildings 2023, 13, 2391. [Google Scholar] [CrossRef]
- Xu, S.; Chen, Y.; Liu, J.; Kang, J.; Gao, J.; Qin, Y.; Tan, W.; Li, G. Comprehensive improvement of energy efficiency and indoor environmental quality for university library atrium—A multi-objective fast optimization framework. Front. Arch. Res. 2024, in press. [Google Scholar] [CrossRef]
- Wang, L.; Huang, Q.; Zhang, Q.; Xu, H.; Yuen, R.K. Role of atrium geometry in building energy consumption: The case of a fully air-conditioned enclosed atrium in cold climates, China. Energy Build. 2017, 151, 228–241. [Google Scholar] [CrossRef]
- Holford, J.M.; Hunt, G.R. Fundamental atrium design for natural ventilation. Build. Environ. 2003, 38, 409–426. [Google Scholar] [CrossRef]
- Liu, Z.; Pan, X.; He, W.; Li, Y. Simulation Study on Natural Ventilation Performance in a Low-Carbon Large-Space Public Building in Hot-Summer and Cold-Winter Region of China. Buildings 2023, 13, 2263. [Google Scholar] [CrossRef]
- Bai, W.; Guo, W.; He, Y.; Wu, Y.; Liang, S.; Zhang, S. Research on the Optimization Design of the Atrium Space Form in University Libraries Based on the Coupling of Daylighting and Energy Consumption. Buildings 2024, 14, 2715. [Google Scholar] [CrossRef]
- Burman, E.; Kimpian, J.; Mumovic, D. Reconciling Resilience and Sustainability in Overheating and Energy Performance Assessments of Non-Domestic Buildings; Centre for Urban Sustainability and Resilience, UCL (University College London): London, UK, 2014. [Google Scholar]
- Rahif, R.; Hamdy, M.; Homaei, S.; Zhang, C.; Holzer, P.; Attia, S. Simulation-based framework to evaluate resistivity of cooling strategies in buildings against overheating impact of climate change. Build. Environ. 2022, 208, 108599. [Google Scholar] [CrossRef]
- Hamdy, M.; Carlucci, S.; Hoes, P.-J.; Hensen, J.L. The impact of climate change on the overheating risk in dwellings—A Dutch case study. Build. Environ. 2017, 122, 307–323. [Google Scholar] [CrossRef]
- Ismail, N.; Ouahrani, D.; Al Touma, A. Quantifying thermal resilience of office buildings during power outages: Development of a simplified model metric and validation through experimentation. J. Build. Eng. 2023, 72, 106564. [Google Scholar] [CrossRef]
- Lomas, K.; Giridharan, R. Thermal comfort standards, measured internal temperatures and thermal resilience to climate change of free-running buildings: A case-study of hospital wards. Build. Environ. 2012, 55, 57–72. [Google Scholar] [CrossRef]
- Palma, R.M.; Medina, D.C.; Delgado, M.G.; Ramos, J.S.; Montero-Gutiérrez, P.; Domínguez, S.Á. Enhancing the building resilience in a changing climate through a passive cooling roof: A case study in Camas (Seville, Spain). Energy Build. 2024, 321, 114680. [Google Scholar] [CrossRef]
- Ahmed, T.; Kumar, P.; Mottet, L. Natural ventilation in warm climates: The challenges of thermal comfort, heatwave resilience and indoor air quality. Renew. Sustain. Energy Rev. 2021, 138, 110669. [Google Scholar] [CrossRef]
- Zhang, C.; Kazanci, O.B.; Attia, S.; Levinson, R.; Lee, S.H.; Holzer, P.; Salvatif, A.; Machard, A.; Pourabdollahtootkaboni, M.; Gaur, A.; et al. IEA EBC Annex 80-Dynamic Simulation Guideline for the Performance Testing of Resilient Cooling Strategies; Aalborg University: Aalborg, Denmark, 2021. [Google Scholar]
- Albuquerque, D.P.; Mateus, N.; Avantaggiato, M.; da Graça, G.C. Full-scale measurement and validated simulation of cooling load reduction due to nighttime natural ventilation of a large atrium. Energy Build. 2020, 224, 110233. [Google Scholar] [CrossRef]
- Li, M.; Shen, X.; Wu, W.; Cetin, K.; Mcintyre, F.; Wang, L.; Ding, L.; Bishop, D.; Bellamy, L.; Liu, M. Cooling demand reduction with nighttime natural ventilation to cool internal thermal mass under harmonic design-day weather conditions. Appl. Energy 2024, 379, 124947. [Google Scholar] [CrossRef]
- Beck, H.E.; Zimmermann, N.E.; McVicar, T.R.; Vergopolan, N.; Berg, A.; Wood, E.F. Present and future Köppen-Geiger climate classification maps at 1-km resolution. Sci. Data 2018, 5, 180214. [Google Scholar] [CrossRef]
- Bi, X.; Wu, C.; Wang, Y.; Li, J.; Wang, C.; Hahs, A.; Mavoa, S.; Song, C.; Konrad, C.; Emch, M. Changes in the associations between heatwaves and human mortality during two extreme hot summers in Shanghai, China. Sustain. Cities Soc. 2023, 95, 104581. [Google Scholar] [CrossRef]
- Zhou, W.; Zhang, L.; Wang, G.; Zhang, Q.; Cao, H.; Zhang, H.; Jia, B.; Tang, Z.; Li, X.; Liu, L. Impacts of urban expansion on air temperature and humidity during 2022 mega-heatwave over the Yangtze River Delta, China. Sci. Total. Environ. 2024, 951, 175804. [Google Scholar] [CrossRef] [PubMed]
- WMO. Heatwaves and Health Guidance on Warning-System Development; WMO: Geneva, Switzerland, 2015. [Google Scholar]
- CMA. Monitoring Indices of High Temperature Extremes; CMA: Beijing, China, 2015. [Google Scholar]
- Environmental Protection Agency. U.S. Extreme Heat. 8 January 2025. Available online: https://www.epa.gov/climatechange-science/extreme-heat (accessed on 3 January 2025).
- Ministry of the Environment of Japan. About WBGT (Wet Bulb Globe Temperature). Available online: https://www.wbgt.env.go.jp/en/wbgt.php (accessed on 3 January 2025).
- Australian Government, Bureau of Meteorology. What is a Heatwave? Available online: http://www.bom.gov.au/australia/heatwave/knowledge-centre/understanding.shtml (accessed on 3 January 2025).
- WMO. Heatwave. Available online: https://wmo.int/zh-hans/node/21175 (accessed on 3 January 2025).
- Ji, L.; Shu, C.; Laouadi, A.; Lacasse, M.; Wang, L. Quantifying improvement of building and zone level thermal resilience by cooling retrofits against summertime heat events. Build. Environ. 2023, 229, 109914. [Google Scholar] [CrossRef]
- JGJ/T 347-2014; Standard of Test Methods for Thermal Environment of Building. China Architecture and Building Press Beijing: Beijing, China, 2014.
- Jin, Z.; Zhang, Y.; Sun, H.; Han, M.; Zheng, Y.; Zhao, Y.; Han, W.; Zhang, M. Indoor thermal nonuniformity of atrium-centered public building: Monitoring and diagnosis for energy saving. Case Stud. Therm. Eng. 2024, 54, 104058. [Google Scholar] [CrossRef]
- Xu, C.; Wang, Y.; Hui, J.; Wang, L.; Yao, W.; Sun, L. Study on winter thermal environmental characteristics of the atrium space of teaching building in China’s cold region. J. Build. Eng. 2023, 67, 105978. [Google Scholar] [CrossRef]
- Flores-Larsen, S.; Filippín, C.; Bre, F. New metrics for thermal resilience of passive buildings during heat events. Build. Environ. 2023, 230, 109990. [Google Scholar] [CrossRef]
- Sun, K.; Specian, M.; Hong, T. Nexus of thermal resilience and energy efficiency in buildings: A case study of a nursing home. Build. Environ. 2020, 177, 106842. [Google Scholar] [CrossRef]
- Yin, X.; Muhieldeen, M.W.; Razman, R.; Ee, J.Y.C.; Chiong, M.C. The potential effects of window configuration and interior layout on natural ventilation buildings: A comprehensive review. Clean. Eng. Technol. 2024, 23, 100830. [Google Scholar] [CrossRef]


| Source | Definitions and Criteria for Hot Weather or Heatwaves |
|---|---|
| Environmental Protection Agency, United States [37] | It is frequently based on how unusually hot and humid it is for an area. Typically, temperatures of 95 °F (35 °C) or higher are considered the standard for extreme heat. |
| Ministry of the Environment, Japan [38] | Japan uses the Wet-Bulb Globe Temperature (WBGT) as a measure of heat risk. A WBGT value between 25 and 28 is considered to indicate a moderate-to-high risk for daily activities, while a WBGT value greater than 28 is considered dangerous for all life activities. |
| Bureau of Meteorology, Australian Government [39] | A heatwave is defined as a period during which both the maximum and minimum temperatures are unusually hot for at least three consecutive days, compared to the local climate and past weather patterns. In Australia, the Excess Heat Factor (EHF) is used for monitoring and forecasting heatwaves. The EHF combines a comparison of the average temperatures for a 3-day period with the temperatures that would typically be considered hot for that location, as well as the observed temperatures at that location over the past 30 days. |
| World Meteorological Organization [40] | A heatwave can be defined as a period where local excess heat accumulates over a sequence of unusually hot days and nights. |
| Phase 1 | ||||||
| Date | 28 Jul | 29 Jul | 30 Jul | 31 Jul | 01 Aug | 02 Aug |
| 9.05 | 9.61 | 9.99 | 10.71 | 11.87 | 12.98 | |
| 5.25 | 5.36 | 5.76 | 6.00 | 6.06 | 6.15 | |
| Phase 2 | ||||||
| Date | 03 Aug | 04 Aug | 05 Aug | 06 Aug | 07 Aug | 08 Aug |
| 12.27 | 11.69 | 11.66 | 11.50 | 11.31 | 10.72 | |
| 7.37 | 7.36 | 7.77 | 7.38 | 7.44 | 7.34 | |
| Sensors Position | 1A | 1B | 1C | 1D | 2A | 2B | 2C | 2D |
|---|---|---|---|---|---|---|---|---|
| d | 82.8 | 81.8 | 118.2 | 162.2 | 150.4 | 188.7 | 173.8 | 203.5 |
Disclaimer/Publisher’s Note: The statements, opinions and data contained in all publications are solely those of the individual author(s) and contributor(s) and not of MDPI and/or the editor(s). MDPI and/or the editor(s) disclaim responsibility for any injury to people or property resulting from any ideas, methods, instructions or products referred to in the content. |
© 2025 by the authors. Licensee MDPI, Basel, Switzerland. This article is an open access article distributed under the terms and conditions of the Creative Commons Attribution (CC BY) license (https://creativecommons.org/licenses/by/4.0/).
Share and Cite
Zhang, G.; Li, L.; Yu, Y.; Liu, J.; Zhang, Q. Thermal Resilience of Public Building Atriums Under Different States During Heatwaves. Buildings 2025, 15, 598. https://doi.org/10.3390/buildings15040598
Zhang G, Li L, Yu Y, Liu J, Zhang Q. Thermal Resilience of Public Building Atriums Under Different States During Heatwaves. Buildings. 2025; 15(4):598. https://doi.org/10.3390/buildings15040598
Chicago/Turabian StyleZhang, Guangyi, Linxue Li, Yang Yu, Jinhao Liu, and Qi Zhang. 2025. "Thermal Resilience of Public Building Atriums Under Different States During Heatwaves" Buildings 15, no. 4: 598. https://doi.org/10.3390/buildings15040598
APA StyleZhang, G., Li, L., Yu, Y., Liu, J., & Zhang, Q. (2025). Thermal Resilience of Public Building Atriums Under Different States During Heatwaves. Buildings, 15(4), 598. https://doi.org/10.3390/buildings15040598