Abstract
Experimental modal analysis has proven effective in damage identification of civil structures but has not been extensively applied to multi-leaf masonry structures, particularly in the context of wall tie inspection. This paper investigates the applicability of non-destructive, vibration-based damage identification methods to a one-storey masonry veneer wall to detect wall tie deterioration based on changes in modal parameters. An impact hammer was used to collect vibration data from eight different wall tie deterioration test cases by disconnecting the wall ties at various locations. The downshift of natural frequencies was recorded for all deterioration test cases, and a reduction of up to 38% was observed when the top row of wall ties was disconnected, highlighting the importance of wall ties to the overall stiffness of the masonry veneer wall system. In terms of damage localisation accuracy, the parameter-based method performed the best by successfully identifying seven out of eight damaged scenarios without additional noise. The findings show that the detection of wall tie deterioration using non-destructive, vibration-based damage identification methods is viable, providing an alternative wall tie inspection method with significant benefits to infrastructure management, thereby enhancing safety, efficiency, and sustainability in maintaining and preserving masonry veneer walls.
1. Introduction
Masonry construction, one of the oldest construction techniques, is still widely used today. In Australia, two commonly used masonry construction systems are the veneer and cavity wall systems. In these systems, an outer brick wall is connected to a backup timber frame or another leaf of brick wall through the use of wall ties. The wall tie is the critical component that transfers lateral load from the non-load-bearing outer brick wall to the inner load-bearing element in the event of wind and earthquake loading conditions.
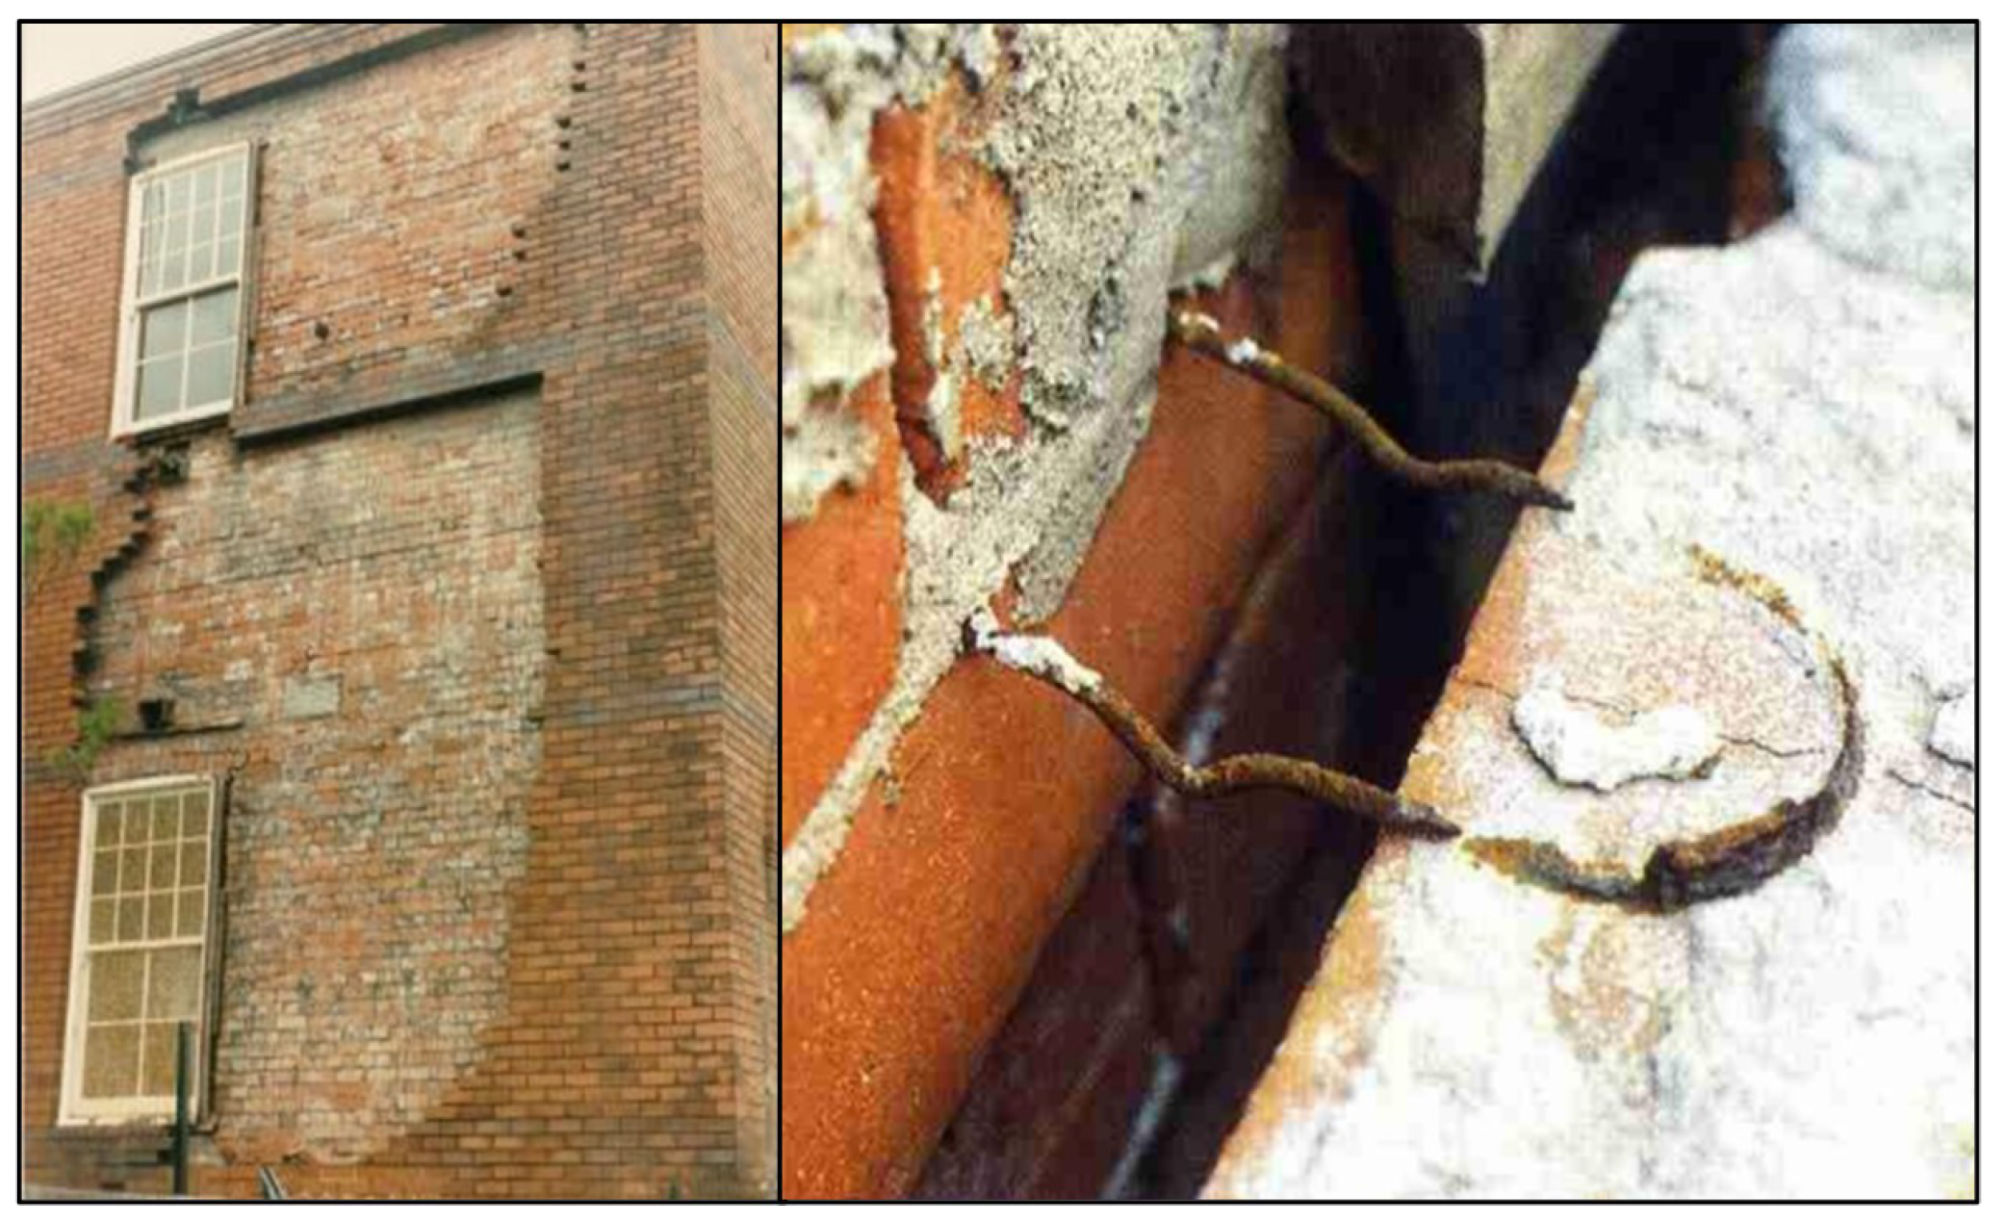
Back in the 19th century, there were inadequate regulations for using wall ties in veneer and cavity wall systems, and steel wall ties which are susceptible to corrosion were often used [1]. In the event of the Newcastle earthquake in 1989, it was revealed by Page et al. [2] that outer brick walls had collapsed due to inadequate wall tie design, poor detailing and wall tie corrosion, as shown in Figure 1. Given that there are still a large number of masonry structures that utilise unregulated wall ties predating the 1990s which are suspected to suffer a similar degree of wall tie deterioration, the condition assessment of wall ties is of increasing importance [3].

Figure 1.
Outer leaf of cavity wall collapsed due to corroded wall ties in the event of Newcastle earthquake in 1989 [4].
One of the effective solutions to address this issue involves an intrusive method where a borescope is inserted into the cavity of the veneer wall, and an image or video of the wall tie conditions is captured directly. However, many researchers have observed that the part of the wall tie that is at and within the bed joints of the outer leaf masonry wall suffered a more severe degree of corrosion [3,4,5]. That particular portion of the wall tie could not be observed by the borescope effectively. Furthermore, insulation materials are sometimes utilised within the cavity, reducing the effectiveness of the borescope and increasing the difficulty of this inspection technique, prompting the use of other more reliable and convenient wall tie condition assessment techniques.
One of the promising methods to address this issue is the use of experimental modal analysis, where the global structural behaviour of a masonry structure is investigated based on vibration measurements. Researchers have been utilising this approach to conduct damage identification on masonry arches [6], unreinforced masonry panels [7] and various case studies that compared the differences in the dynamic behaviour of existing masonry structures before and after rectification or strengthening works [8,9]. Promising results were obtained where areas with significant changes in stiffness after undergoing strengthening operations or cracks due to excessive loading were accurately detected and located based on the changes in modal parameters such as the natural frequencies and mode shapes.
This study focuses on applying well-established vibration-based methods to specifically inspect wall ties within masonry veneer walls, which is an underexplored application. This is particularly significant as traditional inspection methods have limited capability in detecting the deterioration of wall ties, especially when the loss of tie section is concealed within the mortar bed joints. The inability to detect tie deterioration using conventional methods poses a serious risk to both safety and long-term performance. Therefore, the development of non-destructive methods specifically designed for this application is critical for the timely detection and prevention of tie failures. This research addresses this gap and offers a more effective and practical approach to identifying wall tie deterioration in this challenging context.
2. Vibration-Based Damage Identification
Vibration-based damage identification methods have been investigated and developed extensively by many researchers to detect structural damage. Doebling et al. [10] presented a detailed review that covered a wide range of damage identification methods that examine the changes in structural vibration responses. Fan and Qiao [11] furthered this review by including recent developments with a particular focus on beam and plate-like structures which is a reasonable simplification when idealising many civil structures. The main idea is that physical properties such as mass and stiffness of a structure are affected when damage is induced to the structure which in turn causes a change in modal parameters such as natural frequencies, mode shapes and damping ratios [11]. Given the complexity of different structural systems, and the advantages and disadvantages of each identification method, there is no single generalised method that is capable of identifying all types of damage on different types of structures. Hence, for this paper, damage identification methods based on changes in modal parameters that were successfully applied to masonry structures or plate-like structures are prioritised which include natural frequency-based method [12], coordinate modal assurance criteria (COMAC) [13], parameter-based method (PM) [14], curvature damage factor (CDF) [15] and mode-shape-derivative-based damage identification (MSDBDI) method [16].
2.1. Natural Frequency-Based Method
Natural frequencies are more reliable and contain less noise compared to the mode shapes and damping ratios [11]. Common damages experienced by masonry structures are related to cracks and structural deterioration. Assuming there is no considerable mass loss of materials, when stiffness is reduced due to damage, a reduction in natural frequencies is often expected. Although natural frequencies are good indicators for damage detection, no spatial information can be drawn from this global method. Furthermore, the reduction in natural frequencies is also difficult to observe when damage is minimal, and it can be further masked by environmental or experimental noise during the testing process, which may lead to false damage identification [11]. Hence, relying solely on natural frequencies is not sufficient to identify and locate the damage effectively. On the other hand, utilising a combination of natural frequency and mode shape-based damage indicators together demonstrates higher reliability in terms of damage identification and localisation for masonry structures as demonstrated by Pepi et al. [17].
2.2. Coordinate Modal Assurance Criteria (COMAC)
Mode shapes contain local information about a structure, representing the relative displacement of all parts of a structure at a given natural frequency [18]. Changes in mode shapes occur around damaged areas. The disparities compared to the undamaged state can be assessed using the modal assurance criteria (MAC). This criterion measures the numerical correlation between two sets of mode shapes, with a value ranging from 0 to 1. A value of 0 indicates no correlation, while 1 indicates a full correlation between the two sets of mode shapes.
When evaluating MAC, a low MAC value does not explicitly indicate the locations contributing to a low correlation between the two sets of mode shapes. Hence, a variant of MAC called the coordinate modal assurance criteria (COMAC) can be further evaluated at each degree of freedom or measurement location over multiple sets of correlated mode pairs to emphasize the spatial dependence of this correlation parameter [13]. The equation of COMAC is shown in Equation (1).
where and are the mode shape vectors of the undamaged and damaged states, respectively, i is the degree of freedom and n is the number of mode pairs.
2.3. Parameter-Based Method (PM)
Apart from calculating the correlation between mode shapes, Ho and Ewins [19] suggested using the absolute difference between mode shapes of the undamaged and damaged states as a damage indicator. Given that natural frequencies and mode shape changes are all useful information in terms of damage identification, both pieces of information are taken into account where the ratio of natural frequency difference can scale the mode shape of the damaged structure before computing the absolute difference in mode shapes [14]. The equation is shown in Equation (2).
where and are the natural frequencies of the undamaged and damaged states, respectively, j is the mode number, and m is the number of modes.
2.4. Curvature Damage Factor (CDF)
The second derivative of mode shape displacement (curvature) also provides important information in terms of damage identification, and more accurate outcomes were reported in [20,21] as opposed to utilising the mode shape measurements. As the damage may occur at different locations, it may not be captured by comparing just a single mode pair. Hence, the curvature damage factor (CDF) is suggested by Abdel Wahab and De Roeck [15], where the mode shape curvature differences across multiple modes are considered and averaged, as shown in Equation (3).
where and are the mode shape curvatures of the undamaged and damaged states, respectively, and m is the number of modes considered. Note that mode shape curvatures can be calculated by taking the central difference approximation based on the measured mode shape displacements, and the forward and backward difference approximation methods may be used on the edges.
2.5. Mode-Shape-Derivative-Based Damage Identification Method (MSDBDI)
Apart from using mode shape curvature to identify damage, Navabian et al. [16] proposed another method that considers both the first and second derivatives of the mode shape data for a plate-like structure. The method is based on Kirchoff’s plate theory [22] and the authors concluded that it is more reliable compared to COMAC and CDF methods in terms of detecting multiple damage cases and requires fewer modes to identify the exact damage locations. The approach starts with calculating the slopes and curvatures in both the x- and y-directions using central difference approximation. Then, the slopes and curvatures of the whole plate for both undamaged and damaged states can be calculated using Equations (4) to (7), respectively.
where , stand for the mode shape slope and curvature of the whole plate with subscript u indicating the undamaged state while d indicates the damaged state. Finally, Equation (8) can be used to form the MSDBDI index that utilises the slopes and curvatures information from the undamaged and damaged states respectively, and k refers to the number of modes included in the analysis.
The index can be further normalised to better visualise the anomalies using the mean and standard deviation of MSDBDI indices across the whole plate as shown in Equation (13).
Based on Equation (8), the damage index expression for each mode involves the multiplication of the curvature difference between the damaged and undamaged states, and the difference can be either positive or negative. Simply adding the contributions from all modes may cancel out each other and mask significant features. Hence, a slight modification is implemented where the MSDBDI index for each mode is first normalised according to Equation (13) before summing up all the mode contributions and taking the average of the damage index.
3. Experimental Testing Program
3.1. Masonry Veneer Wall Description
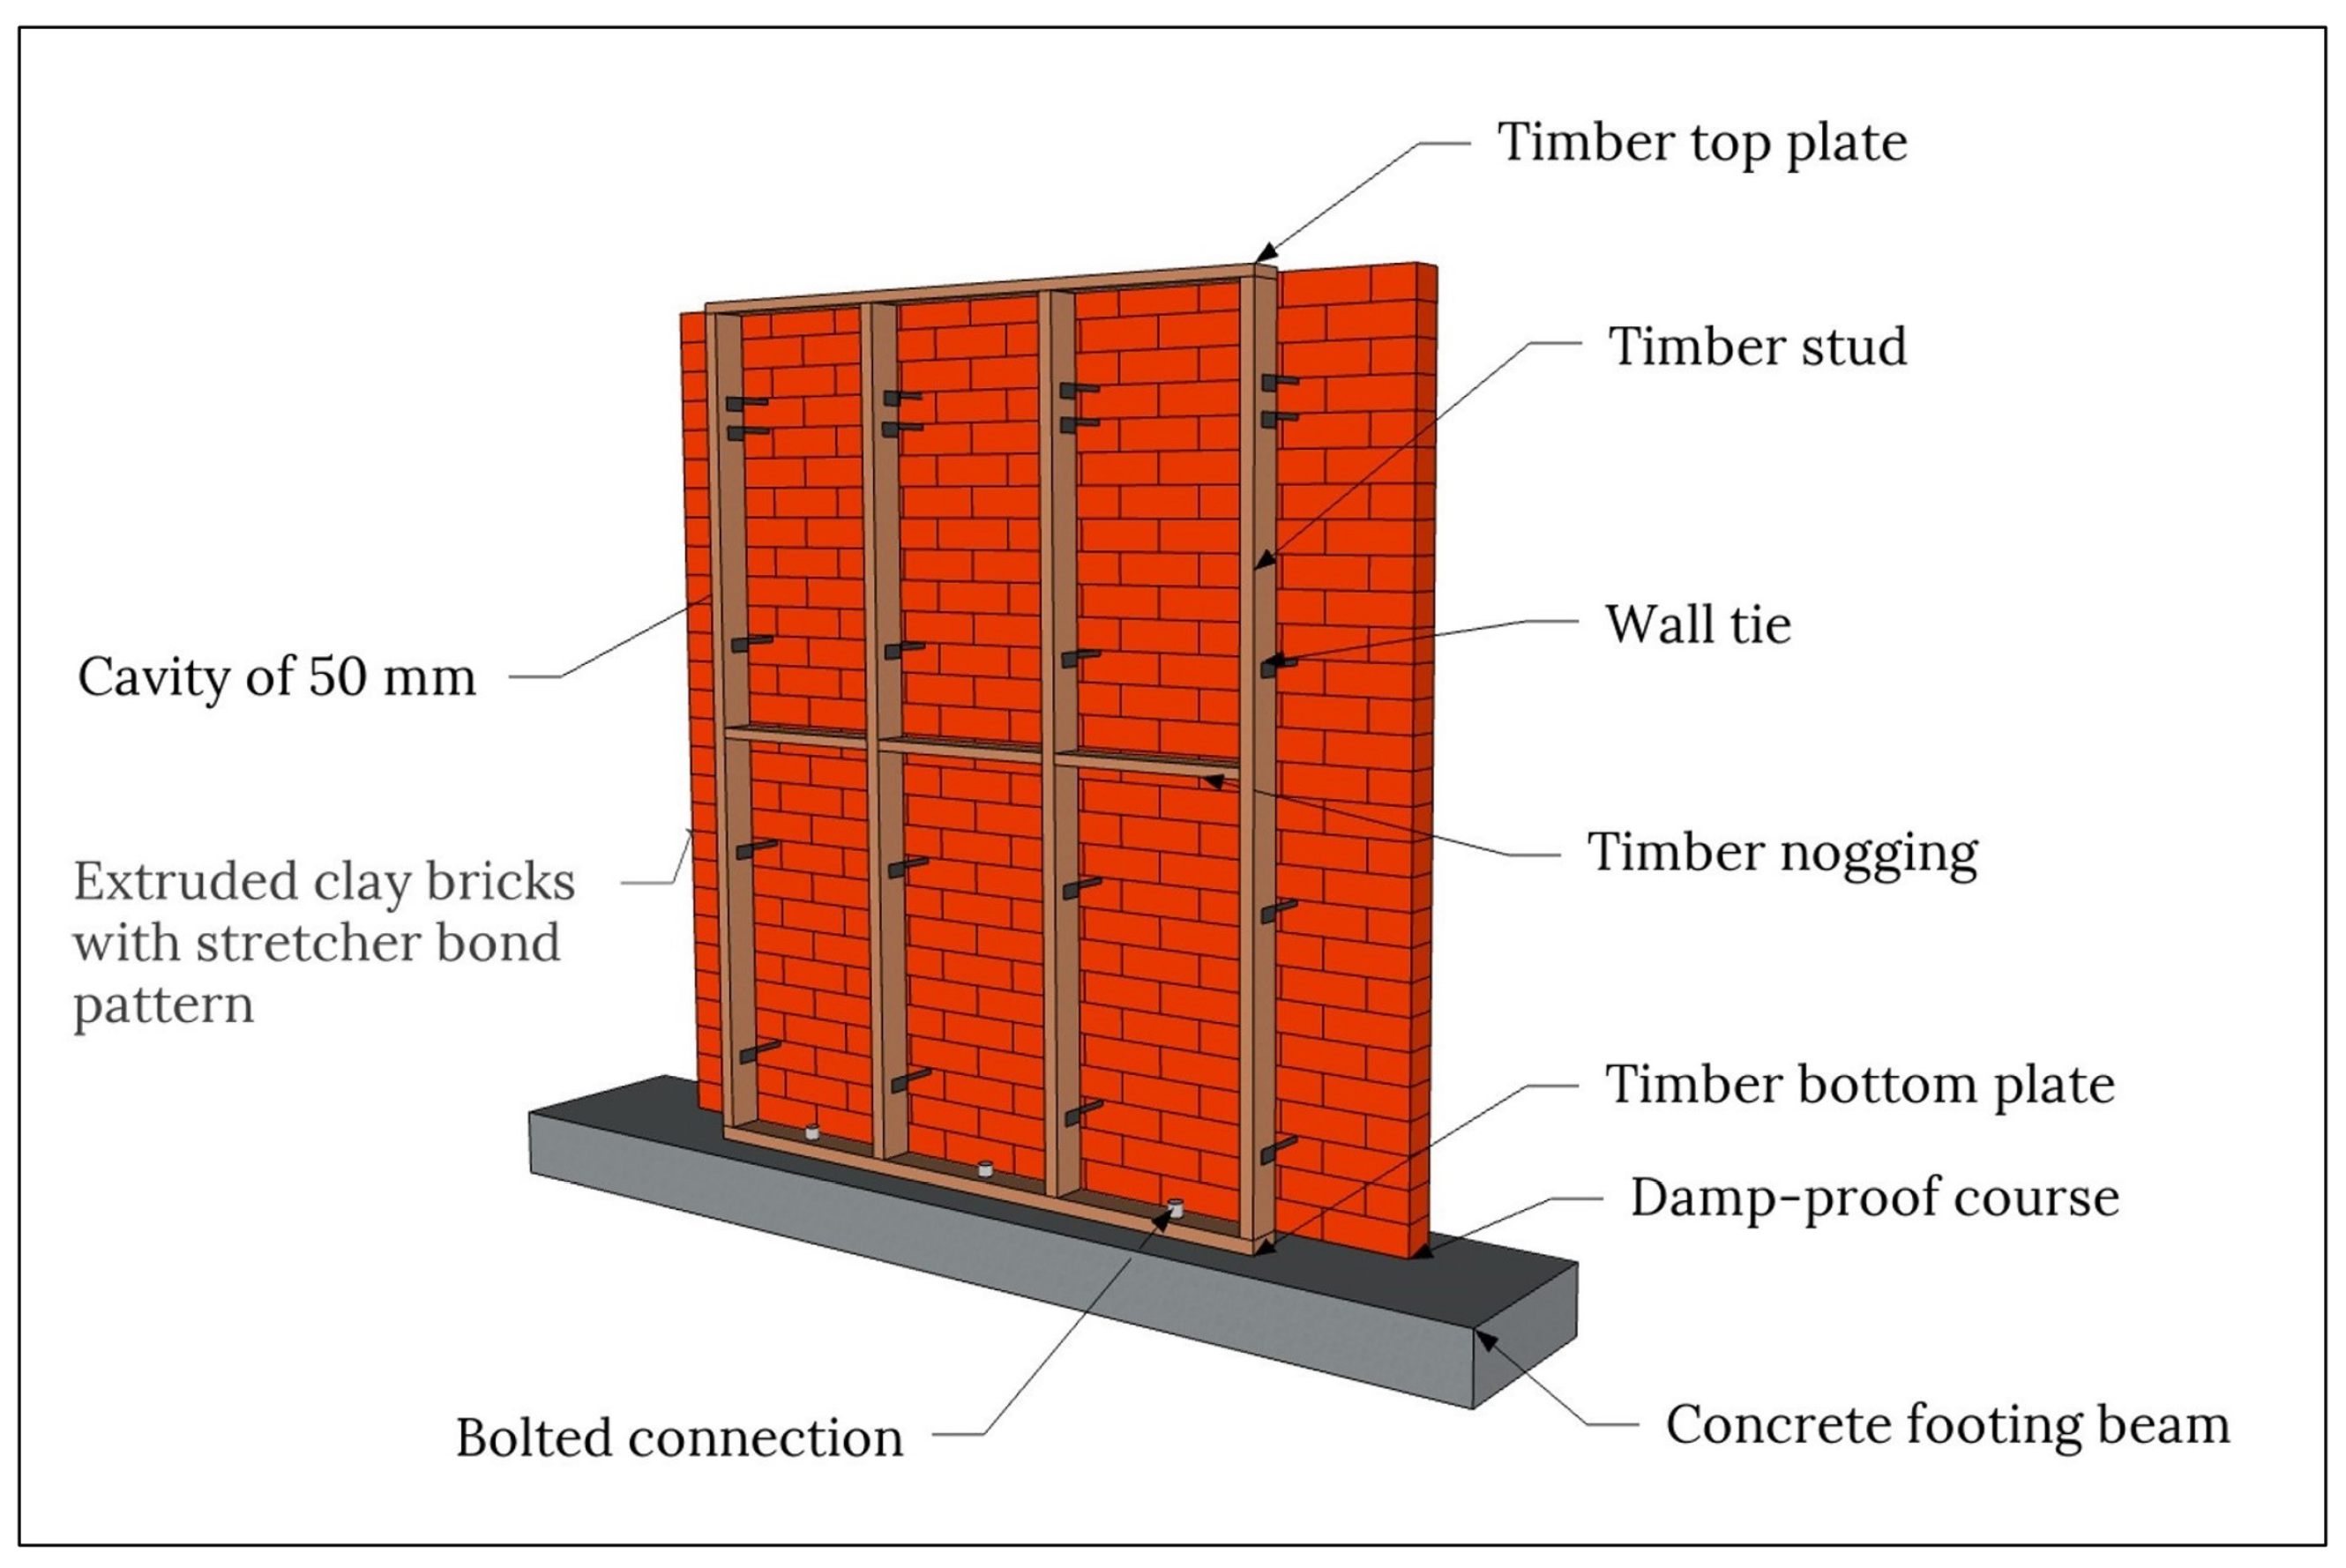
A single one-storey masonry veneer wall was built in the laboratory and experimental modal analysis was performed using an impact hammer. The configuration of the masonry veneer wall specimen is presented in Figure 2. In terms of construction materials, extruded and cored clay bricks with the Standard Australian dimensions of 230 mm × 110 mm × 76 mm (length × width × height) were used to construct the veneer wall. The veneer wall was approximately 2400 mm long × 2400 mm high × 110 mm thick (single masonry leaf), and it was constructed on a concrete footing beam with the application of a damp-proof course to simulate common construction practice for a single-storey wall [23].

Figure 2.
Schematic diagram of masonry veneer wall specimen.
Conventional general-purpose M3 mortar with a mixing ratio of 1:1:6 (cement/lime/sand) by volume in accordance with AS3700 [24] was utilised in the construction of the veneer wall with 10 mm mortar joint thickness. The veneer wall was connected to a timber frame that consists of four 2400 mm long timber studs with a spacing of 600 mm. The studs were connected to a bottom plate, which was bolted to the concrete footing beam, and a top plate which was connected to a reaction frame which prevented movement of the timber frame in the out-of-plane direction of the wall (simply supported). All timber elements were machine-graded pine with stiffness properties of 10,000 MPa (stress grade MGP10) and had a cross-section of 90 mm × 35 mm with the longer dimension aligned normally to the face of the masonry veneer.
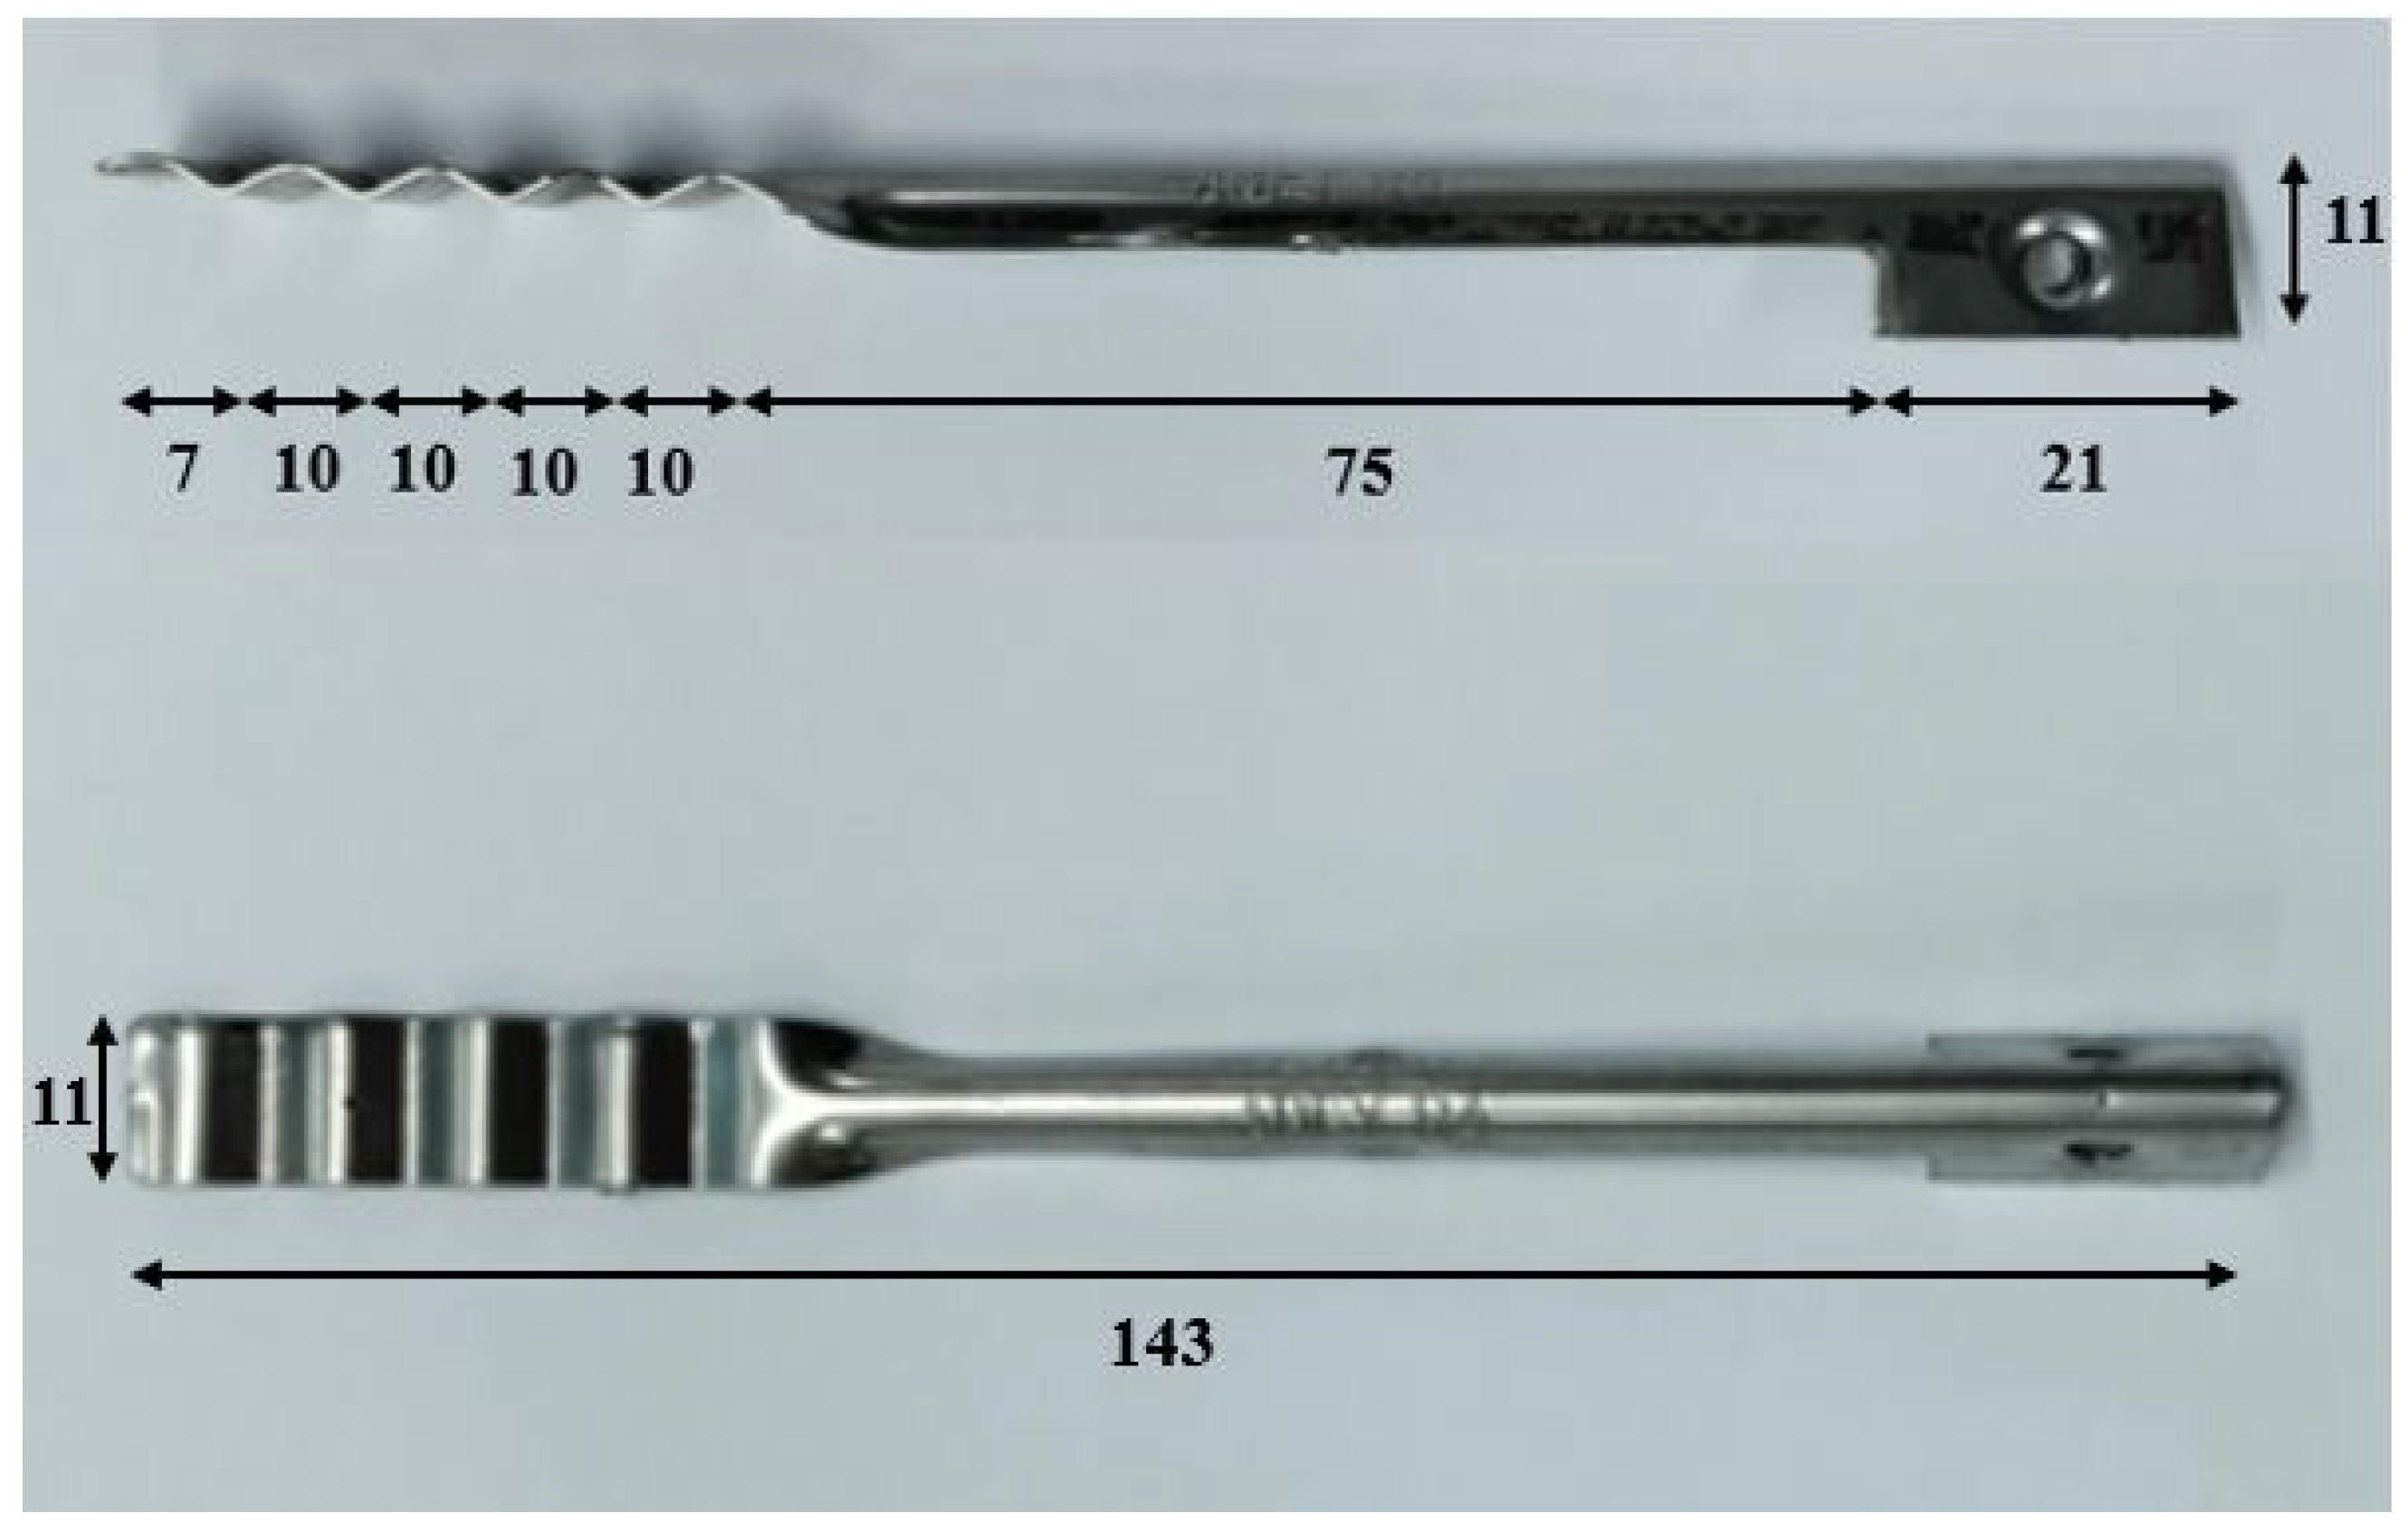
A total of 20 light-duty ‘Type A’ (non-seismic areas) veneer wall ties with durability classification R4 (stainless steel grade) in accordance with AS2699.1 [25] and AS3700 [24] were installed to connect the veneer wall to the timber frame with a cavity width of 50 mm. The dimensions of the veneer wall tie are presented in Figure 3, where the thickness of the wall tie is specified as 0.7 mm according to the manufacturer. Starting at the third course from the bottom of the wall, the wall ties installed with a vertical spacing of approximately 600 mm (7 courses) with an extra row of wall ties on top of the fourth row of wall ties. The wall tie configuration was designed in accordance with AS3700 where a doubled amount of wall ties is required at the top of a masonry veneer that is were connected to a flexible structural backing [24]. The corrugated end of the veneer wall tie was embedded into the mortar for at least 50 mm, whereas the other end was side fixed to the timber stud with a screw. Conventional installation of veneer wall ties on timber studs requires nails for ease of construction but screws were selected in the current experimental program to ensure the removal and re-installation of wall ties could be achieved with minimal disruption and damage to the structure.
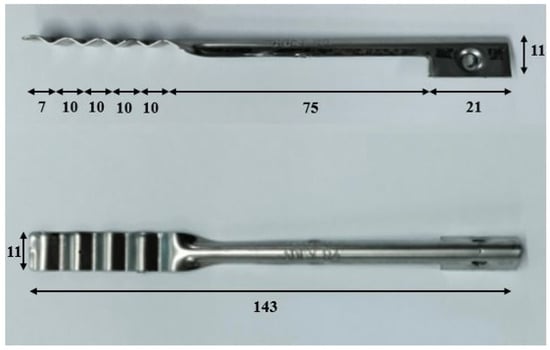
Figure 3.
Dimensions of the selected veneer wall tie. (All dimensions are in mm.)
The veneer wall specimen was built by a professional bricklayer to reflect common construction quality. Due to stability and safety considerations, the veneer wall was built on two separate days, which were one week apart to allow the bottom part of the wall to set and partially cure before constructing the full height of the veneer wall. Given that there is no significant increase in M3 mortar strength from 14 to 28 days observed by Sugo et al. [26], the impact hammer test commenced after the veneer wall was cured for at least 14 days.
3.2. Preliminary Finite Element Modelling of Masonry Veneer Wall
Prior to the impact hammer test, structural eigenvalue analysis of the masonry veneer wall finite element model with dimensions and configurations detailed in Section 3.1 was conducted using DIANA FEA 10.8 [27]. The primary purpose was to identify expected vibration modes of interest that further influence the selection of appropriate equipment and experimental scenarios for investigation. The masonry veneer wall model utilised the simplified micro-modelling strategy to achieve a reasonable accuracy level while using relatively less computational effort [23,28]. The bricks and timber elements are modelled as linear elastic elements while the mortar joint and unit-mortar interface are lumped together using the combined cracking–shearing–crushing model [27]. On the other hand, the wall ties are modelled as uniaxial non-linear elastic truss elements, and the uniaxial stress–strain model was defined based on a series of compression and tension tests of brick-tie-timber subassemblies conducted by Muhit et al. [29].
Based on the observation of the veneer wall under out-of-plane loading, the bases of the veneer wall and timber frame were fixed in translations but were free to rotate, whereas the top of the timber frame was restrained in the translation of the out-of-plane direction only. For the connectivity of the wall ties to the veneer wall in the model, tying boundary conditions were employed where the deflection of one end of the wall tie is the same on the connection point of the masonry wall. While translation was considered in the connection, no connected rotations were taken into consideration [30].
For the input of material properties in the finite element model, material characterisation tests including bond wrench test (BW), shear triplet test (ST), masonry compression test (MC) and lateral modulus of rupture test (RT) were conducted. Specimens were constructed at the same time as the construction of the veneer wall to ensure the estimation of material properties reflects the actual properties of the veneer wall. Material characterisation test results that contributed to the estimation of material properties of the unit, mortar joint and interfaces are summarised in Table 1. The other parameters were based on empirical values or recommendations from the literature, as outlined by Muhit [30].

Table 1.
FEA input of masonry material properties based on material characterisation tests.
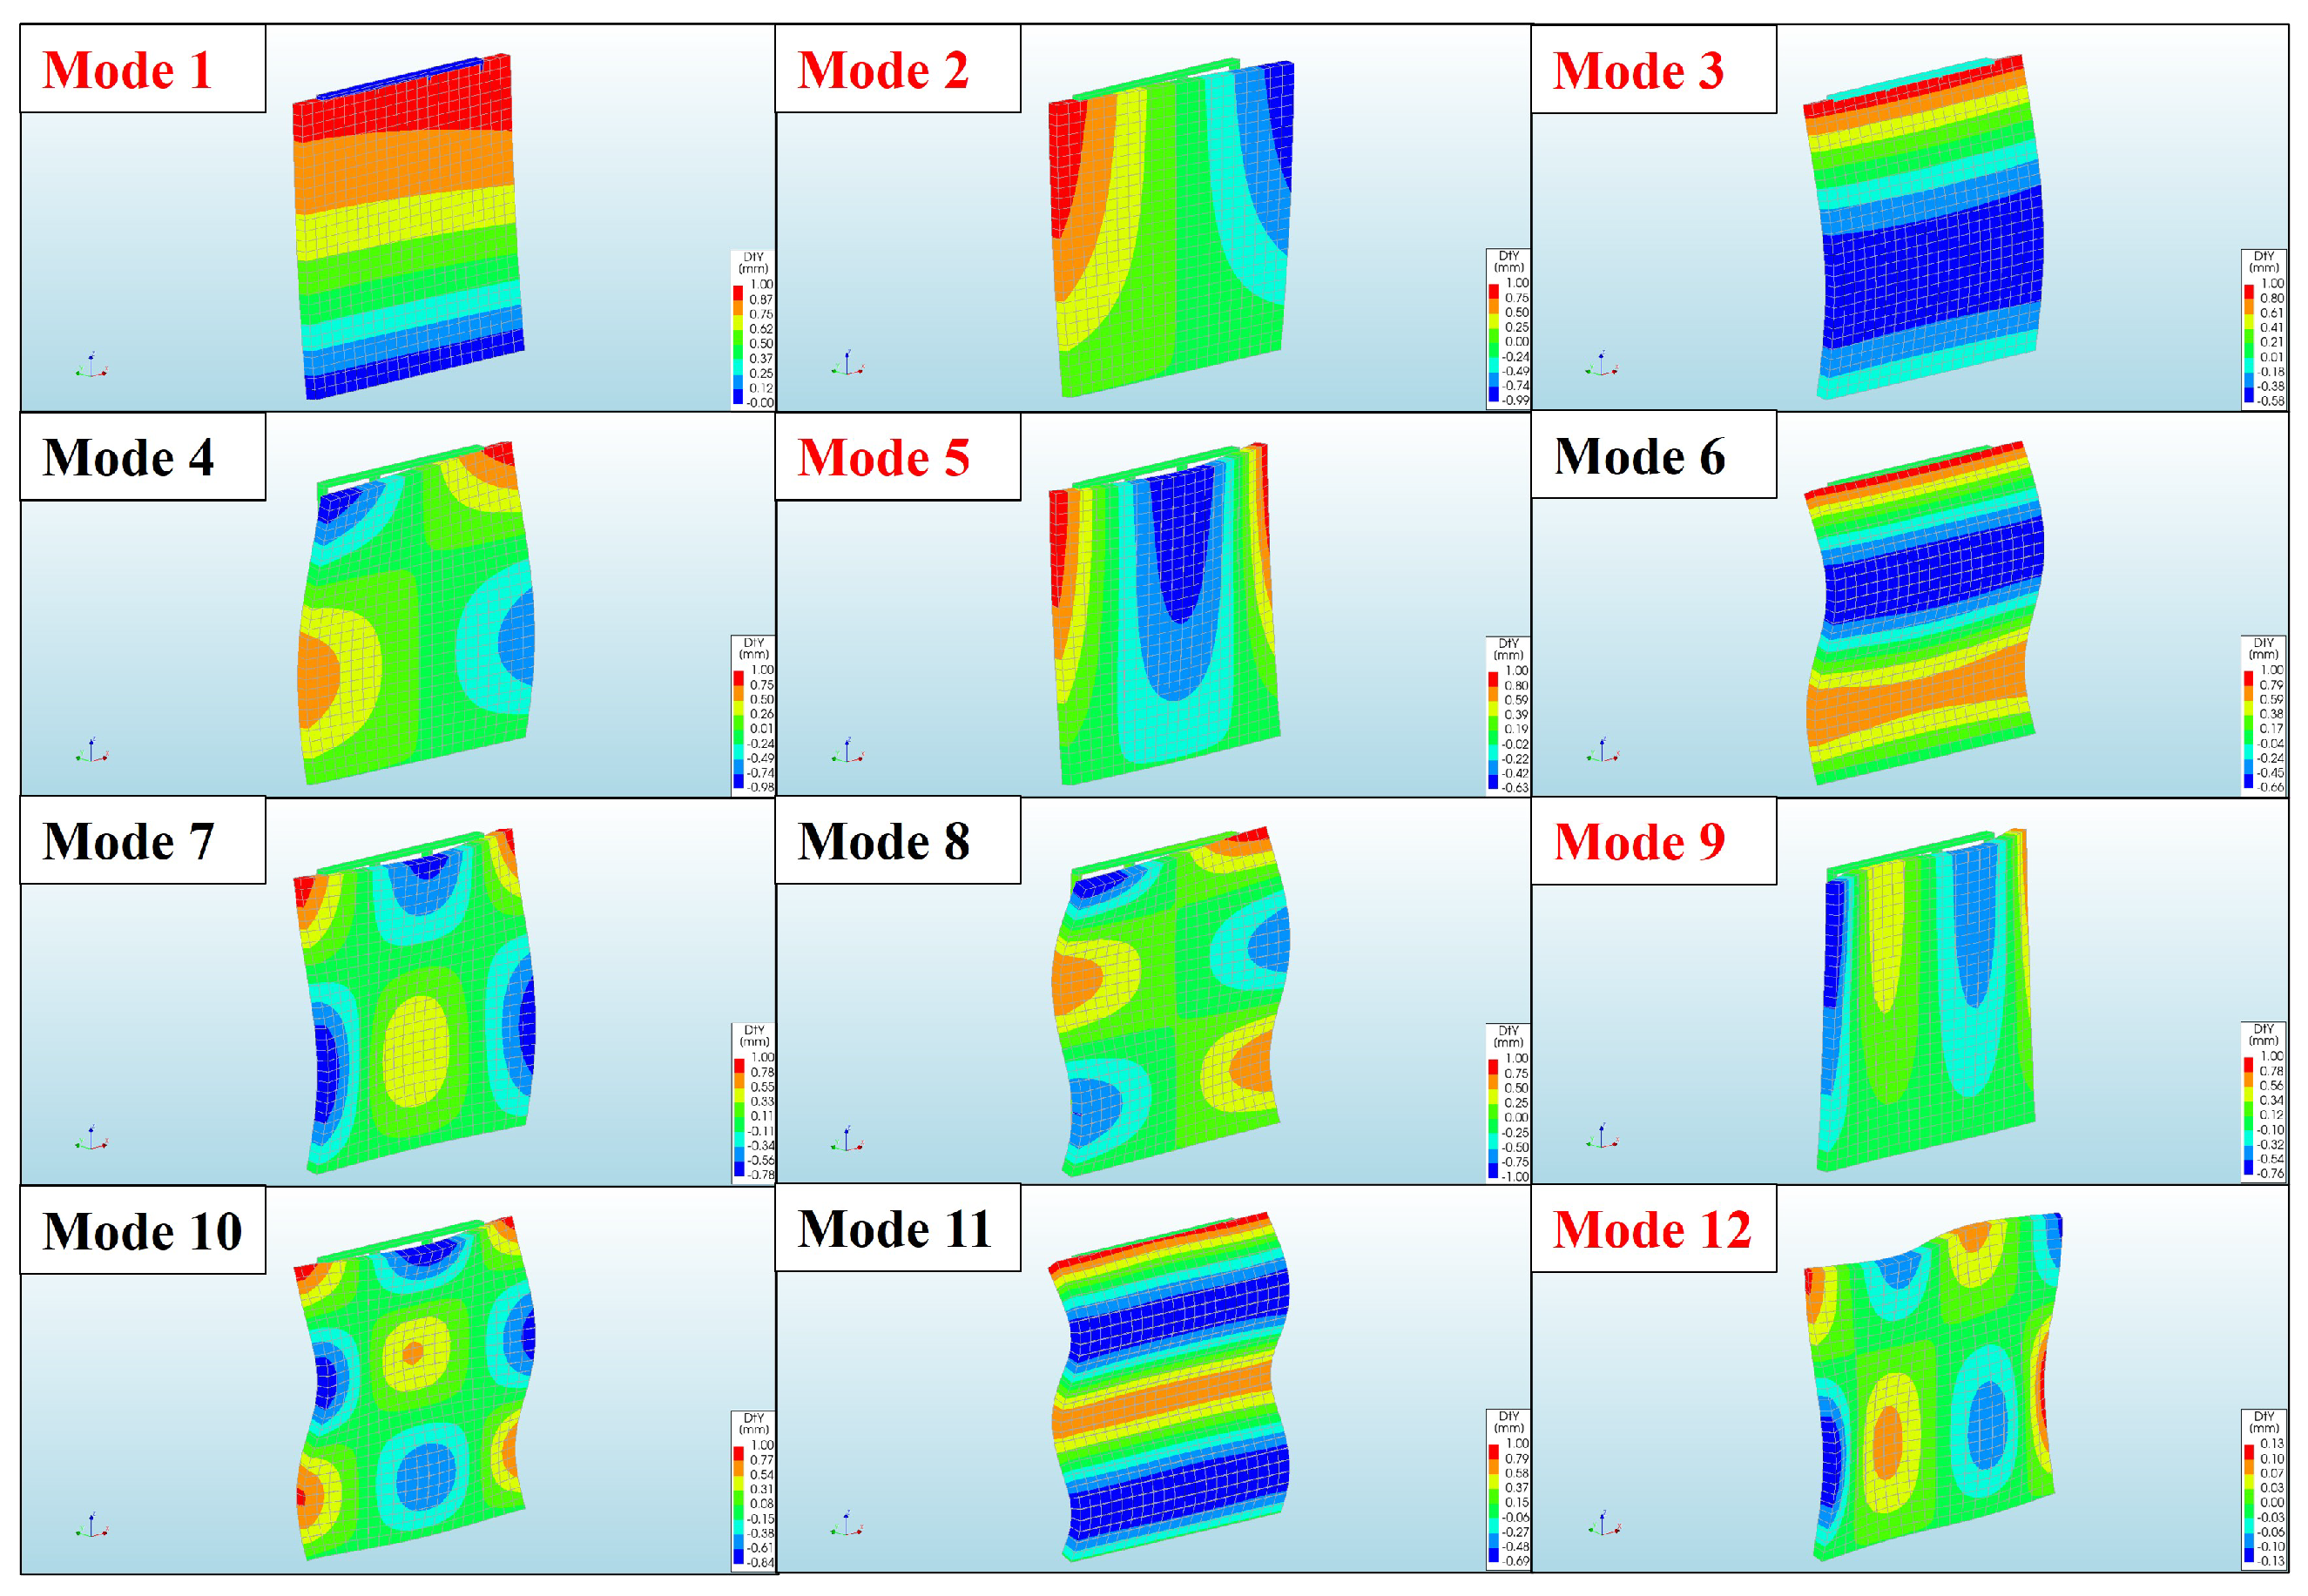
Since wall ties in veneer wall systems are primarily designed to resist lateral (out-of-plane) load and only provide limited shear capacity, out-of-plane vibration modes are more critical. In addition, out-of-plane vibration modes are easier to excite and measure in a practical field setting than in-plane vibration modes. Hence, only out-of-plane vibration modes were investigated both experimentally and numerically while in-plane vibration modes were excluded in this study. A total of 12 out-of-plane vibration modes (bending and torsional modes) were identified from the numerical model up to 250 Hz only, as vibration modes with higher frequencies are more difficult to measure experimentally with high accuracy. The numerical modes obtained for the reference case are shown in Figure 4.
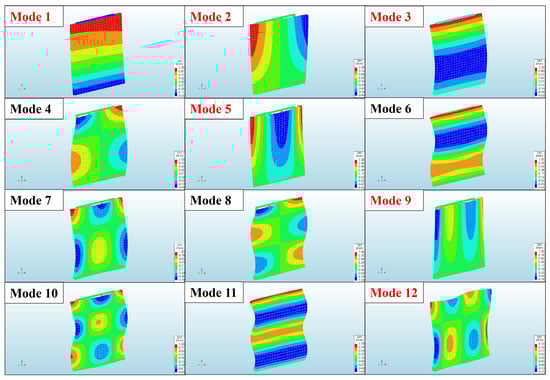
Figure 4.
All numerically simulated mode shapes of the masonry veneer wall with fully functional wall ties within a frequency range of 250 Hz. Modes 1, 2, 3, 5, 9 and 12 are highlighted to emphasise the correspondence with the six renumbered experimental modes obtained in the subsequent section.
3.3. Impact Hammer Testing
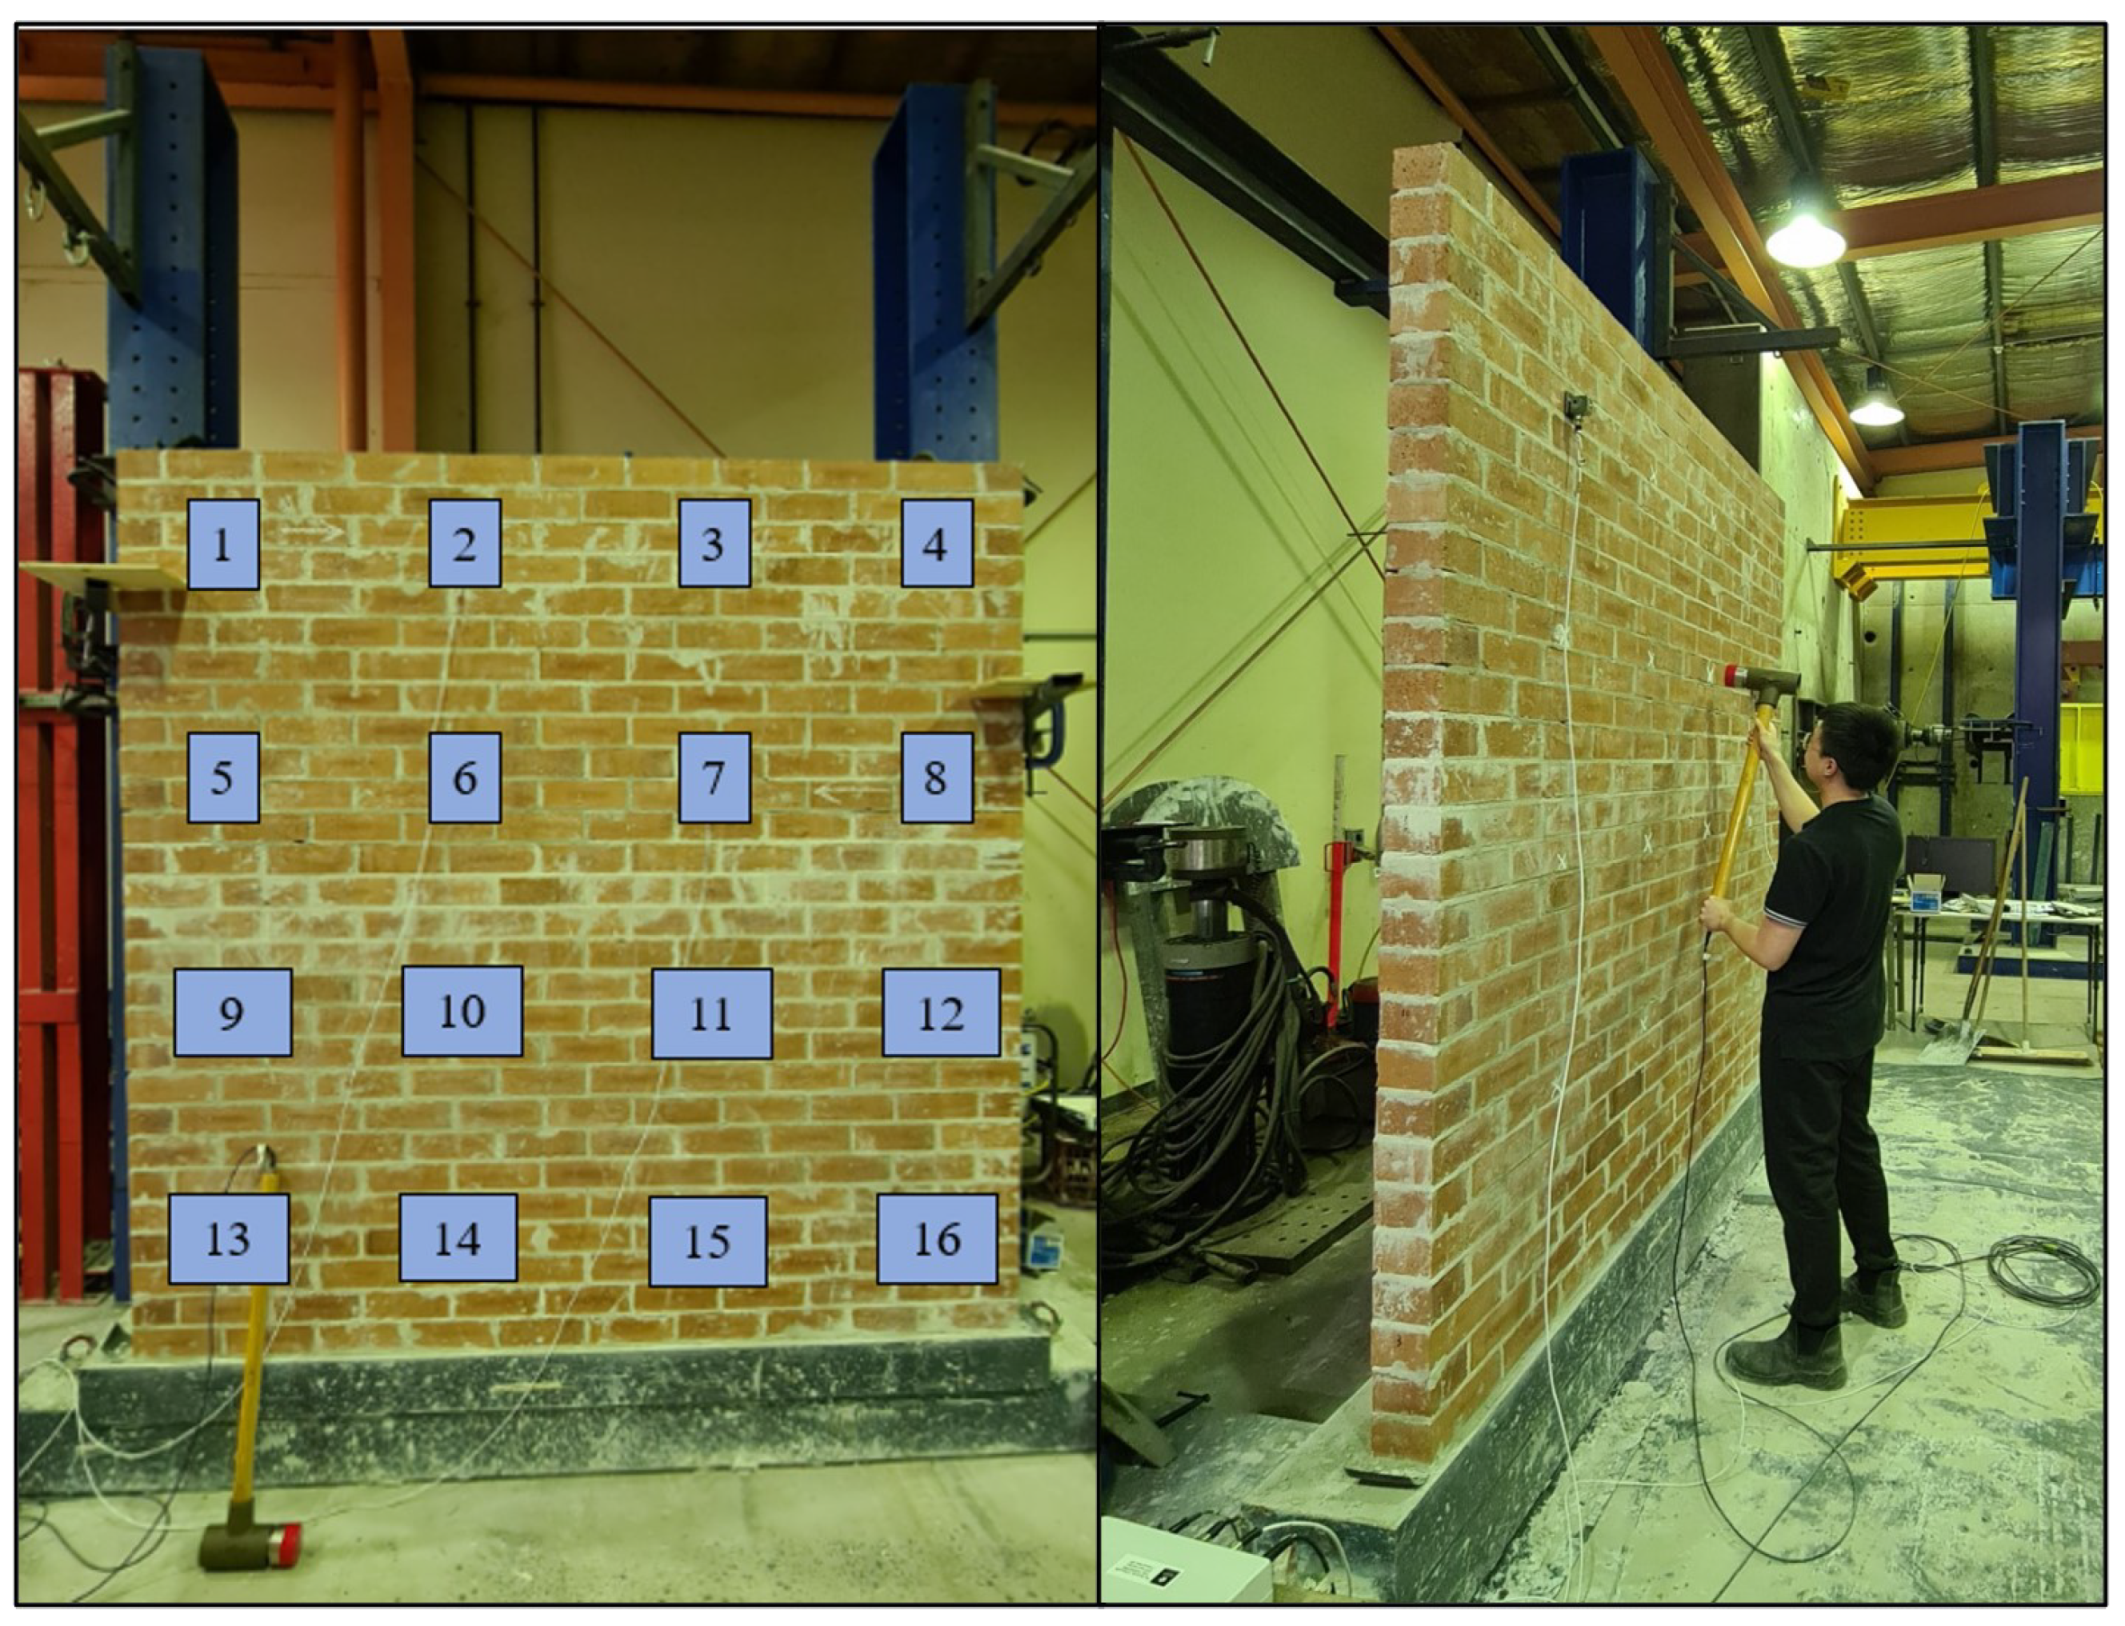
Impact hammer was selected as the vibration source due to its convenience and portability. A higher signal-to-noise ratio can also be achieved by providing an external excitation using the impact hammer compared to ambient vibration [12]. Based on the expected modes of interest from the structural eigenvalue analysis, a 4 × 4 grid was defined on the masonry veneer wall for applying impact hammer excitation. Points were not defined directly at the edges of the brick wall to avoid accidentally damaging the corners and edges with the impact hammer. The grid points did not coincide with the exact locations of the wall ties to examine if the damage localisation methods could approximate the locations of deteriorated wall ties without prior information on their exact locations. The wall tie and impact locations are shown in Figure 5.
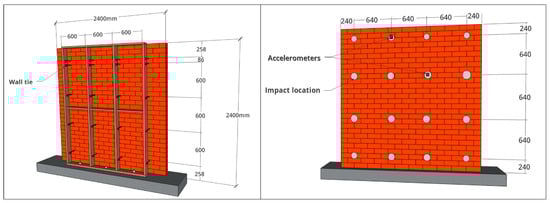
Figure 5.
Schematic diagram of wall tie, impact and accelerometer locations. All measurements are in millimeters.
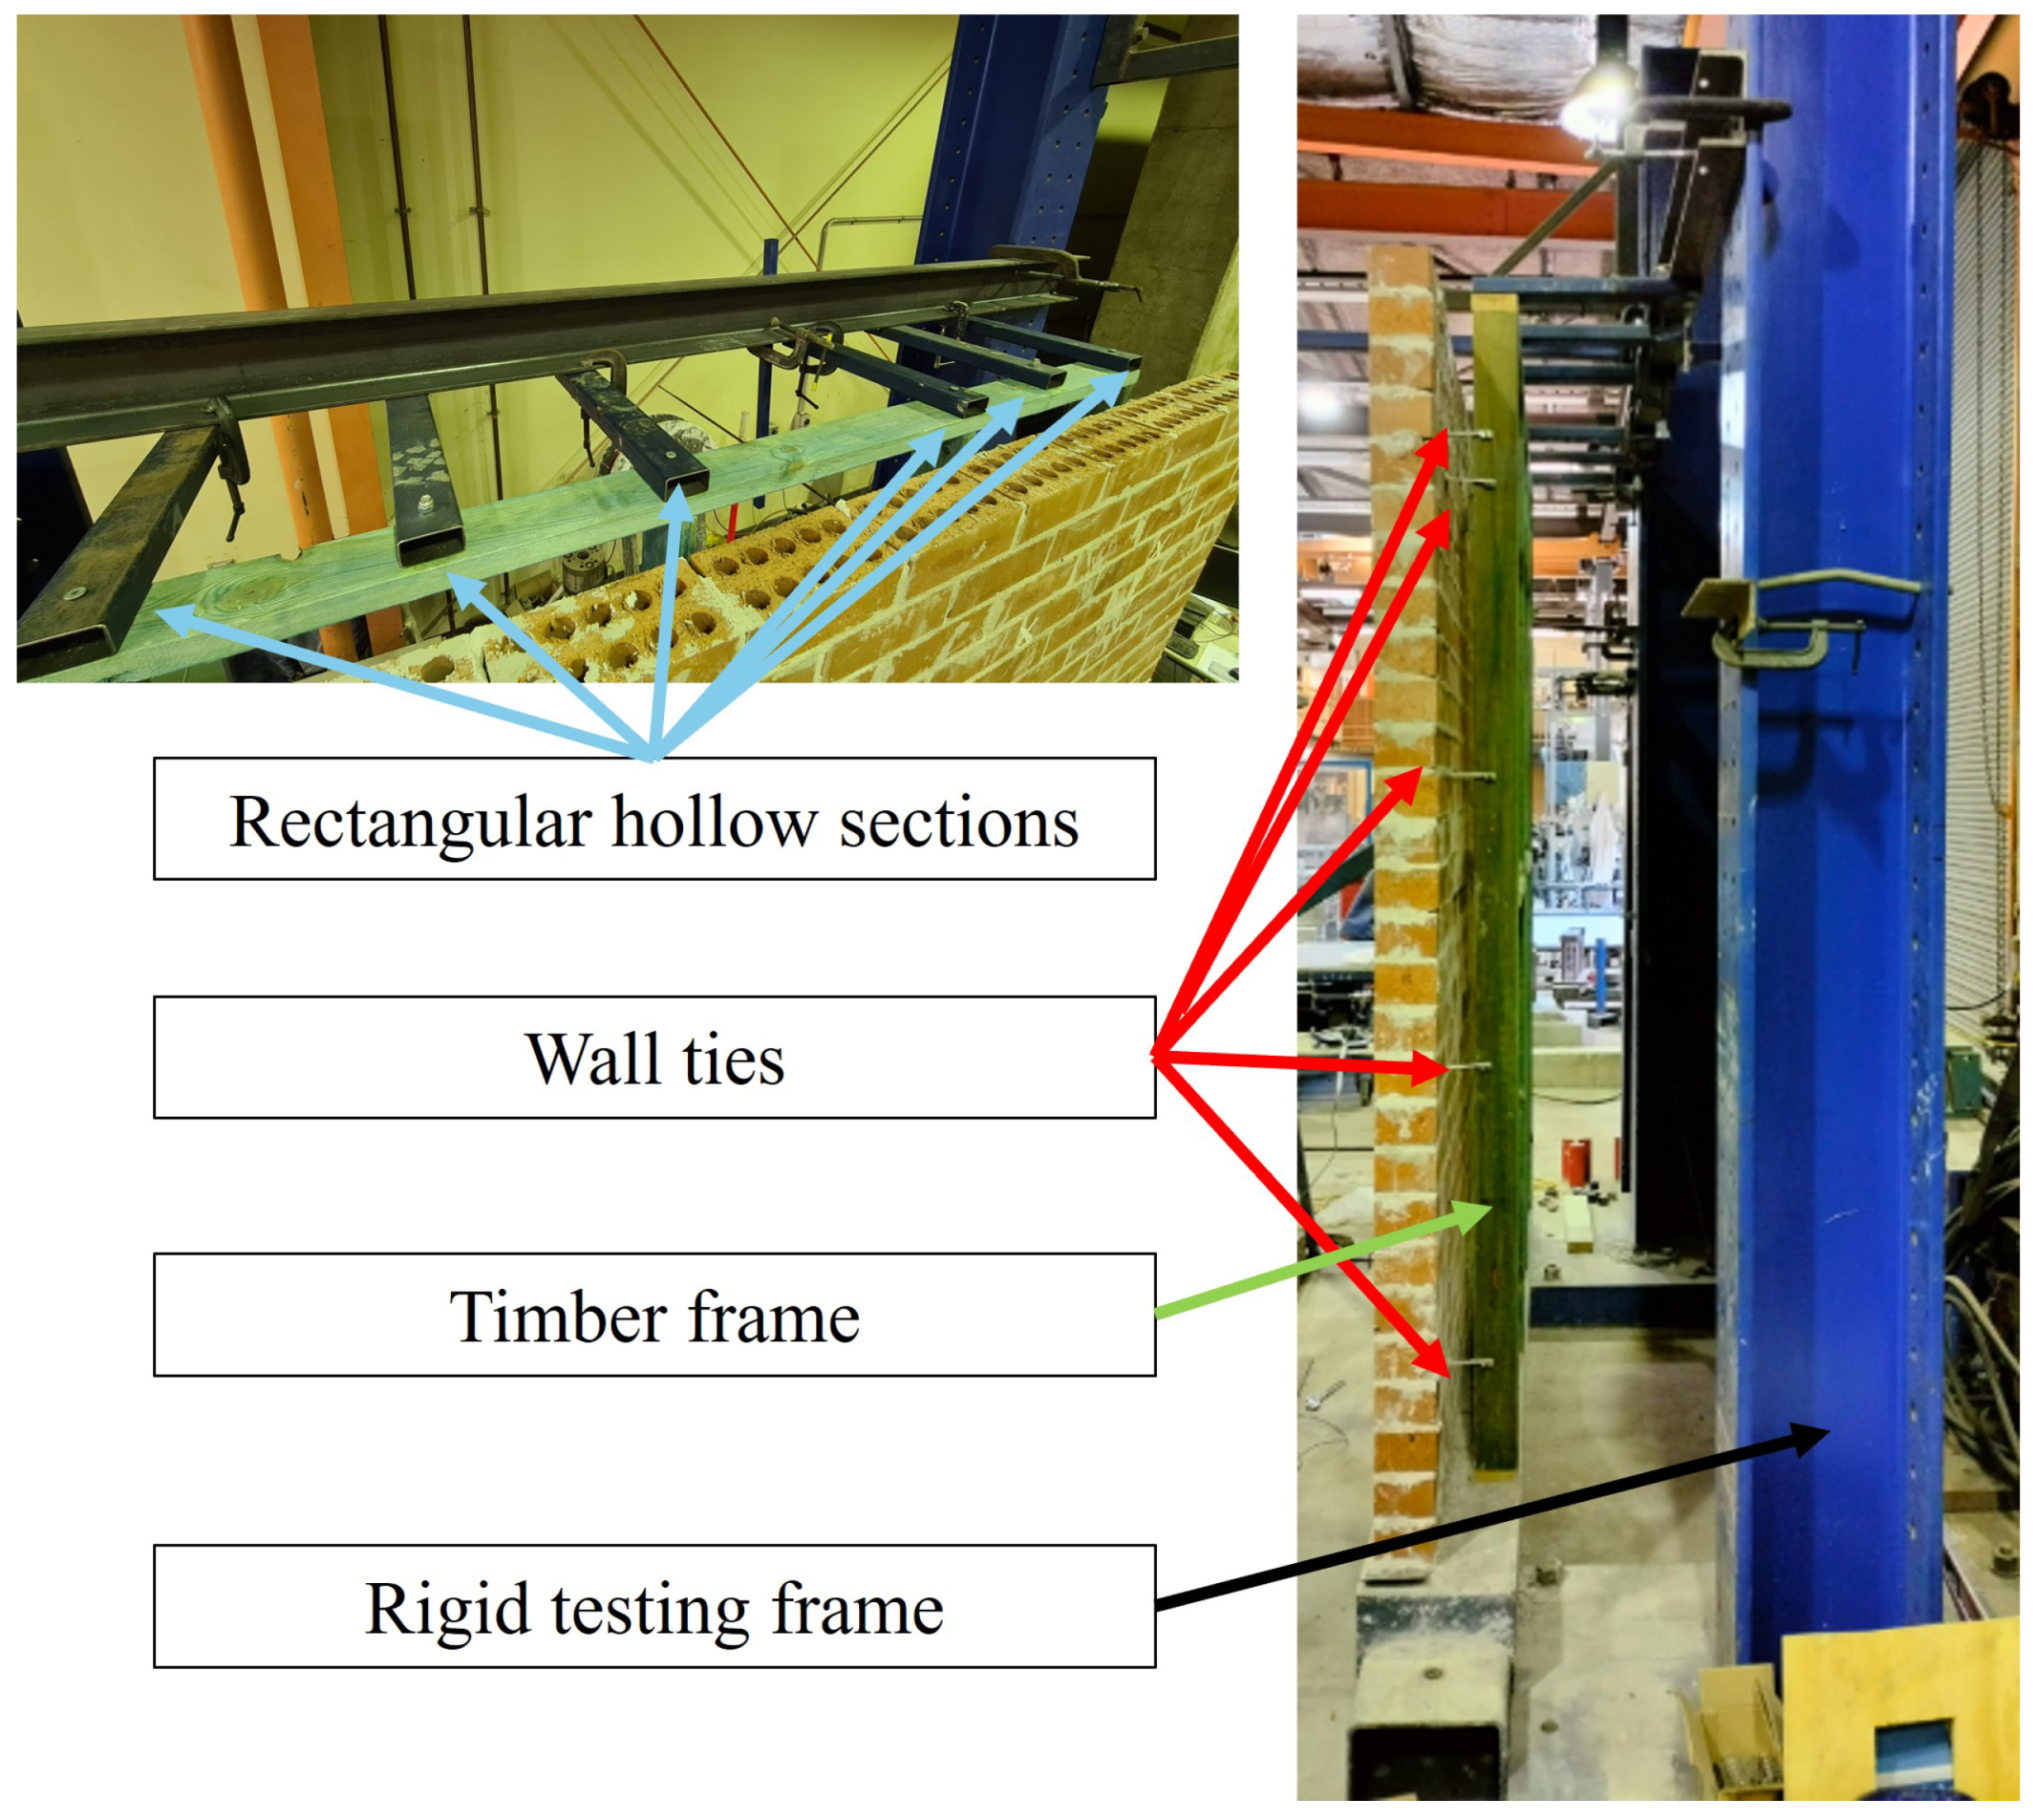
After examining the expected vibration modes, the density of grid points was deemed appropriate to prevent an aliasing effect on the mode shape measurements while also considering the practicality and time constraint of the test. Two accelerometers were attached at Points 2 and 7 to record the out-of-plane acceleration responses of the veneer wall. The two strategically selected measurement locations were deemed sufficient to capture the significant dynamic behaviours of the veneer wall as justified by the high modal assurance criterion values between the experimental modes extracted from the collected data using only the two measurement locations and the numerically simulated modes. The impact hammer test setup and the defined grid points are shown in Figure 6, whereas the top and side views of the veneer wall specimen are shown in Figure 7. In the event of wall tie deterioration within a veneer wall, no significant stiffness reduction would likely occur directly to the timber frame; hence, no measurements are taken from the timber frame. Furthermore, access to the back of the veneer wall is denied to simulate the typical condition encountered in a practical wall tie inspection process.

Figure 6.
Grid points defined on the veneer wall specimen and the process of impact hammer testing. The grid points (impact locations) are numbered 1 to 16, starting from the top left corner to the bottom right corner of the veneer wall.
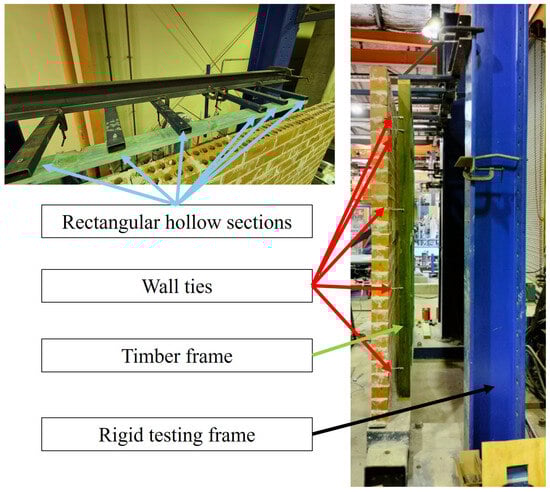
Figure 7.
The top and side views of the veneer wall specimen, where the top timber plate is bolted to multiple rectangular hollow sections and clamped to the testing frame.
Limited studies have been conducted to conclude which part of the wall is more prone to corrosion of wall ties, but attention has been drawn towards the lower ends of the structure due to the humidity of a cavity in a poorly ventilated veneer wall construction and the influence of the moisture from the ground [35]. On the other hand, Chaves et al. [3] observed that corrosion of wall ties within the brick cavity at the same elevation within the same building varies in severity and is influenced by the orientation of the building in which the side that received less exposure from the sun presented a higher corrosion loss. Hence, four different deterioration cases were simulated by disconnecting wall ties row by row to cover potential deterioration scenarios due to height variation. Individual wall ties were also detached in two test configurations to investigate the effectiveness and sensitivity of the damage identification methods. In addition, another two deterioration cases were investigated by detaching columns of wall ties to simulate loss of wall tie connection due to poor workmanship or detailing issues. All simulated deterioration test cases are summarized in Table 2.
Table 2.
Summary of simulated wall tie deterioration cases, specifying the location and number of disconnected wall ties.
A PCB Piezotronics large sledge impact hammer with the model number 086D50 was used in the test where impacts were applied in the out-of-plane direction from Points 1 to 16 on the veneer wall with five repetitions at each impact location to obtain an averaged response. Two HS-173 accelerometers with 100 mV/g sensitivity, a frequency range from 2 Hz to 10 kHz, and a dynamic range equal to ±80 g were used to measure the corresponding acceleration responses due to the hammer impacts. The accelerometers were mounted at Point 2 and Point 7 as reference positions using hot-melt adhesive on a square steel plate to smooth the masonry wall surface.
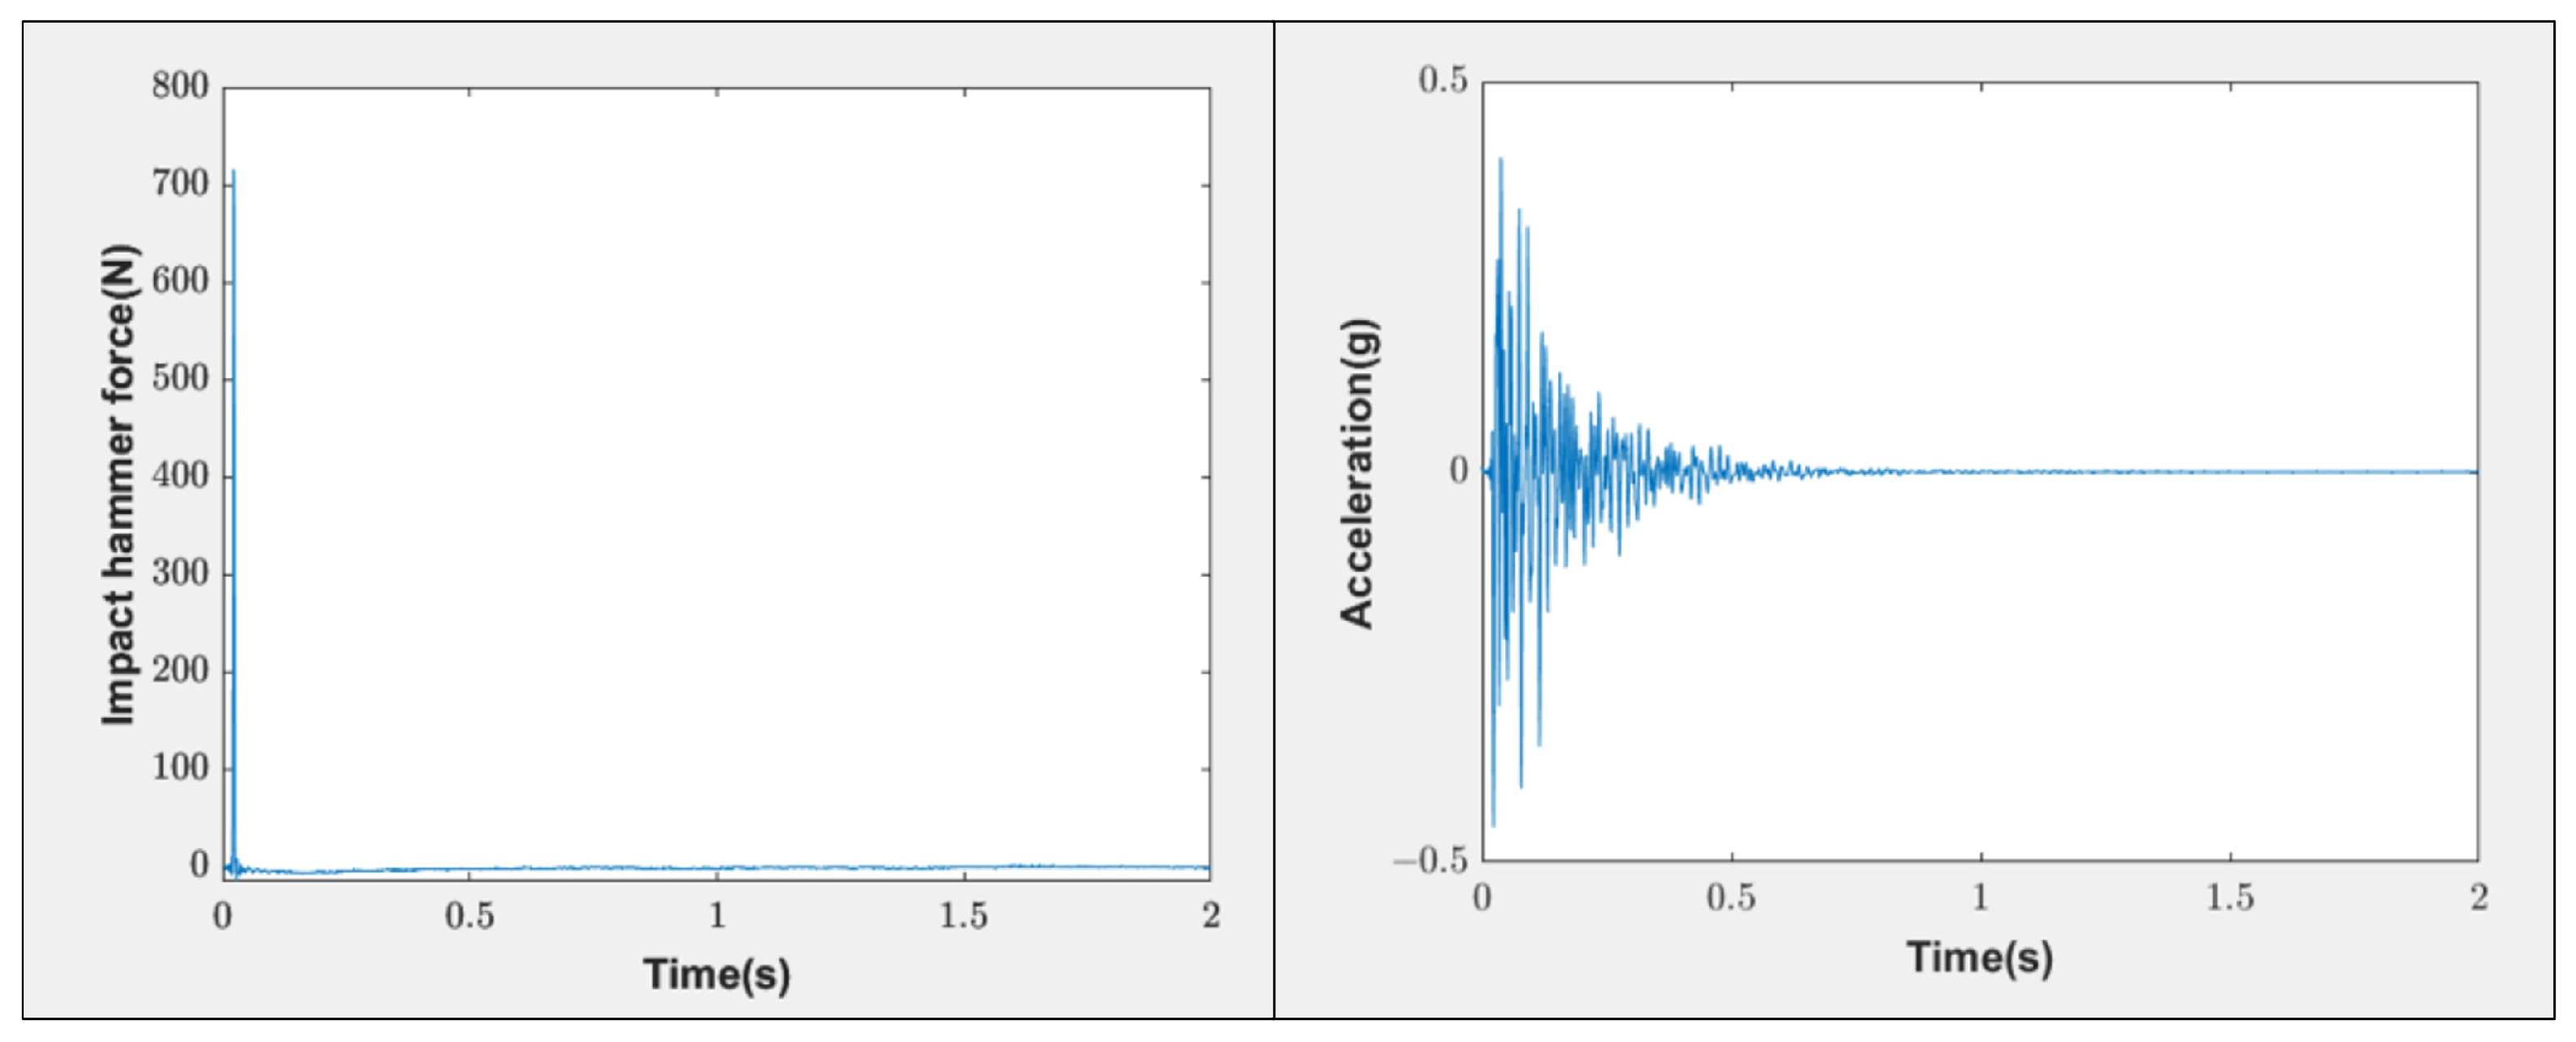
Accelerometers and the impact hammer were connected to the National Instruments cDAQ-9178 data logging system. LabVIEW was used to display all the readings obtained from the test. The sampling rate of the test was set to 1000 Hz and a pre-trigger of 20 ms was set to capture the complete signal of the impact once a force level exceeding 100 N was detected. The force level was kept between 700 N and 900 N to ensure reasonable coherence between each impact. Each impact was recorded for 2 s until the vibrating motion decayed significantly to avoid using an excessive windowing function that may affect the measurement quality. An example of the impact hammer force signal applied at Point 1 and the corresponding acceleration signal measured at Point 2 is shown in Figure 8.

Figure 8.
An example of one impact hammer force signal at Point 1 with corresponding wall acceleration signal at Point 2.
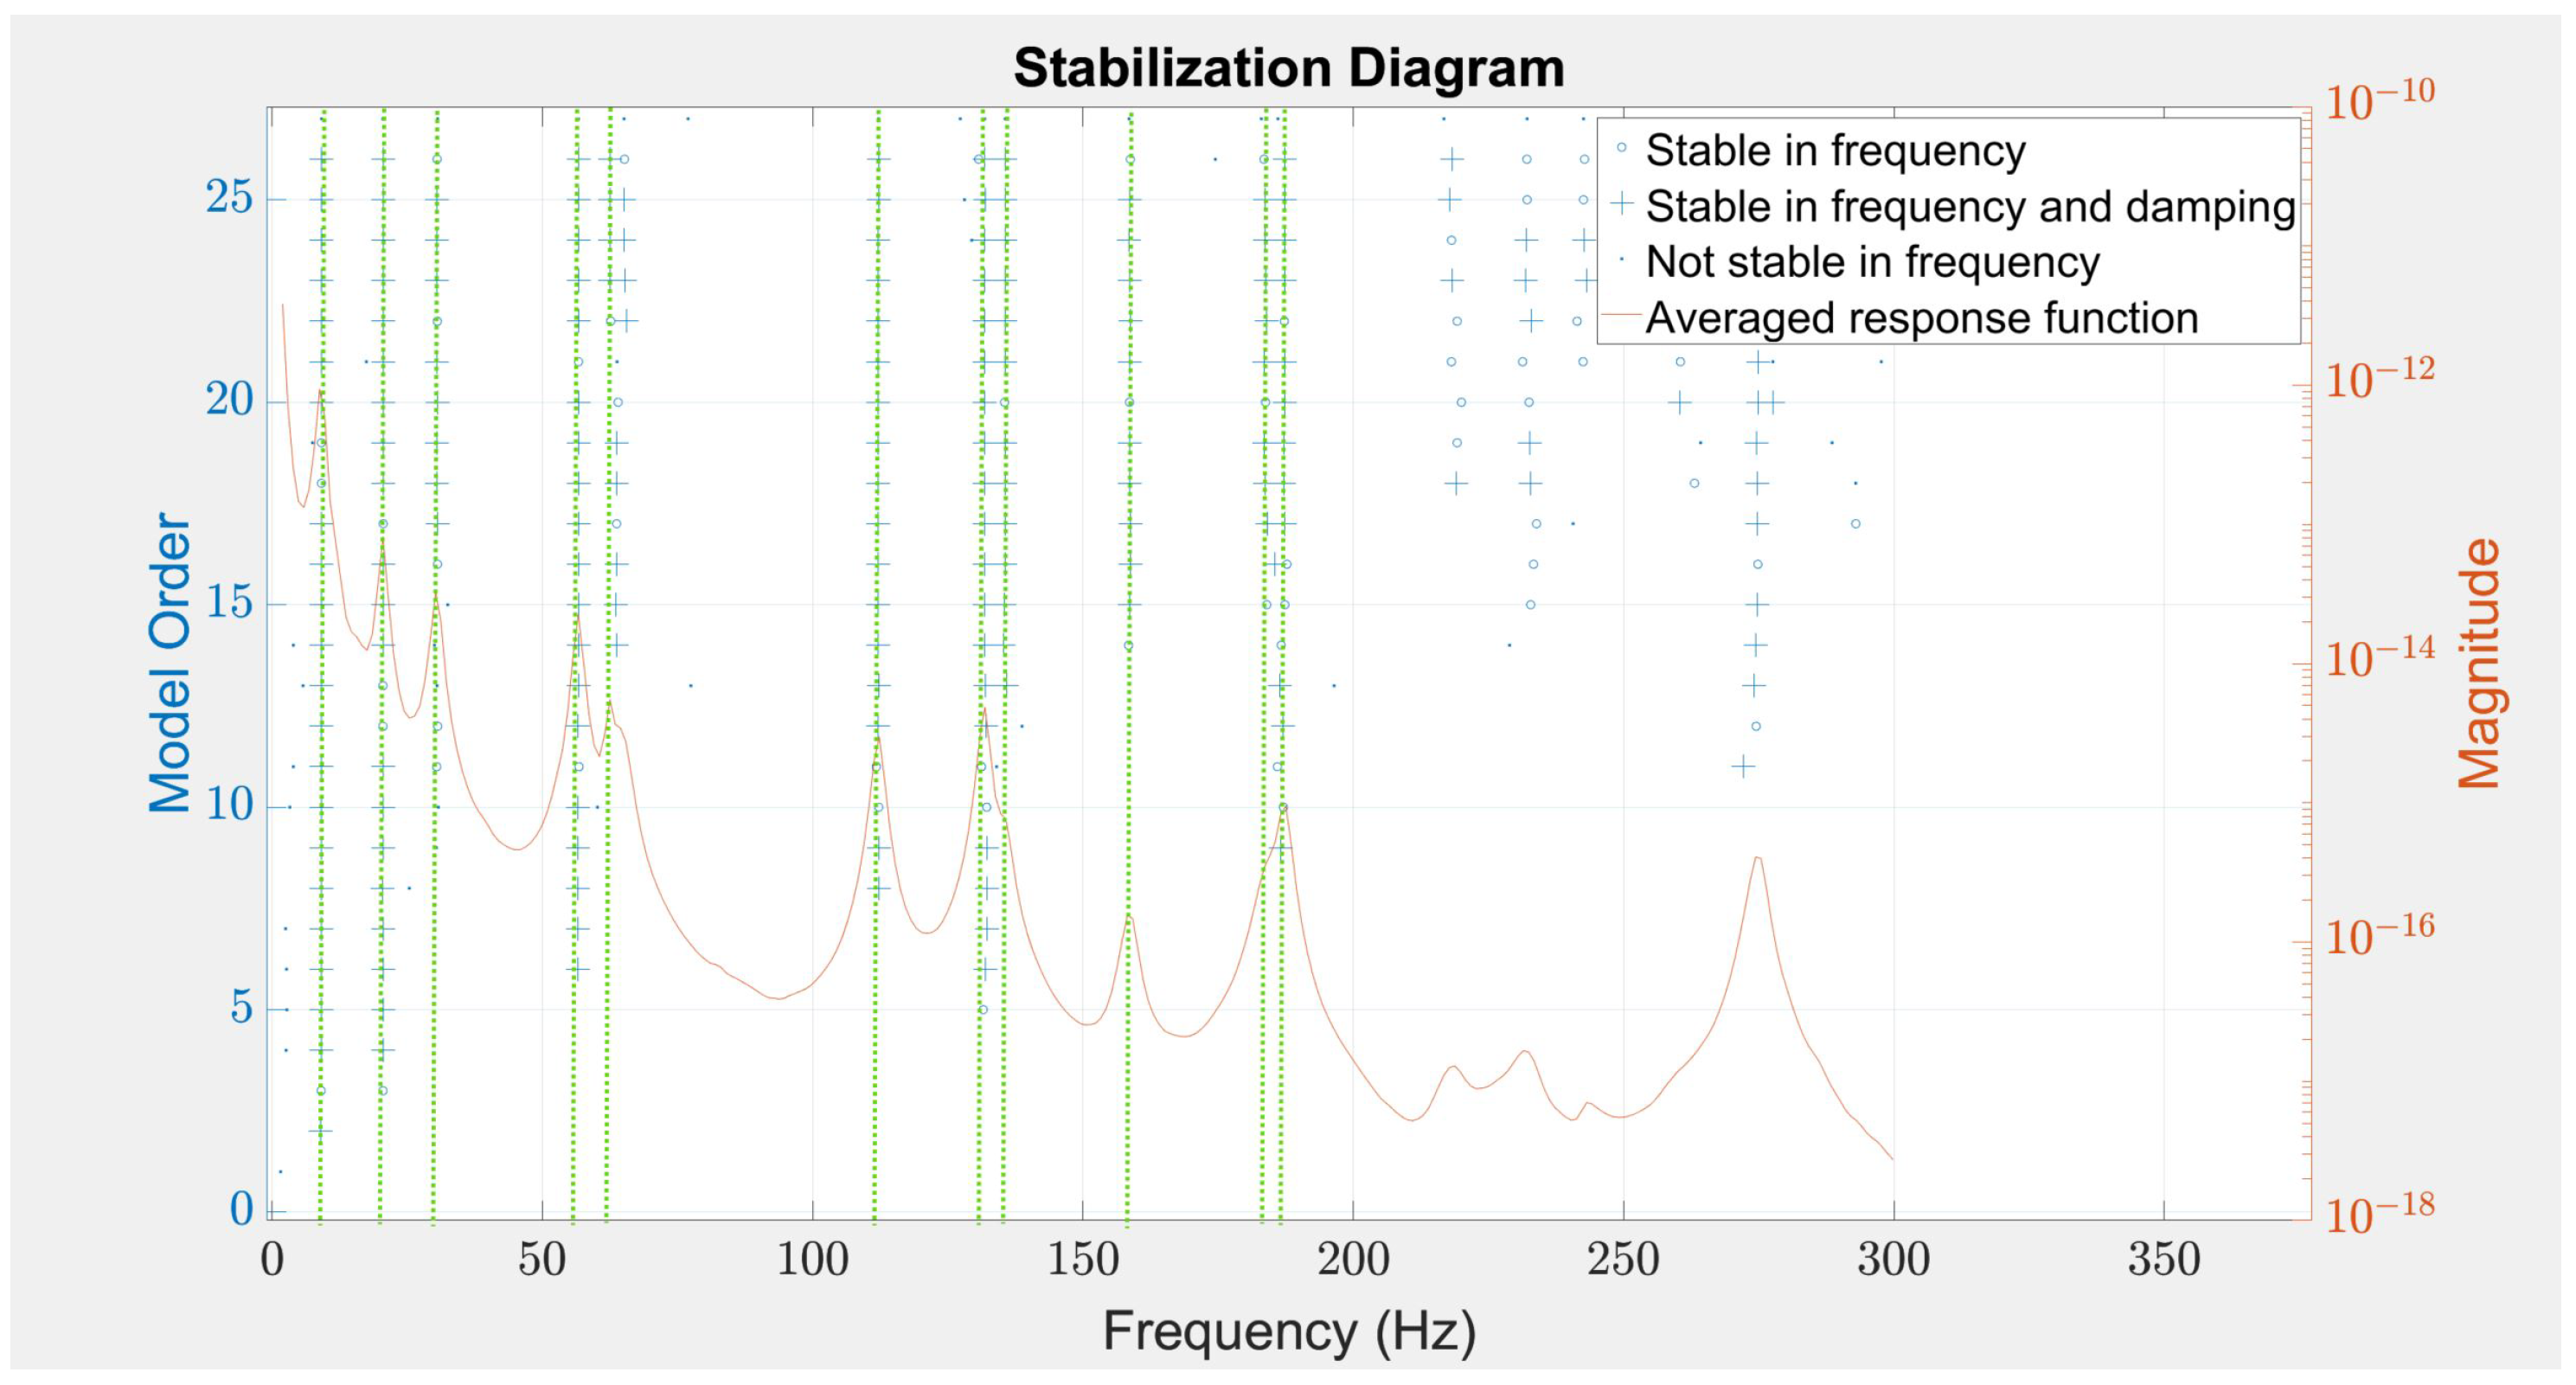
In terms of the signal processing procedures, a fifth-order Butterworth low-pass filter with a cutoff frequency of 350 Hz was applied to the raw measurement signals, attenuating noise at higher frequencies. Furthermore, force and exponential window functions were applied to the force and acceleration signals, respectively, to obtain more accurate frequency response functions (FRFs) and modal parameter estimation. Given that the vibration signals obtained from this laboratory-based experiment contain less noise compared to field data, no further filtering and signal processing techniques were applied. However, when dealing with vibration data in the field that contains a higher noise level due to environmental disturbance, examples of alternative filtering and signal processing techniques can be found in [36] to mitigate noise and improve the signal-to-noise ratio. After constructing the FRFs using the filtered and windowed signals, MATLAB least-square rational function (LSRF) algorithm was used to estimate a single set of global modal parameters by fitting a shared denominator transfer function to the multi-input, multi-output FRFs [37]. Poles corresponding to the computational modes were generated and a stabilisation diagram was used to identify poles that remained stable in both frequency and damping ratio as the model order increased. The stabilisation diagram for the result of the reference test case is shown in Figure 9. Genuine modes could be identified when the stable poles tend to remain and align at particular frequencies. Further checks were conducted to confirm the authenticity of genuine modes using modal assurance criteria (MAC) to compare the similarity of mode shapes between the experimental and numerically simulated mode shapes for each test case, respectively. Only modes with MAC values larger than 0.80 are deemed genuine modes and included for further analysis [17]. The identified genuine modes for the reference test case after the data analysis process are highlighted using green dotted lines, as shown in Figure 9. After determining the stable vibration modes, the ‘modalfit’ function in MATLAB R2022b was used to extract the complex-valued mode shapes. The complex mode shapes were converted into real values for a more convenient comparison with the numerically simulated real-valued mode shapes by applying phase normalisation [38]. Further use of cubic polynomials was implemented to interpolate the real mode shapes between the grid points, enhancing the visualisation of the captured mode shapes.
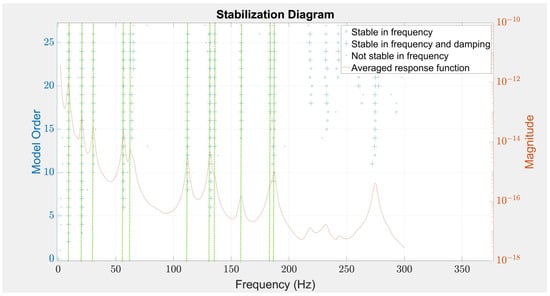
Figure 9.
Stabilisation diagram generated using the LSRF algorithm for the experimental result of the reference test case. Green dotted lines represent the estimated natural frequencies after cross-checking with the finite element model.
4. Results and Discussion
4.1. Damage Detection
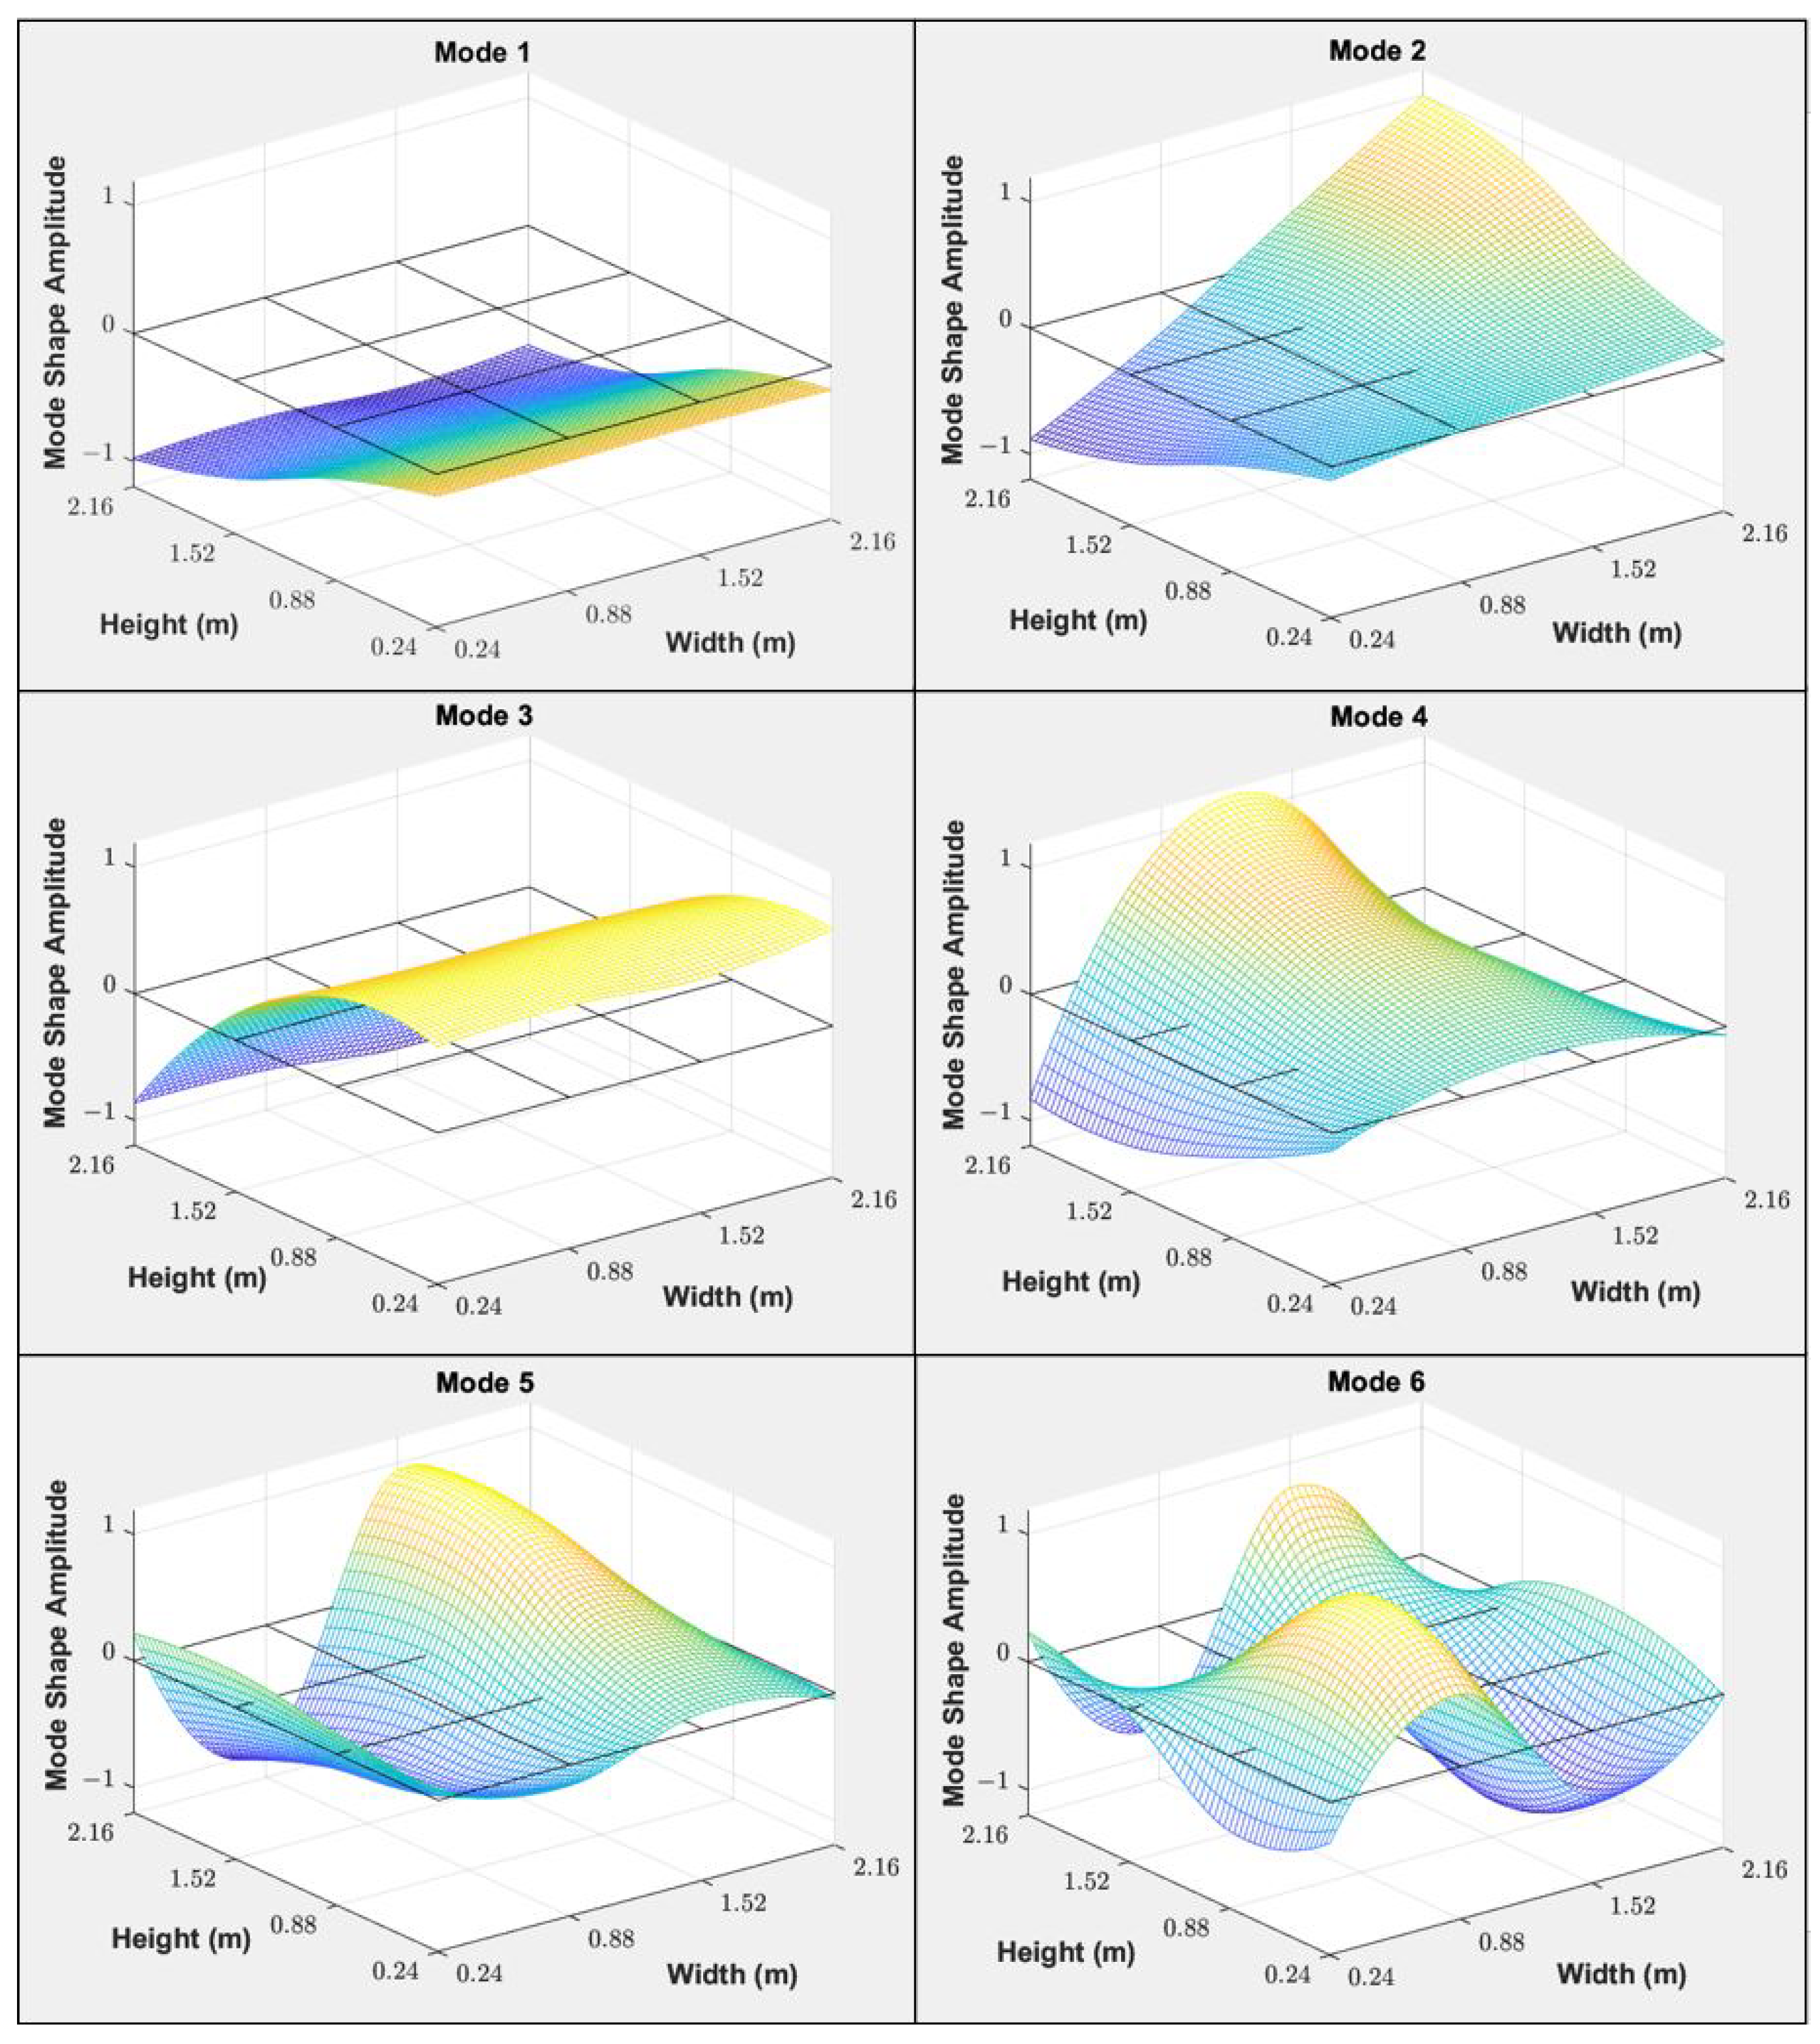
On average, 9 modes were obtained for each test case within a frequency range of 250 Hz, and not all 12 numerically simulated modes were measured experimentally. A total of six common vibration modes were observed consistently throughout all test cases, and the corresponding mode shapes are shown in Figure 10. Note that the mode shape data points were only obtained at the 16 impact locations on the outer brick wall. The mode shape data were interpolated using cubic polynomials to better visualise each mode shape. The six common modes corresponded to Modes 1, 2, 3, 5, 9 and 12 of the numerically simulated modes, respectively, as highlighted in Figure 4. The six common modes have been renumbered to Mode 1 to 6 from this point onwards for ease of reading. In the subsequent damage localisation analysis, only the six common modes were included to allow a consistent comparison across all deterioration test cases.

Figure 10.
The six experimental vibration modes obtained from the reference case T1a (all ties connected) with yellow and blue indicating the maximum and minimum values respectively. The six vibration modes were also observed consistently throughout other test cases.
The natural frequencies of the six common modes are summarised in Table 3 for all test cases, whereas the relative difference in natural frequencies with respect to the reference case T1a is presented in Table 4. The correlation between the experimental mode shapes and their corresponding numerical models was quantified using the modal assurance criteria (MAC), and the results are summarised in Table 5. The selected six common mode shapes for each test case were well correlated with the numerical mode shapes where all modes exceed a MAC value of 0.80.
Table 3.
Natural frequencies of six common modes that were observed consistently throughout all test cases.
Table 4.
Relative difference in natural frequencies for each deterioration case with respect to the reference test case T1a.
Table 5.
Modal assurance criteria (MAC) result for each deterioration case when compared with their corresponding numerical models.
A decreasing trend in natural frequencies was observed for all deterioration cases across all six modes due to reduced overall stiffness of the masonry veneer wall in the presence of disconnected wall ties. A larger magnitude of the relative difference in natural frequencies was observed for lower modes. In particular, the largest and most significant relative difference across all deterioration cases except for T1g was observed for the first vibration mode. For Mode 6 specifically, a minimal reduction in natural frequencies across all test cases was observed, and the natural frequency for T1d even increased slightly which is suspected to arise from experimental noise. The outliers are highlighted in Table 3 and Table 4.
Focusing on the effect of simulating deteriorated wall ties at varying heights (i.e., test cases T1b to T1e), the most severe wall tie deterioration resulting in the largest relative difference was T1b when the top two rows of wall ties were disconnected. The natural frequency of the first mode was reduced to 5.64 Hz from 9.12 Hz with a relative difference of −38.12% compared to the reference state. The reduction in natural frequencies gradually decreased as the simulated disconnection of wall ties moved towards the bottom part of the wall. The effect of disconnecting the second and last row of wall ties at the bottom of the veneer wall (T1d and T1e) was very similar, where the relative differences in natural frequency for the first vibration mode were −4.70% and −4.81% respectively. The observations agree with the research conducted by Muhit [30], where the top two rows of wall ties in a one-storey masonry veneer wall system are more critical in terms of out-of-plane load carrying capacity, highlighting the detrimental effect of their absence on the stiffness of the veneer wall.
For individual deterioration test cases (T1f and T1g), similar trends were observed where a larger difference was observed when the disconnection of wall ties occurred at the top part of the wall. Furthermore, the reduction in natural frequencies for T1f was significantly larger compared to T1c to T1e, which implied that the removal of just two wall ties at the top corner had a more pronounced effect on the stiffness of the veneer wall compared to the removal of an entire row of wall ties at the bottom half of the wall. As for the deterioration cases that involved removing columns of wall ties (T1h and T1i), the results matched the expectation that removing two columns of wall ties resulted in a larger reduction in natural frequencies compared to removing only one column of wall ties. In both cases, the natural frequencies were all lower than the ones for T1c to T1g. In summary, the detection aspect of the damage identification process could be successfully achieved by observing the downshift of natural frequencies for all wall tie deterioration cases.
4.2. Damage Localisation
This section focuses on utilising mode shape data to achieve damage localisation where the effectiveness of four different approaches is discussed and compared. For better interpretability, the result figures in the following subsections are presented as 4 × 4 bar charts, where each bar represents the damage index on each measurement location. The color scale of each bar chart represents the magnitude of the damage index with yellow indicating the maximum value and blue indicating the minimum value.
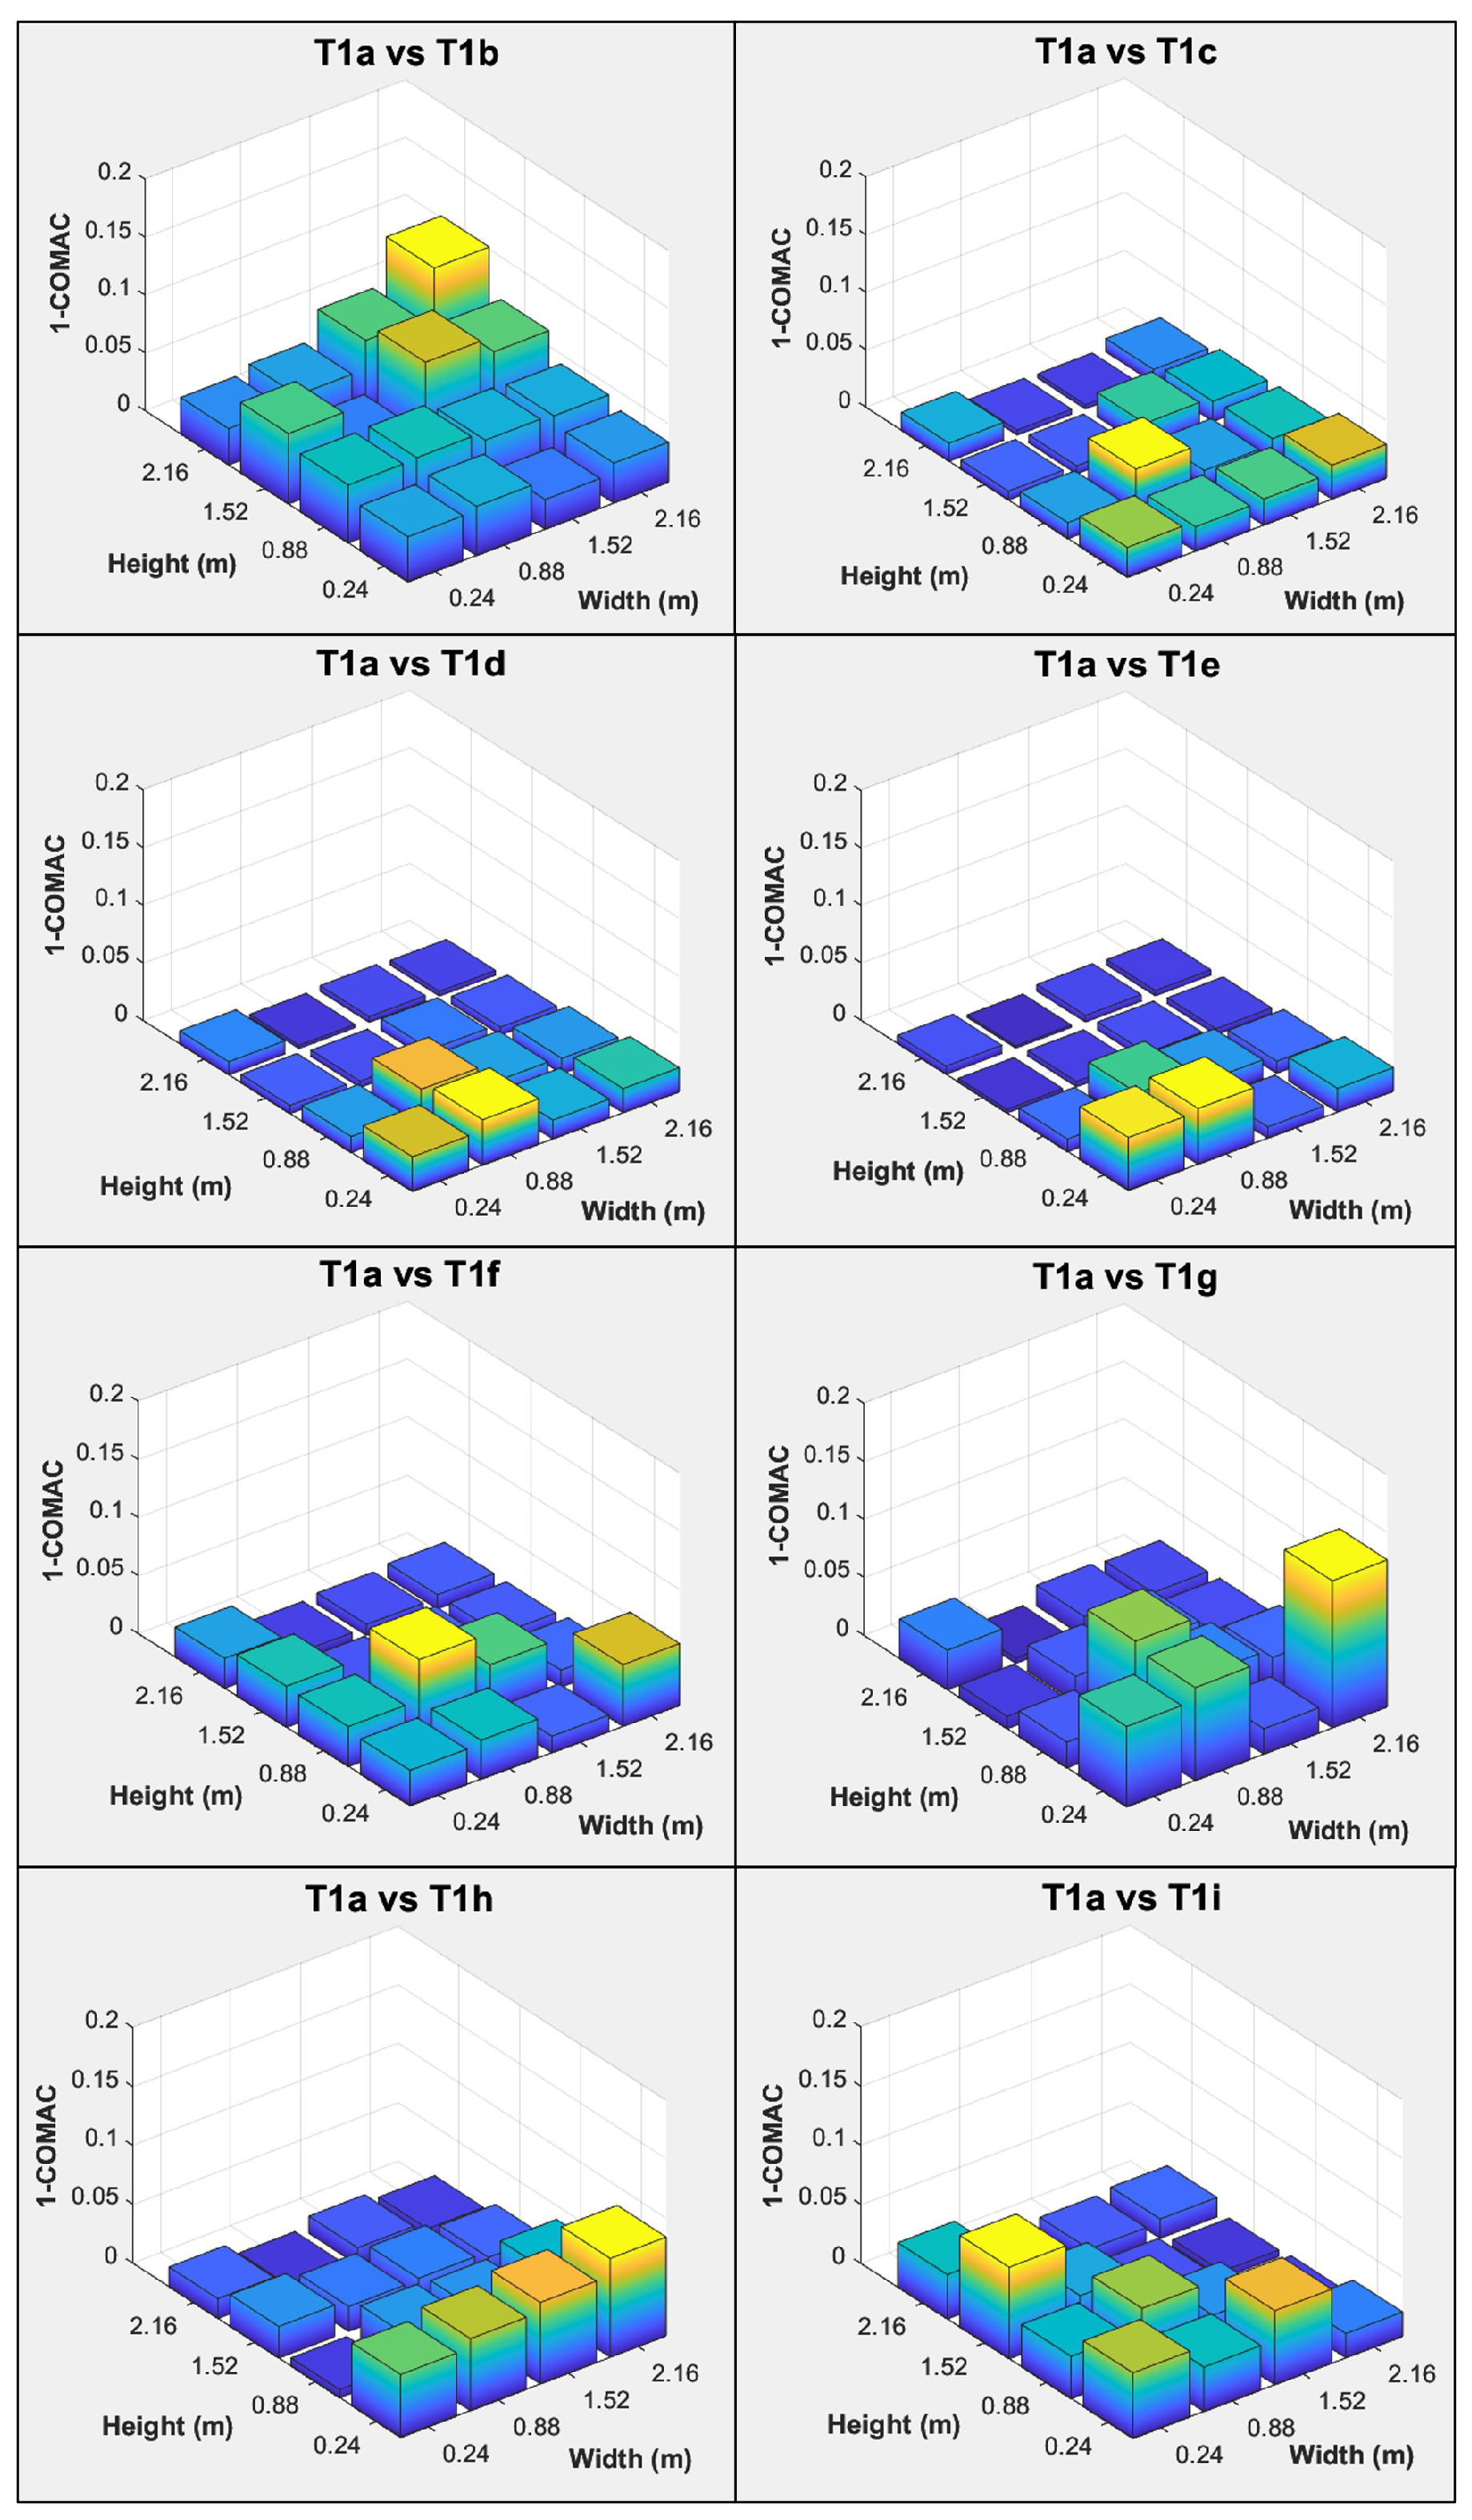
4.2.1. COMAC
For a consistent presentation of the damage indices, 1-COMAC was computed where a higher damage index represents a lower mode shape correlation. The results are presented in Figure 11 by considering all six common modes. Although higher damage indices were observed to be at and close to the damage locations, in particular T1b, T1c, T1d, T1e, and T1i as shown in Figure 11, none of the values exceeded 0.20, the threshold of low mode shape correlation. Hence, it was concluded that the COMAC method is insensitive to wall tie deterioration damage in the veneer wall.
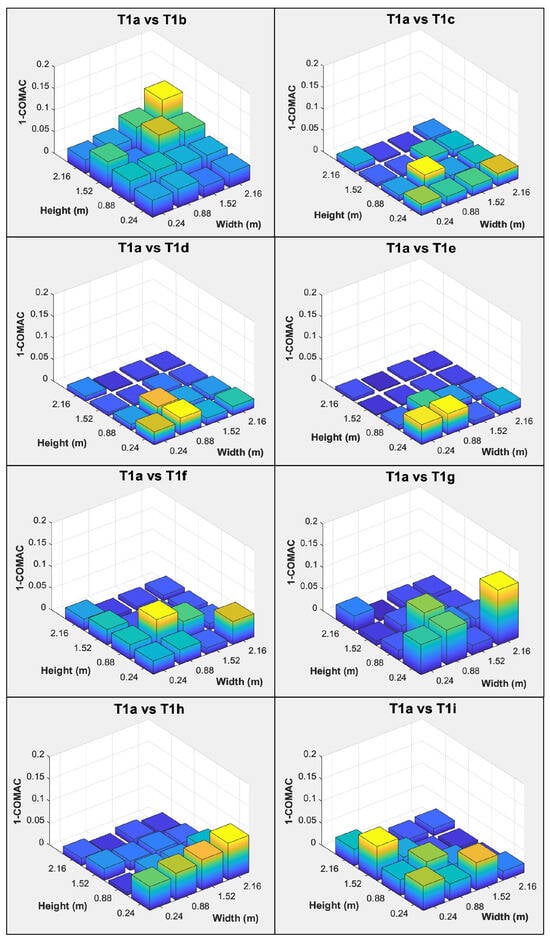
Figure 11.
COMAC results of all eight deterioration cases.
4.2.2. PM
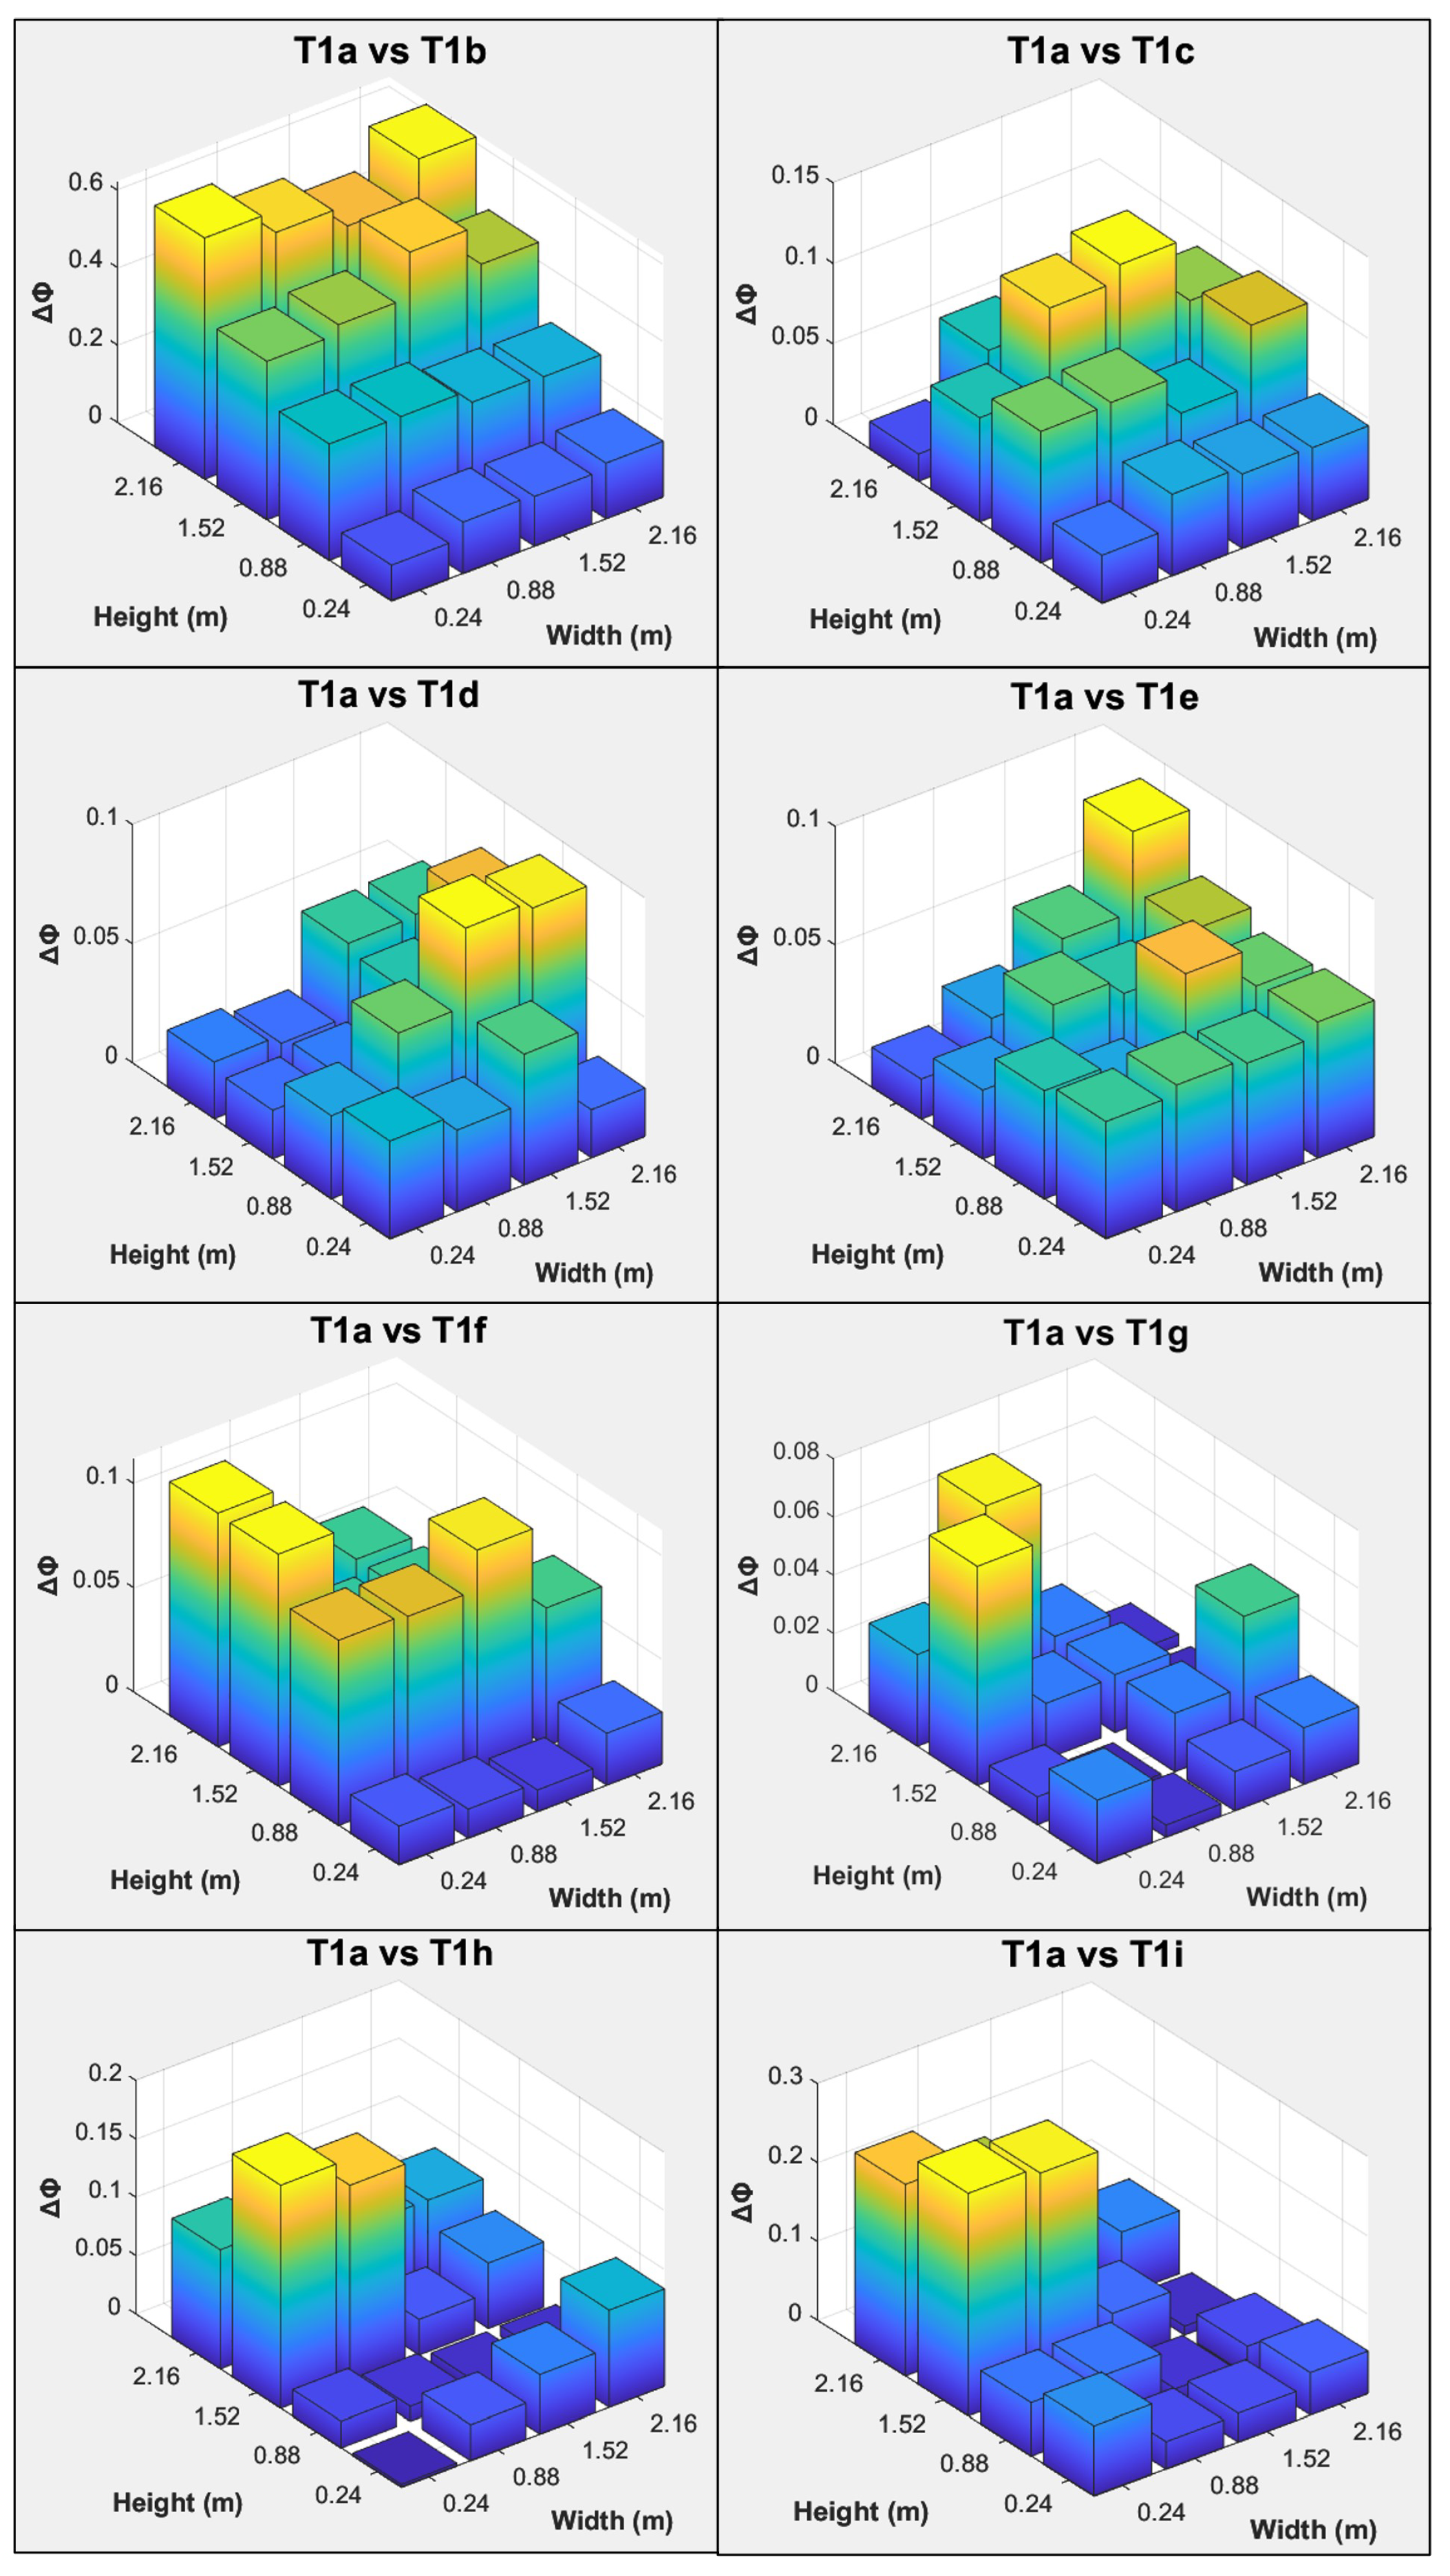
The results of PM that considered both the contributions of natural frequency change and the absolute differences in mode shape displacement using only the first vibration mode are first presented in Figure 12 for each deterioration case, respectively. From Figure 12, six out of the eight deterioration test cases had the highest damage index at the correct location of the disconnected wall ties, respectively, except T1e and T1g. As for test cases T1h and T1i, although high damage index values were observed at left columns, which corresponded to the correct location of disconnected wall ties, both cases had low damage index values near the bottom support of the wall. This is due to the nature of the selected mode for analysis. The first vibration mode included in this analysis, as shown in Figure 3, had a large mode shape displacement at the top of the wall, whereas the mode shape displacement near the bottom support of the wall was close to zero. The difference in magnitude caused low values near the bottom of the wall.
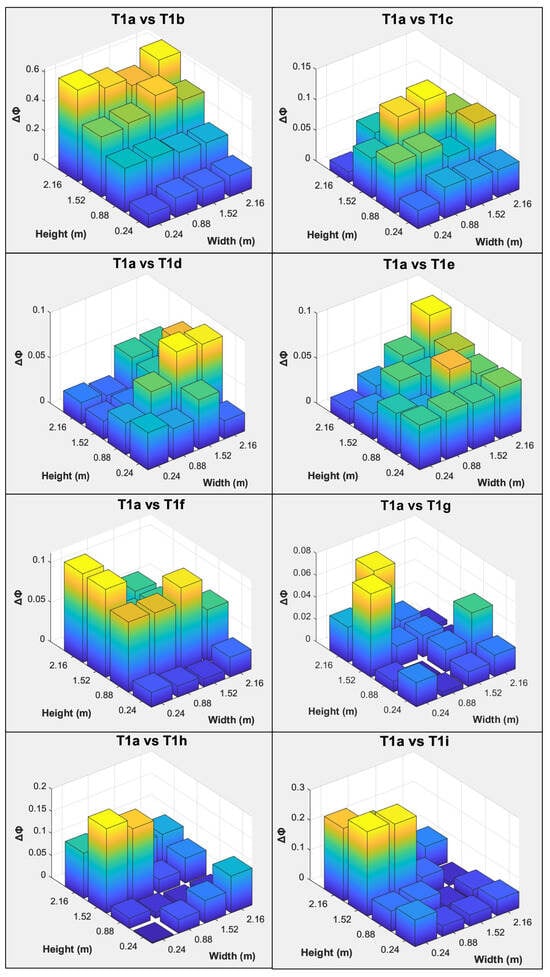
Figure 12.
Parameter-based method results of all eight deterioration cases using the first vibration mode only. Partially adapted from [39] with additional modifications.
To improve the performance of PM for test cases T1e and T1g, all six vibration modes were included in the calculation to obtain an averaged result. The damage indices for T1e and T1g are then shown in Figure 13. The result for T1e improved where relatively large damage indices were observed at the last row of the grid which corresponded to the correct locations of the disconnected wall ties. On the other hand, the result for T1g did not improve after incorporating more vibration modes into the calculations. A false-positive result of wall tie damage was observed instead, which indicated that the changes in natural frequency and mode shape displacement caused by removing only one wall tie that is near the bottom support of the veneer wall were small. Errors arising from the experimental noise or modal parameter extraction process may have a more significant effect on the damage index for T1g.
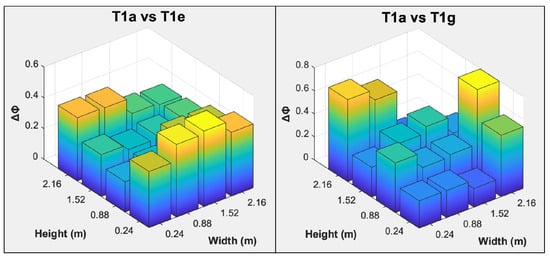
Figure 13.
Parameter-based method results of T1e and T1g using all six common vibration modes.
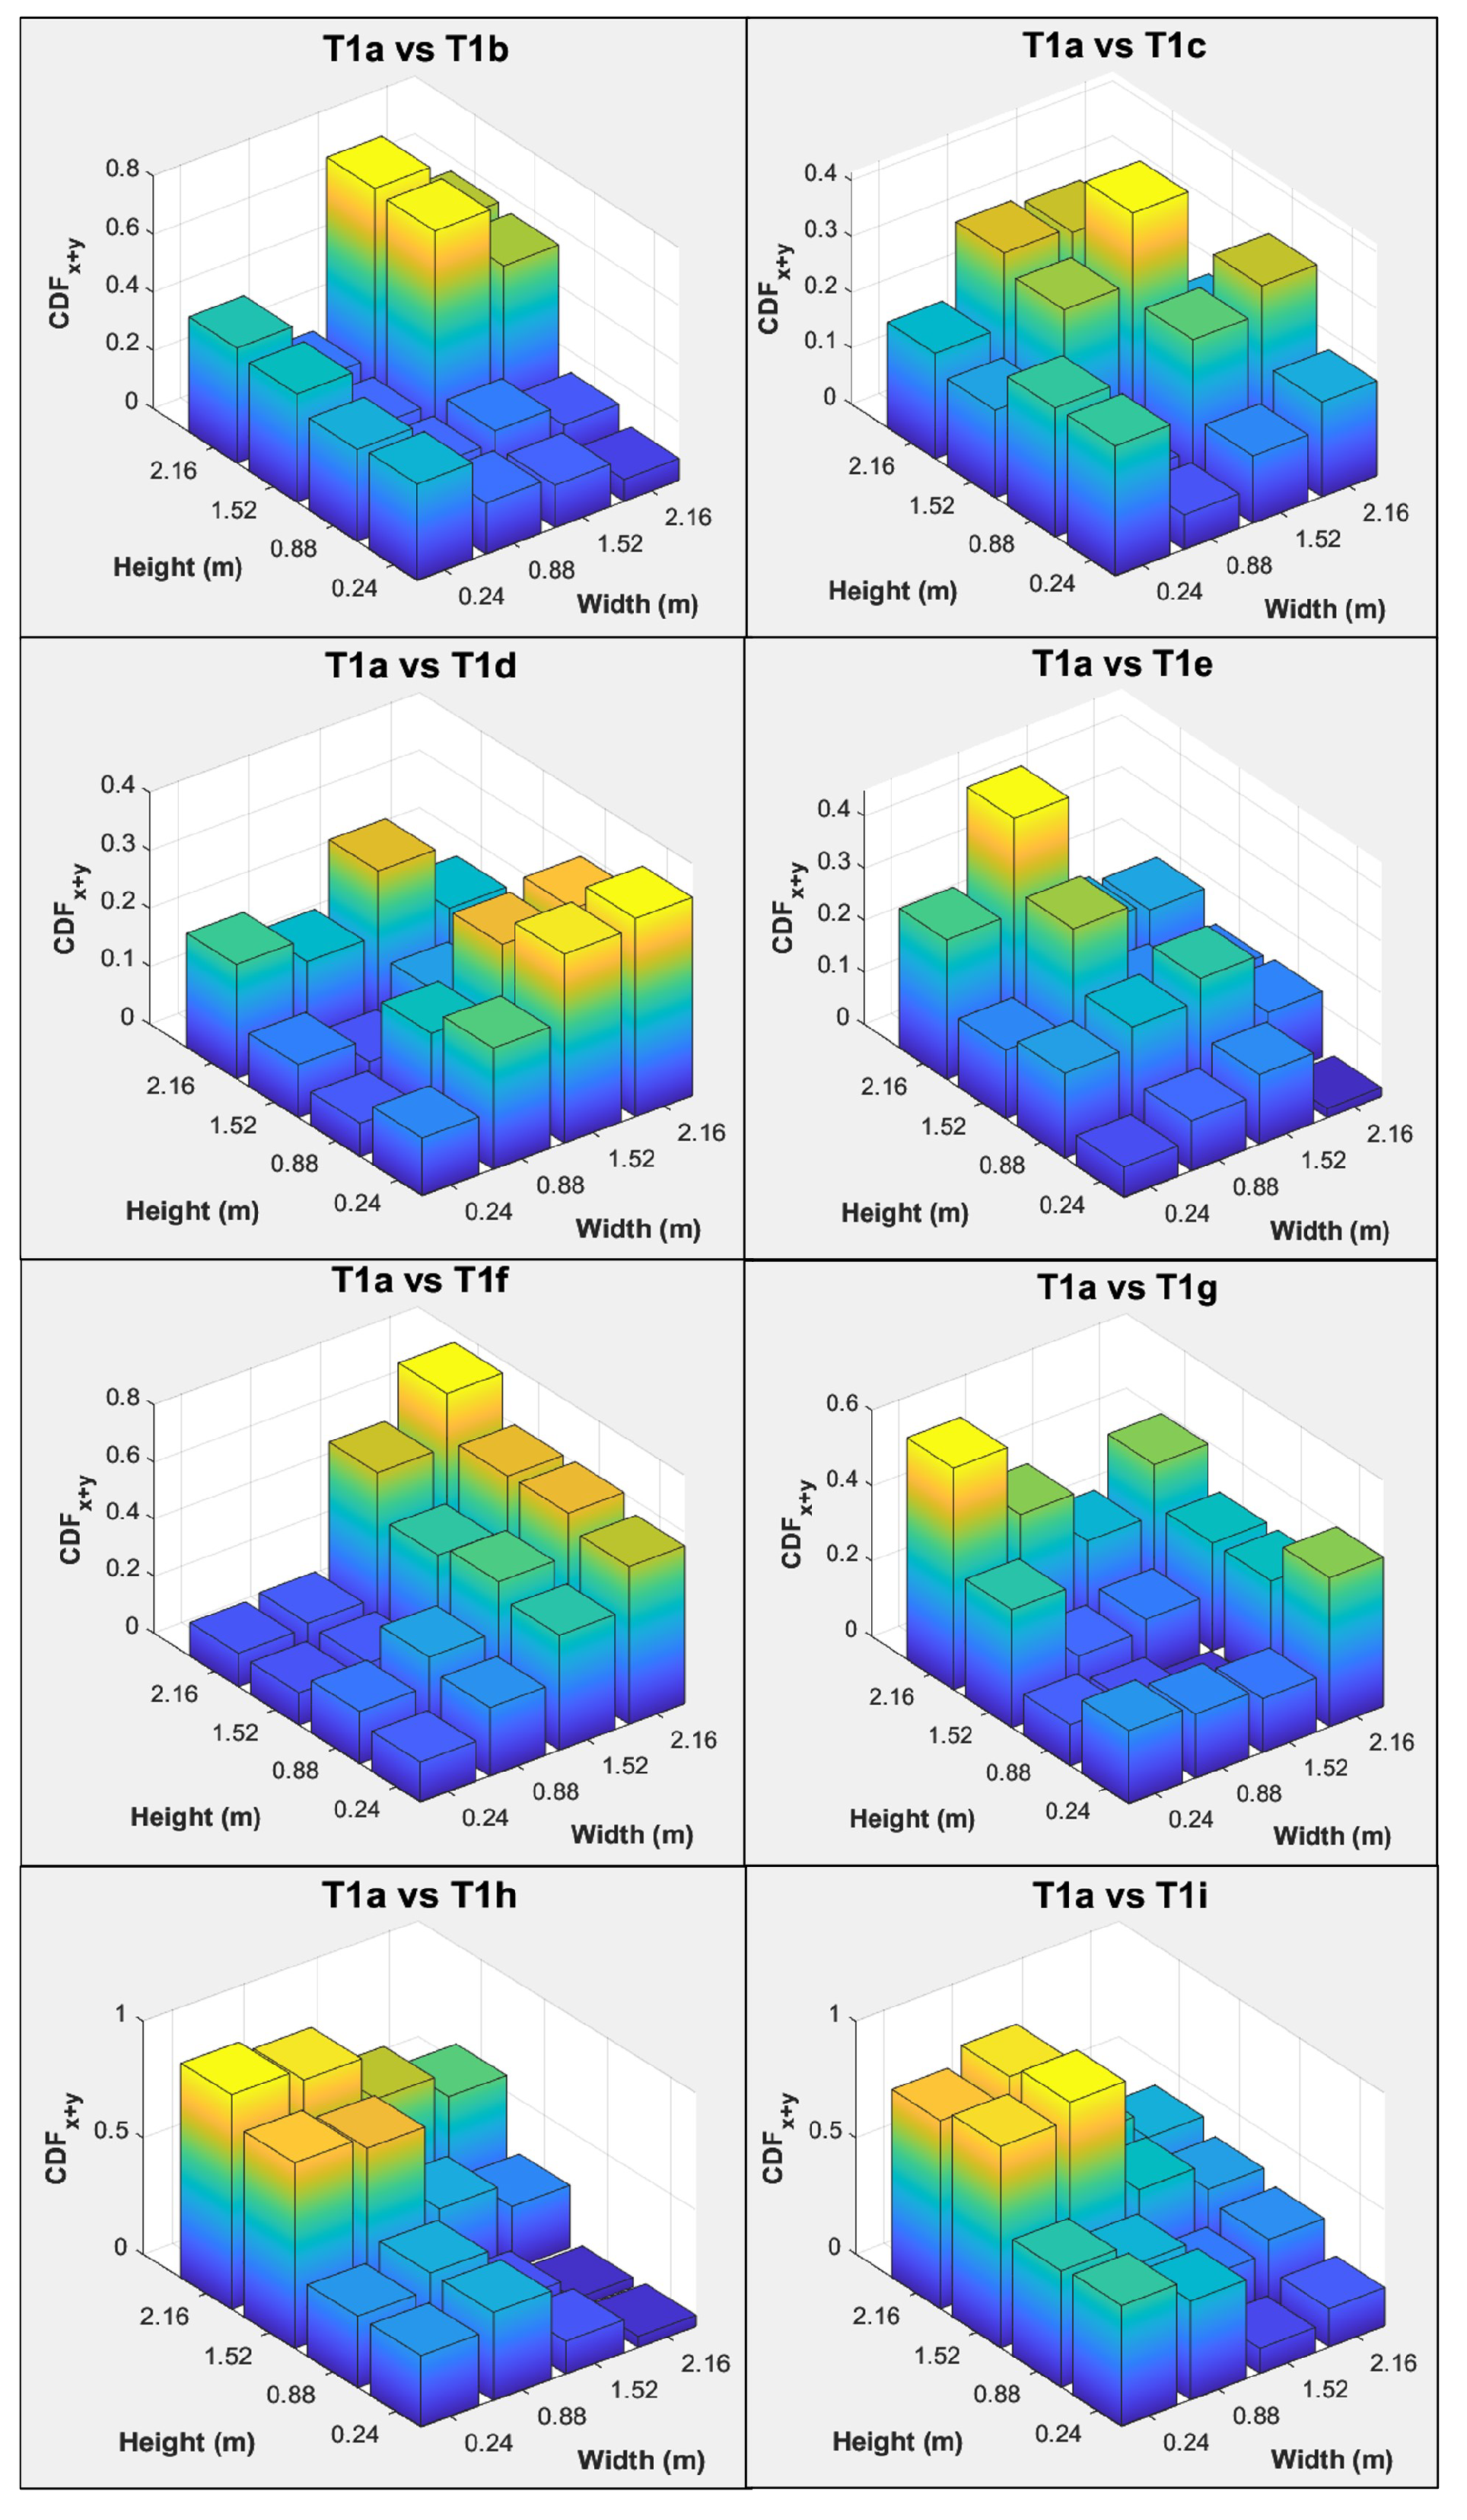
4.2.3. CDF
The result of the curvature damage index that considered only the first vibration mode is first shown in Figure 14. The peaks of curvature damage index were close to the vicinity of damage locations for cases T1b, T1c, T1d, T1h, and T1i, whereas the remaining cases T1e, T1f, and T1g showed high damage index values at other locations. It is well known that measured mode shape data are generally affected by experimental noise and causes local perturbations in mode shape data, especially at the edges and boundaries [40]. The phenomenon matched the observation where the false-positive results were significant at the edges of the grid. The errors were amplified when forward and backward difference approximation methods were used to compute the mode shape curvature at the edges due to a limited number of mode shape data points.

Figure 14.
CDF results of all eight deterioration cases using the first vibration mode only.
To further improve the result for T1e, T1f, and T1g, the mode shape curvatures from all six common vibration modes were included to obtain an averaged result. The results are shown in Figure 15. While the damage localisation of T1f was successful, where the peak was accurately located at the top left corner that coincided with the disconnected wall tie location, the other two test cases that had disconnected wall ties at the bottom of the wall were not successful. The CDF derived from each vibration mode for T1e and T1g was carefully inspected, but none of the modes had a clear indication of the damage location. This further highlights the challenges for identifying deteriorated wall ties that do not cause significant stiffness reduction in the veneer wall, in particular disconnected wall ties that are close to the bottom support of the wall.
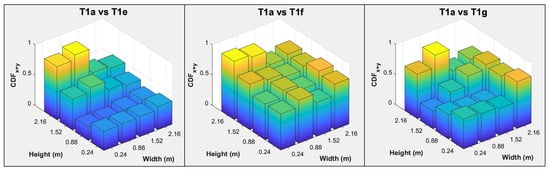
Figure 15.
CDF results of T1e, T1f and T1g using all six common vibration modes.
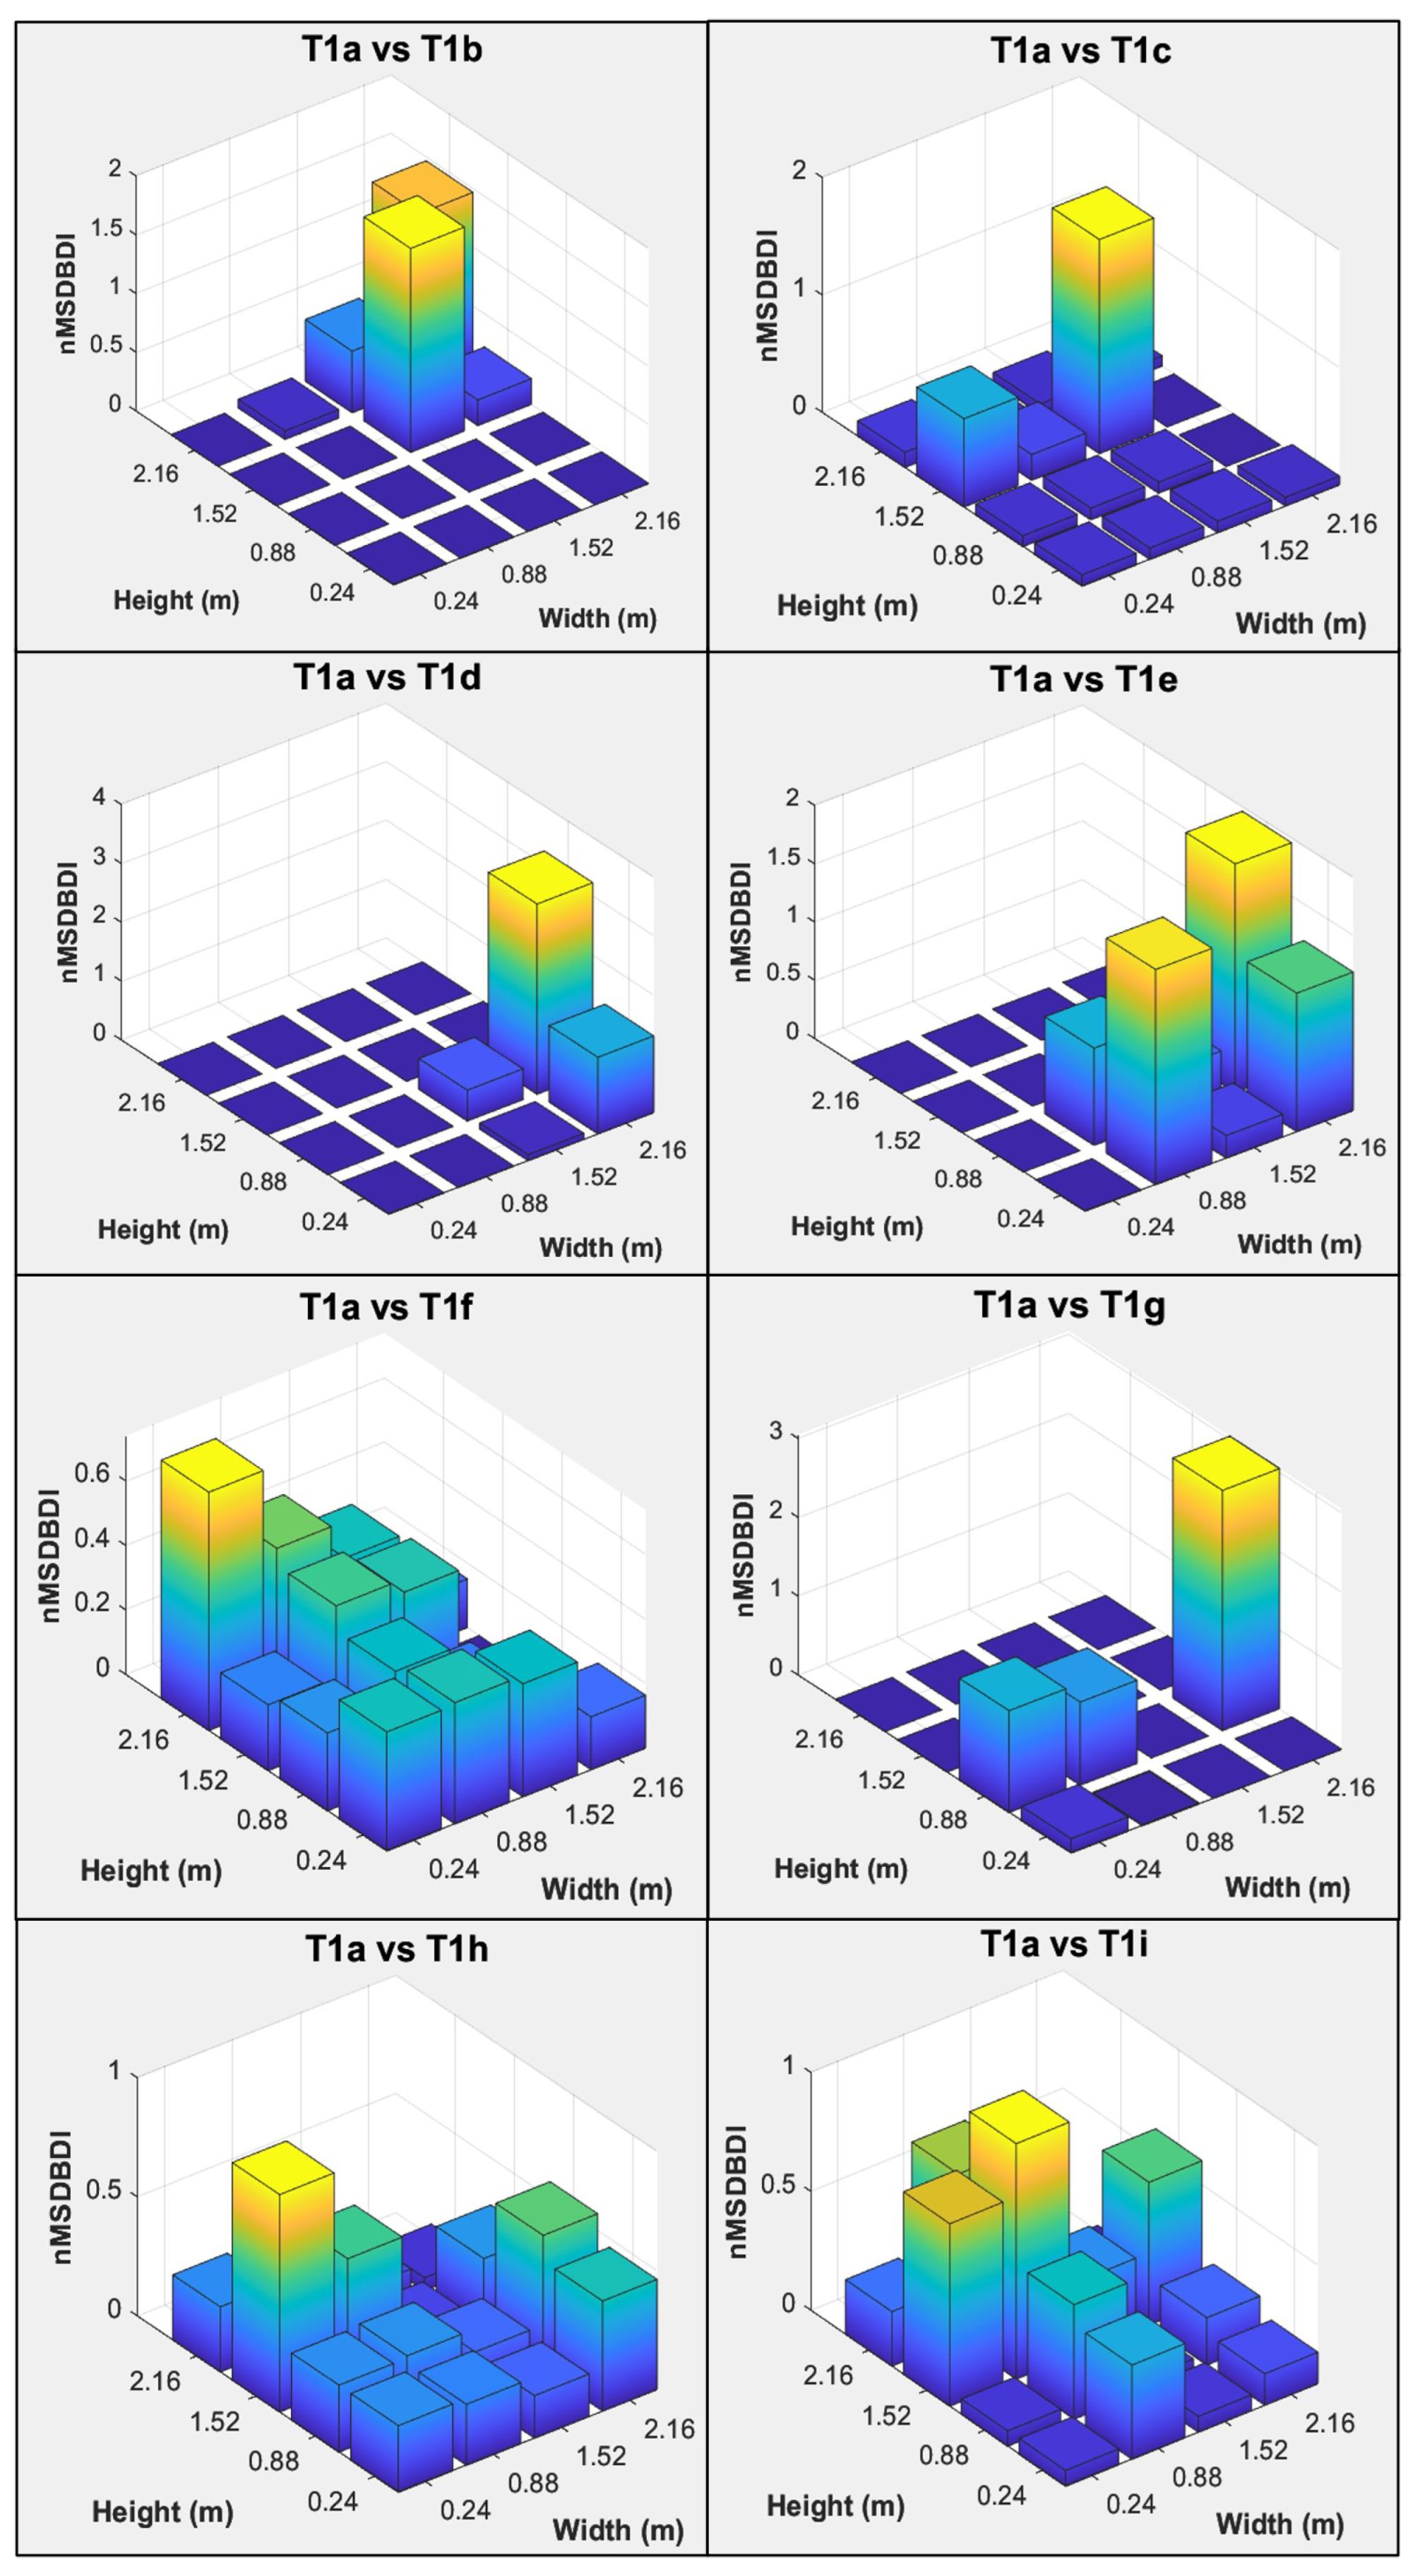
4.2.4. MSDBDI
Given that the success of the damage localisation methods is sensitive to the selection of the vibration modes, the six common vibration modes were inspected individually using the MSDBDI method. The inspection revealed that the best results were obtained when the first two modes were used for disconnected wall ties at the top half of the wall, whereas Mode 3 was sensitive to damaged wall ties at the bottom half of the wall. When columns of wall ties were removed for T1h and T1i, all six vibration modes could be involved. The observation suggests that more accurate outcomes were obtained when the damage occurred at locations with high mode shape amplitudes. The results are summarised in Figure 16.

Figure 16.
Summary of MSDBDI results where selective modes were considered.
Based on Figure 16, the performance of this method was similar to CDF, where the absence of wall ties at the top half of the wall could be detected comfortably, whereas the ones close to the bottom of the wall showed some false-positive results. This observation agrees with research conducted by Ho et al. [41], who pointed out that damage close to the fixed end of the structure degraded the effectiveness of the method, and peaks may emerge in undamaged areas. Similar to the CDF method, the inaccuracy of the particular MSDBDI damage indices may be due to the slope and curvature calculations since central, forward and backward difference approximation methods were used. Limited data points and a low density of measurement grids may have contributed to the errors. Even though interpolation of the mode shape data was implemented to increase the number of data points, no noticeable improvements were observed as an additional source of errors was simultaneously introduced through the interpolation process.
4.2.5. Comparisons of All Damage Localisation Methods
A total of three categories are defined to compare the effectiveness of the four damage localisation approaches. The effectiveness of the damage localisation approaches is classified as correct when the highest damage index corresponds to the damage locations. A category of vicinity is defined when the highest damage index occurred at one column or row away from the actual damage locations, whereas a false positive result is defined if the identified damage locations were far away from the damage locations. The performance of each damage localisation method is summarised in Table 6.
Table 6.
Summary of the success rate for each damage localisation method.
Given that COMAC was insensitive in terms of locating the disconnection of wall ties within masonry veneer wall, and had the poorest performance out of the four damage localisation methods, it is not included in Table 6, even though it is a widely used quantification method of mode shape correlation. On the other hand, the PM method had the best performance overall with the correct identification of seven out of eight deterioration test cases. Meanwhile, CDF and MSDBDI methods were able to correctly identify five out of eight damaged scenarios, and MSDBDI had a slight edge in detecting more deteriorated wall ties in the vicinity of the damaged locations compared to the CDF method. The unidentified test case using all three methods was T1g, where only one wall tie was disconnected at the bottom left corner of the veneer wall. This observation agrees with many numerical simulations conducted by other researchers where artificially introducing a stiffness reduction under a certain threshold degraded the effectiveness of the mode shape-based damage localisation methods [40,42].
For certain deterioration cases, the peak of the damage index may not be at the exact right locations but rather one column or row away which may be due to the difference in wall tie and impact locations, errors in mode shape curvature calculations based on central finite, forward and backward difference approximation, experimental and environmental noises. In addition, when multiple damage locations are involved, not all damage locations are fully identified simultaneously even though relatively higher damage indices occurred at the corresponding damage locations. This observation acknowledges the effectiveness of the selected mode shape-based identification methods but also highlights its need for future refinement to improve the ability to detect multiple deteriorated wall ties simultaneously.
Overall, the formulation of the three main damage localisation methods discussed in this study requires different inputs, such as natural frequencies, mode shapes and the derivatives of the mode shapes. A combination of the damage indices is not recommended as the methods are not normalised to the same scale, resulting in inconsistent interpretation. Therefore, a hybrid approach has not been pursued. Although not evident in this study, directly using mode shapes to identify damage is considered less noise-prone but also less effective in identifying minor and localised damages compared to relying on mode shape derivatives. Hence, establishing a multi-step screening strategy using a different individual method can potentially improve the outcome, providing a more rigorous evaluation of damage detection.
In this study, benchmarking the traditional reference-based damage identification methods under laboratory conditions is prioritised to investigate the effectiveness and reliability of the existing techniques before field implementation. Currently, the proposed methods are most effective when prior information on the undamaged state is available or when a long-term structure health monitoring system has been implemented. Without baseline data, finite element models can be used to approximate the undamaged condition of the test structure based on historical information and design specifications of the structure, and further visual inspection can be conducted prior to vibration-based testing to improve the accuracy of the finite element models. Alternatively, studies have been conducted using the two-dimensional gapped smoothing technique [43] and wavelet-based methods [44] that eliminate the need for undamaged vibration data, where the main idea is to identify anomalies in mode shapes directly, as undamaged mode shapes are expected to be continuous and smooth, offering potential pathways for future research.
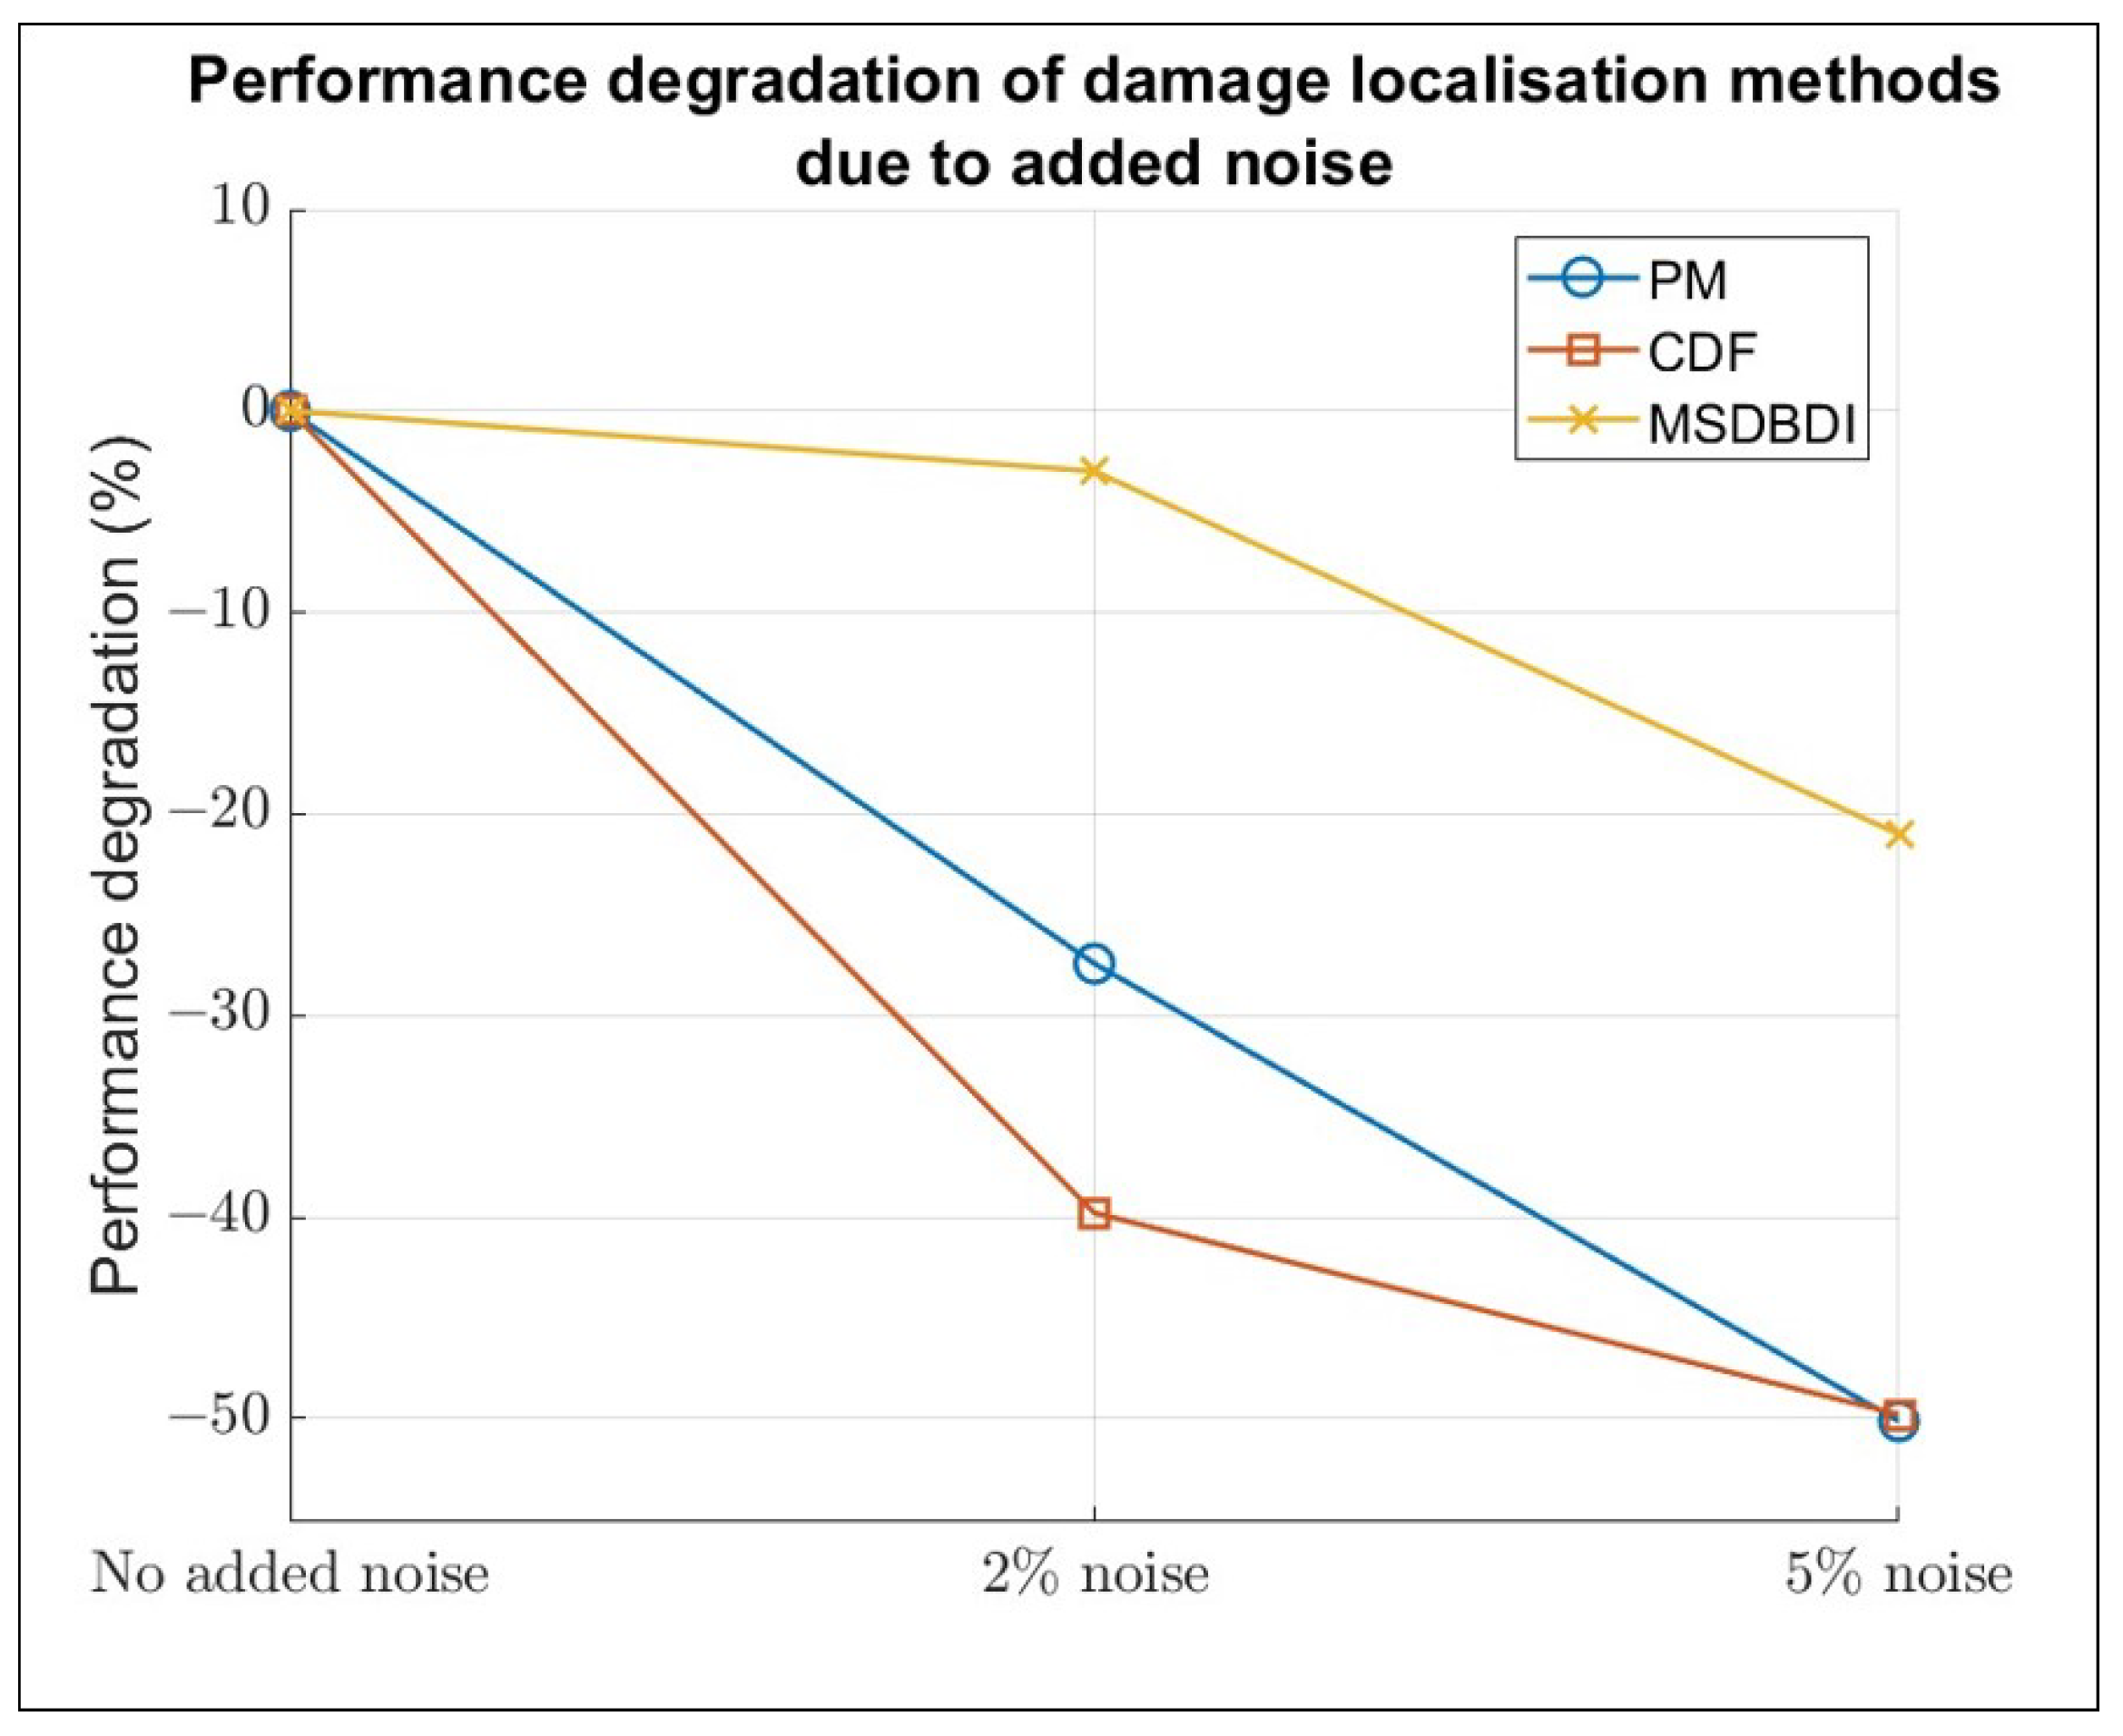
4.2.6. Noise Analysis
Many researchers have reported that increasing temperature and humidity both caused a decrease in natural frequencies as evident in [45,46]. Although the proposed methods in the study were not affected by the extreme change in both temperature and humidity due to controlled laboratory conditions, artificial random noise was added to simulate field measurements to further study the impact of noise on the selected mode shape-based damage localisation methods. While noise levels ranging from 1% to 15% have been investigated by Yan and Ren [47], more reasonable 2% and 5% noise levels were selected for the subsequent noise analysis as the obtained mode shape data were not numerically computed [48,49]. Noisy mode shape data were generated based on Equation (14).
where is the noisy ith mode shape component of the mth mode, denotes the noise level, is a random variable with 0 mean and 1 standard deviation, and is the maximum mode shape component of mth mode.
After incorporating the added noise into the mode shape data, the performance of the damage localisation methods degraded, and the relative difference in the success rate was expressed as performance degradation percentage in Figure 17. MSDBDI performed the best under the influence of noise with only 3% and 21% degradation for the first and second noise levels, respectively. Although PM performed the best without added noise as evident in Table 6, the selected method was highly dependent on the quality of mode shape data, where the success rate was reduced by half when 5% noise was introduced. Similar performance degradation was observed for CDF at 5% noise compared to the PM method, but a larger decrease in success rate at 2% noise was recorded, becoming the most affected damage localisation method by noise. The noise analysis revealed the significant impact of noise on the evaluated damage localisation methods and highlighted the importance of utilising modal parameters without the corruption of noise.

Figure 17.
Impact of noise on the selected three damage localisation methods.
5. Conclusions
This paper reports a study which uses non-destructive testing methods to identify wall tie deterioration in masonry veneer walls. A total of eight test cases simulating wall tie deterioration were conducted by unscrewing the ties at various locations, followed by impact hammer tests under laboratory conditions. Five vibration-based damage identification methods, namely the natural frequency-based method, coordinate modal assurance criteria (COMAC), parameter-based method (PM), curvature damage factor (CDF), and mode-shape-derivative-based damage identification (MSDBDI) method were applied to detect tie deterioration at the affected locations. While it is well known that natural frequencies reduce with structural damage, the study specifically investigated this effect in the context of deteriorated wall ties within masonry veneer walls, where such findings are significant for wall tie maintenance efforts. The findings demonstrate the potential of vibration-based methods as a viable approach to identifying concealed wall tie deterioration, providing a promising alternative to traditional inspection techniques which may be invasive and destructive. While the study concluded that deterioration cases involving minimal stiffness reduction presented a more significant challenge for accurate identification, it is reasonable to deduce those instances do not require immediate intervention as demonstrated by a minimal decrease in natural frequency. However, increasing the density of measurement points to achieve higher spatial resolution and explore different excitation sources that excite a wider range of frequencies may improve the sensitivity of the proposed damage identification methods. Future improvement is planned to consider the construction of spatially continuous mode shape surfaces as outlined in [50] to enhance the sensitivity to detect multiple damaged locations simultaneously. Although the evaluated damage localisation methods performed satisfactorily in the laboratory setting, subsequent noise analysis revealed that the performance of such methods degraded with increasing noise levels, highlighting the importance of employing appropriate noise mitigation strategies to enhance robustness under extreme field conditions.
In summary, PM is the best-performing damage identification method without added noise while MSDBDI is less susceptible to noise influence. Hence, the two methods are recommended for the field inspection of deteriorated wall ties in veneer wall systems depending on the quality of the field vibration data. Although many signal processing techniques listed in the [36] have a huge potential to handle noisy vibration data, some of the techniques may require significant modifications to the damage identification methods discussed in this study. Therefore, wavelet transform is recommended instead due to computational efficiency, noise elimination performance and its suitability to implement in the current procedure of damage identification methods as evident in [51,52,53]. In addition, it is recommended to conduct the field tests under similar environmental conditions to minimise environmental influences; otherwise, appropriate calibration factors may be applied to ensure fair comparisons.
When implementing the current damage identification approach to multi-storey masonry structures, additional complexities due to the interaction of global and local modes, boundary and connection constraints must be considered. Previous studies in [54] have explored a vector correlation-based approach to address the mode interaction issue by differentiating global and local modes through spatial correlation of modal displacement, although careful planning of the excitation and measurement strategies is required. Dynamic substructuring methods [55] and stiffness separation methods [56] that divide a large-scale structure into individual components such as individual walls separately may provide useful insights for integrating the proposed methods into large-scale applications. While this study focused on establishing and validating reliable damage identification and localisation methods in the context of wall tie condition assessment, investigating the difference in load-carrying capacity of masonry veneer walls due to the absence of wall ties could improve the outcomes with a targeted intention to quantify the damage extent of deteriorated wall ties. Future studies are planned to address this critical aspect, with the aim of investigating and defining a threshold in which wall ties need to be replaced immediately within masonry veneer and cavity walls.
As the number of ageing masonry structures with wall tie deterioration issues is constantly increasing over time, an accurate and non-destructive wall tie inspection technique through the analysis of their structural dynamics is of increasing importance, making the findings presented in the study relevant for the foreseeable future.
Author Contributions
Conceptualization, C.Y.L., M.M., I.C. and J.V.; methodology, C.Y.L., M.M., I.C. and J.V.; software, C.Y.L.; validation, C.Y.L., M.M., I.C. and M.A.H.; formal analysis, C.Y.L.; investigation, C.Y.L. and M.A.H.; resources, M.M., I.C. and J.V.; data curation, C.Y.L.; writing—original draft preparation, C.Y.L.; writing—review and editing, C.Y.L., M.M., I.C. and M.A.H.; visualization, C.Y.L.; supervision, M.M. and I.C.; project administration, M.M. and I.C.; funding acquisition, M.M. and I.C. All authors have read and agreed to the published version of the manuscript.
Funding
This research was funded by Australian Research Council under the Linkage Project grant number of LP220100028.
Data Availability Statement
The raw data supporting the conclusions of this article will be made available by the authors on request.
Acknowledgments
The authors are grateful for the assistance provided by The University of Newcastle laboratory staff and EngAnalysis for providing various testing equipment.
Conflicts of Interest
Author John Vazey was employed by the company Structural Health Monitoring, EngAnalysis Ptd Ltd. The remaining authors declare that the research was conducted in the absence of any commercial or financial relationships that could be construed as a potential conflict of interest.
References
- Chaves, I.; Masia, M.; Terry, L.; Lam, C.Y.; Hossain, M.A.; Smith, B.; de Prazer, S.; Vazey, J.; Melchers, R.; Chen, W. Estimating stability and resilience of ageing masonry walls for enhanced infrastructure management and public safety. Aust. J. Struct. Eng. 2025, 26, 20–29. [Google Scholar] [CrossRef]
- Page, A.; Kleeman, P.; Stewart, M.; Melchers, R. Structural aspects of the Newcastle earthquake. In Proceedings of the Second National Structural Engineering Conference 1990: Preprints of Papers, Barton, ACT, Australia, 3–5 October 1990; pp. 305–312. [Google Scholar]
- Chaves, I.A.; de Prazer, S.; Jardim do Nascimento, B.; Flowers, G. Empirical Coastal Atmospheric Corrosion of Masonry Metal Wall Ties. Corros. Mater. Degrad. 2021, 2, 657–665. [Google Scholar] [CrossRef]
- Page, A.W. The Newcastle earthquake and the masonry structures code AS3700. In Proceedings of the 2019 AEES Conference. Australian Earthquake Engineering Society, Newcastle, NSW, Australia, 29 November–1 December 2019. [Google Scholar]
- Maurenbrecher, A.; Brousseau, R. Review of Corrosion Resistance of Metal Components in Masonry Cladding on Buildings; National Research Council Canada, Institute for Research in Construction: Ottawa, ON, Canada, 1993. [Google Scholar]
- Ramos, L.F.; De Roeck, G.; Lourenço, P.B.; Campos-Costa, A. Damage identification on arched masonry structures using ambient and random impact vibrations. Eng. Struct. 2010, 32, 146–162. [Google Scholar] [CrossRef]
- Oyarzo-Vera, C.; Chouw, N. Damage Identification of Unreinforced Masonry Panels Using Vibration-Based Techniques. Shock Vib. 2017, 2017, 1–14. [Google Scholar] [CrossRef]
- Bernat-Masó, E.; Gil, L. Assessing the performance of CFRP strengthening on masonry walls using experimental modal analysis. Eng. Struct. 2019, 193, 184–193. [Google Scholar] [CrossRef]
- Cakir, F.; Uysal, H. Experimental modal analysis of brick masonry arches strengthened prepreg composites. J. Cult. Herit. 2015, 16, 284–292. [Google Scholar] [CrossRef]
- Doebling, S.W.; Farrar, C.R.; Prime, M.B.; Shevitz, D.W. Damage Identification and Health Monitoring of Structural and Mechanical Systems from Changes in Their Vibration Characteristics: A Literature Review; Technical Report; Los Alamos National Lab: Los Alamos, NM, USA, 1996. [Google Scholar]
- Fan, W.; Qiao, P. Vibration-based Damage Identification Methods: A Review and Comparative Study. Struct. Health Monit. 2011, 10, 83–111. [Google Scholar] [CrossRef]
- Ramos, L.F. Damage Identification on Masonry Structures Based on Vibration Signatures. Ph.D. Thesis, University of Minho, Guimarães, Portugal, 2007. [Google Scholar]
- Ewins, D.J. Modal Testing: Theory, Practice and Application; John Wiley & Sons: Hoboken, NJ, USA, 2009. [Google Scholar]
- Dong, C.; Zhang, P.; Feng, W.; Huang, T. The sensitivity study of the modal parameters of a cracked beam. In Proceedings of the 12th International Modal Analysis Conference, Honolulu, HI, USA, 31 January–3 February 1994; Volume 2251, p. 98. [Google Scholar]
- Abdel Wahab, M.M.; De Roeck, G. Damage detection in bridges using modal curvatures: Application to a real damage scenario. J. Sound Vib. 1999, 226, 217–235. [Google Scholar] [CrossRef]
- Navabian, N.; Bozorgnasab, M.; Taghipour, R.; Yazdanpanah, O. Damage identification in plate-like structure using mode shape derivatives. Arch. Appl. Mech. 2016, 86, 819–830. [Google Scholar] [CrossRef]
- Pepi, C.; Cavalagli, N.; Gusella, V.; Gioffrè, M. Damage detection via modal analysis of masonry structures using shaking table tests. Earthq. Eng. Struct. Dyn. 2021, 50, 2077–2097. [Google Scholar] [CrossRef]
- Avitabile, P. Modal Testing: A Practitioner’s Guide, 1st ed.; John Wiley & Sons: Hoboken, NJ, USA, 2017. [Google Scholar]
- Ho, Y.; Ewins, D. On the structural damage identification with mode shapes. In Proceedings of the European COST F3 Conference on System Identification and Structural Health Monitoring, Madrid, Spain, 6–9 June 2000; Volume 1. [Google Scholar]
- Pandey, A.; Biswas, M.; Samman, M. Damage detection from changes in curvature mode shapes. J. Sound Vib. 1991, 145, 321–332. [Google Scholar] [CrossRef]
- Salawu, O.; Williams, C. Damage location using vibration mode shapes. In Proceedings of the 12th International Modal Analysis Conference, Honolulu, HI, USA, 31 January–3 February 1994; Volume 2251, p. 933. [Google Scholar]
- Logan, D.L. A First Course in the Finite Element Method; Thomson: Toronto, ON, Canada, 2011; Volume 4. [Google Scholar]
- Li, J.; Stewart, M.; Masia, M. Probabilistic modeling of unreinforced masonry walls subjected to lateral out-of-plane loading. In Numerical Modeling of Masonry and Historical Structures; Elsevier: Amsterdam, The Netherlands, 2019; pp. 91–140. [Google Scholar]
- AS3700:2018; Masonry Structures. Standards Australia: Sydney, Australia, 2018.
- AS2699.1:2020; Built-In Components for Masonry Construction, Part 1: Wall Ties. Standards Australia: Sydney, Australia, 2020.
- Sugo, H.; Page, A.; Lawrence, S. Characterization and bond strengths of mortars with clay masonry units. In Proceedings of the 11th International Brick/Block Masonry Conference (IB2MAC), Shanghai, China, 14–16 October 1997; pp. 14–16. [Google Scholar]
- DIANA FEA BV. DIANA Finite Element Analysis, Release Note 10.8; DIANA FEA BV: The Hague, The Netherlands, 2024. [Google Scholar]
- Heffler, L.M.; Stewart, M.G.; Masia, M.J.; Corrêa, M.R.S. Statistical analysis and spatial correlation of flexural bond strength for masonry walls. Mason. Int. 2008, 21, 59–70. [Google Scholar]
- Muhit, I.B.; Stewart, M.G.; Masia, M.J. Probabilistic constitutive law for masonry veneer wall ties. Aust. J. Struct. Eng. 2022, 23, 97–118. [Google Scholar] [CrossRef]
- Muhit, I.B. Stochastic Assessment of Unreinforced Masonry Veneer Wall Systems Subjected to Lateral Out-of-Plane Loading. Ph.D. Thesis, The University of Newcastle, Newcastle, Australia, 2021. [Google Scholar]
- Lourenço, P.B. Structural masonry analysis: Recent developments and prospects. In Proceedings of the 14th International Brick and Block Masonry Conference (14IBMAC), Sydney, Australia, 17–20 February 2008; pp. 17–20. [Google Scholar]
- Heffler, L. Variability of Unit Flexural Bond Strength and Its Effect on Strength in Clay Brick Unreinforced Masonry Walls Subject to Vertical Bending. Master’s Thesis, The University of Newcastle, Newcastle, Australia, 2009. [Google Scholar]
- Petersen, R.B. In-Plane Shear Behaviour of Unreinforced Masonry Panels Strengthened with Fibre Reinforced Polymer Strips. Ph.D. Thesis, The University of Newcastle, Newcastle, Australia, 2009. [Google Scholar]
- Lourenço, P.B.; Rots, J.G. Multisurface Interface Model for Analysis of Masonry Structures. J. Eng. Mech. 1997, 123, 660–668. [Google Scholar] [CrossRef]
- Chaves, I.A.; Melchers, R.E.; Barbara Jardim do, N.; Philips, J.; Masia, M. Effects of inter-cavity corrosion on metallic wall ties in masonry structures. AIMS Mater. Sci. 2022, 9, 311–324. [Google Scholar] [CrossRef]
- Amezquita-Sanchez, J.P.; Adeli, H. Signal processing techniques for vibration-based health monitoring of smart structures. Arch. Comput. Methods Eng. 2016, 23, 1–15. [Google Scholar] [CrossRef]
- Ozdemir, A.A.; Gumussoy, S. Transfer function estimation in system identification toolbox via vector fitting. IFAC-PapersOnLine 2017, 50, 6232–6237. [Google Scholar] [CrossRef]
- Akers, J.C.; Winkel, J.P.; Chin, A.W.; Parks, R.A.; Chandler, D.E.; Stasiunas, E.C.; Allen, M.S. Operational Modal Analysis of the Artemis I Dynamic Rollout Test and Wet Dress Rehearsal. In Proceedings of the IMAC, A Conference and Exposition on Structural Dynamics, Orlando, FL, USA, 29 January–1 February 2024; pp. 91–112. [Google Scholar]
- Lam, C.Y.; Hossain, M.A.; Masia, M.; Chaves, I.; Vazey, J. Detecting corroded wall ties through non-destructive means. In Proceedings of the Corrosion and Prevention 2024, Cairns, Australia, 10–14 November 2024. [Google Scholar]
- Ručevskis, S.; Chate, A. Damage identification in a plate-like structure using modal data. Aviation 2013, 17, 45–51. [Google Scholar] [CrossRef]
- Ho, L.V.; Trinh, T.T.; De Roeck, G.; Bui-Tien, T.; Nguyen-Ngoc, L.; Wahab, M.A. An efficient stochastic-based coupled model for damage identification in plate structures. Eng. Fail. Anal. 2022, 131, 105866. [Google Scholar] [CrossRef]
- Cornwell, P.; Doebling, S.W.; Farrar, C.R. Application of the strain energy damage detection method to plate-like structures. J. Sound Vib. 1999, 224, 359–374. [Google Scholar] [CrossRef]
- Yoon, M.; Heider, D.; Gillespie, J., Jr.; Ratcliffe, C.; Crane, R. Local damage detection using the two-dimensional gapped smoothing method. J. Sound Vib. 2005, 279, 119–139. [Google Scholar] [CrossRef]
- Fan, W.; Qiao, P. A 2-D continuous wavelet transform of mode shape data for damage detection of plate structures. Int. J. Solids Struct. 2009, 46, 4379–4395. [Google Scholar] [CrossRef]
- Xia, Y.; Hao, H.; Zanardo, G.; Deeks, A. Long term vibration monitoring of an RC slab: Temperature and humidity effect. Eng. Struct. 2006, 28, 441–452. [Google Scholar] [CrossRef]
- Cai, Y.; Zhang, K.; Ye, Z.; Liu, C.; Lu, K.; Wang, L. Influence of temperature on the natural vibration characteristics of simply supported reinforced concrete beam. Sensors 2021, 21, 4242. [Google Scholar] [CrossRef]
- Yan, W.; Ren, W. A direct algebraic method to calculate the sensitivity of element modal strain energy. Int. J. Numer. Methods Biomed. Eng. 2011, 27, 694–710. [Google Scholar] [CrossRef]
- Pajan, J.; Duvnjak, I.; Bartolac, M.; Ereiz, S. Mode shape area difference method for sparse damage detection in beam-like structures. Struct. Concr. 2024. [Google Scholar] [CrossRef]
- Fu, Y.; Liu, J.; Wei, Z.; Lu, Z. A two-step approach for damage identification in plates. J. Vib. Control. 2016, 22, 3018–3031. [Google Scholar] [CrossRef]
- Fleming, A.J.; Moheimani, S.R. Spatial system identification of a simply supported beam and a trapezoidal cantilever plate. IEEE Trans. Control. Syst. Technol. 2003, 11, 726–736. [Google Scholar] [CrossRef]
- Jiang, X.; Ma, Z.J.; Ren, W. Crack detection from the slope of the mode shape using complex continuous wavelet transform. Comput. Civ. Infrastruct. Eng. 2012, 27, 187–201. [Google Scholar] [CrossRef]
- Pakrashi, V.; O’Connor, A.; Basu, B. A study on the effects of damage models and wavelet bases for damage identification and calibration in beams. Comput. Civ. Infrastruct. Eng. 2007, 22, 555–569. [Google Scholar] [CrossRef]
- Xiang, J.; Liang, M. Wavelet-based detection of beam cracks using modal shape and frequency measurements. Comput. Civ. Infrastruct. Eng. 2012, 27, 439–454. [Google Scholar] [CrossRef]
- Rainieri, C.; Fabbrocino, G.; Brigante, D. Differentiating Local and Global Vibration Modes of Heritage Masonry Buildings through the Spatial Correlation of Modal Displacements. Int. J. Archit. Herit. 2022, 16, 597–615. [Google Scholar] [CrossRef]
- Weng, S.; Zhu, H.; Xia, Y.; Li, J.; Tian, W. A review on dynamic substructuring methods for model updating and damage detection of large-scale structures. Adv. Struct. Eng. 2020, 23, 584–600. [Google Scholar] [CrossRef]
- Xiao, F.; Sun, H.; Mao, Y.; Chen, G.S. Damage identification of large-scale space truss structures based on stiffness separation method. Structures 2023, 53, 109–118. [Google Scholar] [CrossRef]


Disclaimer/Publisher’s Note: The statements, opinions and data contained in all publications are solely those of the individual author(s) and contributor(s) and not of MDPI and/or the editor(s). MDPI and/or the editor(s) disclaim responsibility for any injury to people or property resulting from any ideas, methods, instructions or products referred to in the content. |
© 2025 by the authors. Licensee MDPI, Basel, Switzerland. This article is an open access article distributed under the terms and conditions of the Creative Commons Attribution (CC BY) license (https://creativecommons.org/licenses/by/4.0/).