Abstract
Buildings account for 39% of global carbon emissions, making the construction sector a pivotal contributor to climate change. In ecologically fragile plateau regions, the tension between urban development and environmental sustainability poses a significant challenge. This study examines the spatiotemporal characteristics and influencing mechanisms of building carbon emissions (BCEs) in plateau cities using an empirical analysis of 13-year panel data (2010–2022) from two municipalities and six prefectures in Qinghai Province, China. By employing the eXtreme Gradient Boosting (XGBoost) model, we comprehensively assess drivers across four dimensions: socioeconomic structure, demographic and urban environmental factors, urban expansion patterns, and climatic topographic attributes. Key findings include: (1) The XGBoost model exhibits robust predictive performance (R2 > 0.9, MSE < 0.1, RMSE < 0.3), validating its effectiveness for plateau urban systems. (2) Socioeconomic structure and urban expansion characteristics significantly positively influence building carbon emissions, with GDP, per capita GDP, and built-up areas being particularly influential. (3) The interaction between climate and terrain increases carbon emissions in urban buildings. (4) While socioeconomic structure is a common factor affecting BCEs across different types of plateau urban buildings, other factors, such as urban population density, the housing construction area, and the urban shape index, exhibit variability. These insights inform policy recommendations for cross-regional carbon flow balancing and adaptive low-carbon planning strategies tailored to plateau ecosystems.
1. Introduction
Excessive emissions of carbon dioxide and other greenhouse gases have resulted in a significant increase in global temperatures, posing a substantial threat to the low-carbon and sustainable development of urban environments [1,2,3,4]. Buildings, as one of the primary sources of greenhouse gas emissions, are major contributors to global climate change [5]. Reducing urban building-related carbon emissions has become a critical strategy for countries worldwide to achieve carbon peak and carbon neutrality [6]. Plateau regions, characterized by their rich ecological resources and biodiversity, play a vital role as global carbon sinks [7]. However, due to relatively underdeveloped socio-economic conditions in plateau cities and the rapid rise in building carbon emissions driven by rapid urbanization, these areas face greater pressure from building carbon emissions compared to other regions. They confront the dual challenges of economic development and ecological protection [8]. Therefore, specifically studying the impact mechanisms of carbon emissions in plateau cities is crucial for achieving global climate goals and promoting the sustainable development of plateau regions [9].
With the exploration of the field of low-carbon buildings, scholars have studied the characteristics and influencing factors of building carbon emissions at different scales and dimensions. For instance, Khozema Ahmed Ali et al. [10] analyzed some existing carbon emission problems and emission reduction measures in the construction industry from a global perspective. Hasan Mostafaei et al. [11] emphasized the significance of the construction phase in environmental impact within their research, highlighting the necessity of adopting sustainable practices during dam construction and renovation processes. Han Han et al. [12] analyzed the evolution characteristics and influencing factors of China’s green building space from the perspective of China, finding that a variety of factors such as social and policy influences have significant impacts, among which economic and social impacts are the most significant. Jiaan Jiang et al. [13] studied the path to achieving the goal of carbon peak and carbon neutrality in the nine provinces of the Yellow River Basin in China and concluded that carbon neutrality scenarios vary across different regions. Xiaoping Li et al. [14] studied the temporal and spatial variation characteristics of carbon emissions from public buildings at the city level through energy statistical yearbook data. Regarding the research on carbon emissions in plateau regions, Ran Wo et al. [15] have found that the energy production and supply sectors are the largest sources of carbon emissions in Tibet and Qinghai, as well as the primary drivers of carbon emission growth. To achieve carbon reduction targets, the key task is to transition the Qinghai–Tibet Plateau’s energy structure toward a cleaner model. Qiang Guo et al. [16] have investigated and concluded that ultra-low energy consumption buildings represent an effective approach for reducing building energy consumption and carbon emissions in high-altitude and cold areas. Simulation results indicate that such buildings offer dual benefits of energy conservation and environmental protection.
For instance, Yanxiao Jiang et al. [17] examined the influence of economic vitality factors on building carbon emissions from a socio-economic structure perspective and concluded that economic vitality generally has a positive impact on carbon emissions. Jinpei Ou et al. [18] investigated the effects of urban forms on building carbon emissions using panel data analysis, revealing that fragmented or irregular urban forms tend to result in higher carbon emissions. In contrast, compact urban development models can contribute to reduced emissions. Zhang Deng et al. [19] explored the relationship between climate factors such as temperature and wind speed and building carbon emissions, finding that these climatic elements increase heating demand, thereby raising carbon emissions. Moreover, densely populated urban areas exhibit greater sensitivity to climate change. Zhuoqun Du et al. [20] analyzed the spatiotemporal characteristics of carbon emissions from public buildings based on building types, demonstrating that population, urbanization rate, per capita GDP, and industrial structure significantly influence public building emissions with spatial correlation and variability. Despite having less floor area, public buildings produce relatively more carbon emissions. With advancements in computer technology, machine learning and deep learning methods have increasingly been utilized to study the mechanisms impacting building carbon emissions. For example, Xue Zhao et al. [21] employed the XGBoost-SHAP model to investigate the differences in correlation, spatial heterogeneity, and multi-scale fluctuations between carbon emissions and air pollution, identifying seven key drivers with high accuracy. Ying Li et al. [22] discovered that urban environmental pollution statistics are crucial variables for predicting city-level CO2 emissions in China. The XGBoost model outperformed other methods in terms of estimation accuracy and lower relative errors. Incorporating geospatial and meteorological interpolation predictors further enhanced the accuracy of CO2 emission predictions.
Due to the complex topography and variable climate of the plateau region [23,24], in recent years, frequent extreme weather has affected the observation of remote sensing satellites on the ground, causing the acquired images to be obscured by clouds, which reduces the accuracy of the data and makes it difficult to obtain complete remote sensing data in some areas. Inconvenient transportation also affects the transportation and maintenance of data acquisition equipment, making it difficult to collect data in the field, which increases the difficulty and cost of data acquisition. The characteristics of influencing mechanisms, and effective emission reduction strategies for building carbon emissions have not been fully explored. This not only restricts the process of sustainable development in the plateau region but also brings challenges to the realization of global carbon emission reduction goals. Therefore, based on statistical yearbooks and some historical image map data, this study investigates the characteristics and influencing mechanism of carbon emissions from buildings in plateau cities. In this study, three questions are raised, as follows: (1) What is the trend of spatiotemporal variation of carbon emissions from buildings in plateau cities? (2) What is the mechanism of the influencing factors of carbon emissions of differentiated plateau urban buildings? What is the reason for this phenomenon? (3) What measures should be taken to reduce building carbon emissions and achieve sustainable development for different types of plateau cities?
This study explores the influencing mechanism of building carbon emissions in plateau cities by supplementing and updating the data of building carbon emissions and related indicators in Qinghai Province, providing a basis for comparative analysis of carbon emissions in other plateau cities. It offers an important reference for revealing the similarities and differences between different types of plateau cities in terms of building carbon emissions and provides a case study for global plateau cities to cope with climate change. This has important practical value in addressing the severe challenge of “the warming rate in high-altitude areas significantly exceeding the global average” as pointed out in the IPCC Sixth Assessment Report [25,26]. Through an in-depth analysis of the influencing mechanism of carbon emissions from plateau urban buildings, the roles of four factors, namely socio-economic structure, population and urban environment, urban expansion characteristics, and climate and topographic attributes, carbon emissions are clarified. It contributes to a deeper understanding of the main drivers of building carbon emissions in plateau cities and provides a scientific basis for the formulation of relevant policies. According to the characteristics of plateau cities, this paper proposes differentiated and targeted building carbon emission reduction strategies, aiming to improve the efficiency and effect of building carbon emission reduction in international plateau cities and provide policy reference for other plateau areas to achieve sustainable development.
2. Study Area
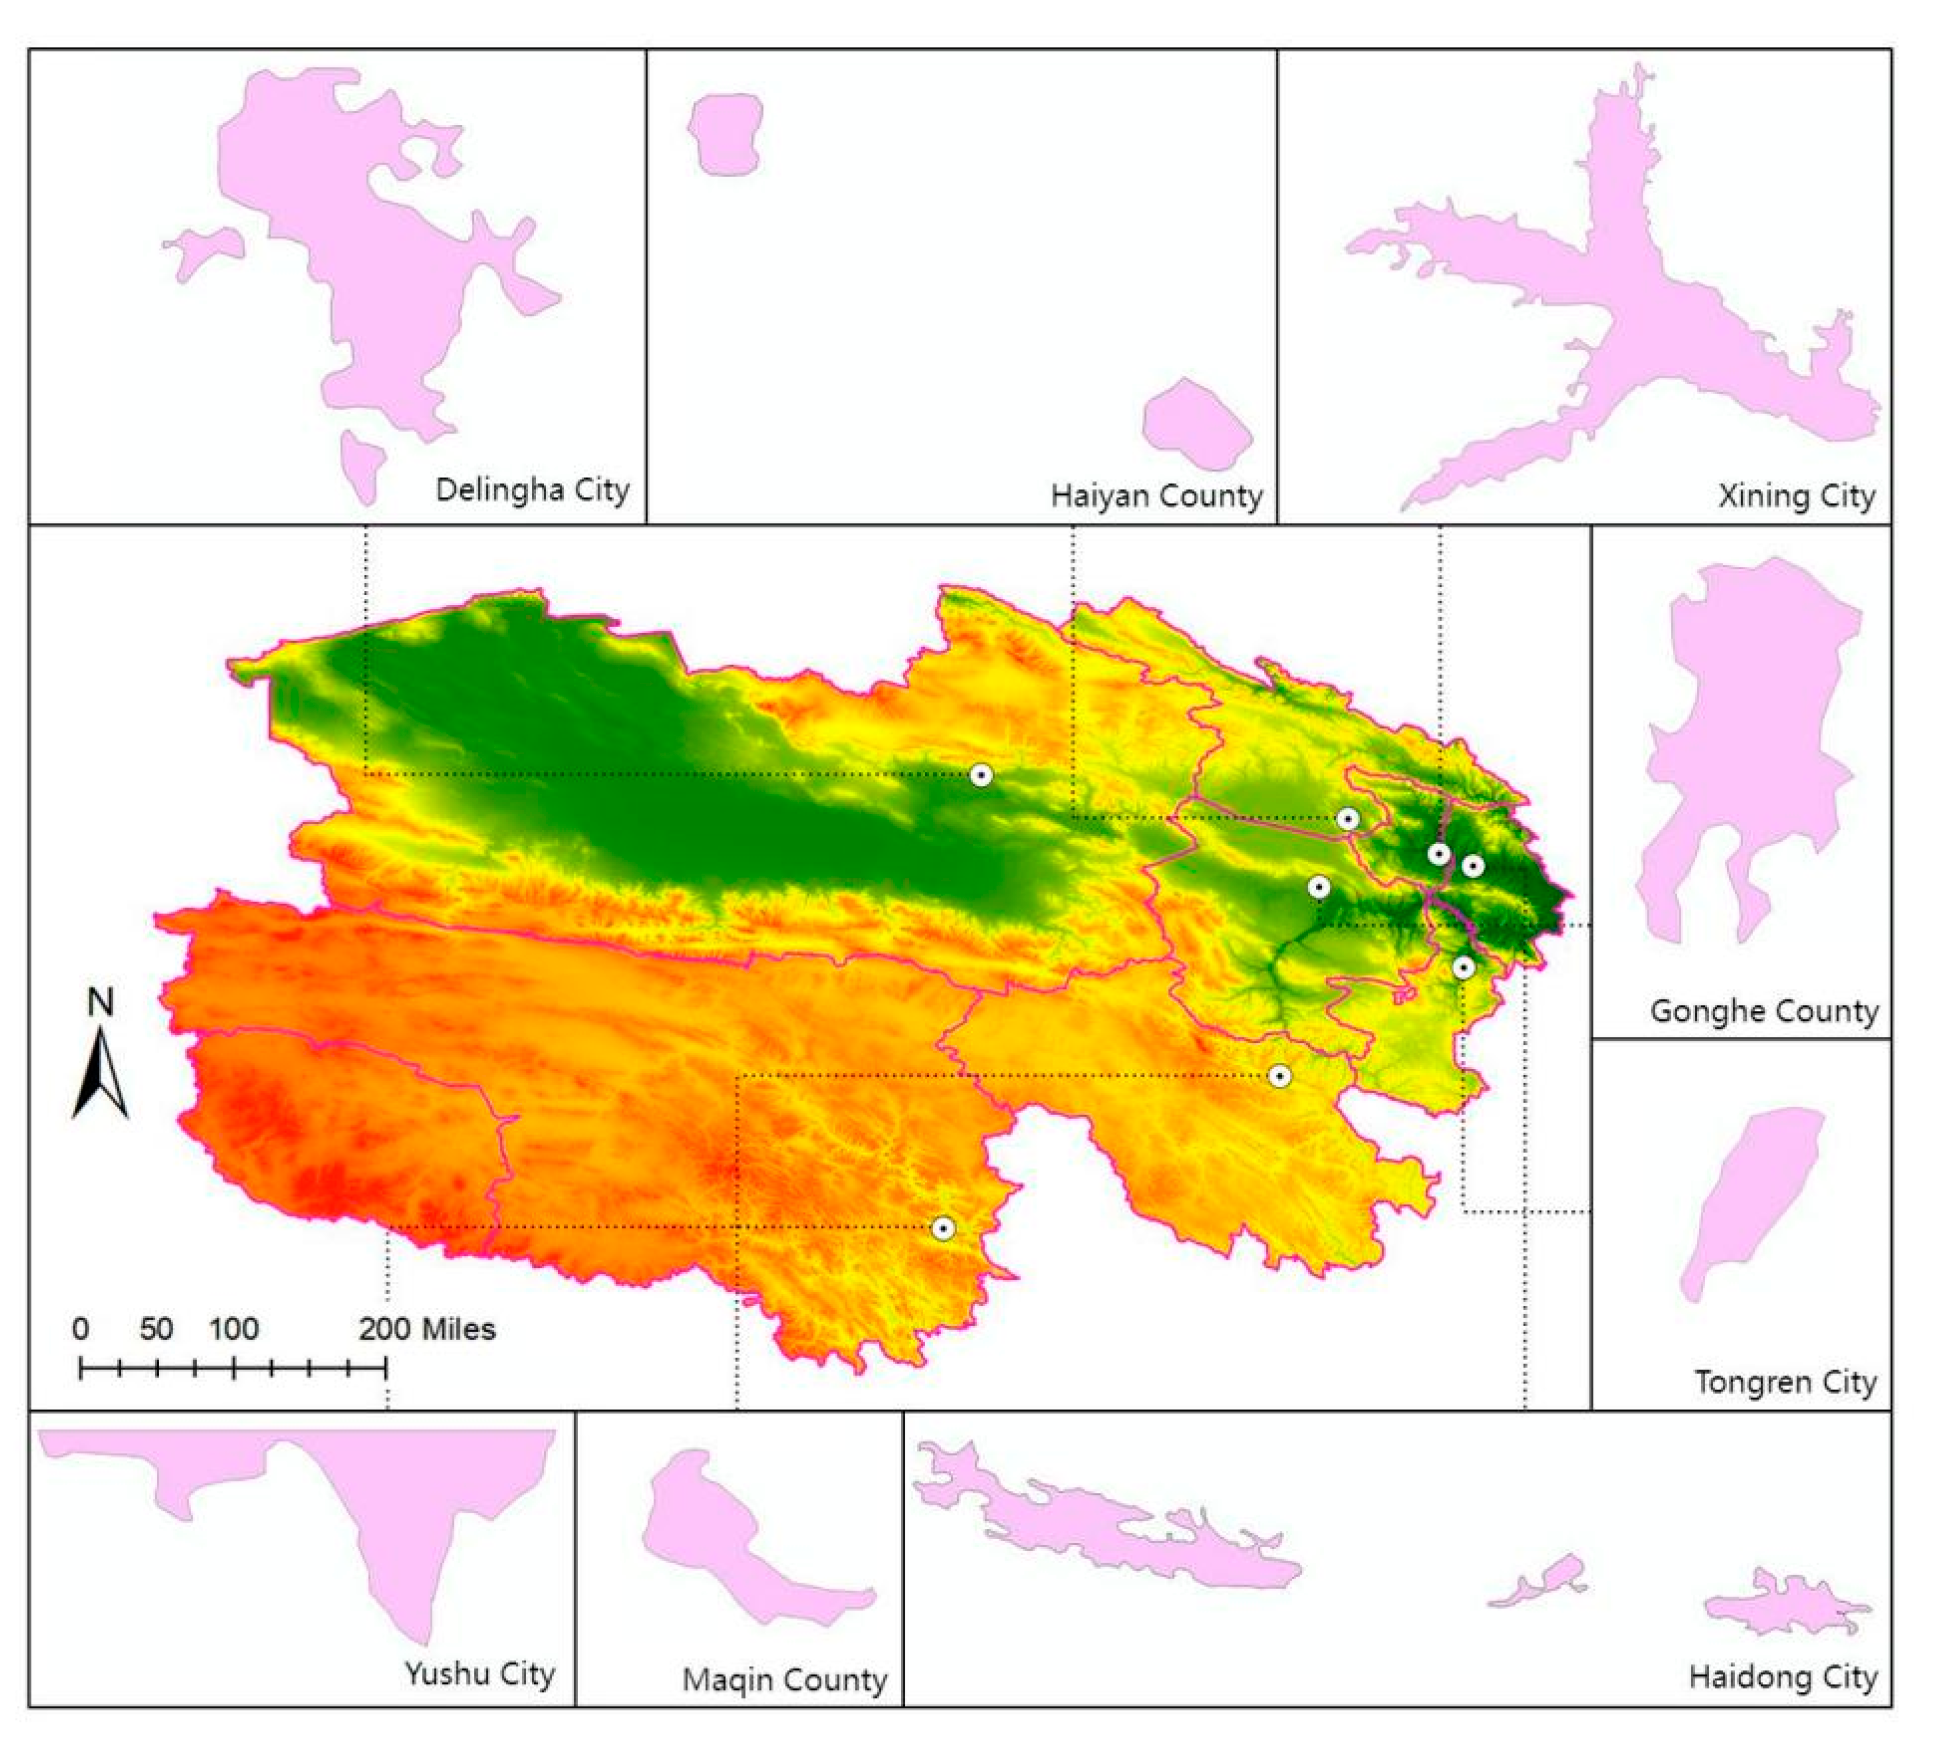
Qinghai Province is in the Qinghai–Tibet Plateau region of China, with an administrative area of 720,000 square kilometers. In the unique geographical environment characterized by an average altitude of over 3000 m, the province has developed a distinct regional development pattern. It comprises two cities and six prefectures, with the majority of its population concentrated in the Xining metropolitan area. Overall, the province has demonstrated industrial characteristics based on energy development, animal husbandry, and tourism as its mainstays. In recent years, it has achieved notable results in the coordinated promotion of new energy development and ecological protection [27,28]. As China’s largest carbon sink contributor zone, Qinghai Province possesses significant carbon sink potential [29]. Relevant studies have confirmed that Qinghai Province achieved a carbon peak in 2018 [30] and has become a carbon sink export area. However, with the acceleration of urbanization [31], the carbon emissions from construction in Qinghai Province are also increasing, which to some extent offset the benefits of carbon sinks. Within its vertical gradient of 2000–4000 m, there are both provincial capital cities represented by Xining, industrial cities represented by Delingha, as well as numerous counties and towns. The differences in altitude gradients, industrial foundations, and the intensity of ecological constraints have led to the complexity of research on building carbon emissions. This paper takes the central areas of two cities and six prefectures in Qinghai Province as the research objects, as shown in Figure 1, including Xining City, Haidong City, Haiyan County, Haibei Tibetan Autonomous Prefecture, Tongren City, Huangnan Tibetan Autonomous Prefecture, Gonghe County, Hainan Tibetan Autonomous Prefecture, and Ma Guoluo Tibetan Autonomous Prefecture, Qin County, Yushu City, Yushu Tibetan Autonomous Prefecture, and Delingha City, Haixi Mongolian, and Tibetan Autonomous Prefecture. According to different urban characteristics, they are divided into four types: comprehensive, transportation, ecological, and industrial.

Figure 1.
Distribution Map of Central Areas in Two Cities and Six Prefectures of Qinghai Province.
Xining City, as the provincial capital, has a large population and a developed economy. It is primarily based on the tertiary industry and chemical industry and is in the Huangshui Valley, making it a comprehensive city. Haidong City has a relatively small population, and its economy is mainly agricultural. It is also situated in the Huangshui Valley and serves as a key transit point for entering the Qinghai–Tibet Plateau, featuring substantial transportation infrastructure, thus it is a transportation-oriented city. Haibei Tibetan Autonomous Prefecture has a small population, with its economy mainly focused on agriculture and animal husbandry. Huangnan Tibetan Autonomous Prefecture, Hainan Tibetan Autonomous Prefecture, and other regions primarily concentrate on agriculture and animal husbandry, characterized by complex terrain, vast territory, and high elevation. These areas have extensive vegetation coverage and are ecologically developed regions. Haixi Mongolian and Tibetan Autonomous Prefecture has a larger population, with its economy mainly based on mineral resource development, featuring a distinctive Salt Lake industry and high terrain. Delingha is a typical industrial city. These cities are not only concentrated sources of carbon emissions but also serve as the administrative centers of two cities and six prefectures.
3. Materials and Methods
3.1. Carbon Emission Accounting
Calculating urban carbon emissions is a crucial component of analyzing the impact mechanism of carbon emissions. This study employed the emission factor method provided by the Intergovernmental Panel on Climate Change (IPCC) in its “Guidelines for Greenhouse Gas Inventory” to estimate carbon emissions in the study area [32,33]. Due to data limitations in plateau regions, the study utilized the carbon emission factor formula, represented as Equation (1):
where EC represents carbon emissions, EI denotes the consumption of various energy sources (such as electricity, natural gas, coal, etc.), and EFI is the carbon emission factor for the corresponding energy sources. The study selected standard coal consumption data for the production and supply of construction industries, electricity, gas, water, and the lives of urban and rural residents to characterize the energy consumption of construction and construction operations, thereby calculating the total construction carbon emissions. Assuming that the energy consumption structure remains relatively stable, and the carbon emission coefficients of various energy sources are constant, a fixed emission factor is used for calculation. The emission factor was set at 2.64, derived from the National Development and Reform Commission of the People’s Republic of China [34].
For plateau cities, traditional calculation methods face limitations due to the discrete distribution of calculation areas and significant differences in architectural characteristics. Therefore, based on the data characteristics and practical needs of the plateau region, this study selected the IPCC emission factor method to calculate the overall building carbon emissions in the Qinghai Province. Regarding carbon emission distribution methods, some scholars compared the results obtained using the per capita carbon emission method, the industrial proportion method, and other approaches, ultimately adopting the carbon emissions calculated by the per capita carbon emission method as their research findings [35]. Drawing on relevant research and the specific context of Qinghai Province, this study used both the per capita carbon emission method and the industrial proportion method to calculate the average value of carbon emissions, which was then used as the basis for municipal and prefectural carbon emissions in subsequent analyses.
3.2. Indicator Selection
Based on relevant studies both in China and internationally, this paper extracted data from various statistical yearbooks, considering the impacts of economy, population, urban characteristics, and climate. To the extent possible with available data, appropriate datasets were selected. For example, altitude and climate differences, which are significant influencing factors, play a crucial role and must not be overlooked. However, due to various limitations, acquiring relevant data remains challenging. Given the accessible data, we selected more direct parameters to characterize these influences.
This paper explores the influence of the mechanism of carbon emissions in urban buildings in plateau areas from four main dimensions: social and economic structure [36], population and urban environment, urban expansion characteristics, and climatic topographic attributes. The social and economic structure encompasses GDP, the proportion of the tertiary industry, and per capita GDP. Population and urban environment factors include the urban population density [37], urban population, housing construction area [38], housing completion areas, and built-up areas. Urban expansion characteristics are represented by water supply pipeline density in the urban built-up areas [39], urban centralized supply thermal area, average floor area ratio of urban buildings [40], proportion of centralized heating in residential buildings, proportion of heating in residential buildings, and proportion of residential construction land. Climatic and topographic attributes include regional average temperature, regional average wind speed [41], regional average sunshine duration [42], and urban shape index [43]. In total, 18 indicators were selected as listed in Table 1 to explore the impact mechanism of building carbon emissions in plateau areas. The data used in this study were derived from statistical yearbooks and satellite images, with some missing data filled with by interpolation methods.

Table 1.
Indicators for Building Carbon Emissions in Qinghai Province.
3.3. XGBoost Model
The XGBoost model is an integrated learning algorithm based on gradient boosting. Its core advantage lies in its ability to perform high-performance computing and significantly enhances the efficiency of large-scale data training. The model is characterized by its flexibility and generalization capabilities, supporting a variety of objective functions and custom evaluation metrics. XGBoost features an automatic mechanism for handling missing values, eliminating the need for additional data preprocessing and simplifying the modeling process [44]. In the analysis of building carbon emissions, the XGBoost model offers distinct advantages [45]. Firstly, it can process high-dimensional data, automatically select important features, and improve both the interpretability and prediction accuracy of the model. Building carbon emission data typically encompasses multiple dimensions, such as the level of economic development, population density, building type, and climatic conditions. XGBoost can effectively process this high-dimensional data. Secondly, XGBoost can capture complex nonlinear relationships, providing more accurate prediction results. There are intricate nonlinear relationships between building carbon emissions and various influencing factors. Through the gradient boosting of its tree structure, XGBoost can automatically fit these relationships. Additionally, the regularization term and pruning strategy of XGBoost effectively prevent overfitting and enhance the model’s generalization ability [46]. This makes it suitable for processing building carbon emission data that may contain noise and outliers. This study mitigates overfitting by optimizing regularization parameters, including the L2 and L1 regularization coefficients, adjusting the proportion of random sampling, and employing nested cross-validation to optimize the hyperparameters in both inner and outer layers.
4. Results
4.1. Analysis of the Applicability and Effectiveness of the XGBoost Model
The XGBoost model is used to predict the building carbon emission data of Qinghai Province from 2010 to 2022, and the results show that the model has high prediction accuracy, as shown in Table 2. The mean square error (MSE) is less than 0.1, the root mean square error (RMSE) is less than 0.3, and the coefficient of determination (R2) is greater than 0.9, indicating that the model can fit the building carbon emission data well.
Table 2.
Analysis of the applicability and effectiveness of the XGBoost model.
4.2. Spatiotemporal Characteristics of Building Carbon Emissions
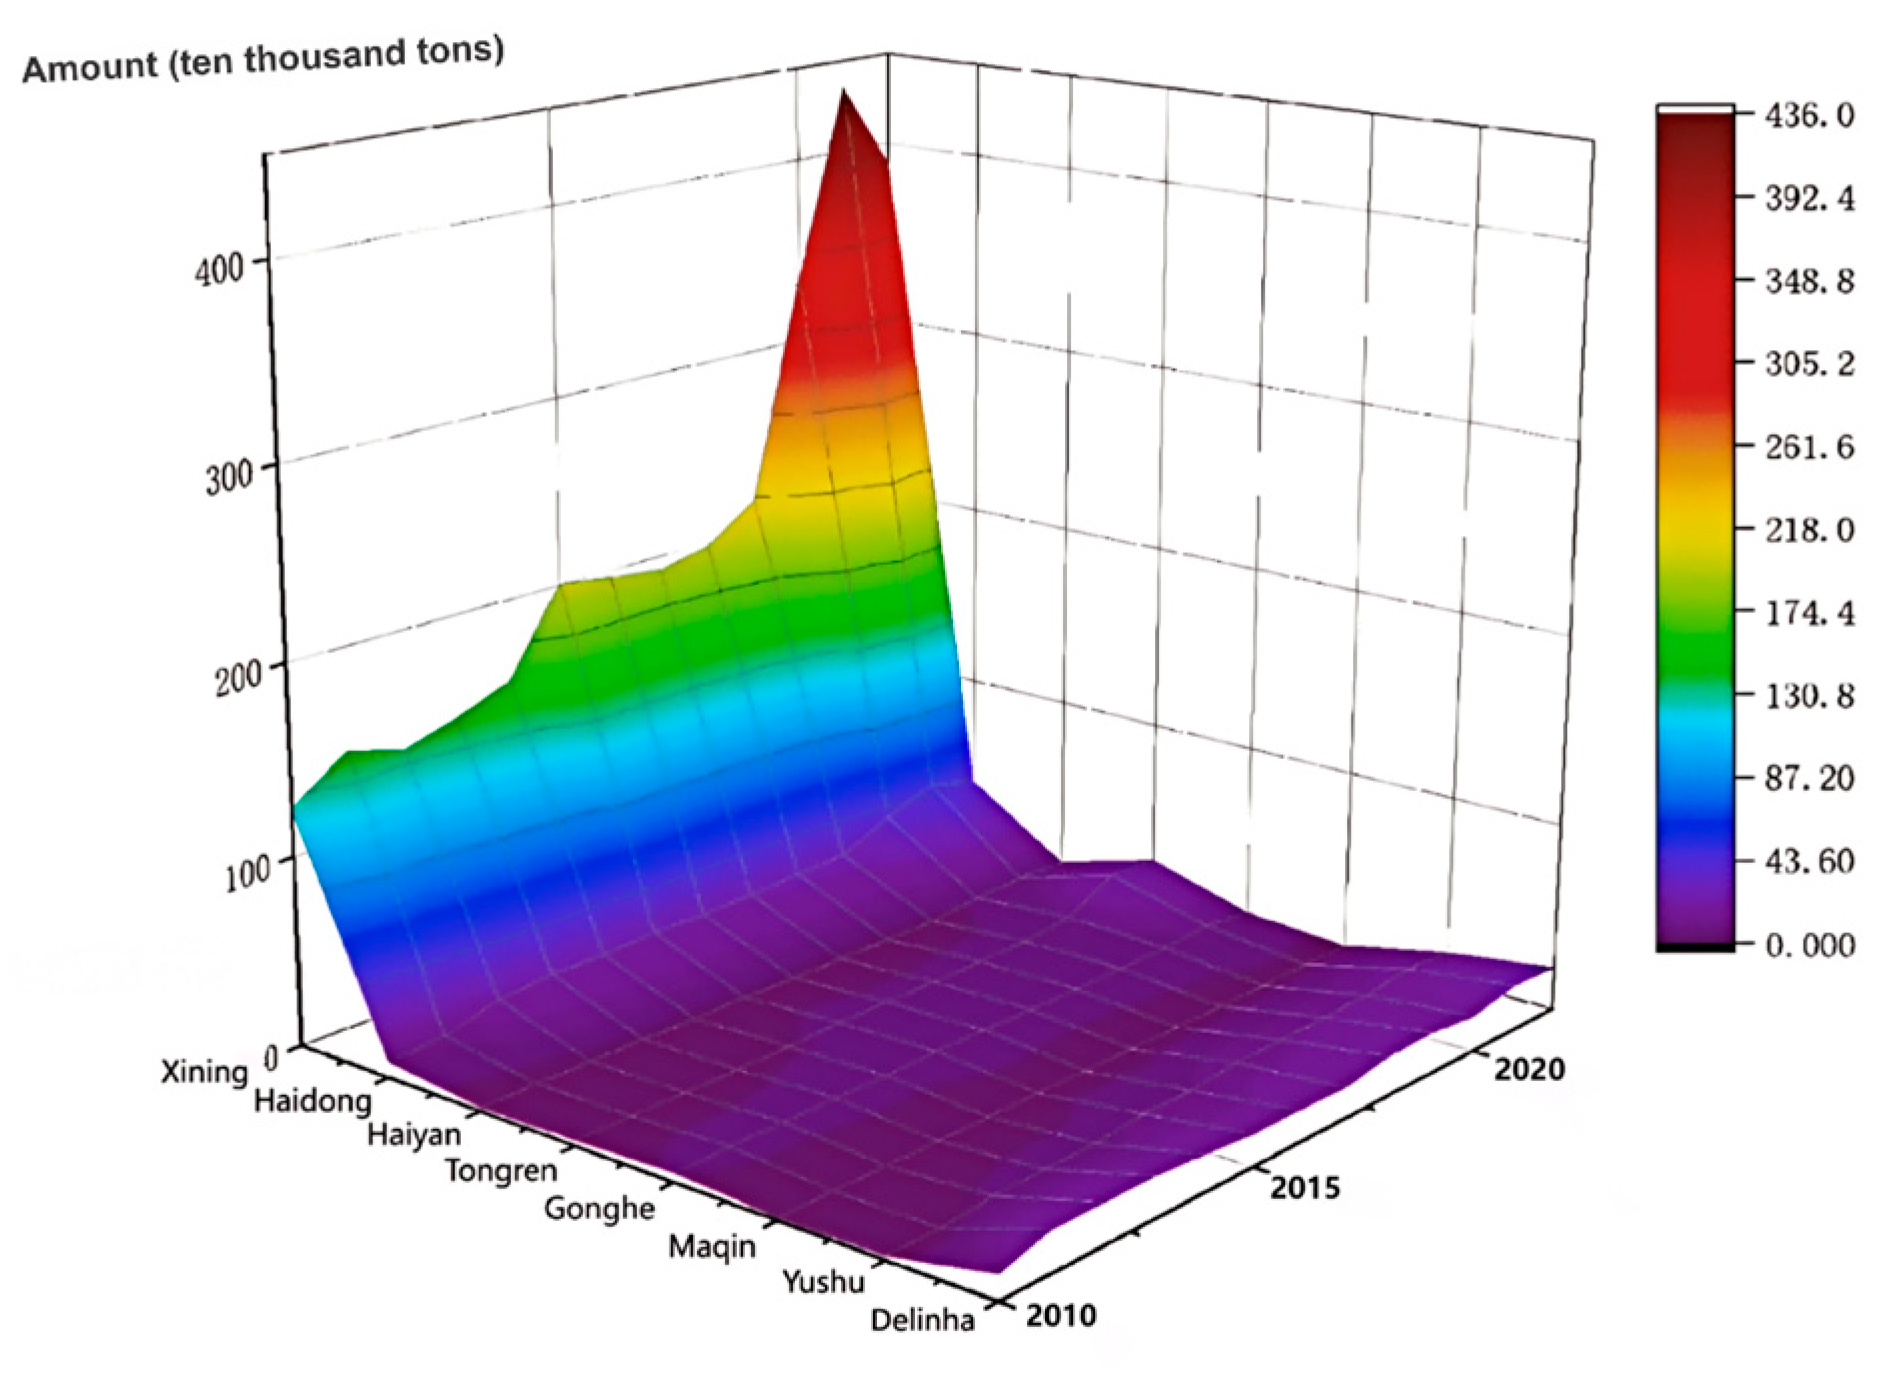
From 2010 to 2022, the carbon emissions of buildings in the two cities and six prefectures of Qinghai Province exhibited an overall upward trend, as shown in Figure 2. This indicates that with economic development and population growth, building carbon emissions have also increased. The growth rate of urban building carbon emissions exceeded that of regional carbon emissions, highlighting the concentration of building carbon emissions in urban areas. However, there were differences in growth rates and trends across different regions, as shown in Figure 3. For the differentiated types of plateau cities, the following characteristics were observed. Due to significant changes in urban and rural construction development within the statistical data interval in Qinghai Province, the reasons for the changes in some data were explored.
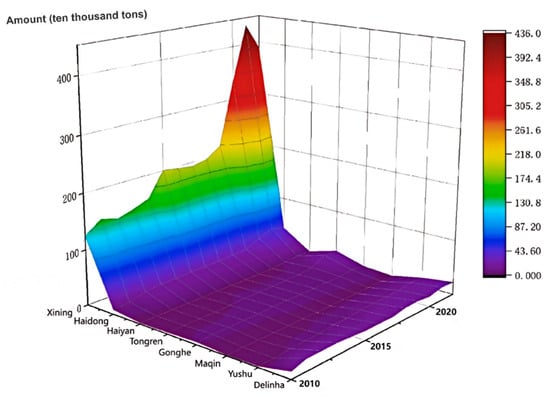
Figure 2.
Annual building carbon emissions in cities and prefectures in Qinghai Province.
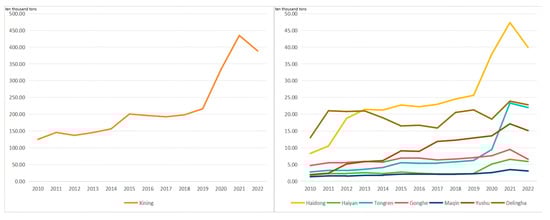
Figure 3.
Carbon Emission Changes in Two Cities and Six Counties of Qinghai Province.
As areas with a relatively concentrated population and economy, the carbon emissions of buildings in comprehensive cities were significantly higher than those in other types of regions, with a relatively fast growth rate. For instance, the overall trend of building carbon emissions in Xining City from 2010 to 2022 was upward, with the growth rate of urban building carbon emissions being approximately 211.2%. The urban agglomeration effect of building carbon emissions was the most pronounced. Notably, the carbon emissions of Xining City surged in 2020. The study attributes this to: (1) an increase in the urban population due to the reorganization of counties and districts in the Huangzhong area; (2) the approval of the Lanzhou-Xining Urban Agglomeration Development Plan by the National Development and Reform Commission in 2018 [47], which triggered large-scale construction of new areas and entered a peak construction period in 2020; (3) in the early stages of the “coal-to-gas” and “coal-to-electricity” projects launched in 2019, the temporary increase in coal-fired heating needs due to the expansion of the power grid [48], resulting in a short-term rebound in emissions.
The carbon emissions of buildings in transportation-oriented cities were significantly lower than those in comprehensive cities but higher than those in other types of regions, with a rapid and volatile growth rate. For example, the carbon emissions of buildings in Haidong City showed an upward trend between 2010 and 2022, but with substantial fluctuations. The growth rate of urban building carbon emissions was about 280.37%. The data changes in Haidong City in 2012 were related to the development and construction of Ledu District. The reasons for the changes in Haidong’s data in 2021 were the following: (1) the State Council approved the establishment of a national-level Hehuang New Area in 2019, with the construction of the core area commencing in 2020; (2) the construction of a post station logistics base in Ping’an District and other projects.
The carbon emissions of buildings in ecological cities were relatively low, showing a trend of increasing and then decreasing, with a relatively fast growth rate. For example, the carbon emissions of buildings in Haiyan County, Tongren City, and Yushu City all followed a trend of initial increase followed by decline from 2010 to 2022. The growth rate of urban building carbon emissions was significant, but the urban agglomeration effect of building carbon emissions was not pronounced. The reasons for the data changes in Haiyan County in 2020 were the following: (1) the construction of Xihai Town and Triangle Town; (2) the building of a cold chain logistics center to establish a modern animal husbandry demonstration area on the plateau. The reasons for the data changes in Tongren City in 2021 were the following: (1) Tongren City was restructured from a county to a city in 2020, with the project of Tongren’s restructuring launched in 2020, leading to an increase in facility construction projects; (2) the construction of large-scale public facilities in the Regong Cultural Industrial Park in 2021 and the implementation of the “characteristic town” project in 2021. The reasons for the data changes in Gonghe County in 2022 were the following: (1) the construction of photovoltaic heating projects in 2021 to replace coal-fired boilers. The reasons for the data changes in Maqin County in 2021 were the following: (1) the implementation of the road widening project and the expansion project of Guoluo Prefecture People’s Hospital in 2021. The reasons for the data changes in Yushu City in 2013 were the following: (1) post-disaster reconstruction in Yushu from 2010 to 2013 led to an increase in carbon emissions from housing construction and building materials transportation. The changes in Yushu’s data in 2021 were the following: (1) the construction of Tibetan-style residential houses for “electricity and heating transformation”, the reconstruction and expansion of Yushu Batang Airport, and other projects.
Emissions from industrial cities were relatively high, with an overall trend first increasing and then decreasing, but the growth rate was relatively slow. For example, the city’s building carbon emissions rose and then fell between 2010 and 2022. The growth rate of building carbon emissions was about 84.9%. This was related to the development of mineral resources and increased industrial activities in the region. The decrease in data in 2014 and 2020 was associated with industrial upgrading, reducing the energy consumption of outbuildings and replacing fossil energy in industrial buildings. This included the introduction of new enterprises to achieve comprehensive utilization of the chemical industry and improve the utilization rate of new energy, the transformation of large coal-fired boilers, and the elimination of highly polluting fuels.
In the analysis of carbon emission fluctuation data, the research identified the following key factors, including the policy response time lag effect. After the implementation of major policies, it usually takes 2 to 3 years to observe a significant turning point in the data [49]. After the construction cycle of engineering projects leads to the start of large-scale infrastructure projects, carbon emissions typically peak in the second to third year [50]. The climate adaptation cost effect, in the year following extreme weather events, is usually accompanied by a short-term emission increase caused by the heating system transformation [51]. Influence of technology substitution, emission fluctuations caused by “parallel new and old systems” often occur in the early stages of clean technology promotion [52].
4.3. Impact Mechanism of Building Carbon Emissions
At the overall level, the impact of socio-economic structure and urban expansion characteristics on building carbon emissions exhibits a significant positive correlation, as shown in Figure 4. Similarly, the impact of the population and urban environment dimension on building carbon emissions also demonstrates a positive correlation, with some factors being influenced by different urban types. In contrast, the impact of climate and topographic attributes on building carbon emissions shows a negative correlation. Among these factors, gross domestic products (GDP), urban central heating area, per capita GDP, and built-up areas have a significant positive effect. However, the effect of housing construction area and regional average temperature is not notable. Additionally, regional average sunshine duration and the proportion of residential construction land exhibit a negative driving effect.
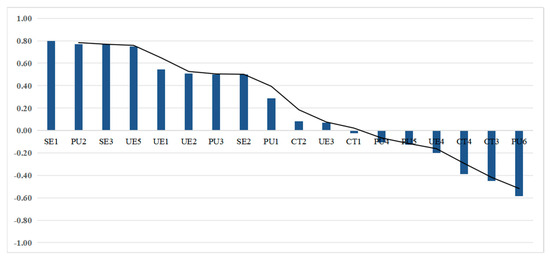
Figure 4.
Statistical data on the average correlation values of various influencing factors.
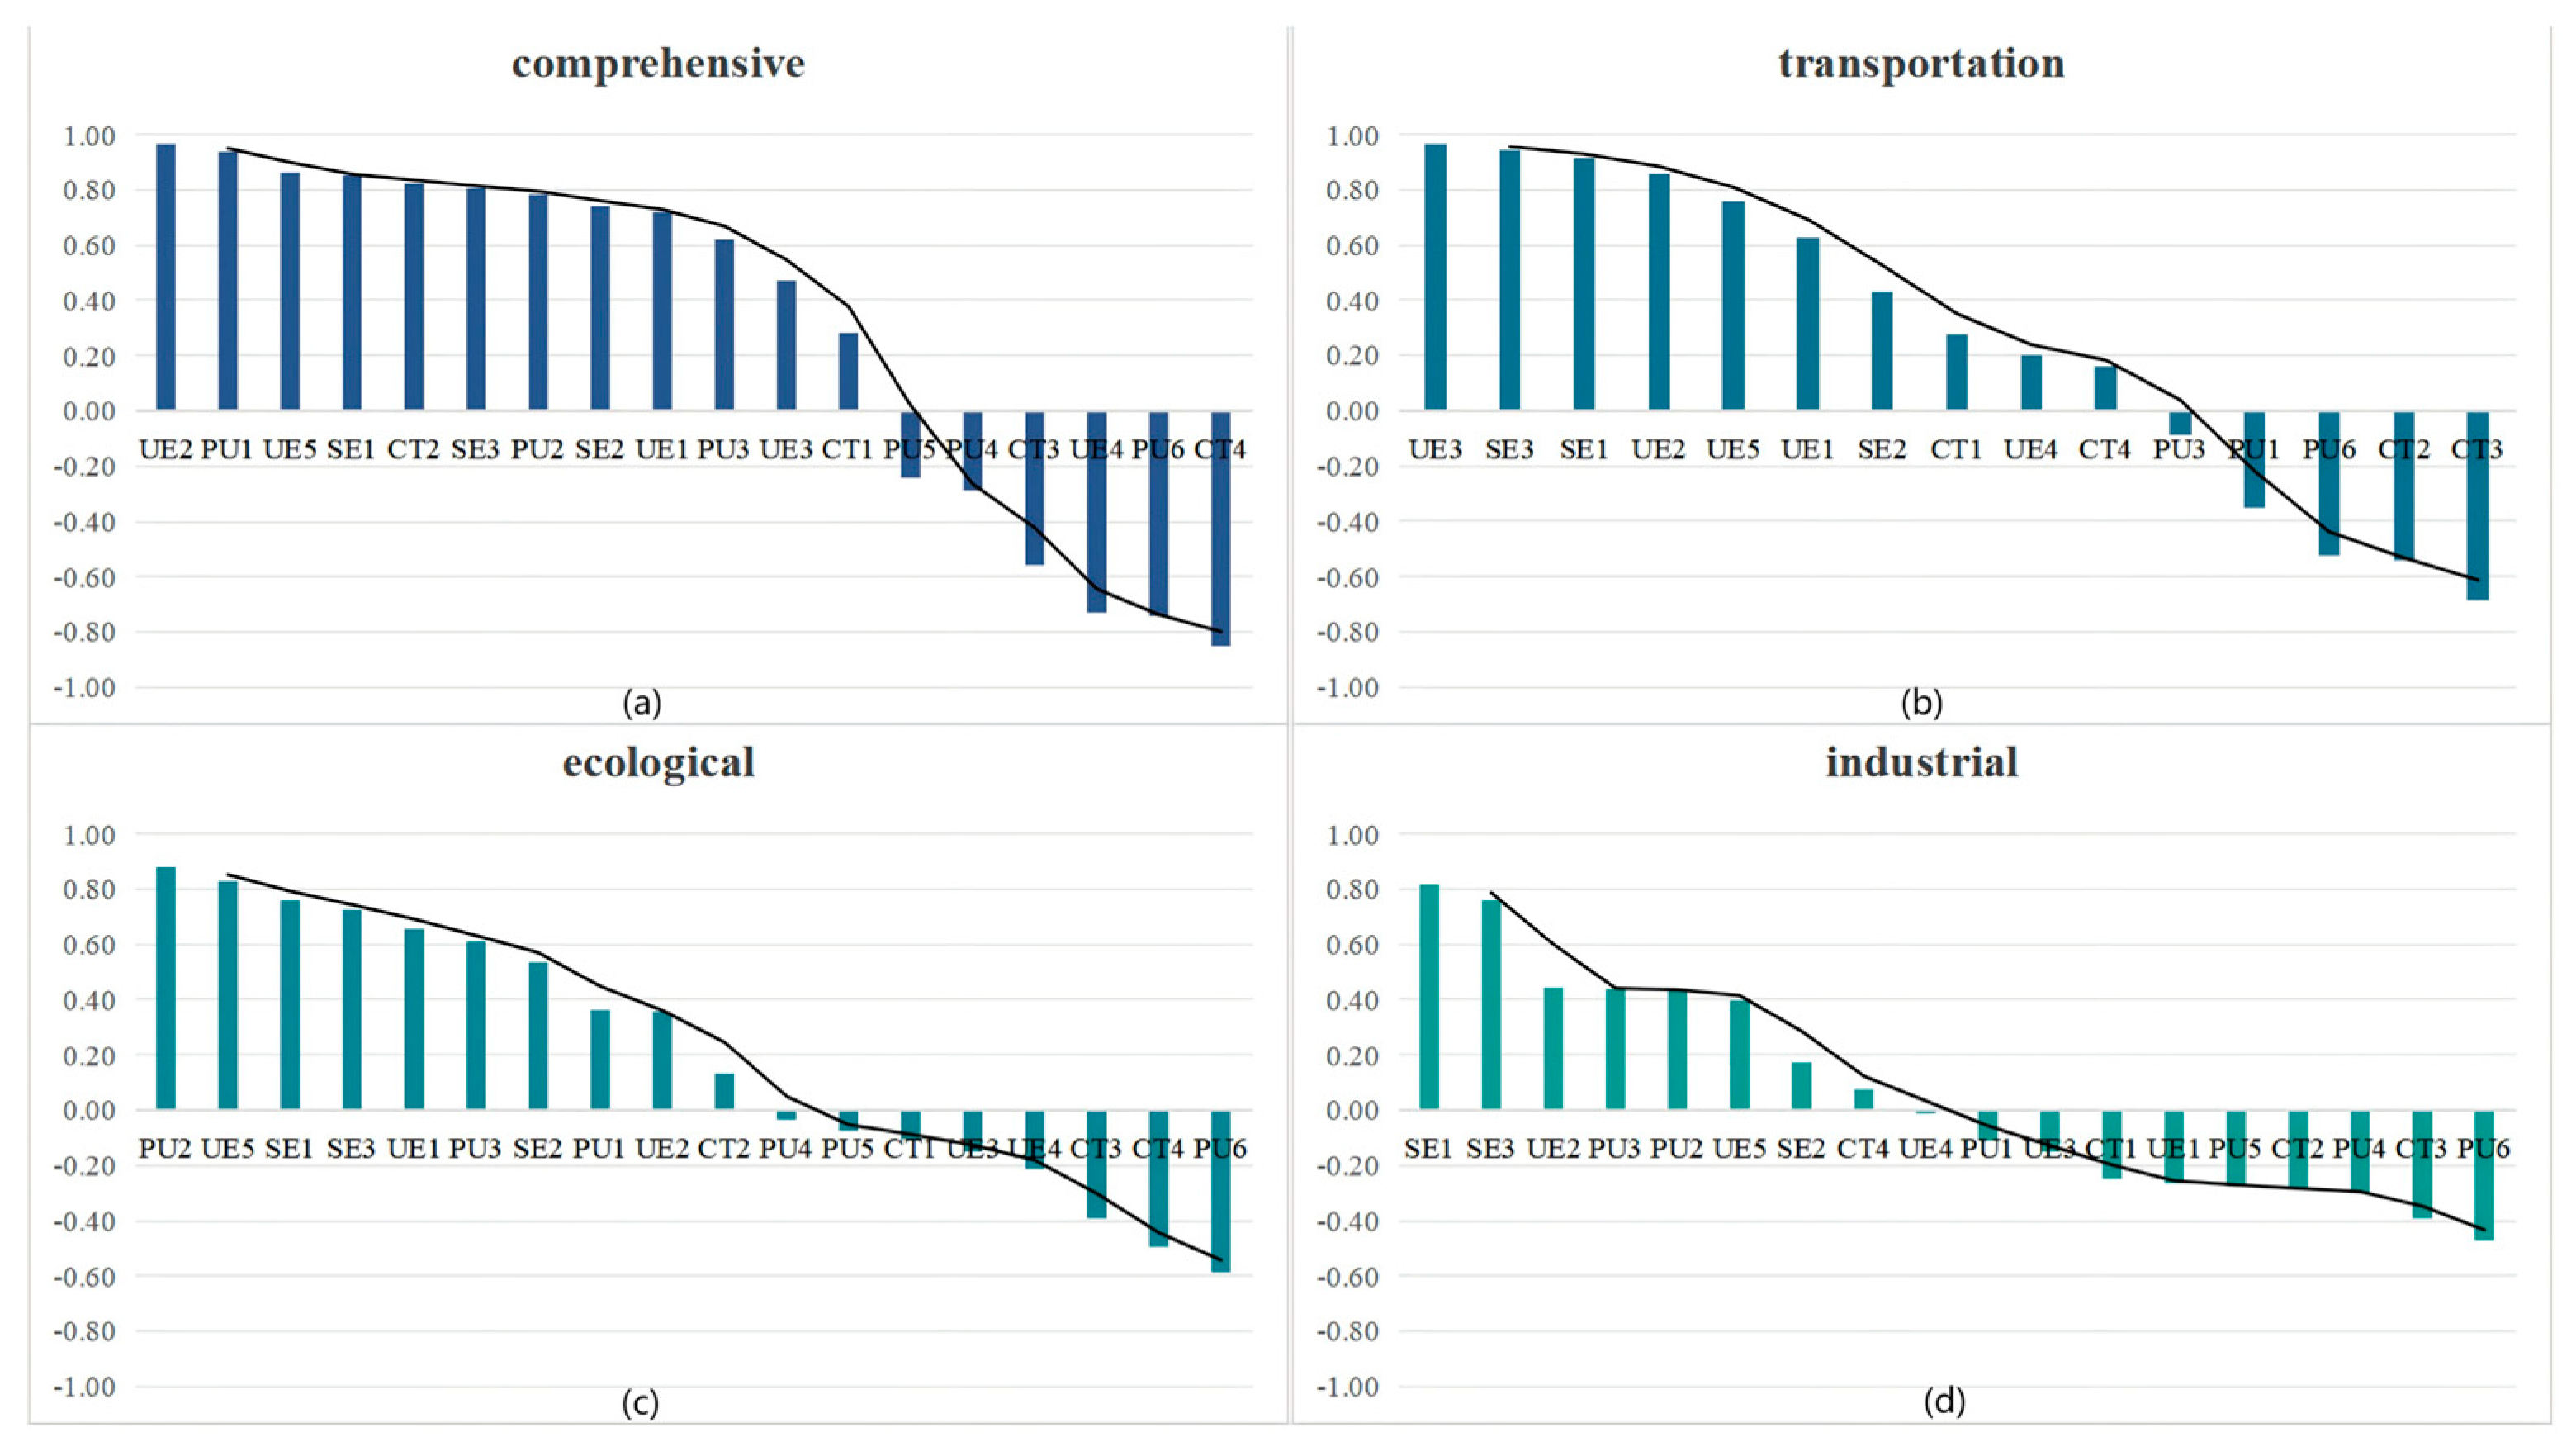
Differentiated city types exhibit distinct characteristics. As shown in Figure 5, comprehensive cities exhibit a typical correlation in “economy–space” coupling, where the proportion of the tertiary industry and the density of infrastructure in built-up areas play a joint role. The demand for climate adaptation is significant, and the positive correlation of average wind speed confirms the characteristics of heating energy consumption in alpine regions. Transportation-oriented cities present a paradox of construction intensity, with a positive correlation between high housing construction areas and a weak positive correlation of completed area. Gaps in the heating system (lack of data) expose infrastructure shortcomings. The environmental constraint effect of ecological cities is prominent, with the negative correlation between wind speed and sunshine reflecting the potential of renewable energy utilization. The correlation of the building heating ratio is minimal, while the correlation of the building heating area is significant, indicating that heating and other energy demands are the main sources of carbon emissions. There are significant differences in spatial morphology, and the negative correlation of the urban shape index demonstrates the emission reduction advantage of compact layout. Industrial cities exhibit a correlation with a unipolar industrial economy, with per capita GDP and climate factors forming a hedging pattern. The alienation of expansion patterns and the negative correlation of urban population density reveal the spatial efficiency characteristics of industrial cities.

Figure 5.
Correlation of influencing factors of carbon emissions in different types of cities. (a) comprehensive; (b) transportation; (c) ecological; (d) industrial.
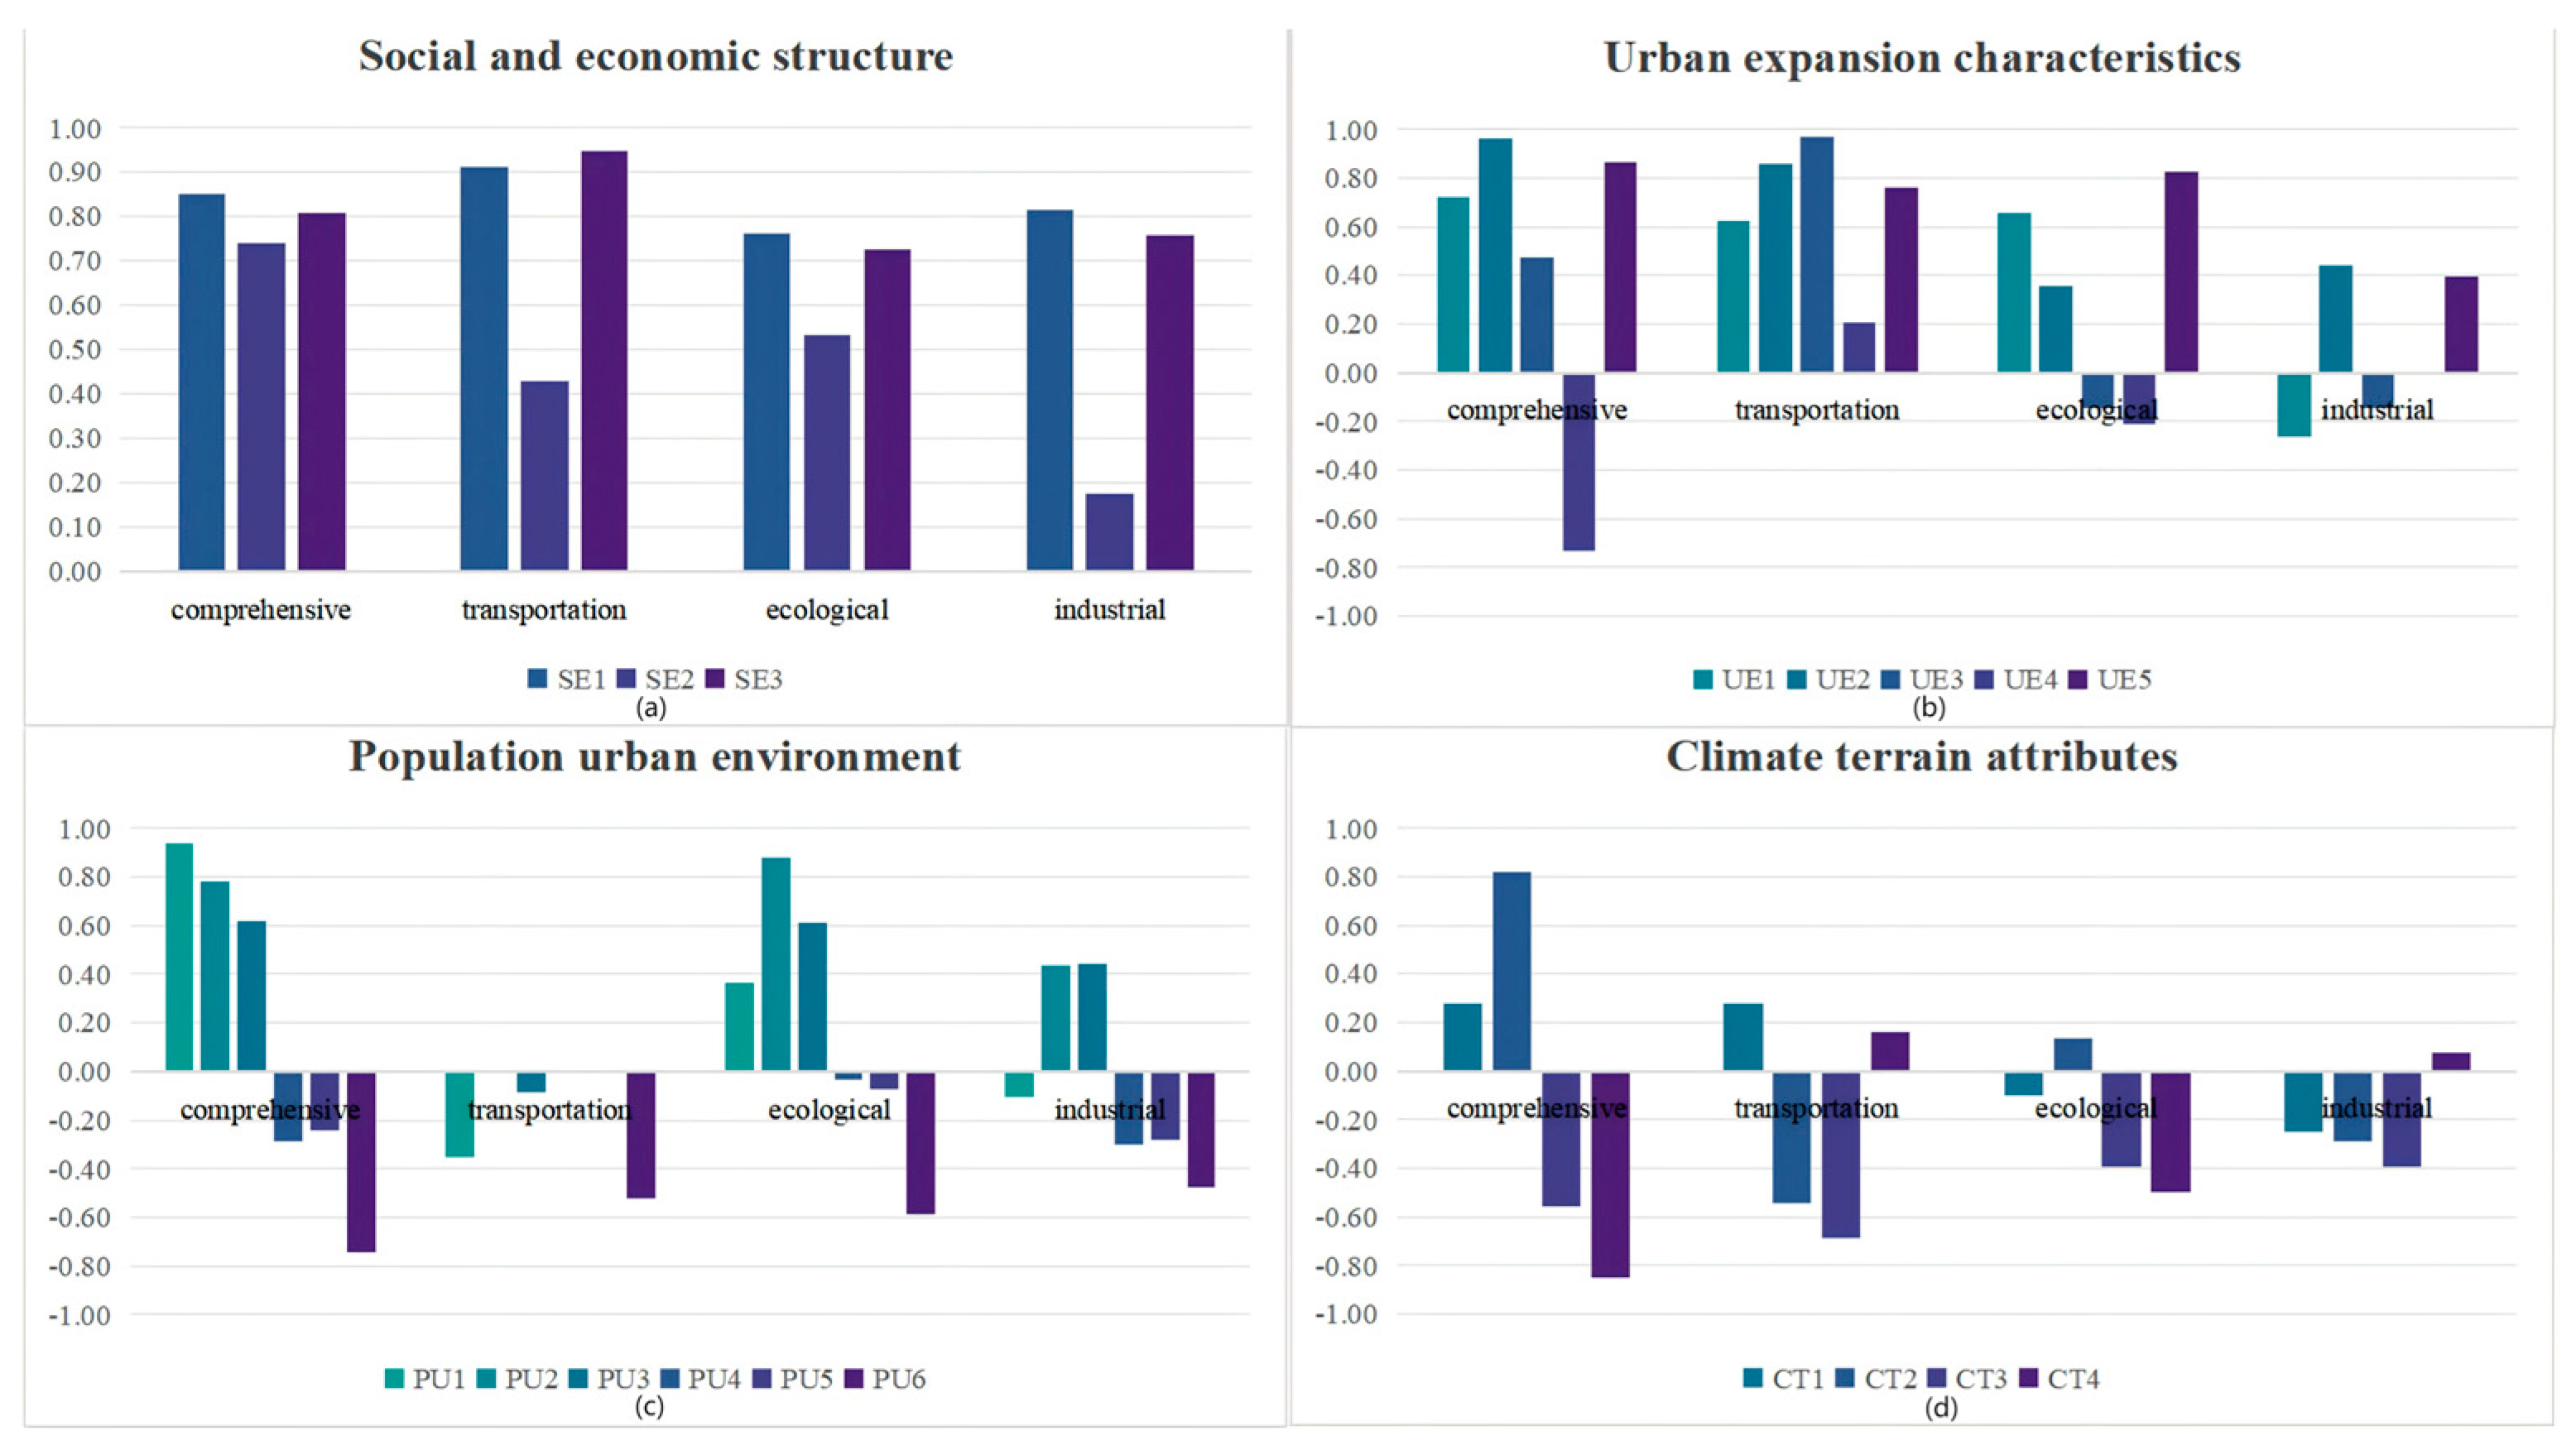
When analyzing the fluctuation data of carbon emissions, factors such as GDP, the proportion of the tertiary industry, per capita GDP, and built-up areas play a significant role. As shown in Figure 6, the economic correlation effect is pronounced in the overall impact pattern. Specifically, economic indicators such as GDP, the proportion of the tertiary industry, and per capita GDP generally show a high positive correlation with carbon emissions, indicating that economic development remains the primary factor with positive correlation of carbon emissions. However, industrial cities exhibit differentiation in industrial structures, highlighting significant differences in the correlation of industrial structure on carbon emissions across different cities. Moreover, the dual-edged sword effect of urban sprawl is also worth noting. Urban population density and urban population were significantly positively correlated with carbon emissions, but the area of housing construction was negatively correlated in ecological areas, reflecting the low-carbon orientation of ecological reserve construction activities. Some key cross-cutting correlations indicate that the spatial mismatch between climate adaptation and economic development, coupled with the superposition of alpine regions and high economic levels, forms a “double high” dilemma of carbon emissions. The infrastructure density trap, where the density of water supply pipelines is positively correlated with the high heating area, reveals the carbon lock-in effect of traditional infrastructure models [53].
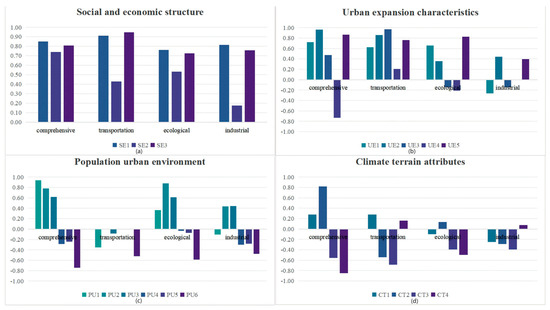
Figure 6.
Correlation of Influencing Factors of Urban Building Carbon Emissions in Different Types of Cities (a) Climate terrain attributes; (b) Urban expansion characteristics; (c) Population urban environment; (d) Climate terrain attributes.
5. Discussion
5.1. Temporal and Spatial Variation Characteristics of Building Carbon Emissions in Plateau Cities
Overall, carbon emissions exhibit a year-by-year increasing trend, particularly in the middle and late stages. However, there are also significant fluctuations in the data. The increase in carbon emissions between 2010 and 2015 was more pronounced, especially in Xining and Haidong, where the level of carbon emissions generally rose, with more significant increases in 2013 and 2014. From 2016 to 2022, the increase in carbon emissions was relatively stable. In terms of total carbon emissions, they are significantly lower than those of cities in central and coastal provinces [54], but the average annual growth rate of carbon emissions exceeds 10%, which is at a high growth level [55]. Differentiated types of plateau cities present their own unique characteristics regarding building carbon emissions. Comprehensive cities show an overall upward trend with a relatively fast growth rate. Transportation-oriented cities also show an upward trend, but with more fluctuations and faster growth. Eco-cities show a trend of first increasing and then decreasing, with relatively low building carbon emissions, but they are also growing rapidly. The overall growth of industrial cities showed a trend of first rising and then declining, with relatively high building carbon emissions, but the growth rate was relatively slow.
5.2. The Impact Mechanism of Carbon Emissions of Differentiated Types of Plateau Urban Buildings
Comprehensive cities, which are developing in multiple fields such as economy, transportation, and culture, typically face high carbon emissions from buildings. The carbon emissions of these cities exhibit significant correlation with economic factors such as GDP, built-up areas, and the proportion of the tertiary industry. Xining’s carbon emissions are significantly correlated with the size of the city and the development of the tertiary industry, so building carbon emissions increase with urban expansion and economic growth [56]. Transportation-based cities experience rapid infrastructure construction, and these cities usually have a high area of completed housing and construction area, so building carbon emissions exhibit significant correlation with factors such as construction area and infrastructure construction. Ecological cities may have lower carbon emissions from buildings due to their focus on ecological protection and environmentally friendly development. However, urban population density, building heating areas, infrastructure construction, etc., will still affect their building carbon emissions, especially when the population is concentrated and infrastructure construction is expanded, carbon emissions may increase. The dominance of industrial production in industrial cities makes building carbon emissions mainly correlated with industrial activities, and the tertiary industry and other factors exhibit a relatively weak correlation on carbon emissions. Although infrastructure construction in these cities may bring some carbon emissions, the overall correlation is minimal. It is worth noting that while this paper has quantified the contribution of various influencing factors to urban carbon emissions, it has not yet determined the specific extent to which changes in factors related to correlation can increase or decrease carbon emissions. For example, reducing the built-up area by a certain percentage would result in a corresponding reduction in carbon emissions by an undetermined amount. Future research should employ additional methods and data to further explore these relationships.
5.3. Differentiated Carbon Emission Reduction Strategies for Plateau Urban Buildings
As the core pole of carbon emissions, comprehensive cities should focus on the synergistic optimization of economic agglomeration and spatial efficiency. For the characteristic of a high proportion of the tertiary industry but low spatial efficiency [57], green building standards should be improved, and the energy efficiency of public buildings should be enhanced. The data reveal negative effects such as residential land and topography, and it is necessary to promote job-housing balance through 15 min community planning, transforming commuting carbon emissions into spatial structure optimization goals [58]. Transportation-oriented cities should rely on the flow characteristics of transportation hubs to increase the green transformation of urban transportation infrastructure systems. To strengthen the coordination of architecture and urban planning, reduce unnecessary building expansion, and improve the utilization rate of urban space, it is necessary to establish a modular construction technology system to address the shortcomings of infrastructure [59]. Ecological cities are significantly affected by the pulse effect of reconstruction, and it is necessary to strengthen the architectural design of ecological cities, promote green renovation of buildings, reduce the energy demand of buildings, strengthen the application of renewable energy, and gradually replace traditional fossil energy [60]. We must promote prefabricated rammed earth technology, use local materials to reduce embodied carbon, and achieve protective development through the carbon sink incremental quota mechanism. Ecological cities should prioritize the protection of the ecological environment and limit excessive land development and building expansion. Industrial cities exhibit unique “M-shaped” fluctuations, and it is necessary to promote green industrial transformation, reduce traditional high-carbon emission industrial activities, and promote the application of clean energy and green technologies in industrial production [61]. For new buildings and large-scale residential complexes, stricter energy-saving requirements should be implemented. It is necessary to increase the use of clean energy and strengthen regional planning within cities to reduce over-reliance on areas with high energy consumption. At the level of regional synergy, the spatial analysis of data shows that the focus of carbon emissions is evident. It is suggested to construct a cross-regional carbon flow balance mechanism, allowing the carbon sinks produced by ecological cities to offset a certain proportion of the construction quota of comprehensive cities, and quantify negative correlation factors such as wind speed and sunshine as design parameters, so as to promote the transformation of plateau urban-rural construction to a climate-adaptive model [62]. It is worth noting that while the research has proposed reasonable recommendations based on the data analysis, the actual emission reduction effects of these measures require further investigation and in-depth discussion.
5.4. Mechanism of Regional Cross-Boundary Carbon Flow Balance and Stakeholder Collaboration Effects
The core framework of the cross-regional carbon flow balance mechanism in Qinghai Province is built upon two key pillars: differentiated quota allocation and ecological compensation. For quota allocation, it is essential to comprehensively evaluate the economic development level, carbon emission intensity, and carbon sink capacity of each prefecture and city. Based on these evaluations, an initial quota allocation system tailored to regional characteristics will be established. Furthermore, high-emission regions will be encouraged to purchase quotas from high-carbon sink regions via the provincial carbon emission trading platform, thereby achieving total quantity control and benefit compensation. Simultaneously, a horizontal fiscal transfer payment mechanism will be constructed to facilitate financial support from industrial zones to ecological protection areas, specifically for the development of low-carbon infrastructure and clean energy projects.
In the process of implementing sustainable and low-carbon building strategies in Qinghai Province, government policies should serve as a guiding force, industry technologies should act as the core driver, and community participation should provide foundational support. By clearly defining responsibilities, enhancing communication and collaboration, and fostering coordinated efforts, an integrated and robust strategy can be established. Specifically, the government should lead in formulating, refining, and enforcing relevant policies, regulations, and standard systems, while strengthening supervision and incentive mechanisms to ensure effective policy implementation. Simultaneously, the industry must actively align with policy initiatives, intensify research and innovation in technology, and develop tailored solutions for ultra-low energy consumption, near-zero energy consumption, low-carbon, and zero-carbon buildings suited to high-altitude and cold regions. On the other hand, communities should enhance residents’ awareness and engagement in low-carbon buildings through education, public awareness campaigns, and organized activities. Communities should also encourage the adoption of energy-efficient equipment and renewable energy sources and promote active resident participation in retrofitting projects aimed at improving the energy efficiency of existing buildings. Through close collaboration among the government, industry, and communities, the objectives of energy conservation and carbon emission reduction in the building sector can be achieved, thereby fostering harmonious and sustainable development of the economy, society, and environment.
5.5. Partial Results Discussion
Some scholars argue that achieving carbon emission reduction targets hinges on transitioning the energy structure of the Qinghai–Tibet Plateau toward a cleaner model. This study examines differentiated types of plateau cities, analyzing urban-level factors influencing carbon emissions to propose more targeted mitigation strategies. Research indicates that in cold regions, increased energy consumption for heating and other purposes leads to higher building-related carbon emissions [63], findings corroborated by this study’s significant impact of heating area. Other studies highlight the rapid growth of resident consumption-based carbon emissions, primarily driven by household consumption levels [64], reflecting the economy’s substantial influence on emissions. While economic factors are deemed most impactful in this study, slight discrepancies may arise due to variations in research scope and focus. Additionally, effective management measures for low-carbon city construction and optimal urban spatial layouts are critical for sustainable development [65]. Beyond green economic policies, actions supporting urban planning, infrastructure development, and energy-saving technologies align with this study’s recommendations. Studies also suggest that changes in construction land significantly affect carbon emissions; in Lhasa, complex landscape and boundary shapes correlate with higher emissions [66], though this influence weakens with economic progress. Consistent with these findings, this study observes a notable effect of the urban shape index. Finally, research shows significant urbanization in high-altitude cities, contributing approximately 30% to their warming trends [67]. Although temperature influences carbon emissions in this study, its effect is not pronounced, warranting further investigation into their interrelationship.
6. Conclusions
Based on the panel data of two cities and six prefectures in Qinghai Province over 13 years (2010 to 2022), this study used the “carbon emission factor” method to calculate the annual building carbon emissions of the central urban areas of these regions and analyzed the spatiotemporal characteristics of building carbon emissions. Subsequently, the XGBoost model was employed to explore the impact mechanism of carbon emissions from plateau urban buildings, conducting a correlation analysis of the influencing factors of four main dimensions—economic development structure, population and urban environment, urban expansion degree, and climate and topography—on different types of plateau cities. This study provides a scientific basis for formulating targeted low-carbon development policies in ecologically fragile areas such as plateaus, thereby promoting the balance between ecological protection and economic development in these regions and achieving the long-term goal of sustainable development. The results are as follows: (1) The carbon emissions of urban buildings in plateau areas have shown an overall increasing trend, albeit with significant fluctuations. The average growth rate is relatively fast, and the growth rate and trend vary across different regions. (2) The primary factor influencing building carbon emissions in plateau areas is economic growth. The interaction between climate and topography can lead to an increase in urban building carbon emissions. (3) The influencing mechanisms of carbon emissions differ among various types of buildings. Comprehensive cities are significantly affected by economic growth and the development of the tertiary industry. Transportation-oriented cities are more notably influenced by infrastructure construction. Ecological and industrial cities have different carbon emissions drivers due to their unique industrial structures and resource and environmental conditions. (4) Different emission reduction measures should be adopted for cities of different types and development conditions. At the level of regional synergy, it is recommended to establish a cross-regional carbon flow balance mechanism within the province.
The data used in this study primarily originate from statistical yearbooks to ensure accuracy. Consequently, the selection of indicators is subject to certain limitations. This study draws on other research that employs XGBoost for analyzing building carbon emissions to demonstrate its effectiveness. However, comparisons with other models are lacking. Although, in the analysis of model applicability and effectiveness, based on the results of relevant parameters, we conclude that the model exhibits satisfactory performance. With advancements in computer technology [68,69], future research should involve testing additional machine learning models, expanding effective data sources, and further investigating the impact of specific carbon reduction measures to contribute more rationally and accurately to the sustainable development of plateau cities.
Author Contributions
Conceptualization, J.Z. and W.L.; methodology, H.J. and J.Z.; software, P.L. and S.W. (Shan Wang); validation, P.L. and S.W. (Shuai Wu); data curation, B.S. and P.L.; writing—original draft, B.S.; writing—review and editing, H.J. and B.S.; supervision, H.J.; project administration, J.Z. and W.L. All authors have read and agreed to the published version of the manuscript.
Funding
This research was funded by the National Social Science Fund of China (Grant No. 22XTJ0055), Qinghai Provincial Social Science Foundation Youth Project (Grant No. 24QN064), Smart Carbon Control Model Construction Project for Plateau Urban Carbon Neutrality: (Grant No. D202410141400367689), 2024 Project of Collaborative Education-Industry Cooperation for Coordinated Training under the Guidance of the Ministry of Education (Grant No. 241202373010855), The Green Innovation Integration Training Project of the 2024 Undergraduate Innovation Training Program (Grant No. qdkc-2539).
Data Availability Statement
The data used to support the results in this article are included within the paper. If you have any queries regarding the data, the data of this study would be available from the correspondence upon request.
Conflicts of Interest
Shuai Wu was employed by China Construction Sixth Engineering Bureau Co., Ltd. The remaining authors declare that the research was conducted in the absence of any commercial or financial relationships that could be construed as a potential conflict of interest.
References
- Fang, J.; Zhu, J.; Wang, S.; Yue, C.; Shen, H. Global warming, human-induced carbon emissions, and their uncertainties. Sci. China Earth Sci. 2011, 54, 1458–1468. [Google Scholar] [CrossRef]
- Alexander, L.; Allen, S.; Bindoff, N.; Breon, F.-M.; Church, J.; Cubasch, U.; Emori, S.; Forster, P.; Friedlingstein, P.; Gillett, N.; et al. Climate Change 2013: The Physical Science Basis. Contribution of Working Group I to the Fifth Assessment Report of the Intergovernmental Panel on Climate Change; IPCC: Geneva, Switzerland, 2013. [Google Scholar]
- Liu, Z.; Deng, Z.; Davis, S.; Ciais, P. Monitoring global carbon emissions in 2022. Nat. Rev. Earth Environ. 2023, 4, 205–206. [Google Scholar] [CrossRef]
- Solomon, S.; Plattner, G.K.; Knutti, R.; Friedlingstein, P. Irreversible climate change due to carbon dioxide emissions. Proc. Natl. Acad. Sci. USA 2009, 106, 1704–1709. [Google Scholar] [CrossRef] [PubMed]
- Huang, Z.; Zhou, H.; Miao, Z.; Tang, H.; Lin, B.; Zhuang, W. Life-cycle carbon emissions (LCCE) of buildings: Implications, calculations, and reductions. Engineering 2024, 35, 115–139. [Google Scholar] [CrossRef]
- Chen, L.; Msigwa, G.; Yang, M.; Osman, A.I.; Fawzy, S.; Rooney, D.W.; Yap, P.-S. Strategies to achieve a carbon neutral society: A review. Environ. Chem. Lett. 2022, 20, 2277–2310. [Google Scholar] [CrossRef]
- Zeng, J.; Zhou, T.; Xu, Y.; Lin, Q.; Tan, E.; Zhang, Y.; Wu, X.; Zhang, J.; Liu, X. The fusion of multiple scale data indicates that the carbon sink function of the Qinghai-Tibet Plateau is substantial. Carbon Balance Manag. 2023, 18, 19. [Google Scholar] [CrossRef]
- Xu, X.; Yang, G.; Tan, Y.; Liu, J.; Hu, H. Ecosystem services trade-offs and determinants in China’s Yangtze River Economic Belt from 2000 to 2015. Sci. Total Environ. 2018, 634, 1601–1614. [Google Scholar] [CrossRef]
- Hu, Y.; Sun, Z.; Zhang, R.; Li, G. Spatial service scope of carbon neutrality and its simulation prediction in the Loess Plateau of China. Appl. Ecol. Environ. Res. 2024, 22, 2225–2240. [Google Scholar] [CrossRef]
- Ahmed Ali, K.; Ahmad, M.I.; Yusup, Y. Issues, impacts, and mitigations of carbon dioxide emissions in the building sector. Sustainability 2020, 12, 7427. [Google Scholar] [CrossRef]
- Mostafaei, H.; Rostampour, M.A.; Chamasemani, N.F.; Wu, C. An In-depth Exploration of Carbon Footprint Analysis in the Construction Sector with Emphasis on the Dam Industry. In Carbon Footprint Assessments, Environmental Footprints and Eco-design of Products and Processes, 2nd ed.; Muthu, S.S., Ed.; Springer: Cham, Switzerland, 2024; pp. 45–80. [Google Scholar] [CrossRef]
- Han, H.; Chen, W.; Zhang, J.; Wang, W.; Xiao, Z.; Wang, Z.; Wan, Y. Study on the characteristics of spatial evolution and influencing factors of green buildings in China. Buildings 2024, 14, 714. [Google Scholar] [CrossRef]
- Jiang, J.; Chen, S. Exploring the pathways of achieving carbon peaking and carbon neutrality targets in the provinces of the Yellow River Basin of China. Sustainability 2024, 16, 6553. [Google Scholar] [CrossRef]
- Li, X.; Li, Y.; Zhou, H.; Fu, Z.; Cheng, X.; Zhang, W. Research on the carbon emission baselines for different types of public buildings in a northern cold areas city of China. Buildings 2023, 13, 1108. [Google Scholar] [CrossRef]
- Wo, R.; Fang, D.; Song, D.; Chen, B. Analysis of embodied carbon emissions and carbon sequestration in Tibetan Plateau-Case study of Tibet and Qinghai. Appl. Energy 2023, 347, 121449. [Google Scholar] [CrossRef]
- Guo, Q.; Wang, F.; Gao, Y.; Liu, Y.; Liu, Y.; Zhang, T. Study on the performance of an ultra-low energy building in the Qinghai-Tibet Plateau of China. J. Build. Eng. 2023, 70, 106345. [Google Scholar] [CrossRef]
- Jiang, Y.; Huang, Z. Impact of urban vitality on carbon emission: An analysis of 222 Chinese cities based on the spatial Durbin model. Humanit. Soc. Sci. Commun. 2024, 11, 1312. [Google Scholar] [CrossRef]
- Ou, J.; Liu, X.; Li, X.; Chen, Y. Quantifying the relationship between urban forms and carbon emissions using panel data analysis. Landsc. Ecol. 2013, 28, 1889–1907. [Google Scholar] [CrossRef]
- Deng, Z.; Javanroodi, K.; Nik, V.M.; Chen, Y. Using urban building energy modeling to quantify the energy performance of residential buildings under climate change. Build. Simul. 2023, 16, 1629–1643. [Google Scholar] [CrossRef]
- Du, Z.; Liu, Y.; Zhang, Z. Spatiotemporal analysis of influencing factors of carbon emission in public buildings in China. Buildings 2022, 12, 424. [Google Scholar] [CrossRef]
- Zhao, X.; Shao, B.; Su, J.; Tian, N. Exploring synergistic evolution of carbon emissions and air pollutants and spatiotemporal heterogeneity of influencing factors in Chinese cities. Sci. Rep. 2025, 15, 2657. [Google Scholar] [CrossRef]
- Li, Y.; Sun, Y. Modeling and predicting city-level CO2 emissions using open access data and machine learning. Environ. Sci. Pollut. Res. 2021, 28, 19260–19271. [Google Scholar] [CrossRef]
- Liu, J.; Xin, Z.; Huang, Y.; Yu, J. Climate suitability assessment on the Qinghai-Tibet Plateau. Sci. Total Environ. 2022, 816, 151653. [Google Scholar] [CrossRef] [PubMed]
- Xiong, L.; Wang, M.; Mao, J.; Huang, B. A review of building carbon emission accounting methods under low-carbon building background. Buildings 2024, 14, 777. [Google Scholar] [CrossRef]
- Intergovernmental Panel on Climate Change. Climate Change 2022: Impacts, Adaptation and Vulnerability. Contribution of Working Group II to the Sixth Assessment Report; Cambridge University Press: Cambridge, UK, 2022. [Google Scholar] [CrossRef]
- Schipper, E.L.F. Catching maladaptation before it happens. Nat. Clim. Change 2022, 12, 617–618. [Google Scholar] [CrossRef]
- Liu, M.; Dong, X.; Wang, X.C.; Zhao, B.; Fan, W.; Wei, H.; Zhang, P.; Liu, R. Evaluating the future terrestrial ecosystem contributions to carbon neutrality in Qinghai-Tibet Plateau. J. Clean. Prod. 2022, 374, 133914. [Google Scholar] [CrossRef]
- Guo, Y.; Chen, P.; Zhu, Y.; Zhang, H. Study on comprehensive evaluation of human settlements quality in Qinghai Province, China. Ecol. Indic. 2023, 154, 110520. [Google Scholar] [CrossRef]
- Gao, Y.; Zhang, Y.; Zhou, Q. Potential of ecosystem carbon sinks to “neutralize” carbon emissions: A case study of Qinghai in west China and a tale of two stages. Glob. Transit. 2022, 4, 1–10. [Google Scholar] [CrossRef]
- Lu, Y.; Chen, S. Exploring the realization pathway of peak and neutralization in the provinces around the Yangtze River of China. J. Clean. Prod. 2024, 466, 142904. [Google Scholar] [CrossRef]
- Feng, Y.; Li, G. Interaction between urbanization and eco-environment in the Tibetan Plateau. J. Geogr. Sci. 2021, 31, 298–324. [Google Scholar] [CrossRef]
- Intergovernmental Panel on Climate Change. IPCC Guidelines for National Greenhouse Gas Inventories; IPCC: Geneva, Switzerland, 1996. [Google Scholar]
- Li, B.; Han, S.; Wang, Y.; Li, J.; Wang, Y. Feasibility assessment of the carbon emissions peak in China’s construction industry: Factor decomposition and peak forecast. Sci. Total Environ. 2020, 706, 135716. [Google Scholar] [CrossRef]
- National Development and Reform Commission. Guidelines for Greenhouse Gas Emission Accounting and Reporting in Industrial Enterprises; NDRC: Beijing, China, 2015.
- Wang, Z.; Geng, L. Carbon emissions calculation from municipal solid waste and the influencing factors analysis in China. J. Clean. Prod. 2015, 104, 177–184. [Google Scholar] [CrossRef]
- Du, J.; Xiang, X.; Zhao, B.; Zhou, H. Impact of urban expansion on land surface temperature in Fuzhou, China using Landsat imagery. Sustain. Cities Soc. 2020, 61, 102346. [Google Scholar] [CrossRef]
- Tan, J.Y. Spatiotemporal distribution and peak prediction of energy consumption and carbon emissions in China’s residential buildings. Appl. Energy 2024, 354, 122167. [Google Scholar] [CrossRef]
- Liu, P.; Lin, B.; Zhou, H.; Wu, X.; Little, J.C. CO2 emissions from urban buildings at the city scale: System dynamic projections and potential mitigation policies. Appl. Energy 2020, 277, 115546. [Google Scholar] [CrossRef]
- Abrar, R.; Sarkar, S.K.; Nishtha, K.T.; Talukdar, S.; Shahfahad; Rahman, A.; Islam, A.R.M.T.; Mosavi, A. Assessing the spatial mapping of heat vulnerability under urban heat island (UHI) effect in the Dhaka metropolitan area. Sustainability 2022, 14, 4945. [Google Scholar] [CrossRef]
- Zhang, N.; Luo, Z.; Liu, Y.; Feng, W.; Zhou, N.; Yang, L. Towards low-carbon cities through building-stock-level carbon emission analysis: A calculating and mapping method. Sustain. Cities Soc. 2022, 78, 103633. [Google Scholar] [CrossRef]
- Firozjaei, M.K.; Sedighi, A.; Mijani, N.; Kazemi, Y.; Amiraslani, F. Seasonal and daily effects of the sea on the surface urban heat island intensity: A case study of cities in the Caspian Sea Plain. Urban Clim. 2023, 51, 101603. [Google Scholar] [CrossRef]
- Liu, Z.; Wang, Y.; Chen, L. Synergistic utilization of wind-solar energy in plateau regions: An optimization model considering negative correlation characteristics. Renew. Energy 2023, 202, 1328–1341. [Google Scholar] [CrossRef]
- Lan, T.; Shao, G.; Xu, Z.; Tang, L.; Dong, H. Considerable role of urban functional form in low-carbon city development. J. Clean. Prod. 2023, 392, 136256. [Google Scholar] [CrossRef]
- Chen, T.; Guestrin, C. XGBoost: A scalable tree boosting system. In Proceedings of the 22nd ACM SIGKDD International Conference on Knowledge Discovery and Data Mining, San Francisco, CA, USA, 13–17 August 2016; pp. 785–794. [Google Scholar] [CrossRef]
- Hou, Y.; Liu, S. Predictive Modeling and Validation of Carbon Emissions from China’s Coastal Construction Industry: A BO-XGBoost Ensemble Approach. Sustainability 2024, 16, 4215. [Google Scholar] [CrossRef]
- Nalluri, M.; Pentela, M.; Eluri, N.R. A Scalable Tree Boosting System: XG Boost. Int. J. Res. Stud. Sci. Eng. Technol. 2020, 7, 36–51. [Google Scholar] [CrossRef]
- National Development and Reform Commission; Ministry of Housing and Urban-Rural Development. Notice on the Issuance of the Lanzhou-Xining City Cluster Development Plan; NDRC: Beijing, China, 2018.
- Xining Municipal People’s Government. Notice on the Implementation Plan for the “Coal-to-Gas” Retrofitting of Coal-Fired Boilers in 2018; Xining Government: Xining, China, 2018.
- Degirmenci, T.; Aydin, M.; Cakmak, B.Y.; Yigit, B. A path to cleaner energy: The nexus of technological regulations, green technological innovation, economic globalization, and human capital. Energy 2024, 303, 131652. [Google Scholar] [CrossRef]
- Zhang, Z.; Gao, Q.; Shao, S.; Zhang, Y.; Bao, Y.; Zhao, L. Carbon emission scenarios of China’s construction industry using a system dynamics methodology–Based on life cycle thinking. J. Clean. Prod. 2024, 435, 140457. [Google Scholar] [CrossRef]
- Luo, H.Z.; Liu, Z.G.; Li, Y.Y.; Meng, X.Z.; Yang, X.H. Characterizing and predicting carbon emissions from an emerging land use perspective: A comprehensive review. Urban Clim. 2024, 58, 102141. [Google Scholar] [CrossRef]
- Zhang, X.; Wang, M.; Zang, H. Renewable energy technology innovation, climate risk, and carbon emission reduction: A cross-country analysis. Renew. Energy 2025, 240, 122136. [Google Scholar] [CrossRef]
- Sun, X.Y.; Zheng, W.K.; Wang, F.; Wang, H.Y.; Jiang, Y.Q.; Bai, Z.Q.; Jiao, J.M.; Guo, C.B. Analysis of operation regulation on delay time in long-distance heating pipe systems for practical engineering. Sustain. Energy Grids Netw. 2024, 40, 101526. [Google Scholar] [CrossRef]
- Yang, J.; Zheng, X. The spatiotemporal distribution characteristics and driving factors of carbon emissions in the Chinese construction industry. Buildings 2023, 13, 2808. [Google Scholar] [CrossRef]
- Yang, Z.; Wu, J.; Shang, X.; Fu, R.; Xie, L.; Ge, Q. Scaling laws of CO2 emissions during global urban expansion. npj Urban Sustain. 2025, 5, 3. [Google Scholar] [CrossRef]
- Chen, W.; Wang, G.; Xu, N.; Ji, M.; Zeng, J. Promoting or inhibiting? New-type urbanization and urban carbon emissions efficiency in China. Cities 2023, 140, 104429. [Google Scholar] [CrossRef]
- Cheng, B.; Li, J.; Zhang, Y. Spatial efficiency optimization in service-oriented cities: A case study of plateau urban agglomerations. Sustain. Cities Soc. 2022, 78, 103621. [Google Scholar] [CrossRef]
- Khavarian-Garmsir, A.R.; Sharifi, A.; Sadeghi, A. The 15-minute city: Urban planning and design efforts toward creating sustainable neighborhoods. Cities 2023, 132, 104101. [Google Scholar] [CrossRef]
- Ashraf, S.R.B.; Daus, D.; Kuester-Campioni, T. Crafting a Transport-Oriented City for Sustainable Living. Amplify 2024, 37. Available online: https://cutter.com/article/crafting-transport-oriented-city-sustainable-living (accessed on 6 April 2025).
- Chen, L.; Hu, Y.; Wang, R.; Li, X.; Chen, Z.; Hua, J.; Osman, A.I.; Farghali, M.; Huang, L.; Li, J.; et al. Green building practices to integrate renewable energy in the construction sector: A review. Environ. Chem. Lett. 2024, 22, 751–784. [Google Scholar] [CrossRef]
- Sokka, L.; Pakarinen, S.; Melanen, M. Industrial symbiosis contributing to more sustainable energy use—An example from the forest industry in Kymenlaakso, Finland. J. Clean. Prod. 2011, 19, 285–293. [Google Scholar] [CrossRef]
- Liu, X.; Chen, L.; Lu, Y.; Chang, M.; Xiao, Y.; Yang, H.; Kong, D.; Zhang, L. Research on the impact of the digital economy on carbon emissions based on the dual perspectives of carbon emission reduction and carbon efficiency. Sci. Rep. 2024, 15, 3416. [Google Scholar] [CrossRef]
- Li, R.; Chen, L.; Cai, W.; You, K.; Li, Z.; Ran, L. Historical peak situation of building carbon emissions in different climate regions in China: Causes of differences and peak challenges. Sci. Total Environ. 2023, 903, 166621. [Google Scholar] [CrossRef]
- Fan, Y.; Fang, C. Insight into carbon emissions related to residential consumption in Tibetan Plateau–Case study of Qinghai. Sustain. Cities Soc. 2020, 61, 102310. [Google Scholar] [CrossRef]
- Chen, L.; Yang, H.-N.; Xiao, Y.; Tang, P.-Y.; Liu, S.-Y.; Chang, M.; Huang, H. Exploring spatial pattern optimization path of urban building carbon emission based on low-carbon cities analytical framework: A case study of Xi’an, China. Sustain. Cities Soc. 2024, 111, 105551. [Google Scholar] [CrossRef]
- Wang, M.; Kong, D.; Mao, J.; Ma, W.; Ayyamperumal, R. The Impacts of Land Use Spatial Form Changes on Carbon Emissions in Qinghai–Tibet Plateau from 2000 to 2020: A Case Study of the Lhasa Metropolitan Area. Land 2023, 12, 122. [Google Scholar] [CrossRef]
- Zhong, Y.; Chen, S.; Mo, H.; Wang, W.; Yu, P.; Wang, X.; Chuduo, N.; Ba, B. Contribution of urban expansion to surface warming in high-altitude cities of the Tibetan Plateau. Clim. Change 2022, 175, 6. [Google Scholar] [CrossRef]
- Sreenivasulu, V.B.; Neelam, A.K.; Panigrahy, A.K.; Vakkalakula, L.; Singh, J.; Singh, S.G. Benchmarking of Multi-Bridge-Channel FETs Toward Analog and Mixed-Mode Circuit Applications. IEEE Access 2024, 12, 7531–7539. [Google Scholar] [CrossRef]
- Gowthami, U.; Panigrahy, A.K.; Rani, D.S.; Bhukya, M.N.; Sreenivasulu, V.B.; Prakash, M.D. Performance Improvement of Spacer-Engineered N-Type Tree Shaped NSFET Toward Advanced Technology Nodes. IEEE Access 2024, 12, 59716–59725. [Google Scholar] [CrossRef]


Disclaimer/Publisher’s Note: The statements, opinions and data contained in all publications are solely those of the individual author(s) and contributor(s) and not of MDPI and/or the editor(s). MDPI and/or the editor(s) disclaim responsibility for any injury to people or property resulting from any ideas, methods, instructions or products referred to in the content. |
© 2025 by the authors. Licensee MDPI, Basel, Switzerland. This article is an open access article distributed under the terms and conditions of the Creative Commons Attribution (CC BY) license (https://creativecommons.org/licenses/by/4.0/).