
Experimental and Numerical Study on Mechanical Performance of Half-Tenon Beam–Column Joint Under Different Reinforcement of Energy Dissipation Plate and Steel Sleeve

 ,
,
Abstract
:1. Introduction
2. Design and Fabrication of the Joints
2.1. Test Materials
- (1)
- Chinese fir
- (2)
- Q235B steel
- (3)
- High-strength bolt
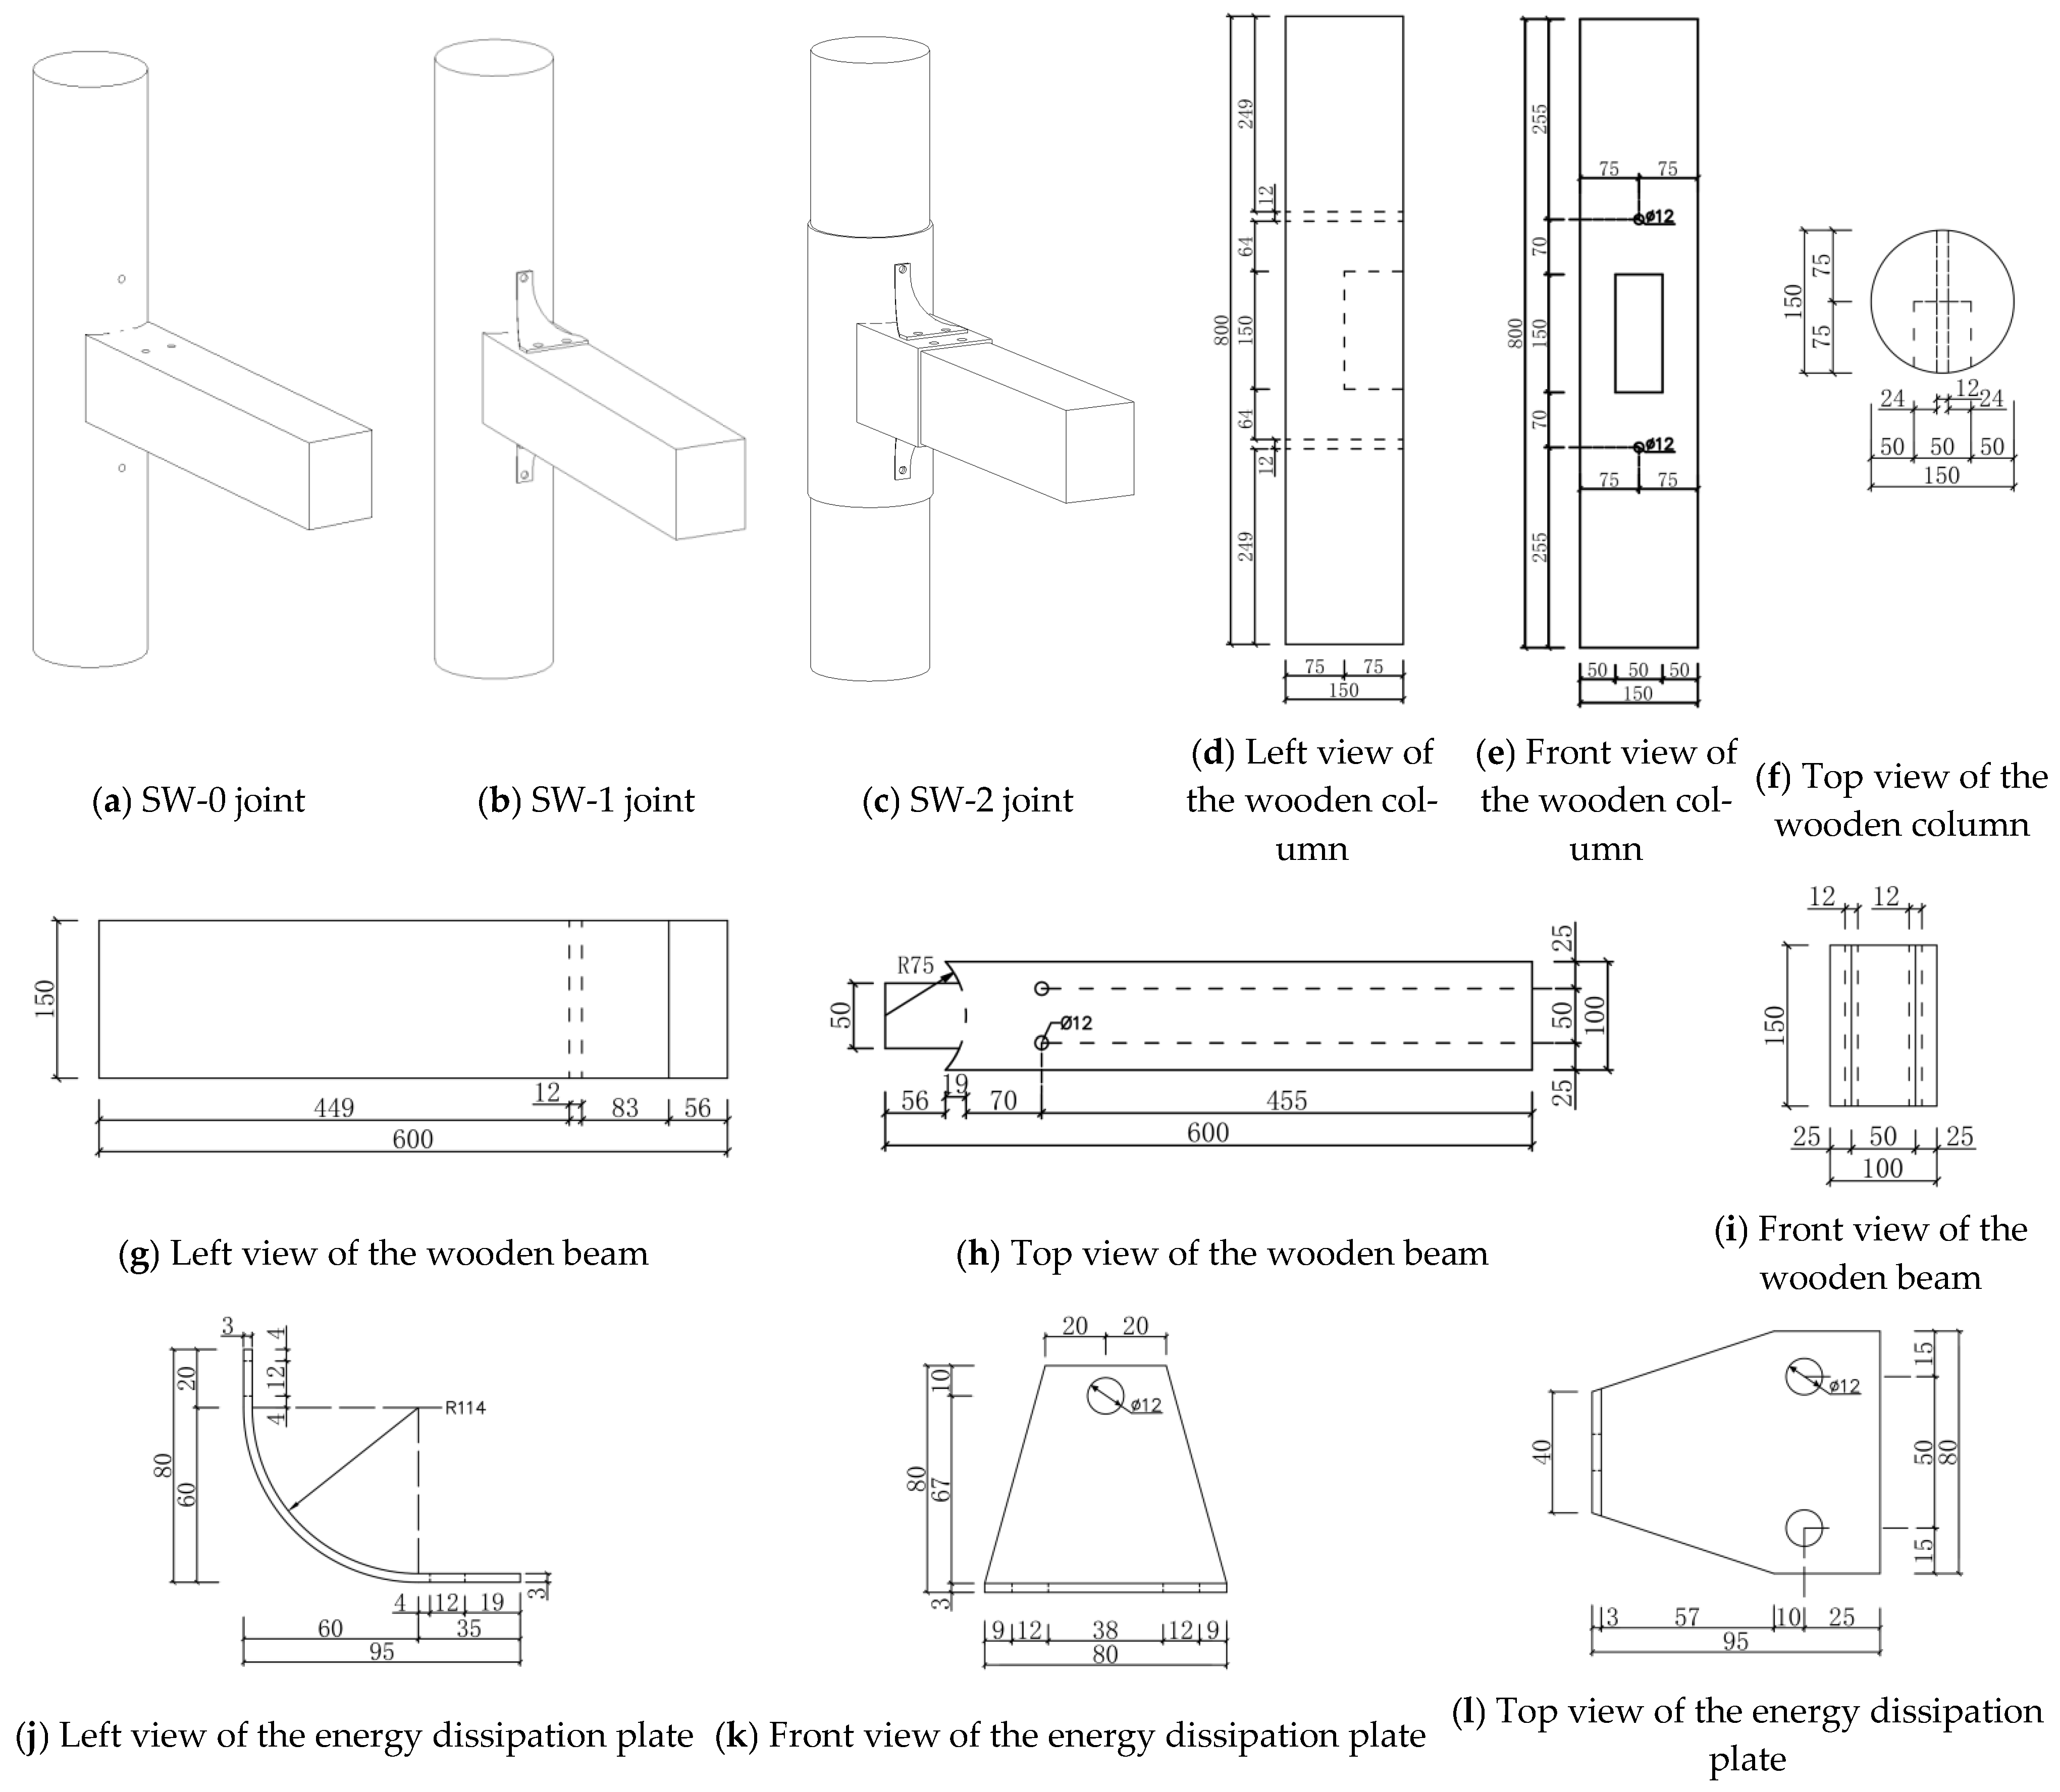
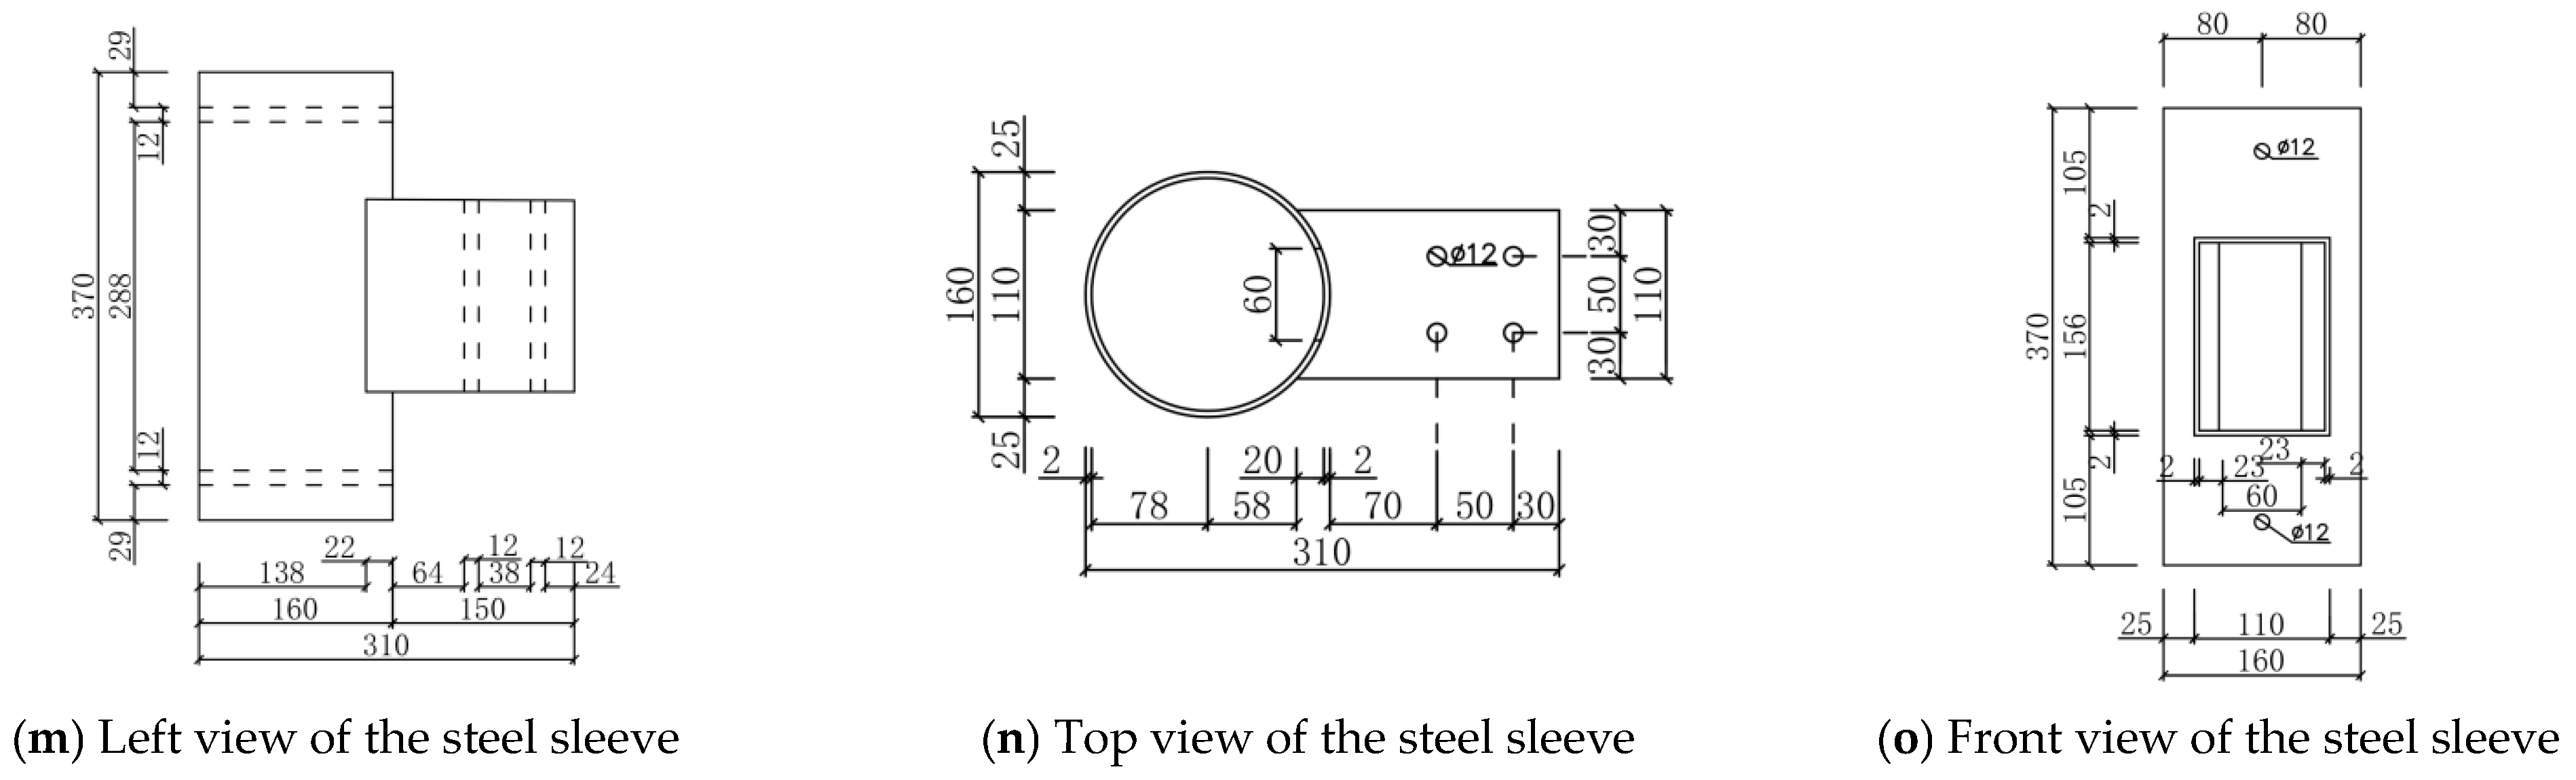
2.2. Design of the Test Joints
2.3. Fabrication and Assembly of the Joints
3. Monotonic Loading Test
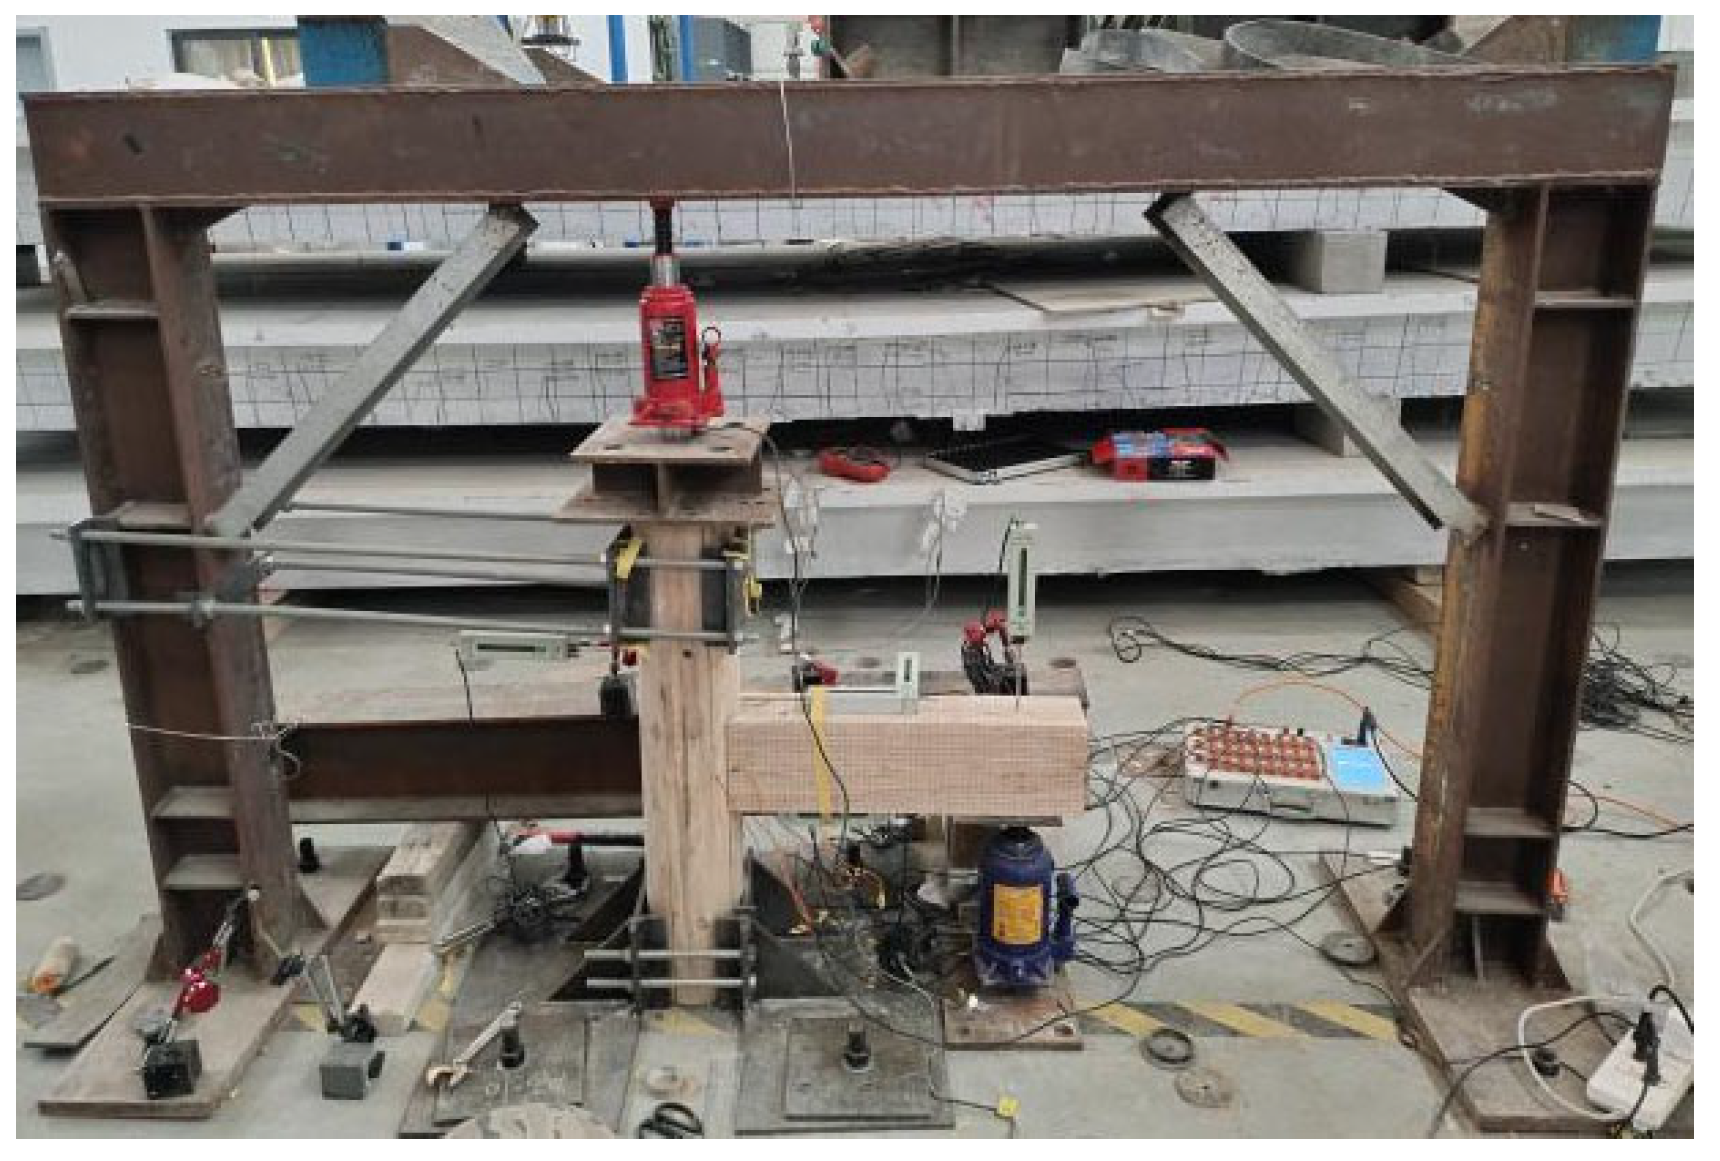
3.1. Experimental Loading Device
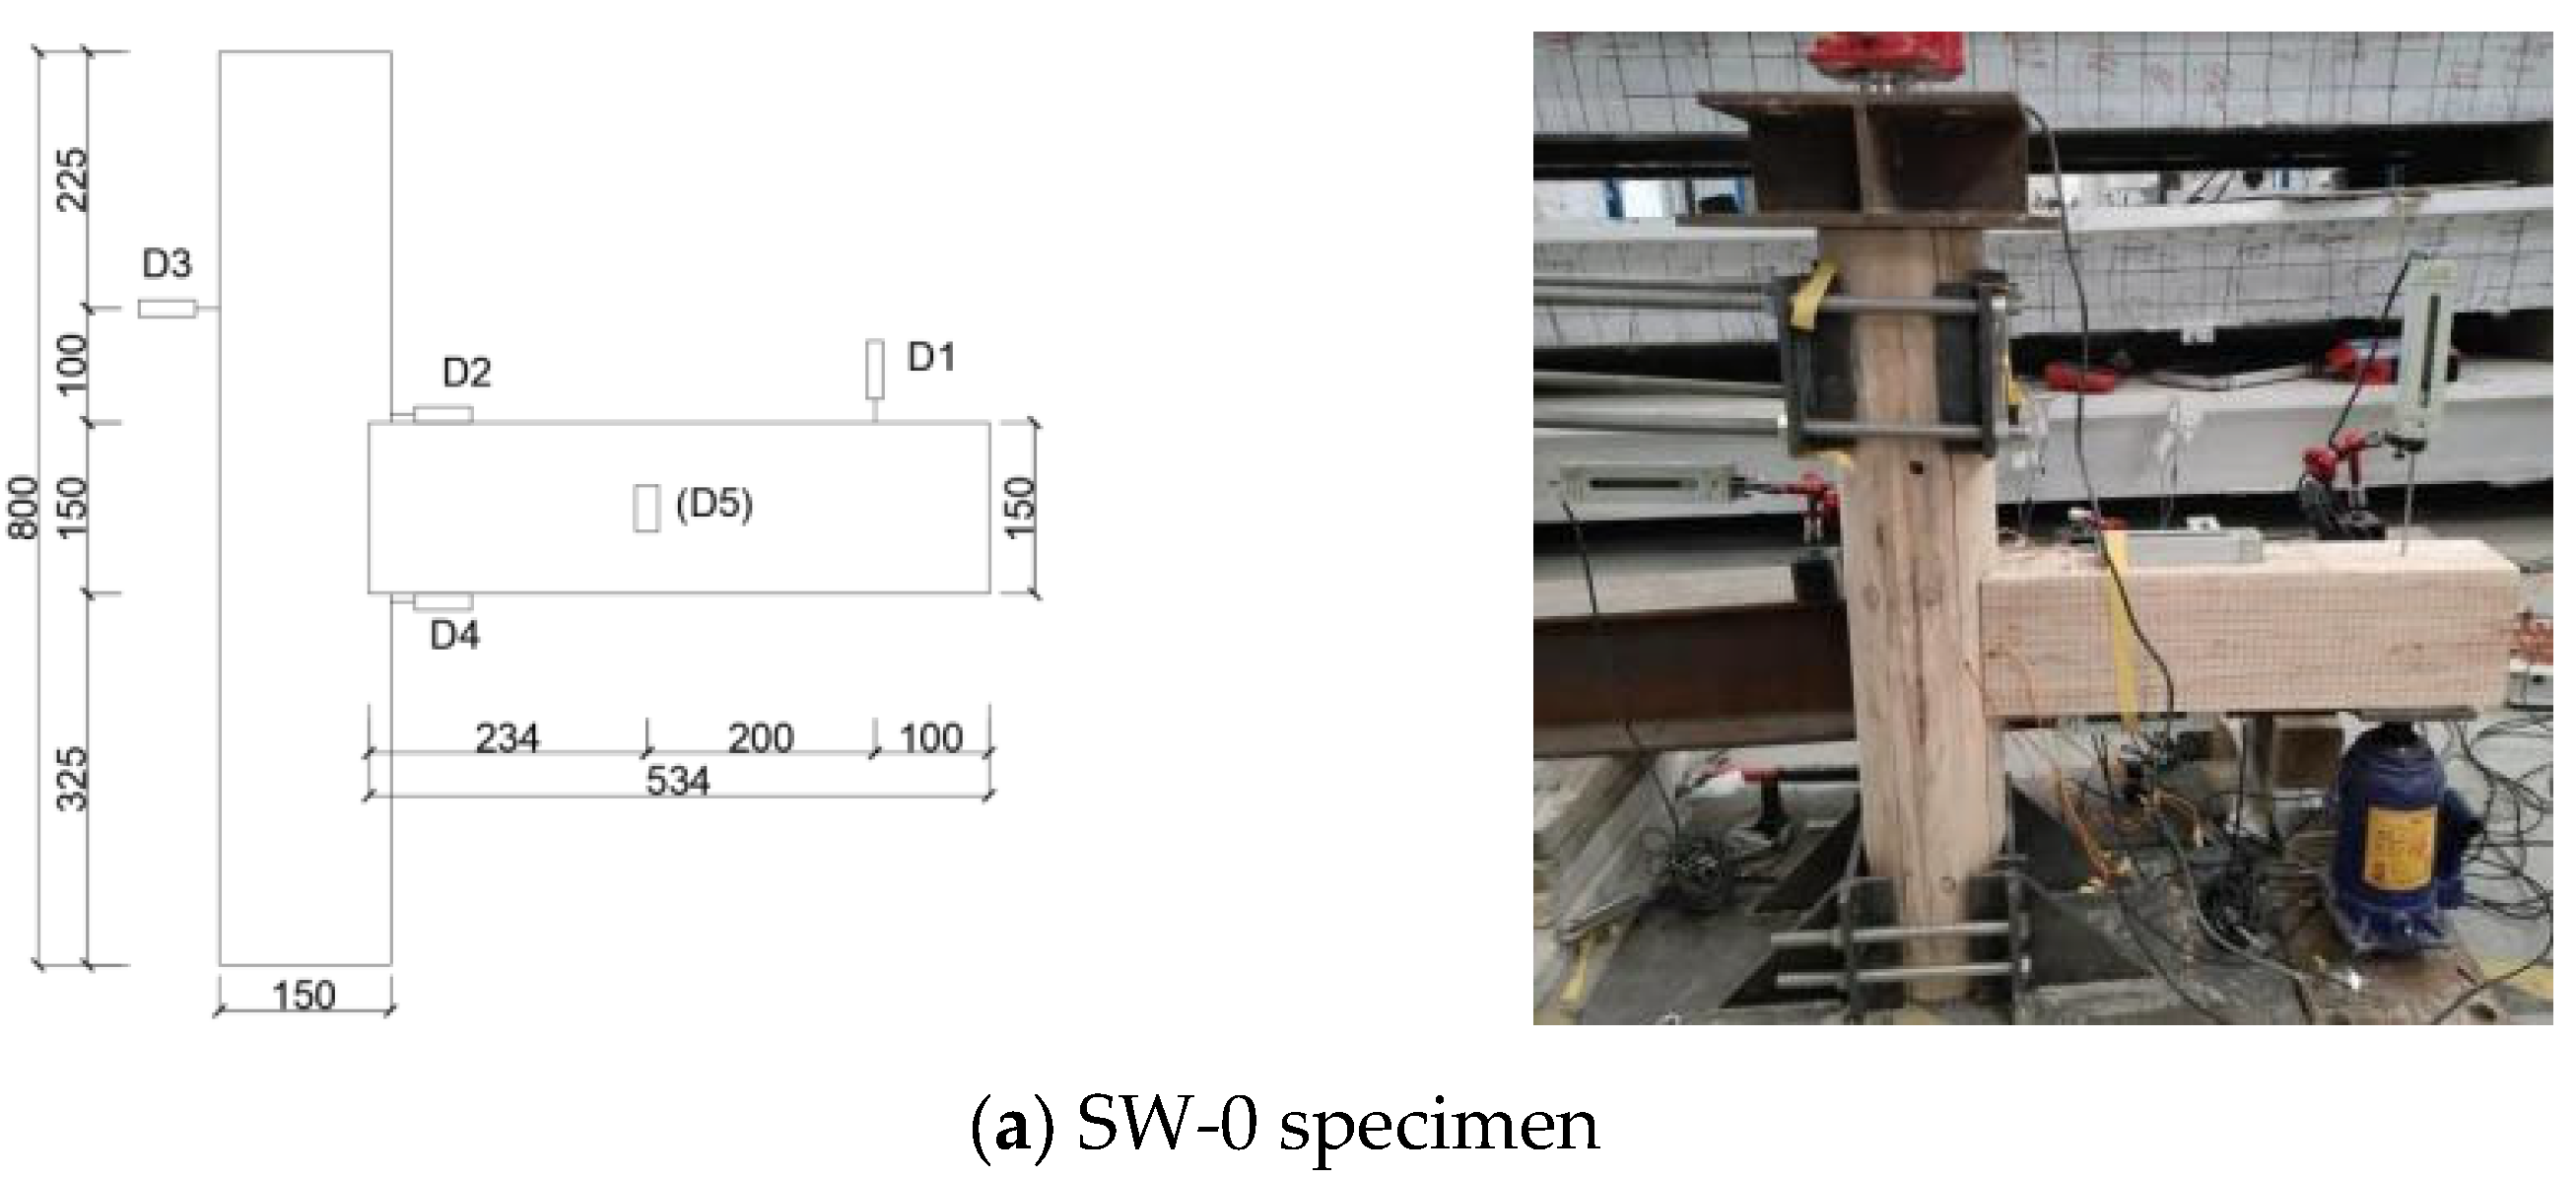
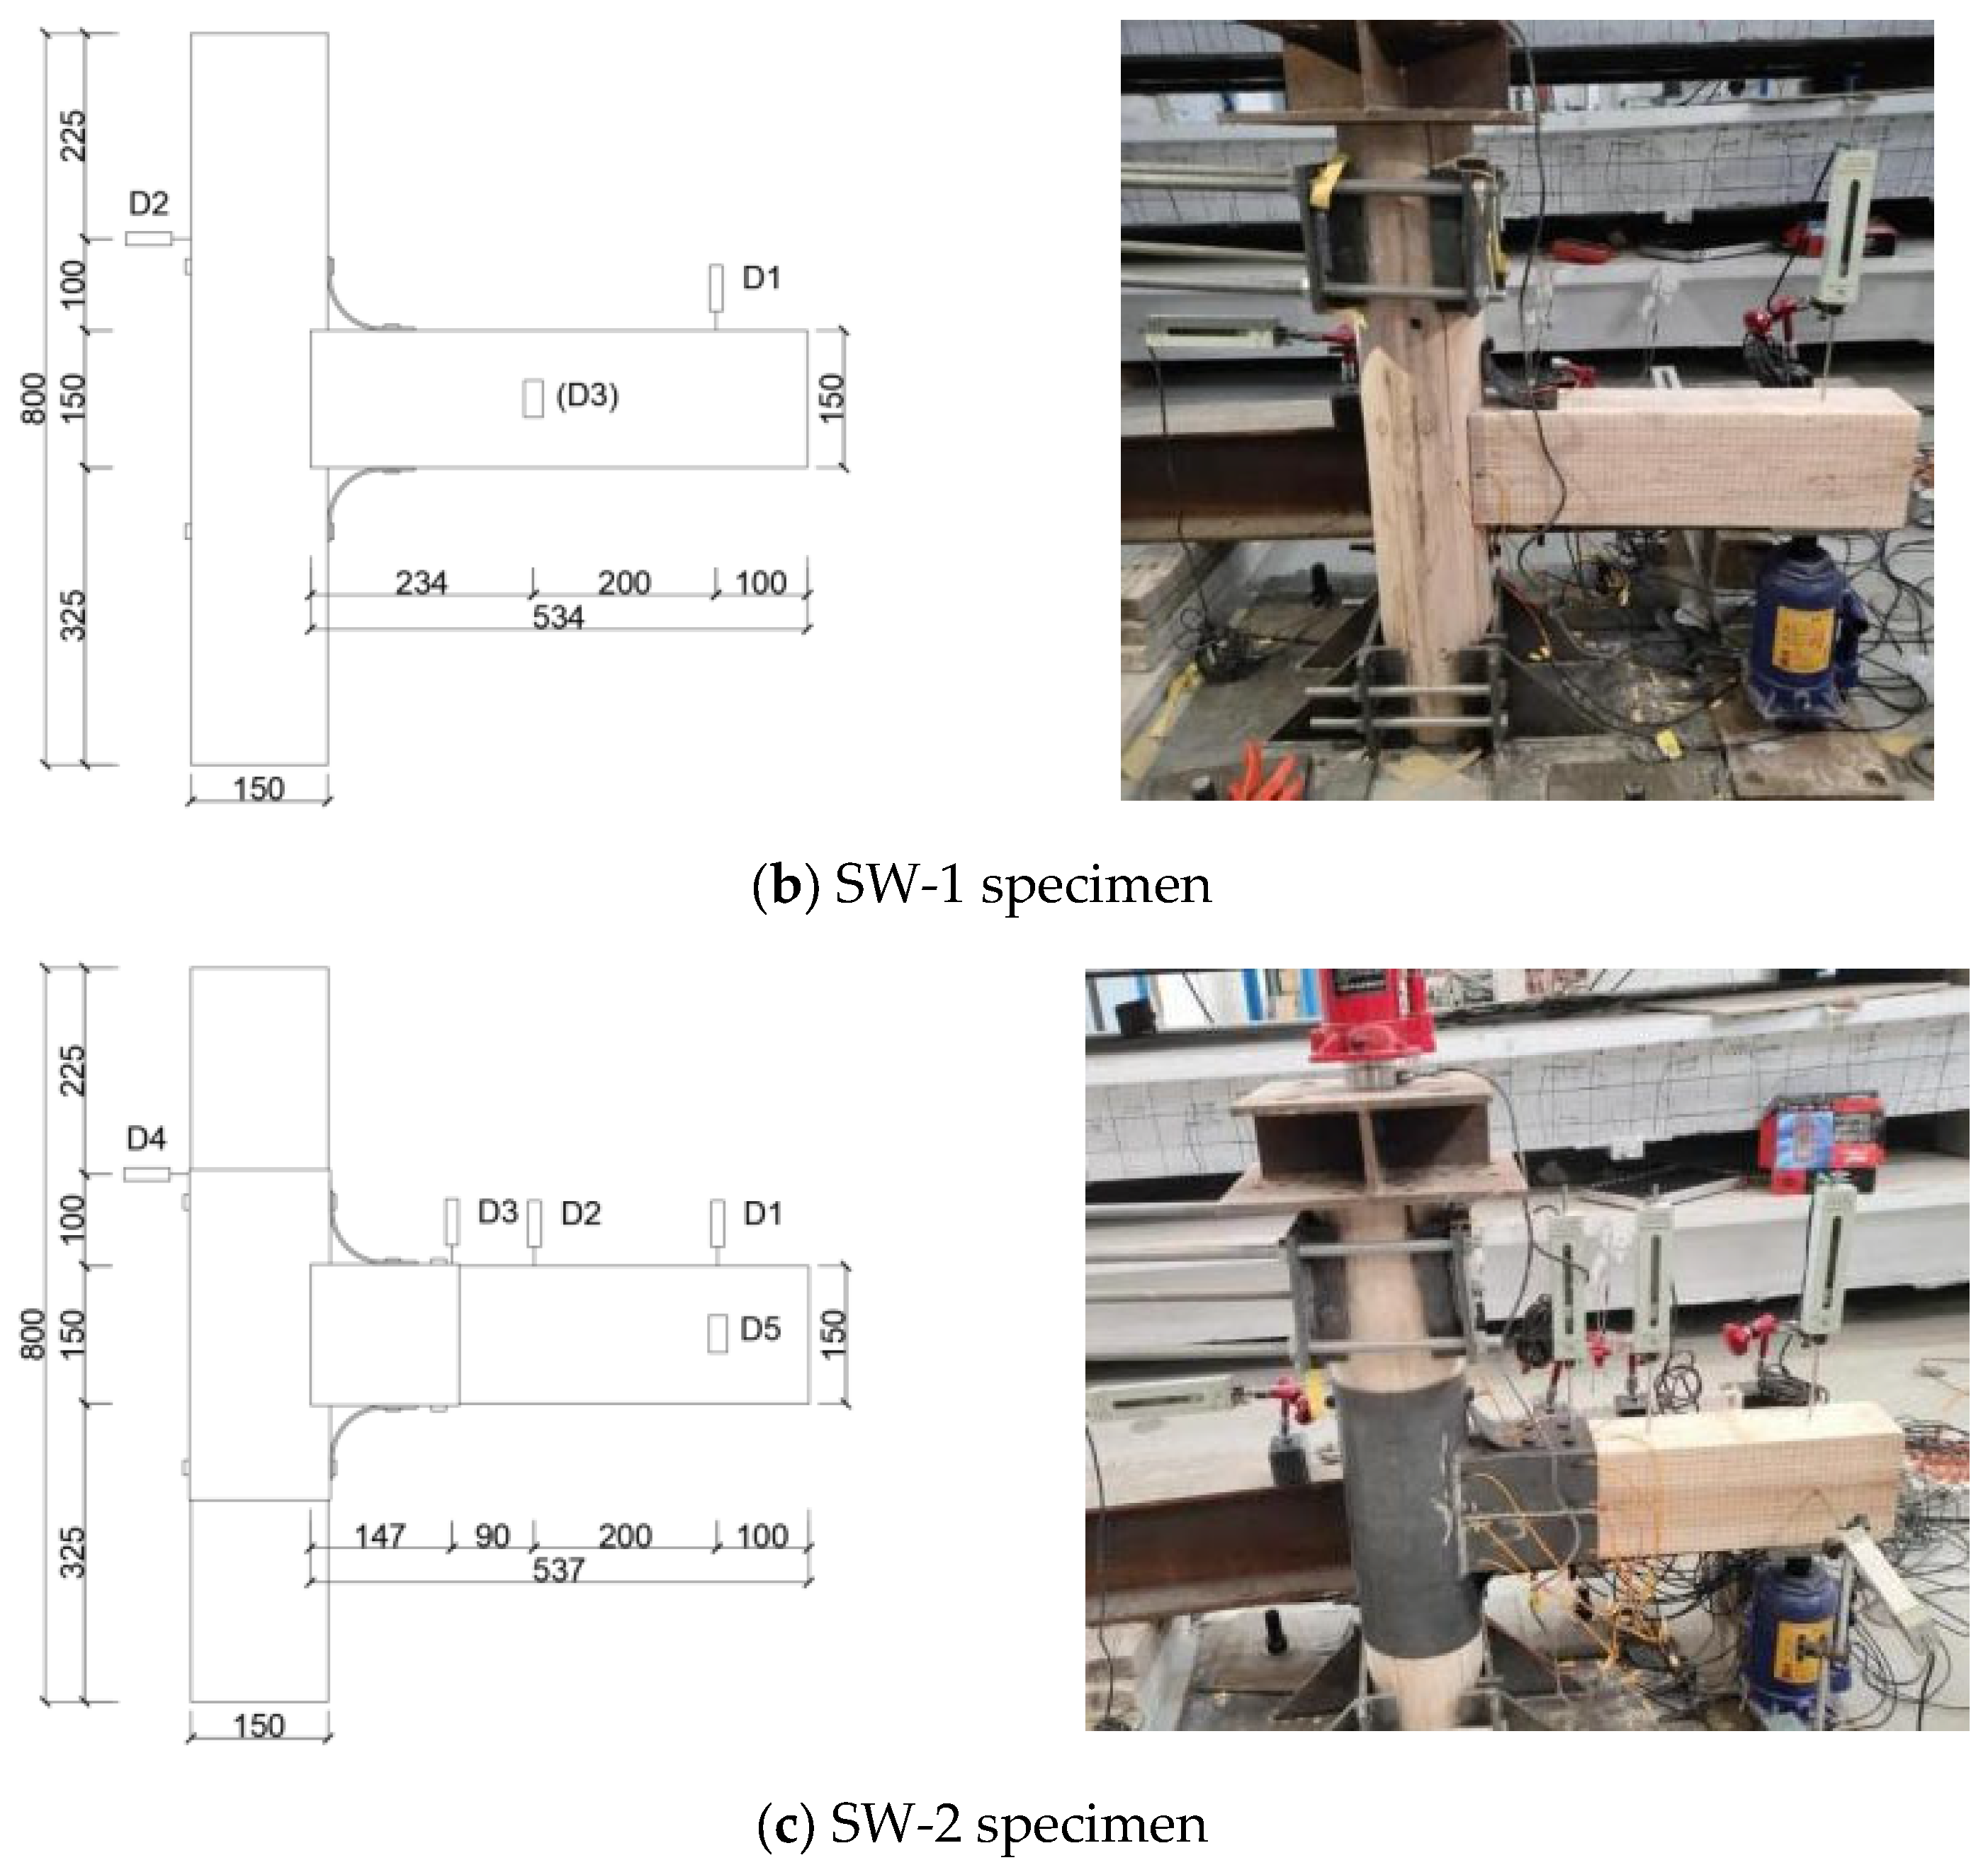
3.2. Displacement Gauge Layout
3.3. Loading Scheme
- (1)
- Pre-loading stage. The main purpose is to check whether the measuring equipment employed in the experiment is working properly and to eliminate any potential imperfect contacts between the components of the joint specimen. The preload value of the SW-0 specimen is applied at 5% of the estimated ultimate load, whereas the SW-1 and SW-2 joints are installed at 10% of the estimated ultimate load.
- (2)
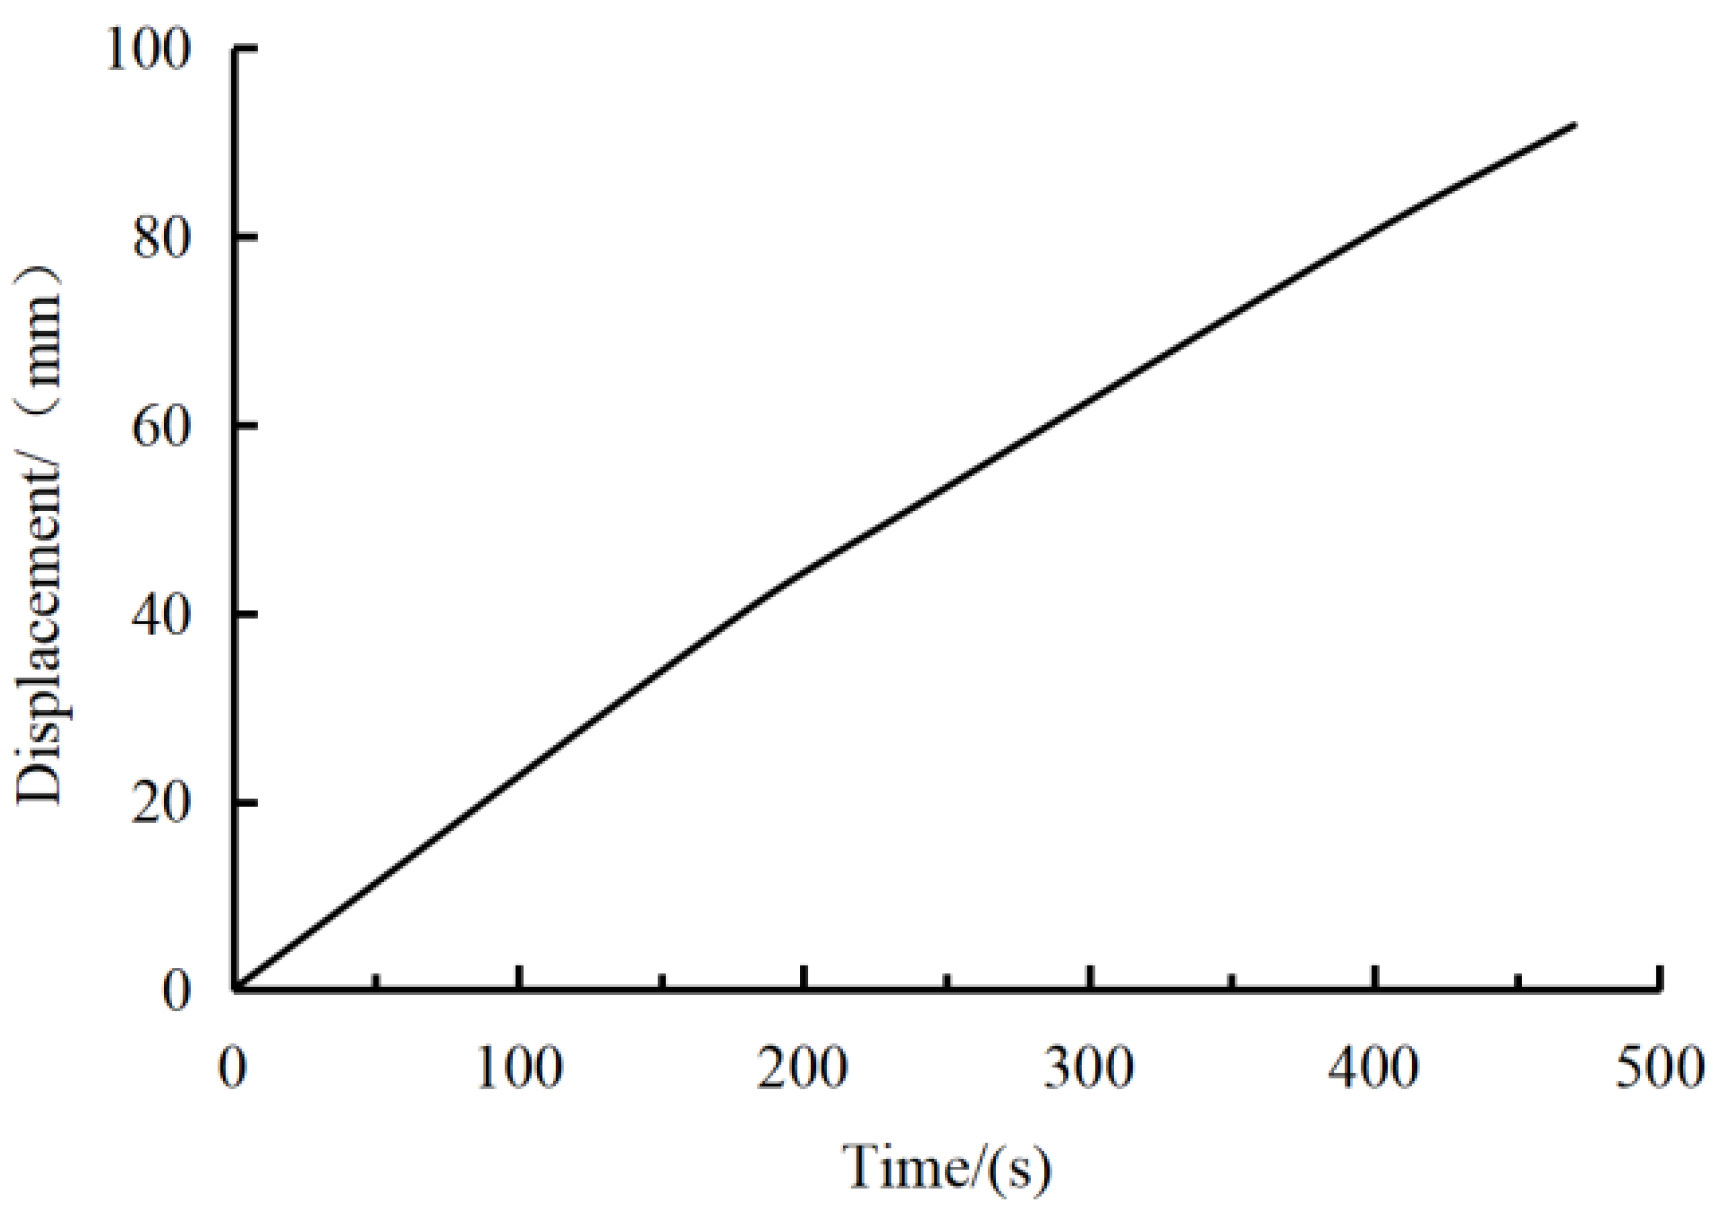
- Normal loading stage. This stage is divided into two steps for load application. First, a 25 kN axial load is applied at the top of the column. Second, a displacement-controlled loading method is used at the beam end to apply the load. The initial displacement amplitude is 5 mm with each subsequent level increasing by 5 mm as the controlled displacement until the specimen fails, and the loading scheme is illustrated in Figure 5.
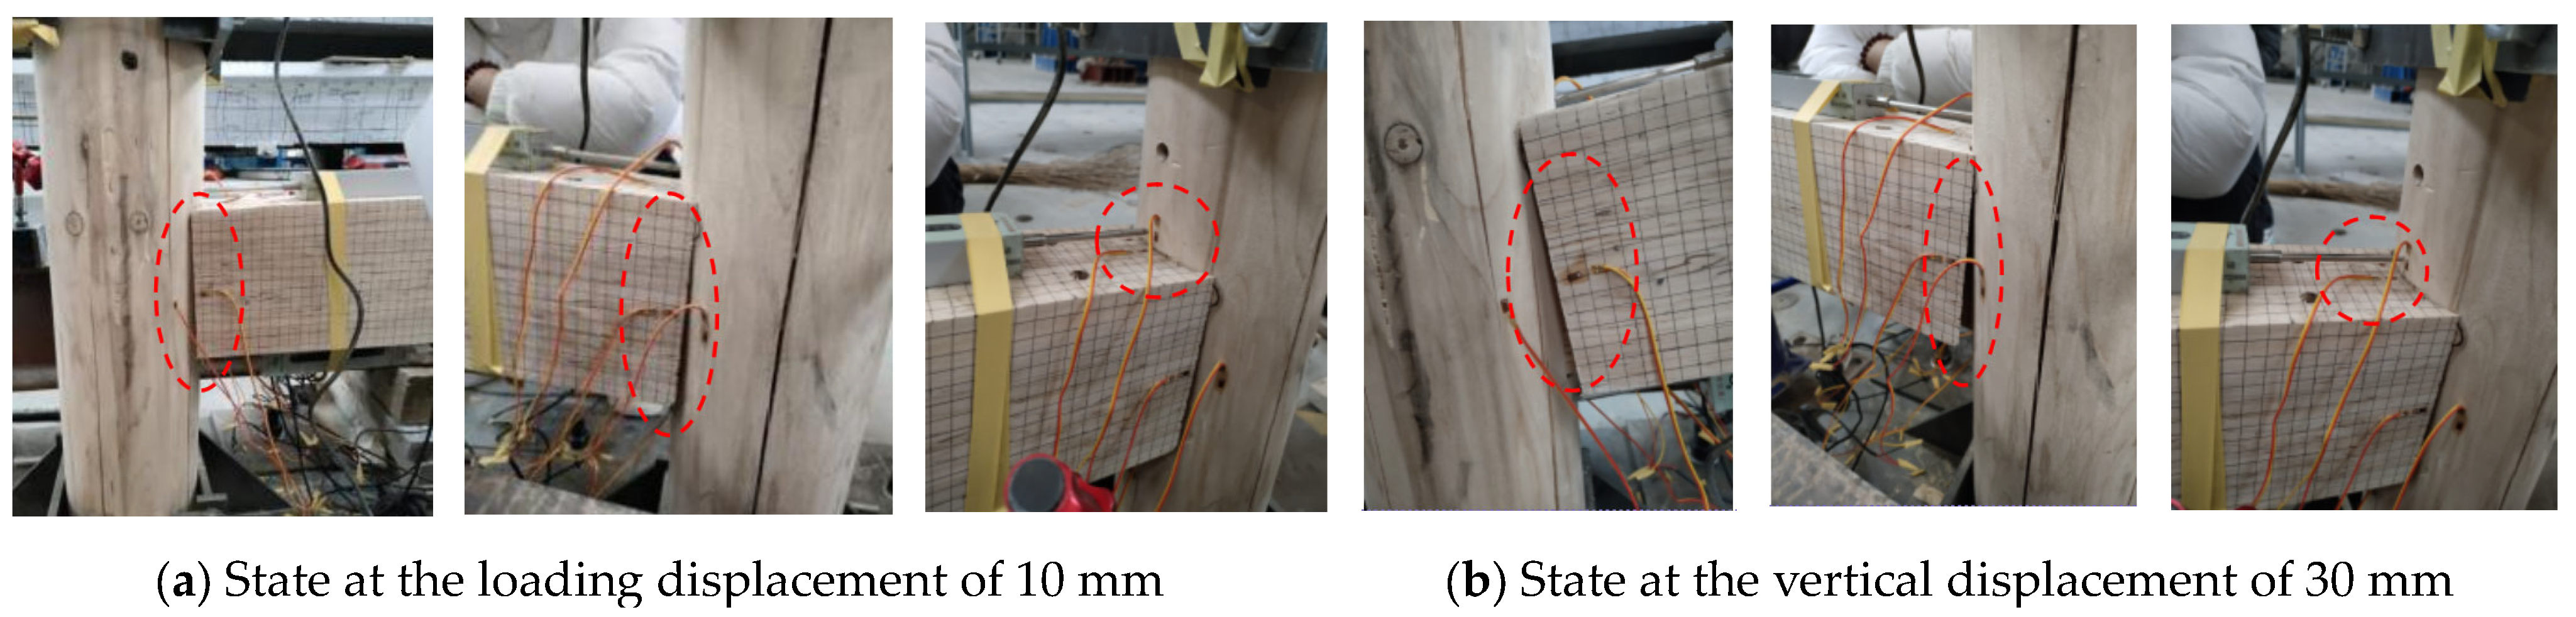
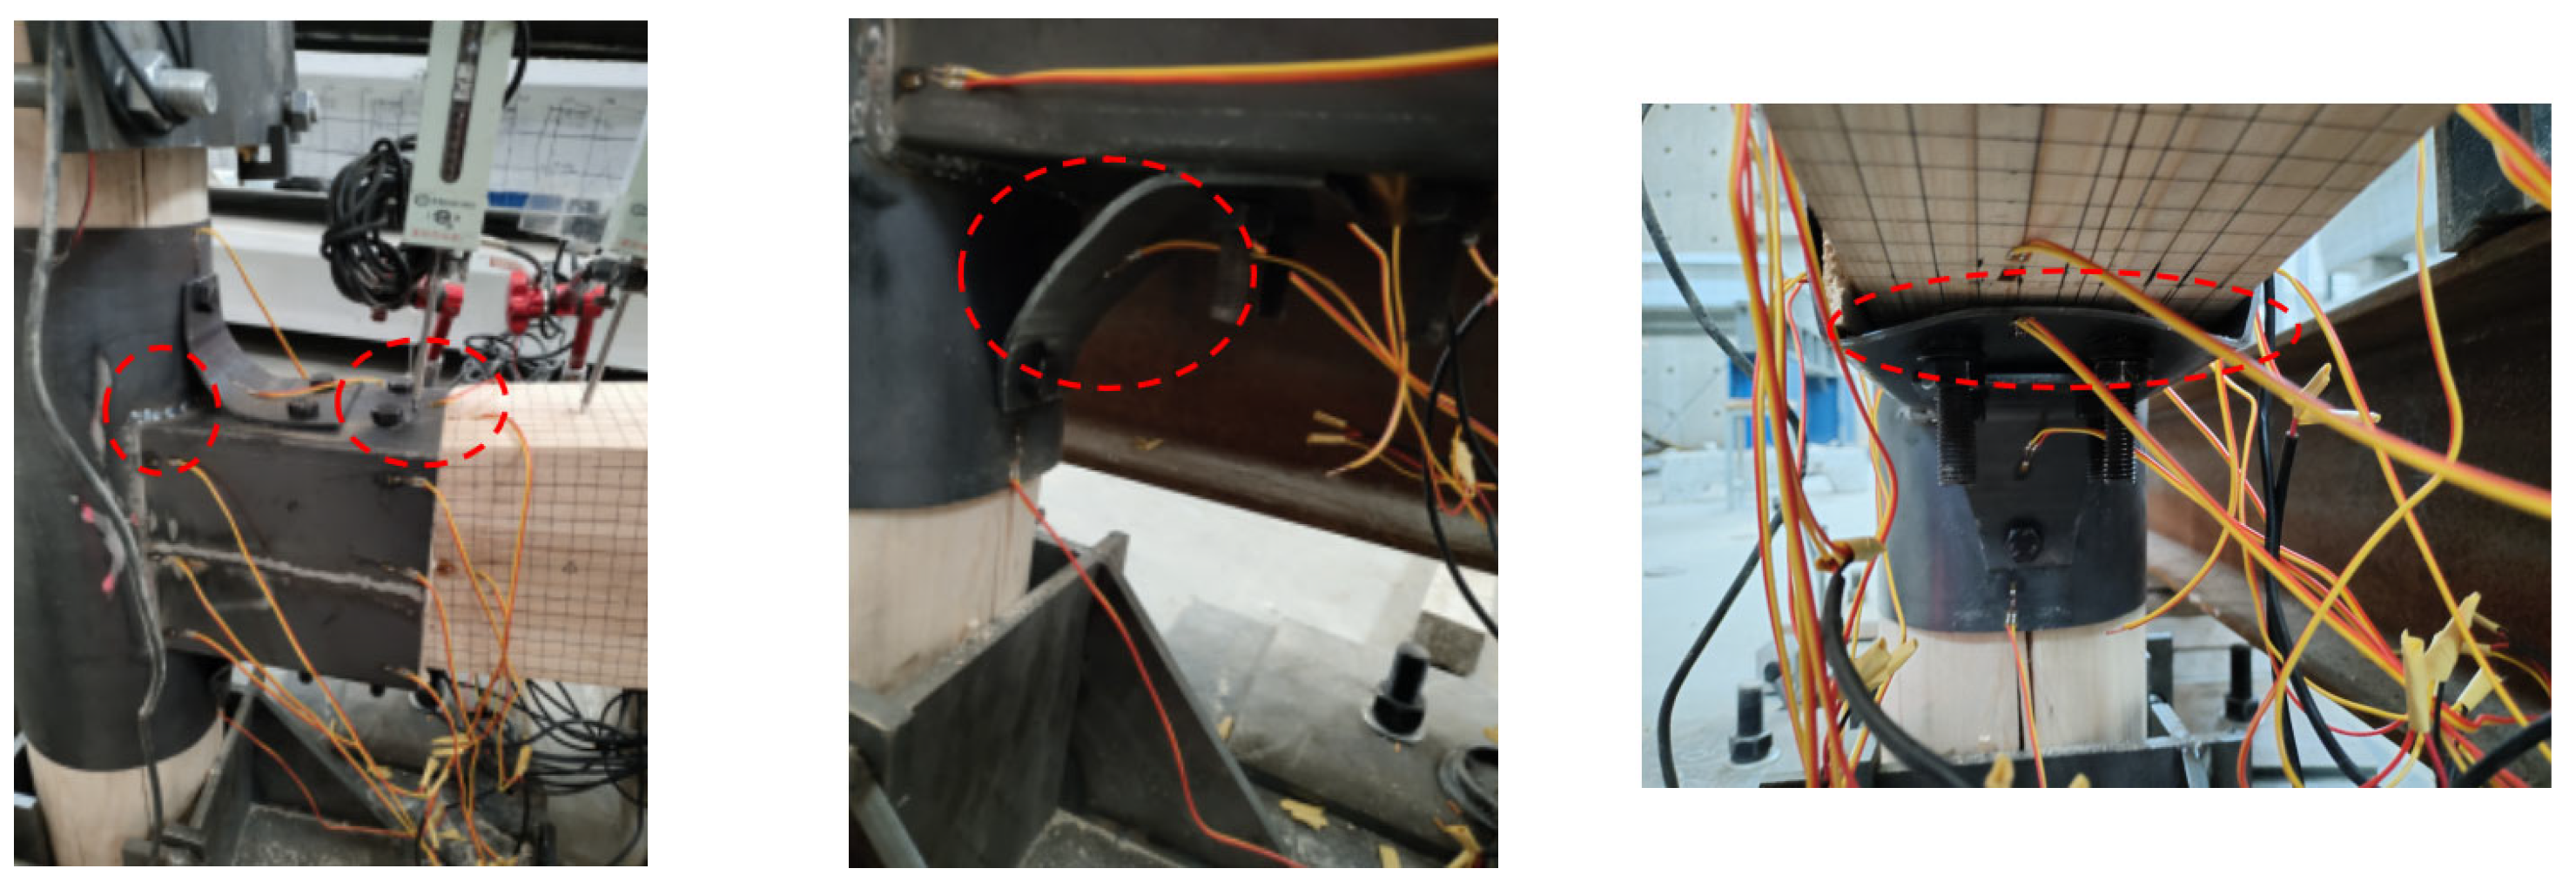
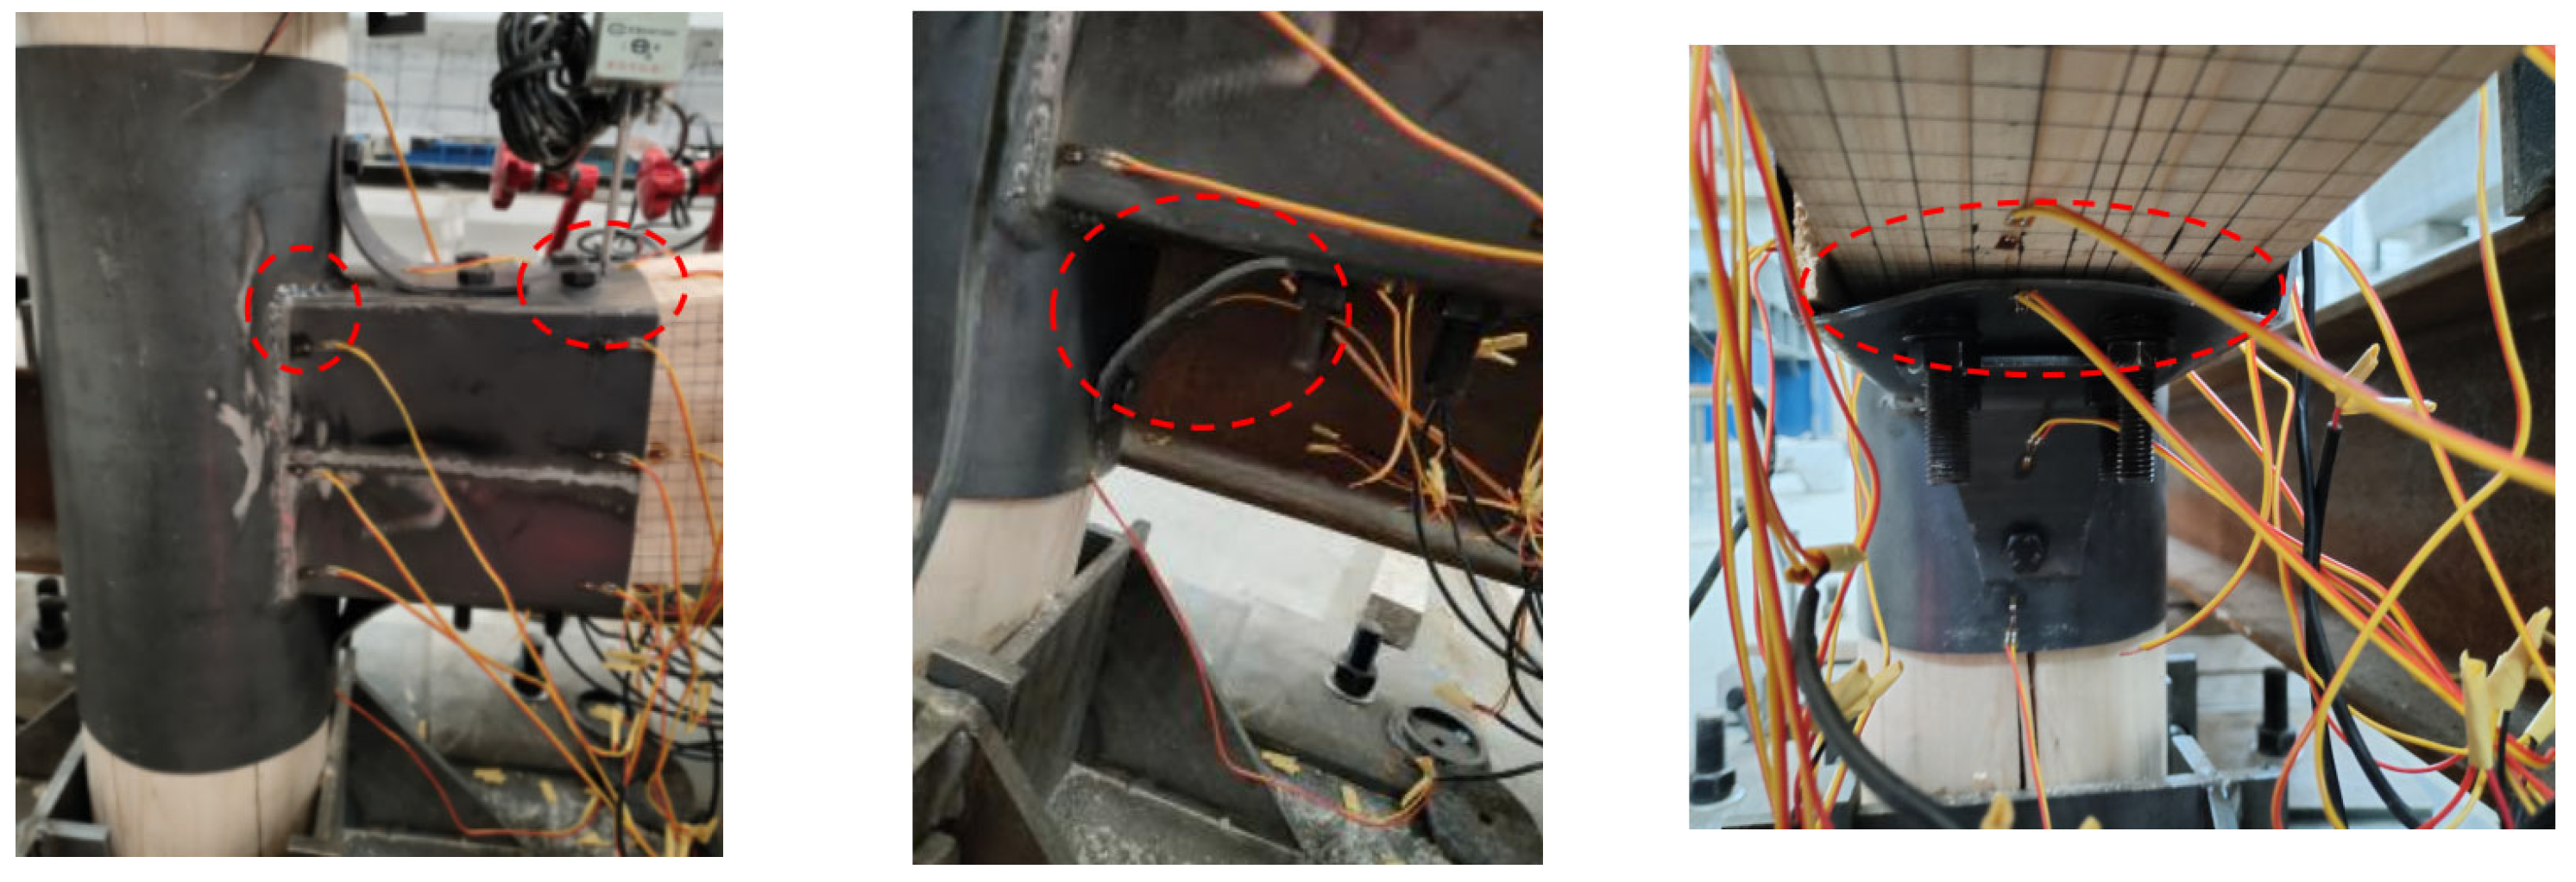
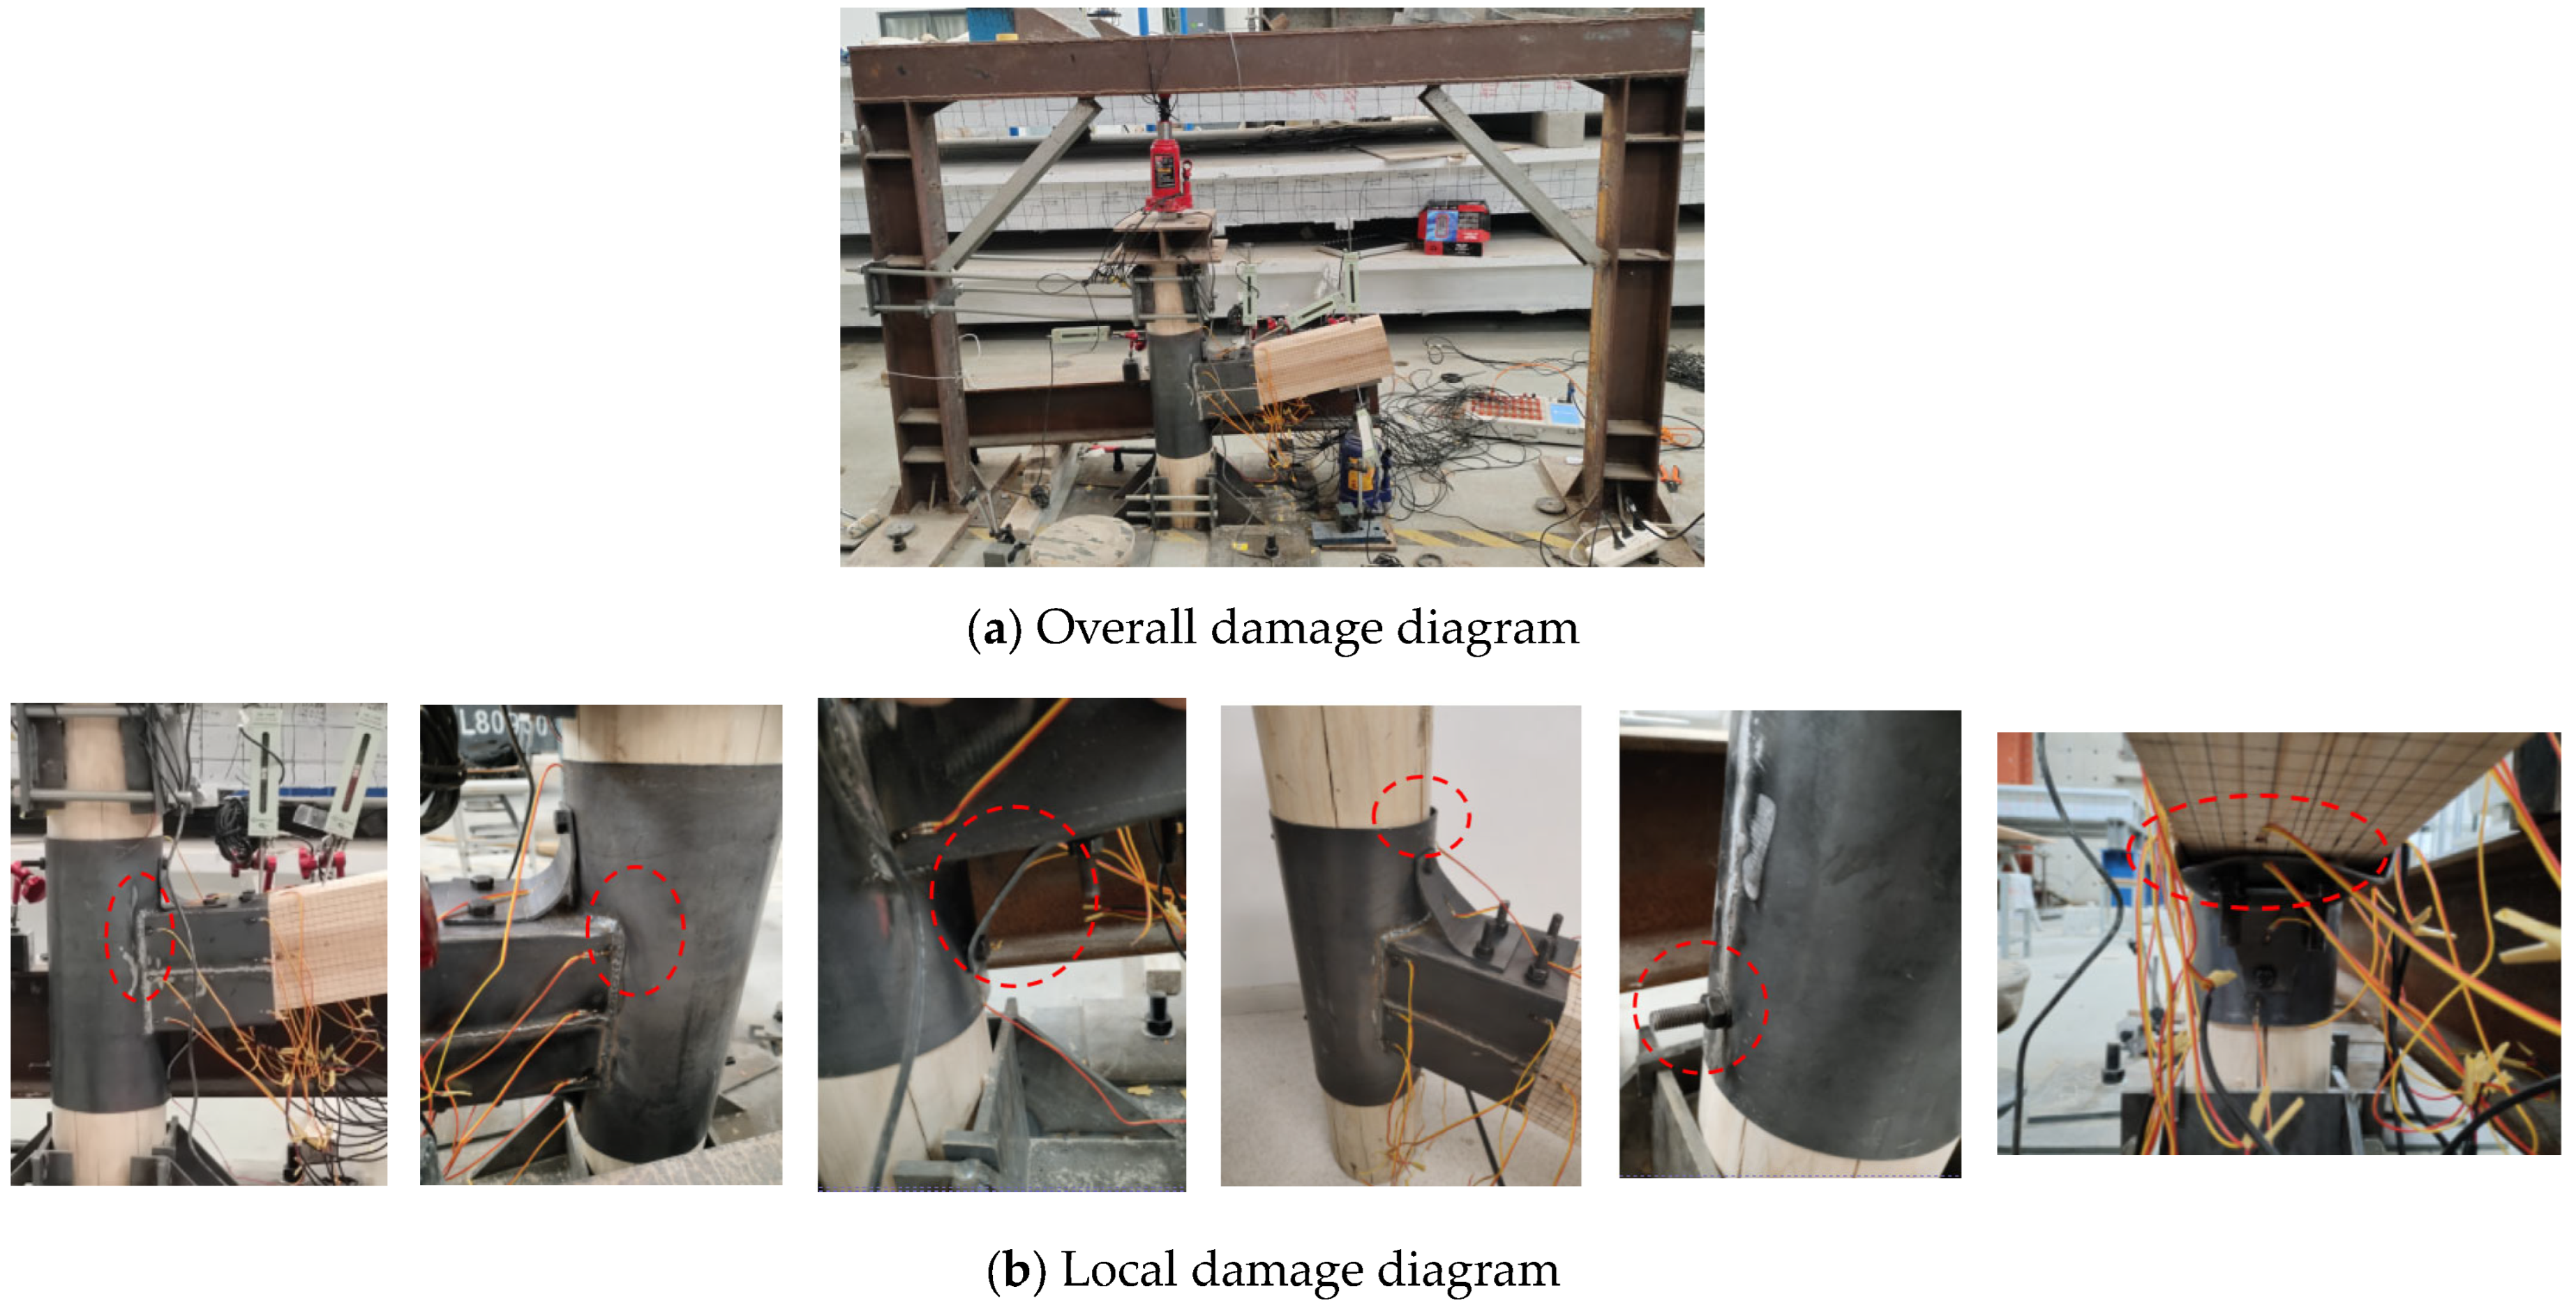
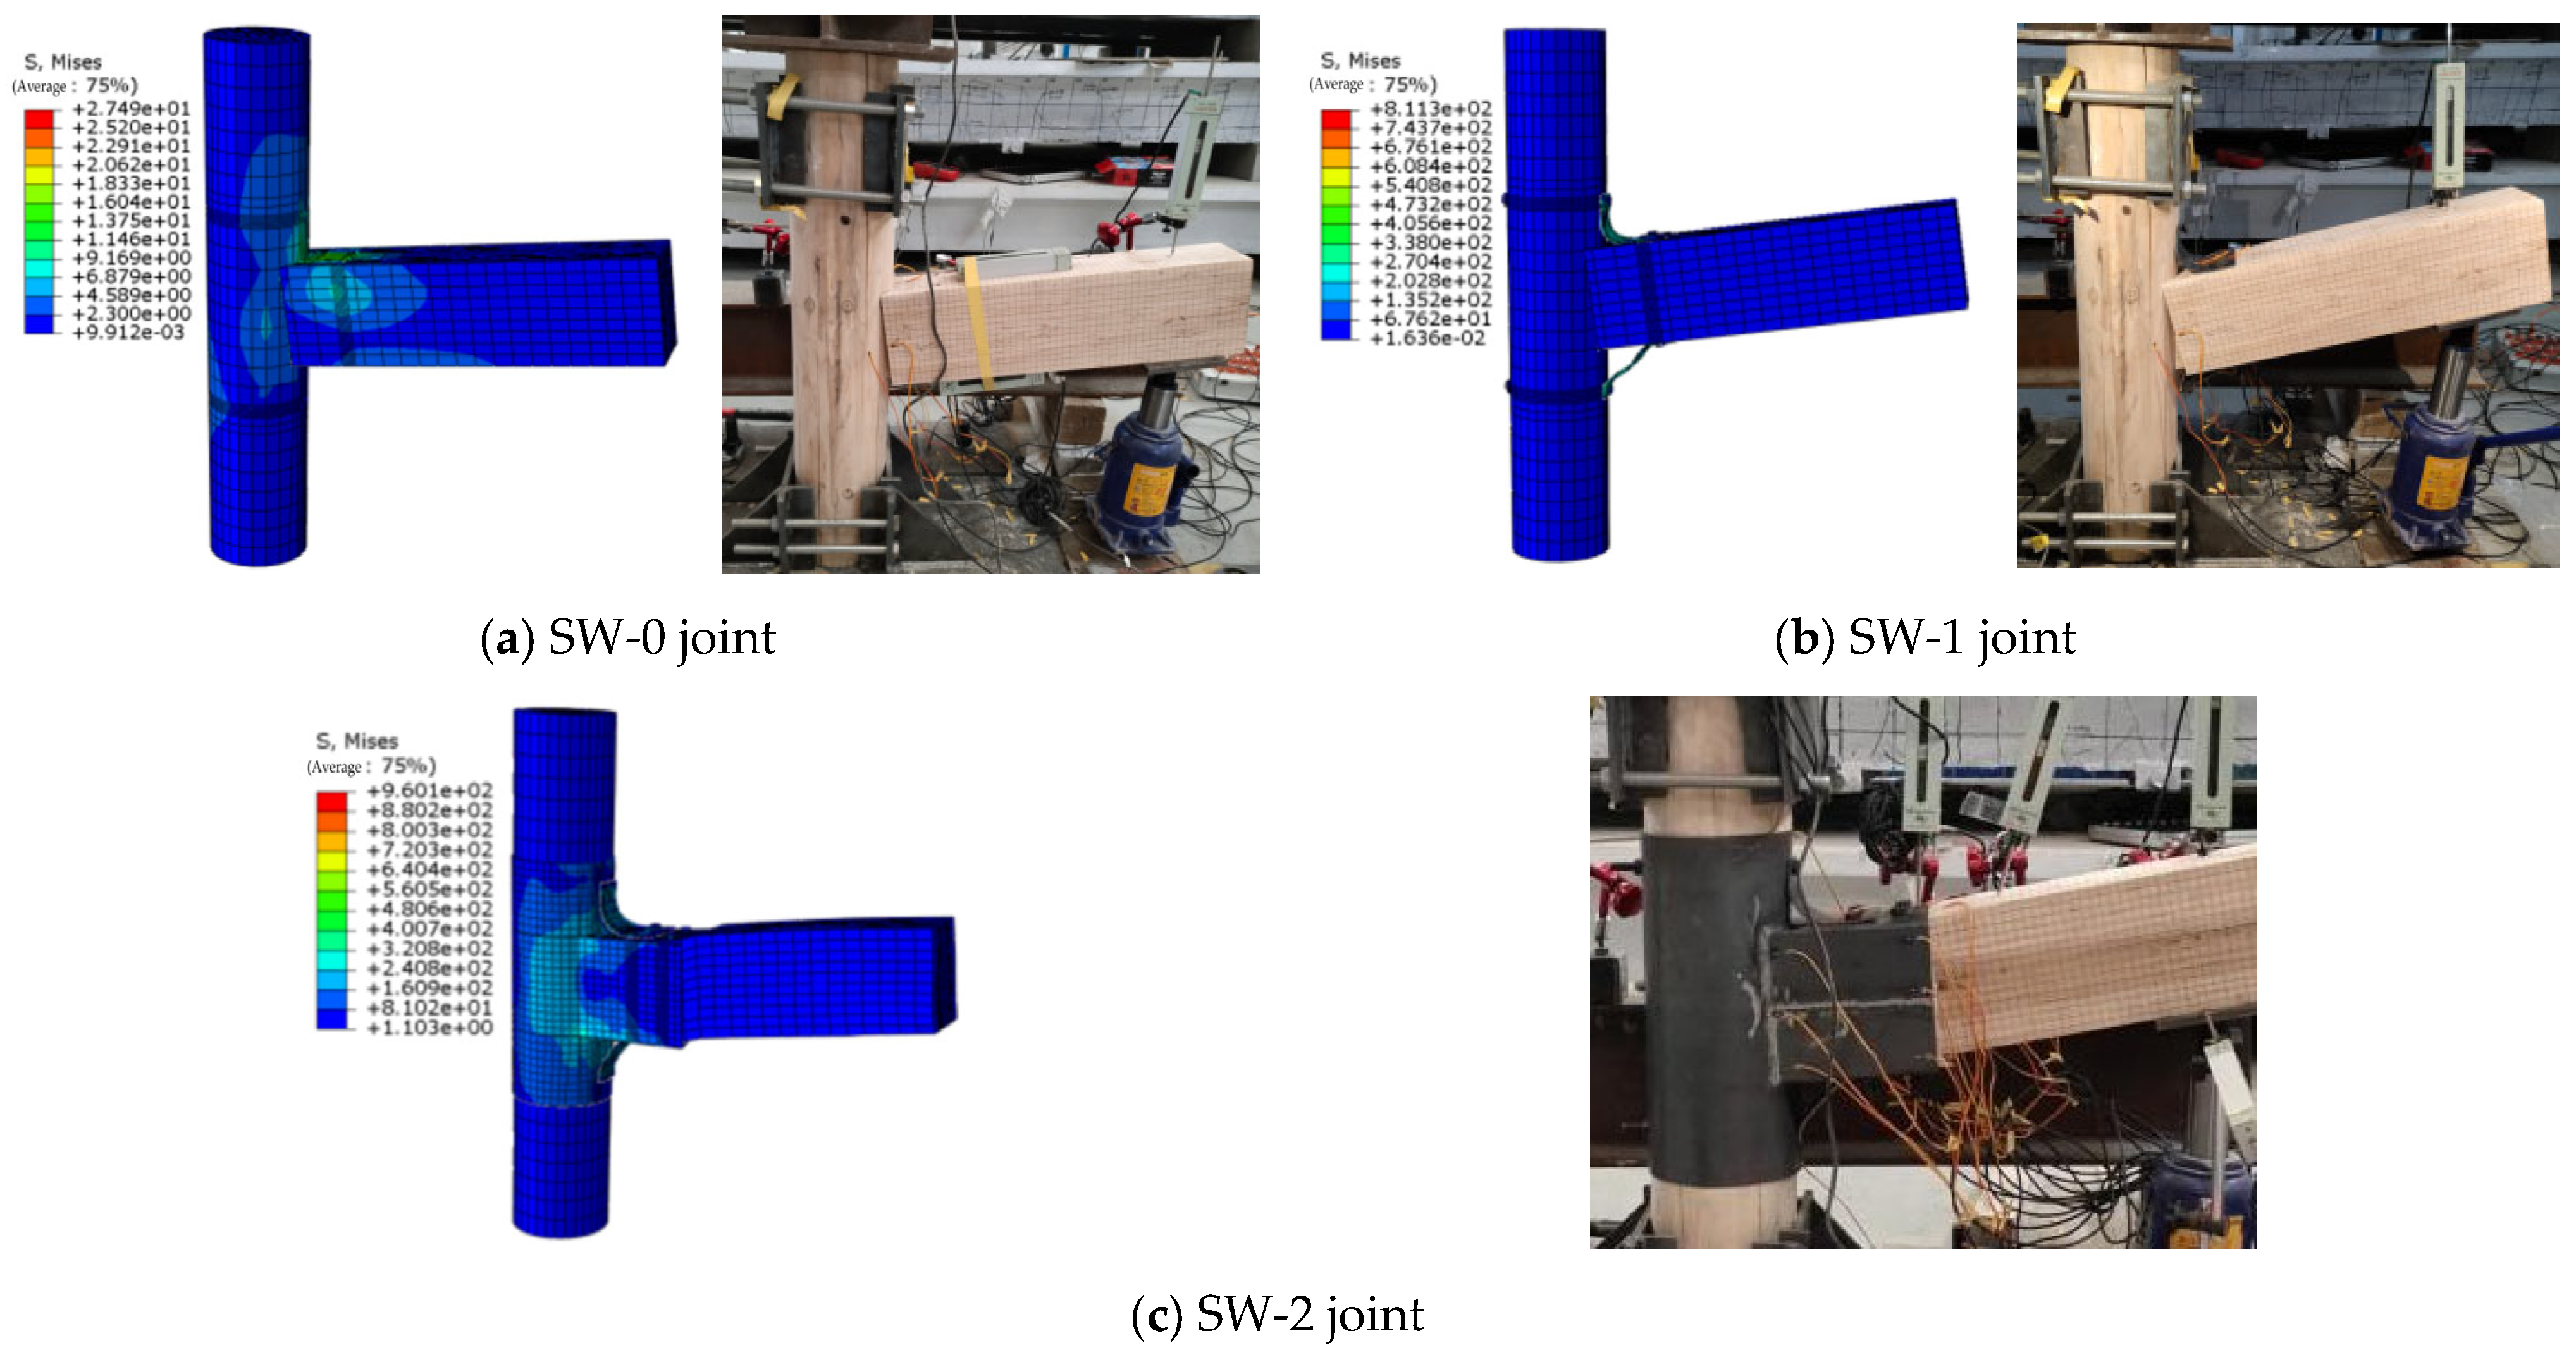
3.4. Analysis of Joint Failure Modes
- (1)
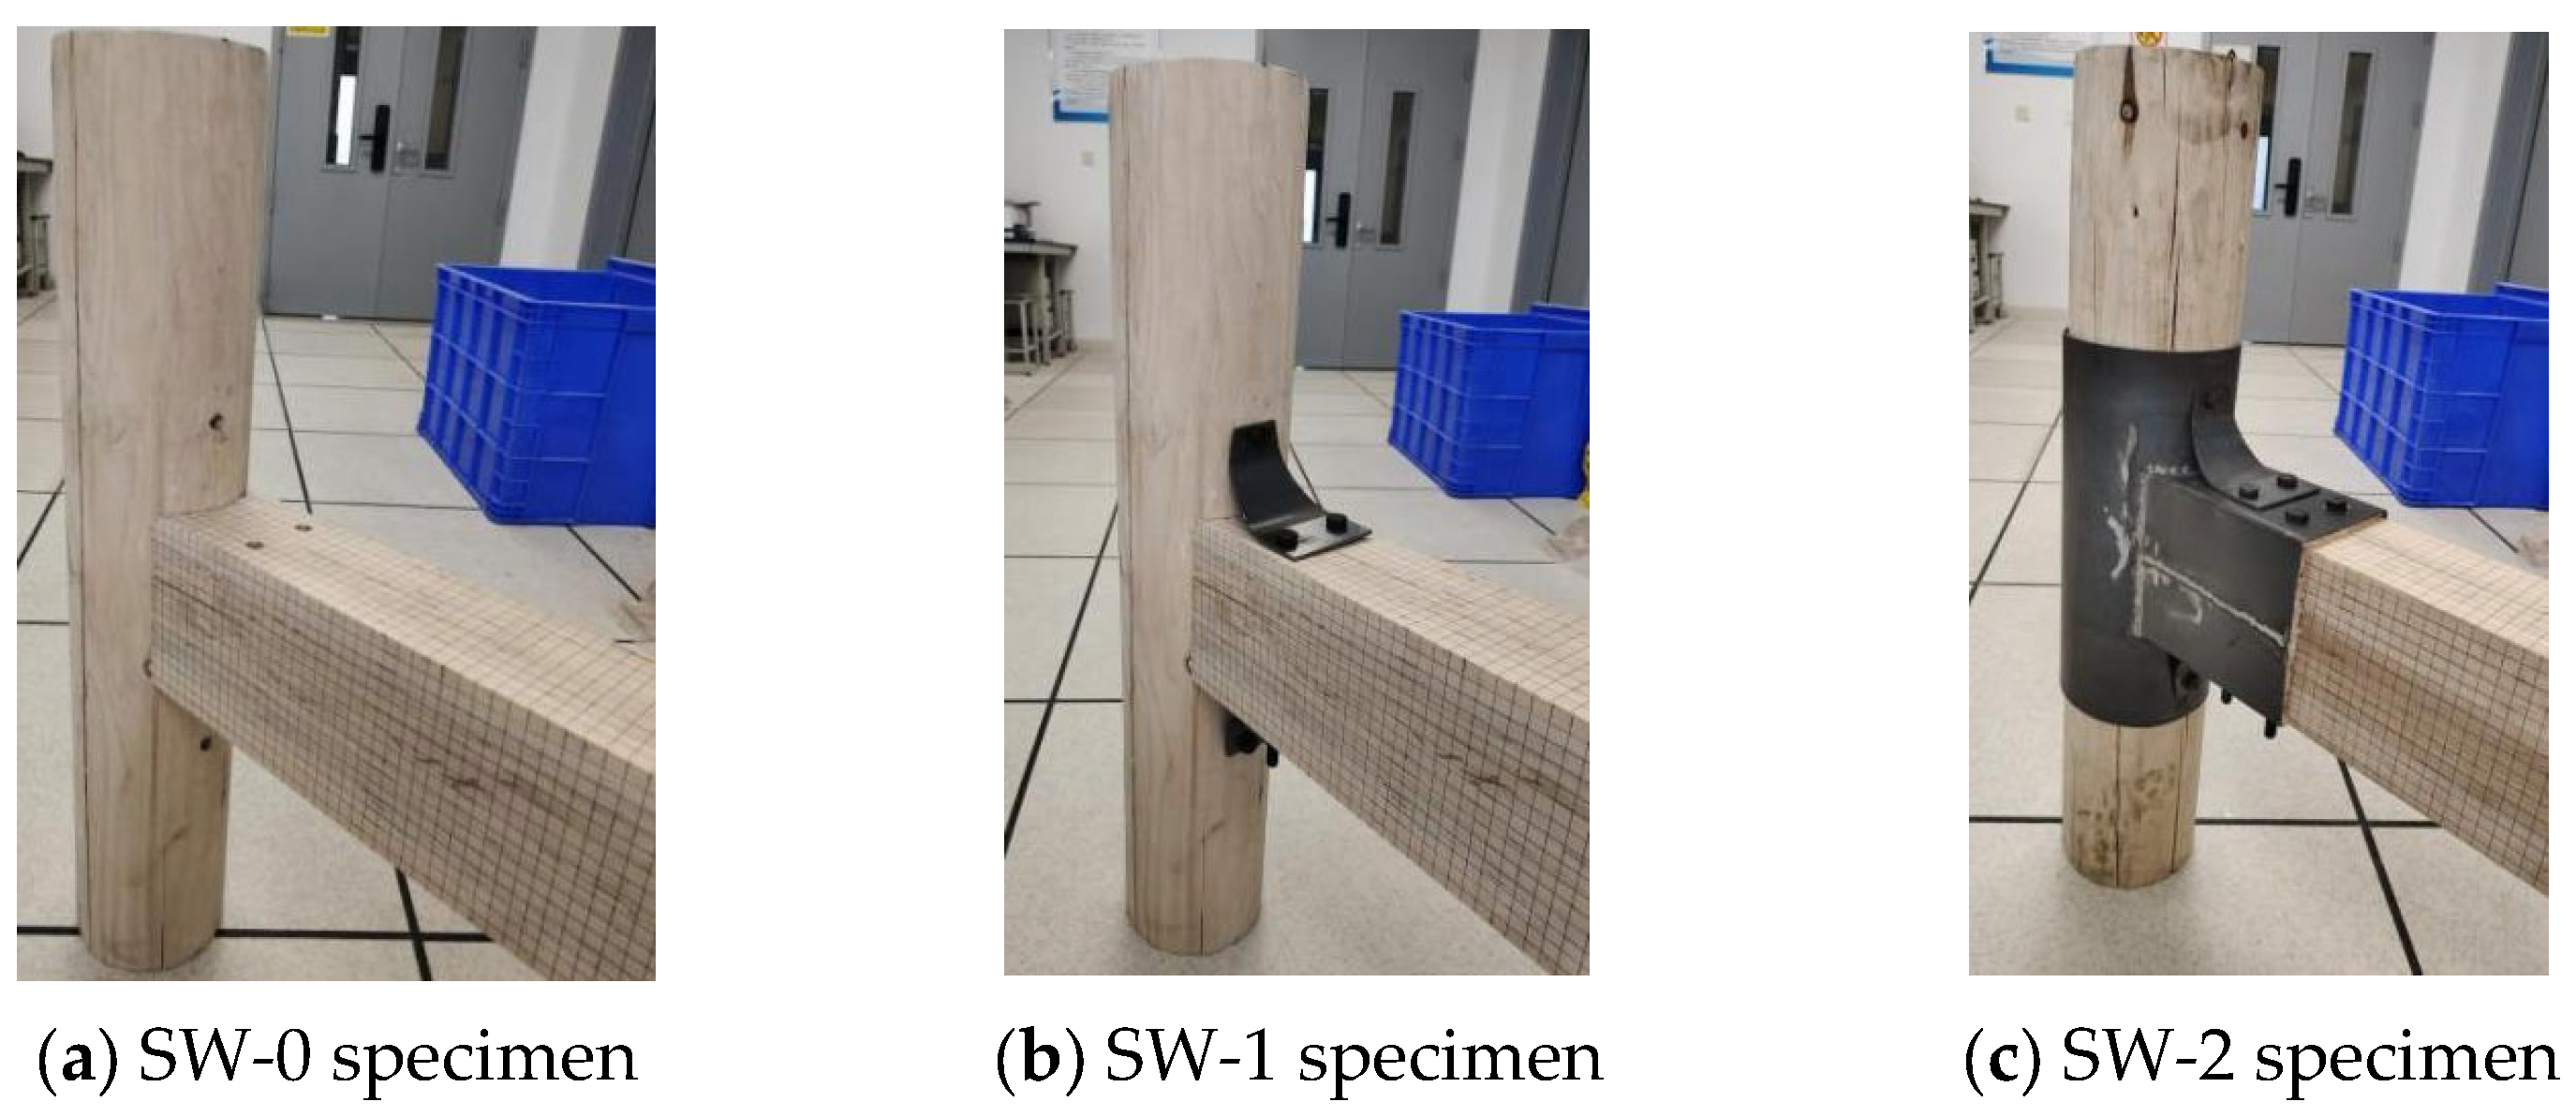
- SW-0 specimen
- (2)
- SW-1 specimen
- (3)
- SW-2 specimen
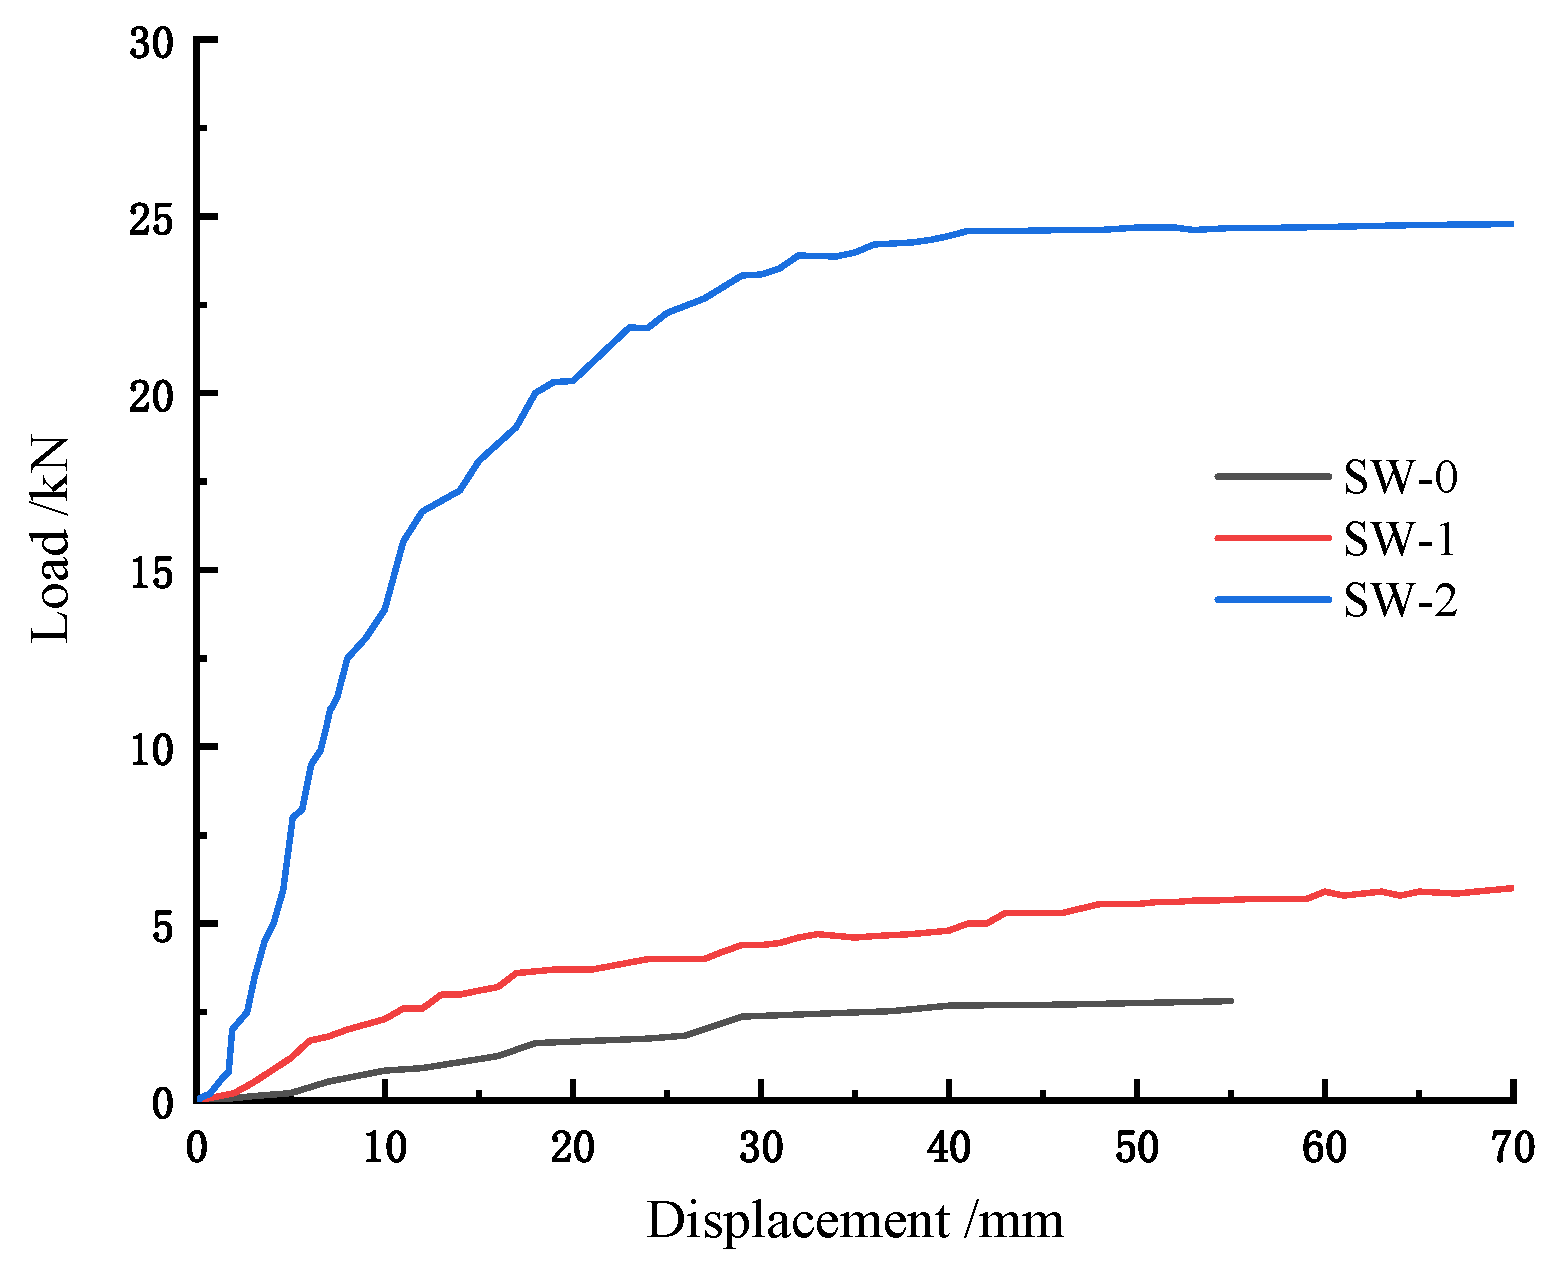
3.5. Load–Displacement Curve
4. Finite Element Numerical Simulation
4.1. Modeling Process
4.2. Constitutive Relation of Material
- (1)
- Material property of wood during the elastic stage
- (2)
- Yield strength value of Chinese fir during the plastic stage
- (3)
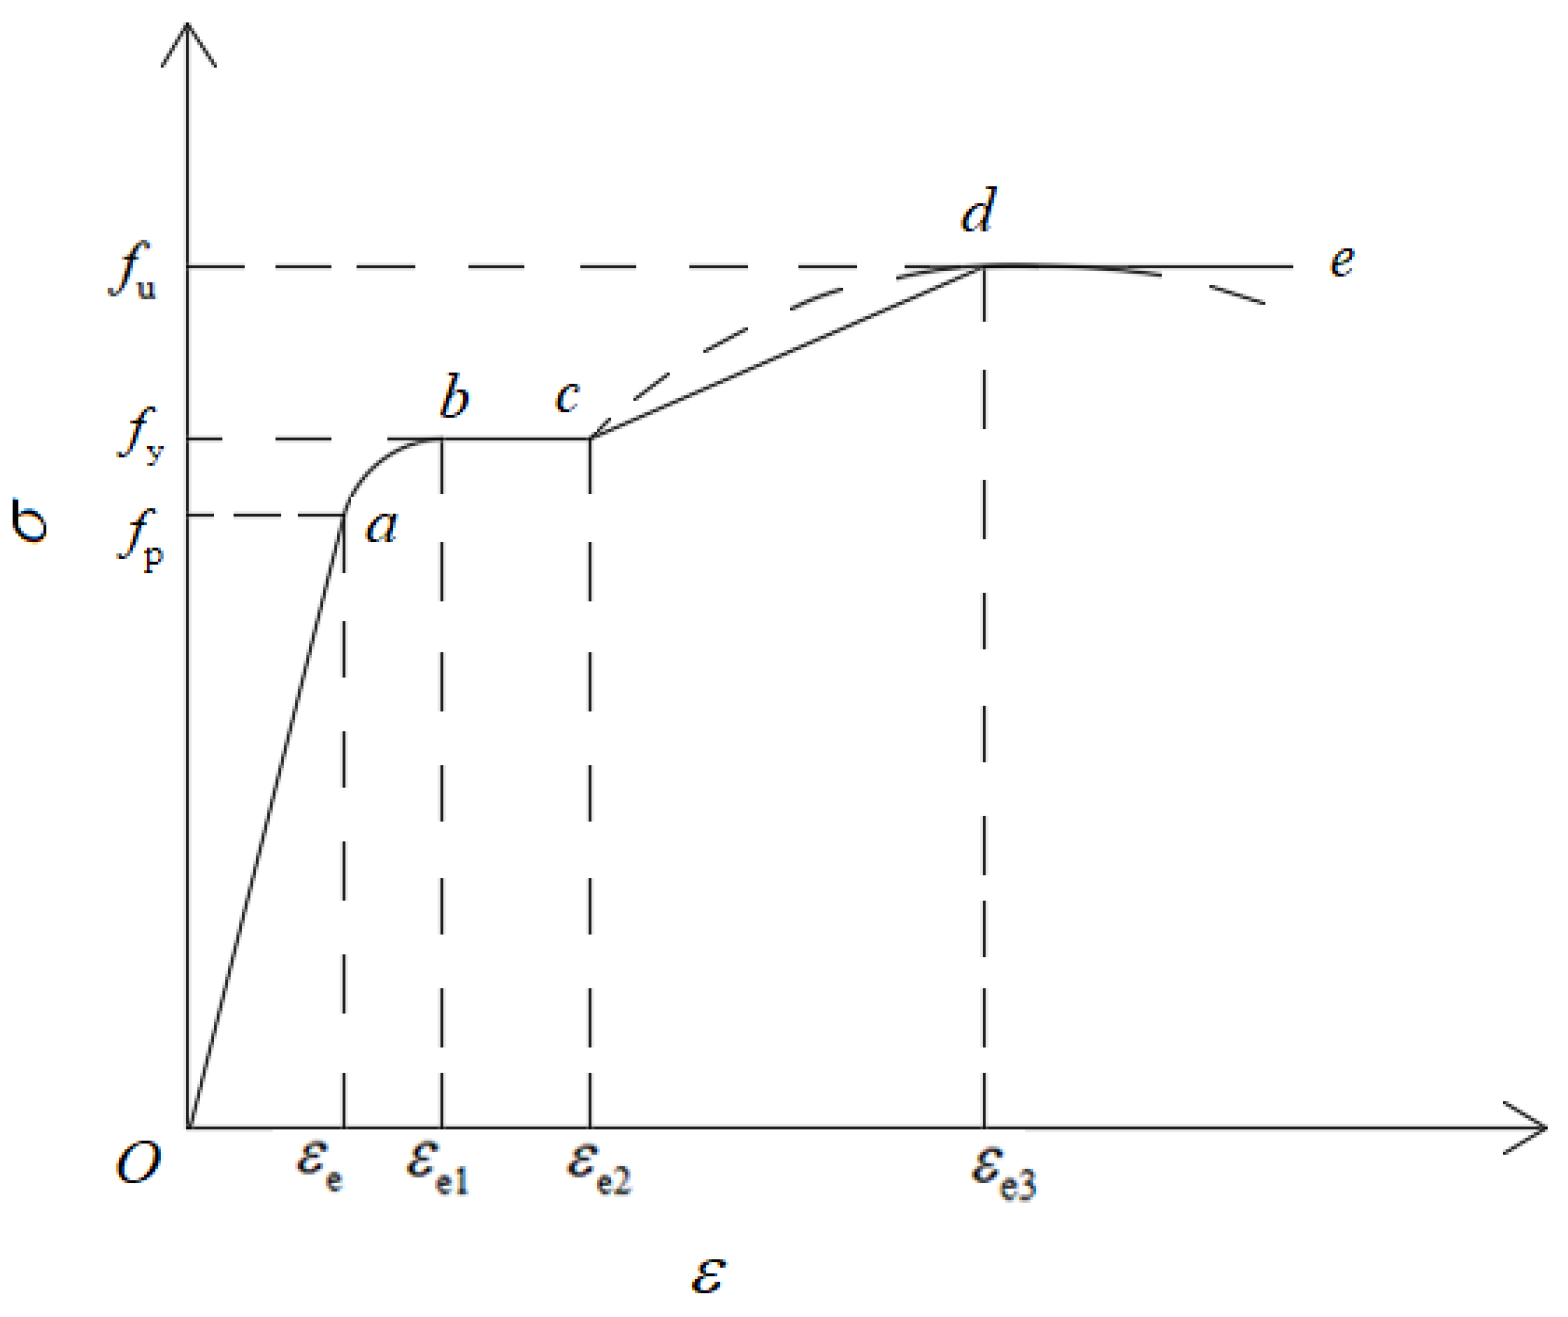
- Constitutive relation of steel
- fy—Yield strength of steel
- Es—Elasticity modulus of steel
- εe—The corresponding strain value for the proportional limit
- εe1—The corresponding strain value for entering the yield platform
- εe2—The corresponding strain value for the end yield platform
- εe3—The corresponding strain value for the strength limit
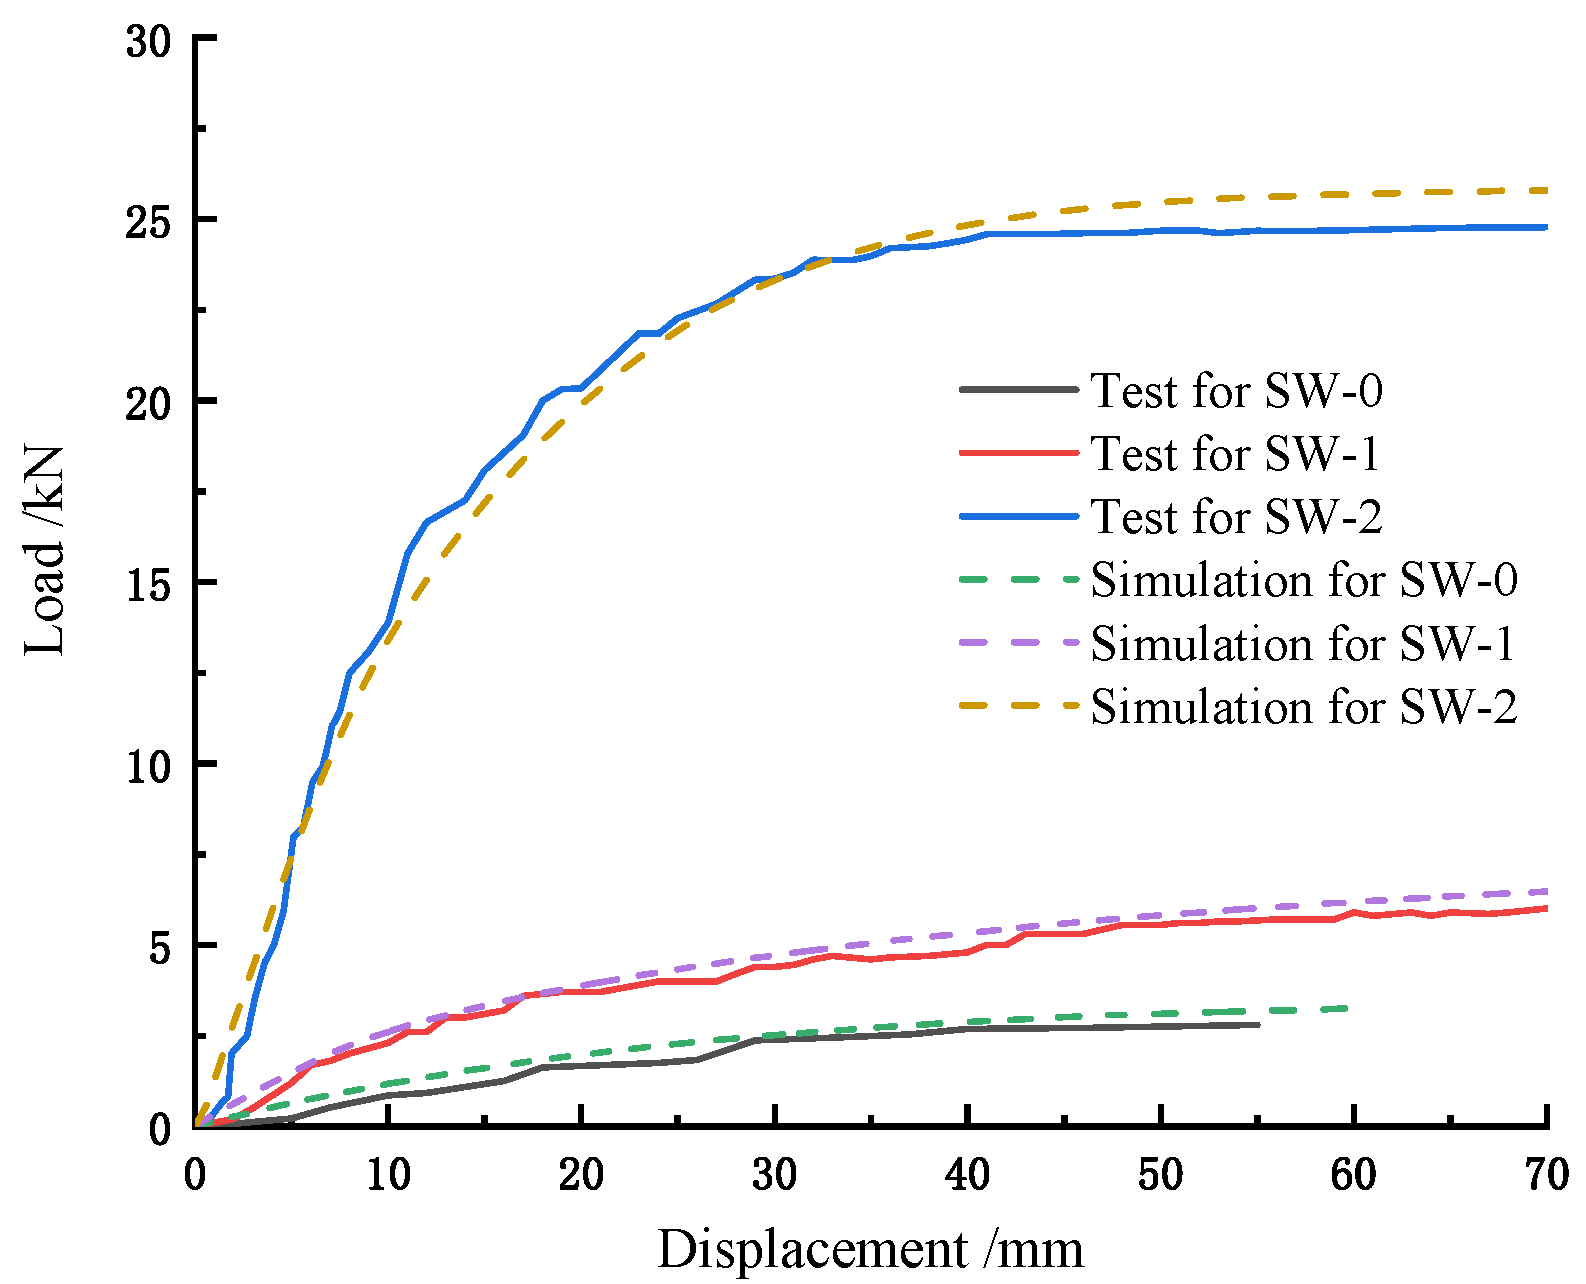
4.3. Comparison on Simulation and Experiment
- (1)
- Comparison of failure modes
- (2)
- Comparison of load–displacement curves
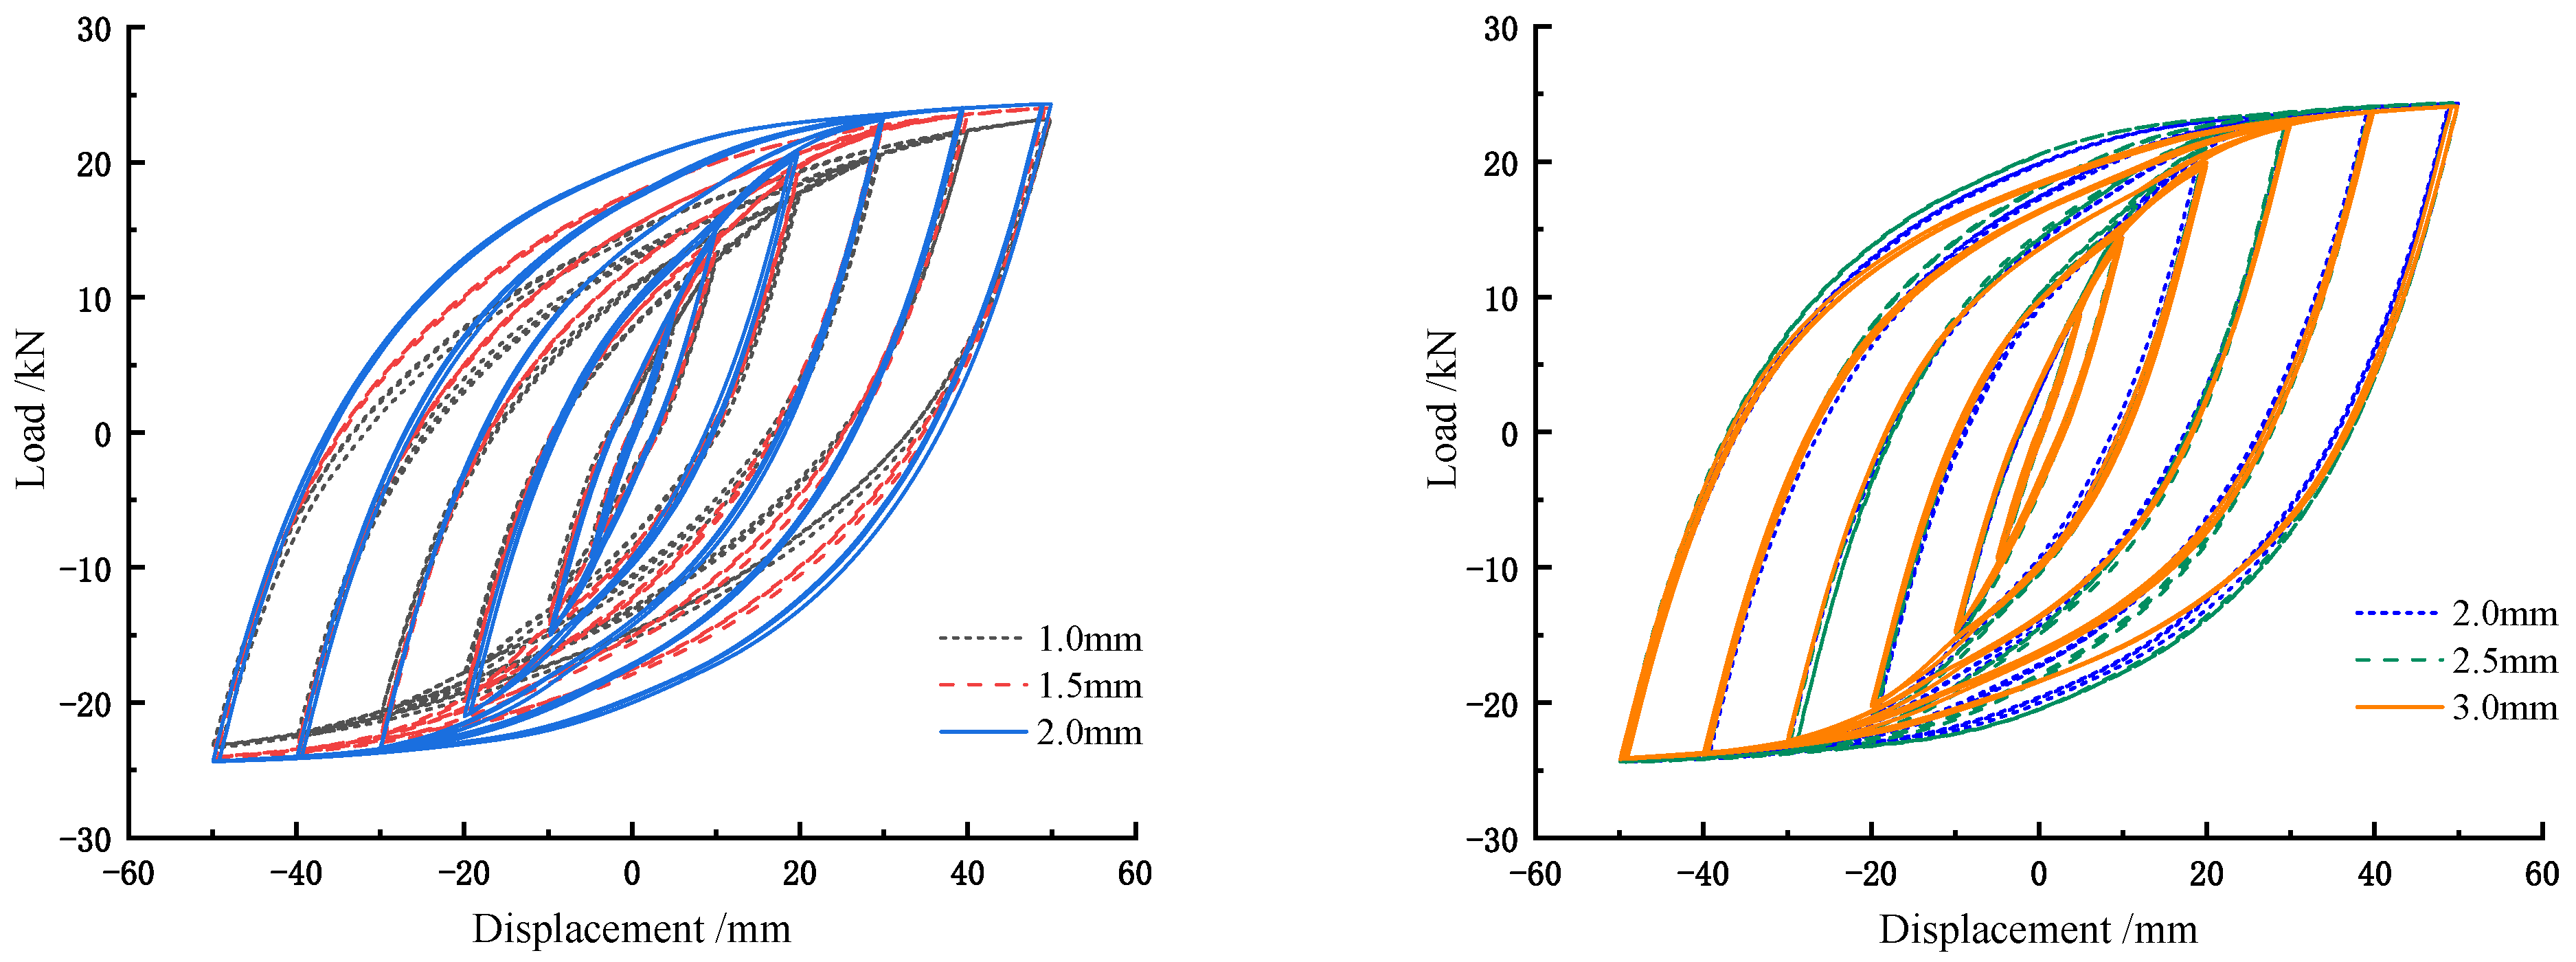
4.4. Finite Element Simulation of the SW-2 Joint with Different Thicknesses of Energy Dissipation Plate
- (1)
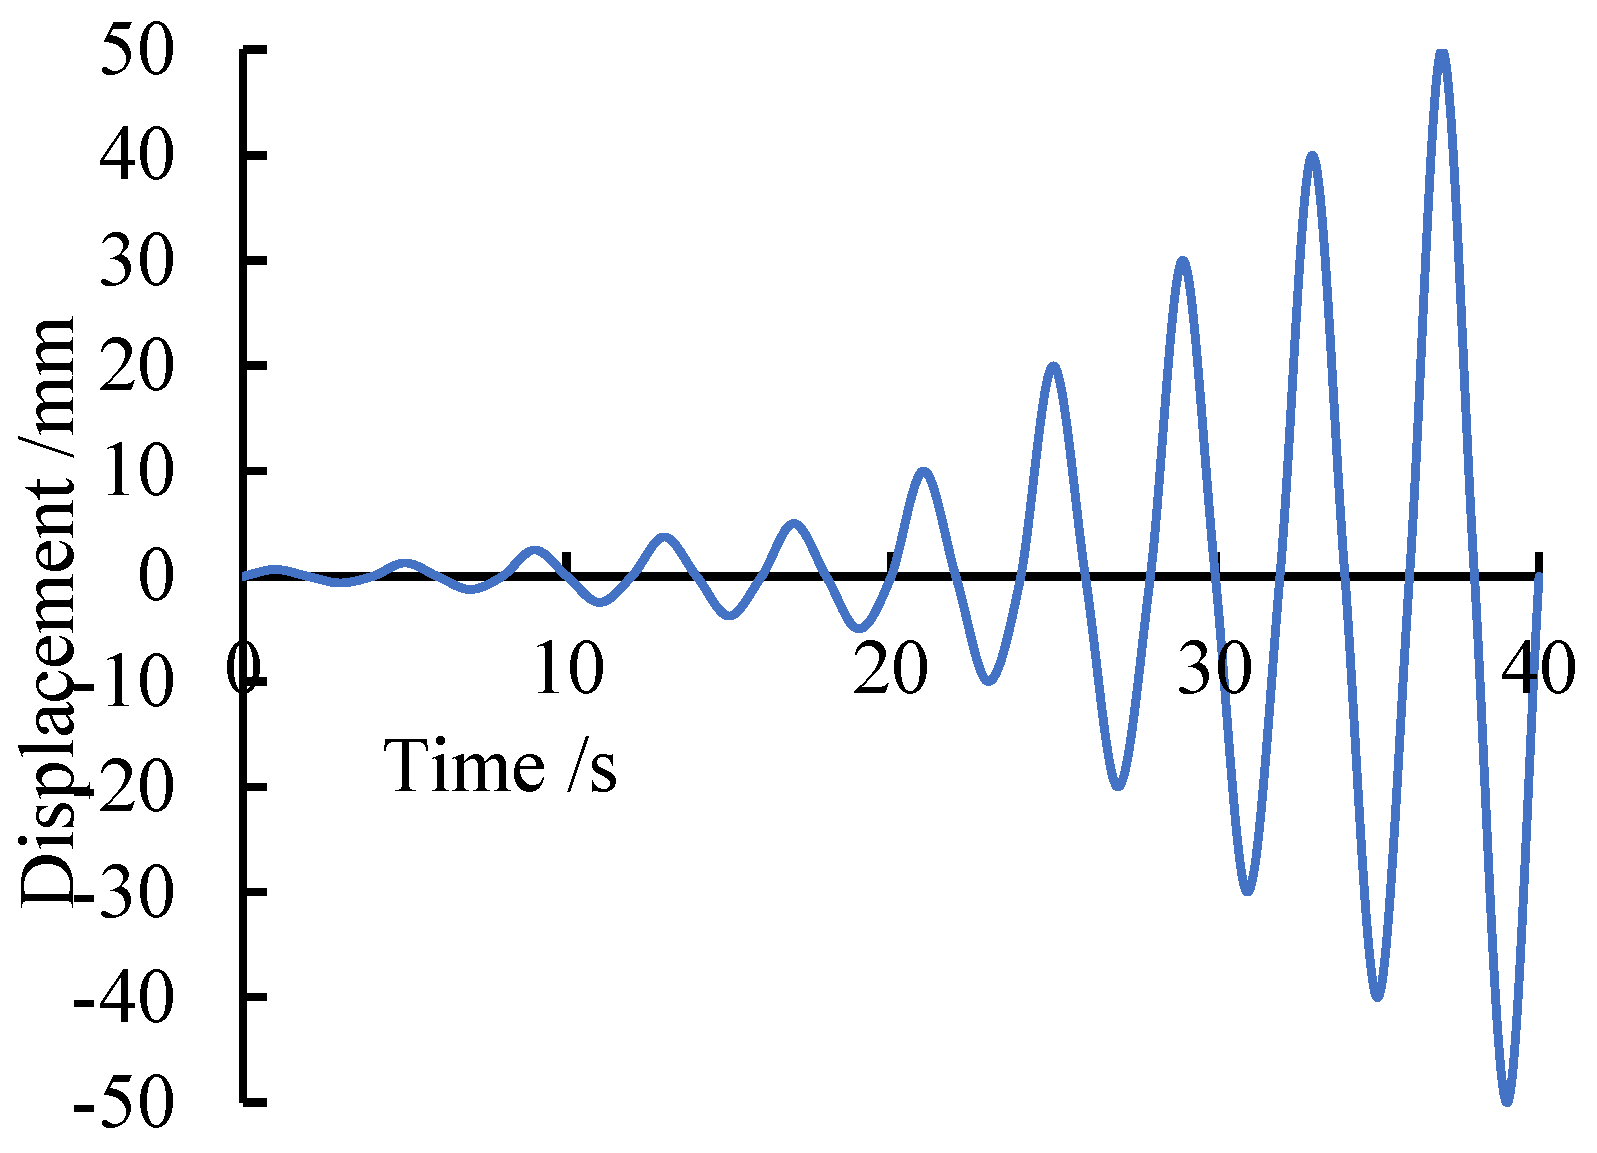
- Analysis of joint hysteresis curves
- (2)
- Analysis of joint skeleton curves
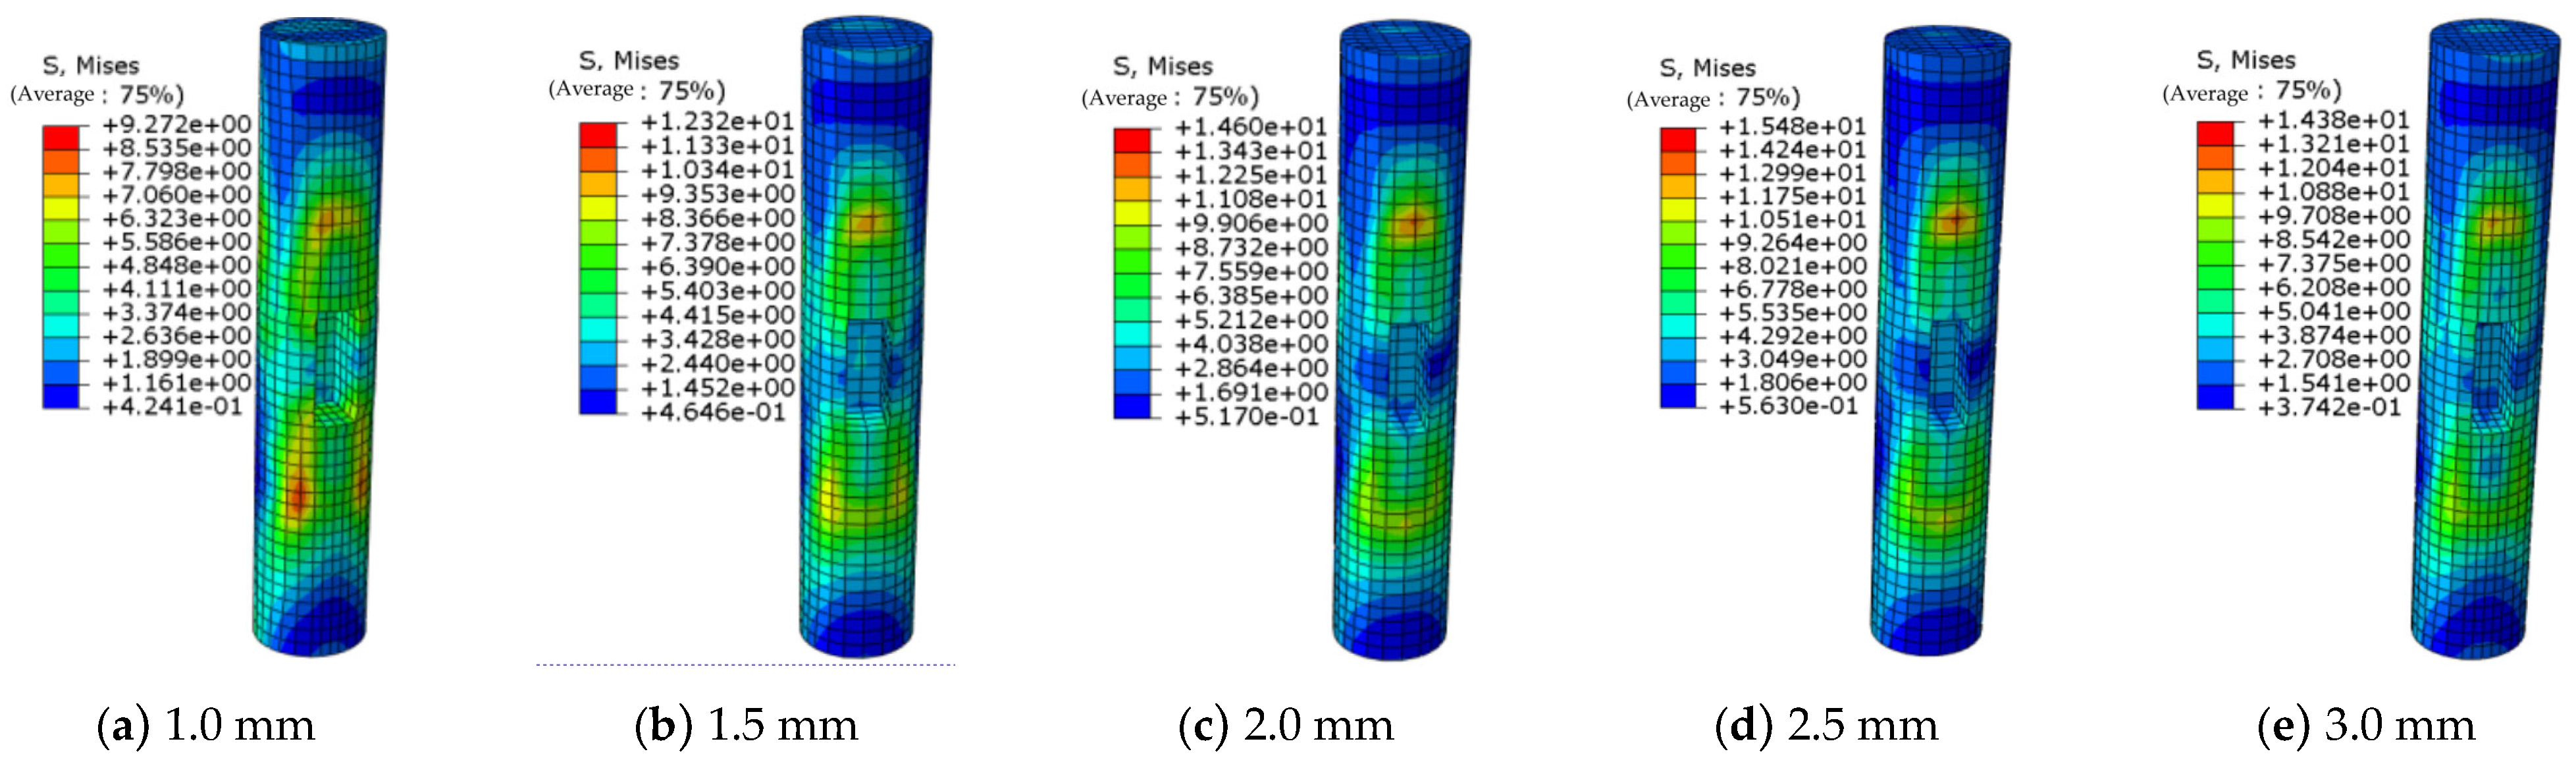
- (3)
- Stress cloud diagram for wooden columns
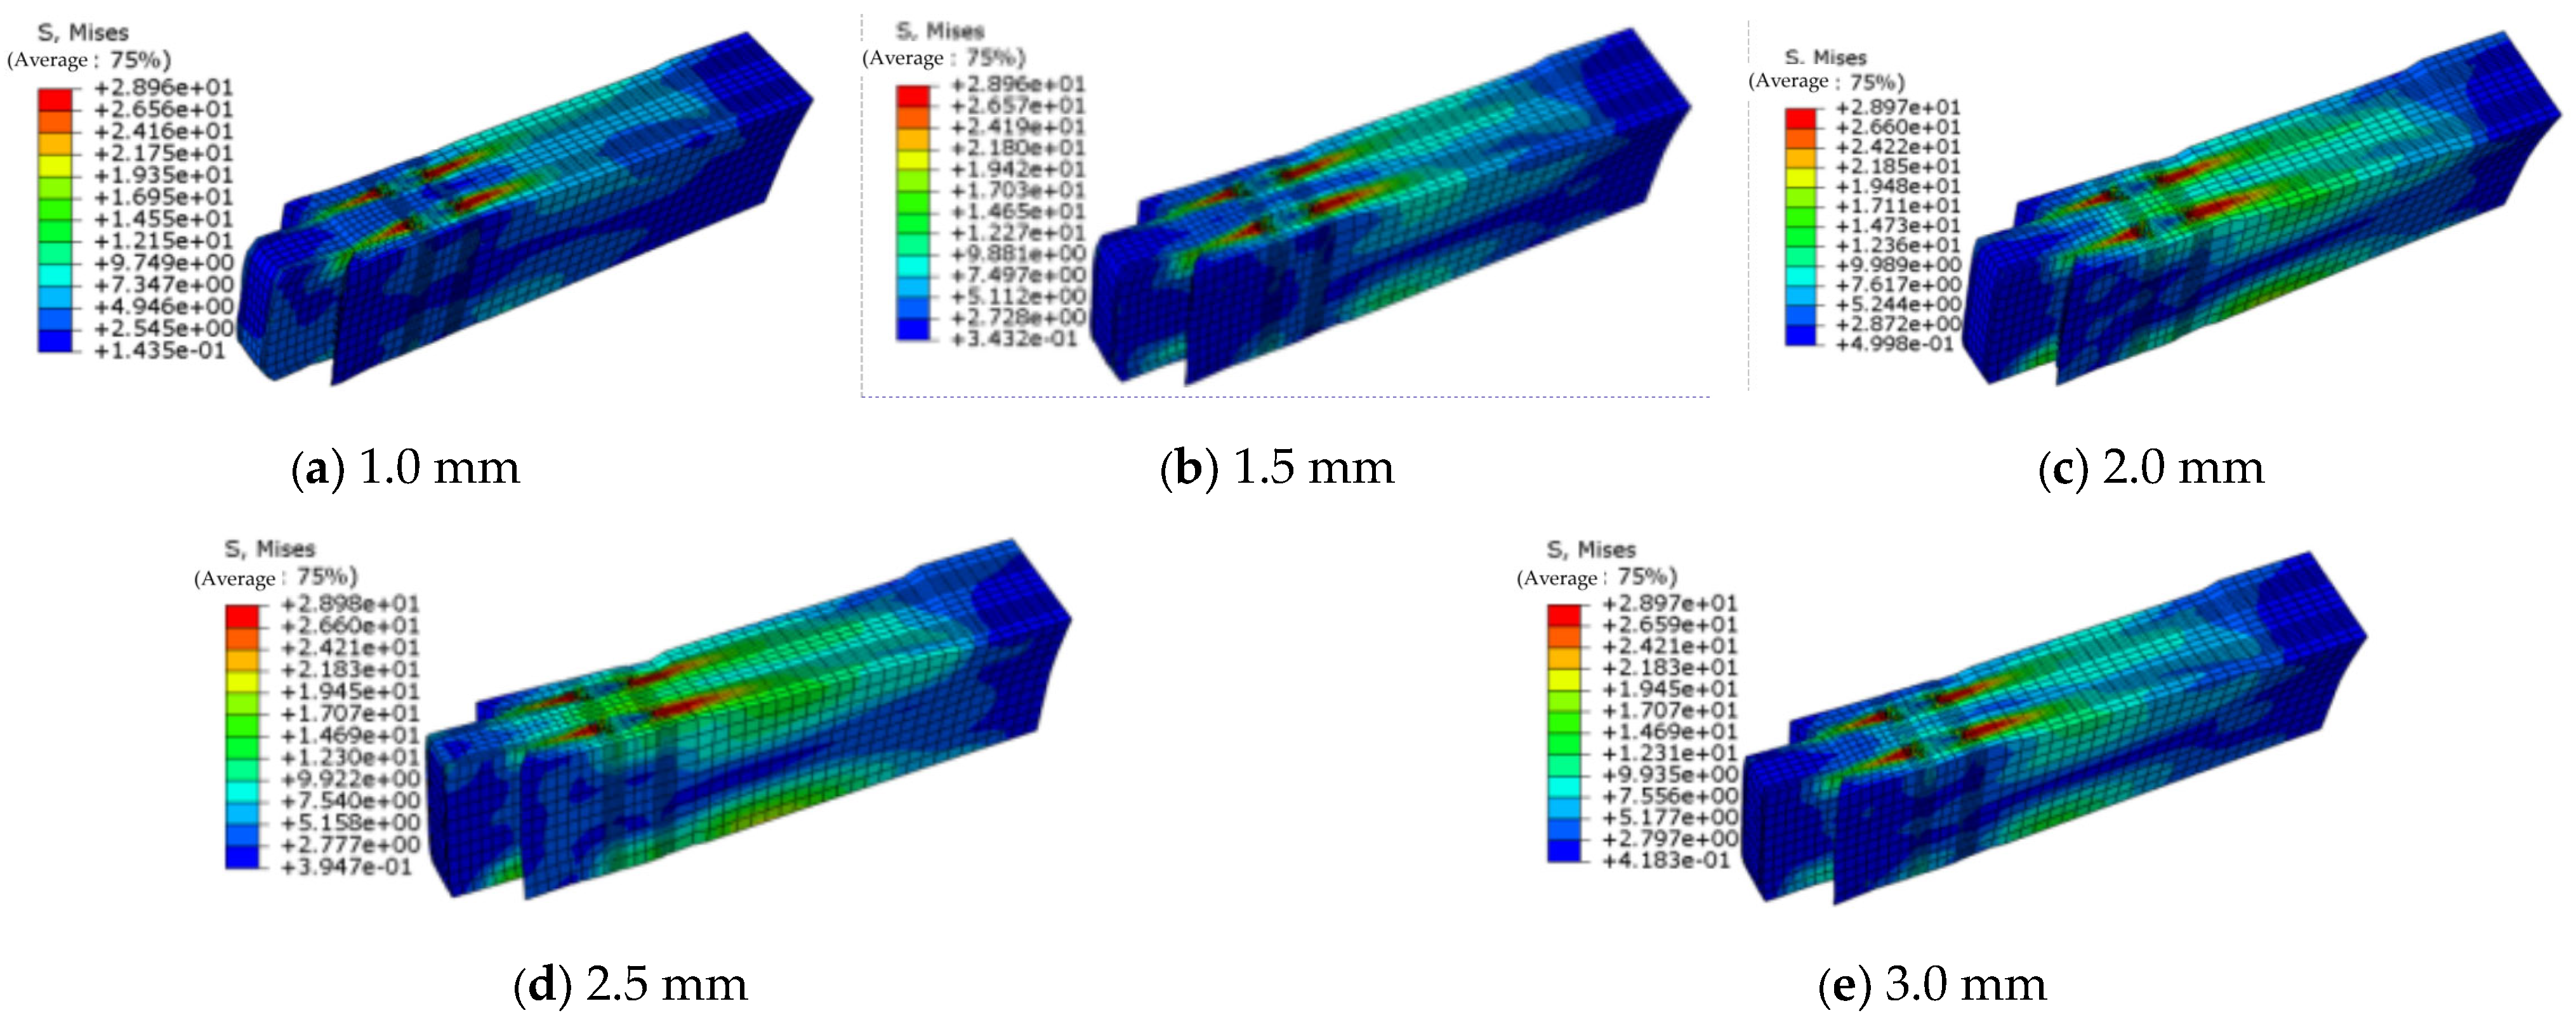
- (4)
- Stress cloud diagram for wooden beams
- (5)
- Stress cloud diagram for steel sleeves
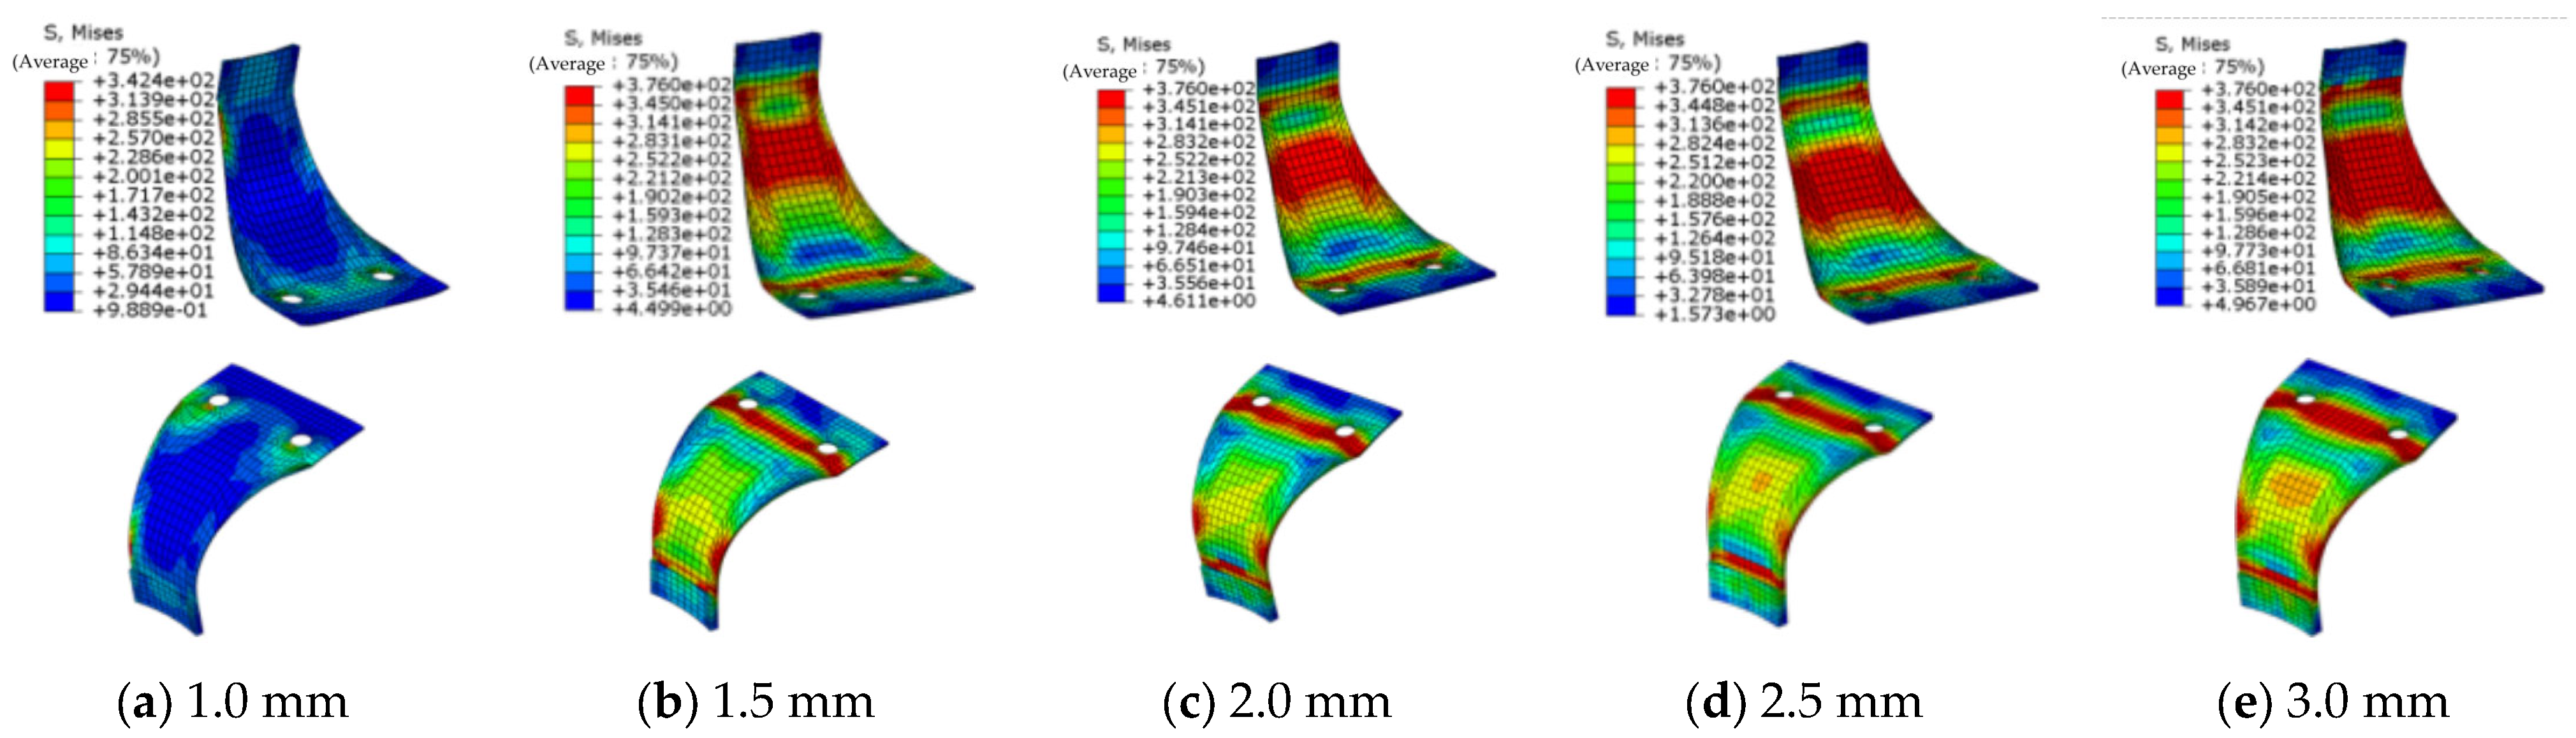
- (6)
- Stress cloud diagram for energy-dissipation plates
- (7)
- Stress cloud diagram for high-strength bolt
4.5. Limitation of Study
- (1)
- Material properties and variability. The mechanical properties of wood are significantly influenced by factors such as moisture content, grain orientation, and inherent material defects. Therefore, the generalizability of the findings in this study may be limited due to the inherent stochastic nature of wood properties.
- (2)
- Simplified numerical model. The contact friction coefficients and the material constitutive models of the finite element model were simplified. The complex interactions between wood and steel components under dynamic loading conditions may not be fully captured due to the simplifications of the model.
- (3)
- Loading condition. This study focused on monotonic loading tests, which means that the cyclic loading conditions typically encountered in seismic events may not be fully represented.
- (4)
- General applicability. The materials, dimensions, and reinforcement methods used in this study is specific. Therefore, the research results may not be directly applied to other types of steel-wood composite joints or different reinforcement materials and configurations.
5. Conclusions
Author Contributions
Funding
Data Availability Statement
Conflicts of Interest
References
- Karel’Skiy, A.; Zhuravleva, T.; Filippov, V.; Labudin, B.; Melekhov, V. Reinforcement Technology of Laminated Wood Structures by Gang Nail. Lesn. Zh. (For. J.) 2018, 130, 80–88. [Google Scholar] [CrossRef]
- Masaeli, M.; Karampour, H.; Gilbert, B.P.; Talebian, N.; Behnia, A.-R. Numerical assessment of the interaction between shear and moment actions in LVL bolted connections. J. Build. Eng. 2022, 55, 2352–7102. [Google Scholar] [CrossRef]
- Michele, M.; Andrea, G.; Sergio, G.; Geert, R.; de Kuilen Jan Willem, V. Combining architectural conservation and seismic strengthening in the wood-based retrofitting of a monumental timber roof: The case study of St. Andrew’s Church in Ceto, Brescia, Italy. Int. J. Archit. Herit. 2024, 18, 750–770. [Google Scholar]
- de la Rosa, P.; González, M.D.L.N.; Prieto, M.I.; Gómez, E. Compressive behavior of pieces of wood reinforced with fabrics composed of carbon fiber and basalt fiber. Appl. Sci. 2021, 11, 2460. [Google Scholar] [CrossRef]
- Gribanov, A.S.; Strekalkin, A.A.; Kudryatseva, A.A.; Zdralovic, N. CFRP composites for strengthening wooden structures. IOP Conf. Ser. Mater. Sci. Eng. 2020, 896, 012114. [Google Scholar] [CrossRef]
- Karagoz, Ü.I.; Kesik, H.İ. Experimental and numerical-analysis of compression and bending strength of old wood reinforced with CFRP strips. Structures 2021, 33, 259–271. [Google Scholar] [CrossRef]
- Chen, G.; Wang, Y.; Yang, S. Elliptical FRP-concrete-steel double-skin tubular columns under cyclic compression: Fundamental characteristics and modeling. Eng. Struct. 2025, 326, 119517. [Google Scholar] [CrossRef]
- Kamyar, K.; Farnaz, A.; Farzad, M.; Bijan, S. Computational simulation of light timber framing connections strengthened with self-tapping screws. J. Build. Eng. 2021, 44, 103003. [Google Scholar]
- Elbashir, D.; Branco, J.M.; Rodrigues, L.G. Reinforcement of dowel-type timber joints with self-tapping screws. Proc. Inst. Civ. Eng. Struct. Build. 2020, 173, 1–43. [Google Scholar] [CrossRef]
- Dar, M.A.; Subramanian, N.; Anbarasu, M.; Carvalho, H.; Dar, A.R. Effective strengthening of timber beams: Experimental investigation. Pract. Period. Struct. Des. Constr. 2021, 26, 342–350. [Google Scholar] [CrossRef]
- Shao, J.; Wang, K.; Sakdirat, K.; Cai, W.; Wang, Z. Experimental Investigations into Earthquake Resistance of Steel Frame Retrofitted by Low-Yield-Point Steel Energy Absorbers. Appl. Sci. 2019, 9, 3299. [Google Scholar] [CrossRef]
- Liu, K.; Shao, J.; Tang, B.; Wu, Q.; Wang, Z. Seismic Performance of Low-Yield-Point Steel Plate Shear Walls Under Horizontal Cyclic Load. Iran. J. Sci. Technol. Trans. Civ. Eng. 2022, 46, 3739–3752. [Google Scholar] [CrossRef]
- Xu, T.; Shao, J.; Zhang, J.; Kaewunruen, S. Experimental Performance Evaluation of Multi-Storey Steel Plate Shear Walls Designed by Different Methods. Int. J. Civ. Eng. 2019, 17, 1145–1154. [Google Scholar] [CrossRef]
- Liu, Q.; Shao, J.; Tang, B.; Wang, Z. Experimental investigation into failure modes of low-yield-point steel plate shear walls. Appl. Sci. 2022, 12, 5632. [Google Scholar] [CrossRef]
- Wang, T.; Shao, J.; Xu, T.; Wang, Z. Study on axial compression properties of aluminum foam-filled steel tube members after high temperature. Iran. J. Sci. Technol. Trans. Civ. Eng. 2022, 46, 883–900. [Google Scholar] [CrossRef]
- Wang, T.; Shao, J.; Zhao, C.; Liu, W.; Wang, Z. Shaking table test for evaluating the seismic performance of steel frame retrofitted by buckling-restrained braces. Shock. Vib. 2021, 2021, 6654201. [Google Scholar] [CrossRef]
- Wang, Z.; Shao, J. Study on Quasi-Static Axial Compression Performance and Energy Absorption of aluminum Foam-Filled Steel Tubes. Materials 2023, 16, 4485. [Google Scholar] [CrossRef]
- Shaimaa, S.; Özgür, A.; Murat, U.; Abdullah, T. Investigation of bond-slip model of timber-to-timber bonded joint strengthened with different types of nets. Mech. Based Des. Struct. Mach. 2023, 51, 235–259. [Google Scholar]
- Yağmur, K.; Anıl, Ö.; Özgür, A.; Shaimaa, S.; Furkan, A. Experimental investigation of bond-slip behavior of between-anchored steel strips to concrete surface. Arch. Civ. Mech. Eng. 2022, 22, 53–79. [Google Scholar]
- Wang, Z.; Yang, W.; Gao, Z.; Shao, J.; Li, D. Experimental and Numerical Simulation Study on the Mechanical Properties of Integrated Sleeve Mortise and Tenon Steel-Wood Composite Joints. Buildings 2025, 15, 137. [Google Scholar] [CrossRef]
- Scotta, R.; Trutalli, D.; Fiorin, L.; Pozza, L.; Marchi, L.; De Stefani, L. Light steel-timber frame with composite and plaster bracing panels. Materials 2015, 8, 7354–7370. [Google Scholar] [CrossRef] [PubMed]
- Chiniforush, A.A.; Valipour, H.; Akbarnezhad, A.; Bradford, M. Steel-timber composite (STC) beams: Numerical simulation of long-term behaviour. Proc. Civ. Eng. 2017, 1, 12051–12059. [Google Scholar] [CrossRef]
- Chiniforush, A.A.; Alamdari, M.M.; Dackermann, U.; Valipour, H.; Akbarnezhad, A. Vibration behaviour of steel-timber composite floors, part (1): Experimental & numerical investigation. J. Constr. Steel Res. 2019, 161, 244–257. [Google Scholar]
- Offerman, T.; Bompa, D.V. Numerical investigation of lateral behaviour of steel-timber hybrid frames. Electr. Eng. 2023, 6, 4. [Google Scholar] [CrossRef]
- GB/T 1928-2009; General Rules for Testing Methods of Physical and Mechanical Properties of Wood. Standards Press of China: Beijing, China, 2009.
- GB/T 1929-2009; Sawing and Sampling Methods for Test Specimens of Physical and Mechanical Properties of Wood. Standards Press of China: Beijing, China, 2009.
- GB/T 228.1-2010; Metallic Materials—Tensile Testing—Part 1: Method of Test at Room Temperature. Standards Press of China: Beijing, China, 2010.
- GB/T 1231-2006; Specifications of High Strength Bolts with Large Hexagon Head, Large Hexagon Nuts, and Plain Washers for Steel Structures. Standards Press of China: Beijing, China, 2006.
- Jin, Y. Seismic performance of Mortise and Tenon Joints in Rural Timber Residential Buildings. Master’s Thesis, Kunming University of Science and Technology, Kunming, China, 2022. [Google Scholar]


| Mechanical Properties | Average Value | Standard Deviation |
|---|---|---|
| Elastic modulus | 11,059.71 MPa | 58.61 MPa |
| Compressive strength | 38.14 MPa | 1.15 MPa |
| Poisson’s ratio | 0.54 | 0.03 |
| Density | 247.21 kg/m3 | 0.42 kg/m3 |
| Mechanical Properties | Average Value | Standard Deviation |
|---|---|---|
| Elastic modulus | 205.85 GPa | 5.26 GPa |
| Yield strength | 233.87 MPa | 2.72 MPa |
| Ultimate strength | 372.21 MPa | 3.85 MPa |
| Mechanical Properties | Average Value | Standard Deviation |
|---|---|---|
| Yield strength | 958.62 MPa | 5.11 MPa |
| Tensile strength | 1042.51 MPa | 3.72 MPa |
| Comparison Joint | SW-0 | SW-1 | SW-2 |
|---|---|---|---|
| Proportional limit displacement/mm | 7.13 | 5.35 | 8.06 |
| Proportional limit load/kN | 0.61 | 1.21 | 4.99 |
| Initial stiffness/(kN/m) | 85.55 | 226.17 | 619.11 |
| Initial displacement at the onset of the horizontal segment/mm | 40.35 | 51.37 | 43.62 |
| Initial load at the onset of the horizontal segment/kN | 2.76 | 5.16 | 24.71 |
| Ultimate displacement/mm | 59.33 | 86.16 | 80.12 |
| Ultimate load/kN | 2.80 | 6.20 | 24.90 |
| Representative Value | Input Value | Value |
|---|---|---|
| 11,059.71 MPa | ||
| 242.72 MPa | ||
| 217.13 MPa | ||
| 822.75 MPa | ||
| 658.23 MPa | ||
| 197.36 MPa | ||
| 0.54 | ||
| 0.46 | ||
| 0.41 |
| Yield Strength (MPa) | σ11 | σ22 | σ33 | σ12 | σ13 | σ23 | σo |
| 29 | 1.6 | 1.6 | 3.51 | 3.51 | 3.51 | 29 | |
| Yield Strength Coefficient | R11 | R22 | R33 | R12 | R13 | R23 | |
| 1 | 0.06 | 0.06 | 0.12 | 0.12 | 0.12 |
| Comparison | Proportional Limit Load/kN | Ultimate Displacement/mm | Relative Error/% | |||
|---|---|---|---|---|---|---|
| Simulation | Test | Simulation | Test | Proportional Limit Load | Ultimate Displacement | |
| SW-0 | 0.64 | 0.61 | 3.21 | 2.80 | 4.92 | 14.64 |
| SW-1 | 1.38 | 1.21 | 6.96 | 6.20 | 14.05 | 12.26 |
| SW-2 | 5.78 | 4.99 | 26.9 | 24.90 | 15.83 | 8.03 |
Disclaimer/Publisher’s Note: The statements, opinions and data contained in all publications are solely those of the individual author(s) and contributor(s) and not of MDPI and/or the editor(s). MDPI and/or the editor(s) disclaim responsibility for any injury to people or property resulting from any ideas, methods, instructions or products referred to in the content. |
© 2025 by the authors. Licensee MDPI, Basel, Switzerland. This article is an open access article distributed under the terms and conditions of the Creative Commons Attribution (CC BY) license (https://creativecommons.org/licenses/by/4.0/).
Share and Cite
Li, D.; Shao, J.; Feng, A.; Wang, Z.; Xu, H.; Gao, J.; Chen, S. Experimental and Numerical Study on Mechanical Performance of Half-Tenon Beam–Column Joint Under Different Reinforcement of Energy Dissipation Plate and Steel Sleeve. Buildings 2025, 15, 1351. https://doi.org/10.3390/buildings15081351
Li D, Shao J, Feng A, Wang Z, Xu H, Gao J, Chen S. Experimental and Numerical Study on Mechanical Performance of Half-Tenon Beam–Column Joint Under Different Reinforcement of Energy Dissipation Plate and Steel Sleeve. Buildings. 2025; 15(8):1351. https://doi.org/10.3390/buildings15081351
Chicago/Turabian StyleLi, Dongmei, Jianhua Shao, Anxiang Feng, Zhanguang Wang, Hongxuan Xu, Jinning Gao, and Shengyu Chen. 2025. "Experimental and Numerical Study on Mechanical Performance of Half-Tenon Beam–Column Joint Under Different Reinforcement of Energy Dissipation Plate and Steel Sleeve" Buildings 15, no. 8: 1351. https://doi.org/10.3390/buildings15081351
APA StyleLi, D., Shao, J., Feng, A., Wang, Z., Xu, H., Gao, J., & Chen, S. (2025). Experimental and Numerical Study on Mechanical Performance of Half-Tenon Beam–Column Joint Under Different Reinforcement of Energy Dissipation Plate and Steel Sleeve. Buildings, 15(8), 1351. https://doi.org/10.3390/buildings15081351