Article

The Evaluation of Spatial Allocation and Sustainable Optimization Strategies for Sports Venues in Urban Planning Based on Multi-Source Data: A Case Study of Xi’an

College of Architecture and Engineering, Nanjing Institute of Technology, Nanjing 211167, China
*
Author to whom correspondence should be addressed.
Buildings 2025, 15(8), 1354; https://doi.org/10.3390/buildings15081354
Submission received: 21 February 2025 / Revised: 12 April 2025 / Accepted: 16 April 2025 / Published: 18 April 2025

Abstract

:
With the development of the economy and improvements in living standards, public demand for sports activities has continued to increase. However, the supply–demand relationship of urban sports venues remains unbalanced in many cities. Existing theoretical research on the spatial allocation of sports venues predominantly focuses on macro-level functional configuration and the equitable distribution of sports resources, lacking more rigorous and quantitative evaluation frameworks for evaluating spatial allocation. This study innovatively integrates multi-source data into the assessment and sustainable optimization of sports venue allocation in urban planning, using Xi’an as a case study. By analyzing geographic information, road network topology, OpenStreetMap (OSM), population distribution, and social media Points of Interest (POI), and using analytical tools such as ArcGIS 10.8 and Stata 17, the appropriateness of resource distribution of public sports venues in Xi’an’s main urban area is evaluated from three dimensions: accessibility, equity, and spatial activity. The results reveal the appropriateness of venue distribution in urban spatial allocation, the equitable distribution of resources, and imbalances in spatial activity and resource distribution. Finally, the study proposes a series of sustainable optimization strategies, including increasing venue coverage in low-supply areas, adaptive reuse of idle industrial buildings into sports venues guided by green sustainability principles, constructing a “15-min fitness circle” spatial system, optimizing low-carbon mobility networks around venues, enhancing the compatibility of sports venues, and improving commercial operation and management capabilities. These strategies aim to optimize the distribution of public sports venues in Xi’an to improve fairness and operational efficiency in service delivery while promoting sustainable urban development.

1. Introduction

With China’s rapid economic growth and rising living standards, sports activities have become integral to urban lifestyles [1]. Scientifically rational spatial allocation of sports venues within urban layouts proves critical for enhancing athletic participation and user experience and serves as a key metric for assessing urban development quality [2]. Importantly, aligning venue distribution with sustainable urban development principles becomes paramount for creating environmentally and socially resilient cities. In contrast to cities in Europe and the United States, where sports venue planning follows a market-driven approach [3,4], the model for sports venue planning in China is a government-led model [5]. There are three fundamental institutional differences between the two models: (1) the decision-making hierarchy (decentralized vs. centralized), (2) the financing mechanism (private investment vs. fiscal allocation), and (3) the performance metrics (profitability vs. social welfare). This institutional divergence stems from China’s unique urbanization trajectory. While Western countries completed their urban transformation under the neoliberal paradigm [6], China’s government-led urban planning model has been effective in ensuring equitable spatial distribution of venue resources for a certain period, which is a crucial social stabilization mechanism during the demographic transition [7]. However, many Chinese cities are experiencing rapid urbanization [8], population agglomeration, and increasingly complex urban configurations. As a result, the original sports resource allocation model is facing new challenges [9]; market forces have begun to occupy a proportion of the sports resources distribution [10], leading to a contradiction between supply and demand [11,12]. Therefore, we need to find a solution that fits the current context of urbanization in China. As a central city in western China, Xi’an has frequent population movements, and urbanization and suburbanization processes co-exist. There is a significant spatial imbalance between the demand for sports and the supply of sports venues in different regions and groups, and the contradiction between the supply and demand of sports venue resources is particularly prominent in the urban spatial structure. The integration and application of multi-source data represent a promising approach to addressing this challenge.
Current urban renewal initiatives and Smart City strategies increasingly leverage big data applications across municipal domains [13]; moreover, digital technologies offer transformative potential for optimizing sports venue allocation [14] and supporting evidence-based urban planning and sports management. Significantly, integrating green building standards in venue construction enhances energy performance while reducing carbon footprints. Nevertheless, extant studies on urban public resource allocation [15] frequently rely on limited datasets, failing to harness multi-source data’s analytical advantages for achieving low-carbon urban development.
This research addresses the allocation challenges of urban sports venues through multi-source data integration [16] and sustainable strategies enhancing infrastructure resilience. Our approach systematically combines environmental design principles with urban resource management, establishing a novel holistic framework. A bibliometric analysis of literature from the Web of Science over the past five years revealed that 76% of the studies focused on healthcare/educational facilities, 14% involved research on the spatial configuration of sports venues, and less than 12% were interdisciplinary. Previous studies on public facility allocation predominantly employ multi-source data fusion for hospitals, schools, and green spaces [17,18]. For instance, Liu (2022) developed urban information unit-based models advancing facility allocation methodologies [19]. However, Liu’s framework overlooked the integration of internationally recognized green building certification systems (e.g., Leadership in Energy and Environmental Design, LEED), limiting its applicability to sustainable urban planning. Omer (2006) demonstrated georeferenced census data’s critical role in park accessibility assessments [20], while Rao (2022) and Yuan (2023) revealed educational facility distribution imbalances [21,22] yet omitted energy efficiency analyses across facility life cycles.
Existing research, while valuable, lacks comprehensive integration of multi-source analytics for sustainable urban resource allocation. Accessibility reflects the ease of obtaining public facility resources [23], equity embodies the balanced distribution of resources [24], and spatial activity levels [25] indicate the efficiency of resource utilization and citizen engagement [26]. These interrelated dimensions necessitate comprehensive analysis through multi-source data integration to achieve efficient resource utilization and meet residents’ needs [27]. Despite their critical role in urban functionality and residents’ well-being, the spatial allocation of sports venues remains underexplored in prior studies.
This is mainly because urban healthcare and education facilities usually follow a ‘single-center coverage’ pattern (typically 1–2 facilities per subdistrict), whereas sports venues are characterized by a high density of clusters (average of 3.7 venues per subdistrict in Xi’an) and functional substitutability between venue types. At the same time, the service provision mechanism requires a new analytical framework (Table 1)—unlike unidirectional patient flows in hospitals and unidirectional student flows in schools, the use of sports venues involves multidirectional choices of multiple venues within tolerance thresholds [28], which requires advanced multi-criteria decision analysis. Moreover, because of the huge construction cost of sports venues, their optimization strategy should be different from the traditional matching of supply and demand by integrating the assessment of green retrofit potentials and energy performance optimization of existing facilities, which fits the principle of circular economy in urban regeneration [29].
Theoretical explorations of sports venue allocation span urban resource–demand dynamics [30] and cross-disciplinary perspectives [31]. Current research primarily examines venue allocation through public accessibility [32], spatial optimization [33], and sustainable development contributions [34]. Architectural studies by Sun, Feng (2022) and Hudec (2016), respectively, analyze sports venue evolution and propose design innovations [35,36]. Bradbury, J.C. (2023) further integrates urban planning, economic, and architectural perspectives [37]. Complementary studies investigate venues’ urban development impacts [38], event capacities [39], and social functions [40,41]. Although research trajectories increasingly address usage efficiency and citizen needs [42,43], comprehensive allocation analyses remain scarce, particularly regarding existing infrastructure’s green retrofitting [44]. Under the context of promoting national fitness, it is imperative to conduct comprehensive and systematic research on the spatial configuration efficiency of sports venues in urban planning [45]. Multimodal data fusion is a good attempt in this regard. Scholars have utilized mobile positioning [46], satellite remote sensing [47], and IoT sensing [48]; integration of multi-source data has significantly improved the spatial and temporal resolution of public facility accessibility analysis. The last three years of research have shown three significant trends (Table 2):
Although the application of multi-source data has made breakthroughs in recent years for sports venue accessibility research [53], its methodology faces the challenge of spatial heterogeneity in sports venue scenarios, and the existing models generally lack a targeted assessment of the effectiveness of sports venue services and the rationality of the layout. There is an urgent need to address the following three key issues: ① Standardization of multi-scale data fusion; ② Quantification of demand forecasts; ③ Transformation paths for existing infrastructure stock.
Therefore, this study takes sports venues within the main urban area of Xi’an as the object of study, responds to these issues in terms of several key dimensions such as accessibility, fairness, and activity, and constructs a multi-level and multi-dimensional analysis and assessment system to comprehensively examine whether their spatial allocation in Xi’an’s urban planning is reasonable or not.
Distance Decay Theory [54] elucidates venue–residence distance effects on utilization rates. Carlos Moreno’s 15-min city concept (2016) underpins fitness circle development and resident-centric spatial optimization [55,56], emphasizing rational venue distribution and subdistrict-level accessibility analysis [57]. Integrating low-carbon transportation infrastructure further enhances sustainable venue accessibility [58]. In terms of methodology, we introduce the Effective Service Equivalent (ESE) coefficient, which establishes a quantifiable equivalence between the quantity of sports venues and the quality of services and solves the ‘quantity-experience inconsistency’ that has long existed in the assessment of sports venues. This innovative indicator integrates dynamic population flow patterns and expert-calibrated quality parameters to build a bridge between sports venue provision and user-oriented service experience. Multi-source data theory enables comprehensive allocation assessments [59,60]; these theories complement each other and together constitute a theoretical framework for studying the allocation of sports venue resources [61], forming an integrated theoretical framework for empirical investigations [62,63,64].

2. Methodology—Construction of a Sports Venue Resource Allocation Analysis System

2.1. Research Methods

This thesis aims to optimize the layout of urban public sports resources and enhance social equity to achieve balanced coverage of fitness services for all. To achieve this goal, we carry out research in the following three aspects:
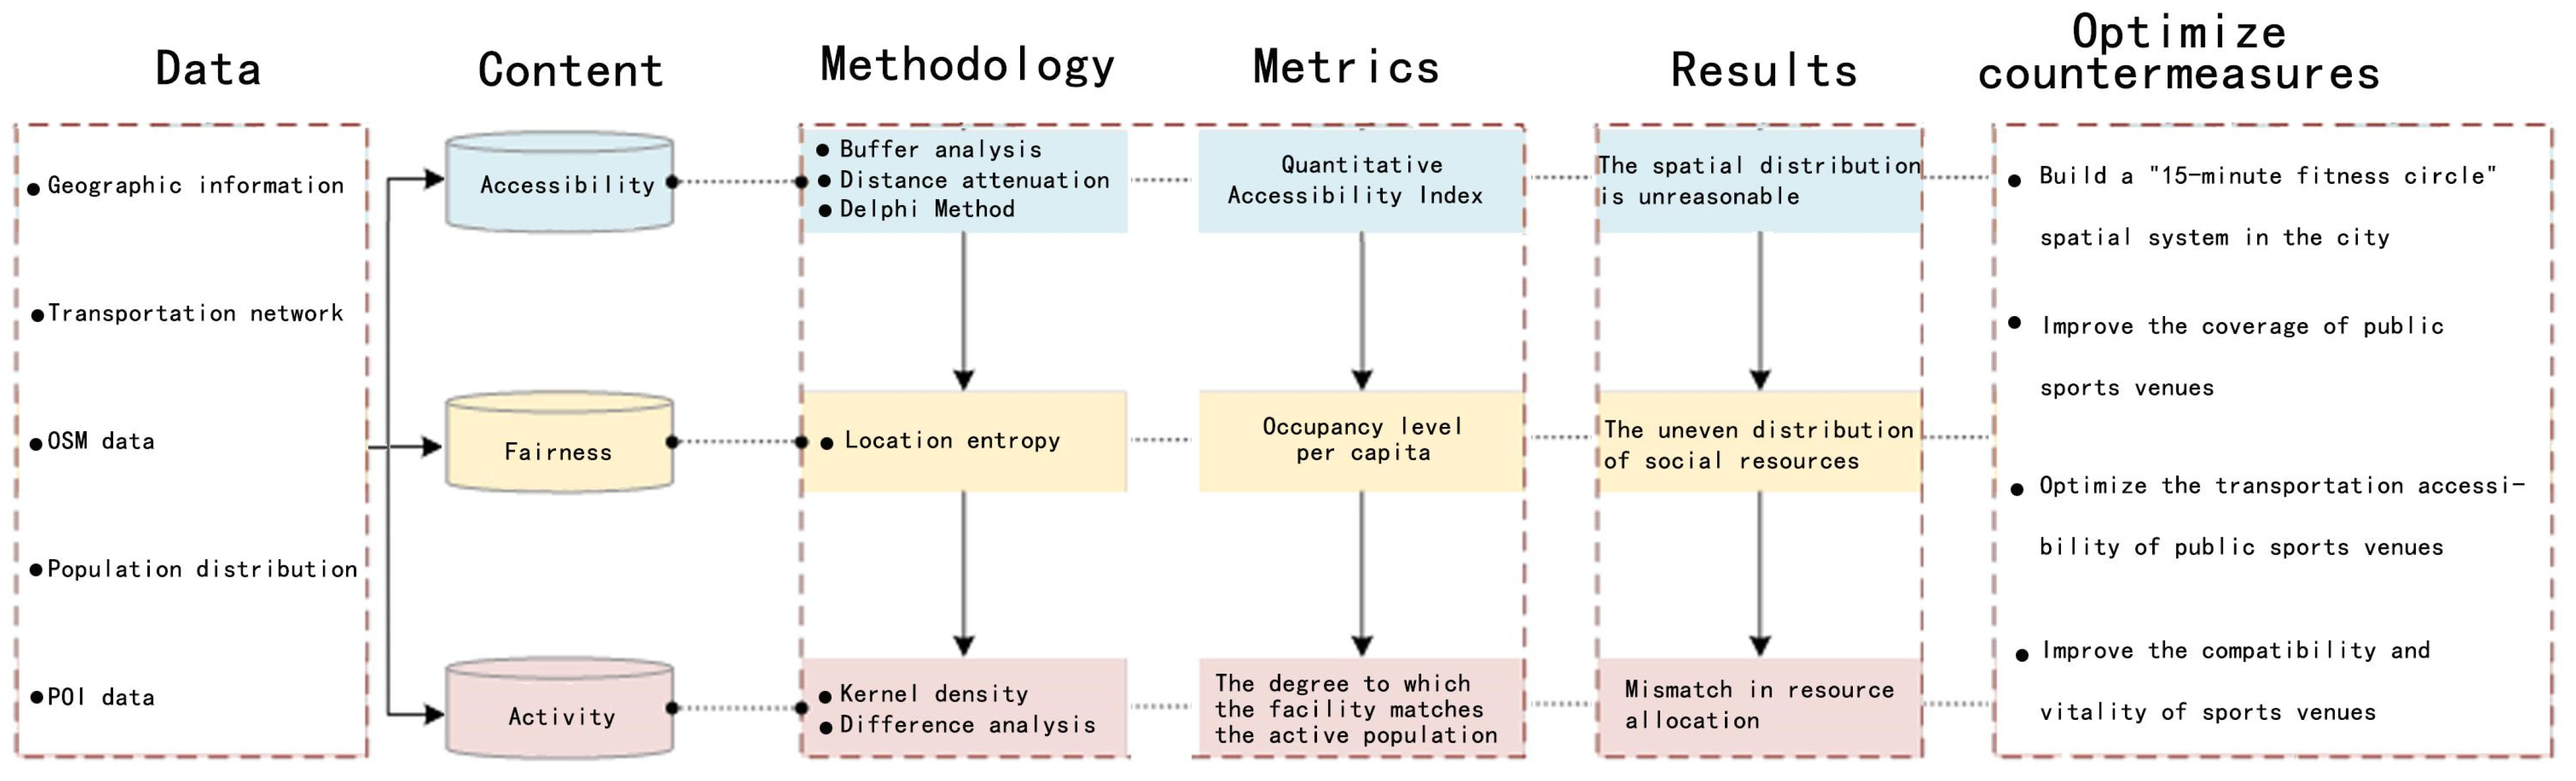
  • Multidimensional data fusion analysis: Using platforms such as Stata and ArcGIS, this study comprehensively analyzed the geographic distribution of sports venues, road network topology, OpenStreetMap (OSM) data, population distribution, and social media point-of-interest (POI) data for Xi’an’s urban area to reveal the spatial distribution characteristics of sports venues and the imbalance of resource matching from the three dimensions of accessibility, equity, and spatial activity;
  • Construction of a scientific assessment system: Combining the Delphi method, buffer zone analysis, distance decay model, locational entropy analysis, and kernel density difference analysis, a quantitative accessibility index and a sports venue active population satisfaction indicator were established to quantitatively assess sports venue coverage, accessibility, and service equity;
  • Design of dynamic optimization strategies: To address the problem of mismatch of resources in sports venues, a phased optimization path is proposed, including the construction of a ‘15-min fitness circle’ in the city, the improvement of the coverage of sports venues, the enhancement of the efficiency of green transport connections, the enhancement of the compatibility of venue functions, and the eventual construction of an all-age friendly and vibrant sports space system.
This framework (Figure 1) aims to systematically address the key challenges in the current public sports resource system, namely spatial imbalance, supply–demand mismatch, and insufficient vitality.

2.2. Data Collection

This study adopted a multi-source data integration framework validated in the literature on urban planning and geospatial analysis, integrating POI data, OSM road networks, and field research data. The workflow contains three core modules:
  • POI data processing: collect POIs of ‘Sports and Leisure Services—Sports Venues’ through Gaode Map API, and manually clean and retain 154 small, 13 medium, and 3 large venues within the circumferential highway in Xi’an, with attribute information covering name, category, address, and coordinates. The original GCJ-02 coordinate system is converted to WGS-84 using an affine transformation algorithm, which can meet the required spatial aggregation accuracy for analysis [27];
  • OSM road network construction: the road network topology is constructed based on the classification of OSM trunk, primary, secondary, and tertiary roads. As an open-source dataset under the Open Data Commons License, OSM offers cost-effective and legally mandated advantages. The network topology consistency is ensured by connectivity checking and suspended node cleaning [65];
  • Field validation: a stratified sampling method is used to verify the POI integrity and operational status of the 30 venues, and to identify temporal changes (e.g., seasonal closure of swimming pools) that are not recorded in the static database [66].
Using analytical tools such as Stata and ArcGIS, data from multiple sources were cleaned, standardized, integrated, and evaluated to calculate supply and demand for public sports venues in the urban area of Xi’an more accurately and objectively, with a focus on promoting sustainable urban development. Integrating different data sources helps to efficiently allocate urban resources, a key aspect of green infrastructure development in urban planning.
For urban spatial data collection, the main urban area was defined as the region within Xi’an Ring Expressway (Figure 2). Using data provided by the Xi’an Municipal Bureau of Natural Resources and Planning, subdistrict boundaries were delineated, and key urban spatial elements, such as the transportation network and ring roads, were mapped. Finally, a foundational spatial analysis base map of Xi’an’s urban area was established using the ArcGIS platform, which facilitates the incorporation of spatial information for the optimization of both sports venue distribution and low-carbon accessibility networks.

2.3. Data Processing

2.3.1. Accessibility Evaluation

The accessibility of public sports venues was quantitatively evaluated from the user’s perspective to assess the rationality of their distribution. The buffer analysis method is employed for accessibility calculations. Among the accessibility analysis methods, commonly used methods include the network analysis method based on shortest path estimation [67], the two-step floating catchment area method integrating supply and demand [68], the isochronous model based on time threshold [69], and the buffer zone analysis method for spatial coverage assessment. In this study, the buffer zone analysis method is chosen because of its computational efficiency advantage in large-scale urban scenarios and its ability to intuitively reflect the service coverage under low-carbon traffic constraints.
This method, widely used in geographic information systems (GIS), identifies potential influence areas or service radii of study objects and determines all spatial objects within these ranges. This method is especially important for ensuring that low-carbon transportation infrastructure and sports venues are accessible to all residents, a critical consideration in promoting sustainable urban lifestyles.
This study analyzed 6159 residential areas within Xi’an’s urban area. A distance decay model was applied, using a 15-min walking distance (1 km radius) as the buffer for public sports venues. Three levels of influence zones were defined based on distance: direct influence zone (1 km radius), indirect influence zone (2 km radius), and peripheral influence zone (3 km radius) [70].
The equation for the circular buffer is X X P 2 + Y Y P 2 R 2 . Here, ( X , Y ) represents the coordinate position of the public sports venue, and R is the buffer radius. According to Equation (1):
O i = x : d ( x , k i ) 1000 .
The 15-min walking coverage area (1 km radius) for each public sports venue in Xi’an’s urban area can be determined, where O i represents the set of all residential areas within a distance d of less than 1000 m from public sports venue k i . After determining the number of residential areas within a 1000-m radius of each public sports venue, the coverage ratio of the public sports venues is calculated as A i k ( O i , the number of residential areas covered by public sports venue k , divided by the total number O of residential areas in a given subdistrict). This value is then used to evaluate the accessibility index A i of public sports venues in the urban area. The formula is as follows:
A i = k n W k A i k .
Here, W k represents the weighted quantization coefficients for the number of public sports venues within the 1000-m radius, and n denotes the total number of predefined quantization scoring intervals [71]. Of these, W k is determined by the new indicator, the ESE coefficient. This indicator integrates the quantity of sports venues and the quality of service. The indicator system solves the problem of inconsistency between the supply side of infrastructure and the user experience through three weighted indicators: functional diversity (based on entropy assessment), time slot coverage (poi check-in data), and facility compliance (on-site audits).
The ESE coefficient framework is constructed through a three-round Delphi method [72], in which experts are required to assign relative weights to the number of other types of venues based on the correlation between the type and number of venues and the ability to provide service coverage to residents, using the service capacity of a single medium-sized venue as the baseline value of 1.0. A total of 15 experts and professionals from various fields (Table 3) were invited to participate, including 3 transportation experts, 2 urban planning experts, 2 geographers, 2 sociologists, 2 psychologists, 2 sports professionals, and 2 community workers. In the first round, 15 experts were solicited to rate the relative weights of the number of venues and service capacity. After mean value calculation, dispersion analysis, and case feedback correction, the final coefficients passed Kendall’s Coordination Coefficient Test (W > 0.71, p < 0.05), and the degree of expert consensus reached an acceptable level.
Based on their expertise and professional experience, the experts evaluated the impact of varying levels of public sports venue availability within a 1000-m radius on residential accessibility. The scoring results were then statistically analyzed to calculate the weighted quantization coefficients for the number of public sports venues within the 1000-m radius.

2.3.2. Equity Evaluation

Equity was represented by the per capita availability of public sports resources [73]. In equity analysis, commonly used methods include the Gini coefficient [74] to measure inequality in the distribution of resources, Lorenz curves [75] to visualize differences, and the Theil index [76] to decompose inter- and intra-regional differences.
Among these methods, the location quotient (LQ) [77] was chosen in this study to represent the ratio of the efficiency of effective coverage of sports venues in a specific area to the efficiency of effective coverage of sports venues in the entire study area. Due to the persistent and unpredictable nature of population movement, static data on the spatial distribution of residential areas were used as a proxy indicator for the dynamic distribution of the time-averaged population. The method quantifies the relative concentration of resources per capita in each subdistrict, and the construction of the indicator only requires basic statistical data, without the need for complex models or high-precision data. The formula is as follows:
L = A R / P R A S / P S ,
where:
  • L: LQ value of the spatial unit;
  • AR: Total Weighted number of residential areas served by sports venues in spatial unit R;
  • PR: Number of residential areas in spatial unit d;
  • AS: Total Weighted number of residential areas served by sports venues in the study area;
  • PS: Number of residential areas in the study area.
An LQ value greater than 1 indicates that the spatial unit’s per capita resources exceed the average, whereas an LQ value less than 1 suggests a deficit.

2.3.3. Urban Spatial Activity Evaluation

Urban spatial activity was assessed through a GIS-based Kernel Density Estimation (KDE) workflow. In spatial activity analysis, commonly used methods include hotspot detection based on local spatial autocorrelation [78], spatial interpolation [79], and density clustering based on grid cells [80]. Compared to these methods, KDE has been widely adopted due to its ability to model continuous spatial density distributions, its flexibility in weighting heterogeneous data, and its adaptability in balancing local details with global smoothing through bandwidth parameters. In this study, the KDE method is chosen for its ability to generate a continuous density surface through kernel functions, visually portray the spatial aggregation patterns of sports venues and population activities, and support dynamic threshold adjustment to identify multi-scale activation features, thus overcoming the limitations of traditional discretized analyses (e.g., grid statistics) that are sensitive to boundaries and difficult to use to quantify gradient changes.
The process began with data preparation involving the input of POI datasets of sports venues and population distribution into a geodatabase, followed by spatial alignment to the city boundary through projection transformation to WGS 1984 UTM coordinates and attribute normalization. During the KDE surface generation process, sports venues were weighted according to their ESE coefficients to reflect heterogeneous resource allocations in the density output. Subsequently, parameters are configured using Silverman’s rule of thumb to define the bandwidths of the two POI categories and cross-validated to ensure the optimal balance between local detail preservation and global smoothing. The KDE algorithm is then executed within the GIS platform to generate a continuous raster layer where pixel values represent activity intensity normalized per unit area—specifically, the sports venue kernel density reflects the spatial clustering of sports venues, while the population distribution kernel density quantifies the hotspots of population activity based on the residential POI distribution. Finally, the mismatch analysis was performed by subtracting the population distribution kernel density raster from the sports venue kernel density. Given the negative distribution characteristics of the original raster difference across the entire domain, a symmetrical and balanced distribution of the corrected data in the positive and negative intervals of the zero-value axis was ultimately achieved by expanding the numerical domain by applying a proportionality factor to the sports venue kernel density raster data. Positive values indicate oversupply due to too many sports venues in low-demand areas, and negative values indicate undersupply due to not enough sports venues in high-demand areas. This approach visually depicts the spatial heterogeneity of sports venue utilization and reveals the mismatch between citizens’ hotspots of demand and available infrastructure.

3. Results

3.1. Spatial Accessibility Analysis

This study analyzes the spatial supply status of public sports venues in Xi’an by calculating the accessibility indicators for various types of venues in the city. These indicators consider key factors such as the city’s geographical layout, road network topology, and OSM data to comprehensively assess the spatial supply of each public sports venue, with a focus on optimizing urban resources and promoting low-carbon mobility.

3.1.1. Spatial Accessibility Distribution of Large Public Sports Venues

Since most residential areas can only access one large public sports venue within the reachable range, the implementation of multi-level interval quantification is limited. To address this, the weight coefficient for the number of public sports venues was calculated using the expert scoring method, yielding a weight coefficient of 1.8. Based on this, the spatial distribution of accessibility values for large public sports venues was determined (Figure 3).
From the accessibility value distribution of large public sports venues, the following observations can be made:
  • The highest accessibility values for large public sports venues in Xi’an are concentrated in the central urban areas, with the accessibility value in Chang’an Road Subdistrict significantly higher than other parts of the city, indicating the highest level of sports venue supply in these areas.
  • A clear “supply gap” is evident, with high-accessibility regions occupying a relatively small area in the urban area, while regions with accessibility values lower than 0.19099 accounts for over 70% of Xi’an’s urban area.
  • The southern and central parts of Xi’an have higher accessibility values for large public sports venues compared to other regions. This is mainly due to the high-accessibility areas, such as Chang’an Road Subdistrict, Taiyi Road Subdistrict, and Changle Middle Road Subdistrict, being concentrated in the central and southern parts of the city. In contrast, the accessibility values in the northern subdistricts, like Xujiabao Subdistrict and Hancheng Subdistrict, are relatively lower, indicating substantial room for improvement in the supply of large public sports venues in the northeastern and southwestern parts of the city.

3.1.2. Spatial Accessibility Distribution of Medium-Sized Public Sports Venues

Within the reachable range of residential areas, the minimum number of medium-sized public sports venues accessible is 0, and the maximum is 2, making it difficult to accurately calculate accessibility values for multiple levels. Therefore, based on expert scoring, the weight coefficient for the number of public sports venues was calculated as follows:
  • If a residential area can access one medium-sized public sports venue within a 1000-m radius, the weight coefficient is 1.
  • If it can access two, the weight coefficient is 1.2.
The spatial distribution of accessibility values for medium-sized public sports venues was then calculated (Figure 4).
The results show:
  • The highest accessibility values for medium-sized public sports venues in Xi’an are found in small, localized areas around Changlefang Subdistrict, Changle Middle Road Subdistrict, and Taiyi Road Subdistrict. These areas are mainly concentrated in the central university campus zones, indicating that the supply of medium-sized sports venues is relatively adequate but not forming continuous regions.
  • The “high-index” characteristic does not show a clear correlation with Xi’an’s urban spatial layout, and the distribution appears to be relatively scattered, indicating a lack of systematic urban planning for the supply of sports venues in the city.
  • There are large “low-accessibility” areas for medium-sized public sports venues. Specifically, a diagonal “supply gap” extends from the Baqiao Subdistrict in the northeast to the Yuhuazhai Subdistrict in the southwest, creating a large area with low accessibility values.

3.1.3. Spatial Accessibility Distribution of Small Public Sports Venues

When assessing the weight coefficients for small public sports venues in Xi’an, it is important to note that these venues are widely distributed across the city with significant regional variation. The number of accessible small public sports venues in different residential areas ranges from 0 to as many as 6. During expert scoring, when the number of small public sports venues in a residential area exceeds 4, the expert scoring on the impact of venue numbers on residential accessibility showed little variation. Based on the Jenks Natural Breaks classification method, this study divided the quantization intervals into five levels according to the number of small sports venues accessible within a 1000-m radius. The weight coefficients for each level are shown in Table 4. Using this method, the accessibility values for small public sports venues were calculated (Figure 5).
The results reveal:
  • The “high-index” areas for small public sports venues are still concentrated in the central urban areas of Xi’an, with the highest accessibility values found around Ziqiang Road Subdistrict and Hujia Temple Subdistrict. The surrounding areas also show noticeably higher accessibility values, though they have not formed contiguous regions.
  • The accessibility values in the outer suburban areas remain low, but a linear correlation with the urban spatial structure of Xi’an’s development can be observed. In the peripheral areas, such as the Daminggong Subdistrict and the Shilipu Subdistrict, the accessibility values begin to decline. In more distant regions, such as the Baqiao Subdistrict and the Yuhuazhai Subdistrict, the accessibility values remain very low. This indicates that the farther from the city center, the lower the supply of small public sports venues, which suggests a need for targeted resource optimization in suburban regions.

3.2. Equity Analysis of Public Sports Venues

This study combines the distribution density of public sports venues in Xi’an, the urban spatial structure, and the population distribution data, using the LQ method for analysis. It reflects the distribution characteristics of per capita public sports venue resources in Xi’an, i.e., the ratio of the efficiency of effective coverage of sports venues in a specific area to the overall average efficiency of effective coverage of sports venues in the entire study area. This approach visually presents the social equity performance in Xi’an, while also revealing the spatial disparities in the supply of public sports venues in the city’s urban areas, which are critical for low-carbon urban development and inclusive infrastructure planning.
The analysis reveals the following findings:
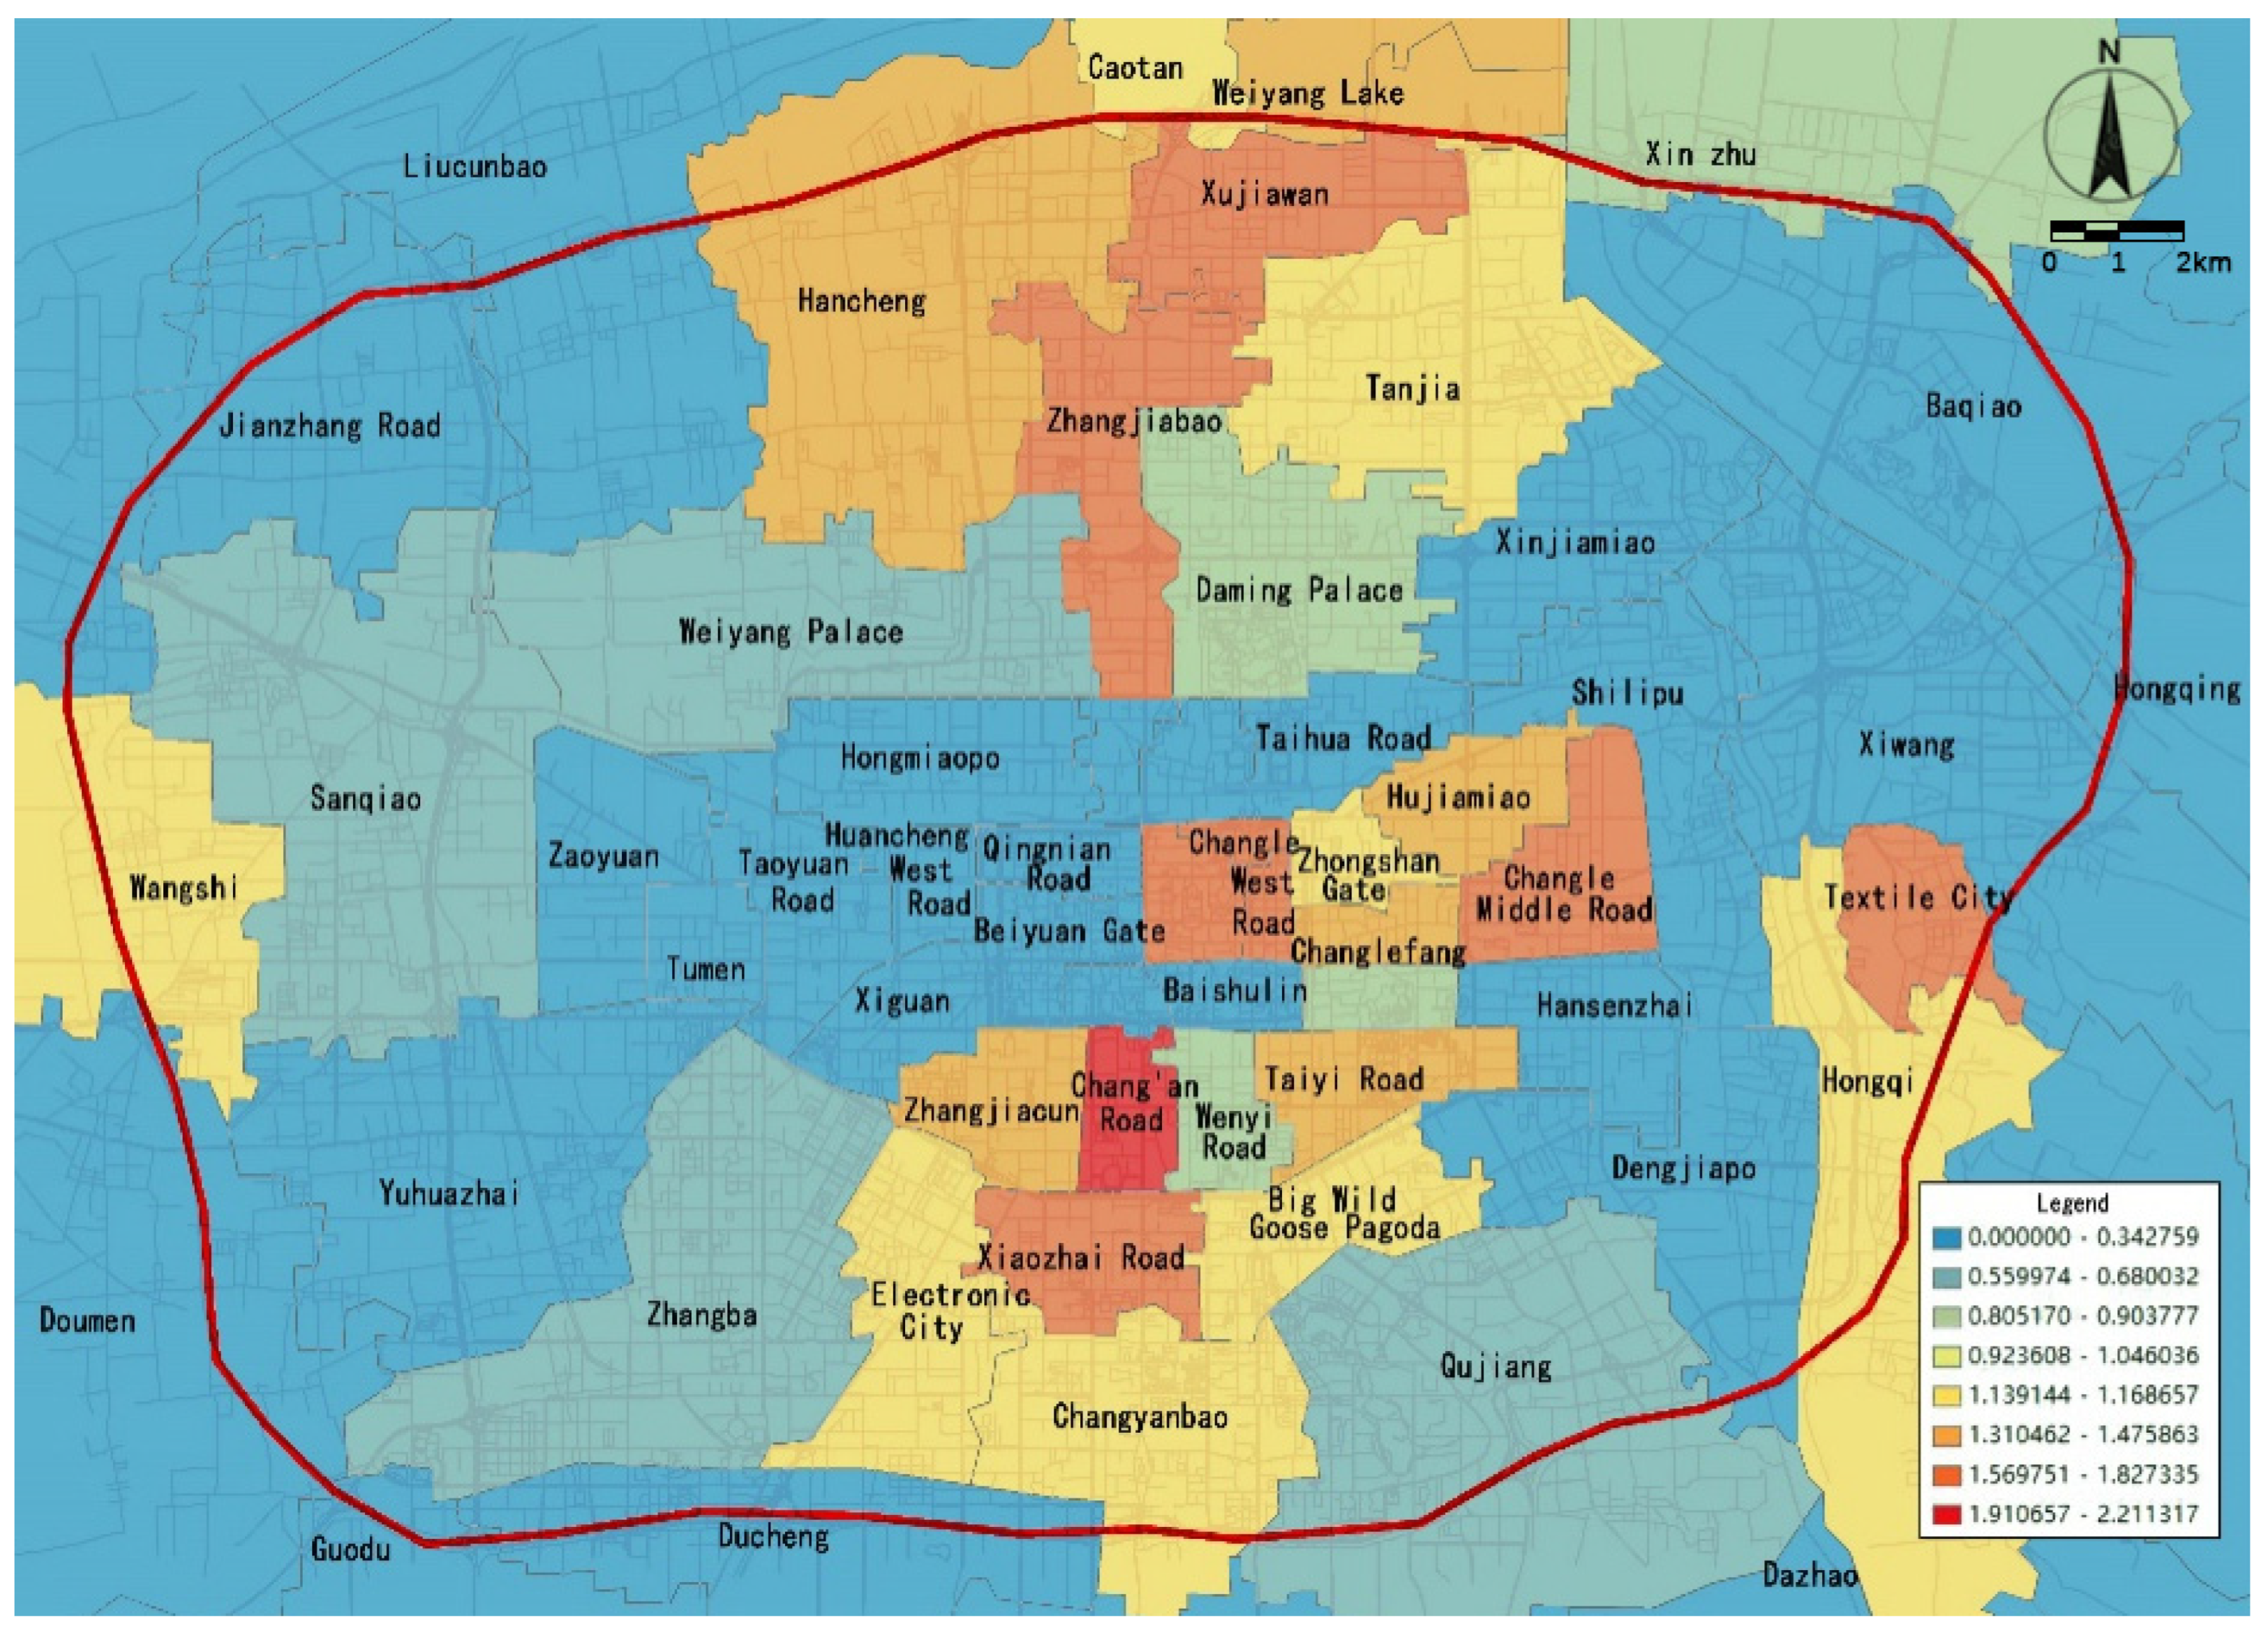
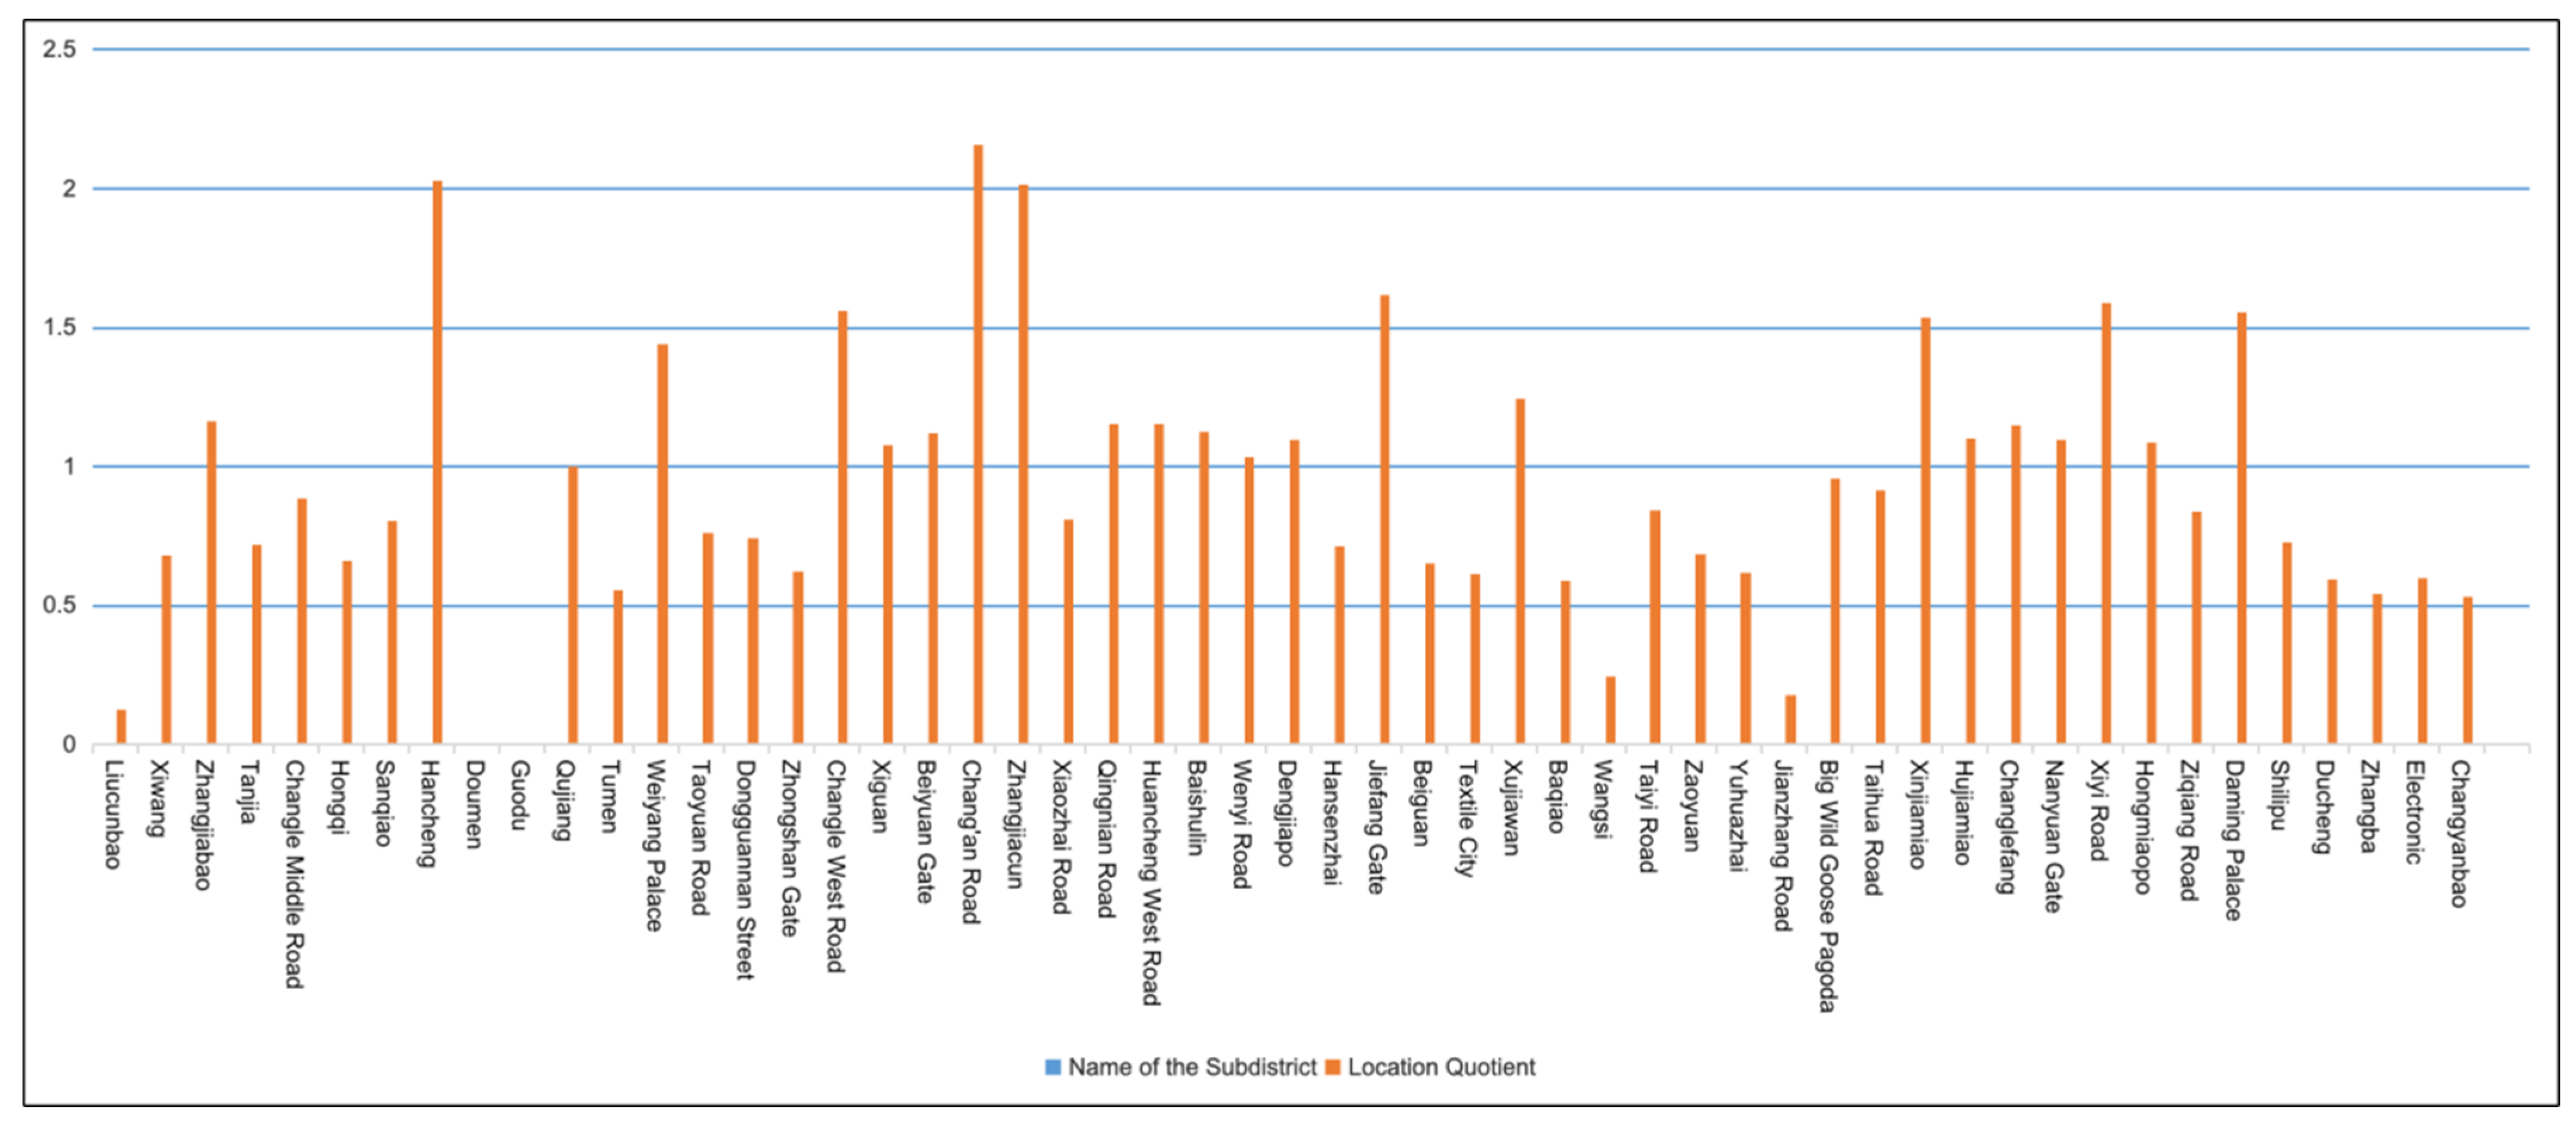
  • The distribution of various public sports venues per person in each district of Xi’an is characterized by a dual-core agglomeration: Hancheng Subdistrict (LQ = 2.030057833) and Chang’an Road Subdistrict (LQ = 2.156793218), mainly because these two districts have two large city-level sports venues, Xi’an City Sports Park and Shaanxi Sports Center, respectively.
  • The level of per capita access to sports resources is generally higher in the urban center than in the urban fringe. The distribution of per capita access to various public sports venues in Xi’an exhibits a dual-core aggregation pattern. The LQ values in areas such as Jiefangmen Subdistrict (LQ = 1.618309202), Xiyi Road Subdistrict (LQ = 1.587673487), and Changle West Road Subdistrict (LQ = 1.560050071) are generally higher than those in the urban fringe, mainly due to the concentration of a large number of small public sports venues in these areas. These regions are geographically central to Xi’an, and the area of Xi’an has a high concentration of small public sports venues.
  • The LQ values in the northern subdistricts, such as Zhangjiabao Subdistrict (LQ = 1.163333129), are also relatively high, indicating a higher level of per capita access to public sports venues. This is largely because urban construction in these areas has accelerated in recent years, improving the supply of sports venues.
  • The secondary center aggregation trend is not very apparent. Except for the core areas with extremely high distribution density, only areas like Changle Middle Road Subdistrict (LQ = 0.887824839), Hujia Temple Subdistrict (LQ = 1.099788759), and Hansenzhai Subdistrict (LQ = 1.618309202) show relatively high index regions. The reason for this phenomenon is mainly due to the poor infrastructure and support in the urban subdistricts.
On the other hand, although the LQ values in areas such as Taoyuan Road Subdistrict and Hongmiao Po Subdistrict are not very low, the distribution of public sports venues in Xi’an’s urban areas has not formed an equitable spatial allocation (Figure 6).

3.3. Spatial Activity Analysis of Public Sports Venues

The spatial activity of public sports venues was assessed using kernel density estimation (KDE) based on POI data of venue and population distribution, clearly revealing supply–demand characteristics in Xi’an. It can be reflected in the kernel density analysis map of POI data:
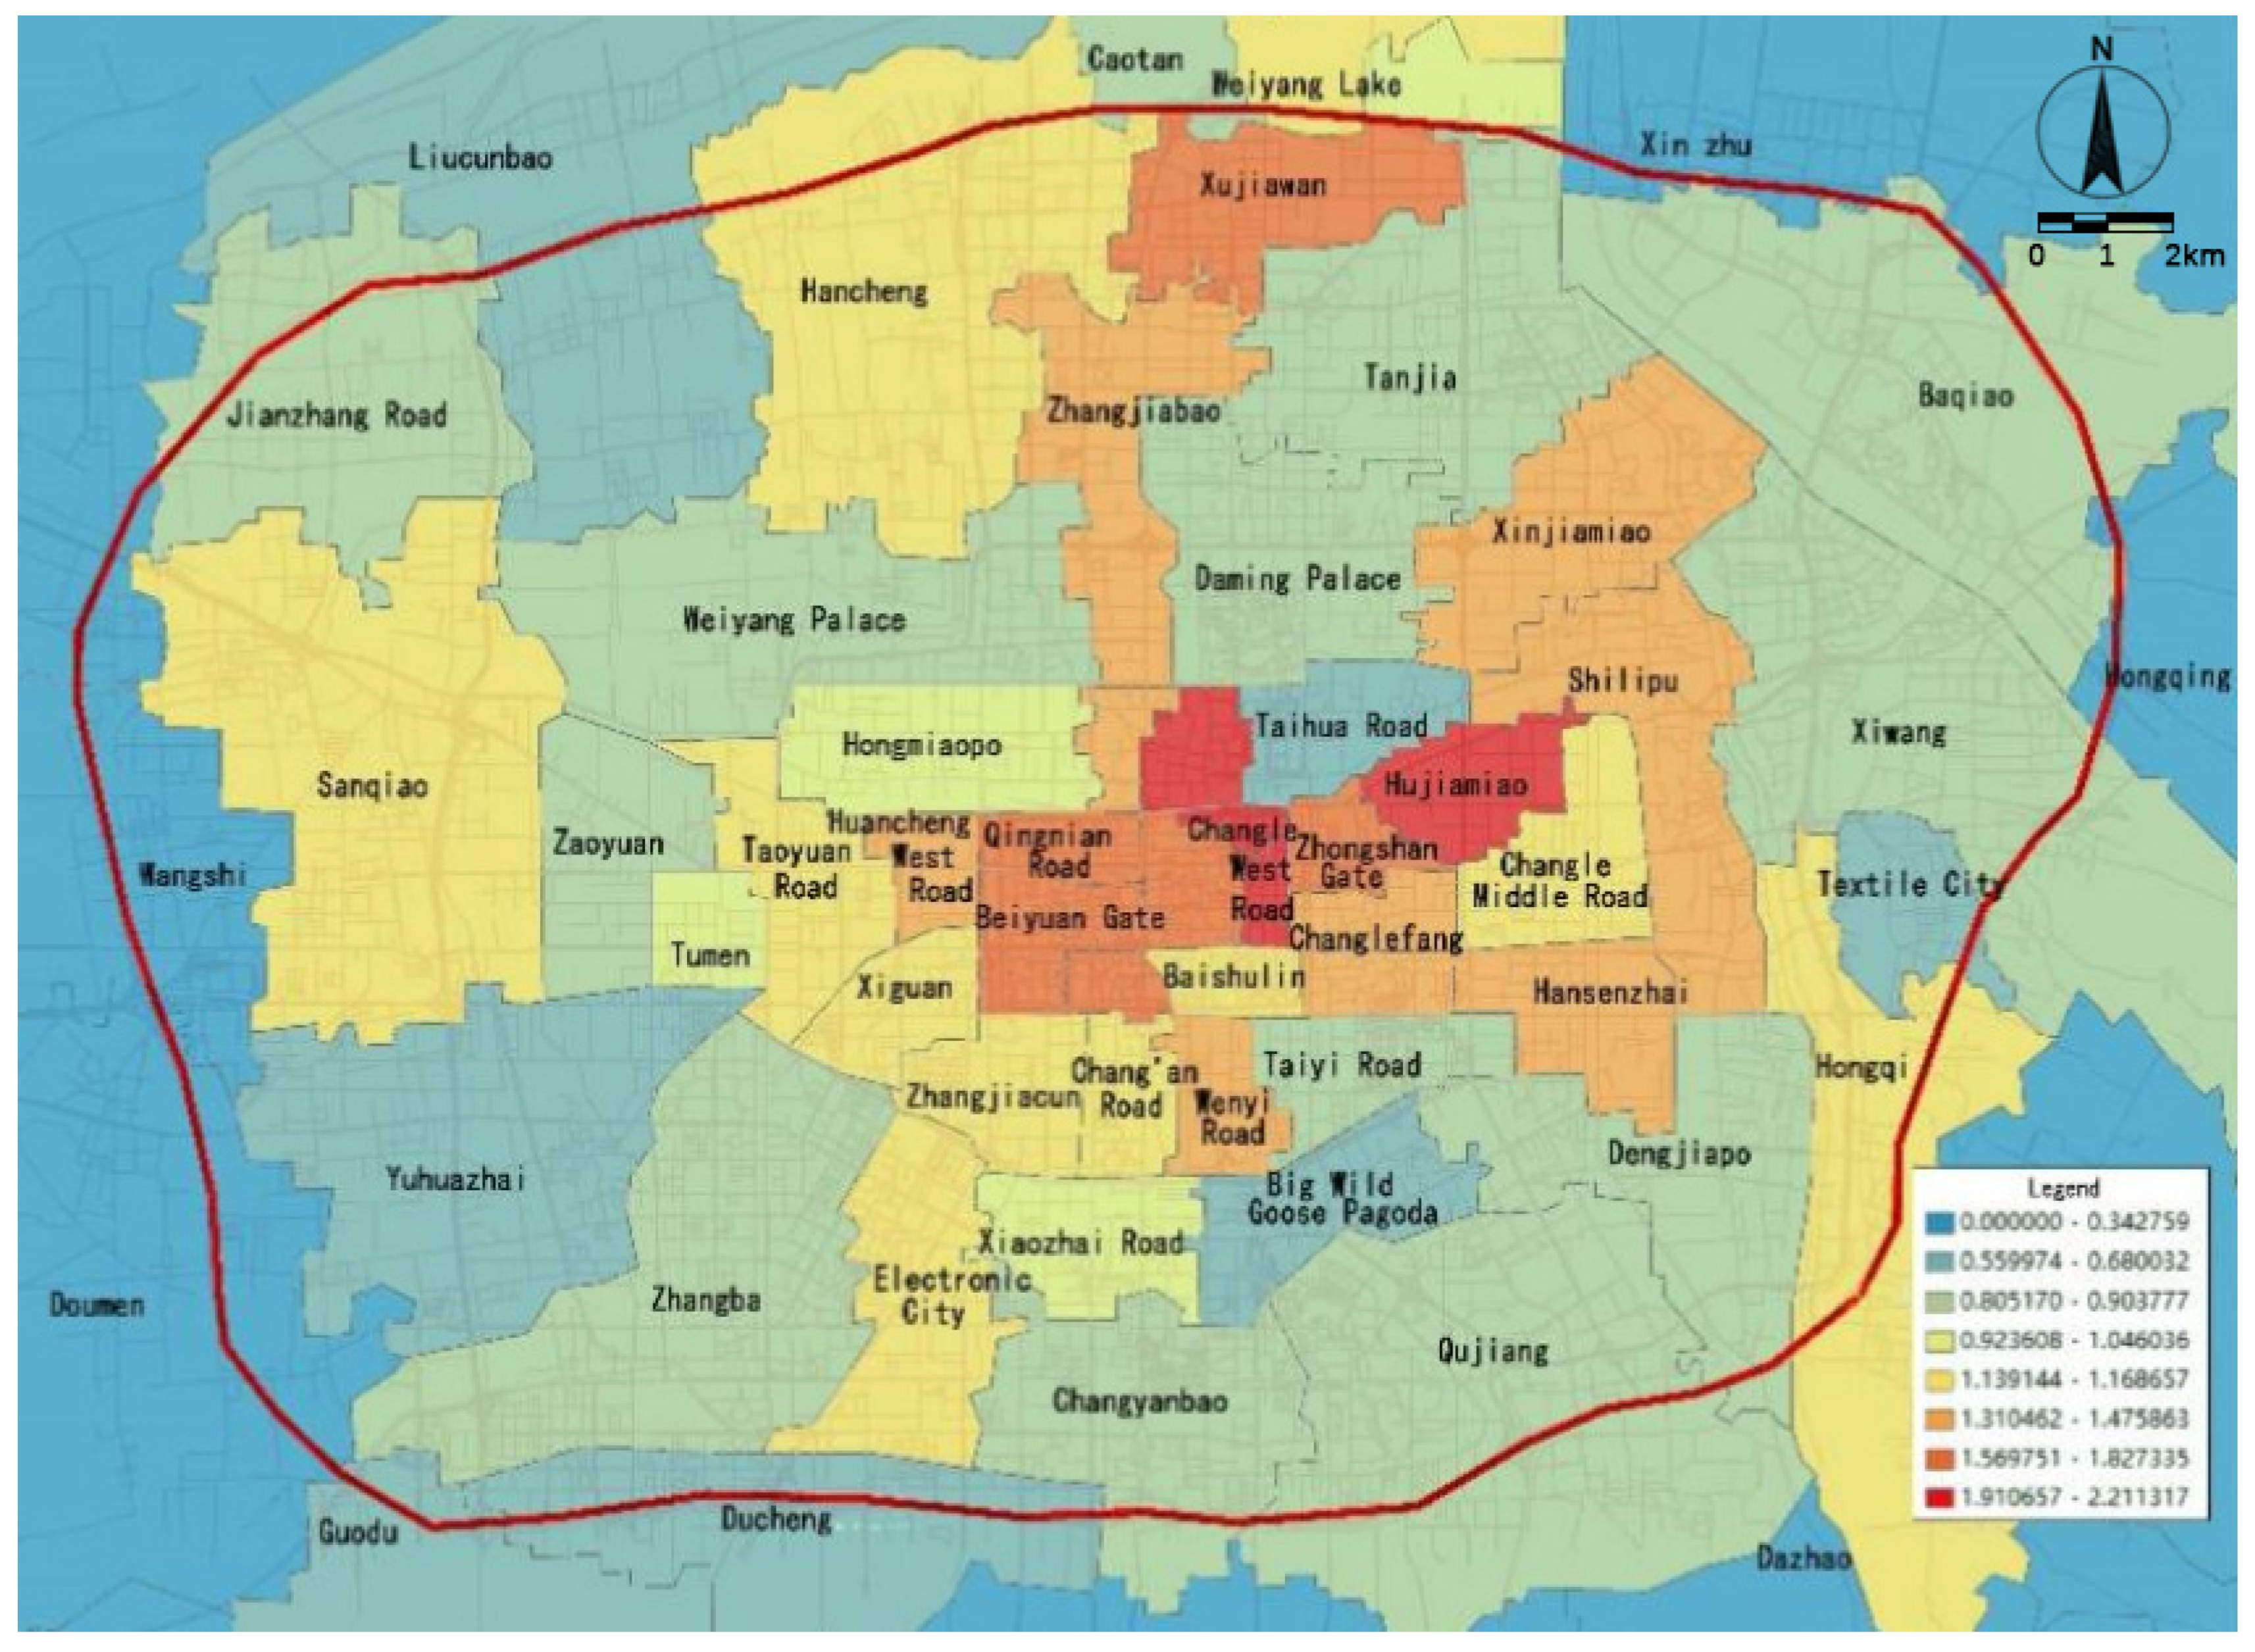
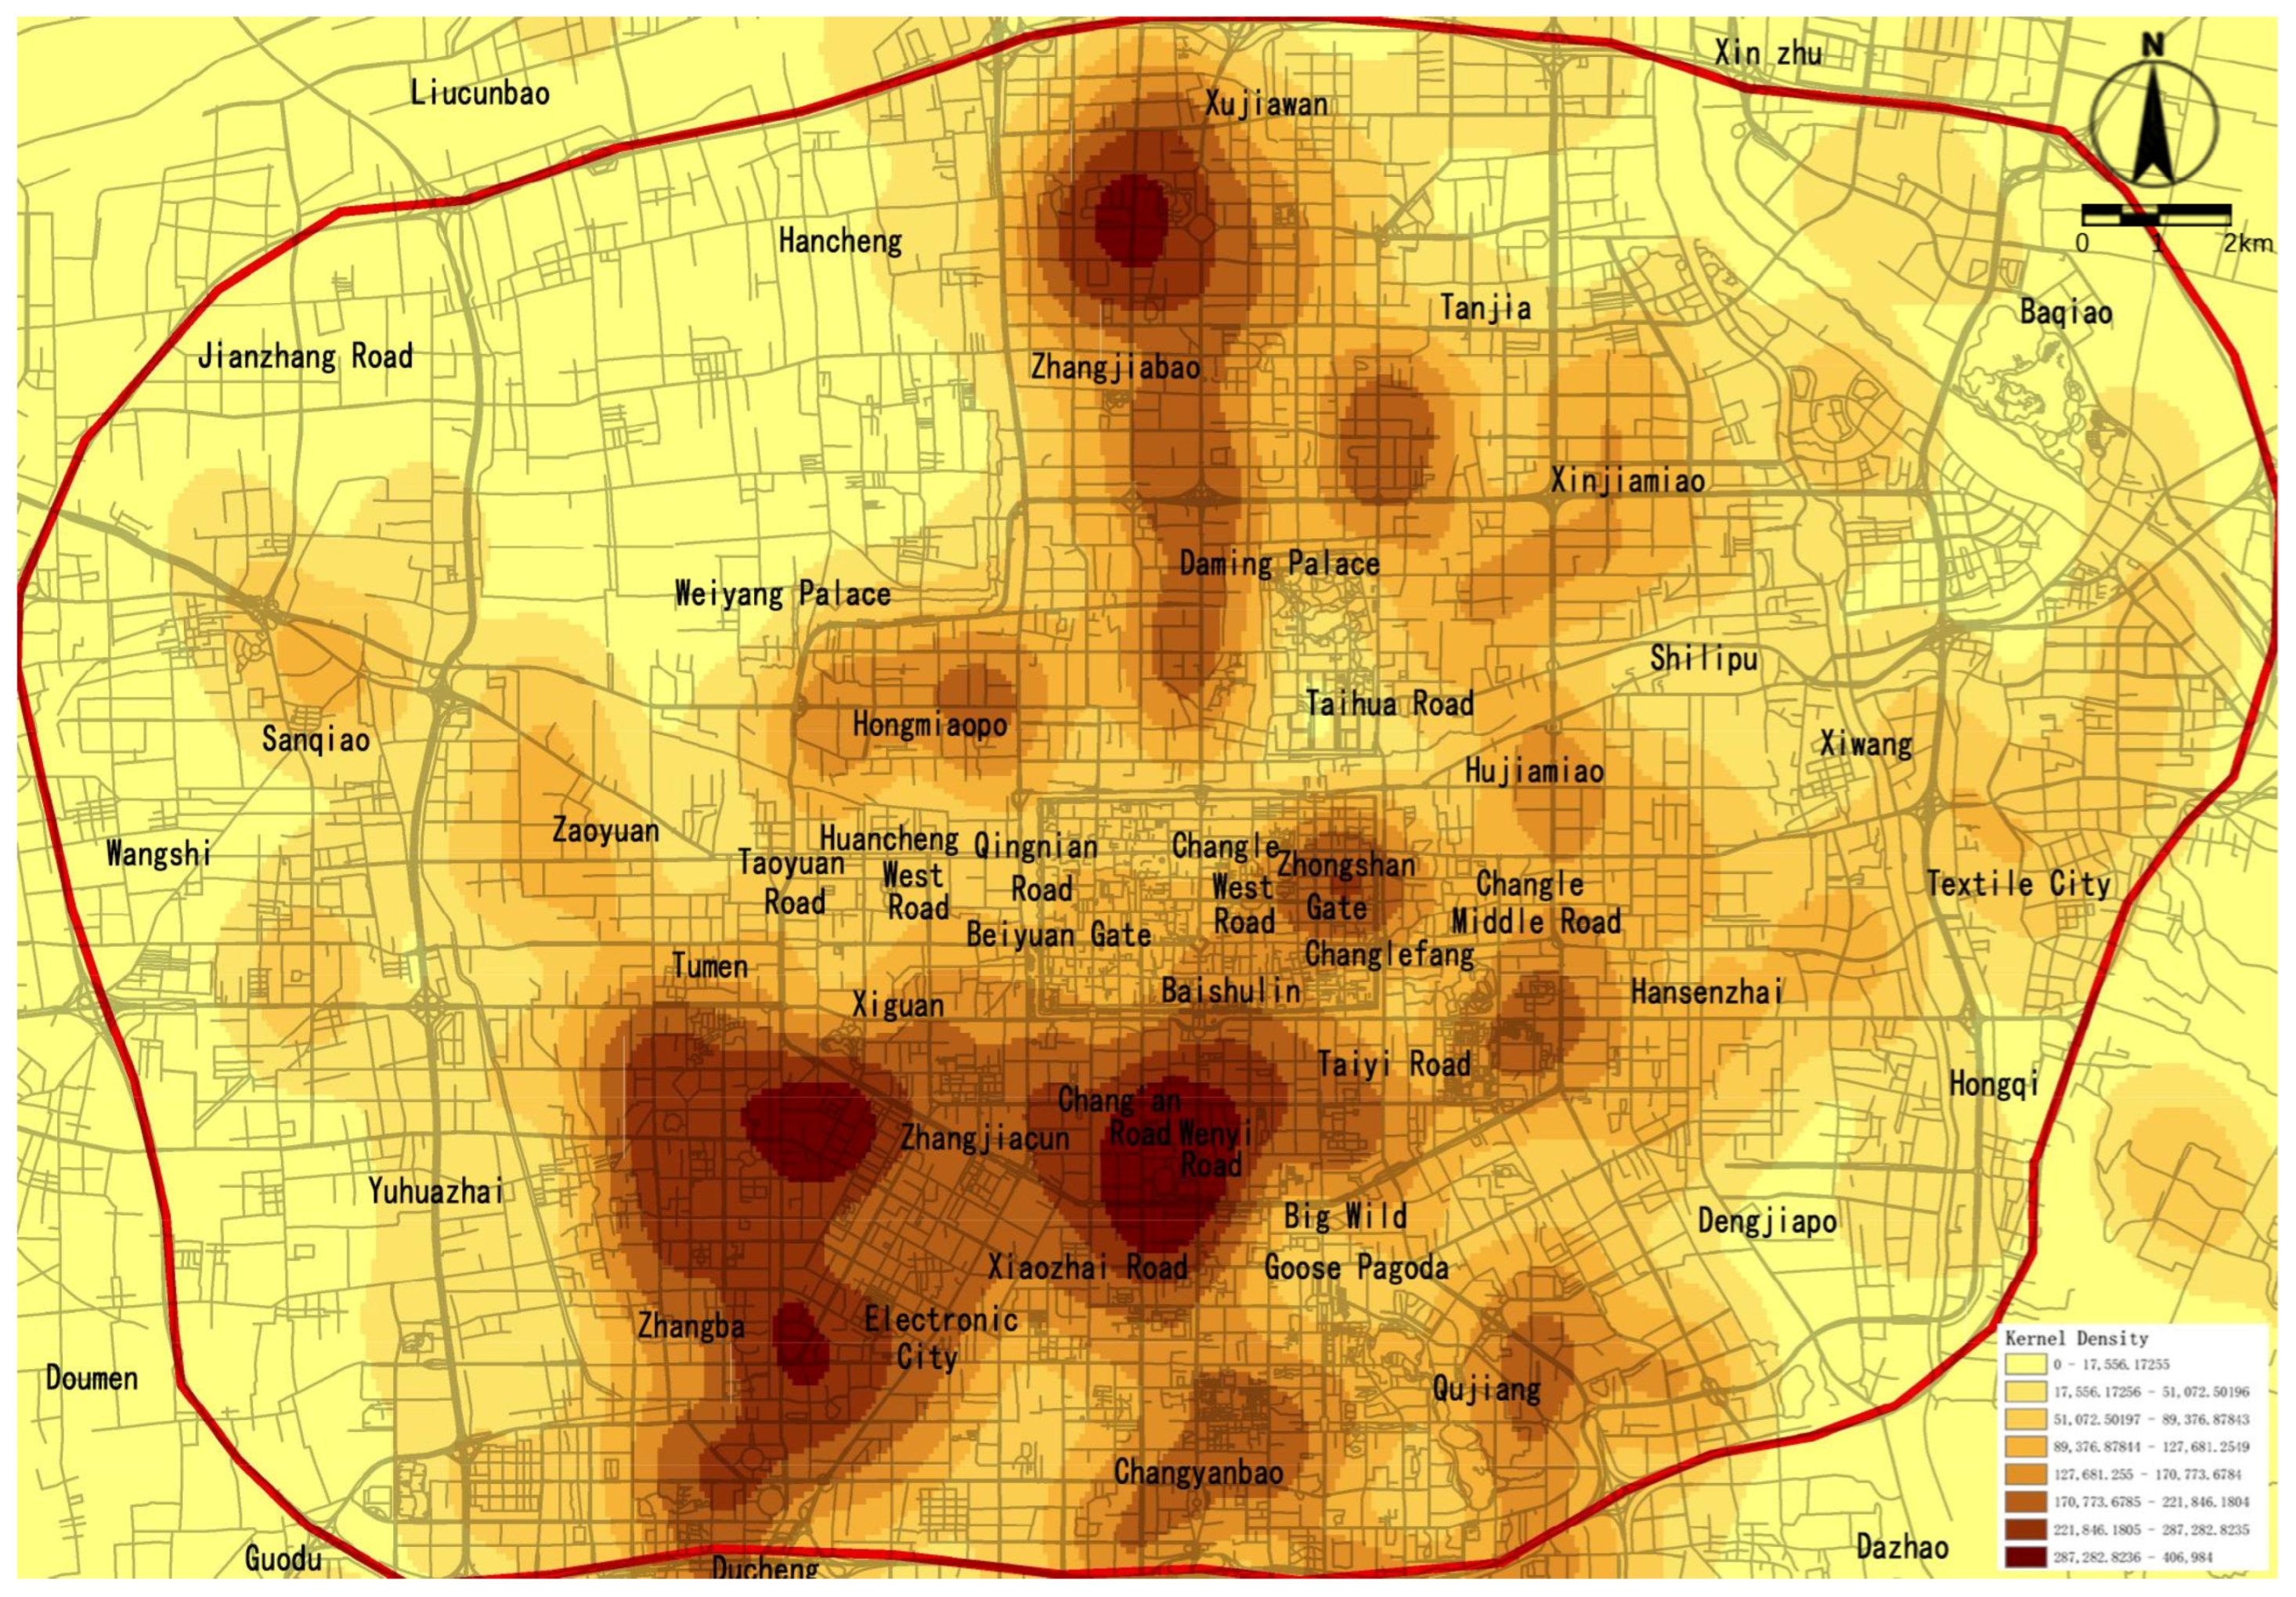
  • The kernel density of sports venues presents a concentrated and continuous distribution characteristic (Figure 7), with obvious agglomeration benefits, which is distributed along the urban traffic arteries in the main urban area of Xi’an on the one hand, and in the areas with high active population density and residential density on the other hand, such as Chang’an Road subdistrict, Zhangjiacun subdistrict, Zhangjiaobao subdistrict, Electronic Subdistrict, Changle West Road Subdistrict, Xiaozhai Road Subdistrict and other areas, and show spatially continuous agglomeration areas, so the supply within these agglomeration areas is more adequate compared to other areas in the urban area;
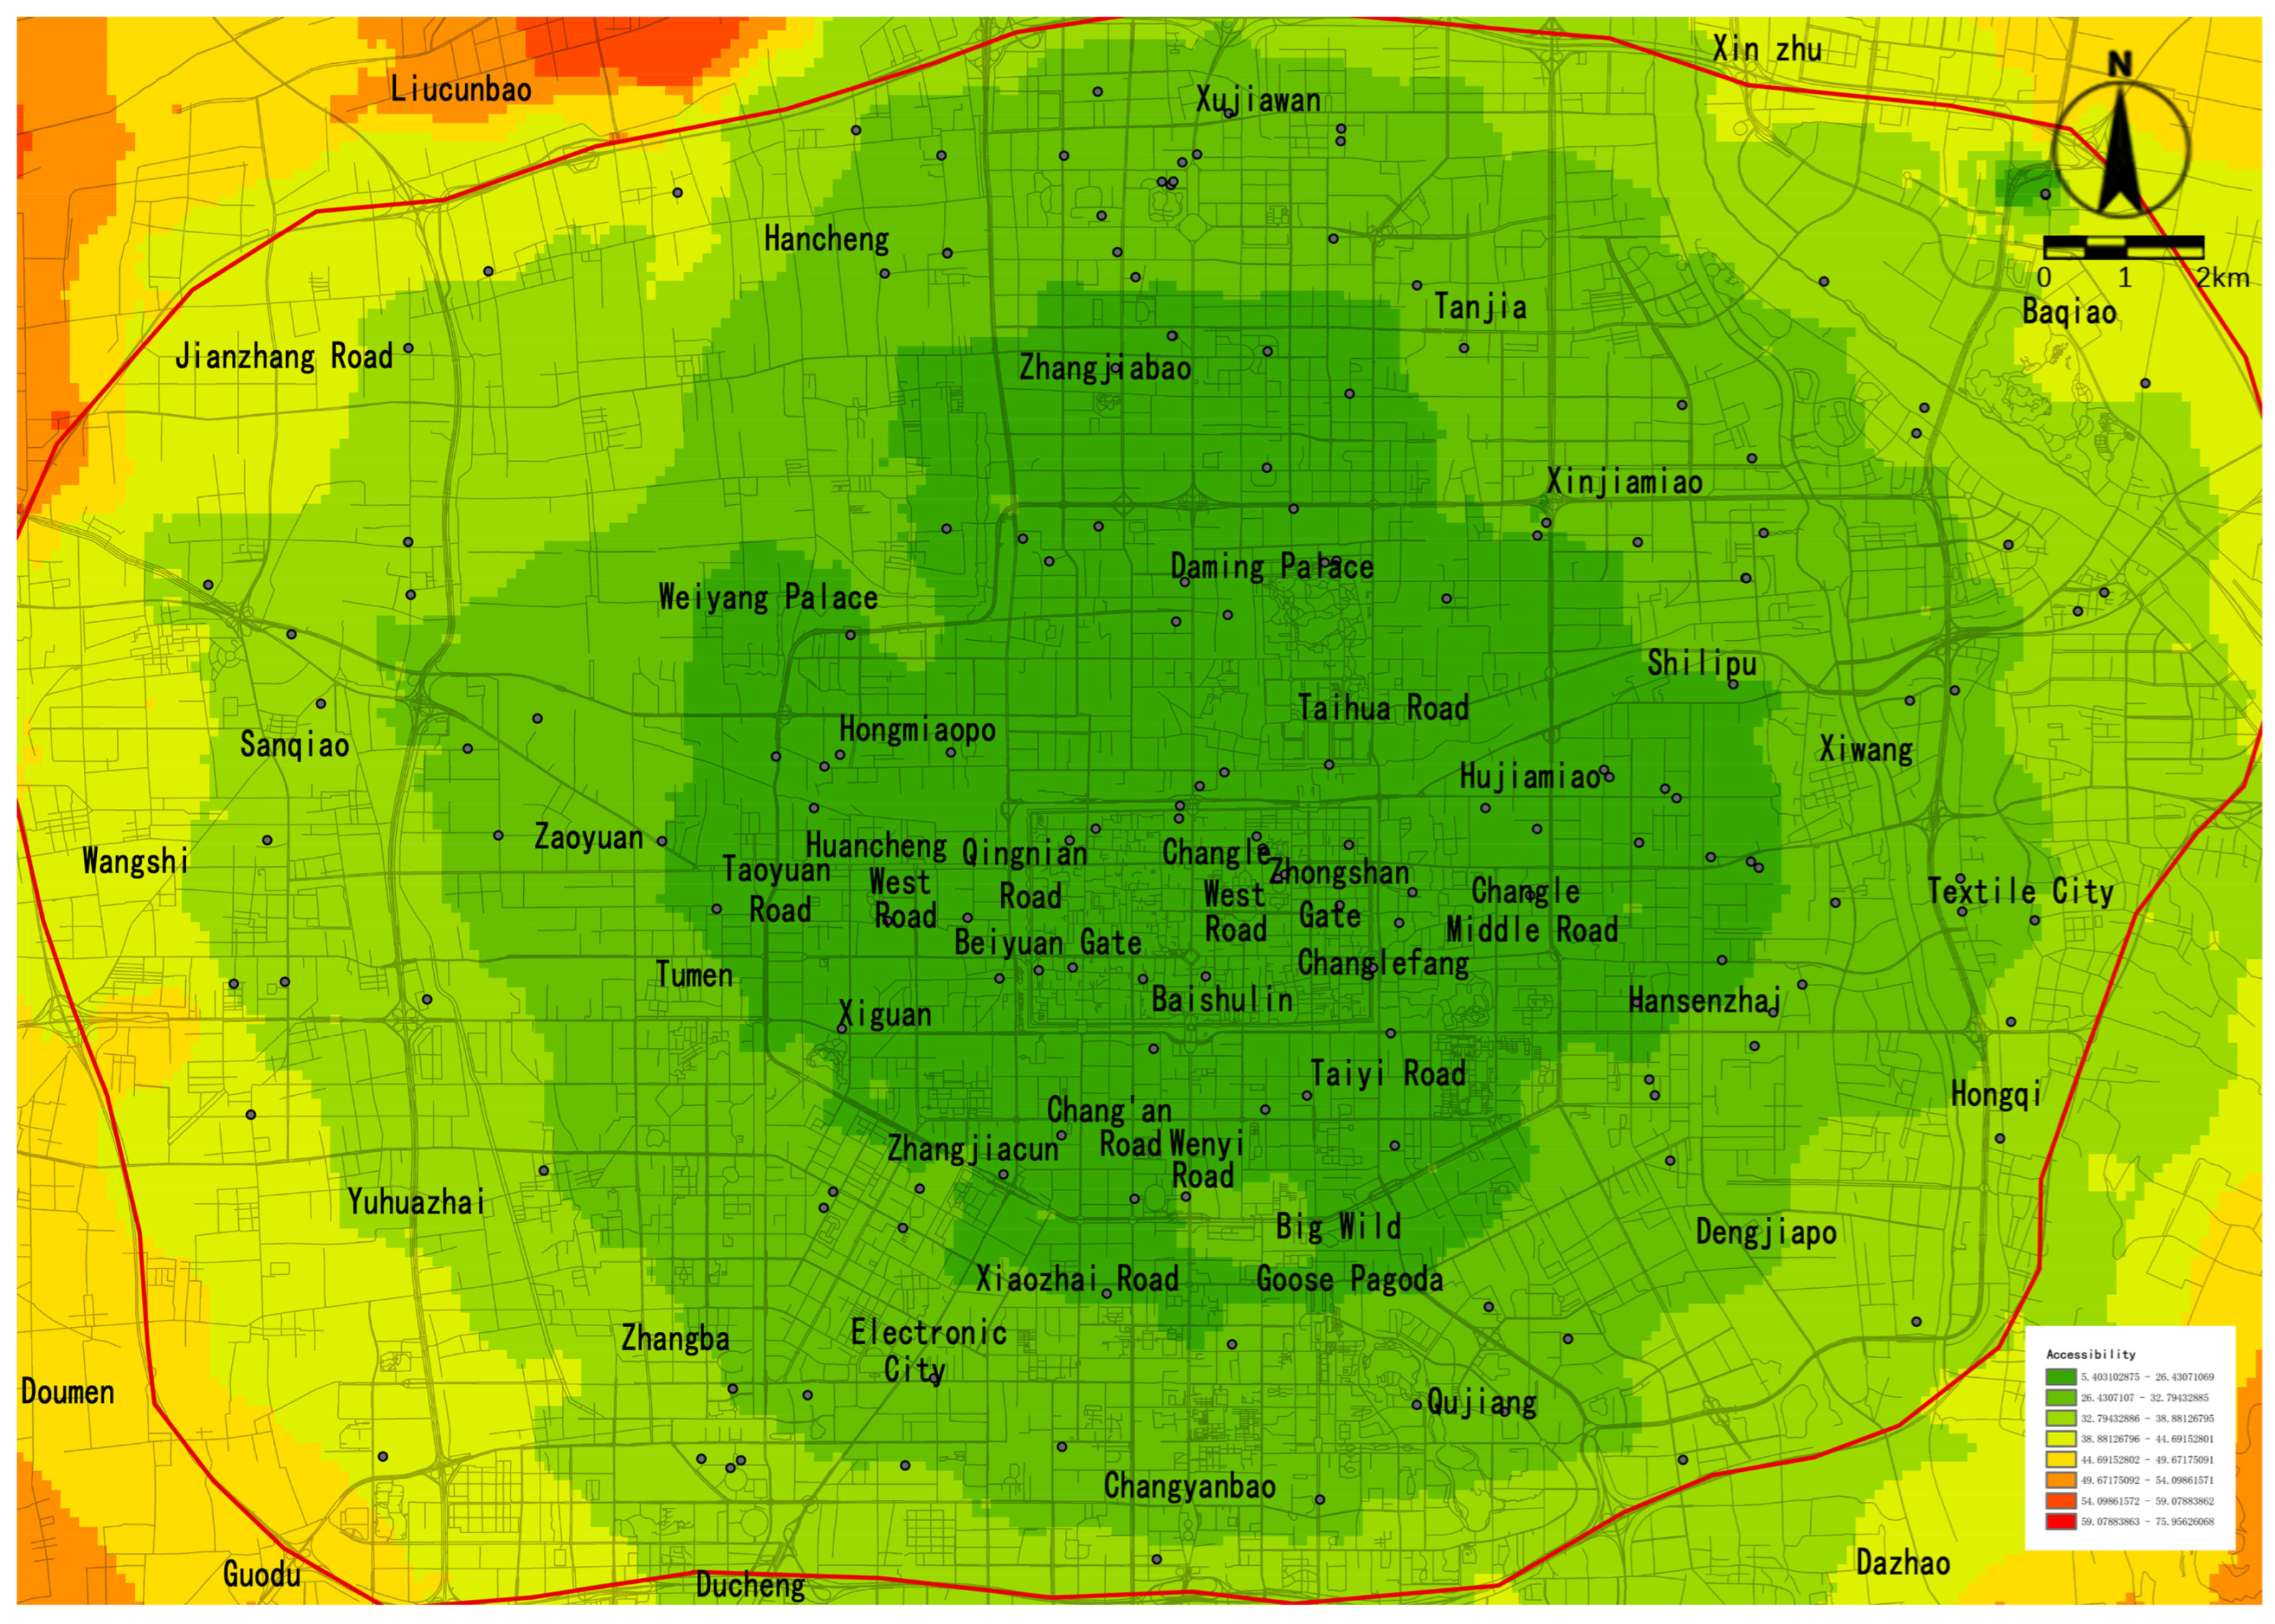
  • The kernel density of population distribution shows the characteristic of orderly radial dispersion from the center, with a clear trend of attenuation from the city center to the outside. Looking at the core agglomerations in the main city that exhibit outward dispersion characteristics, it can be seen that the demand for sport and physical activity is decreasing accordingly as the spatial location moves outwards (Figure 8). It can be understood that the demand for sports activities is gradually decaying the further outward the urban space goes, which can find a corresponding correlation with the order of urban space and population expansion.
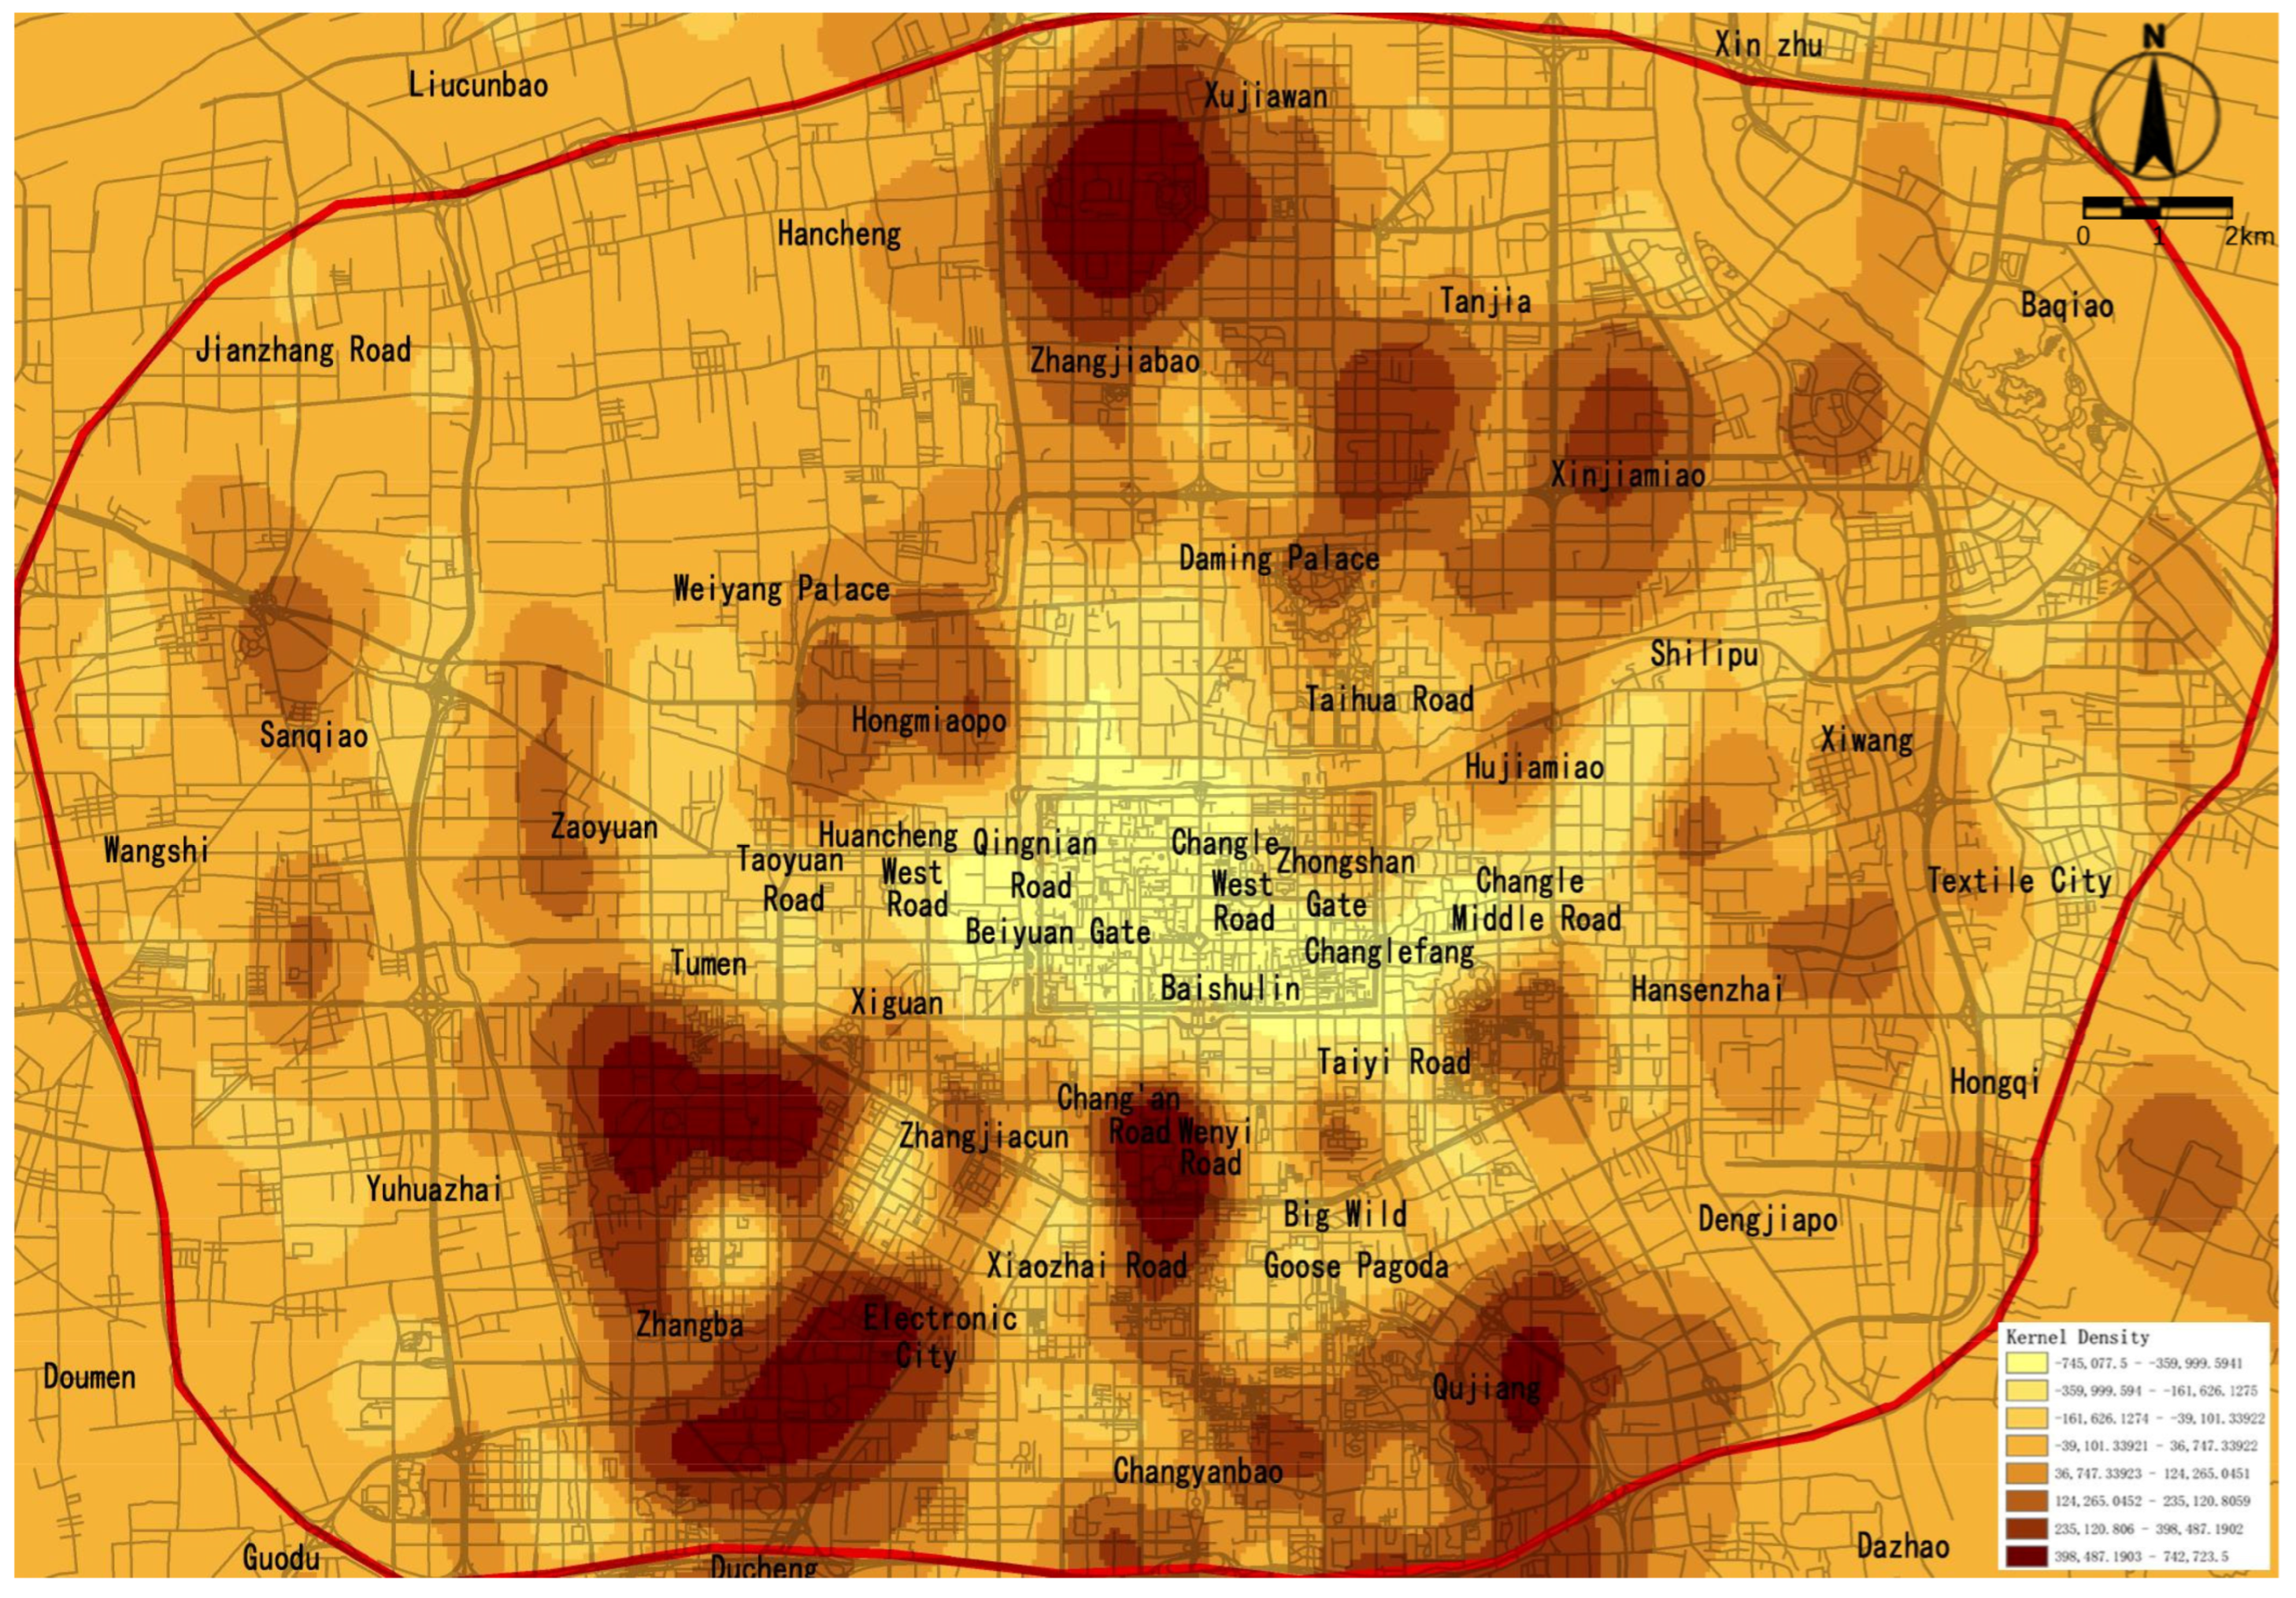
  • The activity difference data (Figure 9) was obtained through the difference analysis between the kernel density of sports venues and the kernel density of population distribution, which can more intuitively reflect the areas where the supply and demand of sports venues are mismatched. Among them, Chang’an Road Subdistrict, Wenyi Road Subdistrict, and Zhangjiabu Subdistrict are oversupplied due to the larger number of sports venues, while Zhangba Subdistrict, Qujiang Subdistrict, and Xinjiamiao Subdistrict are oversupplied due to the low density of the population distribution; whereas, in the two larger areas in the east and west of the city, it is the insufficient supply of sports venues that leads to a mismatch with the demand.

4. Discussion

4.1. Spatial Accessibility Evaluation

The study shows that there are significant regional differences in the spatial allocation and accessibility index distribution of small, medium, and large sports venues in the main urban area of Xi’an. A network dataset was constructed through the following procedures on the ArcGIS platform: First, dangling node errors and pseudo node errors were corrected through topology checking, with differentiated access speed attributes assigned to trunk roads (60 km/h), primary roads (50 km/h), secondary roads (40 km/h), and tertiary roads (30 km/h) in compliance with the Regulations for the Implementation of the Road Traffic Safety Law of the People’s Republic of China. Subsequently, minimum time impedance paths from road nodes to venues were calculated using the Origin–Destination Cost Matrix. Finally, the heat map of accessibility spatial distribution was generated through inverse distance weight interpolation. Overall, the distribution of sports venues presents a structural characteristic of high in the core and low in the periphery (Figure 10). As the hub of public sports venues, the core area of the city has a high concentration and density of venues with high accessibility, while the peripheral area of the city shows a large low-value area, with the accessibility of some areas close to zero.
The formation of this discrepancy stems from the early stages of Xi’an’s development, when most sports venues were concentrated in the city center, forming a public service provision model centered on the core area. However, with the acceleration of urbanization in Xi’an, industries and residential areas gradually expanded outward, while the construction of sports venues failed to keep pace with urban expansion, resulting in a mismatch between supply and demand in some areas.
At present, cities in China, including Xi’an, generally lack the scientific tools to accurately assess the needs of the population in specific areas and the needs of the city during the early stages of construction, renovation, and renewal of sports venues. This lack leads to improper positioning at the decision-making stage of the project, which greatly affects the construction benefits of the venues, mainly due to the following reasons:
  • The current planning guidelines are mostly based on the total number of urban sports areas and the total population [81] and do not fully consider the current distribution of urban residential areas and the travel needs of residents, resulting in a lack of targeting of the planning of venue resources.
  • Most of the sports venues in China, including Xi’an, are unable to accurately meet the needs of society, resulting in the contradiction between the functional positioning of the venues and the growing and diversified needs of the residents, which is mainly reflected in the fact that the scale of the service supply, the type of the service supply, and the quality of the service supply of the venues are unable to meet the needs of the regional populations.
  • The lack of scientific assessment of the utilization and construction status of the venues has made it impossible to proactively promote the functional iteration of the venues, resulting in the venues gradually lagging behind the needs of the city and its residents after a certain period after their completion.
To cope with the above problems, Xi’an should strengthen policy guidance, formulate more scientific planning guidelines [82], and promote the synchronization of venue construction with urban spatial development to meet the growing demand for sports and fitness among residents. The city should also vigorously promote the incremental construction of sports venues in areas with low accessibility to fill the resource gaps. Meanwhile, Xi’an, an old industrial city in China, has a large number of unused industrial plants and other stock buildings. In the future, Xi’an should prioritize the realization of multiple enhancements in the supply of sports venues through the rational transformation of the existing stock of large-space building resources [83].

4.2. Spatial Equity Evaluation

The spatial equity of sports venues in the main city of Xi’an shows significant regional differences. The LQ value of each spatial unit ranges from 0 to 2.156793218, showing serious polarization and the phenomenon of “double-core agglomeration”. This result reflects the imbalance in the distribution of per capita resources for sports venues in different regions and reveals the problem of equity in resource allocation.
The imbalance in the allocation of sports resources in Xi’an mainly stems from the uneven spatial supply of sports resources in the city. Old sports venues are mostly concentrated in the core areas of built-up areas, making it difficult to meet the demand for equalization and fairness. The number of venues is insufficient, and the speed of new construction lags behind the speed of urban expansion, especially in Xi’an, where college venues account for a disproportionately high percentage of venues, and the number of social sports venues is relatively small. The main reason:
  • This discrepancy is closely related to the rapid expansion of urban space in the past decade. The construction of sports venues tends to be concentrated in specific areas; for example, the two major sports centers in the study area concentrate a large number of large-scale sports venues and related facilities, leading to a significantly higher level of resource allocation in these areas than in other areas, while there is an obvious lack of resource supply in the peripheral areas.
  • Insufficient coordination between venue distribution and urban space. For a long time, cities in China, including Xi’an, have lacked holistic planning and consideration of the equity of urban spatial resources in the construction of sports venues. The directionality of development policies has further exacerbated the imbalance in the distribution of venues, failing to fully realize the role of venues as public products. This incoherence has also led to a contradiction between the overall service provision of sports venues and the size of the growing sports and fitness population.
This unbalanced distribution of resources limits the convenience of residents’ participation in sports activities and constrains the development of socially inclusive infrastructures, which is contrary to Xi’an’s vision of building a strong sports city. Therefore, future urban planning should emphasize the fair distribution of sports venues in urban spaces, and increase the supply of sports venues in areas of the city where they are scarce to ensure a balanced distribution of resources [84]. At the same time, the transportation connection should be strengthened to ensure an effective connection between sports venues and various modes of transportation through the optimization of venue location and transportation planning, to enhance the evenness of the venues [85].

4.3. Spatial Activity Evaluation

The trend of matching the supply and demand of public sports venues in Xi’an is closely related to factors such as high population density, traffic accessibility, road network density, and urbanization level in the city center area. From the urban spatial characteristics presented by various types of kernel density indicators, the spatial activity of sports venues and the population distribution is higher in the city center area and shows a multi-directional uneven decay trend, which leads to a mismatch between the supply of sports venues and the demand of residents in the urban area.
The spatial activity problem of sports venues in Xi’an mainly stems from the following aspects:
  • Functional positioning of sports venues is single. To meet the demand for various types of events, some of the newly built venues pay excessive attention to the construction of high-standard event venues, ignoring the feasibility of post-game civic transformation, which leads to the difficulty of post-game function conversion, and there is a mismatch between the occupancy rate of the venues’ resources and their spatial activity. For example, although Chang’an Road Street and Zhangjiaobao Street are rich in venues, some large venues are mainly used for large-scale events, and their spatial compatibility is insufficient, resulting in a certain degree of excess and waste of resources.
  • Mismatch between supply and demand of venue resources. Venue resources are concentrated in the city center, but the supply of resources in the peripheral areas is insufficient, reflecting that the speed of new construction is lagging behind the speed of urban expansion. About 27% of streets (e.g., Wangsi Street and Jianzhang Road Street) show a significant lack of spatial activity of sports venues, reflecting that the speed of urban expansion is faster than the speed of venue construction.
  • Problems in the operation and management of sports venues. The operation and management concepts of sports venues in Xi’an are lagging, and the lack of systematic and forward-looking operation concepts has a direct impact on the service level and operational efficiency of the venues in the process of utilization, resulting in a waste of resources and a shortage of sports resources for the residents. For example, a large number of sports venues in Xi’an are located on university campuses, and in recent years, universities have tightened the management of entry and exit, making it more inconvenient for urban residents to enter the campus, which has led to the lack of spatial activity in densely populated areas, such as Taiyi Road Street.
In the future, Xi’an should design sports venues that can meet the needs of multiple sports programs and have multi-functionality to improve the efficiency of resource utilization. Adaptive reuse of existing venues [86] will improve spatial compatibility and optimize existing space, reducing the environmental impact of new construction and conforming to the principles of the circular economy. This will not only effectively meet the growing demand for sports activities from residents but also promote Xi’an’s transformation into a green city. At the same time, updating operational concepts [87] and introducing dynamic analysis tools will improve the service level and economic and social benefits of the venues.

5. Suggestions

5.1. Strengthening the Incremental Construction of Public Sports Venues in Low-Supply Areas of Xi’an

5.1.1. Improving the Coverage Rate of Public Sports Venues

Currently, the low-accessibility areas of public sports venues in Xi’an are primarily concentrated in the peripheral zones of the urban area. Future urban planning should prioritize multi-source data and make full use of the Xi’an Overall Territorial Spatial Plan (2021–2035), which supports the city’s development strategy of ‘developing to the west and expanding to the east’ to set clear optimization goals and construction plans tailored to each subdistrict’s unique characteristics. By integrating green building standards and energy-efficient designs, new venues can reduce life-cycle carbon emissions while addressing spatial gaps.
Xi’an’s 2035 Territorial Spatial Plan identifies the eastern and western parts of the city as priority development areas, with 210 square kilometers of land to be released within the urban development boundary, and the Support Policies for the Promotion of High-Quality Development of the Sports Industry allows for the location of venues to be resolved through the replacement of land functions, such as the conversion of industrial land to public service land. At the financial level, according to the estimated proportion of similar projects, the special funds for venue construction that can be deployed in the budget of urban and rural communities in 2025 will be about 1.2 billion yuan, which, combined with the ‘public-private’ model of social capital, such as government subsidies to cover 40 percent of the cost, will provide the financial feasibility of a balanced layout of the eastern and western parts of the city. In addition, the city of Xi’an has established a mechanism for the renewal of low-utility land through ‘retention, reform and demolition’, and in the future, it will be possible to transform the stock of land into sports venues through a similar path. The Xi’an Olympic Sports Center can serve as a model for adaptive reuse, transforming underutilized zones into multifunctional hubs that minimize land-use conflicts and support low-carbon spatial planning.

5.1.2. Transforming Abandoned Industrial Buildings into Public Sports Venues

Xi’an’s industrial heritage offers a data-driven circular economy solution for sustainable urban renewal. Repurposing factories into sports venues reduces embodied carbon by 30–40% compared to new construction, directly addressing gaps in existing studies on infrastructure retrofitting. Spatial prioritization should utilize POI-derived activity hotspots to align conversions with demand, such as adapting large factories for basketball or climbing arenas and smaller offices into community fitness centers (Figure 11). Policy integration with Xi’an’s Industrial Heritage Protection Guidelines ensures cultural preservation while advancing net-zero building practices, as demonstrated by Beijing’s Shougang Industrial Park post-2022 Winter Olympics.

5.2. Optimizing the Spatial Equity of Public Sports Venue Resources

5.2.1. Building a “15-Minute Fitness Circle” Spatial System

This study highlights the close relationship between the distribution of public sports venues and residential areas in Xi’an. Therefore, urban spatial planning should integrate sports functions into regional layouts based on local characteristics, aiming to establish a comprehensive “15-min fitness circle” spatial system.
Taking population centers and concentrated activity areas as starting points, the system would utilize GIS to analyze mobile signaling data of population distribution and POI features of urban sports venues. By factoring in residents’ daily travel habits, simulated walking paths, and other urban amenities, a functional “15-min fitness circle” can be constructed to meet residents’ fitness and lifestyle needs (Figure 12).

5.2.2. Enhancing the Transportation Accessibility of Public Sports Venues

Promote low-carbon transportation: organize walking, cycling, and other modes of transportation to meet the travel needs of different citizens. Optimizing connectivity requires data-driven transportation planning. Deploying Intelligent Transportation Systems (ITS) to dynamically adjust bus routes based on social media activity data can improve access to high-demand venues. Incentivizing green travel (e.g., discounts for public transit users) aims to reduce private vehicle reliance by 20% by 2030, particularly in underserved areas like Wangsi Subdistrict and Jianzhang Road Subdistrict.

5.3. Enhancing the Vitality of Sports Spaces

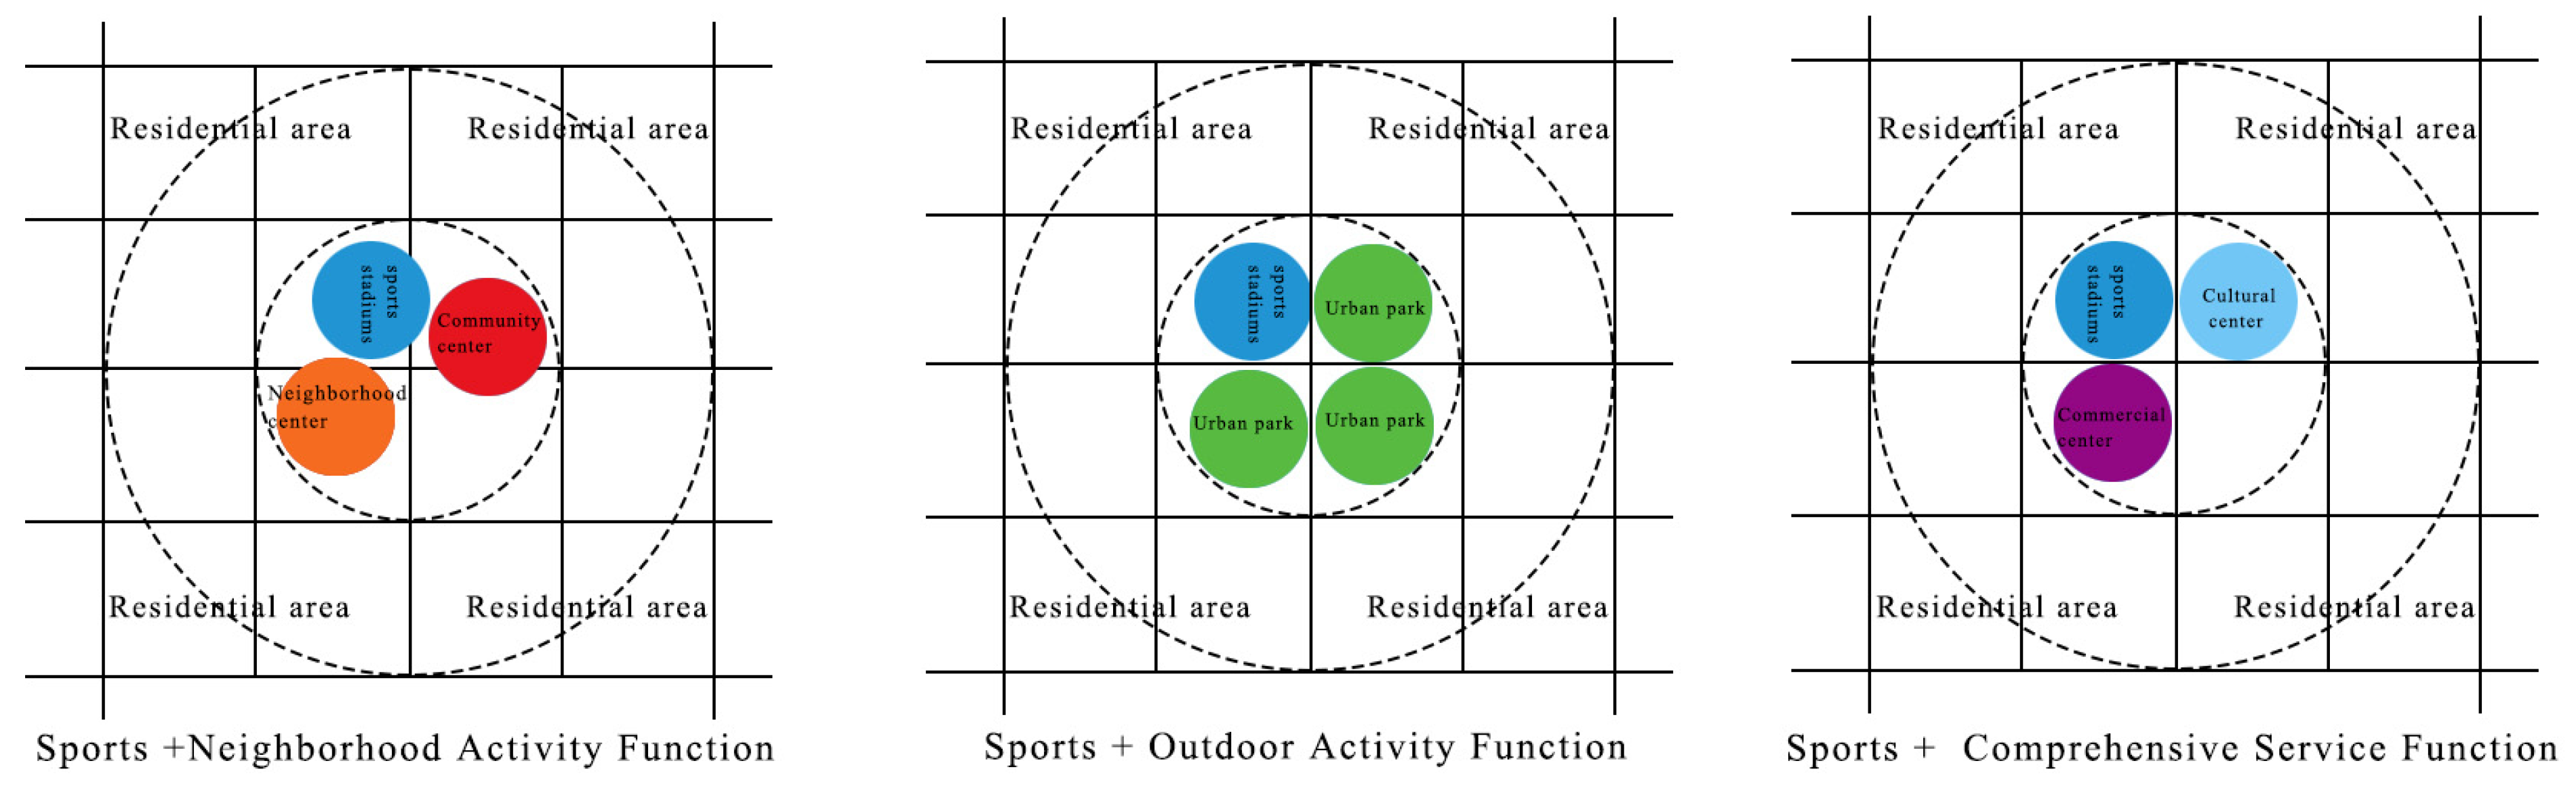
5.3.1. Improving the Compatibility of Sports Venues

Underutilization can be addressed through modular design informed by usage pattern analytics. Retractable seating and multipurpose courts allow venues to host basketball, yoga, or cultural events, increasing space utilization by 30–50%. Ceiling heights ≥12 m accommodate diverse sports (e.g., volleyball, badminton), reducing redundant infrastructure and aligning with resource-efficient urbanization.

5.3.2. Enhancing the Commercial Operation and Management Capabilities of Public Sports Venues

Data-responsive business models are critical for sustainability. Dynamic pricing based on peak/off-peak demand trends extracted from booking platforms can attract users during non-peak hours. Community co-management via mobile apps enables residents to propose activities (e.g., night markets), fostering engagement while reducing vacancy rates.

6. Conclusions

This study systematically integrates multi-source data, employing platforms such as Stata and ArcGIS to establish a scientific framework for analyzing the spatial allocation of public sports venues. By evaluating resource supply, spatial demand, accessibility levels, and spatial activity patterns in Xi’an’s main urban area, critical supply–demand imbalances were identified. Optimization strategies were proposed, including expanding public sports venue coverage in low-supply regions, adaptive reuse of idle industrial buildings (reducing embodied carbon by 30–40% compared to new construction), constructing a “15-min fitness circle” spatial system, enhancing transportation accessibility through ITS, adopting modular design to improve venue multifunctionality, and implementing dynamic pricing models for operational efficiency. These measures aim to balance resource equity, optimize service efficiency, and provide actionable insights for cities confronting similar urbanization challenges.
Although the results of the study are more instructive, there are still some shortcomings in this study. First of all, the data collection of the study may not be comprehensive enough, and the real-time liquidity indicators and socio-economic variables were not integrated into the study, which affected the accuracy of the fairness evaluation to a certain extent. Second, the current analytical framework uses only the Delphi method in the ESE coefficients determination process to ensure the operationalization of policy communication and remains inadequate in quantifying the uncertainty of parameter variations in transportation resistance models. At the same time, although the green sustainable optimization strategy proposed in this study is consistent with the full-cycle energy efficiency target of the sports venue, the future should focus on the role of green renovation technology in the transformation of low-carbon cities, especially the empirical verification of its environmental benefits. Finally, this study is still deficient in drawing on successful international urban planning models and best practices. In the future, by strengthening the comparative study of domestic and international cities, and incorporating machine learning algorithms such as natural language processing for public sentiment analysis to enhance system adaptability in complex scenarios, it will provide more universal suggestions and ideas for the improvement of all kinds of public service facilities in Xi’an and play a greater role in formulating a more forward-looking urban development strategy.
This study takes Xi’an as a case study, but the buffer analysis, LQ analysis, and KDE analysis methods it adopts have significant advantages in terms of spatial analysis methods and land use evaluation criteria, and are fully in line with the requirements for venue construction scale, siting and planning layout of the newly revised Urban Public Stadium Construction Standards (JB202-2024) in 2024, which are of strong applicability and can be generalized. It is highly applicable and can be extended to Chinese cities with similar development characteristics., for example, in the central cities in Northwest China (e.g., Lanzhou) with population densities of 15,000–20,000 people/km2 and a polycentric development pattern, as these cities have a high degree of similarity in urban spatial structure and economic development patterns.
In the subsequent study, we will establish the conversion matrix between spatial analysis indicators (e.g., LQ value, POI kernel density) and the standard fields of the platform according to the parameter system of the Technical Standard of the Basic Platform for Urban Information Modeling (CJJ/T315-2022), taking into account the actual situation of different cities, and we will quantify the effects of random fluctuations in traffic impedance parameters by incorporating Monte Carlo simulation or designing the Bayesian networks to integrate expert knowledge with the confidence level of empirical data and other methods to further improve the compatibility, adaptability, and credibility of the study.

Author Contributions

Conceptualization, D.X.; methodology, D.X.; software, C.S. and D.X.; validation, D.X. and C.S.; formal analysis, D.X. and R.Z.; investigation, D.X. and C.S.; resources, C.S. and D.X.; data curation, C.S. and R.Z.; writing—original draft preparation, D.X.; editing, D.X., C.S. and R.Z.; visualization, D.X., C.S. and R.Z.; supervision, D.X., C.S. and R.Z.; project administration, D.X.; funding acquisition, D.X. All authors have read and agreed to the published version of the manuscript.

Funding

This research was funded by the Innovation Support Program for Soft Science Research of Jiangsu, grant number BR2024039.

Data Availability Statement

The data presented in this research are available upon request from the corresponding author. The data are not publicly available due to privacy.

Conflicts of Interest

The authors declare no conflicts of interest.

References

  1. Zhang, Y.; Ming, Y.Y.; Shi, B. Spatial distribution characteristics and causes of public sports venues in China. Sci. Rep. 2023, 13, 15–56. [Google Scholar] [CrossRef] [PubMed]
  2. He, J.; Ren, F.; Dong, J.; Zhang, H.; Yan, W.; Liu, J. Social inequity of park accessibility in Taiyuan: Highlighting the unfair layout of parks in second-tier cities of China and the relative role of contributors. Geo-Spat. Inf. Sci. 2024, 27, 1118–1140. [Google Scholar] [CrossRef]
  3. Jaworski, B.; Kohli, A.K.; Sahay, A. Market-driven versus driving markets. J. Acad. Mark. Sci. 2000, 28, 45–54. [Google Scholar] [CrossRef]
  4. Day, G.S. The capabilities of market-driven organizations. J. Mark. 1994, 58, 37–52. [Google Scholar] [CrossRef]
  5. Feng, Q.; Chen, H.; Shi, X.; Wei, J. Stakeholder games in the evolution and development of green buildings in China: Government-led perspective. J. Clean. Prod. 2020, 275, 122895. [Google Scholar] [CrossRef]
  6. Le Galès, P. Neoliberalism and urban change: Stretching a good idea too far? Territ. Politics Gov. 2016, 4, 154–172. [Google Scholar] [CrossRef]
  7. Reher, D.S. Economic and social implications of the demographic transition. Popul. Dev. Rev. 2011, 37, 11–33. [Google Scholar] [CrossRef]
  8. Zhu, H.; Li, J.; Yuan, Z.; Li, J. Bibliometric Analysis of Spatial Accessibility from 1999–2022. Sustainability 2023, 15, 13399. [Google Scholar] [CrossRef]
  9. Li, Y.L.; Lin, Y.; Geertman, S.; Hooimeijer, P.; Xu, W. Accessibility-Based Equity of Public Facilities: A Case Study in Xiamen, China. Appl. Spat. Anal. Policy 2021, 14, 947–968. [Google Scholar] [CrossRef]
  10. Liu, D.; Zhang, J.J.; Desbordes, M. Sport business in China: Current state and prospect. Int. J. Sports Mark. Spons. 2017, 18, 2–10. [Google Scholar] [CrossRef]
  11. Kasraian, D.; Maat, K.; van Wee, B. The impact of urban proximity, transport accessibility and policy on urban growth: A longitudinal analysis over five decades. Environ. Plan. B Urban Anal. City Sci. 2019, 46, 1000–1017. [Google Scholar] [CrossRef]
  12. Yang, K.R.; Xie, Y.J.; Guo, H.T. Optimization of spatial distribution of sports parks based on accessibility analysis. PLoS ONE 2023, 18, e0291235. [Google Scholar] [CrossRef]
  13. Cesario, E. Big data analytics and smart cities: Applications, challenges, and opportunities. Front. Big Data 2023, 6, 1149402. [Google Scholar] [CrossRef]
  14. Supianto, A.A.; Nasar, W.; Aspen, D.M.; Hasan, A.; Karlsen, A.S.T.; Torres, R.D.S. An Urban Digital Twin Framework for Reference and Planning. IEEE Access 2024, 12, 152444–152465. [Google Scholar] [CrossRef]
  15. Ruan, S.J.; Bao, J.; Liang, Y.; Li, R.; He, T.; Meng, C.; Li, Y.; Wu, Y.; Zheng, Y. Dynamic Public Resource Allocation Based on Human Mobility Prediction. Proc. ACM Interact. Mob. Wearable Ubiquitous Technol. IMWUT 2020, 4, 1–22. [Google Scholar] [CrossRef]
  16. Li, X.D.; Dunkin, F.; Dezert, J. Multi-source information fusion: Progress and future. Chin. J. Aeronaut. 2024, 37, 24–58. [Google Scholar] [CrossRef]
  17. Ning, M.L.; Yu, Y.; Jiang, H.J.; Gao, Q.K. Research on Dynamic Evaluation of Urban Community Livability Based on Multi-Source Spatio-Temporal Data. In Proceedings of the 26th International Conference on Geoinformatics (Geoinformatics), Kunming, China, 28–30 June 2018. [Google Scholar]
  18. Guo, S.H.; Yang, G.; Pei, T.; Ma, T.; Song, C.; Shu, H.; Du, Y.; Zhou, C. Analysis of factors affecting urban park service area in Beijing: Perspectives from multi-source geographic data. Landsc. Urban Plan. 2019, 181, 103–117. [Google Scholar] [CrossRef]
  19. Liu, B.X.; Tian, Y.; Guo, M.; Tran, D.; Alwah, A.A.Q.; Xu, D. Evaluating the disparity between supply and demand of park green space using a multi-dimensional spatial equity evaluation framework. Cities 2022, 121, 103484. [Google Scholar] [CrossRef]
  20. Omer, I. Evaluating accessibility using house-level data: A spatial equity perspective. Comput. Environ. Urban Syst. 2006, 30, 254–274. [Google Scholar] [CrossRef]
  21. Rao, Y.X.; Zhong, Y.; He, Q.; Dai, J. Assessing the Equity of Accessibility to Urban Green Space: A Study of 254 Cities in China. Int. J. Environ. Res. Public Health 2022, 19, 4855. [Google Scholar] [CrossRef]
  22. Yuan, H.F.; Yang, X.G. Spatial distribution of urban basic education resources in Shanghai: Accessibility and supply-demand matching evaluation. Open Geosci. 2023, 15, 20220571. [Google Scholar] [CrossRef]
  23. Zhang, M.H.; Li, Z.P.; Peng, H. The accessibility analysis of multiple public facilities in the central urban areas based on multi-transportation modes: A study in Chengdu. Trans. GIS 2023, 27, 2213–2233. [Google Scholar] [CrossRef]
  24. Cao, Y.L.; Guo, Y.H.; Zhang, M.J. Research on the Equity of Urban Green Park Space Layout Based on Ga2SFCA Optimization Method—Taking the Core Area of Beijing as an Example. Land 2022, 11, 1323. [Google Scholar] [CrossRef]
  25. Lan, F.; Gong, X.; Da, H.; Wen, H. How do population inflow and social infrastructure affect urban vitality? Evidence from 35 large- and medium-sized cities in China. Cities 2020, 100, 102454. [Google Scholar] [CrossRef]
  26. Pérez-delHoyo, R.; Andújar-Montoya, M.D.; Mora, H.; Gilart-Iglesias, V. Citizen Participation in Urban Planning-Management Processes Assessing Urban Accessibility in Smart Cities. In Proceedings of the 7th International Conference on Smart Cities and Green ICT Systems (SMARTGREENS), Funchal, Portugal, 16–18 March 2018; pp. 206–213. [Google Scholar]
  27. Zhang, S.L.; Zhang, X.J.; Liu, Y. A study of the influence of sports venues on the intra-city population layout based on multi-source data—Taking Xi’an city and Zhengzhou city as examples. PLoS ONE 2023, 18, e0285600. [Google Scholar] [CrossRef]
  28. Tang, D.Z.; Gong, X.Y.; Liu, M.L. Residents’ behavioral intention to participate in neighborhood micro-renewal based on an extended theory of planned behavior: A case study in Shanghai, China. Habitat Int. 2022, 129, 102672. [Google Scholar] [CrossRef]
  29. Mercader-Moyano, P.; Esquivias, P.M. Decarbonization and Circular Economy in the Sustainable Development and Ren-ovation of Buildings and Neighbourhoods. Sustainability 2020, 12, 7914. [Google Scholar] [CrossRef]
  30. Kim, C.; Kim, J. Spatial spillovers of sport industry clusters and community resilience: Bridging a spatial lens to building a smart tourism city. Inf. Process. Manag. 2023, 60, 103266. [Google Scholar] [CrossRef]
  31. Karusisi, N.; Thomas, F.; Méline, J.; Chaix, B. Spatial accessibility to specific sport facilities and corresponding sport practice: The RECORD Study. Int. J. Behav. Nutr. Phys. Act. 2013, 10, 48. [Google Scholar] [CrossRef]
  32. Joseph, D.; Kim, A.; Butler, A.; Haeusler, M.H. Optimisation for sport stadium designs. In Proceedings of the Conference on Computer-Aided Architectural Design Research in Asia (CAADRIA), Daegu, Republic of Korea, 20–23 May 2015; pp. 573–582. [Google Scholar]
  33. Xu, C.H.; Lv, Y.; Zhang, C.Q. Studying on the Public Sports Service Supply Content of Urban Community in China. In Proceedings of the International Conference on Education Research and Reform (ERR 2015), Bangkok, Thailand, 21–22 April 2015; pp. 650–655. [Google Scholar]
  34. Tang, S.N.; Fan, Z.; Zong, X.; Zhang, D.; Liu, M. Evaluation platform for sustainable operation of stadiums integrating multidimensional data: Based on a multifunctional perspective. Energy Build. 2023, 287, 112957. [Google Scholar] [CrossRef]
  35. Sun, F.; Zhang, J.; Ma, J.; Wang, C.; Hu, S.; Xu, D. Evolution of the Spatial-Temporal Pattern and Social Performance Evaluation of Community Sports and Fitness Venues in Shanghai. Int. J. Environ. Res. Public Health 2022, 19, 274. [Google Scholar] [CrossRef]
  36. Hudec, M.; Rollová, L. Adaptability in the Architecture of Sport Facilities. Procedia Eng. 2016, 161, 1393–1397. [Google Scholar] [CrossRef]
  37. Bradbury, J.C.; Coates, D.; Humphreys, B.R. The impact of professional sports franchises and venues on local economies: A comprehensive survey. J. Econ. Surv. 2023, 37, 1389–1431. [Google Scholar] [CrossRef]
  38. Caulfield, J.; Jha, A.K. Stadiums and Digitalization: An Exploratory Study of Digitalization in Sports Stadiums. J. Decis. Syst. 2022, 31, 331–340. [Google Scholar] [CrossRef]
  39. Alm, J.; Solberg, H.A.; Storm, R.K.; Jakobsen, T.G. Hosting major sports events: The challenge of taming white elephants. Leis. Stud. 2016, 35, 564–582. [Google Scholar] [CrossRef]
  40. Qin, P.; Liu, Y.C. Driving path of the socialization and sustainable development of sports resources in Shaanxi universities under the background of supply-side reform. Sustain. Comput. Inform. Syst. 2020, 28, 100400. [Google Scholar] [CrossRef]
  41. Bradbury, J.C. Sports stadiums and local economic activity: Evidence from sales tax collections. J. Urban Aff. 2024, 46, 139–159. [Google Scholar] [CrossRef]
  42. Al-Hamrani, A.; Kim, D.; Kucukvar, M.; Onat, N.C. Circular economy application for a Green Stadium construction towards sustainable FIFA world cup Qatar 2022™. Environ. Impact Assess. Rev. 2021, 87, 106543. [Google Scholar] [CrossRef]
  43. Ahvenniemi, H.; Huovila, A. How do cities promote urban sustainability and smartness? An evaluation of the city strategies of six largest Finnish cities. Environ. Dev. Sustain. 2021, 23, 4174–4200. [Google Scholar] [CrossRef]
  44. Xue, H.H.; Mason, D.S. Stadium Games in Entrepreneurial Cities in China: A State Project. J. Glob. Sport Manag. 2019, 4, 185–209. [Google Scholar] [CrossRef]
  45. Ramshaw, G. Sport heritage and the healthy stadia agenda: An overview. Sport Soc. 2017, 20, 219–225. [Google Scholar] [CrossRef]
  46. Zhang, Y.L.; Li, W.; Deng, H.; Li, Y. Evaluation of Public Transport-Based Accessibility to Health Facilities considering Spatial Heterogeneity. J. Adv. Trans. 2020, 2020, 1–10. [Google Scholar] [CrossRef]
  47. Huang, C.L.; Feng, Y.; Wei, Y.; Sun, D.; Li, X.; Zhong, F. Assessing Regional Public Service Facility Accessibility Using Multisource Geospatial Data: A Case Study of Underdeveloped Areas in China. Remote Sens. 2024, 16, 409. [Google Scholar] [CrossRef]
  48. Jiang, H.; Li, L.; Xian, H.; Hu, Y.; Huang, H.; Wang, J. Crowd Flow Prediction for Social Internet-of-Things Systems Based on the Mobile Network Big Data. IEEE Trans. Comput. Soc. Syst. 2022, 9, 267–278. [Google Scholar] [CrossRef]
  49. Lazaridis, L.; Dimou, A.; Daras, P. Abnormal Behavior Detection in Crowded Scenes Using Density Heatmaps and Optical Flow. In Proceedings of the European Signal Processing Conference (EUSIPCO), Rome, Italy, 3–7 September 2018; pp. 2060–2064. [Google Scholar]
  50. Tahmasbi, B.; Mansourianfar, M.H.; Haghshenas, H.; Kim, I. Multimodal accessibility-based equity assessment of urban public facilities distribution. Sustain. Cities Soc. 2019, 49, 101633. [Google Scholar] [CrossRef]
  51. Giovanniello, M.A.; Tonin, S. Equity and fairness in the location of public facilities. Ann. Public Coop. Econ. 2024, 95, 1095–1120. [Google Scholar] [CrossRef]
  52. Carbonari, A.; Messi, L.; Naticchia, B.; Vaccarini, M.; Pirani, M. Development of a BIM-based holonic system for real-time monitoring of building operational efficiency. Front. Eng. Manag. 2020, 7, 89–103. [Google Scholar] [CrossRef]
  53. Wang, F.; Li, Q. The Correlation between Traffic Accessibility and Positioning of Ten Major Large-Medium-sized Gymna-siums: A Case Study on the Guang-Fo Area. South Archit. 2021, 6, 100–106. [Google Scholar]
  54. Tobler, W. On the First Law of Geography: A Reply. Ann. Assoc. Am. Geogr. 2004, 94, 304–310. [Google Scholar] [CrossRef]
  55. Khavarian-Garmsir, A.R.; Sharifi, A.; Sadeghi, A. The 15-min city: Urban planning and design efforts toward creating sustainable neighborhoods. Cities 2023, 132, 104101. [Google Scholar] [CrossRef]
  56. Allam, Z.; Chabaud, D.; Gall, C.; Pratlong, F.; Moreno, C. Enter the 15-minute city: Revisiting the smart city concept under a proximity based planning lens. In Resilient and Sustainable Cities; Elsevier: Amsterdam, The Netherlands, 2023; pp. 93–105. [Google Scholar]
  57. Kaczynski, A.T.; Besenyi, G.M.; Stanis, S.A.W.; Koohsari, M.J.; Oestman, K.B.; Bergstrom, R.; Potwarka, L.R.; Reis, R.S. Are park proximity and park features related to park use and park-based physical activity among adults? Variations by multiple socio-demographic characteristics. Int. J. Behav. Nutr. Phys. Act. 2014, 11, 146. [Google Scholar] [CrossRef] [PubMed]
  58. Peng, S.P.; Zhou, Y. Allocation and Optimization of Public Sports Facilities Resources in International Tourist Cities Based on Fuzzy Multicriteria Decision-Making Algorithm. Math. Probl. Eng. 2022, 2022, 1–9. [Google Scholar] [CrossRef]
  59. Yüce, A.; Katırcı, H.; Yüce, S.G. Examination of sustainable features of stadiums as an integral part of sustainable urban development: The case of Turkey. Int. J. Sports Mark. Spons. 2021, 22, 142–163. [Google Scholar] [CrossRef]
  60. Hyun, D. Proud of, but too close: The negative externalities of a new sports stadium in an urban residential area. Ann. Reg. Sci. 2022, 68, 615–633. [Google Scholar] [CrossRef]
  61. Høyer-Kruse, J.; Schmidt, E.B.; Hansen, A.F.; Pedersen, M.R.L. The interplay between social environment and opportunities for physical activity within the built environment: A scoping review. BMC Public Health 2024, 24, 2361. [Google Scholar] [CrossRef]
  62. Jiang, Y.; Wang, C.; Zhao, H.; Sun, D.; Shi, Z.; Xia, J. Spatial Distribution Characteristics of Public Fitness Venues in the Main Urban Area of Dalian from the Perspective of Urban Accessibility. Sustainability 2022, 14, 12728. [Google Scholar] [CrossRef]
  63. Luo, S.J.; Jiang, H.; Yi, D.; Liu, R.; Qin, J.; Liu, Y.; Zhang, J. PM2SFCA: Spatial Access to Urban Parks, Based on Park Perceptions and Multi-Travel Modes. A Case Study in Beijing. ISPRS Int. J. Geo-Inf. 2022, 11, 488. [Google Scholar] [CrossRef]
  64. Wang, H.; Dai, X.; Wu, J.; Wu, X.; Nie, X. Influence of urban green open space on residents’ physical activity in China. BMC Public Health 2019, 19, 1093. [Google Scholar] [CrossRef]
  65. Liu, X.J.; Long, Y. Automated identification and characterization of parcels with OpenStreetMap and points of interest. Environ. Plan. B Plan. Des. 2016, 43, 341–360. [Google Scholar] [CrossRef]
  66. Al Jawarneh, I.M.; Bellavista, P.; Corradi, A.; Foschini, L.; Montanari, R. Spatially Representative Online Big Data Sampling for Smart Cities. In Proceedings of the 25th IEEE International Workshop on Computer Aided Modeling and Design of Communication Links and Networks (IEEE CAMAD), Pisa, Italy, 14–16 September 2020. [Google Scholar]
  67. Liao, L.B.; Yang, S.; Lai, Y.; Zeng, W.; Yang, F.; Jiang, M. Efficient Estimation of Time-Dependent Shortest Paths Based on Shortcuts. In Proceedings of the 21st International Conference on Algorithms and Architectures for Parallel Processing (ICA3PP), Electrical Network, Virtual Event, 3–5 December 2021; pp. 18–32. [Google Scholar]
  68. Fu, Y.T.; Yang, J.; Wang, Z.; Zhang, B.; Xue, J.; Zeng, Y.; Li, F. Reassessing urban park accessibility: An improved two-step floating catchment area method based on the physical activity services perspective. Urban For. Urban Green. 2024, 101, 128446. [Google Scholar] [CrossRef]
  69. Pereira, R.H.M. Future accessibility impacts of transport policy scenarios: Equity and sensitivity to travel time thresholds for Bus Rapid Transit expansion in Rio de Janeiro. J. Transp. Geogr. 2019, 74, 321–332. [Google Scholar] [CrossRef]
  70. Zhou, G.Q.; Zhang, R.T.; Huang, S.X. Generalized Buffering Algorithm. IEEE Access 2021, 9, 27140–27157. [Google Scholar] [CrossRef]
  71. Ashik, F.R.; Islam, S.; Alam, S.; Tabassum, N.J.; Manaugh, K. Dynamic equity in urban amenities distribution: An accessibility-driven assessment. Appl. Geogr. 2024, 164, 103199. [Google Scholar] [CrossRef]
  72. McPherson, S.; Reese, C.; Wendler, M.C. Methodology Update: Delphi Studies. Nurs. Res. 2018, 67, 404–410. [Google Scholar] [CrossRef]
  73. Clark, J. Fairness in Public Good Provision: An Investigation of Preferences for Equality and Proportionality. Can. J. Econ. 1998, 31, 708–729. [Google Scholar] [CrossRef]
  74. Dai, G.L.; Li, R.F.; Ma, S. Research on the equity of health resource allocation in TCM hospitals in China based on the Gini coefficient and agglomeration degree: 2009–2018. Int. J. Equity Health 2022, 21, 145. [Google Scholar] [CrossRef] [PubMed]
  75. Wang, B.J.; Liu, C.L.; Zhang, H. Where are equity and service effectiveness? A tale from public transport in Shanghai. J. Transp. Geogr. 2022, 98, 103275. [Google Scholar] [CrossRef]
  76. Yu, H.M.; Yu, S.; He, D.; Lu, Y. Equity analysis of Chinese physician allocation based on Gini coefficient and Theil index. BMC Health Serv. Res. 2021, 21, 455. [Google Scholar] [CrossRef]
  77. Powers, S.L.; Pitas, N.A.; Rice, W.L. Applying location quotient methodology to urban park settings with mobile location data: Implications for equity and park planning. Urban For. Urban Green. 2024, 98, 128418. [Google Scholar] [CrossRef]
  78. Liu, Y.Y.; Kang, Y.; Mahmood, A.R.; Magdy, A. Scalable Evaluation of Local K-Function for Radius-Accurate Hotspot Detection in Spatial Networks. In Proceedings of the 31st ACM SIGSPATIAL International Conference on Advances in Geographic Information Systems (ACM SIGSPATIAL GIS), Hamburg, Germany, 13–16 November 2023; pp. 576–587. [Google Scholar]
  79. Achino, K.F.; Barceló, J.A. Spatial Prediction: Reconstructing the “Spatiality” of Social Activities at the Intra-Site Scale. J. Archaeol. Method Theory 2019, 26, 112–134. [Google Scholar] [CrossRef]
  80. Chuang, I.T.; Benita, F.; Tuncer, B. Effects of urban park spatial characteristics on visitor density and diversity: A geolocated social media approach. Landsc. Urban Plan. 2022, 226, 104514. [Google Scholar] [CrossRef]
  81. Shen, J.; Cheng, J.; Huang, W.; Zeng, F. An exploration of spatial and social inequalities of urban sports facilities in Nanning City, China. Sustainability 2020, 12, 4353. [Google Scholar] [CrossRef]
  82. Barghchi, M.; Omar, D.; Aman, M.S. Sports facilities in urban areas: Trends and development considerations. Pertanika J. Soc. Sci. Humanit. 2010, 18, 427–435. [Google Scholar]
  83. Li, D.; Wang, J.; Shi, K. Research on the investigation and value evaluation of historic building resources in Xi’an city. Buildings 2023, 13, 2244. [Google Scholar] [CrossRef]
  84. Liu, Y.; Wang, H.; Sun, C.; Wu, H. Equity measurement of public sports space in central urban areas based on residential scale data. Int. J. Environ. Res. Public Health 2022, 19, 3104. [Google Scholar] [CrossRef]
  85. Pereira, R.H. Transport legacy of mega-events and the redistribution of accessibility to urban destinations. Cities 2018, 81, 45–60. [Google Scholar] [CrossRef]
  86. Tam, V.W.; Hao, J.J. Adaptive reuse in sustainable development. Int. J. Constr. Manag. 2019, 19, 509–521. [Google Scholar] [CrossRef]
  87. Rosentraub, M.S. Sports facilities and urban redevelopment: Private and public benefits and a prescription for a healthier future. Bus. Sports 2008, 3, 57–80. [Google Scholar]
Figure 1. Research framework.
Buildings 15 01354 g001
Figure 2. Definition of the study area.
Buildings 15 01354 g002
Figure 3. Spatial distribution of accessibility values for large public sports venues.
Buildings 15 01354 g003
Figure 4. Spatial distribution of accessibility values for medium-sized public sports venues.
Buildings 15 01354 g004
Figure 5. Spatial distribution of accessibility values for small public sports venues.
Buildings 15 01354 g005
Figure 6. Per capita access to various public sports venues by subdistrict in Xi’an’s urban area.
Buildings 15 01354 g006
Figure 7. Kernel density analysis of sports venues in Xi’an’s urban area.
Buildings 15 01354 g007
Figure 8. Kernel density analysis of population distribution in Xi’an’s urban area.
Buildings 15 01354 g008
Figure 9. Kernel density difference analysis of sports venues to population distribution.
Buildings 15 01354 g009
Figure 10. Comprehensive evaluation map of public sports venue accessibility.
Buildings 15 01354 g010
Figure 11. Transformation of idle industrial facilities into public sports venues: (a) An abandoned factory in Xi’an; (b) Renovation intention.
Buildings 15 01354 g011
Figure 12. Functional combination model for constructing the 15-min fitness circle.
Buildings 15 01354 g012
Table 1. Differentiated positioning of sports venues from other facility studies.
Comparison TermsAccessibility Study of Healthcare, Educational, and Other FacilitiesSports Venues Study
Core indicatorsMinimum distance/timeDiversity–quantity–quality triangle
Data dimensionsStatic population distributionDynamic needs + assessment of effective services in venues
Policy orientationNew facility site selectionOptimization and restructuring of new venues and stock
Matching supply and demandMatching supply and demandImproving the quality and efficiency of resources
Table 2. Trends in recent research.
Research DimensionsMethodological InnovationCurrent Limitations
Spatial accessibilityReal-time crowd heat map analysis [49]Insufficient scientific assessment of effective services in facilities
Equity of facilitiesSocio-sensory data fusion [50,51]Quantitative criteria are difficult to establish
Operational efficiency improvementBIM Integration [52]No dynamic optimization mechanism in place
Table 3. Background of the experts.
Serial Number 1Years of ExperienceRepresentative Experience
T112Urban Transportation Planning Specialist
T28Researcher in Shared Mobility Systems Integration
T315Principal Investigator for Transportation Accessibility Assessment
U110Core Member of Xi’an “15-Minute Living Circle” Planning Initiative
U27Designer of Infrastructure Renovation Strategies for Aging Communities
G120Scholar in Urban Spatial Big Data and GIS Modeling
G29Researcher on Remote Sensing-Based Urban Heat Island Effects
S114Equity-Oriented Community Resource Analyst
S26Expert in Public Facility Utilization Patterns in Aging Societies
P111Longitudinal Investigator of Sports Infrastructure
P25Designer of Built Environment Interventions
SP118National Sports Venue Consultant
SP210Lead Researcher in Community Sports Venue Efficiency Optimization
C19Grassroots Community Services Advocate
C212Urban Governance Systems Designer
1 Take the initial letter of profession for short.
Table 4. Quantization intervals for small public sports venues.
Level Weight   Coefficients   W k Number of Accessible
None00
Level 10.81
Level 212
Level 31.23
Level 41.64–6
Disclaimer/Publisher’s Note: The statements, opinions and data contained in all publications are solely those of the individual author(s) and contributor(s) and not of MDPI and/or the editor(s). MDPI and/or the editor(s) disclaim responsibility for any injury to people or property resulting from any ideas, methods, instructions or products referred to in the content.

