Abstract
The joint of a shield tunnel segment is the weak part of tunnel, and the opening amount of the joint seriously affects the watertightness of the internal structure of the tunnel. In this experiment, a model was created with ANSYS, the fluid–solid coupling effect of the seawater and seabed was considered using the SuperFLUSH/2D 6.0 software, and the local site effect was considered by free-field seismic response analysis. Considering the structure and stress characteristics of the shield tunnel in conjunction with the marine area, earthquake research on shield tunnel culverts was conducted using lateral and longitudinal beam–spring models. The main focus of this article is to study the earthquake resistance of shield tunnel joints under extreme seismic excitation (SL-2) in complex marine environments. The results indicated that in the lateral analysis, under varying soil layer conditions, the diameter deformation rates for sections 1 and 2 using high-strength bolts were 1.752% and 1.334%, respectively, while the joint-opening amounts were 0.515 mm and 0.387 mm, respectively. This suggests that locations with thicker silt layers exhibit larger joint-opening amounts and are more susceptible to deformation. In the longitudinal analysis, when bolt strength varied, the maximum joint-opening ranged from 4.706 mm to 6.507 mm, and the maximum dislocation ranged from 0.625 mm to 1.326 mm. The deformation rule of the joint bolts followed the pattern that higher stiffness led to smaller deformation, whereas poorer geological conditions resulted in larger deformation. Therefore, the interface between soft and hard strata is a weak point in the longitudinal seismic resistance of the shield tunnel structure. The conclusions of this study can supplement the seismic research on shield tunnels in the marine areas of nuclear power plants.
1. Introduction
With the rapid economic development of coastal areas and the implementation of the national maritime strategy, undersea tunnels, as crucial links across rivers and straits, have been receiving increasing attention. Among them, shield tunnels have many advantages, such as high construction efficiency and good adaptability to complex strata, and have become a widely used construction method in marine tunnel construction.
The Circum-Pacific seismic belt in the coastal area of China is one of the two major seismic zones in the world, which makes it particularly important to research the seismic performance of underwater shield tunnels under inhomogeneous geological conditions. Chen et al. [1] combined viscoelastic artificial boundaries and applied the ANSYS 19.1 software to establish a model that can simultaneously consider the interaction between the soil–water medium and structural dynamics. They conducted lateral seismic analysis on vertical shaft structures in soft soil and rock foundation. The results demonstrated that despite varying soil conditions, the shaft structures followed consistent patterns in internal force distribution and deformation, with the joints experiencing the most significant seismic effects. Ding et al. [2] analyzed the various effects of bidirectional seismic waves on the internal force and deformation of the tunnel cross structure. The findings demonstrated that the effective stress of the soil layer at the top of the tunnel was greatly reduced during the earthquake. In order to prevent the main structure from floating up, it was suggested to strengthen the overlying soil layer. Yu et al. [3] used the dynamic time-history response analysis method and pseudostatic method to analyze the seismic performance of a tunnel under various rock mass criteria. The internal force and deformation characteristics of tunnels were different when they passed through different strata. When the tunnel was in the upper soft and lower hard strata, the internal force was the largest and the deformation was not uniform, while the internal force under the homogeneous rock stratum was the least. Wu et al. [4] conducted a numerical analysis to research deformation in shield tunnel construction under soft upper and hard lower geological conditions in coastal areas. Hard rock strata demonstrated significantly better settlement control characteristics than soft rock formations. In coastal tunnel engineering, hard rock excavation is generally preferred, where maintaining proper geostatic pressure equilibrium is crucial to avoid both settlement and heave. It should be noted that while grouting pressure plays an essential role in achieving complete fissure filling, excessive pressure does not proportionally enhance settlement control effectiveness. Yang et al. [5] researched tunnel inclination and discovered that tunnels exhibited a linear relationship with the tunnel inclination angle. In the seismic design of a shield tunnel, the inclination of the tunnel can be considered to evaluate the internal force change caused by earthquakes so as to improve efficiency. Chang et al. [6] proposed a new model of joint and proved through research that this joint performed well under complex geological conditions, with advantages of reducing the joint-opening amount and improving the rotational stiffness of the joint. Currently, research on submarine tunnels is relatively abundant [7,8,9]; however, studies that consider the coupling effect of seawater and the seabed remain scarce. Liu et al. [10] established a model of the seawater–soil–tunnel structure and compared the seismic performance of a submarine tunnel under distinct buried depths under the action of dead water and flowing water. The analytical results demonstrated a consistent trend where the tunnel’s structural stress and horizontal displacement diminished progressively with increasing burial depth; this was accompanied by a corresponding decrease in the dynamic water pressure influence coefficient. Cheng et al. [11] adopted the finite element software ADINA V9.7.1 to simulate the earthquake response of an undersea tunnel under bidirectional seismic action. Chen et al. [12] experimentally validated a fluid–structure coupling approach, revealing that subsea tunnels are more vulnerable to low-frequency seismic excitations when considering seawater–seabed interactions, with seismic damage mitigation observed at greater water depths. He et al. [13] summarized the characteristics and applicability of common seismic calculation methods for shield tunnels. Zhou et al. [14] invented a new meshfree method that takes into account crazing, touch behavior, and fluid–solid effects and applied the research method practically in the construction of karst tunnels. Huang et al. [15] considered the fluid–solid interaction effect and the effect of overlying seawater pressure on underwater tunnels and analyzed the seismic response rules and damage evolution processes under different ground motion excitations. Chen et al. [12] proposed a seawater–seabed–tunnel model and found that low-frequency ground movement had a greater influence on the submarine tunnel and that tunnel damage decreased with water depth. Li et al. [16] conducted a systematic investigation to enhance the prediction accuracy of formation seepage pressure in slurry shield tunnels. Their results demonstrated that under fluid–solid coupling conditions, rock strata exhibited the most extensive seepage pressure disturbance range under identical grouting pressures compared with relatively smaller ranges in sandy and clay layers. The calculated seepage pressure was consistent with the measured value, which verified the rationality of the revised formula. Jiang et al. [17] developed a three-dimensional seawater–seabed–segment coupled model to investigate the dynamic response characteristics of subsea tunnels subjected to lateral seismic excitation. The findings revealed that the connection between the mid-partition and head junction was most vulnerable to initial damage and that the arch segment sustained the most severe postearthquake damage, suggesting these critical zones require special design considerations. Chen et al. [9] conducted a study on the nonlinear seismic response of tunnel joint lining and compared the research results with dynamic analysis via the three-dimensional finite element method. It was shown that the study method was relatively conservative, and the conclusion can be used as a basis for the design of submarine shield tunnels under strong earthquake excitation.
As a kind of long-line structure, shield tunnels are assembled by precast concrete segments connected by bolts, but the stiffness of their joints is much lower than that of the main segment. Therefore, in the process of earthquake response research, the strain of lining segments is calculated, and it is necessary to pay attention to the effect of joints in earthquake analysis. Wang et al. [18] exploited the equivalent stiffness model to analyze the earthquake response of shield tunnels under various excitation directions and different ground motions. The results showed that the area where the internal force of the soft soil side structure increased significantly was four times the outer diameter of the tunnel. When seismic waves are excited laterally, the longitudinal bending moment plays a leading role. Axial force plays a leading role in longitudinal excitation. Under the same horizontal seismic action, the influence of longitudinal excitation on the structure is more unfavorable. Geng et al. [19] proposed a numerical simulation process from the whole to the local according to the mechanical characteristics of the longitudinal joint details of a shield tunnel under seismic action. Yan et al. [20] proposed a pseudostatic analysis to study the seismic effects of shield tunnels under shear waves, and the conclusion illustrated that the equivalent stiffness quasistatic method was more aligned with reality. Liang et al. [21] employed the concrete plastic damage constitutive model to simulate shield segments and conducted seismic studies on a shield tunnel under fault dislocation. The analysis indicates that if the soil near the fault is soft, increasing the bolt strength can effectively mitigate the displacement caused by fault movement. Zhang et al. [22] developed a method for seismic response based on anchored joints under bidirectional earthquake excitation. The deformation of the joints was discussed, with the deformation of the anchor joints being greater than that under unidirectional conditions.
The reaction displacement method has been applied in many practical projects, and its advantages are high computational efficiency, strong applicability, and simplified processing of input information. Wang et al. [23] took the Xi’an Subway tunnel as the background and conducted a seismic analysis of the shield tunnel based on dynamic time-history analysis and the reaction displacement method. The time-history analysis method had a certain dependence on the time-history curve of seismic waves, the calculation time was long in the application of the same background, and the result obtained by the reaction displacement method was relatively conservative. Liang et al. [24] took the shield tunnel of Tianjin Metro as the background and time-history analysis as the basis to compare and analyze the internal force and peak force value of the tunnel calculated by the integral forced response displacement method, response displacement method, and time-history analysis method. The research showed that among the three analysis methods, the integral forced response displacement method had the best applicability, easiest operation, and highest precision. Fu et al. [25] analyzed the structure of two-layer, three-span subway underground stations and compared the calculation results of seismic bending moments by the reaction displacement method, response acceleration method, and ABAQUS nonlinear time-history analysis. It was found that the difference between the response displacement method and the response acceleration method was small, and this difference was not affected by the ground motion intensity, structural stiffness, or structural roof depth. Therefore, the response displacement method provides a relatively stable and reliable estimation method, which is suitable for various seismic intensity and structural conditions.
At present, all the coastal nuclear power plants that have been built or are under construction in China adopt the seawater once-through cooling system, which requires a massive water intake, and their important plant water systems have the requirements of protecting against seismic disasters under extreme safety ground motion. Therefore, the seismic stability of submarine tunnels under the conditions of extreme safety seismic waves is an important technical difficulty and key problem [26]. In view of this problem, this paper took Sanmen nuclear power project as the background, considering the fluid–solid coupling effect and free-field site effect with the SuperFLUSH/2D software and adopting the ANSYS software, and established a beam–spring analysis model of underwater shield tunnels according to the fundamental principle of the generalized response displacement method. Secondary development subroutine UPFs [27,28] were used in ANSYS to embed an equivalent linear dynamic model and viscous–spring boundary and establish a three-dimensional shield tunnel–foundation finite element model [29], focusing on the seismic performance index of the shield tunnel joint. On this basis, parameter sensitivity analysis was carried out to evaluate the influence of different soil layers and bolt strengths on the seismic response of tunnel structures. The conclusions obtained can provide a basis for the subsequent seismic design of tunnels.
2. Methods
2.1. Response Displacement Method
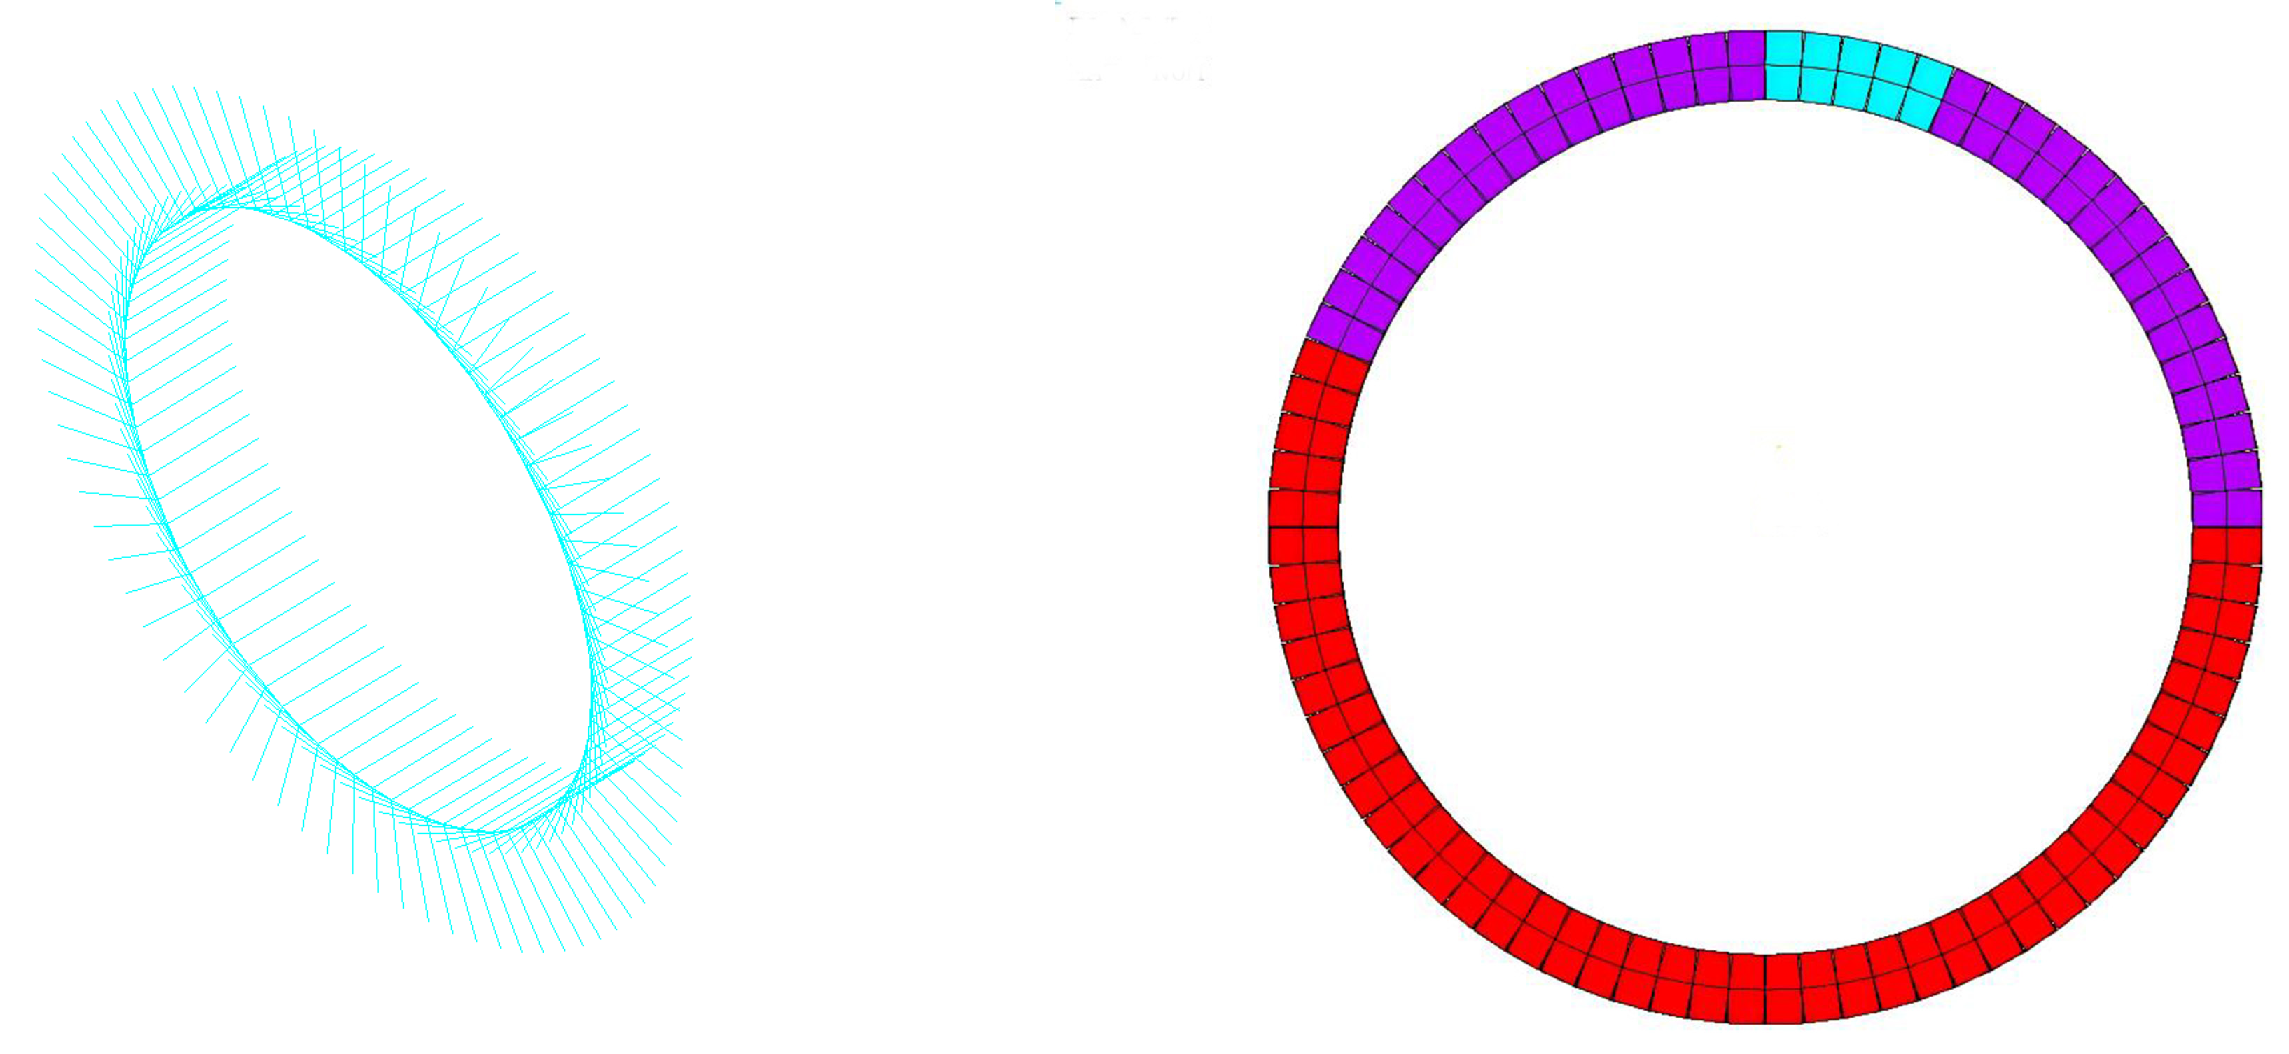
The article analyzed the lateral and longitudinal earthquake resistance of underwater tunnels using the reaction displacement method, and the foundation spring element was employed to represent the soil encasing the underground system. When a shear-wave vibrates in homogeneous strata along the horizontal direction, the resulting ground stress is the shear force in that place. The calculated strata shear force is applied to the corresponding lining position, formation movement is imposed on the restrained end of the strata elastic element according to the direction of action, and the structural load of the shield tunnel lining segment is obtained through calculation.
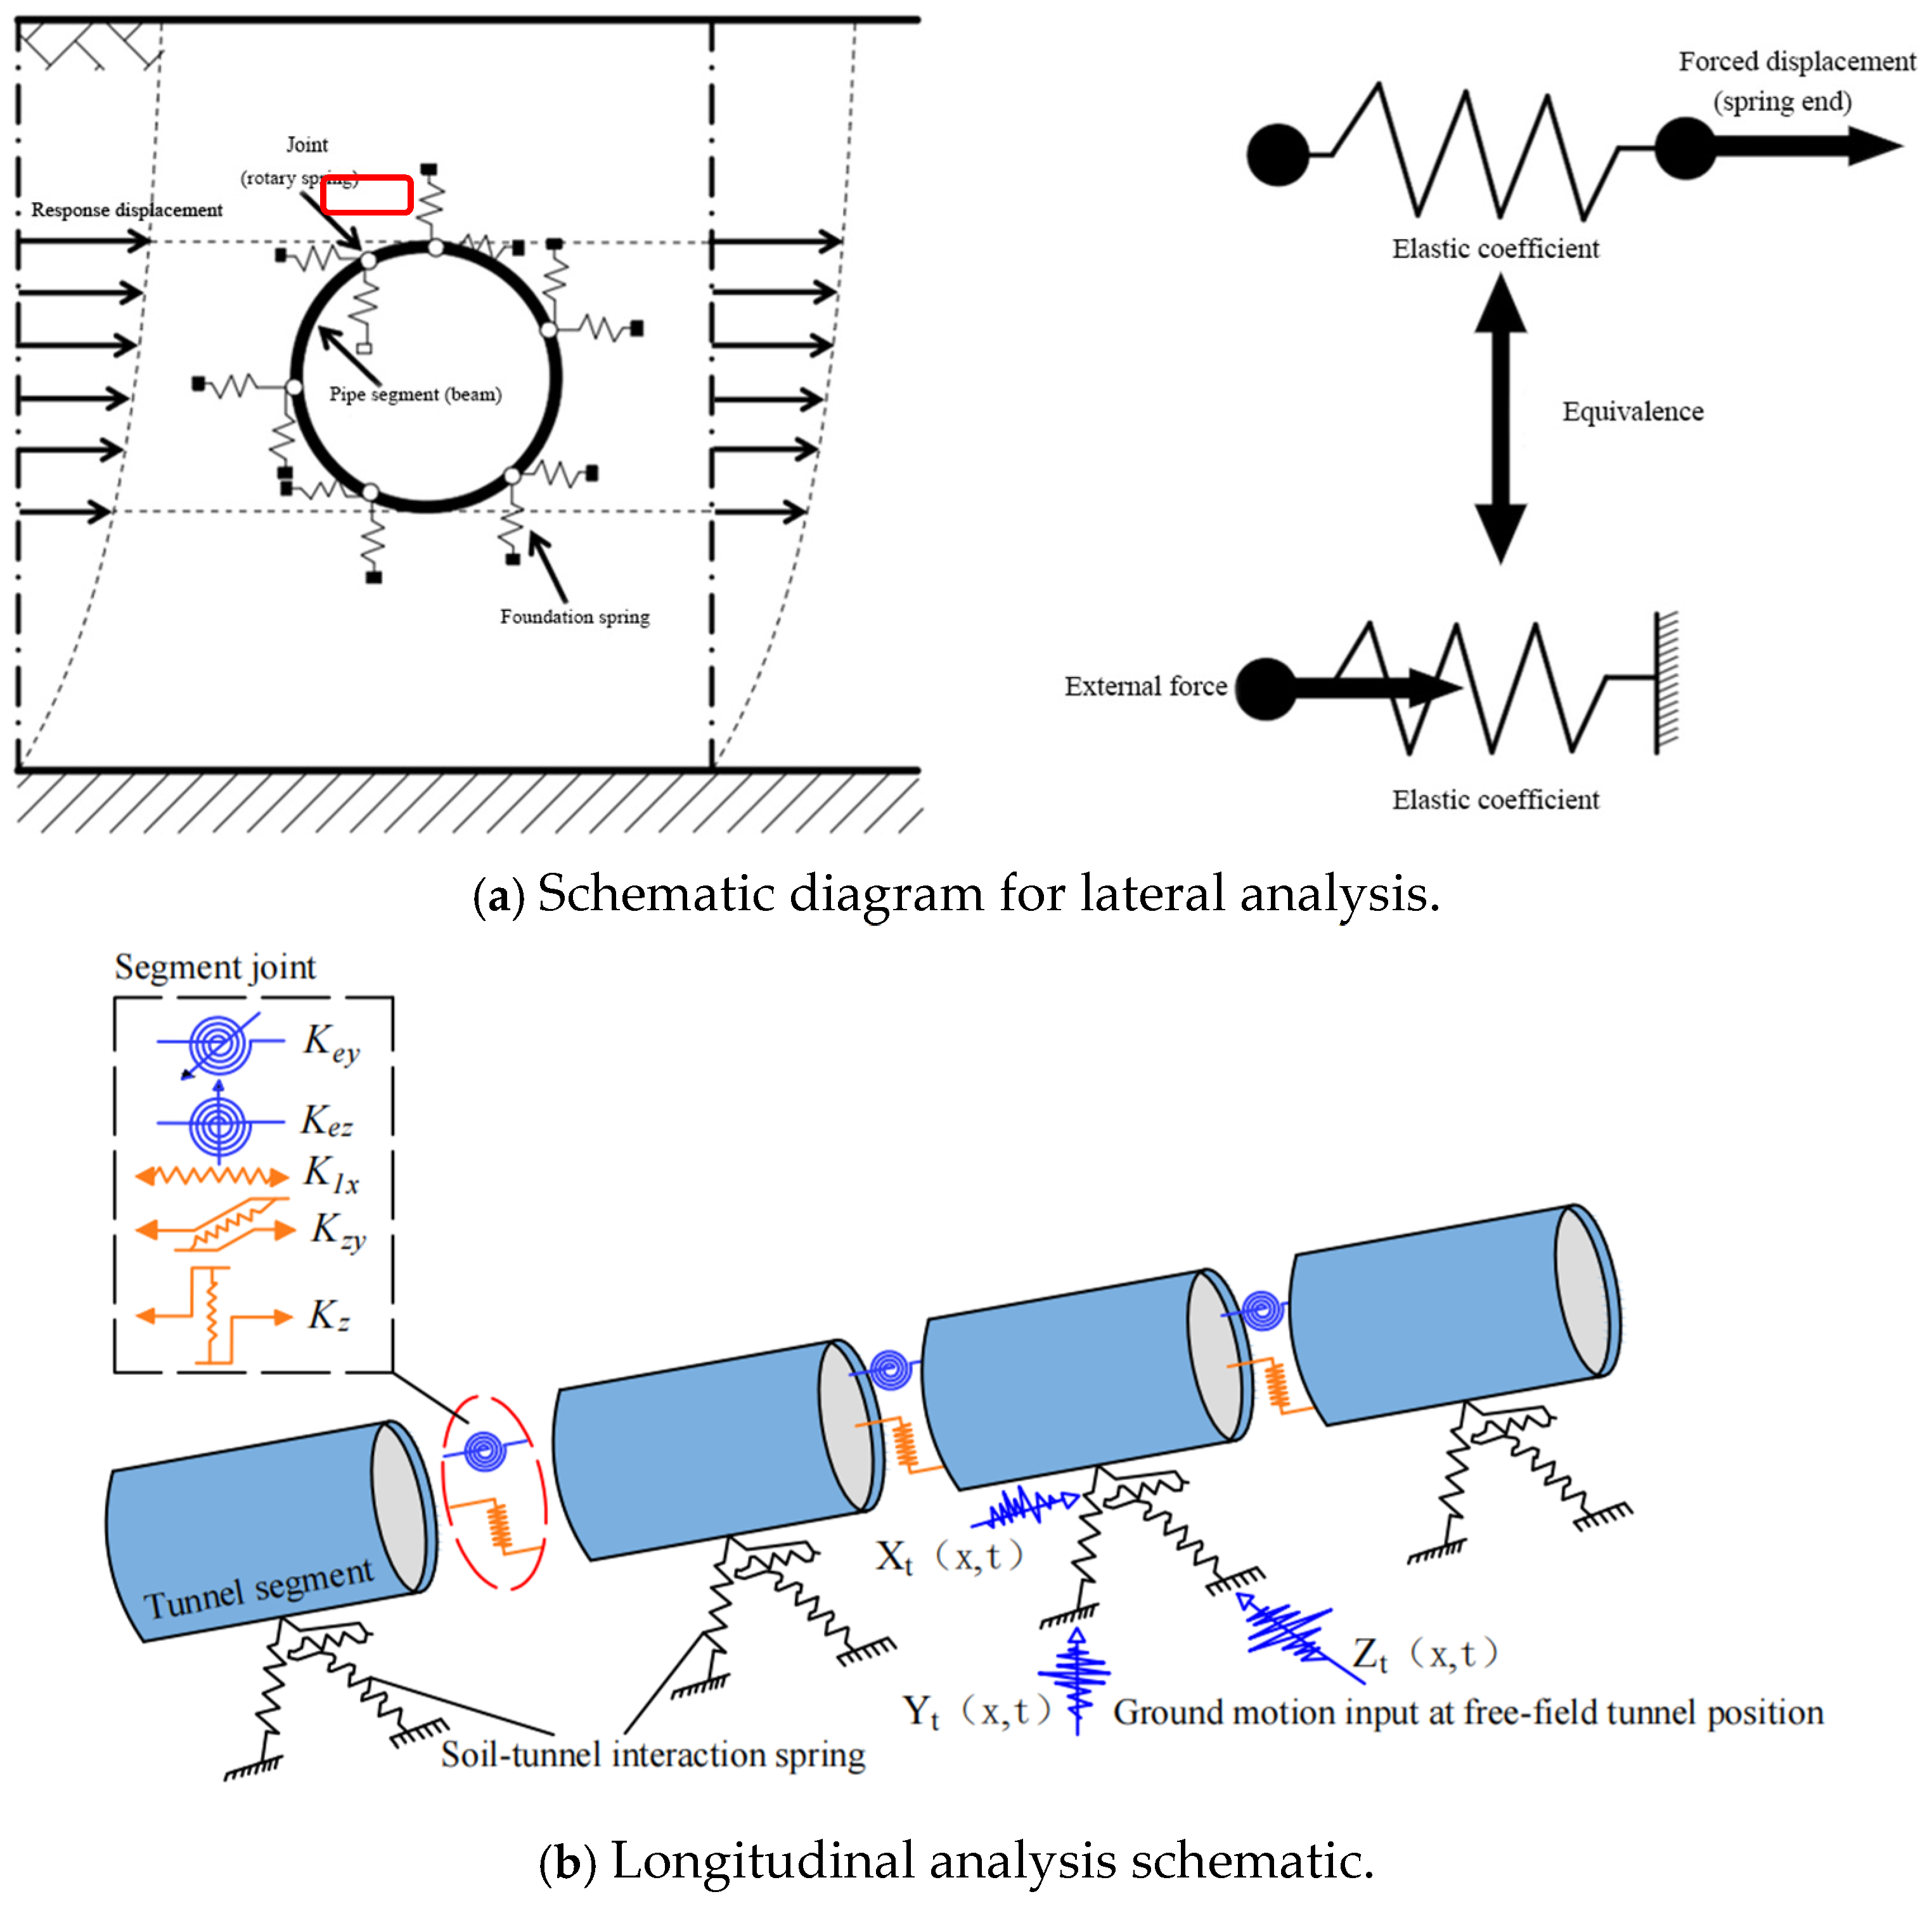
Based on the above basic theories, this paper used the SuperFLUSH/2D software to conduct free-field nonlinear dynamic study. The relative displacement of the surrounding soil under earthquake action was applied to the restrained end of the strata elastic element at the reaction zone of the analysis model in the form of static load, so as to determine the structural load and strain of the shield tunnel. The spring unit was used to simulate the segment joint using a normal spring, tangential spring, and torsion spring. The modeling principle is shown in Figure 1.
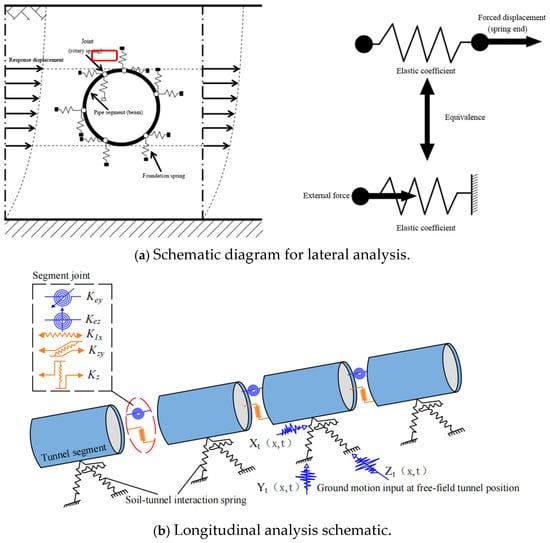
Figure 1.
Schematic diagram of response displacement method modeling.
2.2. Fluid–Solid Coupling
Fluid–solid coupling can be divided into strong coupling and weak coupling problems, and the corresponding solutions are achieved via the direct solution and the separation solution method. The coupling method is to combine the governing equations of the fluid domain and the structural domain into a unified equation simultaneously, but it is often used only for simple problem solving. However, most numerical analysis software employs the separation solution method, where the governing equations of the flow field and structural field are solved separately at each time step, with data exchanged through the coupling interface.
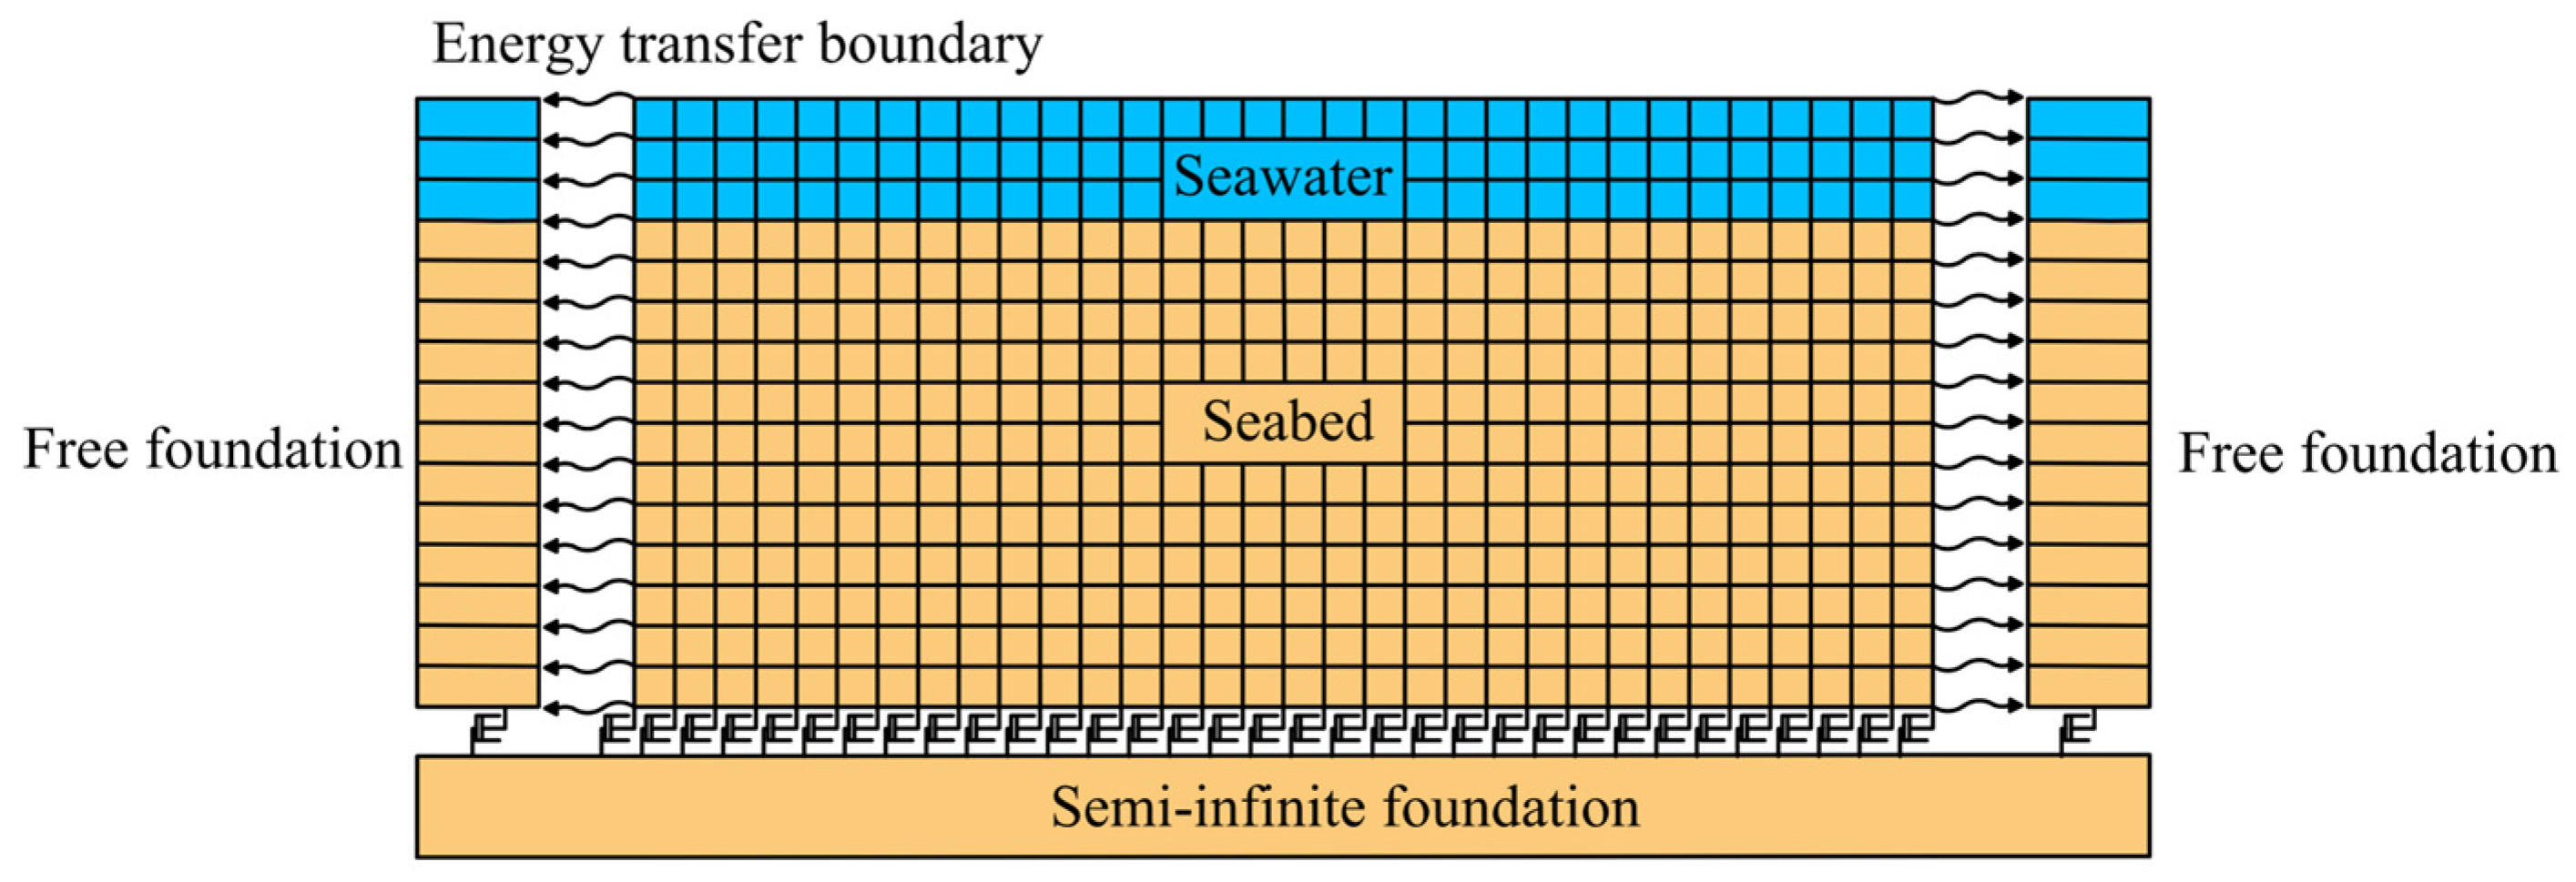
When a tunnel is in the environment of seawater or groundwater, the interaction between the dynamic characteristics of the water and the tunnel structure affect the long-term stability and safety of the tunnel. In particular, the pressure and temperature of seawater changes because of the depth of seawater or seasonal changes, which in turn affects the tunnel structure along with the permeability and mechanical conduction characteristics of the soil layer. Dynamic effects such as tides and waves periodically affect the tunnel structure and the surrounding soil layer. In the soft soil layer, because of the low bearing capacity of soil, the interaction between water and soil may lead to the settlement of the tunnel. In the interaction between soil and the tunnel structure, fluid–solid coupling mainly affects the mechanical properties of the soil and the stability of tunnel structure. This is because changes in fluid pressure and flow rate lead to the deformation of, and a reduction in the shear strength of, the soil, thus affecting the tunnel structure. In research and analysis, scholars often use the finite element method to discretize tunnel structures and the surrounding soil into small elements, solving for each element to obtain the distribution of variables such as strain within the tunnel framework and adjacent soil. The boundary element method is commonly used to discretize the fluid boundary of the submarine tunnel to deal with the unbounded domain problem. In this paper, the SuperFLUSH/2D software of Jishin Kogaku Kenkyusho, Inc. (Tokyo, Japan) was used to analyze the fluid–solid coupling problem between seawater and the soil layer. The interaction between seawater and the seabed is illustrated in Figure 2. The SuperFLUSH/2D software demonstrates superior capabilities in fluid–solid interaction analysis, with its principal advantages manifesting in four key aspects: (1) When the software performs fluid–solid coupling analysis, it can simulate the interaction of soil and structure at the same time. (2) The software can more truly reflect the deformation and failure of nonlinear soil under seismic load, thus providing more accurate analysis results. (3) The software can flexibly set complex boundary conditions and loading methods. (4) The software has efficient computing performance and a wide range of application scenarios.

Figure 2.
Schematic diagram of seawater–seabed interaction.
The fundamental principle of fluid–solid interaction lies in the mutual influence between the two media. Specifically, the fluid exerts pressure on the structure’s surface, inducing deformation, which in turn alters the fluid boundary. The basic formula of fluid–solid coupling includes the fluid control equation:
In the equation, represents the volumetric force vector; denotes the fluid density; represents the fluid velocity vector; denotes the shear force tensor; represents the fluid pressure; denotes the dynamic viscosity; and represents the velocity stress tensor.
The governing equations for solids are as follows:
In the equation, represents solid density; denotes the Cauchy stress tensor; represents the body force vector; and denotes the local acceleration vector in the solid body field.
The fluid–solid coupling equation is as follows:
In the equation, represents fluid; stands for solid; and , , , and are stress, displacement, heat flux, and temperature, respectively.
2.3. Engineering Cases
2.3.1. Engineering Overview
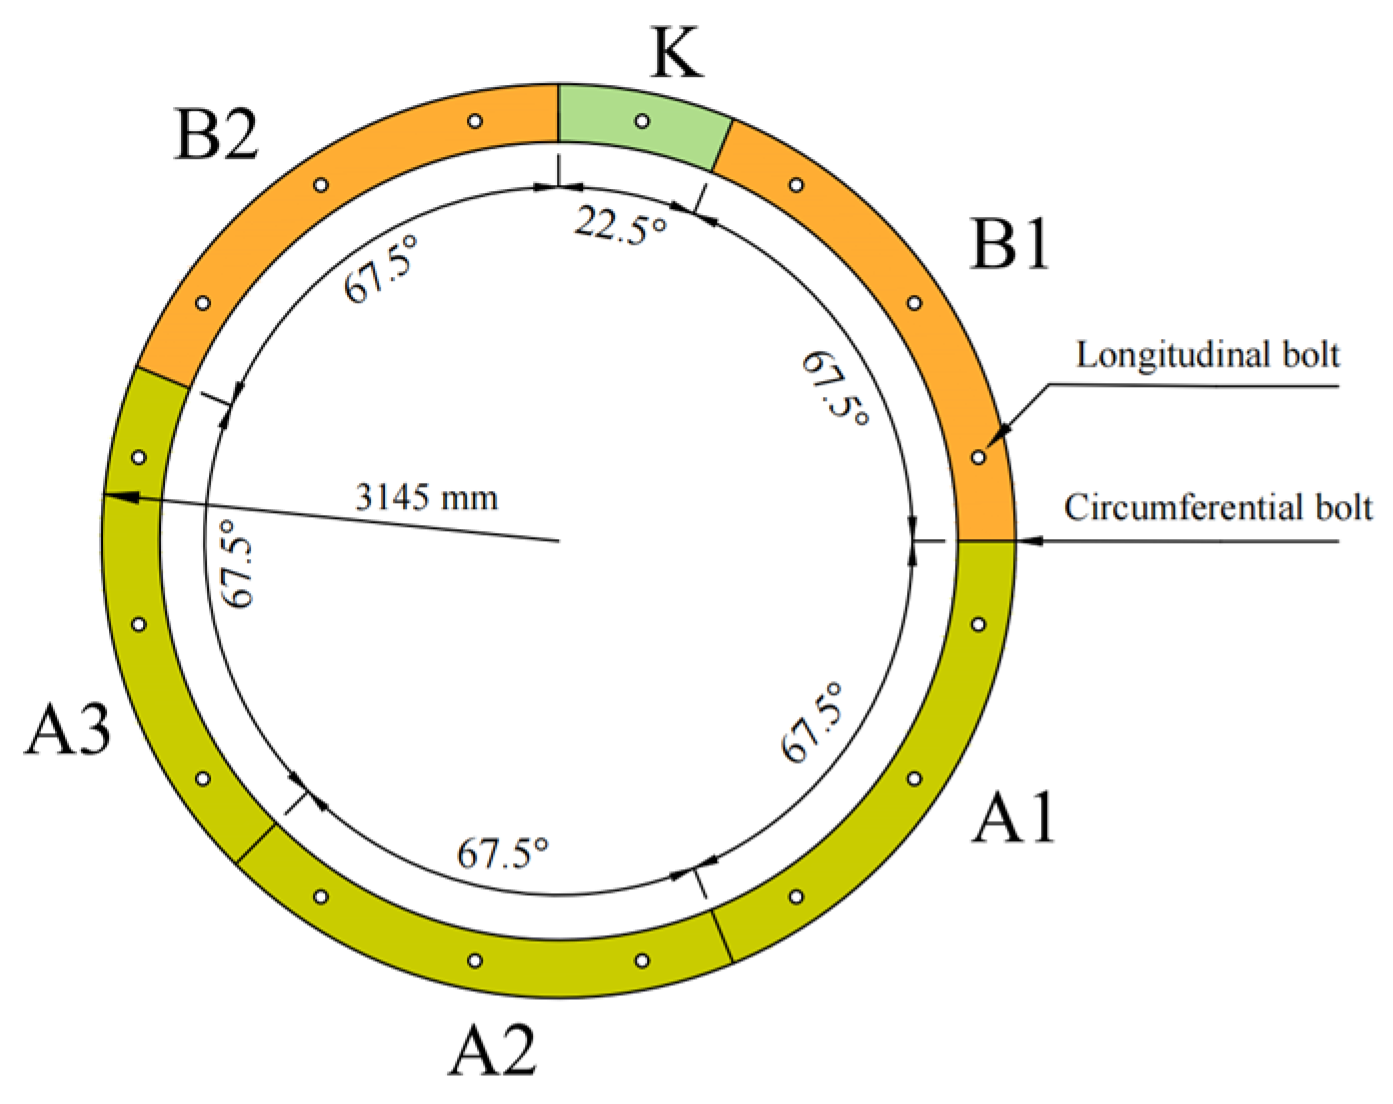
Based on a certain nuclear power project located along the southeastern coast of our country, a safety-grade water intake shield tunnel will be constructed. The planned inner diameter of the water intake tunnel is 6200 mm, with a segment thickness of 0.45 m, a total length along the tunnel axis of 984 m, and a bottom elevation ranging from −17.5 m to −28.5 m. The tunnel will be built with a natural foundation and shield technique, and the soil on the top of the pipe will be about 10 m. The tunnel lining will be made of precast reinforced concrete segments with a ring width of 1.2 m. Each ring will be assembled by staggered joints of 6 segments. There will be 16 longitudinal bolts between the ring and the ring, connected by straight bolts, and 12 ring bolts between the segments, connected by bent bolts. The tunnel’s cross-section is illustrated in Figure 3.
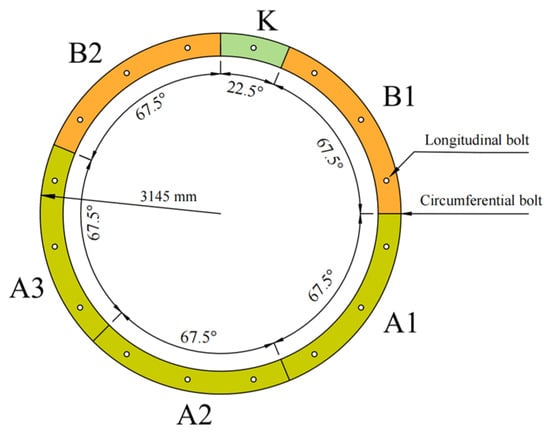
Figure 3.
Details of tunnel cross-section.
2.3.2. Soil Calculation Parameters
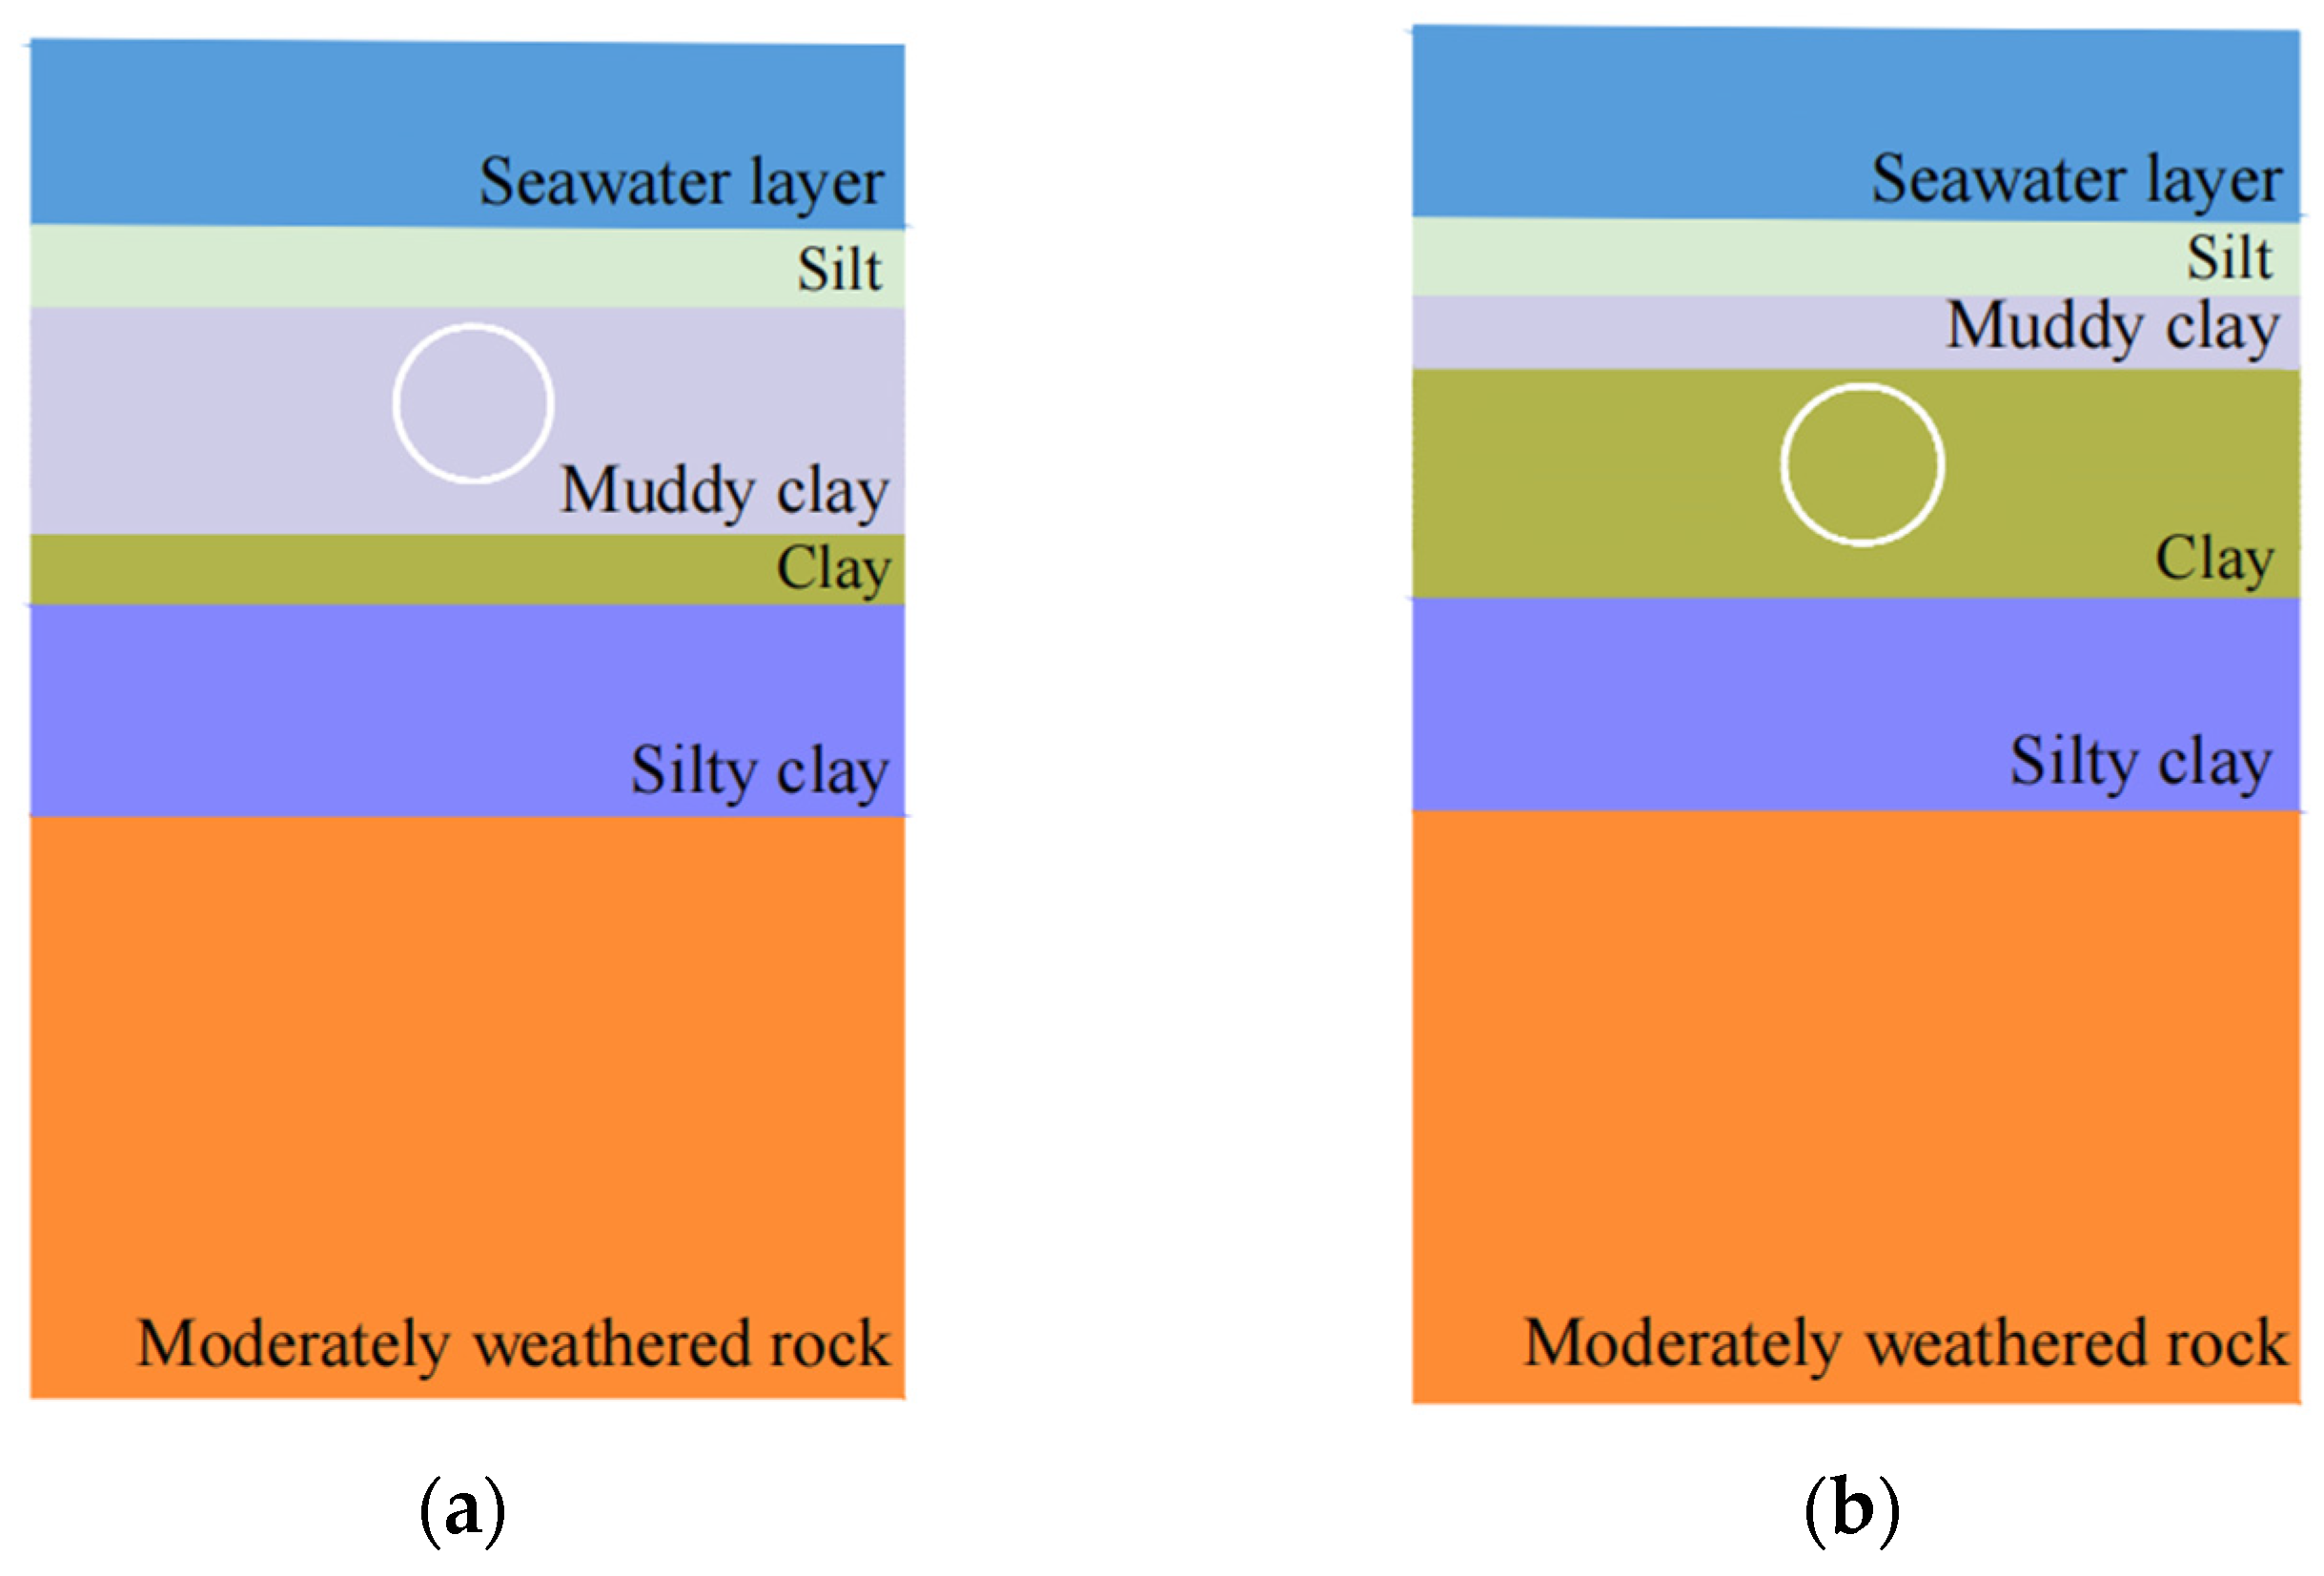
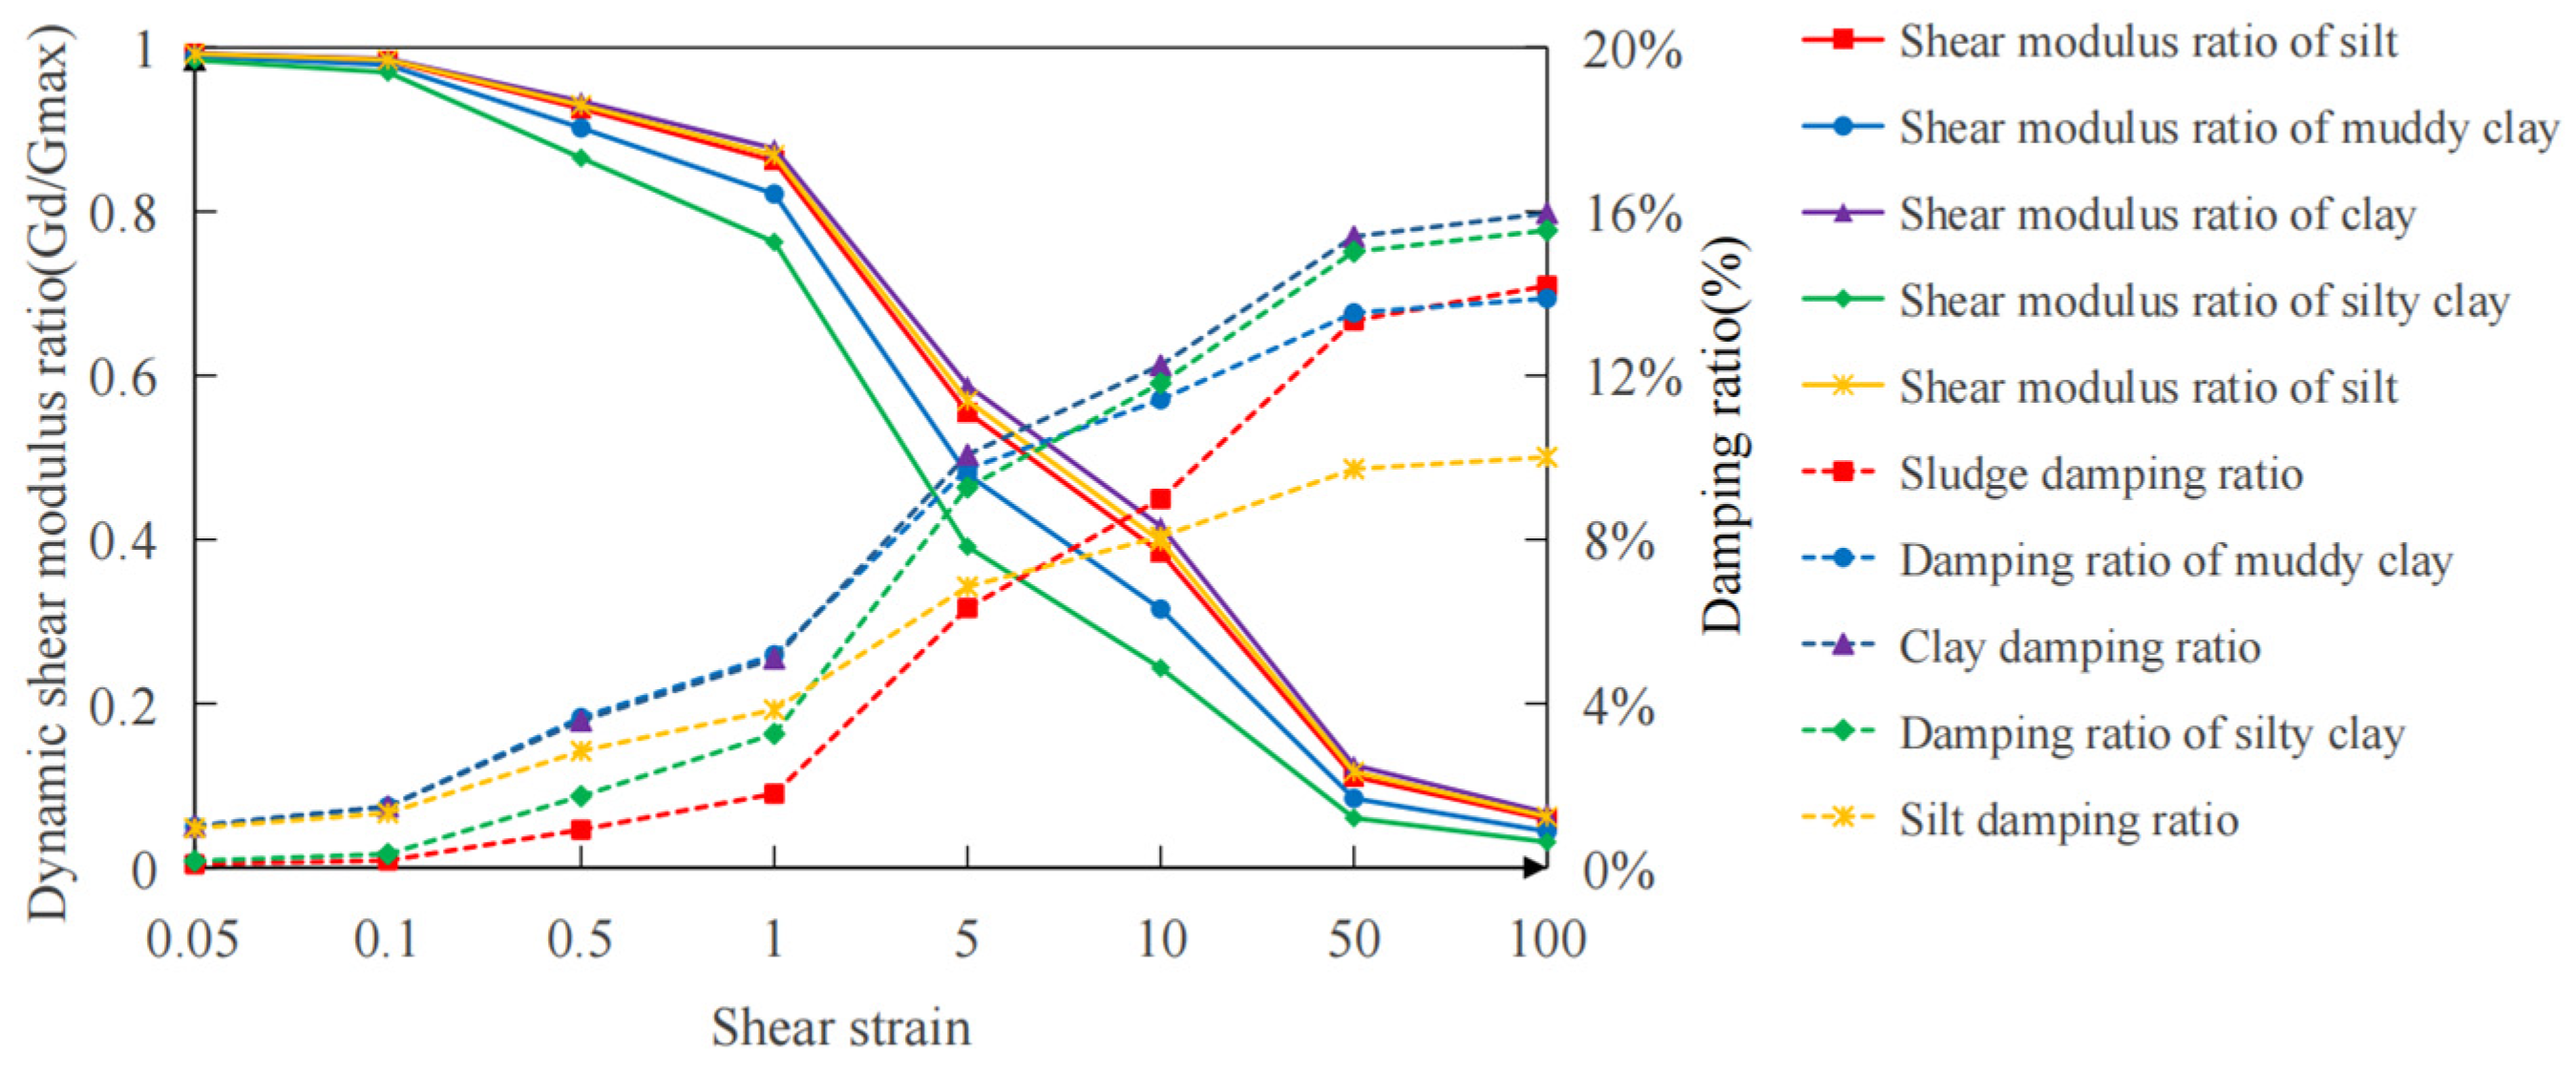
According to the geological safety assessment report, the two most unfavorable sections were selected for calculation and analysis. When the tunnel displaces the silty clay layer, it can be represented by cross-section 1, and when the tunnel displaces the clay layer, it can be represented by cross-section 2. The profile of the soil layer at the site is depicted in Figure 4, and the characteristics of the lining and soil are presented in Table 1. The calculation parameters are mainly taken from the Geotechnical Investigation (Detailed Survey) Report of the Drainage Structure in the Preliminary Design Stage of the first phase of the Sanmen Nuclear Power Plant. The modulus ratio and damping ratio data of the soil samples are presented in Figure 5.

Figure 4.
Engineering geology profile. (a) Schematic of soil layer in cross-section 1; (b) schematic of soil layer in cross-section 2.

Table 1.
Computation values for the lining and soil strata.
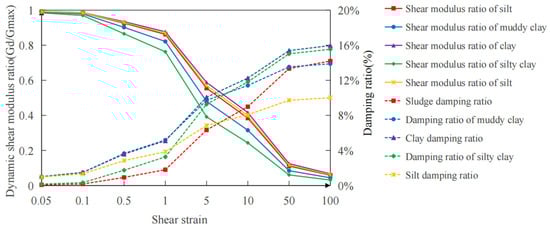
Figure 5.
The modulus ratios and damping ratios of the soil at the seabed tunnel site.
2.3.3. Design Ground Motion Parameters
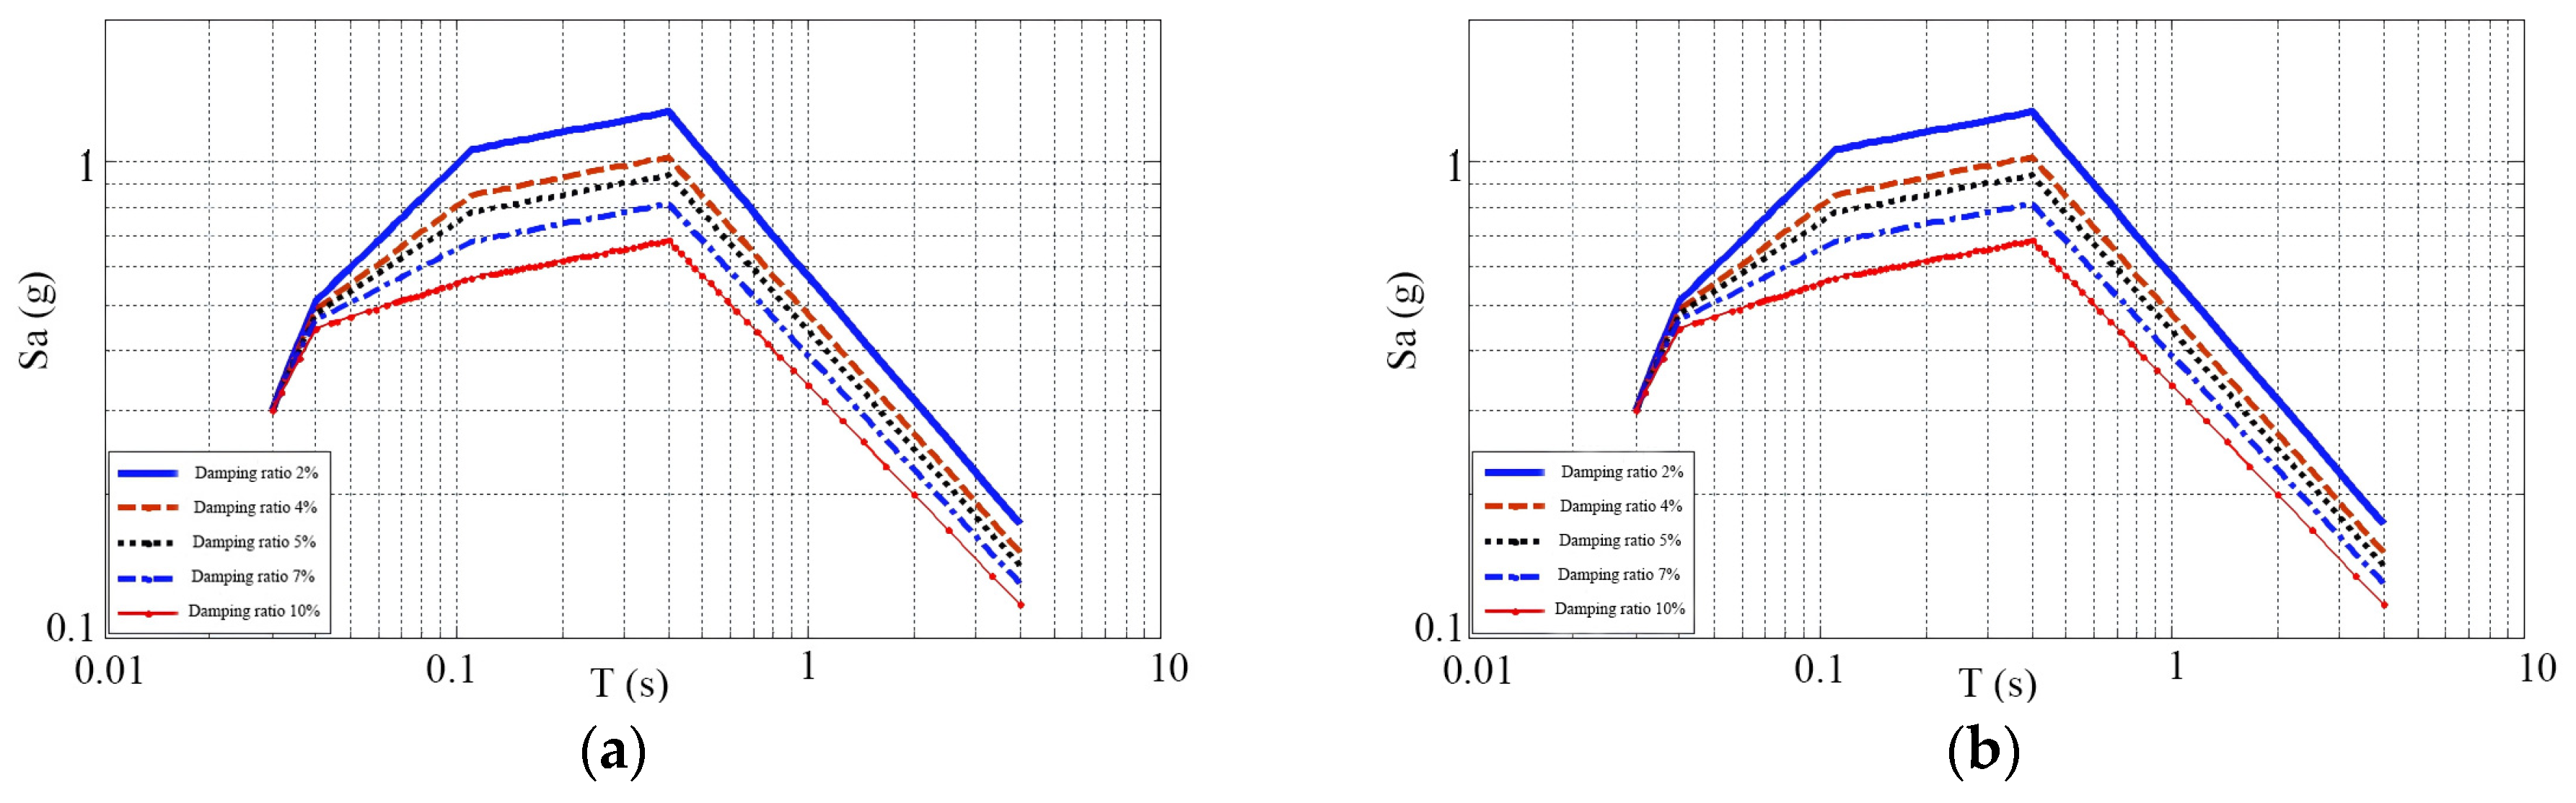
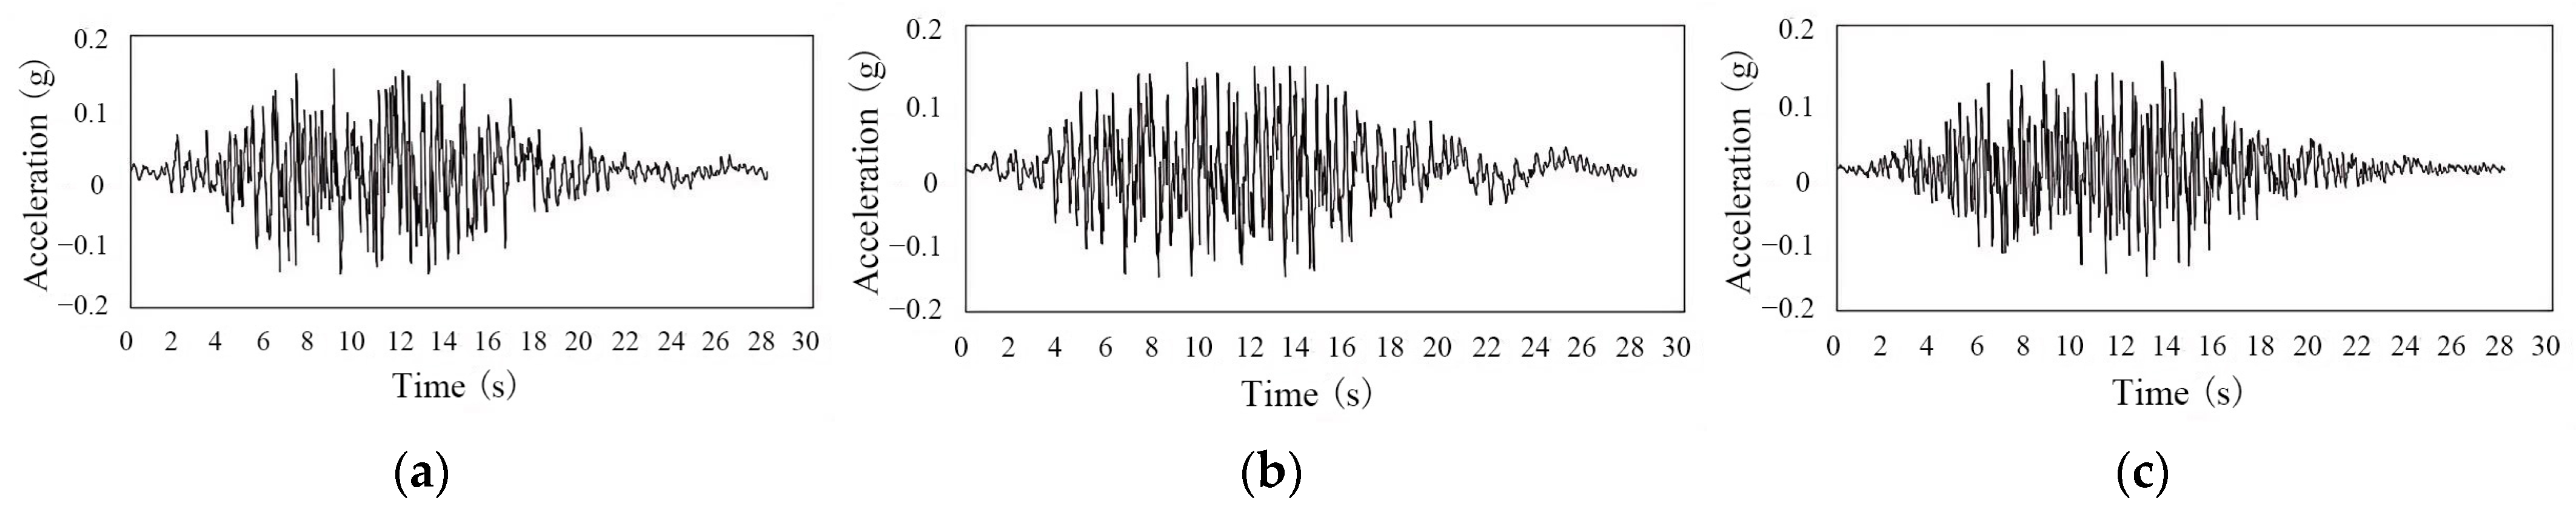
Sanmen Nuclear Power Plant was built in Sanmen County, Wenzhou City, Zhejiang Province, China, using advanced technology and strict seismic design standards. The nuclear power plant is located in a seismically active area, so the impact of earthquakes must be considered in the design process to ensure the safety and stability of the plant structure. The site response spectrum provided by the seismic safety assessment data of Sanmen Nuclear Power Plant’s engineering site is shown in Figure 6. The reason for conducting seismic safety assessment is to evaluate the ground motion characteristics of the site and other factors that may affect structural safety so as to provide basic data for seismic design. The design value of the horizontal peak acceleration of SL-2 bedrock was 0.15 g, and the vertical peak acceleration was 0.10 g. The shaking duration of this site was 28 s. The seismic response curve of the bedrock is illustrated in Figure 7.
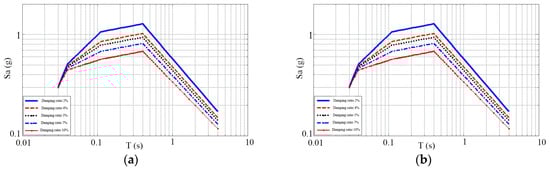
Figure 6.
Site SL-2 level design benchmark acceleration response spectrum. (a) Horizontal design benchmark acceleration response spectrum; (b) vertical design benchmark acceleration response spectrum.
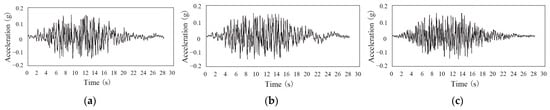
Figure 7.
Seismic response curve of ground motion. (a) Horizontal earthquake element 1; (b) earthquake element 2; (c) vertical earthquake element.
2.4. Numerical Analysis Model
2.4.1. Lateral Analysis Model
In this study, a lateral beam–spring framework for the shield tunnel was employed to conduct a simulation. In this analysis, the built-in Beam188 element of ANSYS was employed to simulate the shield segments, and the Combin14 element was employed to model the joints with various degrees of freedom. Six joint springs were set according to the joint parts of the ring assembly segments, and the lateral analysis model is depicted in Figure 8.
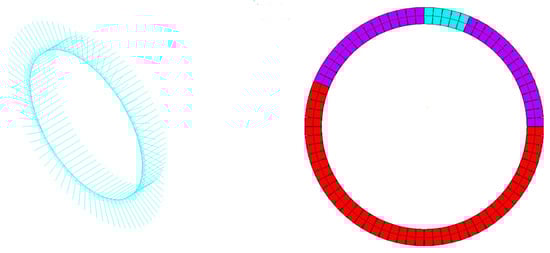
Figure 8.
Lateral beam–spring model of shield tunnel.
The monitoring points for studying the deformation rates of the tunnel diameter and joint-opening were set as shown in the Figure 9.
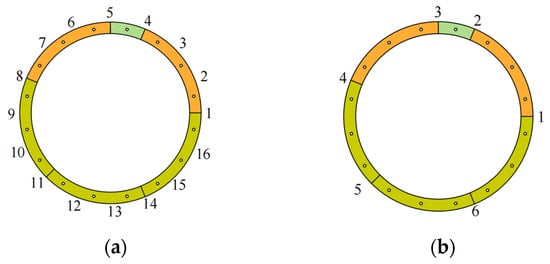
Figure 9.
Schematic diagram of location numbers of monitoring points of tunnel lining segments. (a) The monitoring position of the deformation rate of the lining segment’s diameter; (b) the monitoring position of the lateral joint-opening amount of the lining segment.
2.4.2. Longitudinal Analysis Model
The overall length of the model was 984 m, consisting of 820 segments, among which a partial model of the tunnel is depicted in Figure 10. According to the investigation results of the water intake project for the nuclear power plant, combined with the Code for Seismic Design of Urban Rail Transit Structures [30] and the Standard for Seismic Design of Underground Structures [31], the seismic performance calculation conditions of shield tunnel joint were determined. In order to better represent the relationship between the joint-opening amount and the longitudinal foundation position with the response displacement method, the stiffness coefficient of the spring between the longitudinal rings was calculated according to the stiffness combinations of the three kinds of bolts set in Table 2.
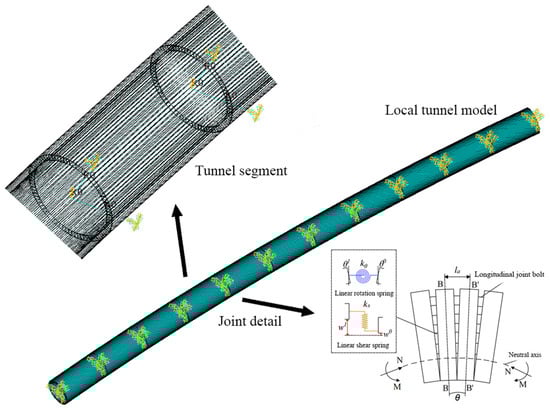
Figure 10.
Longitudinal beam–spring model of the shield tunnel.
Table 2.
Joint stiffness coefficients under different working conditions.
Through the foundation spring, the role of the foundation soil layer on the structure was reflected, so the accuracy of the spring coefficient had a significant impact on the computation outcomes. The spring constant is generally determined by multiplying the foundation bed modulus by the area of action. The calculation is shown in the following formula. Each node in the model was set with foundation springs along the tunnel’s longitudinal and lateral axes.
In the equation, k is the compression or shear foundation spring coefficient; K is the foundation coefficient; L is the influence length of the formation spring; and d represents the calculated extent of the longitudinal ground layer of the tunnel.
k = KLd,
2.4.3. Free-Field Analysis
In seismic analysis, scholars often need to consider the magnification effect of the soil layer. Soil layer amplification means that when seismic waves pass through different soil layers, the wave speed slows down, and the energy is amplified, resulting in an increase in earthquake amplitude. Generally, the soft soil layer is more prone to amplification than the hard soil layer. The soil exhibits nonlinear behavior under strong earthquake action. Its shear modulus decreases with increasing deformation, which results in a change in seismic wave propagation. The soil layer may have different amplifying effects on seismic waves of different frequencies, and the amplifying effect on low-frequency seismic waves is more obvious.
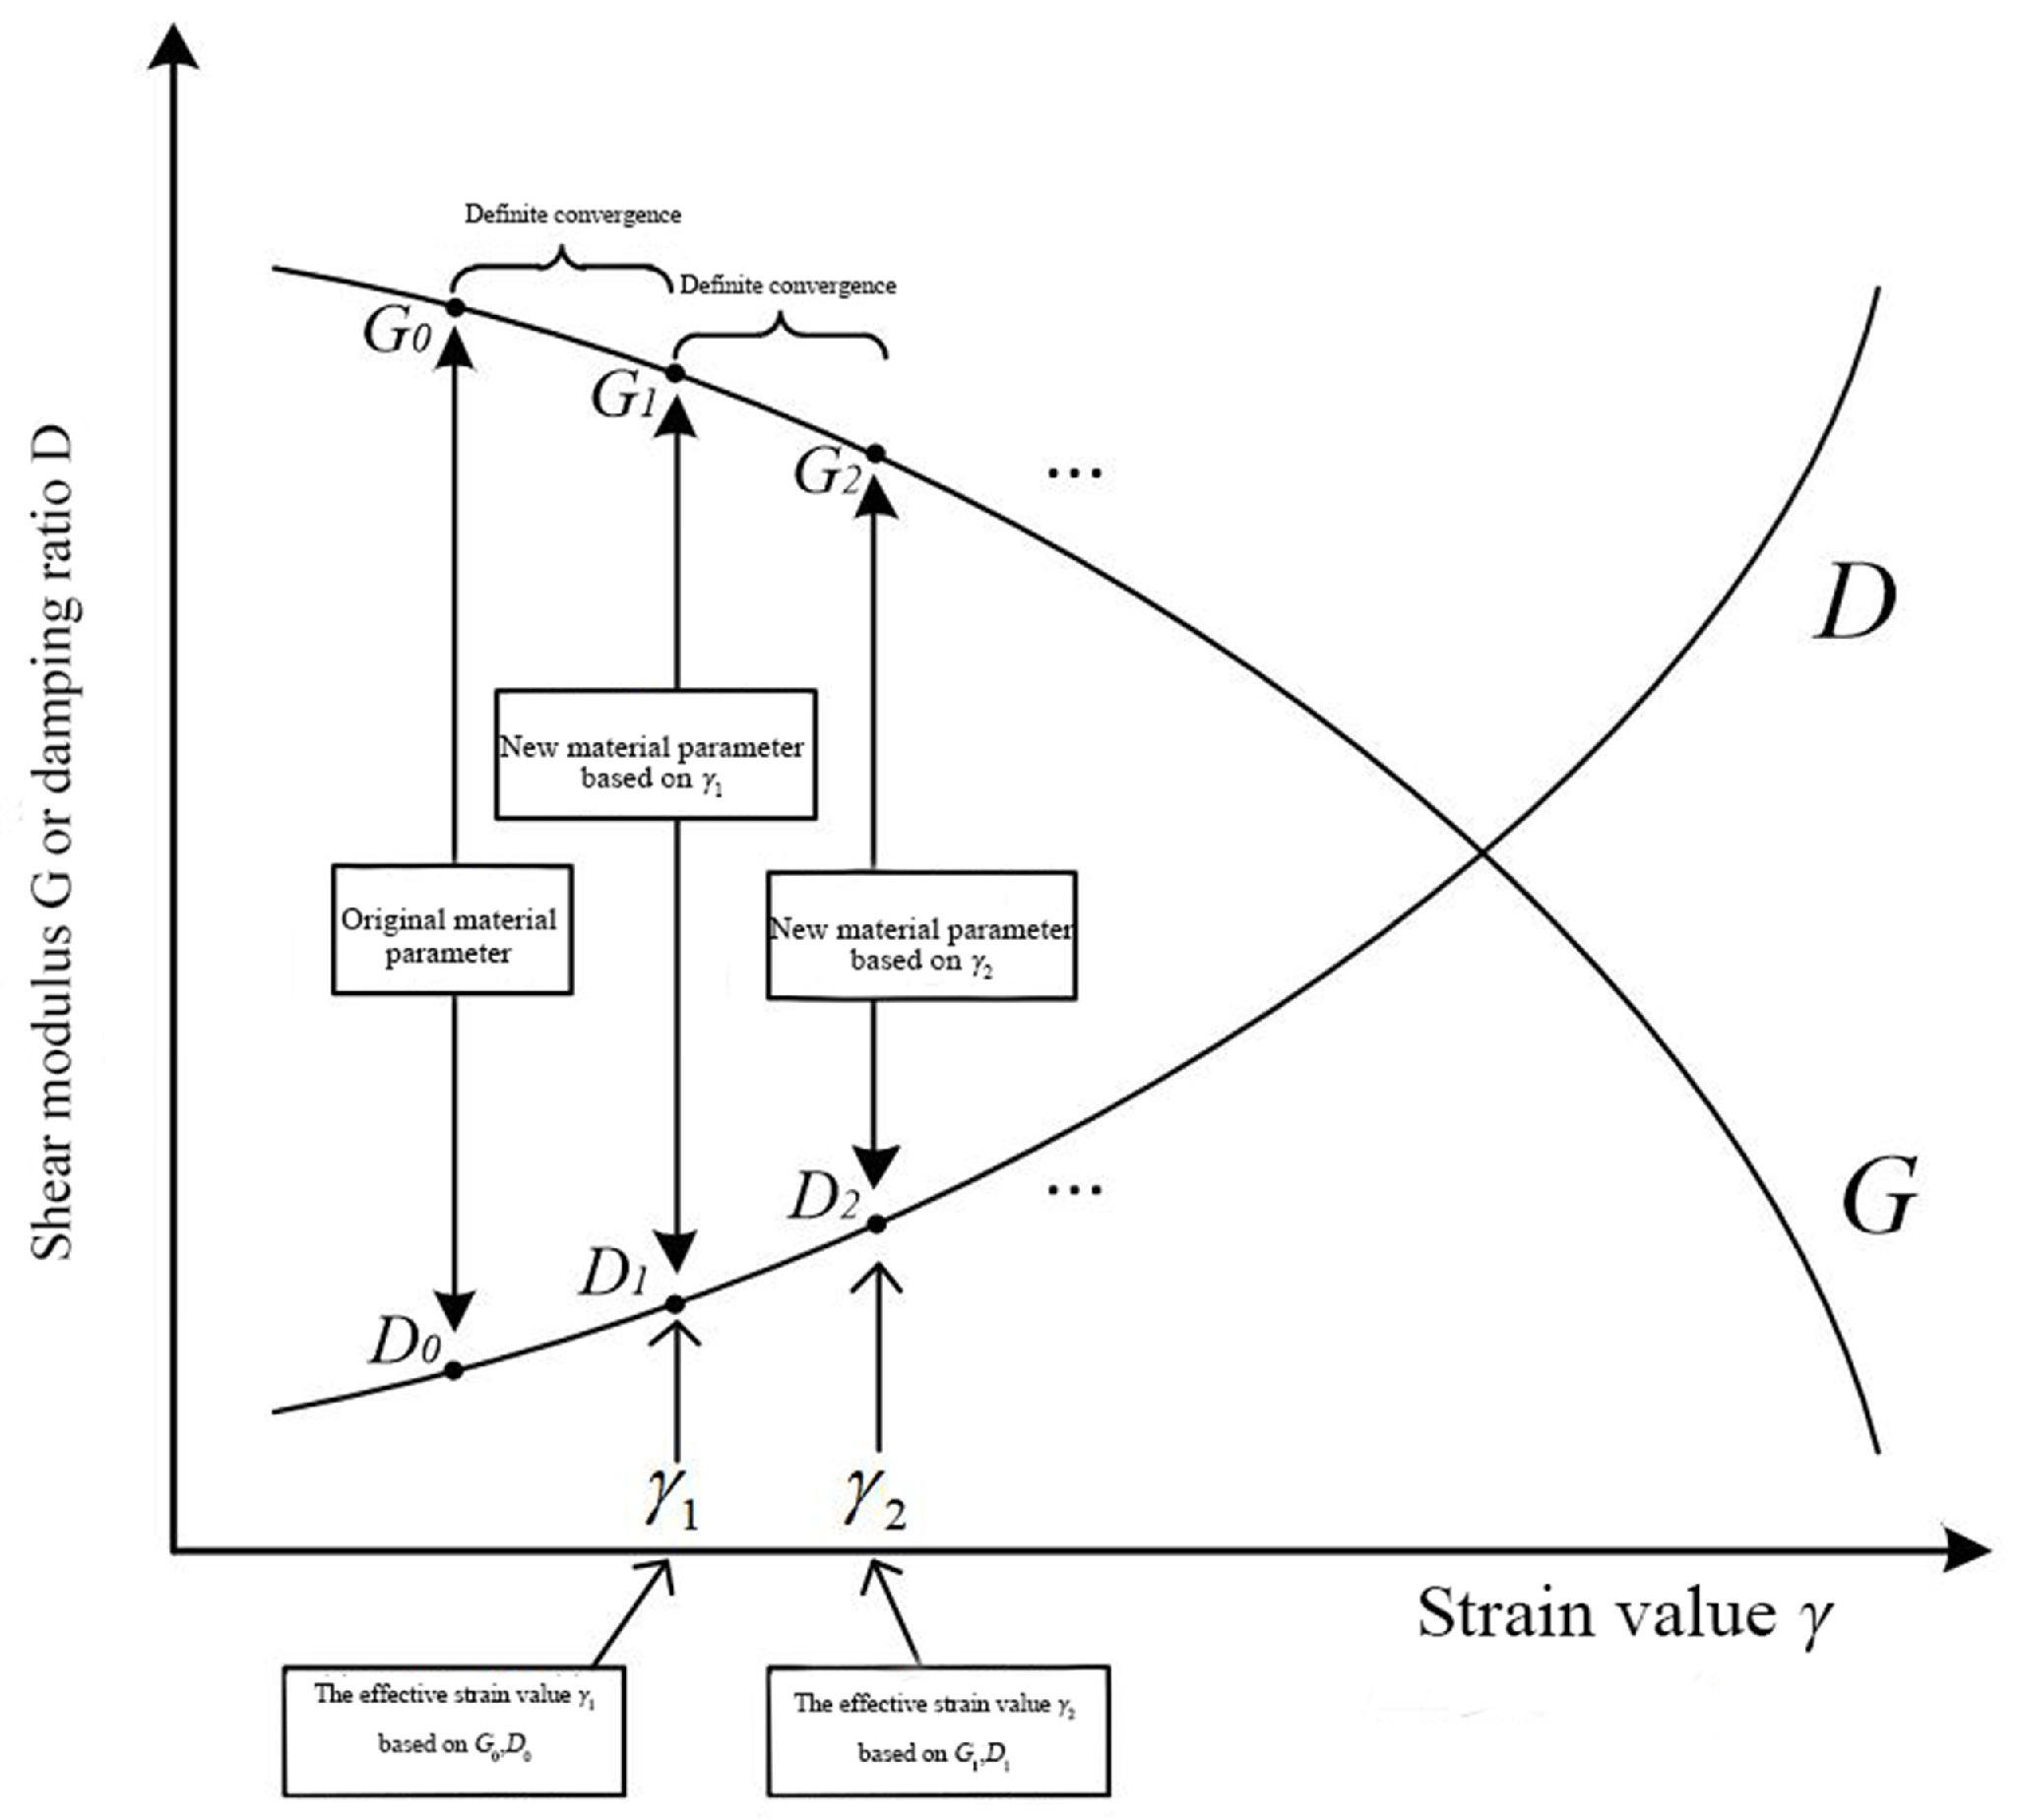
In dynamic analysis, it is essential to account for the nonlinear material characteristics of the soil. From this point of view, the free-field model of the site along the shield tunnel was established through the SuperFLUSH/2D program for equivalent linear analysis, and the nonlinear issue was converted into a linear one by employing the equivalent linear approach. The principle of the equivalent linear method is that the elastic analysis is carried out in each step of the calculation, but the soil modulus and damping ratio change nonlinearly according to the specified mode in the whole time history analysis process. The critical aspect of using the equivalent linearization approach is determining the effective shear strain of the soil mass. First, an equivalent shear strain is defined according to the material characteristics for a dynamic analysis. Subsequently, as shown in Figure 11, a revised equivalent shear modulus and damping ratio of the soil mass are derived based on the G~γ and D~γ curves in order to account for the nonlinear behavior of the soil mass. The longitudinal analysis model of the global site of the shield tunnel is shown in Figure 12. The damping boundary was placed at the base of the free-field configuration and along both lateral edges, and the ground motion was input in the form of equivalent nodal force. The relative displacement of the soil layer in the global frame of the submerged tunnel was then obtained through nonlinear seismic response analysis.

Figure 11.
G~γ and D~γ curves.
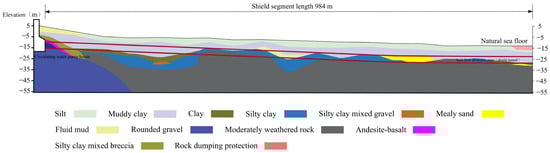
Figure 12.
Geological longitudinal profile map of the tunnel location.
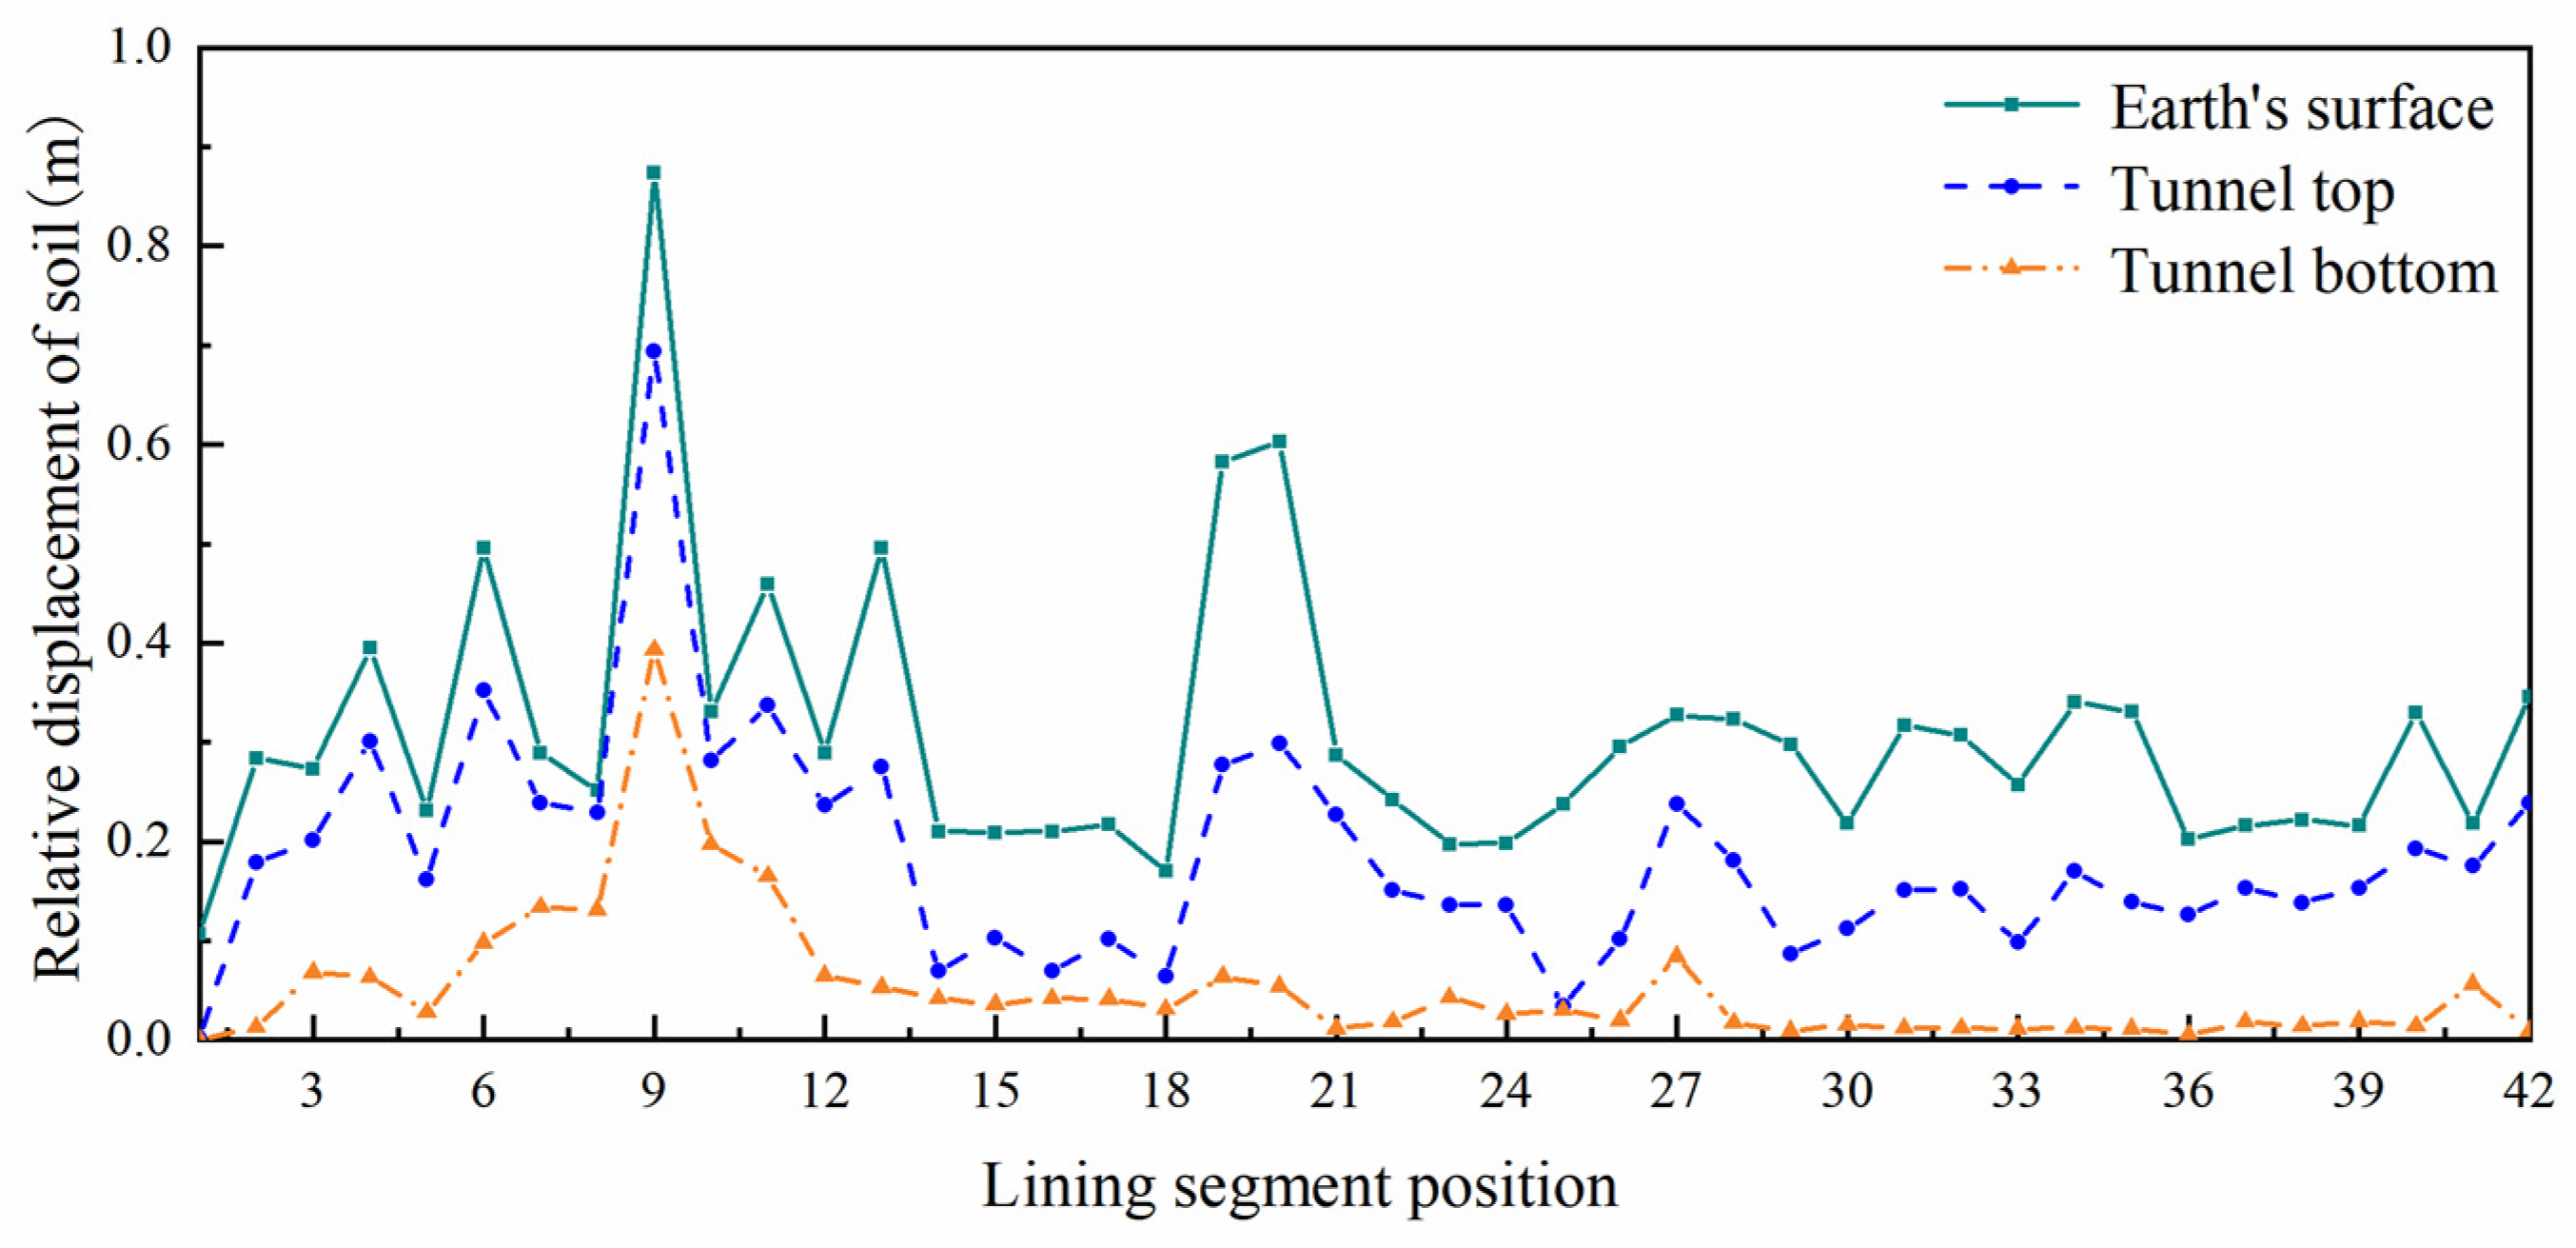
After extracting the comprehensive nonlinear earthquake response data of the tunnel, the displacement values between the soil surface and the upper and lower sections of the shield tunnel were obtained and are presented here in the form of images. As observed in Figure 13, the relative displacement results of soil layers separated by every 20 rings or 24 m are shown. These results were applied to the end of the soil spring. Subsequently, an investigation was carried out into the earthquake resistance of shield tunnels.
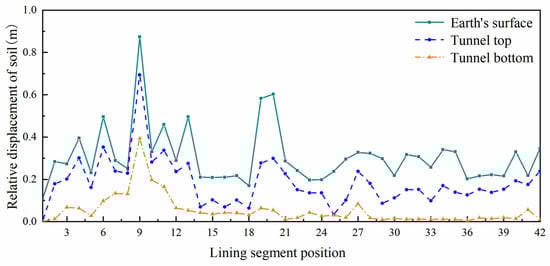
Figure 13.
Displacement variation of the soil layer throughout the entire tunnel area.
3. Results
3.1. Results of Lateral Analysis
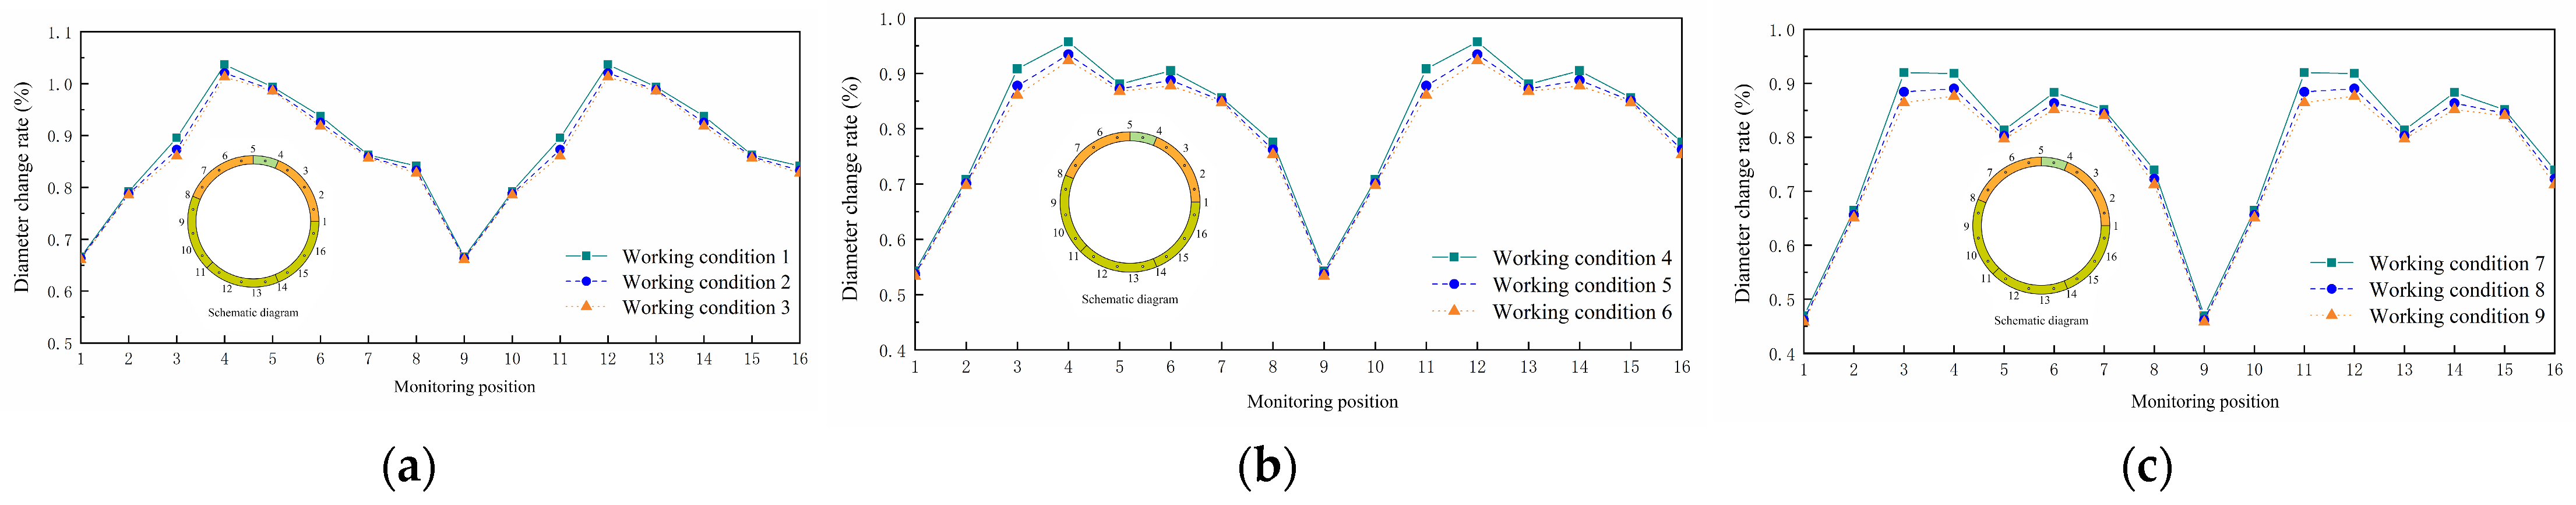
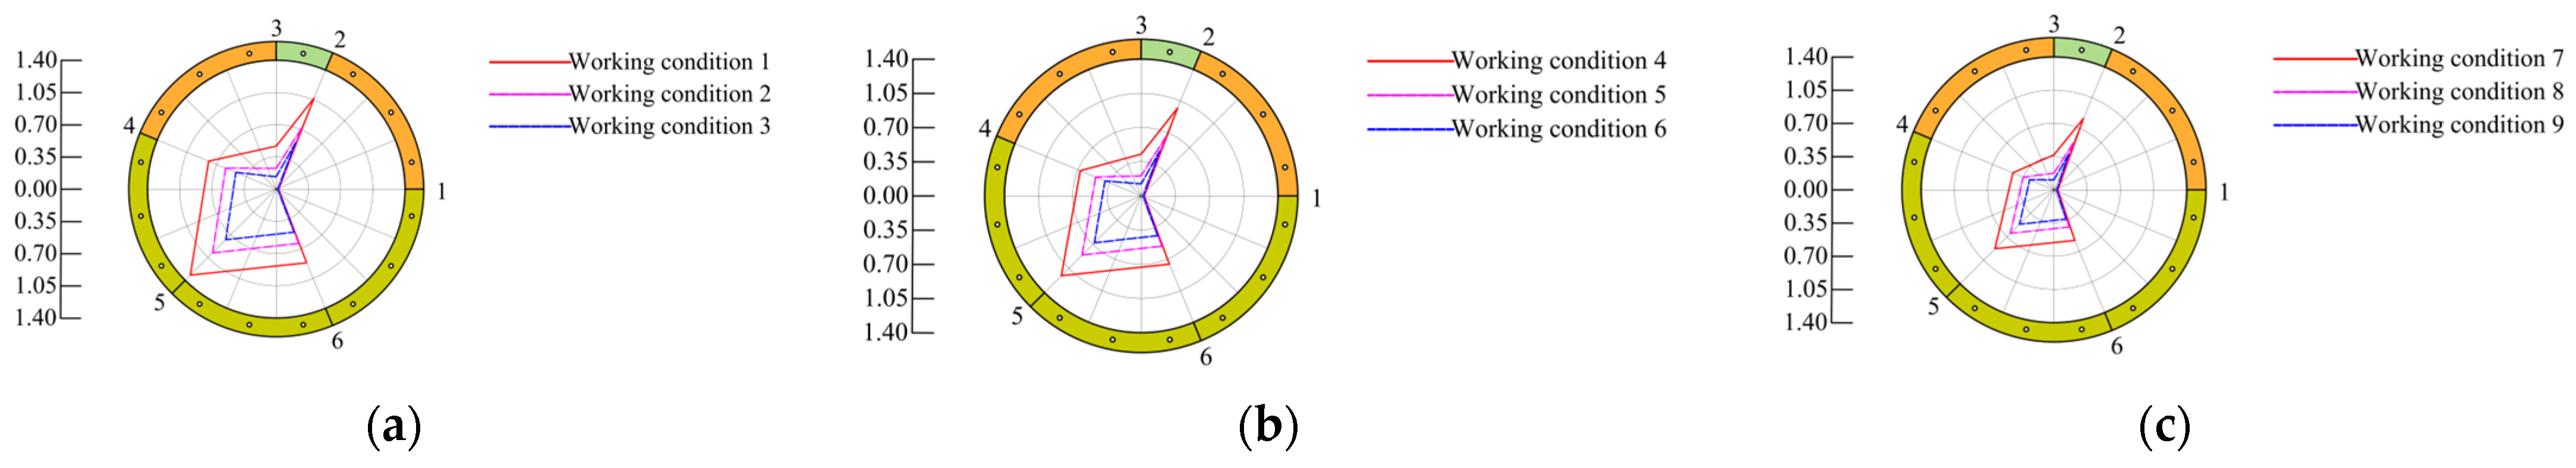
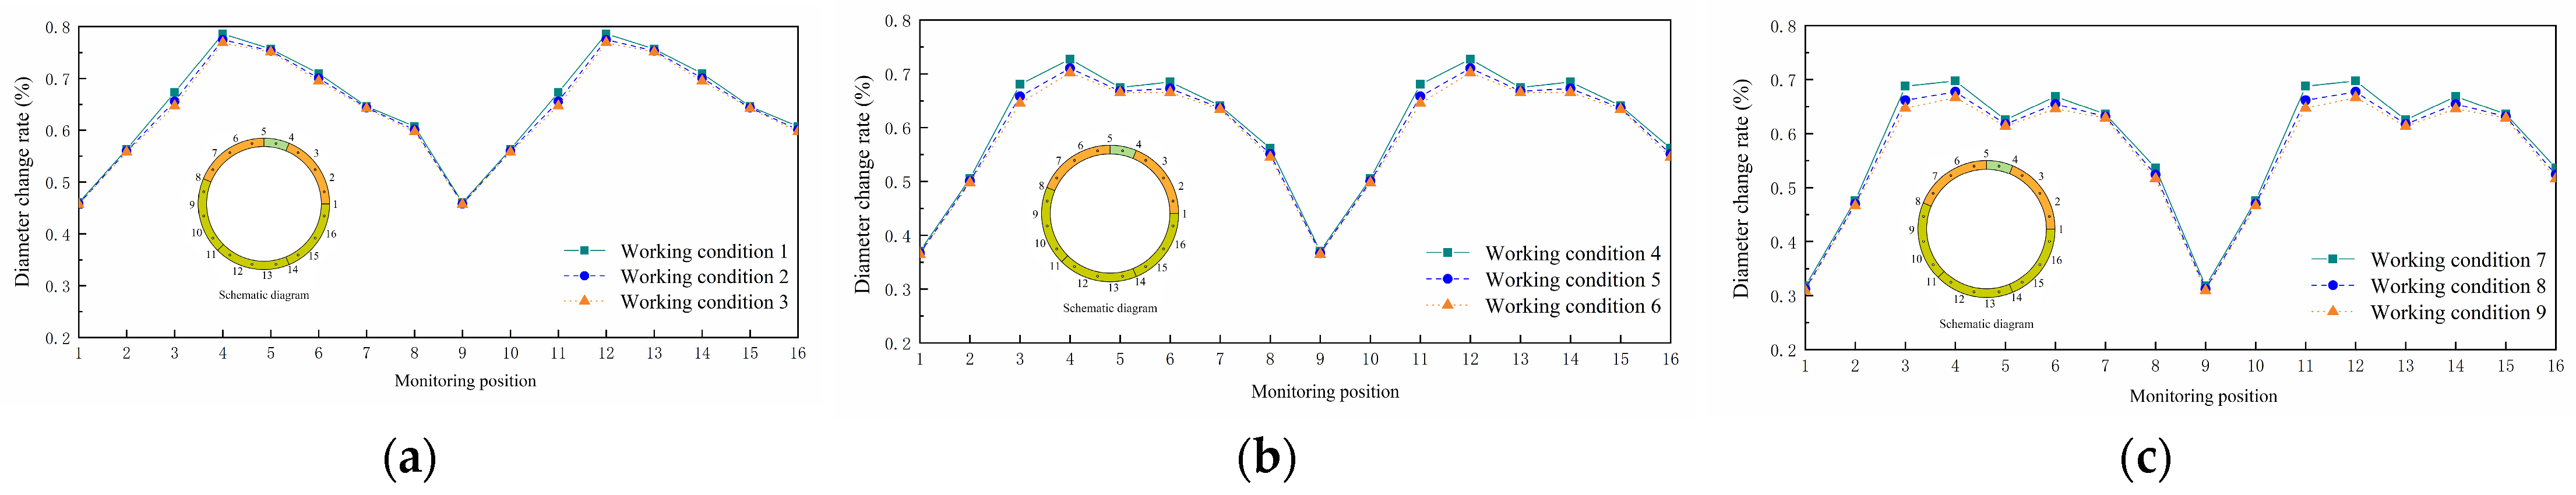
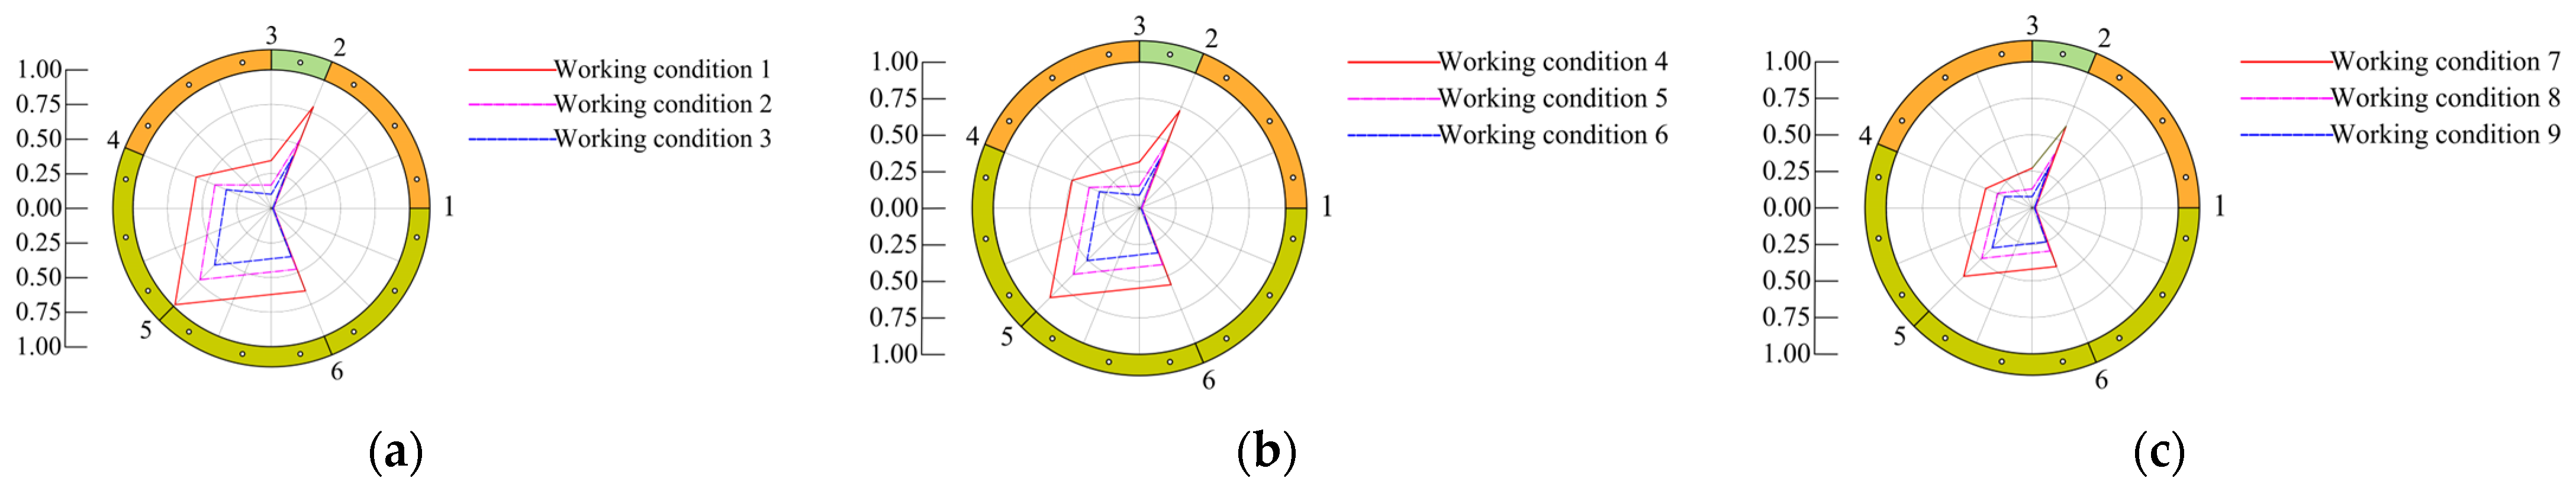
Irregular subsidence of soil layers and seismic vibrations can greatly impact the service life of shield tunnel joints. Therefore, the rate of change in the tunnel lining’s diameter and the circumferential joint-opening amount can serve as the key parameters for assessing the lateral earthquake resistance of the shield tunnel. It can be clearly understood through Figure 14 and Figure 15 that under SL2 seismic excitation of section 1, when the joint bolt was in M24 working condition 1 with low stiffness, the maximum diameter change rate of lining segment was 2.073%, and the maximum joint-opening amount was 1.324 mm. In addition, the joint bolt was in M36 working condition 9 with large stiffness, the maximum diameter change rate of the lining segment was 1.752%, and the maximum joint-opening amount was 0.515 mm.
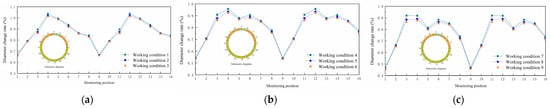
Figure 14.
Section 1: diameter change rate of the lining tube under different bolts. (a) M24 bolt; (b) M30 bolt; (c) M36 bolt.
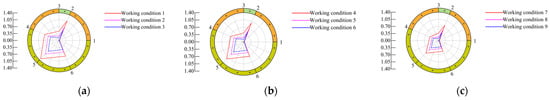
Figure 15.
Section 1: joint-opening amounts of the ring bolt of the lining segment under different bolts. (a) M24 bolt; (b) M30 bolt; (c) M36 bolt.
In the same manner, it can be understood from Figure 16 and Figure 17 that under SL-2 seismic excitation of section 2, when the joint bolt was in M24 working condition 1 with low stiffness, the maximum diameter change rate of the lining segment was 1.572%, and the maximum joint-opening amount was 0.984 mm. In addition, the joint bolt was in M36 working condition 9 with large stiffness, the maximum diameter change rate of the lining segment was 1.334%, and the maximum joint-opening amount was 0.387 mm.
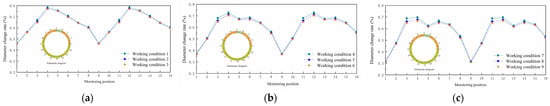
Figure 16.
Section 2: diameter change rate of the lining tube under different bolts. (a) M24 bolt; (b) M30 bolt; (c) M36 bolt.
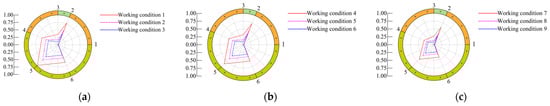
Figure 17.
Section 2: joint-opening amounts of the ring bolt of the lining segment under different bolts. (a) M24 bolt; (b) M30 bolt; (c) M36 bolt.
Under different soil layers, the deformation of the shield tunnel joint showed obvious differences. Specifically, when the tunnel was in muddy clay, the deformation of the lining segments was more obvious, and the maximum diameter change rate and joint-opening amounts were 130% of those under clay conditions. This shows that when a tunnel is in muddy clay, the deformation of lining segments is more obvious because the strength and stability of muddy clay are lower. Further analysis showed that with increasing bolt strength in different soil layers, the joint-opening amount decreased, indicating that bolt stiffness has a certain control effect on joint deformation.
At the same time, observing Figure 15 and Figure 17 clearly shows that the circumferential joint-opening patterns were the same under the influence of three different bolt types and different joint stiffness coefficients, and the joint opening between A3 and A2 was the most serious, which further indicates that this area could be easily affected by an earthquake.
3.2. Results of Longitudinal Analysis
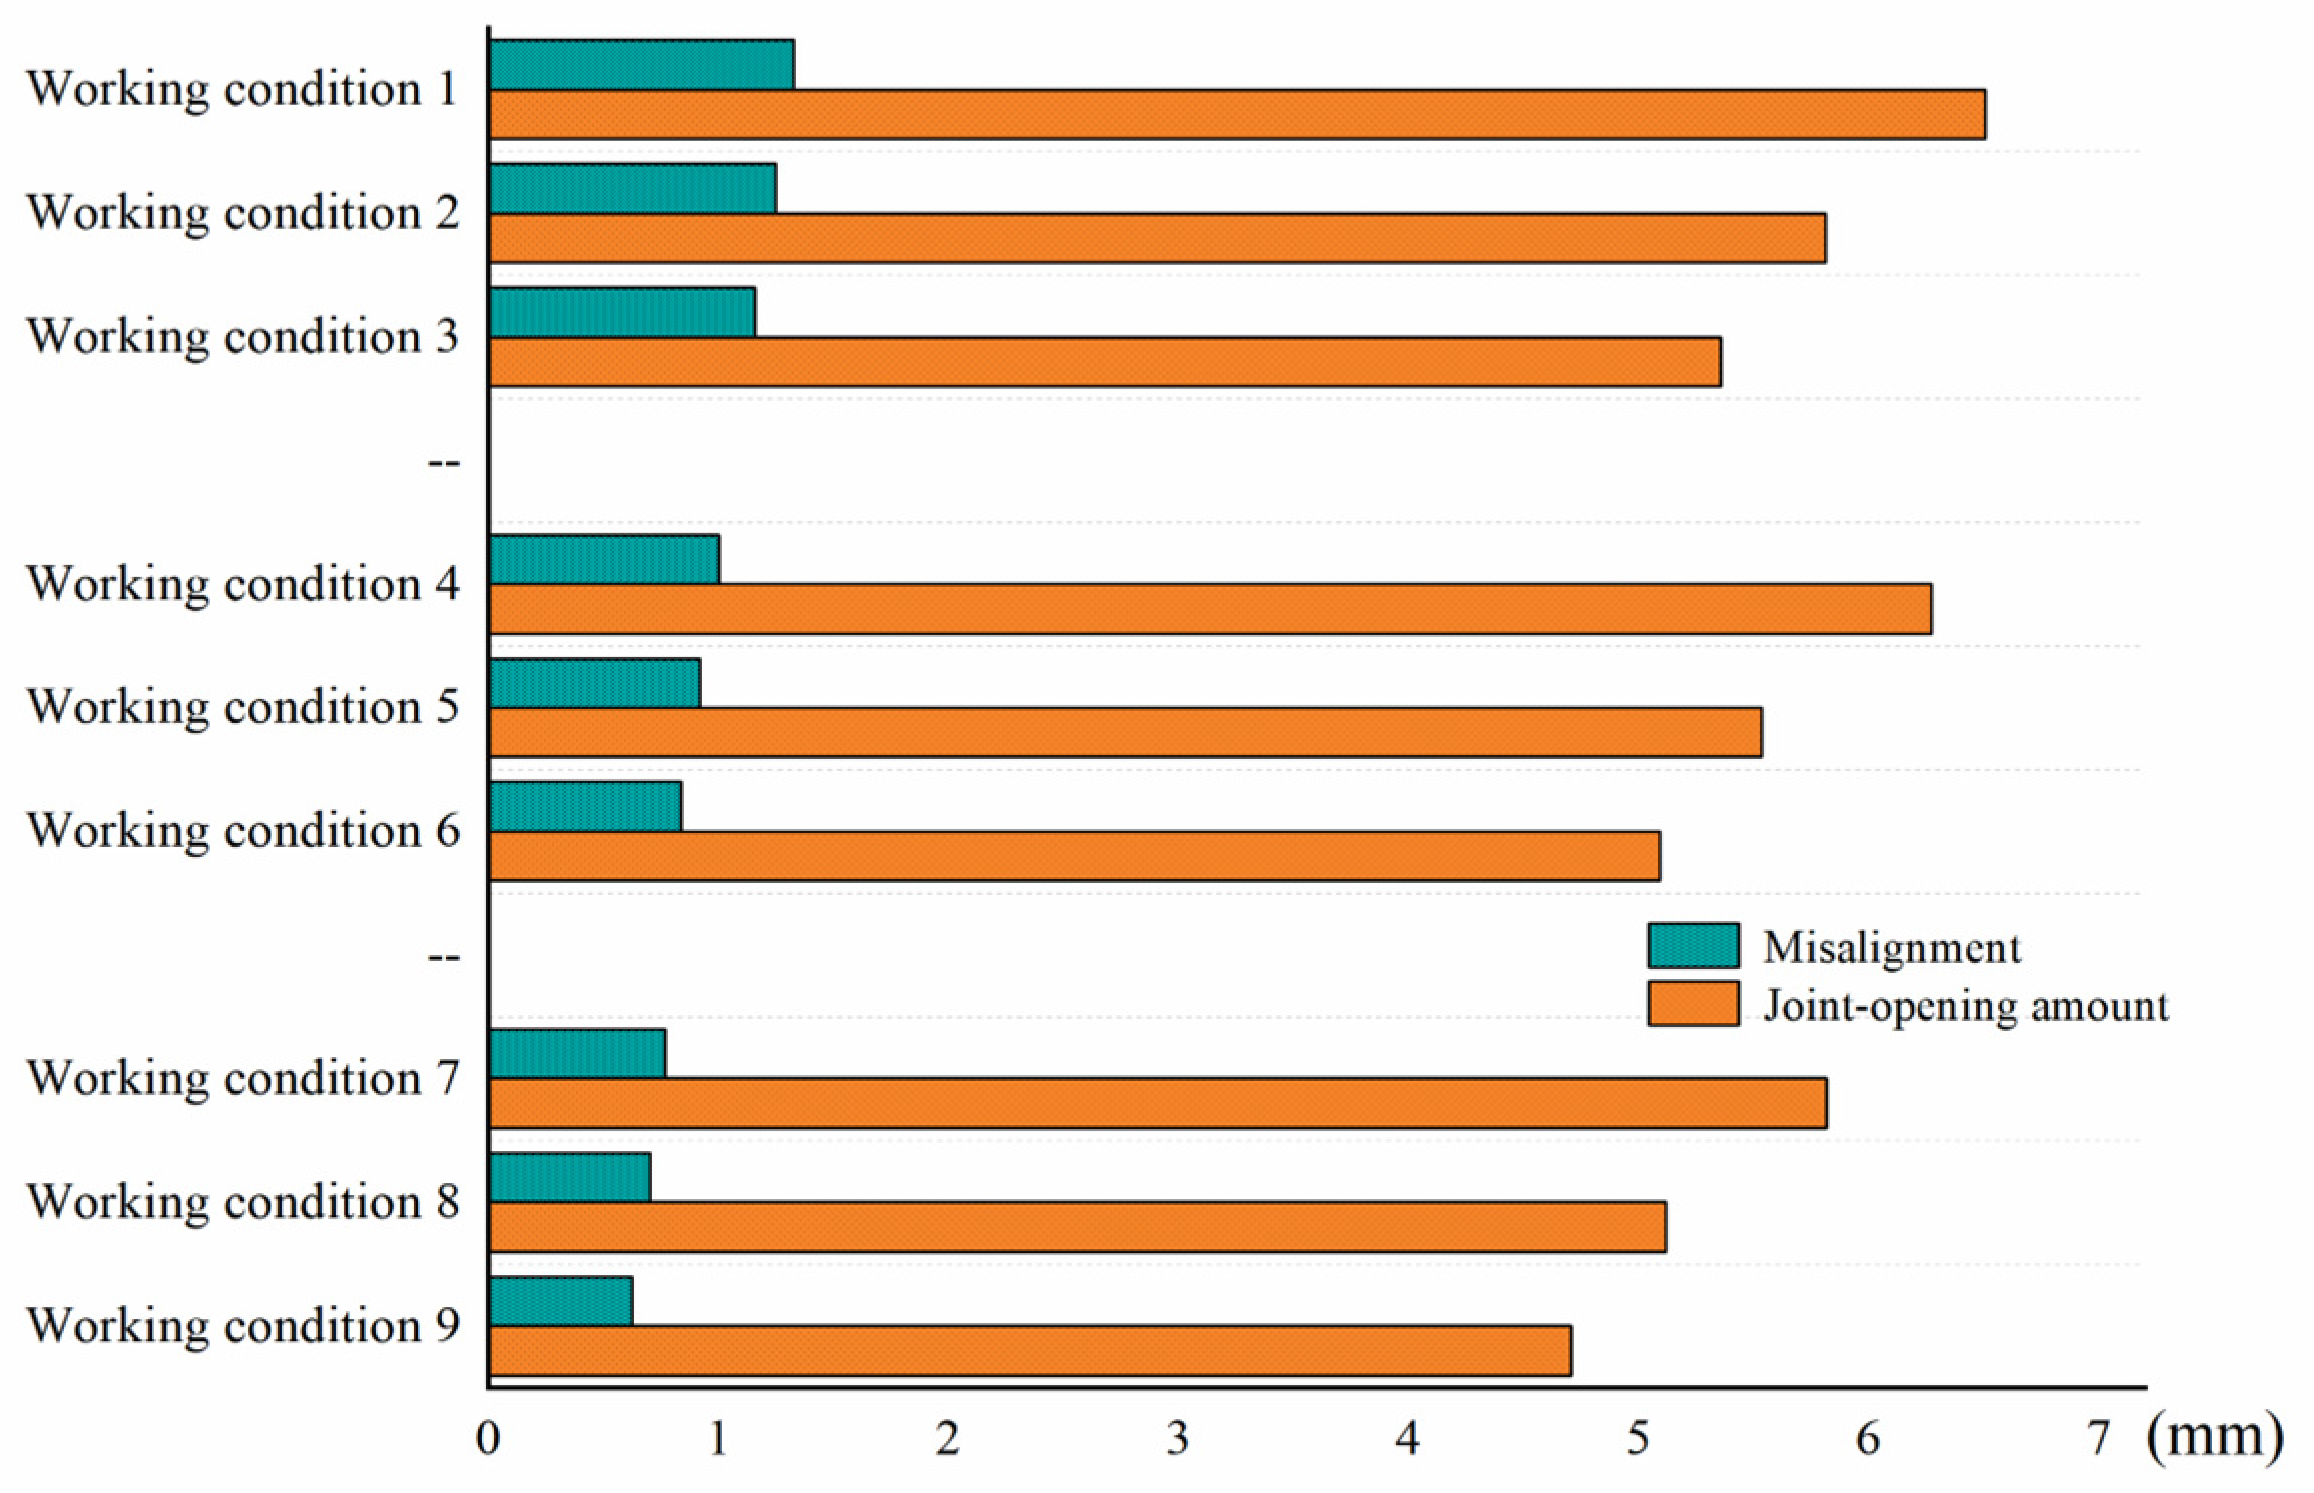
In a shield tunnel, local deformation is closely related to longitudinal nonuniform settlement. Under different soil layers, the longitudinal nonuniform settlement of the tunnel is regulated by the opening and dislocation of the segments, and the deformation of the joint is obviously affected by the soil layer stiffness. This can be seen in Figure 18. Under various research working conditions, the maximum joint-opening amount of the longitudinal joint ranged from 4.706 mm to 6.507 mm, and the maximum misalignment amount varied from 0.625 mm to 1.326 mm. The deformation rule was that as the joint stiffness coefficient increased, the deformation amount of the joint decreased.
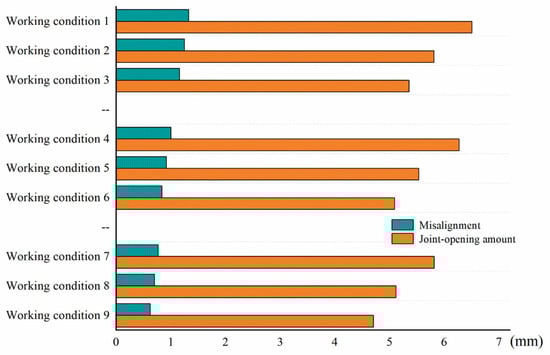
Figure 18.
Maximum joint-opening and misalignment amounts of the longitudinal joint of the lining segment under different working conditions.
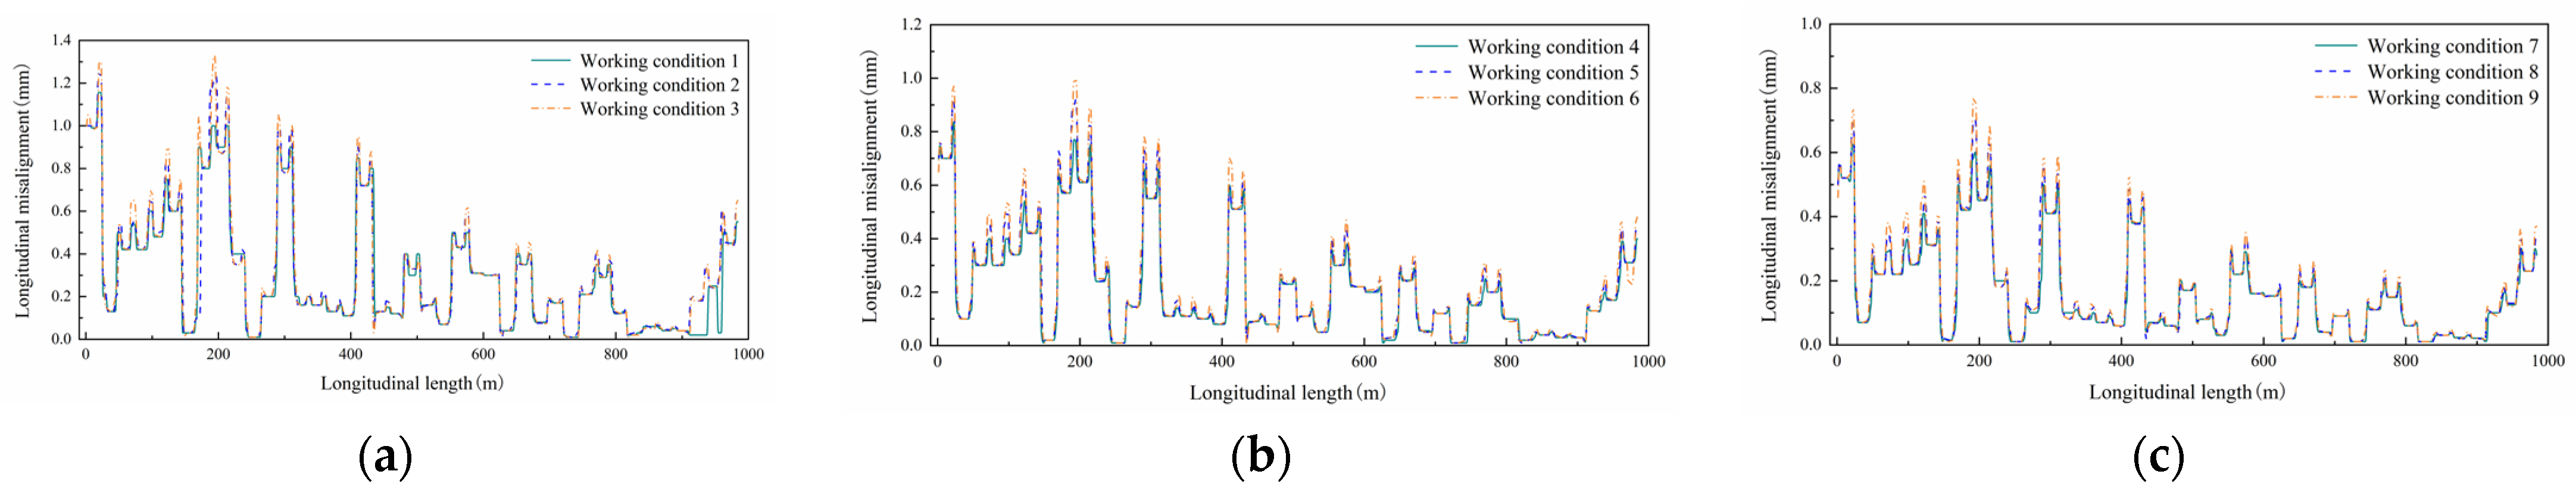
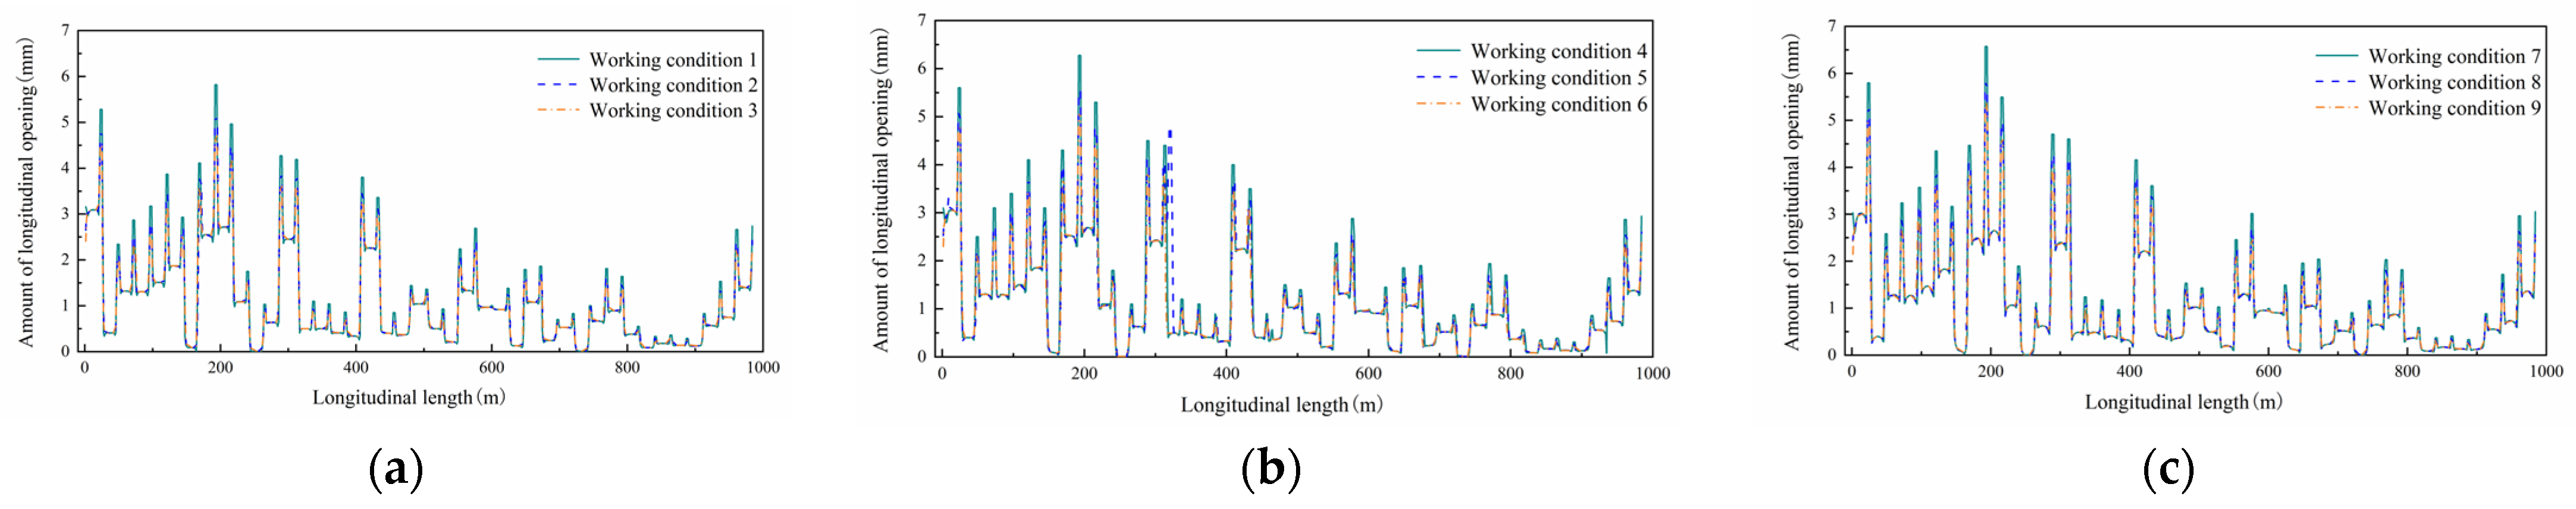
For further analysis of soil layer conditions, Figure 19 and Figure 20 show the longitudinal opening and dislocation curves of the simulated shield tunnel under different working conditions. At about 200 miles, the tunnel crossed the boundary between land and sea, just past the junction between the silty soft soil layer and the clay layer. The change in soil stiffness was prominent here, which is typical of an area with an abrupt change between soft and hard strata. As shown in Figure 12, the maximum longitudinal deformation of the shield tunnel in this section occurred at 193.2 m, indicating that the difference between soft and hard soil layers in this area could lead to the concentration of longitudinal deformation. Because of the drastic change from a soft to a hard soil layer, this position is the weak part of the longitudinal seismic performance of the shield tunnel. Therefore, special attention should be paid to the seismic performance of this area in the design to ensure that the structure can effectively cope with the impact of uneven settlement.
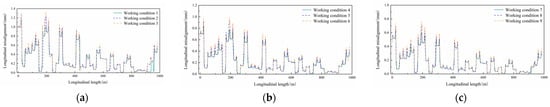
Figure 19.
Variation curve of misalignment of the longitudinal joint of the lining segment under different working conditions. (a) M24 bolt; (b) M30 bolt; (c) M36 bolt.
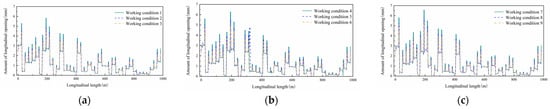
Figure 20.
Variation graph of the longitudinal joint-opening amount of the lining segment under different working conditions. (a) M24 bolt; (b) M30 bolt; (c) M36 bolt.
4. Conclusions and Discussion
This paper relied on the Sanmen nuclear power plant’s intake shield tunnel project, considered the local site effect based on the free-field earthquake reaction assessment, and analyzed the seismic performance of the shield tunnel intake pipe culvert type through the response displacement method, and the conclusions were as follows:
(1) For long linear underground structures such as shield tunnels, the main reason for the failure of the joint structure under the influence of seismic excitation is the compulsive displacement difference triggered by uneven settlement of the stratum. Through lateral analysis and comparison of different working conditions, it was found that the maximum diameter change rate of the section 1 lining segment was 1.752%~2.073%, and the largest joint-opening amount between the lining segment ring was 0.515 mm~1.324 mm; furthermore, the maximum diameter change rate of section 2 lining segment was 1.334%~1.572%, and the largest joint-opening amount between the lining segment ring was 0.387 mm~0.984 mm. When the silt layer was thicker at a location, the circumferential joint-opening amount of the lining pipe was larger. The type and specifications of the connection bolts should be adjusted according to the specific conditions of the tunnel under different geological conditions. When the tunnel was in the position of the thick, muddy layer, the joint-opening amount of the lining joint was large, which indicates that a force concentration phenomenon occurs here and that the tunnel is prone to deformation in this area. Therefore, in the design, it is recommended to use bolts with higher stiffness in this area to enhance the stability of the structure. For the tunnel structure itself, in the A3 and A2 areas at the lower left, the joint-opening is large, so higher-stiffness bolts should be selected to effectively resist the forced displacement caused by earthquakes or settlement and ensure the stability and tightness of the structure.
(2) Through longitudinal research and comparisons of different working conditions, it was found that the maximum joint-opening of the longitudinal joint was between 4.706 and 6.507 mm, and the maximum misalignment was between 0.625 and 1.326 mm. The deformation rule of joint bolts under different working conditions was consistent: the greater the stiffness, the smaller the deformation. Conversely, the worse the geological conditions, the greater the deformation. The combination of local deformation and longitudinal nonuniform settlement causes joint deformation, which may cause potential damage. At the junction of soft and hard soil layers, the deformation of the tunnel was especially significant because of the difference in soil stiffness. This area was the weak link in the seismic performance of shield tunnel. The tunnel joint is in an area of sudden change between soft and hard soil layers, which should be taken into consideration in design.
(3) In actual construction, highly stiff bolts should be used to link the tunnel in specific circumstances and locations to increase the seismic capability of the tunnel.
(4) In the future, the seismic performance of shield tunnels under complex geological conditions can be further discussed, especially the seismic response at the junction of soft and hard soil layers. It is suggested to strengthen the design and optimization of tunnel joints under different geological conditions and explore new materials and structural forms to improve the stability and safety of tunnels under strong earthquake conditions. In addition, field experiments based on dynamic monitoring data should be performed to provide a more accurate theoretical basis for the seismic design of tunnels.
Author Contributions
Conceptualization, J.Z.; methodology, Y.F.; software, Y.F.; validation, X.Y.; investigation, C.F.; data curation, B.Q. All authors have read and agreed to the published version of the manuscript.
Funding
This research received no external funding.
Data Availability Statement
Restrictions apply to the availability of these data. Data were obtained from Jishin Kogaku Kenkyusho, Inc. and are available from the corresponding author with the permission of Jishin Kogaku Kenkyusho, Inc.
Conflicts of Interest
Author Xidong Yu was employed by the company Dalian Public Transport Construction Investment Group Co. The remaining authors declare that the research was conducted in the absence of any commercial or financial relationships that could be construed as a potential conflict of interest.
References
- Chen, X.; Tao, L.; Chen, X. Study on the Transverse Seismic Response of Underwater Tunnel Shaft. Sci. Technol. Eng. 2016, 16, 273–278. [Google Scholar]
- Ding, Z.; Peng, L.; Li, X. Study on Seismic Response of Connectional Passages for Underwater Shield Tunnel. J. Zhengzhou Univ. (Eng. Sci.) 2010, 31, 65–69. [Google Scholar]
- Yu, H.; Zhao, G.; Xu, L.; Dai, J.; Tao, X. Analysis of Submarine Tunnel Linings in Rising Region Crossing Upper Soft and Lower Hard Stratum to Transversal Seismic Load. Earthq. Eng. Eng. Dyn. 2021, 41, 211–218. [Google Scholar]
- Wu, X.; Xu, J.; Wang, S.; Sha, P.; Han, Z.; Chen, X.; Shu, S.; Qiao, W.; Zeng, X. Ground Deformation of Shield Tunneling through Composite Strata in Coastal Areas. Buildings 2024, 14, 1236. [Google Scholar] [CrossRef]
- Yang, Z.; Liu, Y.; Chen, C. Correlation Analysis of Tunnel Deformation and Internal Force in the Earthquake Based on Tunnel Inclination. Buildings 2024, 14, 1395. [Google Scholar] [CrossRef]
- Chang, X.; Sun, J.; Guo, L. Mechanical Performances of Concrete-Filled Steel Pipe Composite Segments in Complex Geological Conditions. Buildings 2024, 14, 2961. [Google Scholar] [CrossRef]
- He, R.; Zhou, Z.; Li, S.; Vanapalli, S. Investigating Surface Settlements During Shield Tunneling Using Numerical Analysis. Sustainability 2025, 17, 20. [Google Scholar] [CrossRef]
- Cai, X.; Liang, J.; Xu, A.; Li, D.; Wu, Z.; Yan, Q. Longitudinal Seismic Analysis of Mawan Sea-crossing Large Diameter Shield Tunnels. J. Nat. Disasters 2020, 29, 13–20. [Google Scholar]
- Chen, G.X.; Ruan, B.; Zhao, K.; Chen, W.Y.; Zhuang, H.Y.; Du, X.L.; Khoshnevisan, S.; Juang, C.H. Nonlinear Response Characteristics of Undersea Shield Tunnel Subjected to Strong Earthquake Motions. J. Earthq. Eng. 2018, 24, 351–380. [Google Scholar] [CrossRef]
- Liu, Y.; Chen, G.; Kong, M. Seismic Response of Undersea Tunnels to Hydrodynamic and Hydrostatic Pressures. Chin. J. Geotech. Eng. 2013, 35, 357–362. [Google Scholar]
- Cheng, X.S.; Xu, W.W.; Yue, C.Q.; Du, X.L.; Charles, H. Dowding. Seismic Response of Fluid–structure Interaction of Undersea Tunnel During Bidirectional Earthquake. Ocean. Eng. 2014, 75, 64–70. [Google Scholar] [CrossRef]
- Chen, W.; Lv, Z.; Xu, L.; Ruan, B.; Ma, J.; Chen, G. Seismic Responce of Subsea Tunnels Consideing Seawater Seabed Coupling Effect. J. Eng. Geol. 2021, 29, 1878–1886. [Google Scholar]
- He, C.; Geng, P. Research on Practical Seismic Analysis Methods of Shield Tunnel. China J. Highw. Transp. 2020, 33, 15–25. [Google Scholar]
- Zhou, Y.; Xia, C.; Shi, Z.; Lu, G.; Liu, L.; Liu, M. Progressive Failure of Water-Resistant Stratum in Karst Tunnel Construction Using an Improved Meshfree Method Considering Fluid–Solid Interaction. Buildings 2024, 14, 3140. [Google Scholar] [CrossRef]
- Huang, W.; Xu, G.; He, C.; Li, B. Seismic Response Analysis of Subsea Tunnels Considering Fluid-Solid Coupling Effect. Tunn. Constr. 2024, 44, 739–749. [Google Scholar]
- Li, Y.; Wang, Y.; Ren, J.; Dong, Q.; Chen, L.; Wang, Z. Research on the Determination and Law of Formation Seepage Pressure of Slurry Shield Tunnel. Yellow River 2024, 46, 138–144. [Google Scholar]
- Jiang, J.; Huang, W.; Xun, Z.; Zhao, K.; Li, Z.; Du, X. Seismic Elasto-plastic Response Analysis of Subsea Immersed Tunnel of Hong Kong-Zhuhai-Macao Bridge. J. Build. Struct. 2023, 44, 359–366. [Google Scholar]
- Wang, W.; He, C.; Geng, P. Longitudinal Seismic Analysis of Shield Tunnels in Homogeneous Ground. Mod. Tunn. Technol. 2016, 53, 73–79. [Google Scholar]
- Geng, P.; Wang, Q.; Guo, X.; He, C.; Lu, S.; Xiao, M. Force Characteristics of Longitudinal Joints of Shield Tunnel under Seismic Action. J. Southwest Jiaotong Univ. 2020, 55, 704–712. [Google Scholar]
- Yan, Q.; Zhang, Y.; Wang, C.; Geng, P. Quasi-static Analysis Method for Seismic Effect of Shear Waves on Shield Tunnel. Eng. Mech. 2015, 32, 184–191. [Google Scholar]
- Liang, J.; Wu, Z.; Xin, Y.; Ba, Z. Seismic Countermeasures of Shield Tunnel under Fault Movement. Earthq. Eng. Eng. Dyn. 2020, 40, 1–11. [Google Scholar]
- Zhang, G.; Zhang, W.; Qi, J.; Niu, R.; Zhang, C. Seismic Response Analysis of Anchor Joint in Shield–Driven Tunnel Considering Soil–Structure Interaction. Appl. Sci. 2022, 12, 6362. [Google Scholar] [CrossRef]
- Wang, X.; Meng, M.; Li, J.; Zhang, L.; Wang, S. Comparative Analysis of Reaction Displacement Method and Time History Analysis Method in Seismic Design of Tunnel. Railw. Eng. 2015, 7, 35–38. [Google Scholar]
- Liang, J.; Zhu, Y.; Zhao, H. Applicability of Integral Forced Response Displacement Method Inseismic Analysis of Shield Tunnels. Earthq. Eng. Eng. Dyn. 2020, 40, 1–10. [Google Scholar]
- Fu, X.; Chang, S.; Chen, G. Comparison of Pseudo Static Method and Nonlinear Dynamic Method of Subway Station Structure Seismic Response Analysis. Earthq. Eng. Eng. Dyn. 2016, 36, 44–51. [Google Scholar]
- GB 50267-2019; Standard for Seismic Design of Nuclear Power Plants. China Architecture & Building Press: Beijing, China, 2019. (In Chinese)
- Gu, Y.; Liu, J.; Du, Y. 3D Consistent Viscous-spring Artificial Boundary and Viscous-spring Boundary Element. Eng. Mech. 2007, 12, 31–37. [Google Scholar]
- Yin, X.; Li, J.; Lin, G. 3D Compact Viscous-spring Boundary Element Based on UPFs. World Earthq. Eng. 2012, 28, 95–100. [Google Scholar]
- Zhao, J.; Gan, C.; Lan, W. Three Dimensional Seismic Analysis of Immersed Tunnel in Sea Area of Nuclear Power Plant Considering Soil Structure Interaction. Nucl. Sci. Eng. 2023, 43, 402–411. [Google Scholar]
- GB 50909-2014; Code for Seismic Design of Urban Rail Transit Structures. China Planning Press: Beijing, China, 2014. (In Chinese)
- GB/T 51336-2018; Standard for Seismic Design of Underground Structure. Architecture and Building Press: Beijing, China, 2018.


Disclaimer/Publisher’s Note: The statements, opinions and data contained in all publications are solely those of the individual author(s) and contributor(s) and not of MDPI and/or the editor(s). MDPI and/or the editor(s) disclaim responsibility for any injury to people or property resulting from any ideas, methods, instructions or products referred to in the content. |
© 2025 by the authors. Licensee MDPI, Basel, Switzerland. This article is an open access article distributed under the terms and conditions of the Creative Commons Attribution (CC BY) license (https://creativecommons.org/licenses/by/4.0/).