Article

Management of Pile End Sediment and Its Influence on the Bearing Characteristics of Bored Pile

1
Gansu Wuhuan Highway Engineering Ltd., Lanzhou 730050, China
2
Key Laboratory of Disaster Mitigation in Civil Engineering of Gansu Province, School of Civil Engineering, Lanzhou University of Technology, Lanzhou 730050, China
3
Gansu Jiantou Construct Co., Ltd., Lanzhou 730050, China
*
Author to whom correspondence should be addressed.
Buildings 2025, 15(8), 1389; https://doi.org/10.3390/buildings15081389
Submission received: 28 February 2025 / Revised: 29 March 2025 / Accepted: 9 April 2025 / Published: 21 April 2025
(This article belongs to the Special Issue Recycling of Waste in Material Science and Building Engineering)

Abstract

:
In order to study the influence of pile end sediment on the bearing characteristics of bored piles, the on-site bearing capacity test was conducted on a single pile. A mathematical model of bearing capacity and the settlement response of a single pile considering sediment effects and a finite element model of a single pile with pile end sediment were established. In addition, the influence of sediment thickness on the bearing capacity of bored piles was systematically analyzed. The results show that the compaction of sediment at the pile end could significantly improve the ultimate bearing capacity of the single pile. Compared with the single pile that did not consider the compaction of the sediment at the pile end, the load required to reach the ultimate bearing capacity of the pile after compaction of the sediment increases by 900 KN. The settlement of the pile under a maximum vertical load increases with an increase in the thickness of the sediment. The influence of sediment thickness on axial force transmission is mainly reflected in the linear to nonlinear transformation of axial force distribution from low to high during the process of load. The slight decrease in axial force at the bottom of the pile could also be caused by the increase in the thickness of sediment. The increase in sediment layer thickness means that the transfer efficiency of the pile end resistance decreases. However, with an increase in load, the compression effect of the pile end sediment becomes obvious, which will further change the distribution of load between the pile side resistance and the pile end resistance.

1. Introduction

Bored piles are often used in the foundation of buildings and bridges to transfer structural loads to deeper soil or rock [1,2,3]. The quality of piles could be easily affected by multiple factors, including construction methods and on-site soil conditions. Therefore, different types of pile defects such as pile end sediment, diameter reduction, or diameter expansion may occur, and the pile end sediment is one of the most common problems. Pile end sediment usually contains mud and possibly chemical additives (such as bentonite or polymer in wall slurry). If not properly treated, it would not only affect the bearing capacity of the bored pile but also infiltrate into the soil or flow into the groundwater, resulting in heavy metal enrichment, increased turbidity of the groundwater, and damage to the aquatic ecosystem. Therefore, the management of pile end sediment is a key point in the green transformation of civil engineering [4,5]. Nevertheless, there are still shortcomings, both domestically and internationally, in studying the deformation behavior and bearing characteristics of a single pile considering the pile end sediment. Dong et al. [6] analyzed the impact of pile end sediment on pile load transfer using the results of on-site stress tests of filled piles. According to the test results, it was concluded that pile end sediment not only affects the pile end resistance play, but it also affects the pile side resistance play, especially in the range of 20 m from the pile end below the pile side resistance play, which has a greater impact—in other words, the thicker the pile end sediment, the smaller the value of the pile side resistance play. Mullins et al. [7] designed a more complete set of static load test programs, mainly for pile bottoms containing different degrees of sediment states with respect to the pile foundation bearing capacity, of which there was a difference in performance. In that study, it was concluded that the pile end of the sediment will result in a serious loss of pile foundation bearing capacity. Feng et al. [8] investigated the effect of the sediment thickness on the vertical bearing properties of monopiles through indoor modeling tests, and the results of static loading tests showed that the load–settlement (Q–s) curve of monopiles without pile end sediment was of a slowly varying type, whereas, with an increase in the sediment thickness, the Q–s curve of monopiles containing pile end sediment tended to shift toward a steeply decreasing type. The effect of pile end sediment on pile top settlement varies with increasing pile top load, with increasing thicknesses of pile end sediment leading to more significant incremental pile top settlement under larger pile top loads. Xiong et al. [9] studied the effect of pile end sedimenting and pre-compression on the bearing performance of piles according to the results of static loading tests of large-diameter grouted piles under different pile end conditions, and they also analyzed the results of the tests, concluding that the ultimate bearing capacity of a single pile increases with an increase in the strength and stiffness of the soil layer at the end of the pile. They also established that the compression of a small amount of sediment at the end of the pile is conducive to the play of lateral friction resistance to the ultimate value, while the intact piles with no sediment have a generally difficult play with respect to the resistance at the end of the pile and the lateral friction resistance to the limit value. Xu et al. [10] used indoor modeling tests and finite element simulation and concluded that the sediment at the pile end has a significant effect on the distribution of the axial force of monopiles, and its presence not only significantly changes the axial force transfer mechanism of monopiles but also accelerates the rate of axial force transfer. Zhu et al. [11] used finite element software to establish a finite element model of a defective pile containing pile end sediment, and their research results show that the existence of pile end sediment on a load applied at the beginning of the impact is relatively small; with an increase in the load, the impact becomes increasingly obvious, and with a greater thickness of the sediment at the end of the pile, the settlement becomes more pronounced, indicating that the existence of the sediment at the end of the pile attenuates the end of the resistance to play. Zhao et al. [12] analyzed the influence of each factor on the settlement characteristics of rotary dug-bored piles from the three aspects of sediment thickness, modulus of elasticity, and the presence or absence of a bearing platform, and they concluded that sediment defective piles with a bearing platform have a more adequate exertion of the upper lateral friction resistance than defective piles without a bearing platform. Huang et al. [13] analyzed, in detail, the effect of sediment thickness, modulus of elasticity, Poisson’s ratio, and the cohesion and angle of the internal friction of pile ends on the bearing characteristics of a pile according to the existing engineering data using finite element software; their results show that there is a critical value in the effect of sediment thickness on the ultimate load-carrying capacity, and the ultimate load-carrying capacity will increase with an increase in the modulus of elasticity of the sediment. Based on the finite element numerical method, Lin et al. [14] established a finite element numerical model of the pile–soil interactions of drilled monopiles with pile end sediment, and they also quantitatively analyzed and investigated the bearing characteristics of drilled friction-type piles affected by sediment in terms of the Q–s relationship, pile compression, and load-sharing ratio by taking the thickness of the sediment at the end of the pile and the modulus of the sediment as variables.
In summary, at present, research on defective piles with pile end sediment is mainly based on field tests and numerical simulations; in addition, there is a lack of theoretical analysis framework support, which also limits further in-depth studies and undermines a comprehensive understanding of the influence of pile end sediment on the vertical bearing performance of drilled piles. Therefore, this study provides a theoretical method for the study of the influence of pile end sediment on the bearing performance of drilled piles via the mathematical modeling of the loading settlement characteristics of drilled piles containing pile end sediment; it also conducts verification analysis of the corresponding finite element model on the basis of existing research. Additionally, this study provides a new idea for treating the pile tip sediment of bored piles and achieving the coordinated development of engineering benefits and ecological protection.

2. Overview of the Field Tests

2.1. Overview of the Site and Test Piles

The test site was located in an alluvial flood plain geomorphic area with flat and wide topography; the foundation soil was subdivided into several main layers and sublayers, including fill, loess chalk, fine sand, gravel, pulverized clay, etc., with a total of nine main layers and several sublayers. The typical engineering geological section is shown in Figure 1. Undisturbed soil samples were taken from the foundation soil within the exploration depth for indoor physical and mechanical property tests. The physical and mechanical indexes of the soil layers are detailed in Table 1. The bearing capacity of the two test piles was tested using the self-balancing method, and the parameters of the test piles are shown in Table 2.

2.2. Analysis of the Field Pile Foundation Test Results

The self-balancing method is loaded by connecting special loading equipment, i.e., a load box, with the steel cage, then burying the pile in the designated position and filling the load box with oil with a high-pressure oil pump. The friction force of the upper pile body, the friction force of the lower pile body, and the end resistance are balanced to maintain the loading. In this test, a ring load box and a dial indicator with a range of 50 mm were used for measurement. The loading method adopts the slow maintenance load method, and the loading stops after reaching the maximum load required by the design.
The load–displacement curves of the upper section pile and the lower section pile obtained from each test pile under the self-balancing method are shown in Figure 2 and Figure 3, respectively. From an analysis of the comparative graphs, it was observed that the Q–s curve of the lower section of Test Pile-1 showed a trend of slow change at the initial stage, followed by a sharp decrease and then slowing down again, and this phenomenon mainly originated from the larger thickness of the sediment at the bottom of Pile-1. When the load on Test Pile-1 was increased to 5000 KN, the displacement of its lower section showed a significant increase, while the displacement tended to stabilize when the load was further increased to 6000 KN. In contrast, the lower half of the Q–s curve of Test Pile-2 did not show a similar sharp increase in settlement throughout the loading process.
According to the above table, which details the comparison of the construction conditions of the two test piles, it is clear that the thickness of the sediment at the bottom of Test Pile-1 reached 90 mm, while the thickness of the sediment at the bottom of Test Pile-2 was 70 mm. This difference in the thickness of the sediment was found to be a key factor leading to the significant difference between the Q–s curves of the lower part of the pile in Test Pile-1 and that of the pile in Test Pile-2. In particular, the thicker sediment present at the base of Test Pile-1 had a higher compressibility, which resulted in a relatively weaker bearing capacity of the soil layer at the base of Test Pile-1. As a result, when a particular level of load was applied, the settlement of the lower part of Test Pile-1 abruptly increased due to the compressive effect of the sediment at the pile end.

3. Mathematical Modeling of Single-Pile-Bearing Capacity and Settlement Response Based on the Sediment Effect

During the construction of bored piles, pile end sediment is a layer of sediment that is formed at the bottom of the pile hole by the accumulation of soil, rock fragments, and other residues during the drilling process. These sediments, if not adequately removed, can negatively affect the performance of the grouted piles. First, the presence of a sediment layer reduces the direct contact between the pile end and the soil of the bearing layer below it, thereby reducing the pile end resistance, which is an important component of the pile-bearing capacity. Secondly, the sediment layer may be further compacted with the load of the superstructure, leading to the additional settlement of the pile and affecting the stability and safety of the whole structure. Therefore, effective measures need to be taken during the construction process, such as through cleaning using a bottom cleaner or cyclic flushing, to ensure that the sediment is effectively removed and minimize its negative impact on the bearing performance and settlement performance of the grouted piles. The compressive settlement of sediment at the end of drilled grouted piles is shown in Figure 4.
Mei et al. [15] conducted an indoor model test, where two groups of comparative tests were performed, including a single pile without sediment and a single pile with sediment. The comparative Q–s diagrams of these single piles were plotted, as shown in Figure 5. When comparing the Q–s curves of the single piles with sediment at the bottom of the piles with single piles without sediment, it can be seen that the load was small in the early stages, and the force of the piles was mainly determined by pile side friction resistance while the pile end resistance was small. With an increasing load, when the pile end sediment exists, the pile end resistance fails to be exerted in time, and the compression of the sediment layer leads to a rapid decrease in load. As a result, the settlement of the single pile containing pile end sediment was found to be larger than that of the pile without sediment under the same load. In addition, the compression of the sediment layer made its modulus of elasticity increase until it reached a dense state. At this time, the resistance at the pile end was in a process of significant enhancement, which was reflected in the Q–s curve as an intersection with the Q–s curve of a conventional monopile. The compression of the sediment and the subsequent sustained loading contributed to a sustained end resistance, such that the monopile was able to continue to withstand further loading after the sediment was compacted.
When combining the field test results with the literature review, it becomes clear that the thickness of sediment at the pile end has a significant effect on the Qs behavior of the monopile. Both the comparison of Test Pile-1 and Test Pile-2 in the test observation and the analysis of monopiles with and without sediment in the literature show that, in the initial loading stage, the trend of the Qs curves is more or less the same, mainly reflecting the contribution of the pile side friction force (at which time the pile end force is low). With an increase in load, when there is sediment at the bottom of the pile, the resistance at the pile end fails to give full play instantly, resulting in an obvious settlement surge phenomenon in the process of the sediment being compressed. This phenomenon causes the Q–s curves of single piles with sediment under the same load to be steeper and to settle more than those of single piles without sediment. This comprehensive analysis revealed that the thickness of sediment at the pile end is a key factor affecting the Q–s curves of the monopiles, especially regarding the sudden increase in settlement caused by the compressibility of sediment during the load increase stage, and the process of increasing the resistance at the pile end after sediment compression has an important influence on the overall Q–s curve shape. When there is thick sediment at the pile end, due to its low strength and high compressibility, the penetration deformation of the pile end causes the soil around the pile to move downward and toward the sediment at the pile end. This movement mode reduces the relative displacement between the pile and soil, which is not conducive to the full play of the pile side friction. With the complete compression of the sediment and the bearing performance of the similar bearing layer under the constraint of the surrounding bearing layer, the relative displacement of the pile–soil caused by the increase in the pile top load increases. At this time, the pile side friction decreases to the residual strength, making the increased load almost completely borne by the pile end, accelerating the settlement of the pile end.
An analysis of typical sediment-containing load–displacement curves showed that these curves can be divided into three stages: (1) the straight-line stage of the independent action of lateral friction resistance; (2) the stage of sediment compaction at the pile end; and (3) the stage of the elastic–plastic damage after sediment compaction at the pile end. In this study, mathematical modeling was carried out for each stage.

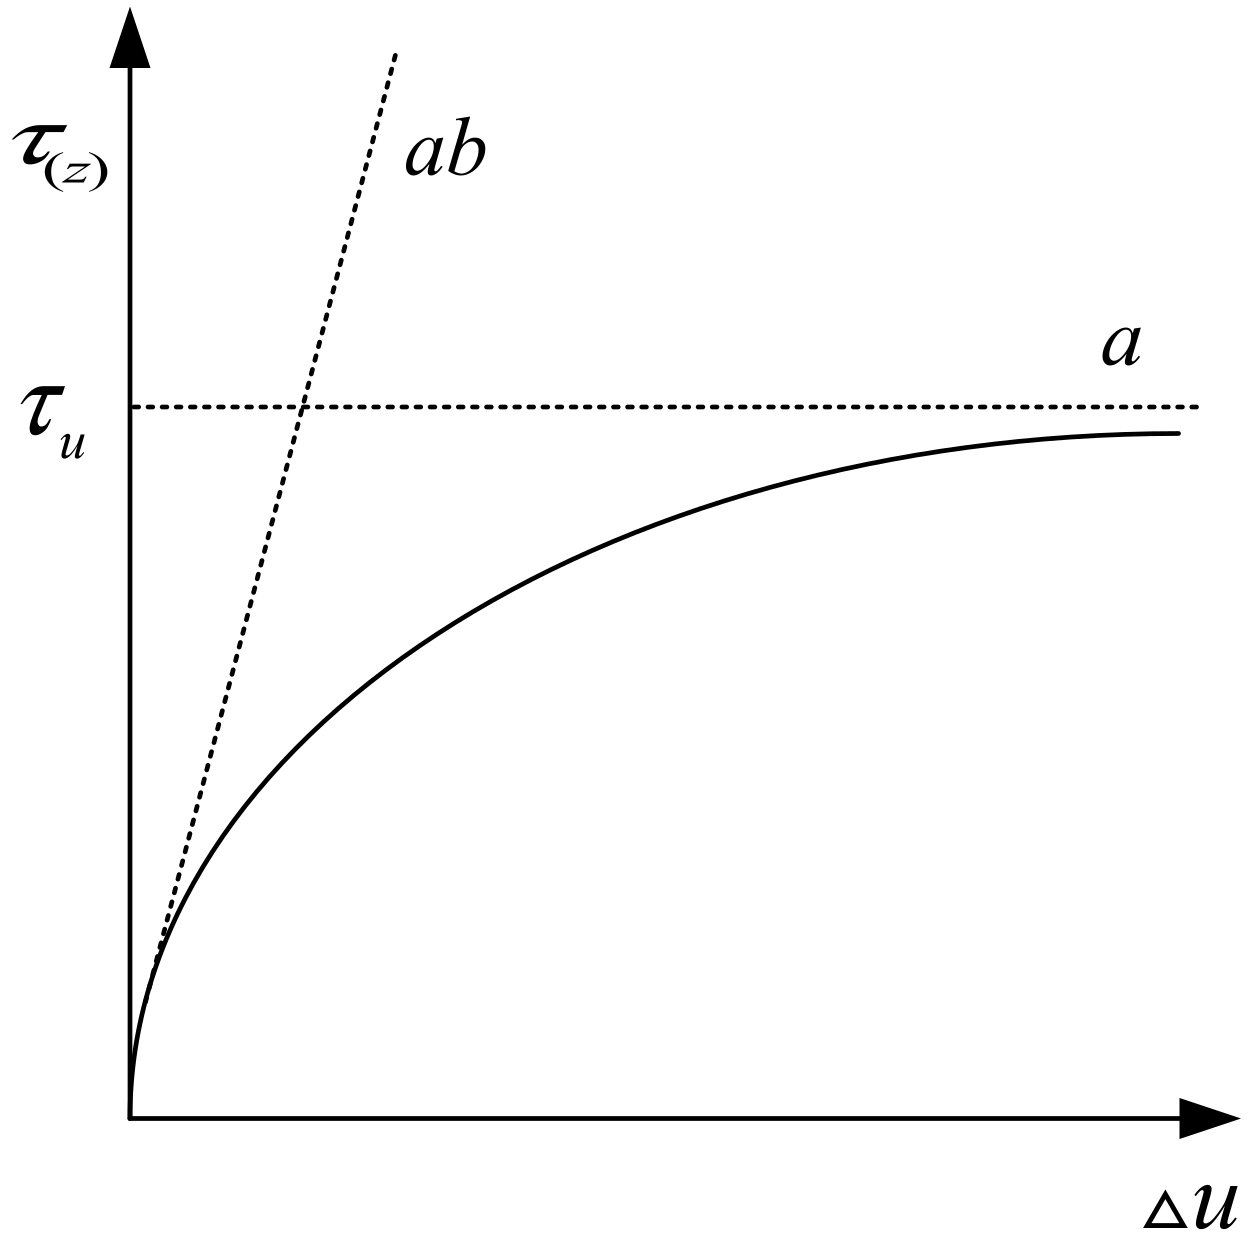
3.1. Lateral Friction Resistance Acting Independently in a Straight-Line Phase

When the pile foundation is subjected to a vertical load, its bearing capacity per unit length and the corresponding settlement show a significant nonlinear connection. In this study, an exponential function model was used to simulate the Q–s relationship in the linear phase of the independent action of lateral friction resistance; its mathematical expression and model sketch are shown in Equation (1) and Figure 6 [16], respectively.
τ ( z ) = a ( 1 e b Δ u )
where τ(z) is the unit side friction, Δu is the relative displacement of the pile and soil, a is the ultimate pile load, and b is the bending degree coefficient of the load–settlement curve.
In this stage, the pile end resistance does not play a role, which means that there is a direct and equal relationship between the pile side friction and the total load applied to the top of the pile when considering the pile-bearing capacity analysis; as such, the model’s modified single-pile Q–s curve in the straight-line section can be expressed as follows:
Q = a ( 1 e b s )
where Q is the pile top load and S is the pile top displacement.
The methods for calculating the unit lateral friction resistance qsu of piles can be categorized into the effective stress method and the total stress method, which include the α-method, the β-method, and the λ-method. The α-method fails to fully consider the influence of depth when evaluating the side friction, while the λ-method only provides a framework for considering the depth effect, and the determination of the λ-coefficient still lacks sufficient data support and statistical analysis, which limits its wide application. Therefore, the improved β-method proposed in [17], which is more widely applicable, is used in this study to calculate the side friction resistance of piles in multilayered soils, with the following expression:
q s u = K i tan δ i σ v z + c i
where Ki is the ground lateral pressure coefficient; σvz is the effective stress of the soil body on the pile side at depth z; δi is the friction angle of the pile–soil contact surface; and ci denotes the cohesion of the soil body on the pile side of the ith layer.
Converting the above equation yields the following:
q s u = K 0 ( K i K 0 ) tan δ i σ v z + c i
where K0 is the ground lateral pressure coefficient.
Under the assumption that the pile–soil system has reached a sufficiently consolidated equilibrium state and the soil on the pile side shows normal consolidation conditions, the static lateral pressure coefficient K0 at this time can be taken as follows [18,19]:
K 0 = 1 sin φ i
Substituting Equation (5) into Equation (4) yields the following:
q s u = ( 1 sin φ i ) ( K i 1 sin φ i ) tan φ i σ v z + c i
The results of Kulhawy [20] show that, for steel pipe piles with smooth surfaces, grouted piles, or H-beam piles, the values of the coefficients (Ki/K0) range from 0.7 to 1.2 when experiencing small displacements. In contrast, the range of coefficients for these pile types is elevated to 1.0 to 2.0 when they experience large displacements. This suggests that, as the displacement increases, the interaction force between the surface of the pile body and the surrounding medium increases, which leads to an increase in the coefficients.
Current design codes and common calculation methods generally adopt the simplified assumption that the lateral resistances of piles in a particular soil layer are regarded as constant values. These methods and assumptions are mainly for the design and analysis of short- or medium-length piles, in which the neglect of the depth effect is reasonable to a certain extent. However, with the continuous evolution of engineering practice, the design length of piles has gradually increased, which makes it particularly important to consider the depth effect in the analysis of pile lateral resistances, and, after considering the depth effect, the pile lateral resistances can be expressed as follows:
q s u = ( 1 sin φ i ) ( K i 1 sin φ i ) tan φ i γ i z i + c i
where γi is the heaviness of the soil; zi denotes the thickness of the pile through the ith layer of soil; and φi is the internal friction angle.
The formula for calculating the lateral friction resistance of a single pile is given below:
f s = π d L q s u
where d is the pile diameter and L is the pile length.
Under this condition, the pile lateral friction force fully carries the pile top load as the pile end resistance is not activated. Setting the coordinates of Inflection Point 1 as (Q1, S1) indicates that, at this point, the load transmitted by the pile body changes with the rate of change along the depth of the pile body, and the joint Equation (12) can be obtained as follows:
f s = Q 1 a ( 1 e b S 1 ) = π d L ( 1 sin φ i ) K i 1 sin φ i tan φ i γ i z i + c i
Transforming Equation (9) yields S1:
S 1 = 1 b ln ( a K i π d L γ i z i tan φ i a + c i )
In summary, the expression for the elastic linear phase of a single pile containing the sediment Q–s curve at the end of the pile under the independent action of lateral frictional resistance is given by the following:
Q = a ( 1 e b S ) ( 0   < S < 1 b ln ( a K i π d L γ i z i tan φ i a + c i ) )

3.2. Pile-End-Sediment Compaction Stage

It is assumed that the pile top load is increased to the point where the modulus of elasticity of the pile end sediment and the modulus of elasticity of the soil below the bottom of the pile are close to each other, that is, when the pile end sediment is compressed to compaction. On this basis, the settlement of a monopile containing pile end sediment in a multilayered soil body was analyzed based on the elastic theory method. For this process, the following assumptions were made:
(1)
The foundation was assumed to be an idealized semi-infinite elastic medium, and the effect of pile construction on the original stress state of the soil was neglected.
(2)
It was assumed that the modulus of elasticity of the soil varied linearly from the soil interface to the end of the pile, and it remained constant below the end of the pile.
(3)
It was assumed that the pile body was perfectly synchronized with the soil in contact with its sides in terms of displacement, i.e., the displacement at any point of the pile body was consistent with the displacement at the corresponding contact soil point.
(4)
It was assumed that the movement of the pile and soil in the vertical direction was synchronized, and the difference in relative displacement in the horizontal direction was ignored.
Poulos’ formula for the settlement of a single pile is given by [21] as follows:
S = Q E s L I p
where Q is the pile top load; Es is the modulus of elasticity of the soil; Ip is the coefficient of settlement influence; and L is the pile length.
It is difficult to select the Es for layered soils. Generally, a representative Es can be back-calculated from the Q–s relationship that is obtained from single-pile tests under similar geologic conditions, and then this can be used to predict the settlements of single and group piles with different pile diameters and lengths under similar geologic conditions. Poulos proposed to simplify multilayered soils as a single pile passing through a homogeneous soil body and fixing it on another homogeneous soil layer, at which time the soil’s resilient modulus, Es, can be taken as a weighted average [21], which can be expressed as follows:
E s = k = 1 n E k l k L
where lk is the height of the soil layer and Ek is the elastic modulus of the k-layer soil.
The linear variation in the elastic modulus with depth when considering a two-layer soil [22] and the variation in the elastic modulus for each layer of soil are shown in Figure 7.
In order to describe the introduction of non-homogeneity indicators, we utilized the following equations:
η s = E s 1 E s 2
η m = E m 1 E m 2
The increase in the modulus of elasticity of the soil with depth can be expressed as follows:
E n = E n 2 η s + ( 1 η s ) z L n ( 0 z L s )
E m = E m 2 η m + ( 1 η m ) z L s L m ( L s z L )
E m = E m 2 ( z > L )
The weighted average modulus of elasticity in a bilayer soil is as follows:
E s = E n 2 L n η s + ( 1 η s ) z + E m 2 L m η m + ( 1 η m ) ( z L s ) L
When loading a sinker that contains water, the water will react to the applied pressure. Changes in pore water pressure can reduce or increase the effective stress between soil particles (i.e., the stress at the point of contact of the particles), which, in turn, affects the strength and compressibility of the soil. In order to consider the effect of the pore water pressure during compaction of the sediment, the principle of effective stress is introduced. Its formula is expressed as follows:
σ = σ u
where σ’ is the effective stress; σ is the total stress; and u is the pore water pressure.
The modulus of elasticity E0 at the instant the pile end sediment is compacted can be expressed as follows:
E o = σ ε = Q / A u Δ t / T
where T is the original height of the pile end sediment; ε is the compressive strain of soil; A is the cross-sectional area of the pile end sediment; and Δt is the amount of change in the pile end sediment.
After assuming that the pile top load at this time is Q2, when the change in sediment at the pile end is Δt and the pile top settlement at this time is S2, the results can then be obtained as follows:
Q 2 I ρ S 2 L = ( Q 2 u A ) T A Δ t
From Equation (22), the settlement of the sediment after compaction of the pile end sediment can be obtained as follows:
S 2 = A Δ t I p Q 2 T L ( Q 2 u A )
Based on the data of (Q1, S1) and (Q2, S2), the equations of the curves for the pile top settlement and load during compaction of the sediment at the pile end can be determined as follows:
Q Q 2 = Q 2 Q 1 S 2 S 1 ( S S 2 )
When substituting the corresponding values, one can obtain the equation for the pile end after compaction of the sediment as follows:
Q = Q 2 Q 1 A Δ t I p Q 2 T L ( Q 2 u A ) 1 b ln ( a K i π d L γ i z i tan φ i a + c i ) ( S A Δ t I p Q 2 T L ( Q 2 u A ) ) 1 b ln ( a K i π d L γ i z i tan φ i a + c i ) S A Δ t I p Q 2 T L ( Q 2 u A )

3.3. Stage of the Elastic–Plastic Damage After Compaction of Sediment at the Pile End

According to the above analysis, it can be seen that the Q–s curve of the pile-end-sediment compaction is consistent with the trend of the Q–s curve without sediment; as such, its mathematical expression is as follows:
Q = a ( 1 e b ( S Δ t ) ) + ( Q 2 Q 1 ) , S > A Δ t I P T L
In summary, the mathematical expression for the Q–s curve of a single pile containing sediment is given by the following:
Q = a ( 1 e b S ) ,         0 < S < 1 b ln ( a K i π d L γ i z i tan φ i a + c i ) Q 2 Q 1 A Δ t I p Q 2 T L ( Q 2 u A ) 1 b ln ( a K i π d L γ i z i tan φ i a + c i ) ( S A Δ t I p Q 2 T L ( Q 2 u A ) ) ,         1 b ln ( a K i π d L γ i z i tan φ i a + c i ) S A Δ t I p Q 2 T L ( Q 2 u A ) a ( 1 e b ( S Δ t ) ) + ( Q 2 Q 1 ) ,         S > A Δ t I p Q 2 T L ( Q 2 u A )
There are two parameters that need to be determined in Equation (27), which are a (ultimate load) and b (curve bending degree coefficient), the method of which can be referred to in the literature. Moreover, it is through this that the curve can be converted to give the ultimate load Q3 of a normal monopile, the ultimate load Q4 containing sediment at the end of the pile can also be obtained through the formula, and the difference between Q3 and Q4 is the load required for compaction of the sediment.

3.4. Case Studies

The field Test Pile-1 was used in this validation to analyze the change in the ultimate bearing capacity of bored piles containing pile end sediment and ordinary monopiles. The field test Q–s curve is shown in Figure 8.
According to the calculation results of Equation (27), the Q–s curves of the single pile without sediment and the single pile with sediment were obtained, which were then compared with the Q–s curves obtained from the field test, as shown in Figure 9. It was found that the two had better consistency. This comparison not only verified the accuracy of the calculation method, but it also reflected the influence of pile end sediment on the ultimate bearing capacity of the test pile. Specifically, by comparing the Q–s curves with and without pile end sediment, it was found that the compaction of pile end sediment significantly increased the ultimate bearing capacity of the test pile. The load required to reach the ultimate bearing capacity of the test piles after sediment compaction was increased by 900 KN compared to the case where no pile-end-sediment compaction was considered.

4. Numerical Analysis of Drilled Piles with Pile End Sediment

According to the actual engineering example, the finite element model of a bored pile when considering the influence of pile end sediment was established. Through the analysis of the model, the influence of parameters, such as the thickness of pile end sediment on the bearing performance of bored piles under vertical load, was discussed in detail.

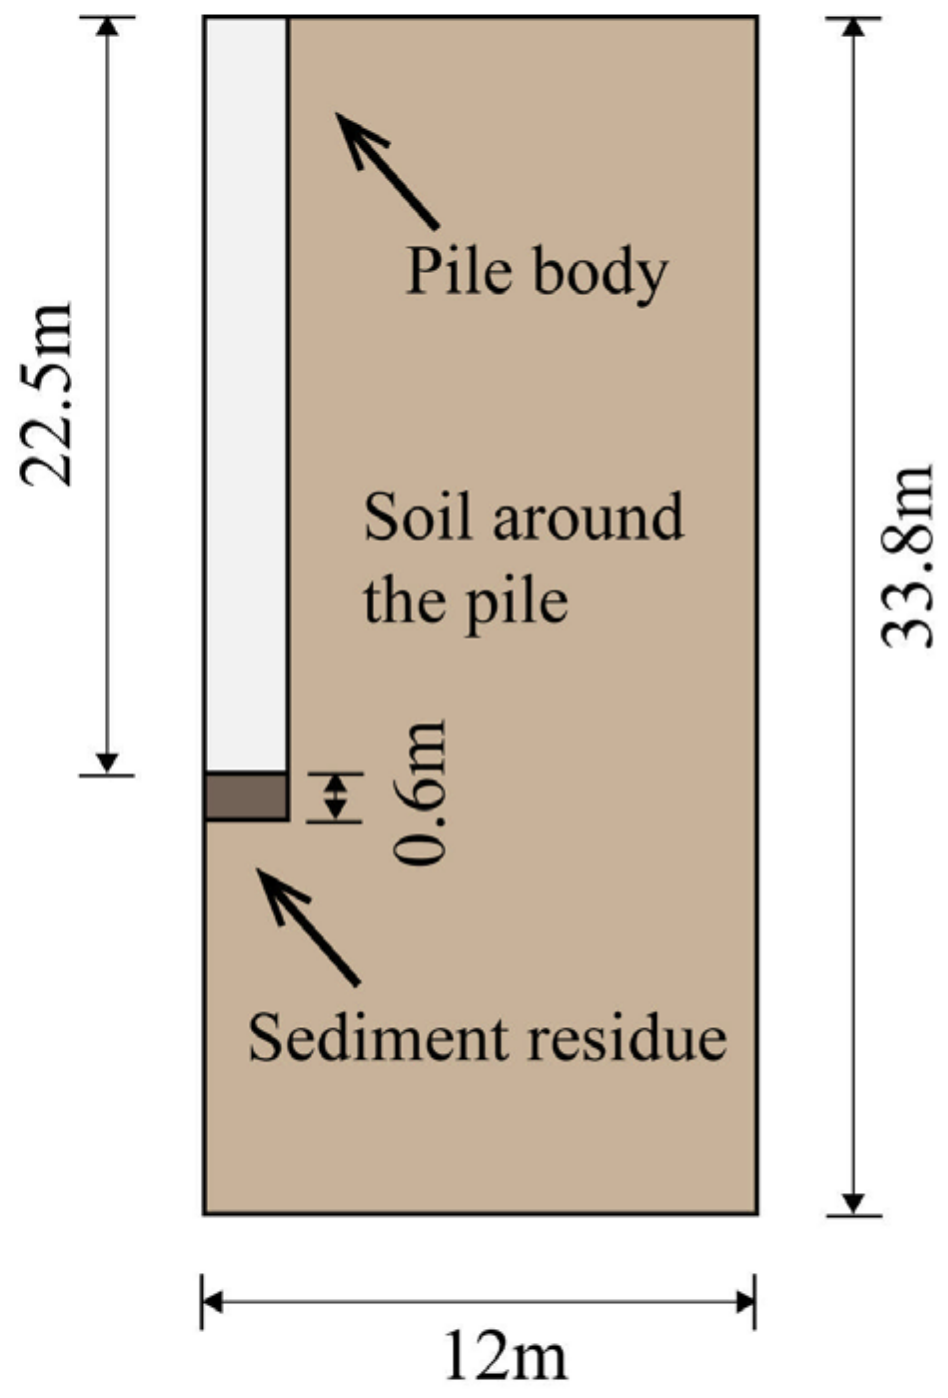
4.1. Geometric Modeling Calculation Parameters

In the study by Desai [23] on the bearing capacity of monopiles in sandy soils, it was suggested that the depth of the computational region should be 1.5 times the pile length (L), while the width should be 15 times the pile diameter (D). Therefore, in this study, the finite element analysis model adopted a width of 15 times the pile diameter and a depth of 1.5 times the pile length. The ground stress equilibrium was balanced by a gravity field, normal displacement constraints were applied to the side of the soil body, and three-way displacement constraints were applied to the bottom of the soil body. The mesh division was locally encrypted for the pile body, and a certain range was used around the pile. The Mohr–Coulomb model was chosen for the intrinsic model of the sediment and soil body; the pile body was modeled by the linear elasticity model [24,25]; the pile diameter was 0.8 m, the length was 22.5 m, and the modulus of elasticity was 34.5 GPa. A one-half model was adopted for the pile and soil body. The sediment parameters were the parameters obtained in the on-site tests, as shown in Table 3.
The thickness of the sediment was set as 0 mm, 100 mm, 200 mm, 300 mm, 400 mm, 500 mm, and 600 mm to analyze the effect of the different thicknesses of pile end sediment on the drilled piles under vertical load. The two-dimensional and three-dimensional models containing pile end sediment are shown in Figure 10 and Figure 11 below.

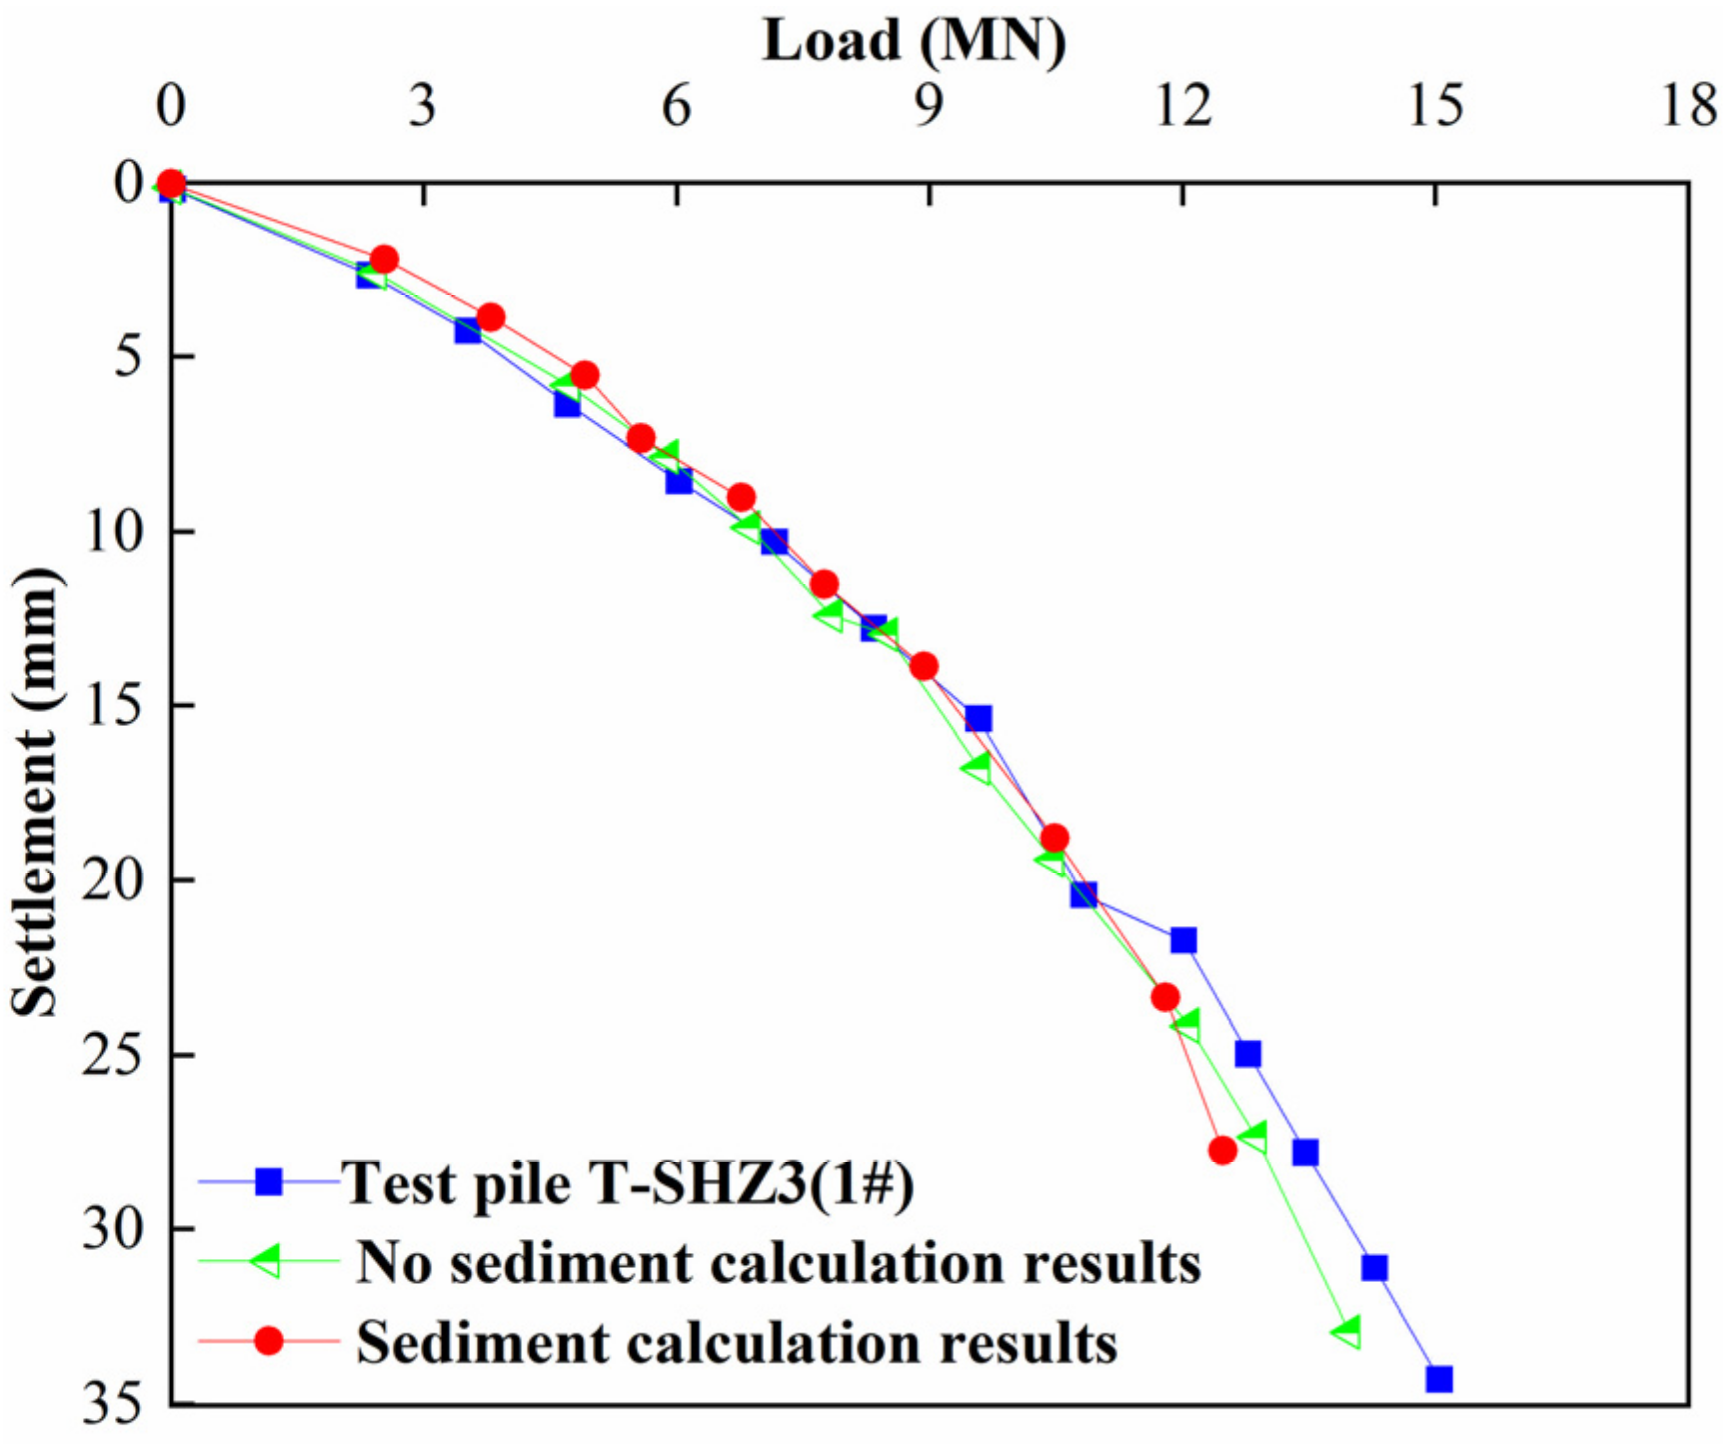
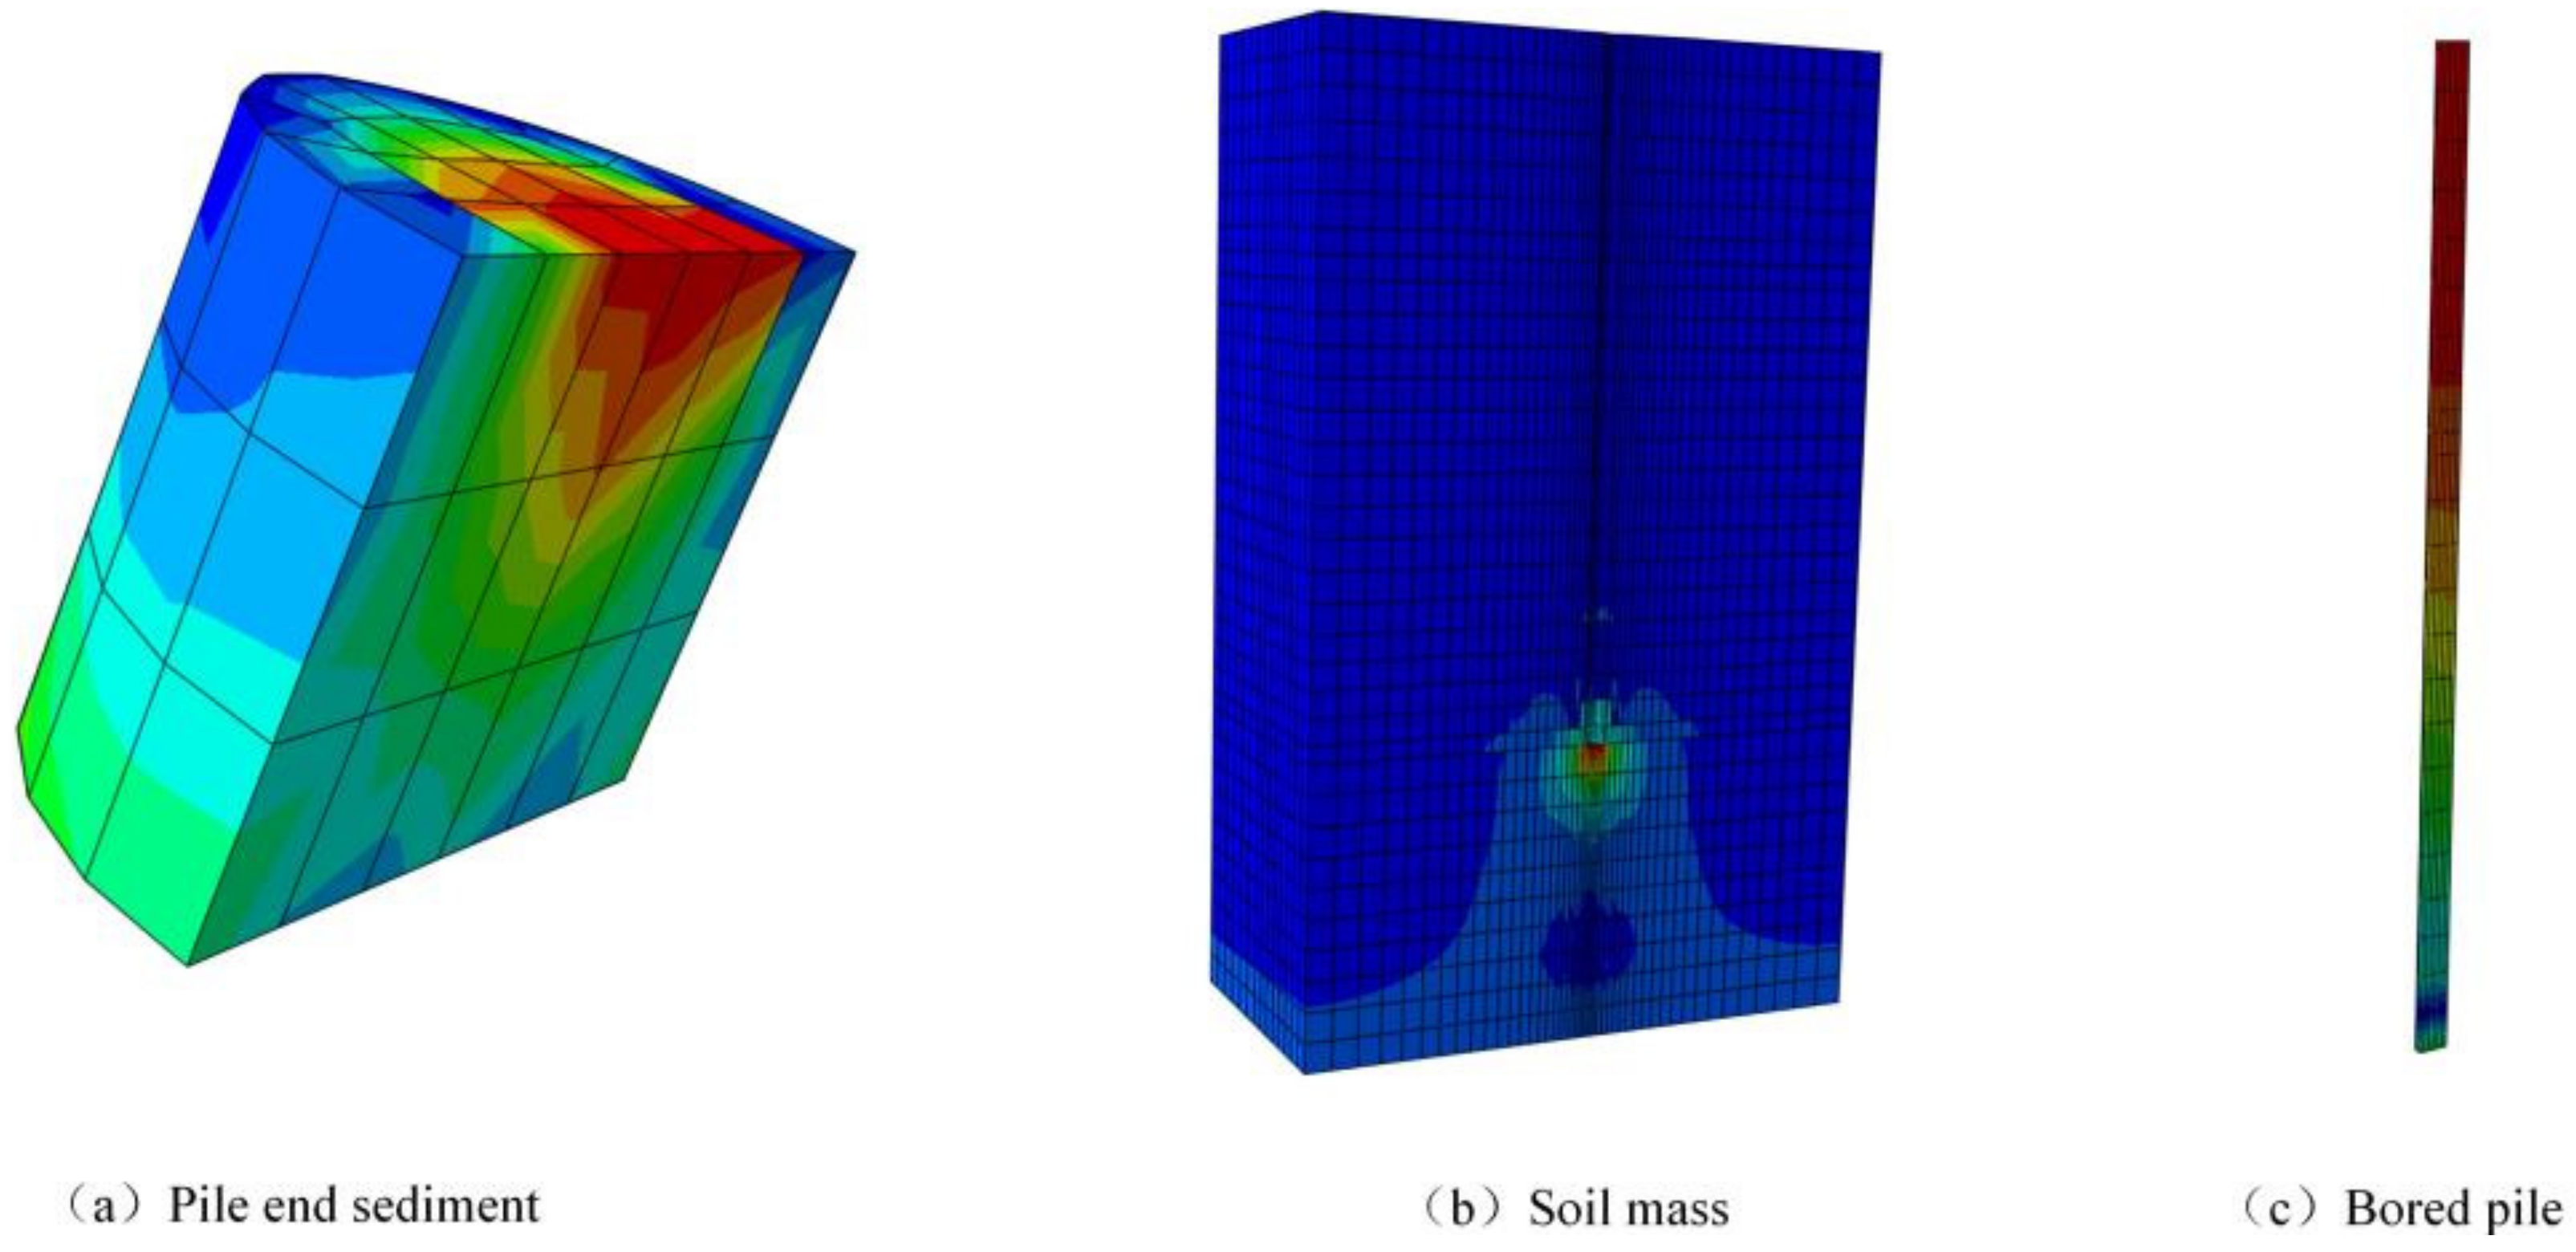
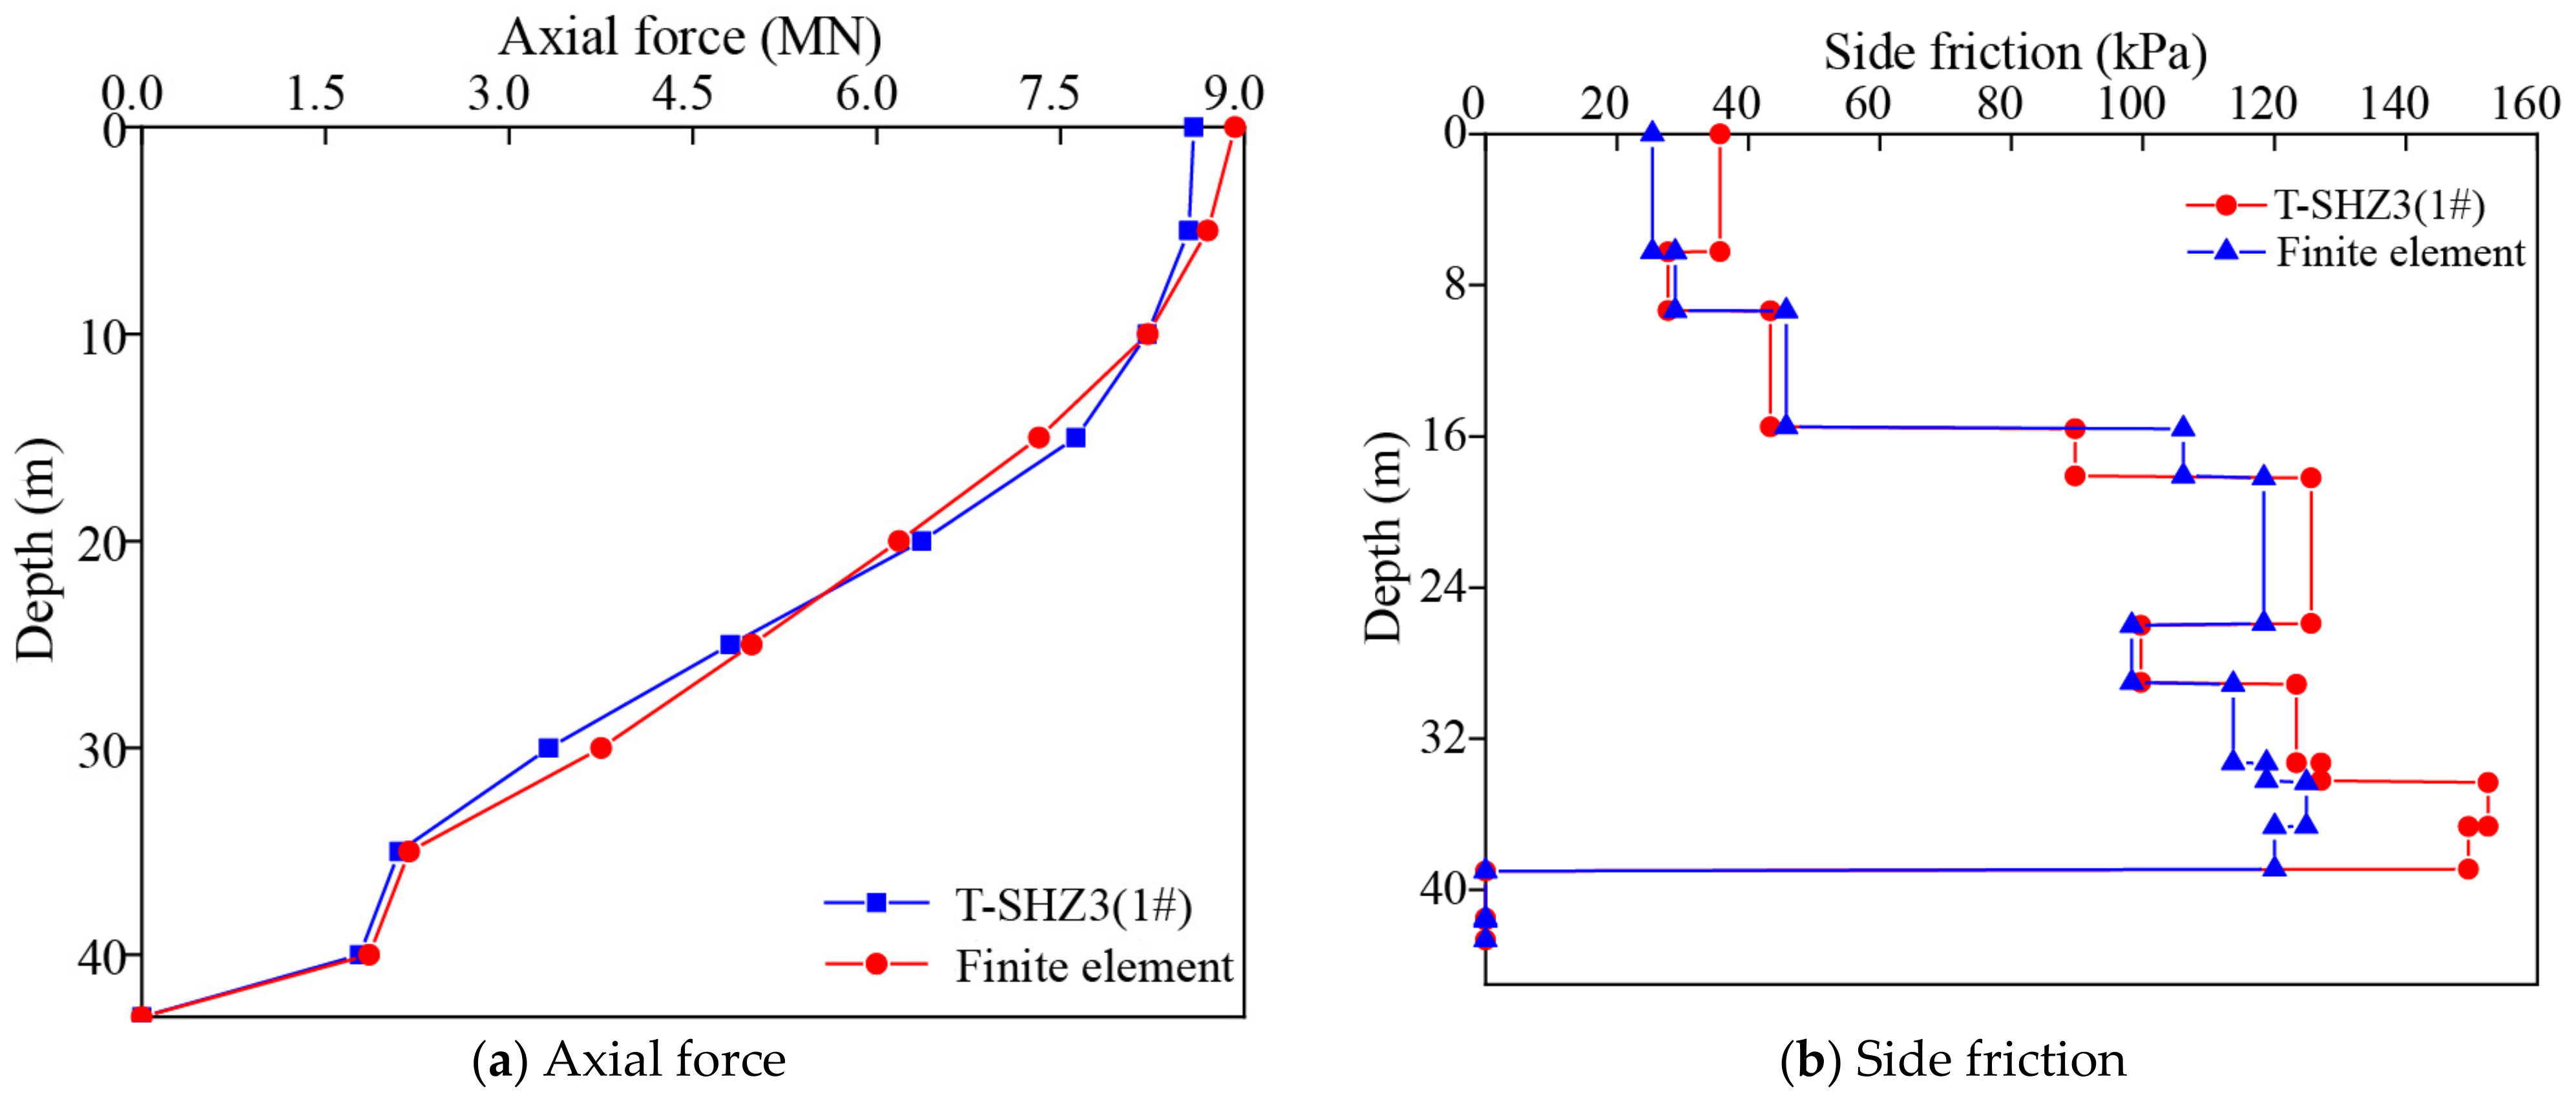
4.2. Finite Element Verification

Test Pile-1 was determined to be 43.53 m via the comparison and verification between the finite element software and the field-measured Test Pile-1 results. The verified axial force and lateral friction curve are shown in Figure 12. It can be seen from the figure that the finite element calculation results are in good agreement with the field test data.

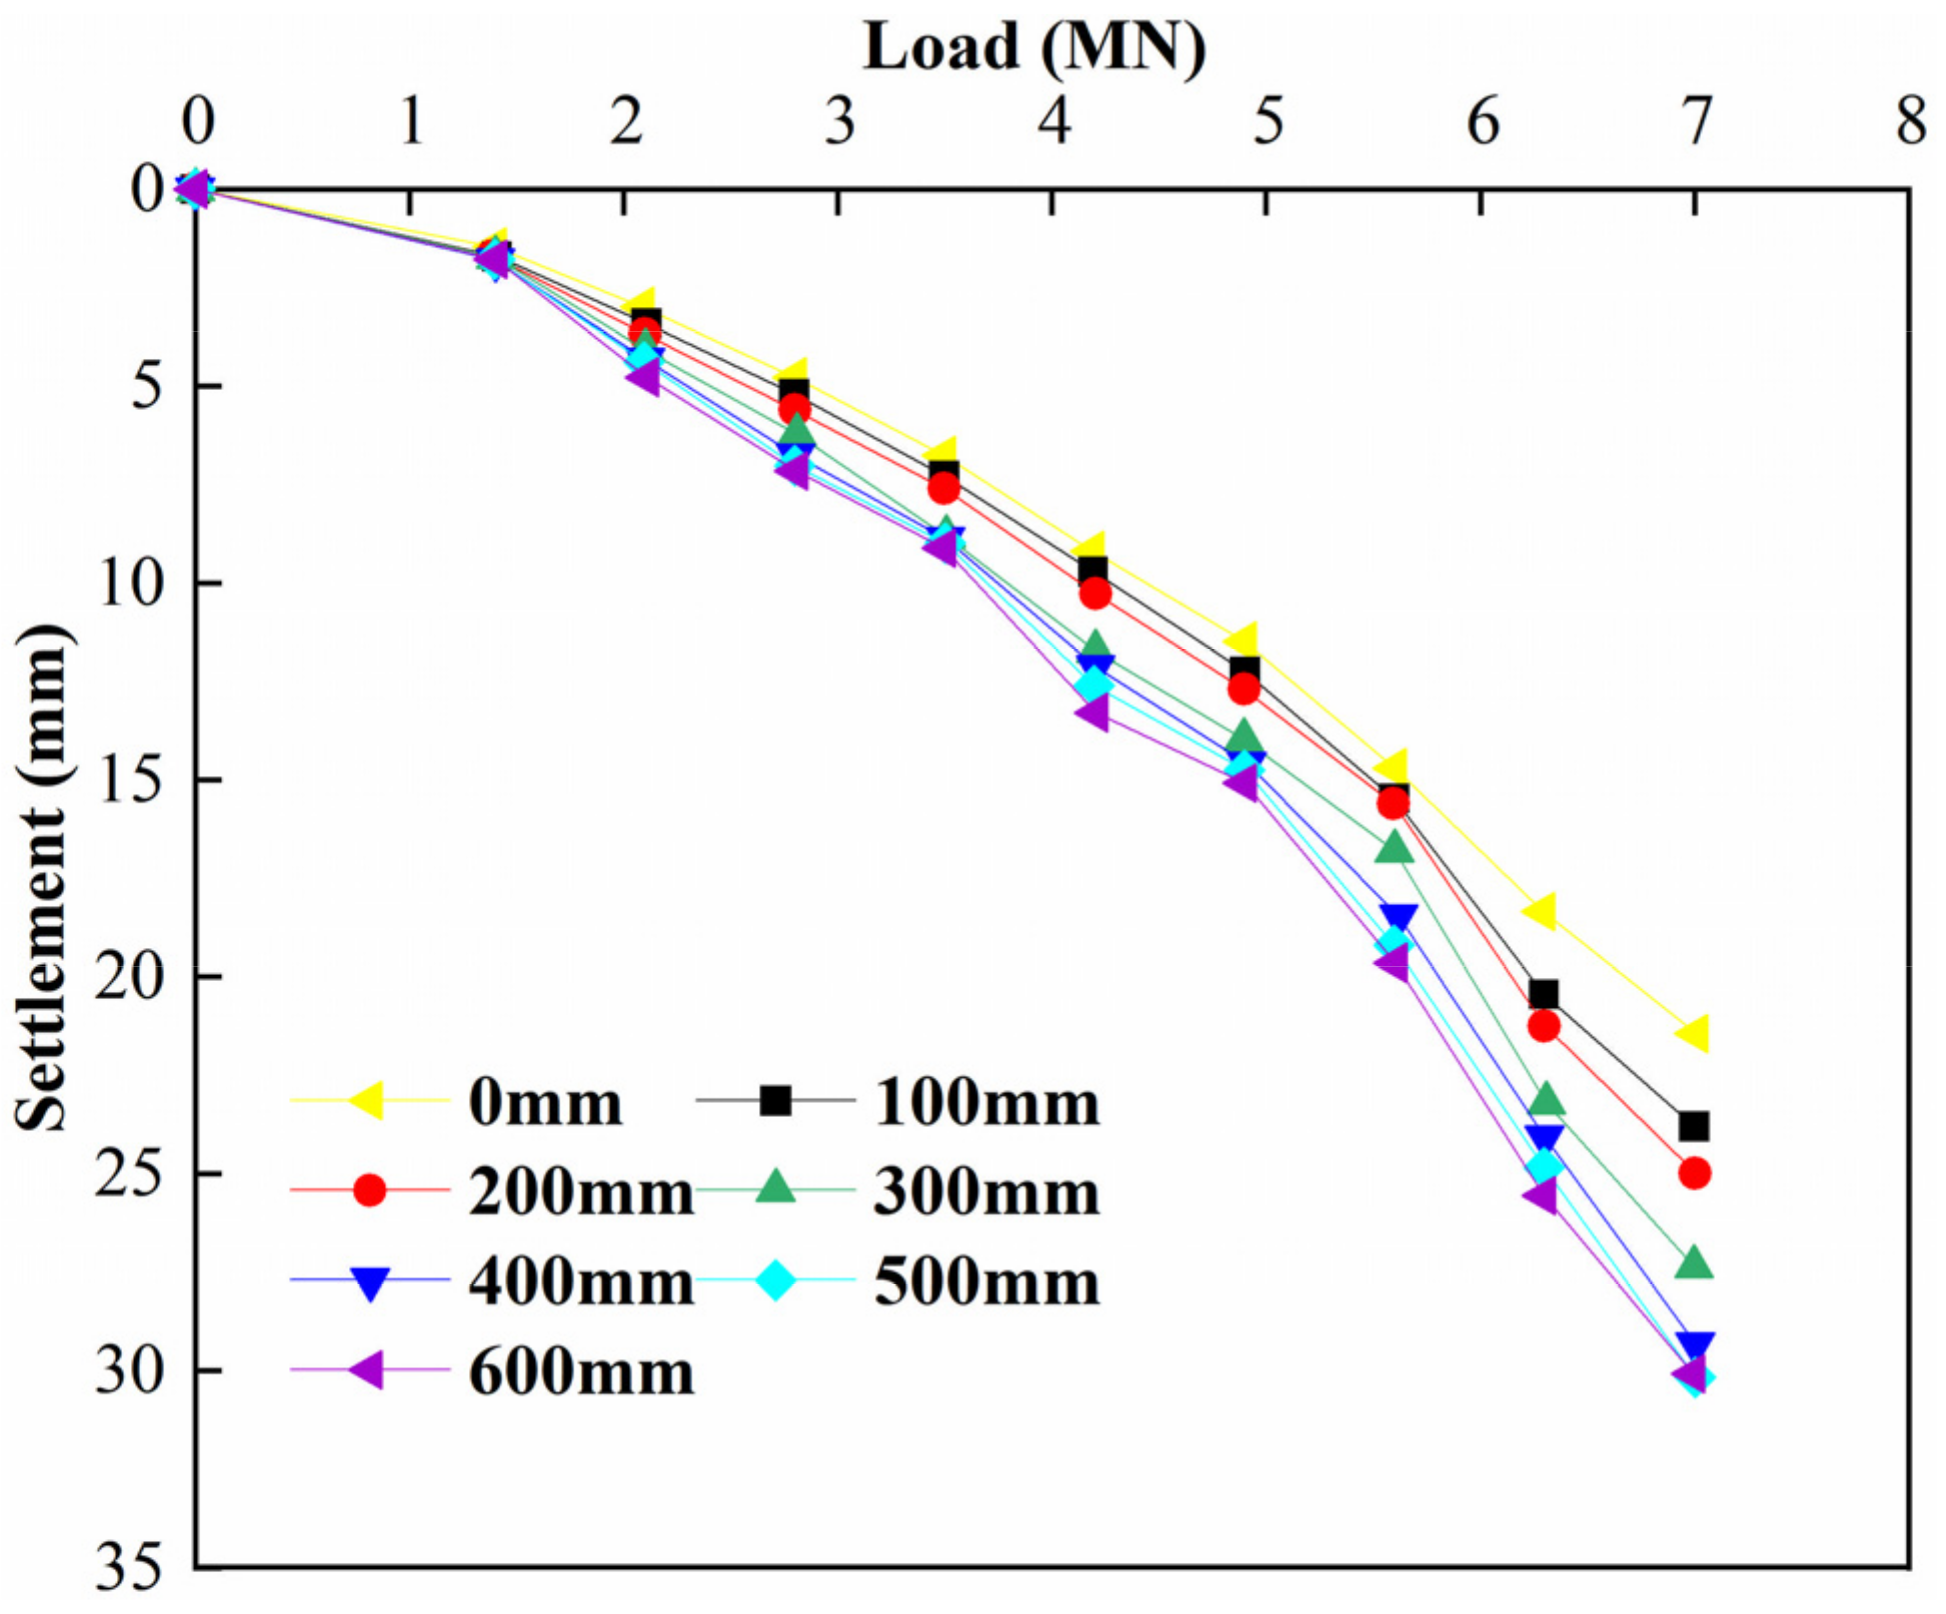
4.3. Study of the Effect of Different Sediment Thicknesses on the Q–s Relationship

The Q–s curve can not only show the response of a single pile under vertical loading but can also reveal the interaction mechanism between the pile foundation and the surrounding soil (including any sediment layer). It can be seen from the analysis of the Q–s curves plotted by the simulation in this study (as shown in Figure 13) that the settlement of the pile foundation under the initial loading was mainly due to the compression of the pile body itself and the immediate compression of the soil around the pile, and this was caused by the compression of the pile itself and the immediate compression of the soil around the pile. At this stage, because the external load was small, it could not be effectively transferred to the pile end; as such, the thickness of the sediment layer had relatively little effect on the settlement. This occurred because the compression of the pile body and the soil around the pile was the main settlement contributor under smaller loads, while the sediment layer at the pile end had not yet been subjected to sufficient loads so as to affect settlement. As the load increased, the load was gradually transferred through the pile body to the sediment layer at the pile end and bottom. At this point, the presence of the cinder layer started to significantly affect the settlement. It must be noted that, especially in the case of a thicker sediment layer, the compression of the sediment layer will become an important contributor to settlement. This is because the compression of the sediment layer increases as the load increases, making the settlement accelerate. Moreover, especially under the maximum thickness of the sediment layer, the settlement becomes more significant due to the compressibility of the sediment itself and the accelerated compression under higher loads. This phenomenon indicates that the thickness of the sediment layer has a significant effect on the settlement of the pile foundation under vertical loads. The effect of the sediment layer may be less pronounced in the early stages when the loads are small, but it becomes critical as the loads increase, especially when the loads are sufficiently transmitted to the pile ends.

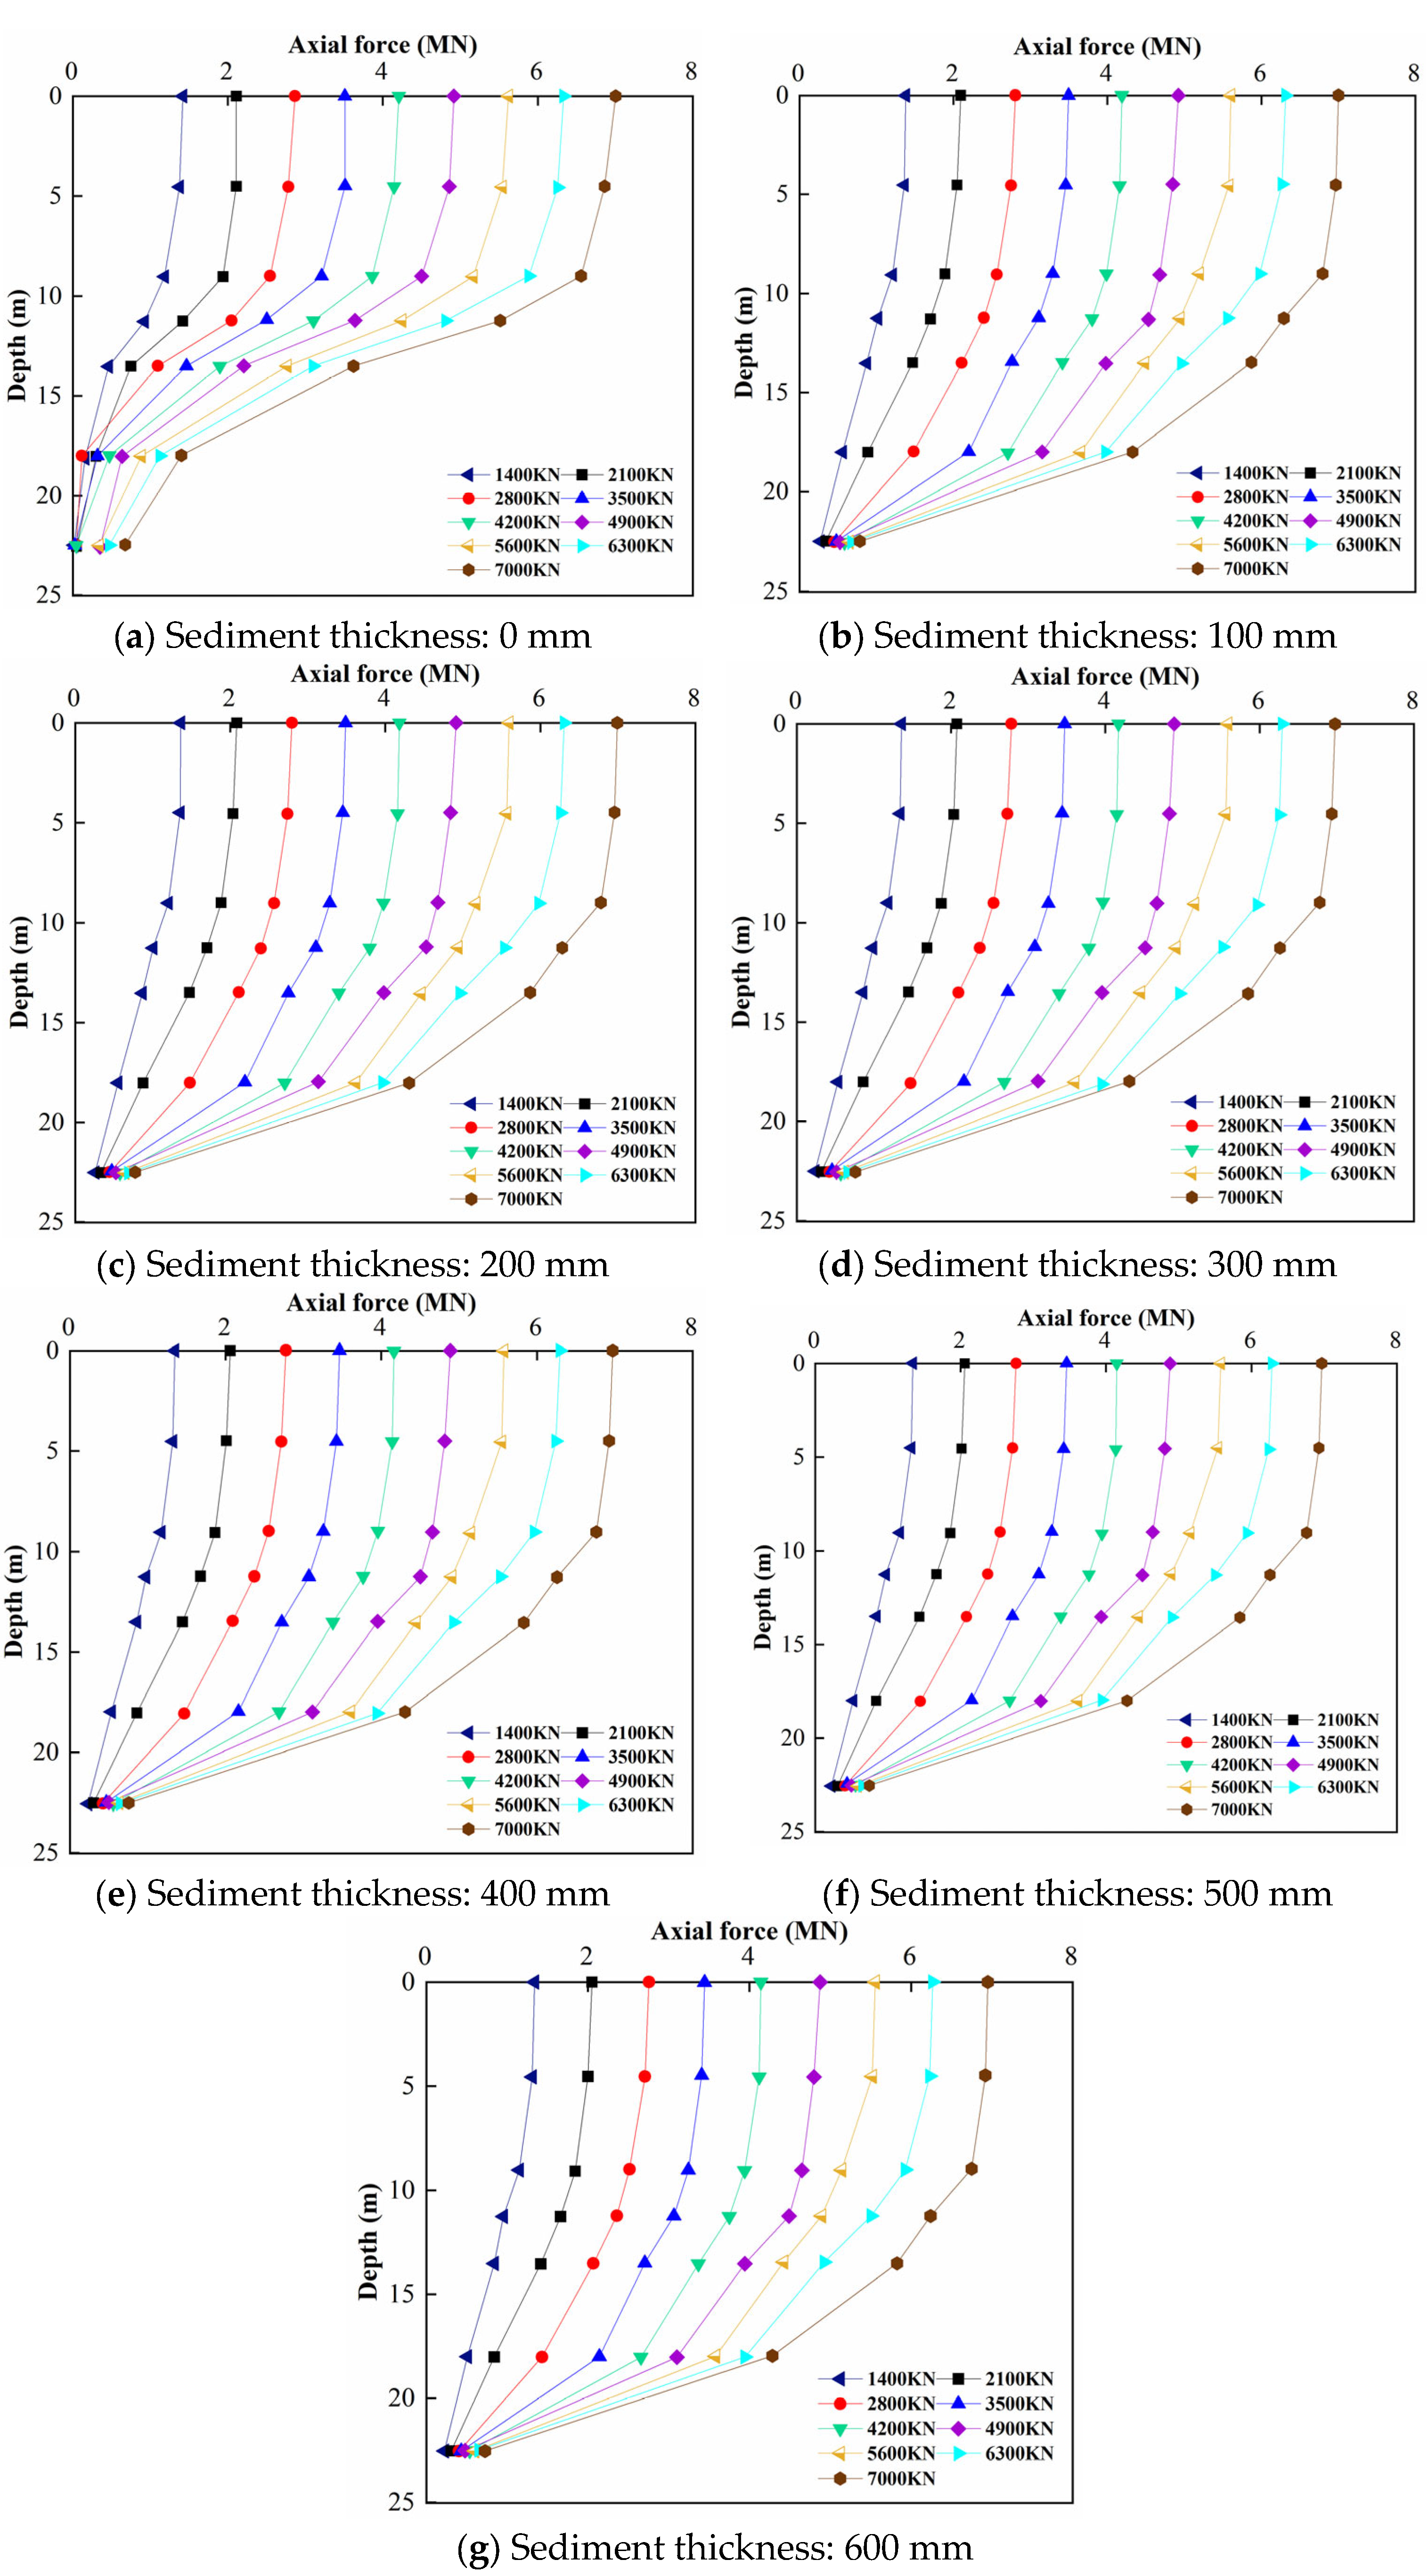
4.4. Study on the Effect of Different Sediment Thicknesses on Axial Force Exertion

The distribution and transmission of axial forces are affected by many factors, including pile material, pile size, pile depth, and the nature of the soil surrounding the pile. The thickness and physical properties of the sediment (e.g., density, compressibility, and shear strength) can also have a significant effect on the distribution of axial forces when the bottom or sides of the pile base are in contact with the sediment layer. Therefore, investigating the effect of sediment thickness on the axial force exerted is key to understanding and optimizing the design of the pile foundation, as shown in Figure 14, which shows the axial force curves of piles with different thicknesses.
In the study of the effect of sediment thickness on the axial force of monopiles, it was observed that there is a certain correlation between the transmission characteristics of the axial force and the thickness of the sediment layer, although this effect is relatively small. According to the simulation results, the main influence of the thickness of the cinder layer on the distribution of axial force is reflected in the lower part of the pile body, and the distribution of axial force shows different trends under different loading conditions: the axial force maintains a linear increase under smaller loads, while it turns to a nonlinear increase under larger loads. In addition, as the thickness of the sediment increases, the axial force transmitted to the pile bottom decreases slightly, with a decrease of no more than 100 KN. The distribution of the axial force along the pile body remained relatively linear under smaller loads, which may reflect the fact that the deformation of the pile body and the sediment layer was in the elastic range and the load was transmitted through the pile body in a more homogeneous manner at low load levels. The linearly increasing axial force distribution indicated that neither the properties of the pile materials nor the pile–soil interaction reached the threshold of nonlinear response at that time. As the load increased, the axial force distribution began to exhibit nonlinear characteristics, which are usually associated with the nonlinear behavior of the pile body materials, the increased compressibility of the sediment layer, and the deformation and reduced shear strength of the soil surrounding the pile. The nonlinear distribution, including possible plastic deformation and localized shear damage, may have also reflected the fact that the interaction between the pile body and the cinder layer became more complex at or above a certain level of loading. Although the variation in the thickness of the sediment layer had some effect on the transfer of axial forces, the small reduction in axial forces observed (which did not exceed 100 KN) suggests that the effect of the sediment layer on the transfer of axial forces was relatively limited over the range of sediment thicknesses studied. This may be due to the fact that the lower portion of the pile was able to effectively carry and transmit the loads by itself and through its interaction with the soil below it, even with the increased thickness of the sediment layer. In addition, this small change reflects the complexity of the interaction between the pile body and the sediment layer, and the influence of the physical and mechanical properties of the sediment layer on the efficiency of axial force transfer may be related to the specific conditions and characteristics of the sediment layer. In summary, although the thickness of the sediment layer had a certain effect on the transmission of axial force, within the scope of consideration, this effect was relatively limited, which was mainly reflected in the linear-to-nonlinear transition of the axial force distribution in the process of the load from low to high, and the small reduction in the axial force at the bottom of the pile was due to the increase in the thickness of the sediment layer.

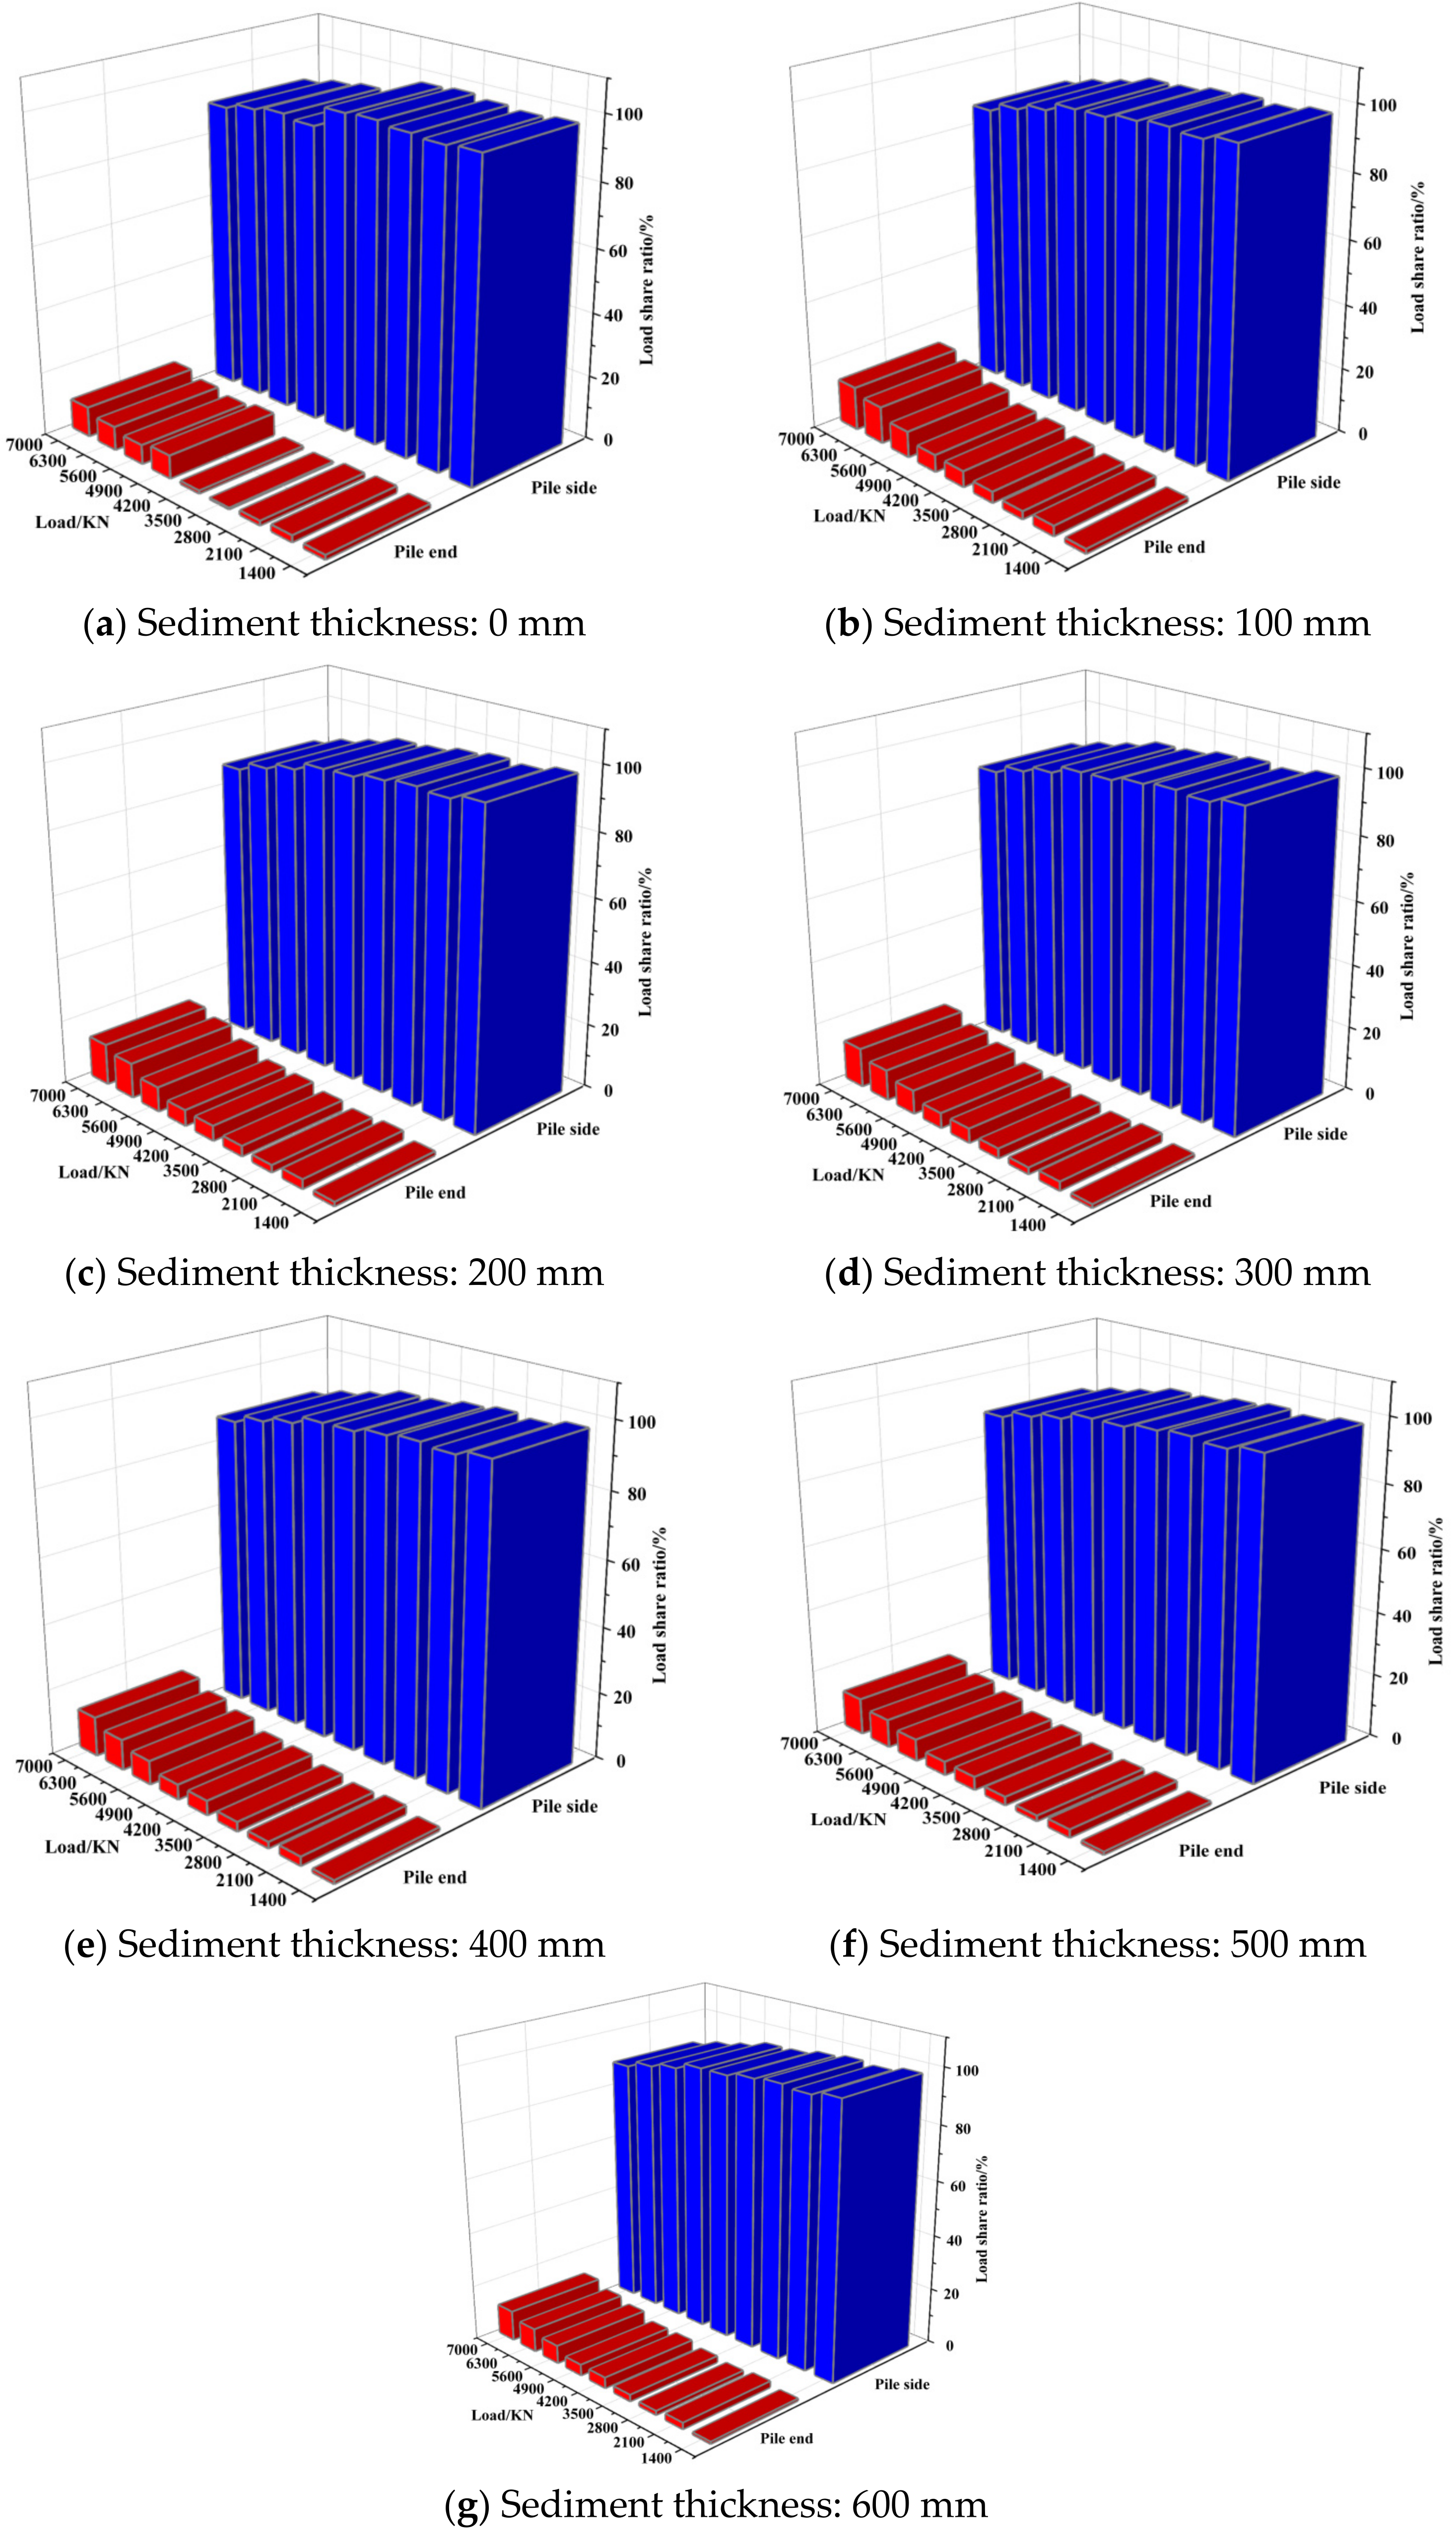
4.5. Study on the Effect of Different Sediment Thicknesses on Pile Side Resistance and Pile End Resistance

Pile side resistance and pile end resistance are two key parameters in the design and analysis of pile foundations, which together determine the bearing capacity of the pile foundation. The pile side resistance is generated by the interaction between the pile body and the surrounding soil, while the pile end resistance is generated by the contact between the pile end area and the bearing layer. The presence of sediment at the pile end will directly affect the direct contact between the pile end and the bearing layer, thus affecting the magnitude of pile end resistance. In addition, the sediment compression also affects the nature of the soil around the pile, which, in turn, affects the pile side resistance. Figure 15 shows the plot of a load-sharing ratio under different thicknesses of sediment according to the numerical simulation results.
The analysis results show that, with an increase in the load applied to the top of the pile, the proportion of the pile lateral friction resistance in the load bearing tended to decrease, reflecting that the proportion of the pile end resistance in the total load distribution improved with an increase in load. This phenomenon was especially significant under ultimate load conditions, and the change in the pile end resistance sharing ratio due to the increase in sediment thickness was relatively reduced under an ultimate load due to the compression of the sediment. The presence of sediment reduced the effective contact area between the pile end and the bearing layer, resulting in a reduction in the resistance sharing ratio at the pile end. As the load increased, the compressive effect of the sediment at the pile end became more pronounced, which further altered the load distribution between the pile side resistance and the pile end resistance. This change in the load-sharing ratio showed that the effect of the sediment thickness must be taken into account when considering pile design and performance evaluation. From a theoretical analysis, the effect of the presence and variation in the thickness of the sediment layer on the pile-bearing mechanism can be attributed to the variation in the interaction between the sediment and the pile end, as well as in the surrounding soil. An increase in the thickness of the sediment layer implies a reduction in the efficiency of the transfer of resistance at the pile end as it reduces the direct contact between the pile end and the bearing layer. In addition, the compression of the sediment layer may compensate somewhat for the effect of the initial sediment thickness as the load increases, but this compensating effect gradually diminishes under ultimate load conditions.

5. Conclusions

(1)
The thickness of the sediment at the pile end has a significant effect on the load–settlement behavior of a single pile. The thicker sediment at the pile bottom has higher compressibility, which leads to a relatively weak bearing capacity of the soil layer at the pile bottom. With an increase in the load, when the load is applied to a certain level, the lower settlement of the pile will suddenly increase due to the compression of the sediment at the pile end.
(2)
After sediment compaction, the load required to reach the ultimate bearing capacity of the test pile increases by 900 KN, which indicates that the load required for a bored cast-in-place pile with sediment at the pile end is higher than that of the pile without sediment when it reaches the ultimate load. This discovery highlights the potential ability of the pile-end-sediment compaction to improve the bearing capacity of pile foundations.
(3)
The settlement of piles increases with an increase in sediment thickness. When the pile top load is small, this phenomenon is not obvious. With an increase in the pile top load, the compression of sediment leads to a sharp increase in settlement, which becomes more obvious.
(4)
The influence of the thickness of the sediment layer on the axial force transfer is mainly reflected in the linear-to-nonlinear transformation of the axial force distribution in the process of load from low to high, as well as in the slight reduction in the axial force at the pile bottom caused by the increase in the thickness of the sediment layer. The increase in the sediment layer thickness means that the transfer efficiency of the pile end resistance decreases, but with the increase in load, the compression effect of the pile end sediment becomes more obvious, which will further change the distribution of the load between the pile side resistance and pile end resistance.
(5)
In this study, the influence of the sediment thickness and elastic modulus on the bearing characteristics of bored piles was studied. However, the influence of the other physical properties of sediment, such as the Poisson ratio, density, particle size distribution, and water content of the sediment, was not fully or deeply considered. These factors are what we are going to focus on in future studies.

Author Contributions

Conceptualization, W.S.; Methodology, W.S. and Z.W.; Software, W.Z.; Validation, Z.W.; Investigation, J.Y.; Resources, W.S.; Writing—original draft, W.S., Z.W., W.Z. and J.Y.; Writing—review & editing, W.S., Z.W., W.Z., J.Y. and J.Z.; Funding acquisition, J.Z. All authors have read and agreed to the published version of the manuscript.

Funding

This study was supported by the Youth Science and Technology Fund Program of Gansu Province (Grant No. 22JR5RA286) and the Hongliu Excellent Young Talents Program of Lanzhou University of Technology.

Data Availability Statement

The original contributions presented in this study are included in the article. Further inquiries can be directed to the corresponding author.

Conflicts of Interest

Authors Weibin Song and Jianming Zeng were employed by the company Gansu Wuhuan Highway Engineering Ltd. Author Junping Yang was employed by the company Gansu Jiantou Construct Co., Ltd. The remaining authors declare that the research was conducted in the absence of any commercial or financial relationships that could be construed as a potential conflict of interest.

References

  1. Ateş, B.; Şadoğlu, E. Experimental Investigation for Group Efficiency of Driven Piles Embedded in Cohesionless Soil. KSCE J. Civ. Eng. 2023, 27, 5123–5134. [Google Scholar]
  2. Ateş, B.; Şadoğlu, E. Experimental Investigation of Optimum Piles Spacing for Piled Raft Foundation in Sandy Soils. Tek. Dergi 2021, 32, 10477–10493. [Google Scholar] [CrossRef]
  3. Ateş, B.; Şadoğlu, E. Experimental Investigation of Pile Addition and Length on Bearing Capacity and Settlement of Rafts on Loose Sandy Soil. Afyon Kocatepe Univ. J. Sci. Eng. 2021, 21, 399–407. [Google Scholar]
  4. Liu, J.L. Experimental study on the effect of pile bottom sediment on the bearing capacity of super-large diameter drilled piles. Geotech. Investig. Surv. 2000, 28, 8–11. [Google Scholar]
  5. Lou, X.M.; Chen, Q.H.; Yu, Y.W.; Tao, X.W. Analysis of abnormal phenomena in ultimate bearing capacity of bored pile. Chin. J. Geotech. Eng. 2001, 23, 547–551. [Google Scholar]
  6. Dong, J.R. Influence of pile bottom slime on skin friction and bearing capacity estimation to pile. Ind. Constr. 2009, 39, 93–97. [Google Scholar]
  7. Mullins, G.; Winters, D. Infrared Thermal Integrity Testing Quality Assurance Test Method to Detect Drilled Shaft Defects; Dept. of Transportation: Washington, DC, USA, 2011. [Google Scholar]
  8. Feng, L.F. Experimental Studies and Numerical Simulations of the Effects of bottom Sediment on the Vertical Bearing Behaviour of Bored Piles; Tianjin University: Tianjin, China, 2012. [Google Scholar]
  9. Xiong, Y.C. Research on strength characteristics of sediment and hardening and softening effect of skin friction. Ind. Constr. 2019, 49, 107–114. [Google Scholar]
  10. Ni, M.; Xu, P.; Ding, X.; Mei, G. Physical and numerical modelling of axially loaded bored piles with debris at the pile tip. Comput. Geotech. 2019, 114, 103–146. [Google Scholar]
  11. Zhu, L.-H. Vertical Bearing Capacity Test and Finite Element Analysis on Large-Diameter Deep-Length Bored Cast-in-Situ Pile. Master’s Thesis, Chongqing Jiaotong University, Chongqing, China, 2012. [Google Scholar]
  12. Zhao, J.Q. Research and Controlling on Settlement Characteristic of Rotary Drilling Pile Considering the Bottom Sediment; Chongqing University: Chongqing, China, 2014. [Google Scholar]
  13. Huang, W.Y. Study on influence of pile bottom sediment on mechanical properties of cast-in-place pile. China Energy Environ. Prot. 2018, 40, 62–67. [Google Scholar]
  14. Lin, M.G.; Huang, X.L.; Han, D.D.; Shi, H. Numerical Simulation Research on Influence of Pile Tip Sediment on Bearing Capacity of Bored Pile. Highway 2021, 66, 116–122. [Google Scholar]
  15. Mei, G.X.; Hu, C.B.; Mei, L. Indoor model test of pile foundation using sediment at pile bottom. Chin. J. Rock. Mech. Eng. 2011, 30 (Suppl. S1), 3252–3259. [Google Scholar]
  16. Zhang, Q.Q. Bearing mechanism and response analysis method of vertically loaded piles. J. Shandong Univ. Sci. Technol. (Nat. Sci.) 2020, 39, 93–105. [Google Scholar]
  17. Yuan, C.X.; Zhen, X.D.; Chen, K. Effect of excavation beneath for a new subway station on the shaft resistance of an existing pile. J. Civ. Environ. Eng. 2024. early access. [Google Scholar]
  18. Vijayvergiya, V.N.; Focht, J.A. A new way to predict capacity of piles in clay. In Proceedings of the 4th Annual Offshore Technology Conference, Houston, TX, USA, 5–8 May 1972; pp. 865–874. [Google Scholar]
  19. Zheng, G.; Peng, S.Y.; Ng, C.W.; Diao, Y. Excavation effects on pile behaviour and capacity. Can. Geotech. J. 2012, 49, 1347–1356. [Google Scholar] [CrossRef]
  20. Kulhawy, F.H.; Prakoso, W.A.; Zhang, L.; Einstein, H.H. End bearing capacity of drilled shafts in rock. J. Geotech. Geoenviron. Eng. 1999, 125, 1106–1110. [Google Scholar] [CrossRef]
  21. Poulos, H.G. Settlement of single piles in nonhomogeneous soil. J. Geotech. Eng. Div. 1979, 105, 627–641. [Google Scholar] [CrossRef]
  22. Zhang, L.; Ernst, H.; Einstein, H.H. Nonlinear analysis of laterally loadedrock-socketed shafts. J. Geotech. Geoenviron. Eng. 2000, 126, 955–968. [Google Scholar]
  23. Desai, C.S. Numerical design-analysis for piles in sands. J. Geotech. Eng. Div. 1974, 100, 613–635. [Google Scholar] [CrossRef]
  24. Ateş, B.; Şadoglu, E. Experimental and Numerical Investigation for Vertical Stress Increments of Model Piled Raft Foundation in Sandy Soil. Iran. J. Sci. Technol. Trans. Civ. Eng. 2022, 46, 309–326. [Google Scholar] [CrossRef]
  25. Ateş, B.; Şadoğlu, E. Experimental and Numerical Investigation of Single Pile Subjected to Vertical Load in Sand. In Proceedings of the 3rd International Conference on Advanced Engineering Technologies, Surabaya, Indonesia, 2 October 2021. [Google Scholar]
Figure 1. Typical engineering geological profiles.
Buildings 15 01389 g001
Figure 2. The load–displacement curve of Test Pile-1.
Buildings 15 01389 g002
Figure 3. The load–displacement curve of Test Pile-2.
Buildings 15 01389 g003
Figure 4. Pile-end-sediment compression settlement diagram.
Buildings 15 01389 g004
Figure 5. The typical load–displacement curves with and without sediment.
Buildings 15 01389 g005
Figure 6. Exponential function model diagram.
Buildings 15 01389 g006
Figure 7. A variation diagram of the elastic modulus of the multilayer soil.
Buildings 15 01389 g007
Figure 8. The converted Test Pile-1 Q–s curve.
Buildings 15 01389 g008
Figure 9. A Q–s curve comparison diagram.
Buildings 15 01389 g009
Figure 10. A two-dimensional model diagram of a bored pile with pile end sediment.
Buildings 15 01389 g010
Figure 11. A three-dimensional model diagram of a bored pile with pile end sediment.
Buildings 15 01389 g011
Figure 12. A comparison diagram of the single-pile axial force and side friction.
Buildings 15 01389 g012
Figure 13. Load–displacement curves of the piles under different sediment thicknesses.
Buildings 15 01389 g013
Figure 14. A diagram of the single-pile axial force under different sediment thicknesses.
Buildings 15 01389 g014
Figure 15. A load-sharing ratio diagram of single piles under different sediment thicknesses.
Buildings 15 01389 g015
Table 1. Soil parameters.
Stratum NumberStratigraphic NameElastic Modulus (MPa)Poisson’s RatioInternal Friction Angle (/°)Cohesion (c/KPa)Gravity
(γ/KN·m−3)
Water Content (%)Saturation Degree (%)Constrained
Modulus (MPa)
②-1Loess silty soil9.50.224.527.81812.5636.887.74
④-1Silty soil150.253031919.063.78.56
⑥-1ASilty clay350.2540321.821.17912.73
⑥-1BSilty soil100.3521.523.619.523.8983.956.92
⑧-1Silty clay70.321.423.519.622.586.910.67
Table 2. The parameters of the test piles.
Pile NumberPile Diameter/mPile Length/mSediment Thickness/mm
1#0.84190
2#0.84170
Table 3. The main soil parameters.
Soil HorizonElastic Modulus (MPa)Poisson’s
Ratio
Internal Friction Angle
(/°)
Cohesion
(kPa)
Gravity
(KN·m−3)
Sediment20.230119.6
Disclaimer/Publisher’s Note: The statements, opinions and data contained in all publications are solely those of the individual author(s) and contributor(s) and not of MDPI and/or the editor(s). MDPI and/or the editor(s) disclaim responsibility for any injury to people or property resulting from any ideas, methods, instructions or products referred to in the content.

