Article

Designing for Neonates’ Wellness: Differences in the Reverberation Time Between an Incubator Located in an Open Unit and in a Private Room of a NICU

by
Virginia Puyana-Romero
1,*,
Daniel Nuñez-Solano
2,
Ricardo Hernández-Molina
3,
Francisco Fernández-Zacarías
3,
Juan Jimenez
3 and
Giuseppe Ciaburro
4
1
Departament of Sound and Acoustic Engineering, Universidad de Las Américas, Quito 17513, Ecuador
2
Group R&D, Rockwool, A/S Hovedgaden 584, DK-2640 Hedehusene, Denmark
3
Acoustic Engineering Laboratory, Puerto Real Campus, Universidad de Cádiz, 11510 Puerto Real, Spain
4
Department of Engineering, Faculty of Engineering and Computer Science, Università Digitale Pegaso, 80143 Naples, Italy
*
Author to whom correspondence should be addressed.
Buildings 2025, 15(9), 1411; https://doi.org/10.3390/buildings15091411
Submission received: 24 March 2025 / Revised: 15 April 2025 / Accepted: 17 April 2025 / Published: 22 April 2025
(This article belongs to the Special Issue Acoustics and Well-Being: Towards Healthy Environments)

Abstract

:
Noise levels in Neonatal Intensive Care Units (NICUs) significantly impact neonatal health, influencing stress levels, sleep cycles, and overall development. One critical factor in managing noise is reverberation time (T), which affects sound persistence and acoustic comfort. This study, conducted at the Universidad de Las Américas in Quito, Ecuador, examines T in two NICU room types—open unit and private room. Measurements were taken in simulated environments to assess acoustic differences between these two designs. Results indicate that T is significantly lower in private rooms compared to open units, suggesting that private rooms provide a more controlled and acoustically favorable environment for neonates. Lower T reduces excessive noise exposure, improving sleep quality and minimizing stress responses in preterm infants. Furthermore, the findings align with Sustainable Development Goals (SDGs), particularly SDG 3 (Good Health and Well-being) and SDG 11 (Sustainable Cities and Communities), by advocating for hospital designs that enhance patient health and promote sustainable infrastructure. These results highlight the importance of integrating acoustically optimized spaces in NICUs to improve neonatal outcomes and contribute to a more sustainable healthcare system. Future research should further explore architectural solutions for noise reduction to refine NICU design standards.

1. Introduction

Newborn exposure to noise within neonatal intensive care units (NICUs) remains a critical issue despite technological advancements in biomedical engineering over recent decades [1]. While innovations have mitigated some noise sources—such as those related to the incubator engine—many essential devices used to support neonatal health continue to generate significant noise [2,3,4,5]. Notably, incubators themselves, even with improved airflow and engine systems, are still considered significant contributors to the noise burden in NICUs [2,6,7]. In fact, measurements conducted in a III level NICU in Ottawa (Canada) reveal mean sound pressure levels of 83.5 dB, 83 dB, and 80.9 dB, for the day, evening, and night periods, respectively [8]. This background noise remains a concern as prolonged NICU stays, especially those exceeding four days, have been identified as risk factors for neonatal hearing impairment [9]. Among premature newborns, between 2% and 10% have hearing loss, compared with only 0.1% of the general population of full-term infants [10]. But the impact of noise on neonates in NICUs extends beyond hearing problems. Numerous studies underscore how the noisy environment can lead to broader adverse health effects, such as neonatal stress [11,12,13,14,15]. Persistent acoustic stress has been associated with future difficulties in language acquisition, attention, and auditory processing [16,17], alongside physiological stress responses such as changes in heart rate and oxygen saturation [10]. These physiological responses may impact neurological development in significant ways [11,18,19,20,21,22].
However, prolonged NICU stays are often necessary for premature infants or those with severe health conditions, placing them at heightened risk of chronic problems due to noise exposure. These problems may cause sleep disturbances [23,24,25], which have profound effects on various critical physiological functions, such as heart rate regulation, apnea episodes, and intracranial pressure, which in turn can hinder recovery and growth [26]. Deep sleep, essential for brain maturation, when disrupted, can interfere with thermoregulation, hormone production, and immune function [23]. Over time, these cumulative effects may impact long-term outcomes, including cognitive development, academic success [27], emotional (increasing risks for anxiety or depression), and behavioral problems (such as attention-deficit/hyperactivity disorder (ADHD)) [28].
A recent study analyzed noise levels generated by modern incubators, specifically examining six Giraffe Incubators, two Giraffe Omnibeds, and one Care Plus model. Results indicated that noise intensity inside incubators was generally higher than outside (60.9 dB vs. 58.7 dB; p < 0.001). Incubators with protective covers showed reduced internal noise levels (58.8 dB vs. 62 dB; p < 0.001), while incubators with active humidification systems had slightly increased noise (61.5 dB vs. 60.2 dB; p < 0.001) [29]. These sound pressure level measurements, although did not account for other noise sources, such as fans, infusion pumps, alarms, and phones, exceed the 45 dB maximum recommended by the American Academy of Pediatrics Health [30], which also suggests regular monitoring of NICU and incubator sound pressure levels, a feature not yet widely available in incubators.
Historical data gathered by Busch-Vishniac et al. [31,32] during 45 years indicate an annual noise level increase of 0.4 dB during both daytime and nighttime hours, illustrating an upward trend in NICU acoustic stress. Within the NICU, two primary noise types have been identified: background noise, generated by incubator motors, fans, and other essential medical devices; and impulsive noise events, arising from alarms, conversations, and various staff activities [2,33,34]. Consequently, infants in the NICU are exposed to an environment that is very different from that experienced by most healthy full-term newborns [35].
This does not mean that neonatal rooms should be silent since exposure to sounds, especially natural sounds, is necessary for the neonate and provides constant sensory stimulation [36,37]. However, these stimuli should be more related to familiar voices than to medical devices [38]. This early exposure to artificial sounds in the neonatal environment plays a critical role in language acquisition and the development of language skills [39].
Therefore, a reduction in the non-parental noise levels the newborn is exposed is needed. This can be achieved by lowering the sound levels in an entire unit, treating the infant in a section of a NICU or a “private” room, in incubators in which the sound levels are controlled, carrying out awareness campaigns addressed to the medical staff, or reducing the sound levels that reach the individual infant by using earmuffs or earplugs.
Concerning NICU design, several studies have compared noise levels in units designed with individual rooms for each family versus traditional open units [2,40,41]. These studies have found that single incubator rooms had significantly lower noise levels compared to open units due to less interference from sounds from other incubators and medical equipment, which not only reduces noise but also improves the perception of care by parents and the well-being of staff. That is, open-plan units tend to have higher noise levels due to greater exposure to noise generated by staff and equipment, while small modules help mitigate the acoustic impact [2]. On the other hand, making an effort to reduce NICU noise levels, several training programs and procedures have been carried out [42,43,44,45], but none of them have reduced the noise below the recommendations. A recent study examined NICU staff’s awareness of the effects of excessive noise on infants’ neurodevelopment and their perspectives on the clinical usefulness of a noise meter [46]. The findings indicated that while most nurses recognized the potential harm of excessive noise on infant development, nearly half questioned the effectiveness of noise meters in reducing noise levels. An observational study conducted by Coston and Aune [47] tried to reduce NICU noise levels below the recommended 45 dBA. The maximum decrement was up to 55.3 dBA, although three different procedures were applied: Staff awareness and education, environmental noise reduction measurements, and unit modification procedures. Additionally, to locally reduce the noise the neonate is exposed to, Almadhoob and Ohlsson [48] analyzed the effects of silicone earplugs versus no earplugs qualified for inclusion. There was a significant difference in the Mental Developmental Index (MD—Bayley II) favoring the silicone earplugs group at 18 to 22 months corrected age: MD 14.00, 95% CI 3.13 to 24.87 (n = 12), but not for Psychomotor Development Index (Bayley II) at 18 to 22 months corrected age: MD −2.16, 95% CI −18.44 to 14.12 (n = 12).
The different treatments required by newborns, whether full-term, preterm, or post-term, determine whether they are placed in a thermal cot or an incubator. However, incubators provide a protective environment for newborns, creating a room with humidity, temperature, and oxygen conditions that promote growth and development and meet the needs of newborns with health problems [49].
Since incubators are needed for the health and recovery of preterm neonates, some factors affecting noise inside incubators have also been considered in research. Reverberations caused by reflective surfaces in both incubators and the room amplify noise levels, often creating a high-reverberant environment inside the incubator domes. For years, research suggested reverberation could significantly elevate noise levels within closed incubators [50,51,52]. In fact, closed incubator walls tend to produce higher noise levels than when doors are open [50,53,54]. Barcelo et al. reported reverberation times (Ts) between 2 to 3.7 s from opening and closing incubator windows [55], although procedural details like the number of measurements or microphone locations were unclear. To check the reverberation time magnitude, a recent study measured Ts inside a neonatal incubator in an acoustically treated room (T < 0.15 s). A total of 28 combinations of microphone and source positions were used, leading to more than 500 measurements. The largest reverberation happened at 125 Hz, with a mean value of 1.89 s [56]. Though these times fall within the average for a standard room, they are long and acoustically uncomfortable for the confined space of an incubator. Furthermore, the materials normally used in NICUs, with very reflective surfaces and the incubator’s low acoustic insulation, contribute to the noise persistence being higher inside than outside the incubator at some sound frequencies [7,57,58], also contributing to an increase in the stress levels in neonates.
Considering these facts, it can be affirmed that the incubator, together with the NICU, constitutes an interconnected system in which the ambient noise of the room directly affects the neonates. This relationship highlights the importance of appropriately managing the noise level in the neonatal environment to protect the health and development of newborns, as well as ensure an environment conducive to their recovery [59].
The evaluated studies do not consider the effect of the T of the rooms on the T inside the incubator. Furthermore, no studies were found comparing Ts in two neonatal rooms, one open and one private room, with different sound absorptions and volumes. Most studies focus on comparing noise levels in open-plan NICUs with those in single-room settings, highlighting the advantages of the latter in terms of noise reduction and better environmental control. However, the T is a very important factor in neonatal well-being and acoustic comfort. This lack of research highlights the need to further investigate how variations in the NICU design can influence the T in the incubator and ultimately in the health and development of newborns.
Therefore, the present research aims to deepen the knowledge of the effects of the T on the sound persistence inside the same incubator located in two different NICUs, an open-plan NICU, and a private room NICU setting, analyzing its possible impact on neonatal well-being and assessing their alignment with the Sustainable Development Goals (SDGs) to promote healthier and more sustainable healthcare environments. For that, T measurements in the mentioned NICUs settings and inside the incubators were conducted

2. Materials and Methods

In order to understand how T and the room environment impact noise levels inside the incubator, two different rooms were chosen for the study. Because T measurements require the generation of very high noise levels, and in order to protect neonates and NICU staff, the measurements were not made in real NICUs, but in similar rooms in the Simulation Medical Center of the School of Medicine and the Department of Sound and Acoustic Engineering of the University of the Americas, in Quito, Ecuador. The first one simulates an open-plan unit, and the second one, with a smaller size, simulates a private room in a NICU; each room provides unique acoustic characteristics and is representative of both NICU configurations. From now on, they will be called “OU” and “PR”, respectively.
T measurements were evaluated in the incubator and in both NICUs. The acoustic insulation between both NICUs and the incubator was also calculated in this study. The analysis was carried out in one-third octave bands ranging from 100 Hz to 5000 Hz.

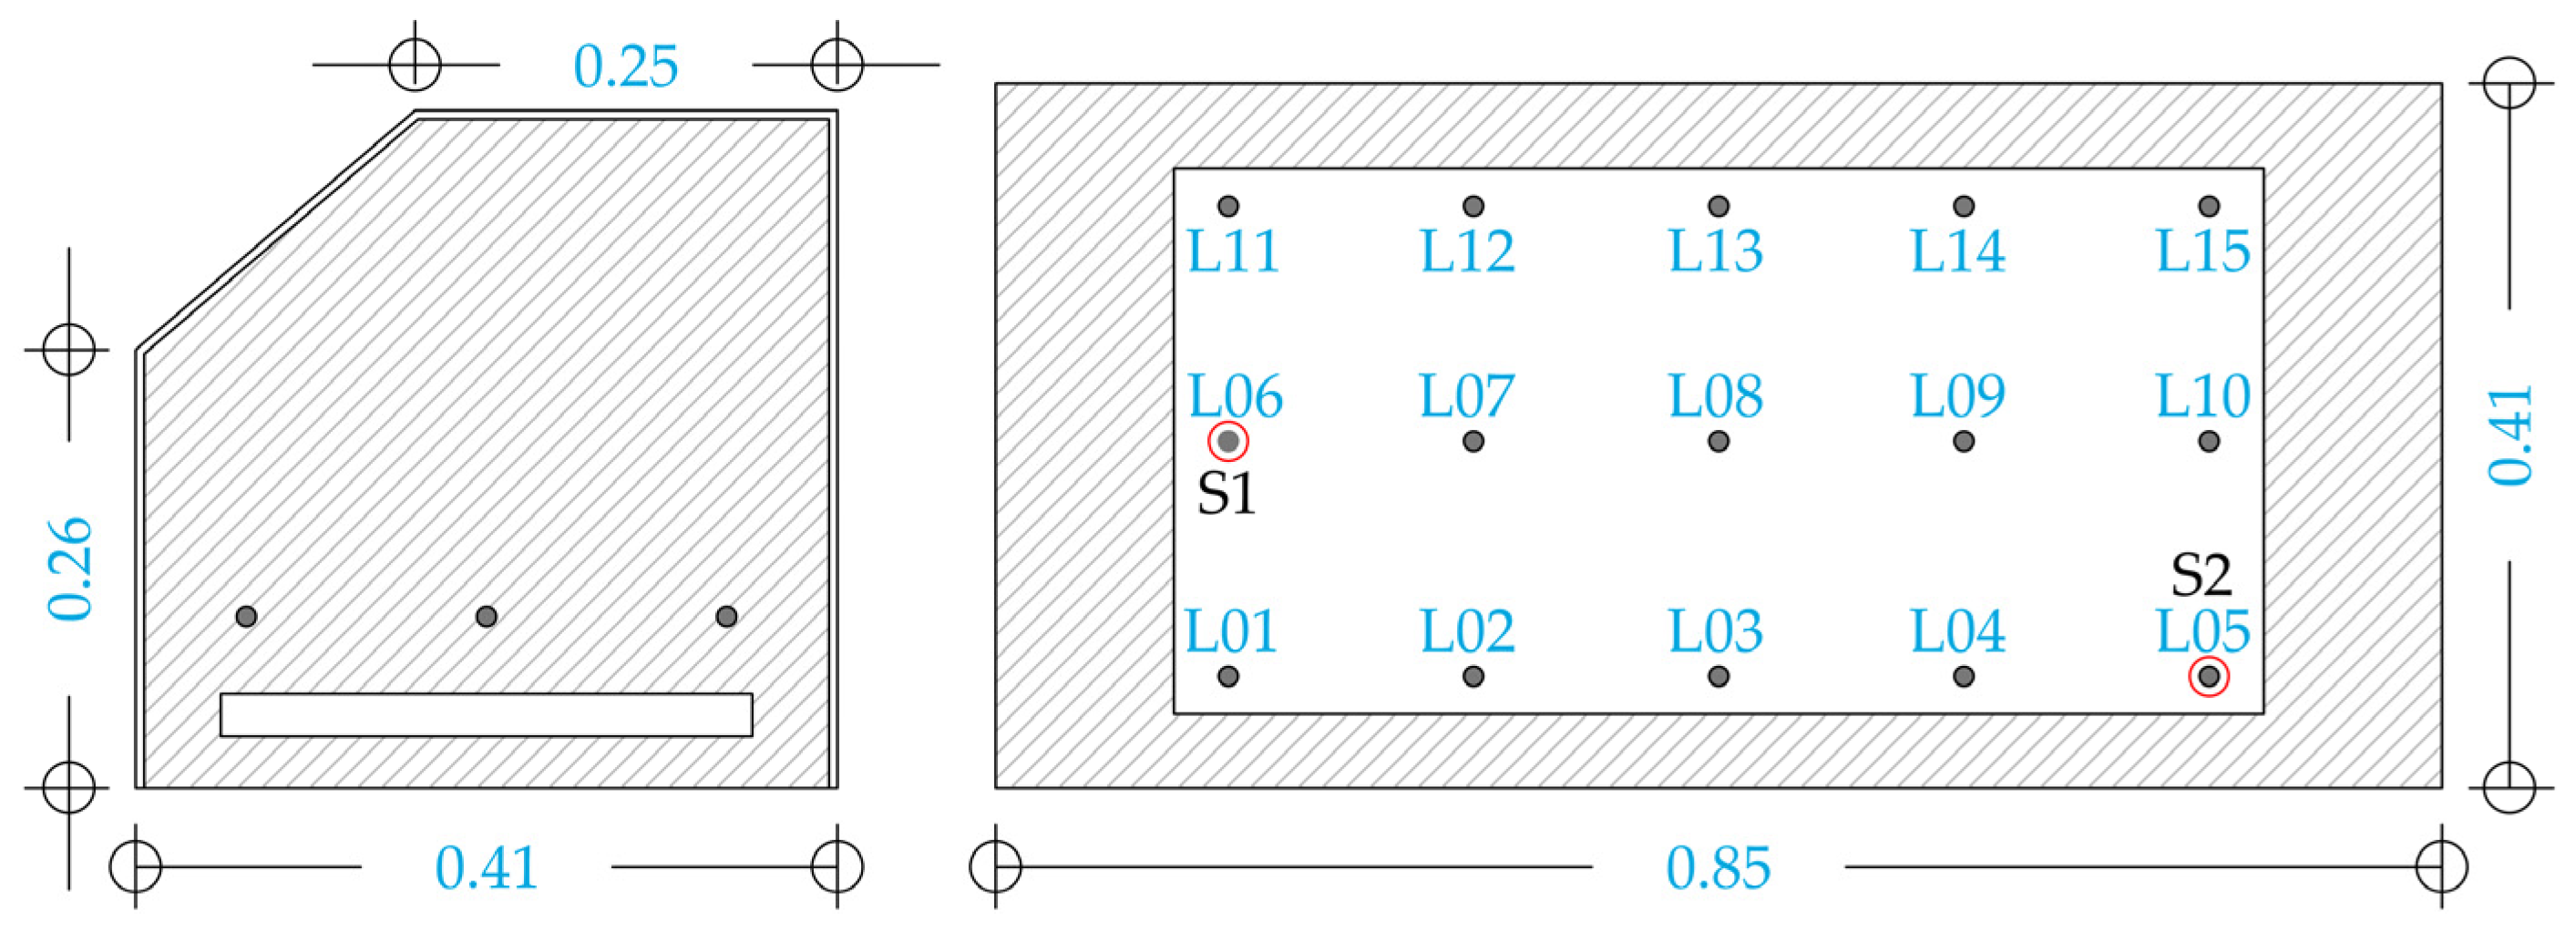
2.1. Reverberation Time Measurements

The room impulse response is a signal that encapsulates data about the direct sound as well as the early and late reflections generated when a sound source activates the propagation medium [60,61,62]. Moreover, the room impulse response characterizes the room’s sound energy and its decay. By measuring the room impulse response within an incubator or NICU, it becomes possible to determine Ts and sound pressure levels (SPLs) caused by the sound source. These T and SPL values can then be utilized to measure the incubator’s acoustic insulation. Since the recorded noise levels exceeded the background noise by 10 dB, no correction for background noise was necessary. In this study, the T measurements, specifically T30, were analyzed. T30 represents the time required for the sound pressure level (SPL) to decrease 30 dB, extrapolated by multiplying by 2. Background noise is measured during each T assessment to ensure that the 30 dB sound decay remains at least 10 dB above the ambient noise level in the room.
The T was measured in both rooms and inside the incubator located in each room. Due to its size, for the incubator impulse response measurements, balloon bursts were used to produce an impulsive sound for measuring T instead of a standard omnidirectional source. Although balloon bursts have certain limitations, such as directional sound radiation at specific frequencies [63,64,65], balloons were selected because of their adaptability to the incubator size and compliance with ISO 3382-2 requirements [66] for omnidirectional sources at frequencies above 500 Hz [63]. Balloons of uniform size, material, and inflation pressure were used to ensure uniform room excitation [63,65,67]. Given the lack of specific literature guidance on the number of sound source positions for small enclosures as an incubator, the ISO 3382-2 was taken as a reference; consequently, two source positions were chosen, consistent with recommendations for engineering-level measurement accuracy. While the ISO does not prescribe specific sound source locations for small locations, one source was placed in a corner to facilitate standing wave excitation [68], and the other was positioned near where an infant’s head would normally rest. To assess the T inside the incubator, 15 positions were marked on the incubator floor, following the methodology applied in previous studies on small rooms developed by the authors [56,69]. Fourteen microphone positions were used to conduct the measurements since the two sound source locations were substituted with one of the placements marked on the incubator floor. Since four measurements were made at each of the 14 microphone positions and sound source combinations, a total of 112 acoustic measurements were made. A 1/2” free-field GRAS microphone connected to a PC via an external AVID sound card was used to carry out the T measurements inside the incubator. Each measurement involved recording an impulse response audio file at a sampling rate of 44.1 kHz. The T values were obtained after post-processing data using the open-source ITA toolbox [70] developed in Matlab. Measurements were taken with the incubator turned off, all access portholes closed, and two configurations, the first one with a mattress inside to replicate standard incubator use, and the second one without it, to acoustically characterize the incubator. During the measurements, the two lateral wall openings were kept closed. In contrast, the smaller holes designated for breathing tube cables or cardiac monitor electrodes remained open, given their relatively minor size compared to the incubator dome’s surface. These openings were also utilized to pass the microphone cable and accommodate the balloon-popping tool.
The SC260 sound level meter, the omnidirectional sound source, and the AP602 Noise Generator from the CESVA brand were used to measure the T in the OU and PR. For the OU, ten microphone-sound source combinations were used, with four decays at each combination, far exceeding the number of measurements recommended by the ISO 3382-2 for the engineering method [70] (Figure 1b). However, the small dimensions of the PR only allowed for 8 microphone-sound source combinations (Figure 1b). Four decays were also conducted for each combination. White noise was used to carry out the T measurements.
To validate the measurement chain, a CESVA class 1 calibration pistonphone was utilized, with checks conducted both before and after the measurements, inside the incubator and in both rooms.

2.2. Acoustic Insulation Measurements

The acoustic insulation index “D” (sound pressure level difference) between the rooms and the incubator was conducted using ISO 16283-1 [71] as the reference standard. However, this standard was used solely as a guideline since it is intended for rooms with volumes ranging from 10 to 250 m3, whereas the incubator’s space is considerably smaller.
For the sets of acoustic insulation measurements in both OU and PR, the interior of the incubator was designated as the receiver room. This decision was based on the delicate nature of newborns and the ISO 16283-1 standard’s recommendation to select the smallest room as the receiver to prevent overestimation of the acoustic insulation results [71]. To obtain more accurate results, acoustic insulation was calculated in one-third octave bands as suggested by ISO.
To assess the sound pressure level difference (D) between the interior and exterior of the incubator in each room, measurements were performed using the SC260 sound level meter, an omnidirectional sound source, and the AP602 noise generator, all manufactured by CESVA. White noise was employed for the measurements.
The procedure was the following. First, SPL measurements were conducted in the simulated NICU (outside the incubator), locating the sound source and the microphones in the positions shown in Figure 1a,b. After that, with the same locations of the sound sources in the rooms, the noise transmitted to the incubator was measured, placing the microphones in the 15 locations used to measure T (Figure 2).
A total of 10 microphone-sound source combinations were used in the OU, conducting 4 measurements for each combination, with a total of 40 measurements. The microphone locations in the sending rooms (outside the incubator) were distributed uniformly in different planes relative to the room boundaries, intentionally avoiding any formation of a regular grid. The following minimum distance criteria were met: the distances between microphones were larger than 0.7 m, every microphone kept a minimum distance of 0.5 m from any room boundary, and at least 1.0 m was kept between any microphone and the speaker. Implementing the ISO 16283-1 in confined spaces can be challenging, particularly in meeting the suggested distances between the microphones and sound sources [60]. The dimensions of PR allowed only four positions for microphones (instead of the 5 positions that the ISO advises), so sound sources had to be located at the corners to facilitate standing wave excitation and appropriately measure the noise levels outside the incubator. In each microphone–source combination, 4 measurements were conducted, resulting in a total of thirty-two measurements.
The microphone placement in the receiver room (incubator) should meet the same criteria as in the sending room. However, the reduced dimensions of the incubator did not allow it. Consequently, it was preferred to locate the microphone in many locations [15], so that the results could be consistent.

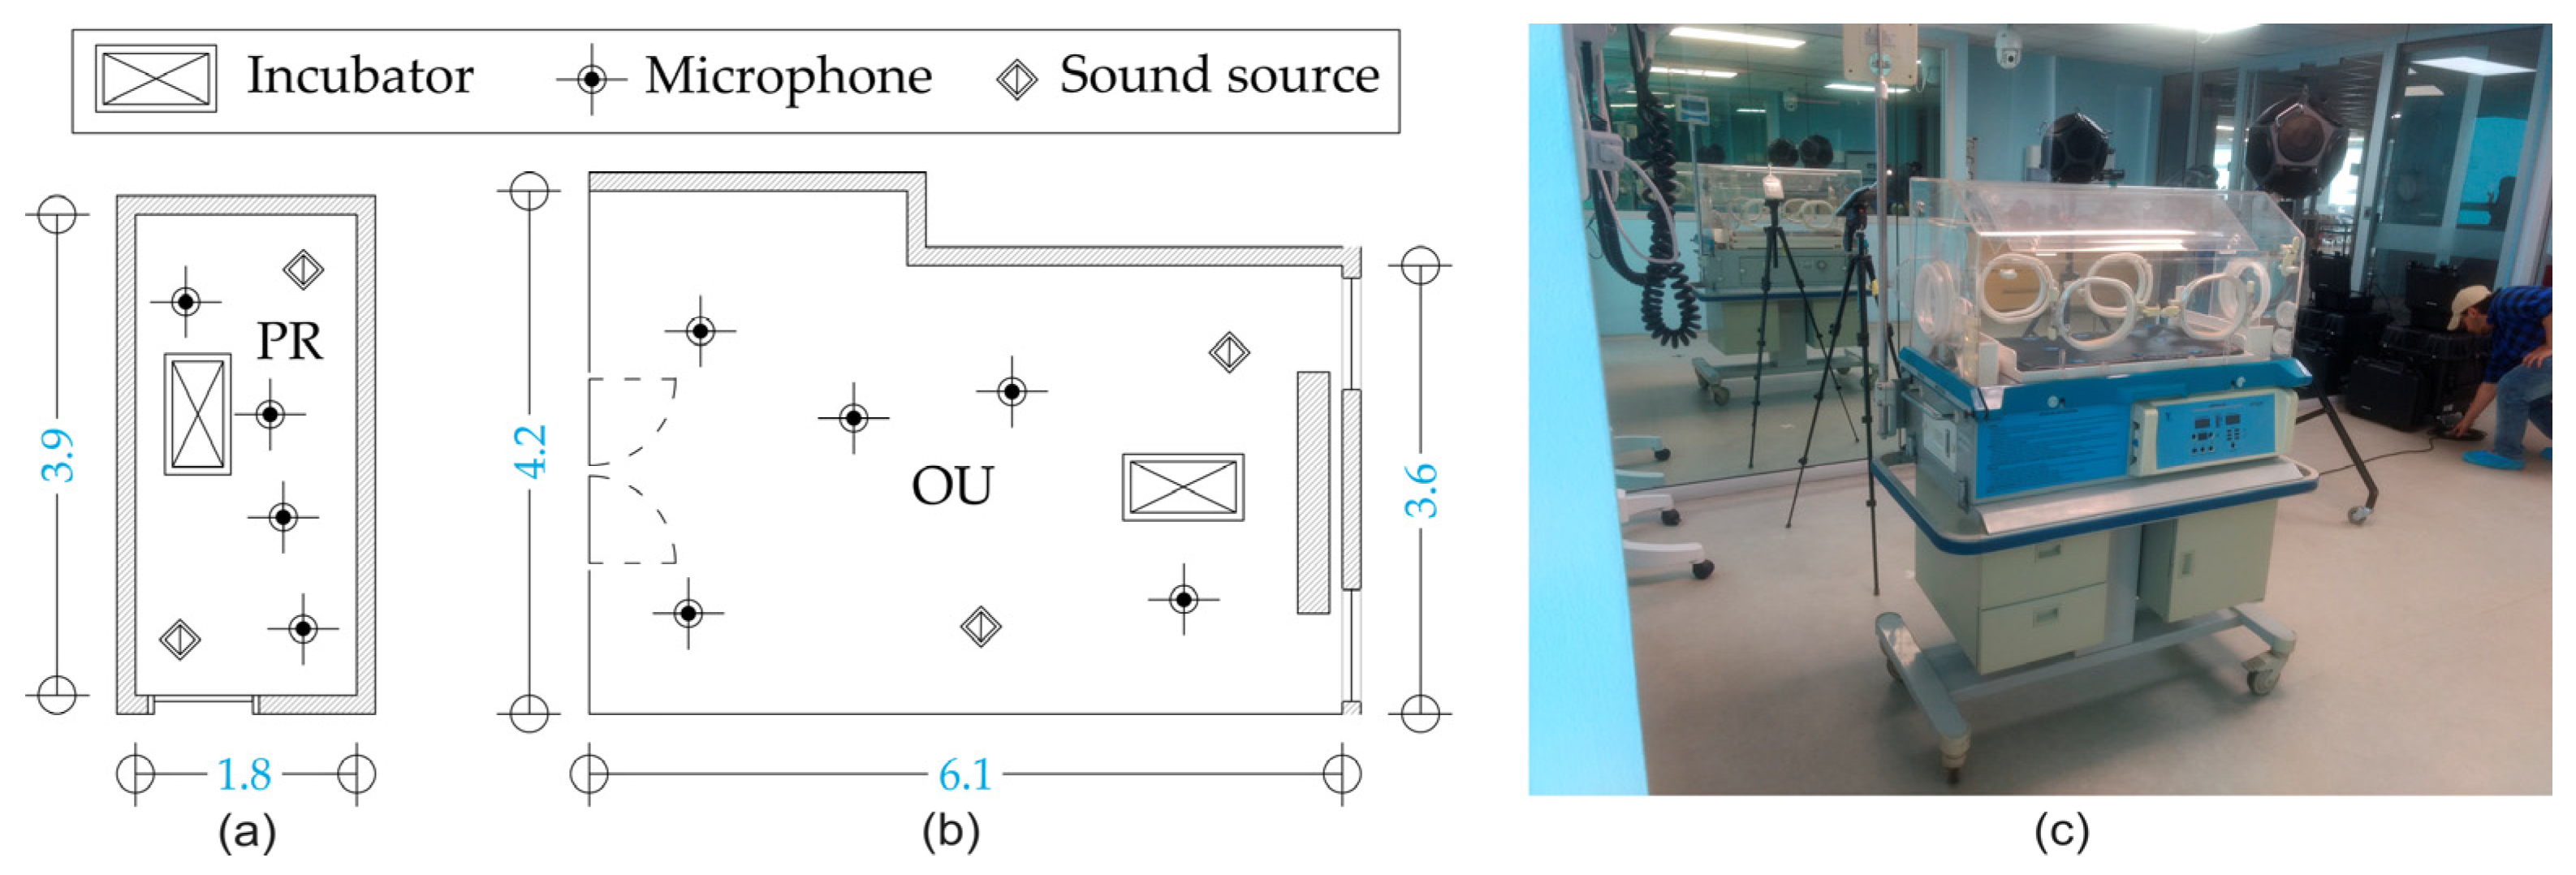
2.3. Rooms and Incubator Description

The OU (6.1 m × 3.9 m × 3.5 m) has plaster, concrete, and glass walls and a porcelain stoneware floor (Figure 1b). It is a space for medical students to do their practical work and mimics the characteristics of an open NICU room. However, although the floor and wall surfaces are highly reflective, the ceiling, like the rest of the classrooms at the Universidad de Las Americas, is acoustically absorptive to improve speech intelligibility so that the Ts are lower than if the room had the false plaster ceiling as most NICUs have. The second room, PR, is a controlled acoustic environment located in the Sound and Acoustic Engineering Department. Measuring 1.8 m × 3.9 m × 2.5 m, PR is designed with sound-absorbing walls and has a low average T (Figure 1b). This design allows accurate measurements of the sound characteristics of the incubator by minimizing reflections and ensuring that most of the sound energy is absorbed rather than reflected.
The selection of the rooms was made to avoid the entrance of high outdoor background noise. Measurements were conducted on weekends to avoid sounds from students’ or teachers’ conversations coming from corridors or other classrooms.
The incubator has three sets of parallel surfaces and a sloped top. The configuration and size of the incubator, along with the microphone positions, are depicted in Figure 2. The incubator dimensions are roughly 0.85 m × 0.41 m × 0.40 m.

2.4. Statistical Analysis

Parametric tests, although they are more powerful than non-parametric ones, should meet some assumptions. For example, they are based on the premise that the data adhere to a normal distribution, and they also require conditions such as equal variance among groups. In contrast, non-parametric tests do not depend on any predefined distribution, which makes them particularly useful for analyzing datasets with outliers or those derived from small samples. Parametric tests of differences between measurements must meet different assumptions, including that both samples are normally distributed and that they present homogeneity of variances. When the assumptions are not met, non-parametric tests are normally used.
For large samples (over 50), the Kolmogorov–Smirnov test is often used to check for normality [72]. Levenne’s test was used to evaluate the homogeneity of variances. In our study, this test indicates that the data did not follow a normal distribution, so non-parametric tests were chosen to provide a more robust analysis under these circumstances.
The Kruskal–Wallis test was applied to compare the T of the incubator located in each room (OU and PR), with the analysis performed for all one-third octave bands. This non-parametric, rank-based test [73] is used to determine if there are statistically significant differences among groups, though it does not reveal which specific groups differ. To identify which specific groups differ and examine statistically significant differences in the Ts measured within the incubator positioned in each room, or the existence of T differences between both NICUs, a repeated measures Mann–Whitney test was conducted as post-hoc analysis for every one-third octave band.
When the study involves the calculation of multiple pairwise comparisons, the risk of committing a type I error increases. A type I error happens when the null hypothesis is rejected, although it is actually true. In the present study, the Benjamini-Hochberg adjustment was used to control the expected proportion of false discoveries [74,75]. It is less conservative and has more power than the family-wise error rate methods FWER. The adjusted p-values were calculated with the function p.adjust of the R software, version 4.3.2.
The effect size is a widely used statistic that quantifies the magnitude of the difference between two groups, with larger values indicating a more substantial and practically significant difference [76]. This metric is essential for assessing not only the statistical but also the real-world impact of research findings, complementing traditional p-value-based significance tests [77]. By providing an estimate of the magnitude of observed effects, researchers can better understand the importance and applicability of their findings in practice.
Glass’s rank-biserial correlation (rc) was chosen as the preferred measure of effect size of the Mann–Whitney test results, due to its robustness and suitability for data that do not meet normality assumptions [78,79], which makes it highly versatile for analyzing a variety of data types. This measure is particularly advantageous when dealing with skewed data, as it does not require the assumption of equal variances between groups. Unlike many measures of effect size, Glass’s rank-biserial correlation is less influenced by outliers, meaning that extremely high or low values will not unduly skew the overall effect size estimate.
The rc metric is defined on a symmetrical scale that ranges from 1 to −1. A value of 1 indicates complete dominance by positive ranks, meaning that every observation in the first sample exceeds all the corresponding values in the second sample. In contrast, an rc value of −1 reflects the opposite scenario, where every data point in the second sample surpasses those in the first. This full range of values not only highlights the direction of the effect—whether the first or second sample holds higher values—but also provides insight into the magnitude of the difference. By capturing both the extent and direction of the disparity, this metric offers a clear and intuitive measure that is particularly useful in comparative studies. Such a scale allows researchers to quickly assess and interpret the underlying trends in their data, making it an invaluable tool in statistical analysis. The rank-biserial correlation is calculated by taking the ratio of the difference between the sum of positive ranks and the sum of negative ranks to the total number of ranks [80]. This clear range provides a simple way of measuring the magnitude of differences and gives researchers a valuable tool for interpreting the practical significance of their data. Overall, the ease of calculation, combined with its interpretability and flexibility, supports its growing popularity as a reliable tool for quantifying effect sizes in complex, real-world data. Rank-biserial effect size was calculated using the “effectsize” package [81] of the R software, version 4.3.2. The effect size was assessed using the interpret function in R and Cohen’s guidelines, which produces a numerical result paired with an effect size classification [81,82]. According to this criterion, the classifications are as follows: very small (0.1 < |rc|), small (0.1 ≤ |rc| < 0.3), moderate (0.3 ≤ |rc| < 0.5), and large (|rc| ≥ 0.5).
The American Statistical Association (ASA) issued a landmark statement on interpreting p-values, highlighting common misconceptions and inherent limitations in their use [83]. According to the ASA, a p-value merely indicates the degree of compatibility between the observed data and a specified statistical model; it does not quantify the probability that a hypothesis is true, nor does it measure the probability that the data occurred purely by chance. This perspective is important because p-values are often misinterpreted in research as a direct measure of the evidence supporting a hypothesis, when in fact they provide no information about the size of the effect or the likelihood that an alternative hypothesis is correct. The challenges in understanding and interpreting p-values had already been pointed out in numerous studies [84,85,86,87,88], with some critics emphasizing the common practice of applying a universal significance level (α = 0.05) regardless of study type or sample size.
In comparing traditional hypothesis testing methods with alternative inference-based approaches, such as Bayesian methods, the ASA suggests that p-values, when used in isolation, may lead to limited or even misleading conclusions about the data. Therefore, they recommend that p-values should be complemented by other inference methods that provide a more comprehensive view of the evidence. Bayesian methods are particularly noteworthy in this context, as they allow researchers to assess the likelihood of certain hypotheses by combining prior information (priors) with observed data. This results in posterior probability distributions that reflect the uncertainty around the model parameters.
Unlike traditional approaches that rely on a fixed significance threshold (e.g., α = 0.05) to decide whether to reject or accept the null hypothesis, Bayesian inference uses Bayes factors or posterior distributions to allow a direct comparison between the null and alternative hypotheses. The Bayes factor quantifies the relative evidence for one hypothesis over another, offering a more nuanced and continuous perspective than the binary “significant” versus “non-significant” criteria used with p-values. This approach enables researchers to develop a deeper understanding of the strength of evidence for each hypothesis, avoiding rigid binary decisions and acknowledging the subtle gradients of evidence that are essential in scientific decision-making.
The evidence categories for interpreting Bayes factors are typically as follows [86,87,89,90,91]: >100 = extreme evidence for H0; 30–100 = very strong evidence for H0; 10–30 = strong evidence for H0; 3–10 = moderate evidence for H0; 1–3 = anecdotal evidence for H0; 1 = no preference; 0.333–1 = anecdotal evidence for H1; 0.1–0.33 = moderate evidence for H1; 0.033–0.1 = strong evidence for H1; 0.01–0.033 = very strong evidence for H1; and <0.01 = extreme evidence for H1.
The acoustic measurements were made with the incubator openings closed and with the motor and other devices for newborn care off (air recirculation, alarm systems, etc.).

3. Results

The results will be presented in the following order to avoid misunderstandings. In Section 3.1, the Ts of the incubator are analyzed, located in both the open unit room and the private room, without the mattress inside. The same analysis is then performed, but with the mattress inside the incubator in Section 3.2. After this, Section 3.3 evaluates and compares the Ts of both rooms. For these three cases, the distribution of the Ts is first evaluated using a boxplot, which indicates the arrangement of the first, second (median), and third quartiles. Subsequently, the existence of statistically significant differences between the different pairs of cases analyzed through the Kruskal–Wallis methods is evaluated, and if so, it is sought in which frequency range these statistically significant differences appear by means of the Mann–Whitney U test, with the corresponding Benjamini-Hochberg adjustment of the p-values. To corroborate the outcomes, following the recommendations of the ASA, the results of the analyses based on the frequency of the data were compared with the inferential analyses. Section 3.4 analyzes the noise level differences between the incubator and each NICU (using the omnidirectional sound source, with microphones inside and outside the incubator).

3.1. T of Incubator Without Mattress in Open Unit and Private Room

Figure 3 shows the distribution of the T measurements when the incubator with a mattress is in the OU and in the PR. The interquartile range is generally larger in the OU than in the PR for all the frequencies, but for 200 Hz, which means that the data are more widespread. The medians are also larger in the OU than in the PR for all the frequencies evaluated. The highest median values can be found at 125 Hz, with approximately 2.90 s and 2.52 s at OU and PR, respectively. At 160 Hz, the T values are 1.54 s and 0.3, although the highest difference between median values happened at 200 Hz, 2.52 s, and 0.68 s in OU and PR, respectively. The selection of a nonparametric test to evaluate the differences is reinforced since there is a high number of outliers in both datasets (incubator without mattress in OU and in PR). At lower frequencies, in the OU, T values rise and fall as the frequency increases, with a progressive tendency toward reduction; from 500 to 5000 Hz, however (but for 1250 Hz), the T continuously decreases as the frequency increases. Similarly happens at the PR, with a decrease in the median from 200 Hz to 5000 Hz, and very small T values.
The average background noise was 37.53 dB(A) in the OU and 36.35 dB(A) in the PR.
Kolmogorov–Smirnov test showed that the data were not normally distributed for most of the sound frequencies of the study, evaluating the T in each room. Levenne’s test results show that there is no homogeneity of variances between the two groups. Consequently, non-parametric tests were chosen for the analysis. This happens in all the paired groups evaluated in the following subsections, so it will not be mentioned again. Kruskal–Wallis results show that there are statistically significant differences (p-value < 0.001) between the T of the incubator without a mattress when it is located in OU and PR at two or more frequencies (in the range from 100 Hz and 5000 Hz). To evaluate at which frequencies the T is different, the Mann–Whitney U test was conducted. The results of the Mann–Whitney U test are shown in Table 1. The differences at all the frequencies evaluated had a level of significance below 0.001. The size of the differences is small, for 100 Hz and 125 Hz, probably because the lower frequencies are less affected by the size of the room in which the incubator is located. However, the differences of the T are moderate (at 160 Hz) or large for all the other frequencies, which means that the different values of the T of the same incubator are affected by the type of NICU in which the incubator is located.
Table 2 shows the results of the inferential analysis for two independent samples, assuming unequal variances. The negative mean difference indicates that the mean values of T of the OU are higher than those of T. The Bayes factors are <0.001 for all the frequencies analyzed, but for 125 Hz, which indicates extreme evidence for the alternative hypothesis to be true, or in other words, that the T of the same incubator located in different NICUs is different.
The mean difference and the lower and upper bounds of the 95% credible interval are also negative, which also supports that the Ts of the OU are higher than those of the PR for all the frequencies evaluated. Consequently, the outcomes of the Bayes factor and their interpretations coincide with the ones obtained using frequentist statistics.

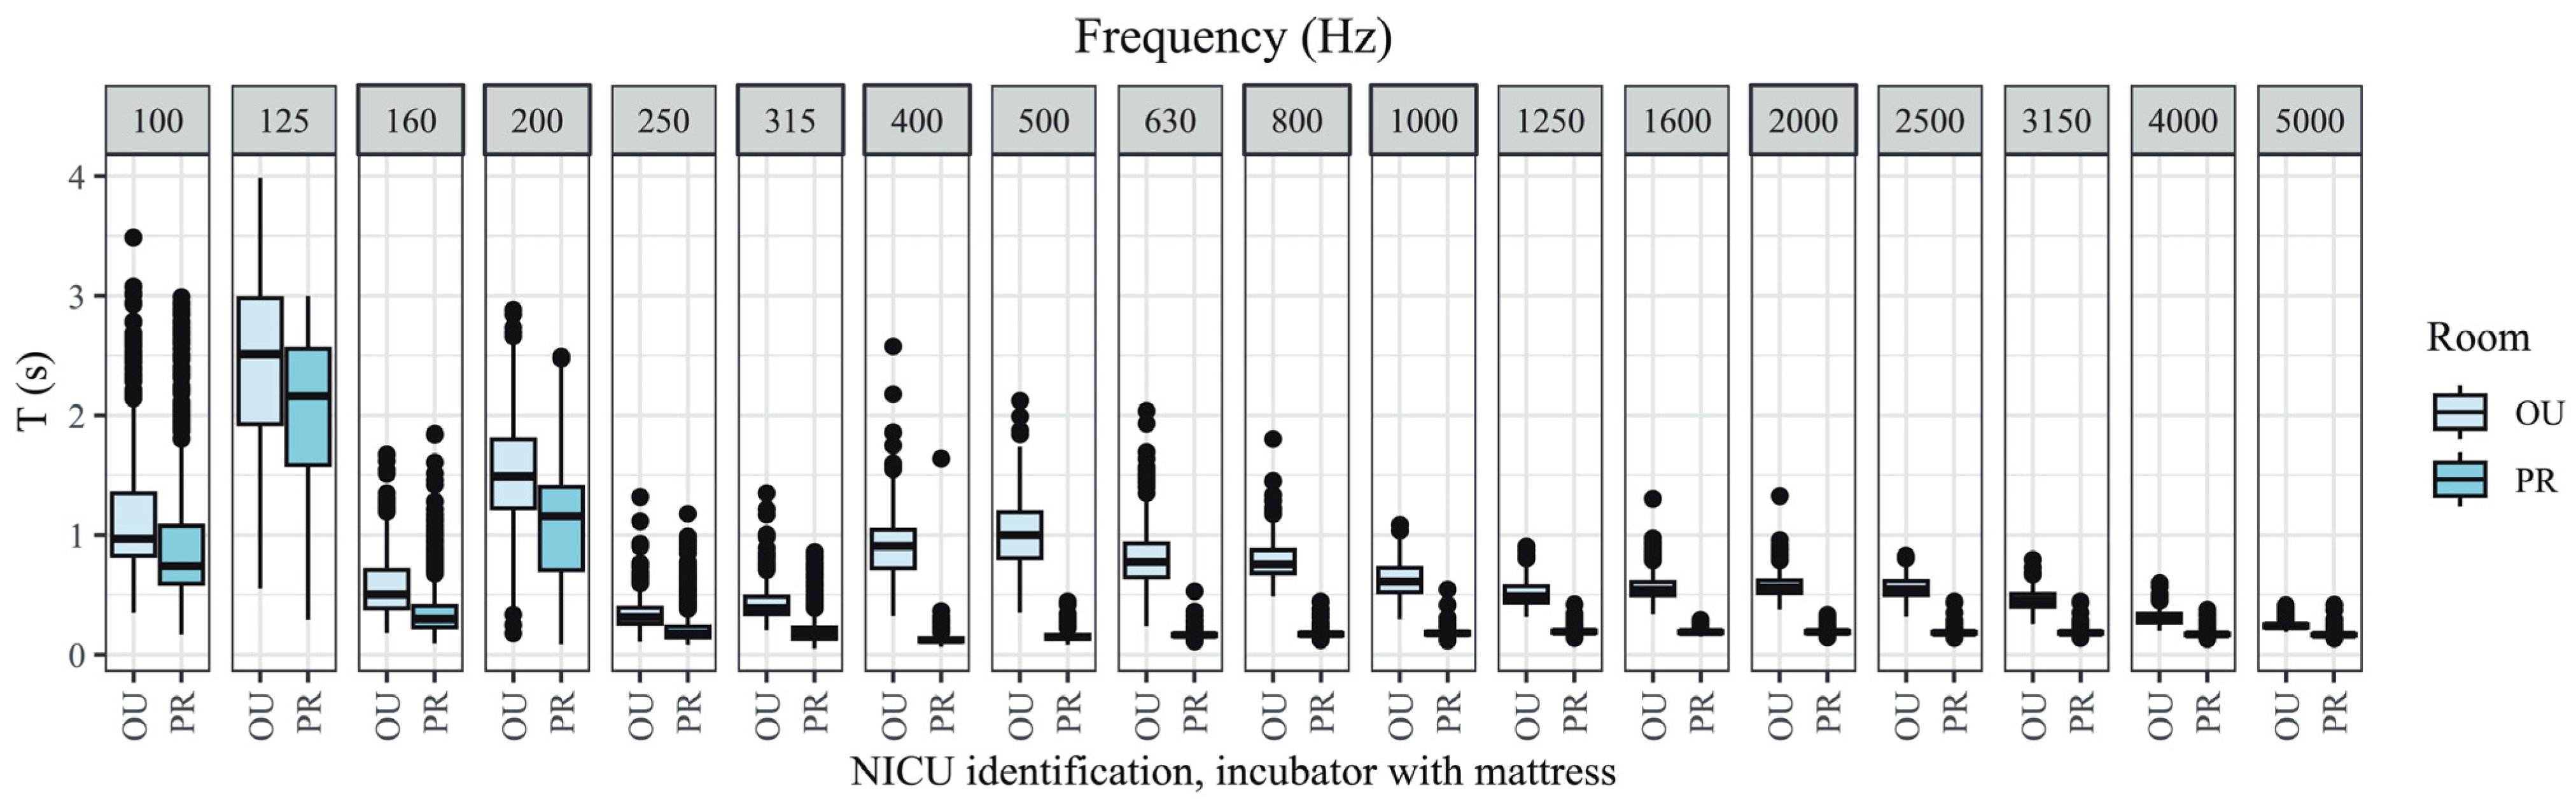
3.2. T of Incubator with Mattress in Open Unit and Private Room

The boxplot of the T measured inside the incubator with a mattress in both rooms is shown in Figure 4. The behavior of the T values along the frequency range evaluated was very similar. However, with the mattress, the T differences measured inside the incubator at the OU and PR are, in general, smaller than without it. For example, at 125 Hz, the differences between both rooms are 0.99 s at 125 Hz (3.29–2.30 s), 0.15 s at 160 Hz (0.51–0.36 s), and 1.22 s at 200 Hz (1.48–0.26 s). Although the T differences are smaller, both graphs show the same trend: irregularities in noise levels at the low frequencies, and a T decrease as the frequency increases.
The average background noise was 37.80 dB(A) in the OU and 36.28 dB(A) in the PR.
Similarly to what happens when the incubator has the mattress inside, the Kruskal–Wallis test showed statistically significant differences in the measures with a significance level of 0.001. With this premise, the Mann–Whitney U test was also conducted, showing statistically significant differences at all the frequencies analyzed. The differences are small at 100 Hz and 125 Hz, moderate at 160 Hz, 200 Hz, and 250 Hz, and large for all the other differences. Consequently, according to Cohen’s interpretation, the differences in the T values depend on which type of room the incubator is located in [82].
The results of the Mann–Whitney U test that assess the differences in the T inside the incubator (with mattress) when it is located in the OU and in the PR room are shown in Table 3. The differences at all the frequencies evaluated had a level of significance below 0.001
The Bayesian analysis outcomes (Table 4) support the ones of the Mann–Whitney U tests, with extreme evidence for the alternative hypothesis to be true for the whole frequency range assessed, corroborating that there exists a difference in the T measurements and that it depends on the NICU.

3.3. T of Open Unit and Private Room

According to the previous results, the incubator’s T values depend on the type of NICU it is located. Therefore, the differences in the T measured in both NICUs were evaluated. Figure 5 shows the T distribution within both types of simulated NICUs analyzed. The T averaged across the medians of the frequency bands analyzed in the OU study is 0.76 s, while that of the PR is 0.14 s. The greatest differences in median T values occur at 125 Hz, 200 Hz, and 250 Hz. In any case, the median T values are always higher in the OU than in the PR.
As with the analyses in the previous two subsections, the Kruskal–Wallis test indicated that there were statistically significant differences between at least two pairs of variables compared, and the Mann–Whitney test indicated that these differences occurred for all frequencies, although the level of significance was slightly lower for 3150 Hz and 5000 Hz (p-value = 0.01) than for the rest of the frequencies (Table 5). The differences between the T measured in OU and PR are large for all frequencies except for 3150 Hz and 4000 Hz, which are medium.
The results obtained by the frequentist analyses, but for 5000 Hz, are supported by the inference analyses, showing strong, very strong, or extreme evidence for the alternative hypothesis to be true (Table 6). At 5000 Hz, it is considered that the alternative hypothesis can be true. Since there is a discrepancy between both methods, the results of the Bayesian analysis were selected, since they are more unfavorable.

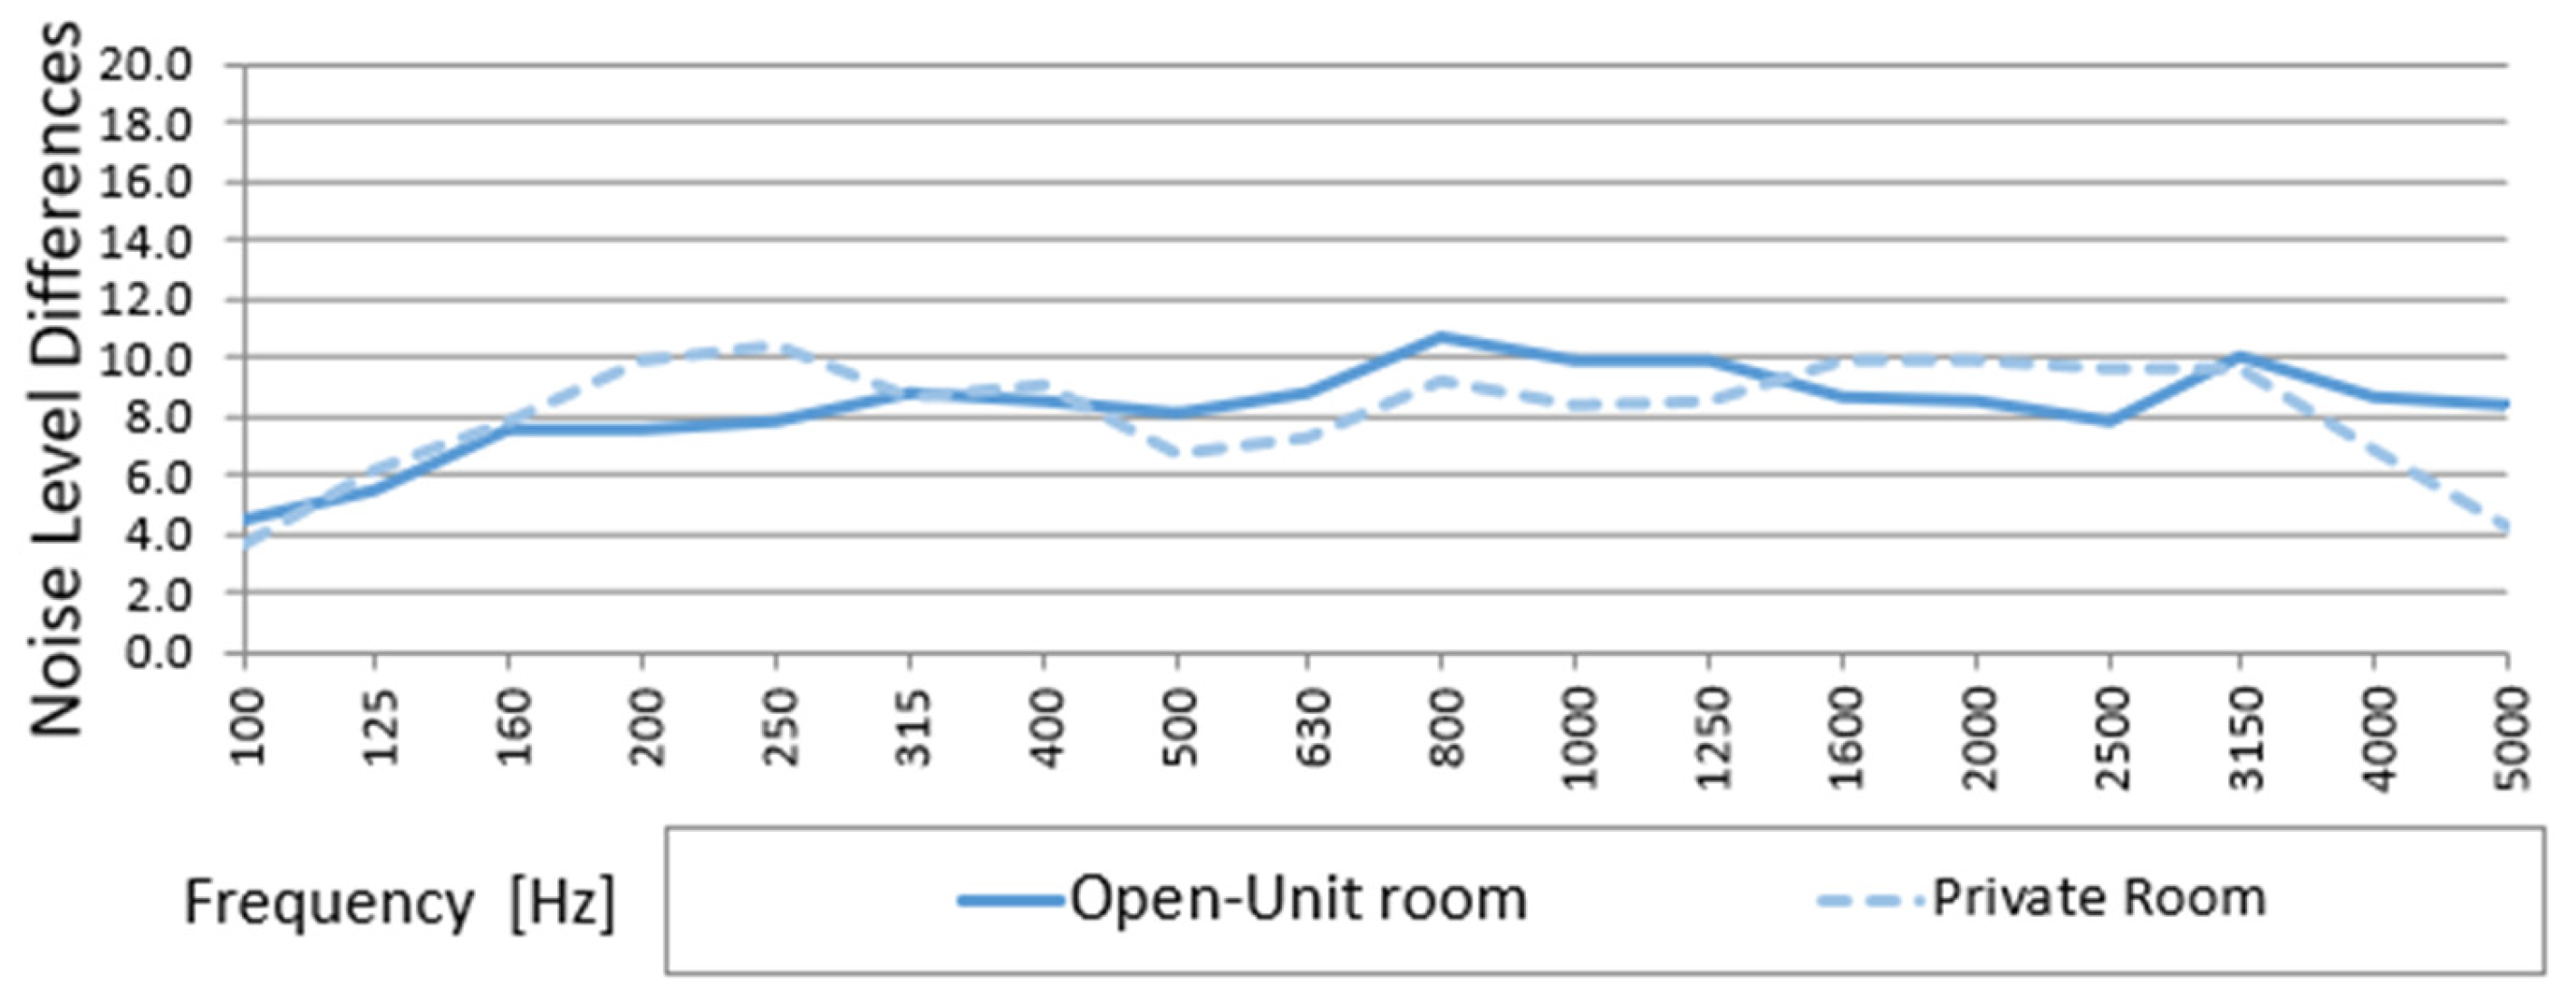
3.4. Noise Level Differences (D) Between Outside and Inside the Incubator in Open Unit and Private Room

The same settings were used in both rooms for the noise emission of the omnidirectional sound source and the SPL measurements inside the rooms and the incubator. Figure 6 shows the noise level differences (D) in dB of the measurements inside and outside the OU and the acoustic. It should represent the acoustic isolation of the incubator walls, and the values should be similar in both rooms. However, there are frequency intervals in which the noise differences are higher in the PR than in the OU room (for example, from 200 Hz until 250 Hz, or from 1600 Hz until 2500 Hz), and intervals in which the opposite happens (for example, from 500 Hz to 1250 Hz).

4. Discussion

The frequency-based analyses (Kruskal–Wallis and Mann–Whitney tests) and the inference-based analysis (Bayesian analysis) yield very similar results, highlighting the stability and reliability of the findings.
The Ts within the incubator are anomalously long [92]. In real-life NICU settings, several interrelated acoustic phenomena can significantly affect the sound environment inside neonatal incubators. These include acoustic coupling, flutter echo, resonant frequencies, and the poor sound insulation of the incubator dome. Together, these factors contribute to elevated SPLs, which can have serious implications for the health and neurodevelopment of premature newborns.

4.1. Acoustic Coupling and Poor Acoustic Insulation

It has been shown that the room’s Ts influences the incubator’s Ts. This aspect, which had been suggested in earlier studies, is particularly evident in the OU, where Ts are longer. This phenomenon may be due to the acoustic coupling between spaces, given the nature of the materials used in incubators and the joints between them.
Acoustically coupled spaces exhibit great complexity. These types of spaces are often a result of intentional acoustic manipulation, as it happens in auditoriums with coupled reverberation chambers, to reduce a live space or increase T [93]; in other occasions, they are a result of a wrong design, as sometimes occurs in the transepts or chapels of a church, increasing the T of the nave. Coupling implies that two or more spaces are acoustically connected, and the acoustic behavior of one can influence that of another.
This occurs, for example, in theater auditoriums located near an open corridor, which can be disturbed by reverberation from adjacent spaces. Therefore, no matter how well-designed the auditorium is, the acoustics will be poor because it will be disturbed by the adjacent reverberant room. This phenomenon occurs not only through airborne transmission but can also be due to transmission through elastic partitions with non-restrained boundaries [94]. For example, if a “dead” room is near a reverberant corridor, and a sound source and a microphone are located in the dead room when the sound source is turned on and subsequently interrupted, the sound drops fast, which is an effect that could be seen in the decay curve [95]. However, during the process of decay, the sound transmitted to the reverberant corridor returns to the room, and consequently, the end of the decay curve is similar to that of a common space where the T of the corridor dominates. If, instead, the sound source stays in the dead room and the microphone is located in the corridor, the slope drops rapidly at the start. Still, very fast, the incident waves on the reverberating walls give rise to a slow fall that closely resembles that of the corridor [95].
This process becomes even more complex when there is an elastic transmission with the partitions/elements separating both spaces and their boundaries are not constrained, which increases the complexity of the analysis [94], as it happens with the incubator walls.
If both spaces are highly reverberant, as occurs in the acoustic interaction between the NICU room and the incubator, the sound transmission is airborne and structural, and the sound persistence increases. Given the size of the incubator, its impact on the acoustics of the NICU room is less pronounced. However, similarities can be seen in the rises and falls of the T between both spaces when the room is very reverberant, as it happens in the OU (See Figure 7b). Furthermore, the acoustic isolation is so poor (10 dB maximum at several frequencies) that part of the incident energy goes through the incubator walls and returns to the room, contributing to the persistence of the SPL of the NICU.
The simulation room OU in our study is relatively small compared to the NICUs typically found in hospitals because it is a simulation space for teaching. It has an approximate volume of 67 m3, which assuming a generic absorption of the materials of 0.1, gives us a T of 1.05 s, slightly less than the measured (0.76 s), since the false ceiling, like the rest of the classrooms at the University of the Americas, has acoustic insulation to improve speech intelligibility that reduce the T. However, NICUs do not usually have acoustic insulating ceilings.
Other real-life NICUs evaluated by this research team, such as the one at Puerta del Mar University Hospital (Cádiz, Spain), have a volume of 415 m3 and a T estimated using the Sabine formula of 2.65 s; the Juan Ramón Jiménez University Hospital (Huelva, Spain) has a volume of 175 m3 and a reverberation time of 2.5 s [59]. Furthermore, they have adjacent spaces, such as the pharmacy, the laundry, or the clothing room, which are sometimes open and represent other coupling spaces. These volumes and estimated Ts are much longer than the 0.76 s measured in the NICU in our study, so it is likely that in a real-life NICU, this coupling effect would have a much greater effect on the Ts measured inside the incubators.

4.2. Flutter Echo

Flutter echo is a phenomenon characterized by successive reflections between parallel, highly reflective surfaces, which leads to the formation of distinct interference patterns within the sound field [96]. This effect is initiated by an impulsive acoustic event whose energy is repeatedly reflected between these surfaces, producing a series of short-duration sound pulses.
In elongated corridors with reflective walls and absorptive ceilings and floors, such behavior can be easily perceived [97]. In neonatal incubators, however, the scenario becomes particularly critical. The internal walls of these incubators are typically smooth, parallel, and highly reflective, which creates an ideal setting for the development of flutter echo. Measurements indicate that the average T within these incubators can exceed 2 s at 125 Hz. In such a confined space, reflections arriving within the first 50 milliseconds are usually integrated perceptually as a single event; nevertheless, the highly reflective surfaces promote additional reflections beyond 50 ms, giving rise to the flutter echo phenomenon [96,98].
These prolonged Ts cause an increase in sound energy that not only alters the temporal and spectral characteristics of sounds but also affects spatial perception. For example, when a reflection arrives at a higher SPL than the direct sound, it can cause a change in the perceived provenance of the sound source. Furthermore, the risk of flutter echo and other perceptual effects depends on the spectral and temporal properties of the signal. In fact, spoken words (an acoustic signal characterized by a wide frequency range and rapid temporal variations) or alarms are more likely to reveal the presence of flutter echo compared to sounds with slower temporal variations [99]. In fact, for medium-range frequencies corresponding to human speech or certain alarms, Ts are approximately 1 s, which are huge values for such small spaces.
Consequently, the acoustic environment within neonatal incubators, characterized by anomalously long Ts and a propensity for fluttering echo, can lead to a perceptual degradation of sound quality. This includes increased overall sound levels, altered timbre, impaired speech intelligibility, and possible misplacement of sound sources, all of which can create a particularly unpleasant listening experience in such sensitive environments [62].

4.3. Resonant Frequencies

On the other hand, there appears to be a peak in the reverberation time inside the incubator at 125 Hz, possibly due to resonant frequencies that arise when the propagation medium is excited, as suggested by Puyana-Romero et al. [56]. Since electronic devices in the United States operate at 120 V with a 60 Hz frequency, their harmonics can produce an uneven energy distribution in the 125 Hz one-third octave band [100].

4.4. Combined Effects and Possible Consequences on Neonatal Health

Figure 7c,d show the difference in the Ts between the two rooms, and how the T in the incubator is lower in the PR due to the low T of the room, showing a much more appropriate environment than the open-plan NICUs, especially considering than in typical hospitals, as mentioned in Section 4.1, the T is much higher than in our study.
For this reason, as can be seen in Figure 6 and Figure 7a, the persistence of sound, considering the median values, is greater inside the incubator than in the room, and greater in the OU, suggesting the combination of the previous effects may be happening in the interaction between the NICU and the incubator.
The combination of the mentioned effects, which cause noise persistence, high SPLs, and poor acoustic quality inside incubators, may lead to a wide range of short- and long-term consequences for neonates’ health. In the short term, preterm infants require prolonged periods of quiet sleep for brain development, and noise can disrupt their sleep. Sudden or loud sounds activate the stress response, increasing the heart rate and oxygen desaturation, which can affect cardiovascular and respiratory stability. Stress caused by noise may also lead to metabolic disorders, delaying weight gain in neonates [30]. In the long term, excessive noise during critical periods of auditory development can lead to further difficulties in speech and language acquisition. Furthermore, it can cause cognitive and behavioral issues, since chronic overstimulation may impair neural plasticity, affecting memory, attention, and emotional regulation in later childhood. Furthermore, early exposure to a stressful acoustic environment may sensitize infants to stress, contributing to anxiety-related disorders [10,27,28]. Since reverberation can amplify noise levels, increasing stress noise levels in incubators, studies have suggested that reducing T through appropriate architectural materials and spatial design can significantly improve acoustic comfort, creating a calmer and more healing-focused environment [52,56,68,100].

4.5. Neuroscience and NICU Design

The type of materials used in the construction of NICU spaces have a strong influence on how sound behaves within them, particularly regarding T. When comparing open-concept NICU in our study with PR, the acoustic characteristics of the mate-rials involved can explain why sound tends to decay more quickly in private settings, especially within the incubator, which is the more sensitive area.
OU relies on hard, reflective materials such as concrete and glass walls, tiled floors, and smooth ceilings. While these materials are practical for cleaning and maintenance, they are not effective at absorbing sound. Instead, they tend to reflect sound waves, which prolongs the presence of noise. The reflective properties of these materials produce an environment that is more susceptible to flutter echoes and an acoustically artificial environment. Glass, in particular, reflects a large percentage of sound energy at high frequencies [101], contributing to an increase in the reverberant noise, and has a very poor acoustic insulation at low frequencies.
PR, on the other hand, has an acoustic insulation treatment in the walls and ceiling, and carpeted flooring. These features help reduce sound reflections by allowing much of the energy to be absorbed, leading to a calmer and more acoustically stable environment. Because of this, reverberation time is shorter in both the incubator and the room.
When an incubator is placed in a private, acoustically treated room, the surrounding materials help reduce the amount of environmental noise entering the space and the time it takes for it to fade. The incubator itself does not change, but the behavior of sound within the dome does. Fewer reflections and greater absorption create a quieter zone around the baby. In contrast, open NICU spaces allow sound to reflect freely on surfaces such as glass, tile, or metal. This not only increases background noise levels but also requires staff to speak louder to hear each other, which can disrupt newborns’ sleep cycles and vital functions. These acoustic conditions can create an overly stimulating and potentially disruptive environment for newborns.
Neuroscience has demonstrated that the physical environment significantly influences human behavior, emotions, and cognition [102]. This premise is particularly crucial in the design of Neonatal Intensive Care Units (NICUs), where patients are especially vulnerable to sensory stimuli due to their ongoing neurological development [103]. Kahneman [104] introduced the concepts of System I and System II to describe human behavioral processes. System I is fast, automatic, and intuitive, while System II is slow, deliberate, and analytical. Although these systems primarily refer to adult cognition, understanding these dynamics can inform the design of spaces that influence both automatic and conscious responses, even in neonatal settings. According to de Haan et al. [105], while these systems were initially applied to adults, early developmental neuroscience suggests that similar processes may occur in neonates as they respond instinctively to their environments and begin to develop more deliberate cognitive functions.
In NICUs, architectural design must consider how sensory stimuli affect neonates and their families. For example, lighting that mimics natural circadian rhythms can regulate sleep and wake cycles, promoting proper neurological development in neonates [106]. Noise reduction through sound-absorbing materials and controlled alarm systems minimizes overstimulation of System I, which could trigger automatic stress responses in infants [31]. In this context, T—a critical acoustic factor—must be carefully managed.
Additionally, incorporating natural elements and designing spaces that allow for privacy and family bonding can activate System II, fostering relaxation and emotional connection [107]. These conscious architectural design strategies not only enhance patient well-being but also facilitate active family participation in the caregiving process.
By applying acoustic principles to NICU design, environments can be created that support both automatic and deliberate responses in all users of the space. This leads to more holistic and effective care, promoting better health outcomes and a more positive experience for the neonates and their families.

4.6. Sustainable Development Goals and NICU Design

The design of Neonatal Intensive Care Units (NICUs) plays a crucial role in promoting sustainable development by aligning with the United Nations’ Sustainable Development Goals (SDGs) [108]. Specifically, SDG 3 (Good Health and Well-being) and SDG 11 (Sustainable Cities and Communities) are directly impacted by strategies aimed at optimizing the neonatal environment, including the reduction of T in incubators and the implementation of PRs over OUs designs.
Neuroscience has demonstrated that the physical environment significantly influences human behavior, emotions, and cognition [106]. This is particularly relevant in NICUs, where neonates are highly vulnerable to sensory stimuli due to their ongoing neurological development [109]. Studies indicate that reducing T through sound-absorbing materials and appropriate spatial design can create a more acoustically comfortable and healing-focused environment [110,111]. By lowering physiological stress and promoting stable sleep–wake cycles, these interventions directly contribute to SDG 3 by improving neonatal health outcomes.
Furthermore, the implementation of PRs instead of OUs rooms enhances both neonatal and family well-being. PRs allow for greater control of sensory stimuli, reducing stress levels in both infants and caregivers [112]. They facilitate stronger parent–infant bonding, which is crucial for neurodevelopment and emotional regulation. This aligns with SDG 3 by ensuring healthier developmental trajectories for neonates while also supporting parents’ mental health and participation in caregiving. Moreover, PRs promote a more inclusive and equitable healthcare environment, aligning with SDG 10 (Reduced Inequalities) by allowing for individualized care tailored to the specific needs of each infant and family.
Additionally, SDG 11 emphasizes the need for sustainable and inclusive infrastructure. NICUs designed with sound-absorbing materials and PR configurations contribute to sustainable urban planning by optimizing energy efficiency, reducing noise pollution, and creating environments that prioritize human health [113]. The use of sustainable building materials and evidence-based architectural designs further supports environmental responsibility, demonstrating that healthcare facilities can be both high-performing and ecologically responsible.
The concept of architecture designed for the senses plays a fundamental role in NICU design. Spaces should be structured not only for functional efficiency but also for sensory well-being, integrating elements such as natural lighting, controlled acoustics, and biophilic design to enhance relaxation and healing [114]. By engaging multiple sensory modalities, architecture can create an immersive healing environment that minimizes stress responses and fosters cognitive and emotional development in neonates [115]. These conscious architectural interventions not only enhance neonatal health but also contribute to the broader sustainability agenda, reinforcing the interconnection between health, well-being, and responsible building development.

4.7. Limitations of the Study

The T measurements were not conducted in real NICUs, because the noise levels generated during the measurements could harm the health of newborns. In addition, since it is carried out in classrooms, the ceilings are acoustic absorbers, a characteristic that hospital NICUs do not usually have. This could limit the study findings. However, the aim of the research was not to indicate that all NICUs, or incubators, will have a similar T to the ones obtained in our study, but rather to demonstrate that the reverberation time of a NICU affects the reverberation time inside the incubator.
Accordingly, measures were implemented to avoid errors in reverberation time measurements (both in the selection of rooms and in the performance of reverberation time measurements). Rooms with similar materials to those in the OU and the PR were selected, but with more restrictive conditions. As noted in the Discussion section, the T of the OU is 0.76 s. The T of the PR is below 0.15 s. These are very low T compared to real NICU settings (see Section 4.2). The rooms and the measurement periods were chosen to have a low background noise (below 40 dB(A)), allowing for accurate measurements of T30 (instead of having to calculate T20 or T10, as in rooms with medium-high background noise).
Consequently, measurements were taken in acoustically controlled settings with minimal external noise and low Ts, aiming to ensure that the results were primarily influenced by the room’s geometry and construction materials. Therefore, since the reverberation time of simulated OU and PR has been shown to influence the T inside the incubator, this effect is likely to be more pronounced in most real NICUs, which are expected to have higher Ts.

5. Conclusions

This study evaluates the effects of T on the sound persistence inside the same incubator located in two different NICUs: an open-plan NICU and a private room. Understanding how acoustic conditions in these environments impact neonatal care is crucial, as reducing sound persistence can influence the well-being and development of neonates.
The findings suggest that T varies significantly between the two NICU environments. In fact, the T inside the incubator is higher when it is inside the OU room than in the PR. When comparing the T of each NICU, it is higher in the OU than in the PR. In both types of rooms, the presence of a mattress inside the incubator was found to reduce the T, particularly at frequencies where reverberation tends to be higher, such as 125 Hz.
Different acoustic phenomena, such as the acoustic coupling or the flatter echo between the incubator and the surrounding space, driven by the materials and construction of the incubator, may be increasing the Ts.
Private rooms have been shown to be more suitable for neonate care compared to open-plan NICUs. These rooms not only provide a quieter, less stressful environment by reducing reverberation, but they also support stronger emotional bonds between neonates and their families, fostering privacy and intimacy that help nurture the parent–child relationship. By accommodating both the acoustic needs of neonates and the emotional well-being of families, private rooms contribute to better health outcomes and enhance the overall NICU experience for both patients and caregivers.
The study’s findings underscore the importance of designing private NICU environments with controlled acoustic properties (low T and SPLs) to promote neonatal well-being. For incubator designers, it is recommended to integrate highly absorbent materials and acoustic diffusers that reduce reverberation time and minimize the effect of resonant frequencies. Furthermore, parallel surfaces in the dome should be avoided to prevent flutter echo and resonant frequencies, together with concave shapes that cause noise focusing. Efforts to develop quieter incubators and oxygen distribution systems are essential to align technological innovation with creating a relaxing environment for neonates. Similarly, NICU designers and hospital planners should adequately isolate the NICUs from outside noise and position them away from noise sources to avoid that outdoor conditions increase the inner background noise. The use of sound-absorbing panels suitable for hospital settings on walls and ceilings is also recommended to promote a more natural and less intrusive acoustic environment. Furthermore, constructing a dedicated room for a central alarm system, thus distancing alarm noise from incubators, can further mitigate the effects of an excessively noisy acoustic environment on newborns. These specific recommendations seek to harmonize the operational requirements of high-tech neonatal care with the need for a quiet, acoustically optimized environment, creating healing environments that balance neonatal care and environmental responsibility.

Author Contributions

Conceptualization, V.P.-R., D.N.-S., R.H.-M. and G.C.; methodology, V.P.-R., D.N.-S., R.H.-M., F.F.-Z. and G.C.; software, V.P.-R., D.N.-S., R.H.-M. and G.C.; validation, V.P.-R., D.N.-S. and G.C.; formal analysis, V.P.-R., D.N.-S. and G.C.; investigation, V.P.-R., D.N.-S. and G.C.; resources, V.P.-R. and D.N.-S.; data curation, V.P.-R. and D.N.-S.; writing—original draft preparation, V.P.-R., D.N.-S. and G.C.; writing—review and editing, V.P.-R., D.N.-S. and G.C.; visualization, V.P.-R., D.N.-S. and G.C.; supervision, V.P.-R., D.N.-S., F.F.-Z., R.H.-M., J.L.B.-J. and G.C.; project administration, V.P.-R.; funding acquisition, V.P.-R. All authors have read and agreed to the published version of the manuscript.

Funding

This research was funded by the Universidad de Las Américas (UDLA) and was developed under the research project with reference SOA.VPR.22.01 (XI Call for research projects of the UDLA).

Data Availability Statement

The original contributions presented in the study are included in the article. Further inquiries can be addressed to the corresponding author.

Acknowledgments

We are grateful to the Medical Simulation Centre of the Universidad de Las Americas for allowing us to conduct the study at their facilities, especially considering the high noise levels associated with the acoustic measurements.

Conflicts of Interest

Author D.N.-S. was employed by the company Rockwool. The remaining authors declare that the research was conducted in the absence of any commercial or financial relationships that could be construed as a potential conflict of interest.

References

  1. McCallig, M.; Pakrashi, V.; Durkin, C. Evaluation of noise levels and noise sources in an Irish neonatal intensive care unit. Ann. Work. Expo. Health 2024, 68, 550–555. [Google Scholar] [CrossRef] [PubMed]
  2. Smith, S.W.; Ortmann, A.J.; Clark, W.W. Noise in the Neonatal Intensive Care Unit: A New Approach to Examining Acoustic Events. Noise Health 2018, 20, 121–130. [Google Scholar] [PubMed]
  3. Garinis, A.C.; Liao, S.; Cross, C.P.; Galati, J.; Middaugh, J.L.; Mace, J.C.; Wood, A.-M.; McEvoy, L.; Moneta, L.; Lubianski, T.; et al. Effect of gentamicin and levels of ambient sound on hearing screening outcomes in the neonatal intensive care unit: A pilot study. Int. J. Pediatr. Otorhinolaryngol. 2017, 97, 42–50. [Google Scholar] [CrossRef] [PubMed]
  4. Shimizu, A.; Matsuo, H. Sound Environments Surrounding Preterm Infants Within an Occupied Closed Incubator. J. Pediatr. Nurs. 2016, 31, e149–e154. [Google Scholar] [CrossRef]
  5. Restin, T.; Gaspar, M.; Bassler, D.; Kurtcuoglu, V.; Scholkmann, F.; Haslbeck, F.B. Newborn Incubators Do Not Protect from High Noise Levels in the Neonatal Intensive Care Unit and Are Relevant Noise Sources by Themselves. Children 2021, 8, 704. [Google Scholar] [CrossRef]
  6. Santos, J.; Carvalhais, C.; Xavier, A.; Silva, M.V. Assessment and characterization of sound pressure levels in Portuguese neonatal intensive care units. Arch. Environ. Occup. Health 2018, 73, 121–127. [Google Scholar] [CrossRef]
  7. Fernández-Zacarías, F.; Puyana-Romero, V.; Hernández-Molina, R. The Importance of Noise Attenuation Levels in Neonatal Incubators. Acoustics 2022, 4, 821–833. [Google Scholar] [CrossRef]
  8. Mayhew, K.J.; Lawrence, S.L.; Squires, J.E.; Harrison, D. Elevated Sound Levels in the Neonatal Intensive Care Unit: What Is Causing the Problem? Adv. Neonatal Care 2022, 22, E207–E216. [Google Scholar] [CrossRef]
  9. Vohr, B.R. Screening the Newborn for Hearing Loss; UpToDate: Waltham, MA, USA, 2020. [Google Scholar]
  10. Sibrecht, G.; Wróblewska-Seniuk, K.; Bruschettini, M. Noise or sound management in the neonatal intensive care unit for preterm or very low birth weight infants. Cochrane Database Syst. Rev. 2024, 2024, CD010333. [Google Scholar]
  11. Cardoso, S.M.S.; Kozlowski, L.d.C.; de Lacerda, A.B.M.; Marques, J.M.; Ribas, A. Newborn physiological responses to noise in the neonatal unit. Braz. J. Otorhinolaryngol. 2015, 81, 583–588. [Google Scholar] [CrossRef]
  12. Kuhn, P.; Zores, C.; Pebayle, T.; Hoeft, A.; Langlet, C.; Escande, B.; Astruc, D.; Dufour, A. Infants born very preterm react to variations of the acoustic environment in their incubator from a minimum signal-to-noise ratio threshold of 5 to 10 dBA. Pediatr. Res. 2012, 71, 386–392. [Google Scholar] [CrossRef] [PubMed]
  13. Wharrad, H.J.; Davis, A.C. Behavioural and Autonomic Responses to Sound in Pre-Term and Full-Term Babies. Br. J. Audiol. 1997, 31, 315–329. [Google Scholar] [CrossRef] [PubMed]
  14. Vranekovic, G.; Hock, E.; Isaac, P.; Cordero, L. Heart rate variability and cardiac response to an auditory stimulus. Biol. Neonate 1974, 24, 66–73. [Google Scholar] [CrossRef] [PubMed]
  15. Stanley, N.; Graven, M. Sound and the Developing Infant in the NICU: Conclusions and Recommendations for Care. J. Perinatol. 2000, 20, 88–93. [Google Scholar]
  16. Lahav, A.; Skoe, E. An acoustic gap between the NICU and womb: A potential risk for compromised neuroplasticity of the auditory system in preterm infants. Front. Neurosci. 2014, 8, 381. [Google Scholar] [CrossRef]
  17. Lejeune, F.; Parra, J.; Berne-audéoud, F.; Marcus, L.; Barisnikov, K.; Gentaz, E.; Debillon, T. Sound Interferes with the Early Tactile Manual Abilities of Preterm Infants. Sci. Rep. 2016, 6, 23329. [Google Scholar] [CrossRef]
  18. Lai, T.T.; Bearer, C.F. Iatrogenic Environmental Hazards in the Neonatal Intensive Care Unit. Clin. Perinatol. 2008, 35, 163–181. [Google Scholar] [CrossRef]
  19. Long, J.G.; Lucey, J.F.; Philip, A.G.S. Noise and Hypoxemia in the Intensive Care Nursery. Pediatrics 1980, 65, 143–145. [Google Scholar] [CrossRef]
  20. Wachman, E.M.; Lahav, A. The effects of noise on preterm infants in the NICU. Arch. Dis. Child.-Fetal Neonatal Ed. 2011, 96, F305–F309. [Google Scholar] [CrossRef]
  21. Williams, A.L.; Sanderson, M.; Lai, D.; Selwyn, B.J.; Lasky, R. Intensive Care Noise and Mean Arterial Blood Pressure in Extremely Low-Birth-Weight Neonates. Am. J. Perinatol. 2008, 26, 323–329. [Google Scholar] [CrossRef]
  22. Peng, N.-H.; Bachman, J.; Jenkins, R.; Chen, C.H.; Chang, Y.C.; Chang, Y.S.; Wang, T.M. Relationships Between Environmental Stressors Stress Biobehavioral Responses of Preterm Infants in NICU. Adv. Neonatal Care 2013, 13, 2–10. [Google Scholar] [CrossRef] [PubMed]
  23. Beira Jiménez, J.L. Afección Acústica de Pacientes en Incubadoras. Caso de Estudio: Neonatos Prematuros en el Hospital Universitario Puerta del Mar de Cádiz; Universidad de Cádiz: Cádiz, Spain, 2021. [Google Scholar]
  24. Aaron, J.N.; Carlisle, C.C.; Carskadon, M.A.; Meyer, J.; Hill, N.S.; Millman, R.P. Environmental noise as a cause of sleep disruption in an intermediate respiratory care unit. Sleep 1996, 19, 707–710. [Google Scholar] [CrossRef] [PubMed]
  25. Balk, S.J.; Bochner, R.E.; Ramdhanie, M.A.; Reilly, B.K. Preventing Excessive Noise Exposure in Infants, Children, and Adolescents. Pediatrics 2023, 152, e2023063752. [Google Scholar] [CrossRef] [PubMed]
  26. Muñoz Illescas, M.L.; Sevilla Salgado, S.; Pérez Lafuente, E. Tecnología y mínima manipulación en prematuros. Enfermería Integr. Col. Enfermería Val. 2017, 116, 41–45. [Google Scholar]
  27. Guerra Rodríguez, A.E. Alteraciones del Sueño en los Pacientes Pediátricos Hospitalizado; Universidad Autónoma de Nuevo León: San Nicolás de los Garza, Mexico, 2023. [Google Scholar]
  28. Singh, K.; Parashar, K.; Srishti, K. The Long-Term Impact of Neonatal Intensive Care Unit (Nicu) Environments on Infant Development: A Comprehensive Review with Gap Analysis. Int. J. Curr. Sci. 2024, 14, 613–619. [Google Scholar]
  29. Valdés-de la Torre, G.E.; Martina Luna, M.; Braverman Bronstein, A.; Iglesias Leboreiro, J.; Bernárdez Zapata, I. Medición comparativa de la intensidad de ruido dentro y fuera de incubadoras cerradas. Perinatol. Reprod. Humana 2018, 32, 65–69. [Google Scholar] [CrossRef]
  30. American Academy of Pediatrics. Committee on Environmental Health. Noise: A Hazard for the Fetus and Newborn. Pediatrics 1997, 100, 724–727. [Google Scholar] [CrossRef]
  31. Busch-Vishniac, I.J.; West, J.E.; Barnhill, C.; Hunter, T.; Orellana, D.; Chivukula, R. Noise levels in Johns Hopkins Hospital. J. Acoust. Soc. Am. 2005, 118, 3629–3645. [Google Scholar] [CrossRef]
  32. Fortes-Garrido, J.C.; Velez-Pereira, A.M.; Gázquez, M.; Hidalgo-Hidalgo, M.; Bolívar, J.P. The characterization of noise levels in a neonatal intensive care unit and the implications for noise management. J. Environ. Health Sci. Eng. 2014, 12, 104. [Google Scholar] [CrossRef]
  33. Hassanein, S.M.A.; El Raggal, N.M.; Shalaby, A.A. Neonatal nursery noise: Practice-based learning and improvement. J. Matern. Neonatal Med. 2013, 26, 392–395. [Google Scholar] [CrossRef]
  34. Benini, F.; Magnavita, V.; Lago, P.; Arslan, E.; Pisan, P. Evaluation of noise in the neonatal intensive care unit. Am. J. Perinatol. 1996, 13, 37–41. [Google Scholar] [CrossRef] [PubMed]
  35. Givrad, S.; Hartzel, G.; Scala, M. Promoting infant mental health in the neonatal intensive care unit (NICU): A review of nurturing factors and interventions for NICU infant-parent relationships. Early Hum Dev. 2021, 154, 1–10. [Google Scholar] [CrossRef] [PubMed]
  36. Webb, A.R.; Heller, H.T.; Benson, C.B.; Lahav, A. Mother’s voice and heartbeat sounds elicit auditory plasticity in the human brain before full gestation. Proc. Natl. Acad. Sci. USA 2015, 112, 3152–3157. [Google Scholar] [CrossRef] [PubMed]
  37. Yetkin, A.K.; Gunes, B.; Erbas, O. Prenatal Auditory Stimulation and Its Significance for Newborns. J. Exp. Basic. Med. Sci. 2023, 4, 96–103. [Google Scholar]
  38. Plante-Hébert, J.; Boucher, V.J.; Jemel, B. The processing of intimately familiar and unfamiliar voices: Specific neural responses of speaker recognition and identification. PLoS ONE 2021, 16, e0250214. [Google Scholar] [CrossRef]
  39. Balsan, M.J.; Burns, J.; Kimock, F.; Hirsch, E.; Unger, A.; Telesco, R.; Bloch-Salisbury, E. A pilot study to assess the safety, efficacy and ease of use of a novel hearing protection device for hospitalized neonates. Early Hum. Dev. 2021, 156, 105365. [Google Scholar] [CrossRef]
  40. Pineda, R.G.; Stransky, K.E.; Rogers, C.; Duncan, M.H.; Smith, G.C.; Neil, J.; Inder, T. The Single Patient Room in the NICU: Maternal and Family Effects. J. Perinatol. 2012, 32, 545–551. [Google Scholar] [CrossRef]
  41. Szymczak, S.E.; Shellhaas, R.A. Impact of NICU design on environmental noise. J. Neonatal Nurs. 2014, 20, 77–81. [Google Scholar] [CrossRef]
  42. Carvalhais, C.; Santos, J.; Vieira, M.; Xavier, A. Is There Sufficient Training of Health Care Staff on Noise Reduction in Neonatal Intensive Care Units? a Pilot Study From Neonoise. J. Toxicol. Environ. Health Part A Curr. Issues 2015, 78, 897–903. [Google Scholar] [CrossRef]
  43. Liu, W.F. The impact of a noise reduction quality improvement project upon sound levels in the open-unit-design neonatal intensive care unit. J. Perinatol. 2010, 30, 489–496. [Google Scholar] [CrossRef]
  44. Wang, D.; Aubertin, C.; Barrowman, N.; Moreau, K.; Dunn, S.; Harrold, J. Reduction of noise in the neonatal intensive care unit using sound-activated noise meters. Arch. Dis. Child. Fetal Neonatal Ed. 2014, 99, 515–516. [Google Scholar] [CrossRef] [PubMed]
  45. Fusch, G.; Mohamed, S.; Bakry, A.; Li, E.W.; Dutta, S.; El Helou, S.; Fusch, C. Analysis of noise levels in the neonatal intensive care unit: The impact of clinical microsystems. Eur. J. Pediatr. 2024, 183, 1245–1254. [Google Scholar] [CrossRef] [PubMed]
  46. Fucile, S.; Patterson, C.; Dow, K. Noise reduction in the neonatal intensive care unit: An exploratory study. J. Neonatal Nurs. 2023, 29, 330–333. [Google Scholar] [CrossRef]
  47. Coston, A.D.; Aune, C. Reducing Noise in the Neonatal Intensive Care Unit. Pediatrics 2019, 144, 154. [Google Scholar] [CrossRef]
  48. Bergman, I.; Hirsch, R.P.; Fria, T.J.; Shapiro, S.M.; Holzman, I.; Painter, M.J. Cause of hearing loss in the high-risk premature infant. J. Pediatr. 1985, 106, 95–101. [Google Scholar] [CrossRef]
  49. American Academy of Pediatrics. Guidelines for Perinatal Care, 8th ed.; American Academy of Pediatrics: Itasca, IL, USA, 2020. [Google Scholar]
  50. Moreira Pinheiro, E.; Guinsburg, R.; de Araujo Nabuco, M.A.; Yoshiko Kakehashi, T. Noise at the Neonatal Intensive Care Unit and inside the interior of the incubator. Rev. Lat. Am. Enfermagem 2011, 19, 1214–1221. (In Spanish) [Google Scholar] [CrossRef]
  51. Carvalhais, C.; Silva, M.V.; Silva, J.; Xavier, A.; Santos, J. Noise in neonatal intensive care units: A short review. In Proceedings of the Euronoise 2018, Crete, Greece, 27–31 May 2018; pp. 545–550. Available online: http://www.euronoise2018.eu/docs/papers/95_Euronoise2018.pdf (accessed on 16 April 2025).
  52. Philbin, M.K. Planning the acoustic environment of a neonatal intensive care unit. Clin. Perinatol. 2004, 31, 331–352. [Google Scholar] [CrossRef]
  53. Lichtig, I.; Maki, K. Estudos de níveis de ruídos ambientais e de ruídos gerados pelas incubadoras em uma unidade de terapia intensiva. Pediatria 1992, 14, 30–34. [Google Scholar]
  54. DOliveira Rodarte, M.; Silvan Scochi, C.G.; Moraes Leite, A.; Ide Fujinaga, C.; Zamberlan, N.E.; Correa Castral, T. O ruído gerado durante a manipulação das incubadoras: Implicações para o cuidado de enfermagem. Rev. Lat. Am. Enferm. 2005, 13, 79–85. [Google Scholar] [CrossRef]
  55. Barceló, C.; Molina, E.; Mendoza, J.G.; Dueñas, E.; Plá, E. Estructura física de los sonidos continuos y de impulso en incubadoras infantiles de uso nacional. Rev. Cub. Ped. 1986, 58, 575–590. [Google Scholar]
  56. Puyana-Romero, V.; Núñez-Solano, D.; Hernández, R.; Fernández-Zacarías, F.; Beira-Jiménez, J.L.; Garzón, C.; Muñoz, E.J. Reverberation time measurements of a neonatal incubator. Appl. Acoust. 2020, 167, 107374. [Google Scholar] [CrossRef]
  57. Fernández Zacarías, F.; Beira Jiménez, J.L.; Bustillo Velázquez-Gaztelu, P.J.; Hernández Molina, R.; Lubián López, S. Noise level in neonatal incubators: A comparative study of three models. Int. J. Pediatr. Otorhinolaryngol. 2018, 107, 150–154. [Google Scholar] [CrossRef] [PubMed]
  58. Puyana-Romero, V.; Núñez-Solano, D.; Hernández-Molina, R.; Jara-Muñoz, E. Influence of the NICU on the Acoustic Isolation of a Neonatal Incubator. Front. Pediatr. 2020, 8, 588. [Google Scholar] [CrossRef]
  59. Rodríguez-Montaño, V.M.; Puyana-Romero, V.; Hernández-Molina, R.; Beira-Jiménez, J.L. The Noise: A Silent Threat to the Recovery of Patients in Neonatal Intensive Care Units. Buildings 2024, 14, 2778. [Google Scholar] [CrossRef]
  60. Núñez-Solano, D.; Puyana-Romero, V.; Ordoñez-Andrade, C.; Bravo-Monayo, L.; Garzón-Pico, C. Impulse response simulation of a small room and in situ measurements validation. In Proceedings of the 147th Audio Engineering Society Convention, New York, NY, USA, 16–19 October 2019; pp. 1–7. [Google Scholar]
  61. Kleiner, M.; Tichy, J. Acoustics of Small Rooms; CRC Press: Boca Raton, FL, USA, 2014; pp. 1–453. [Google Scholar]
  62. Everest, F.A. The Master Handbook of Acoustics, 4th ed.; McGraw-Hill Education: New York, NY, USA, 2000. [Google Scholar]
  63. Pätynen, J.; Katz, B.F.G.; Lokki, T. Investigations on the balloon as an impulse source. J. Acoust. Soc. Am. 2011, 129, EL27–EL33. [Google Scholar] [CrossRef]
  64. Griesinger, D. Beyond MLS-Occupied Hall Measurement with FFT Techniques. In Audio Engineering Society Convention 101; Audio Engineering Society: New York, NY, USA, 1996. [Google Scholar]
  65. Cheenne, D.J.; Ardila, M.; Lee, C.G.; Bridgewater, B. A qualitative and quantitative analysis of impulse responses from balloon bursts. J. Acoust. Soc. Am. 2008, 123, 3909. [Google Scholar] [CrossRef]
  66. ISO 3382-2; Measurement of Room Acoustic Parameters. Part 2: Reverberation Time in Ordinary Rooms. International Organization for Standardization: Geneva, Switzerland, 2008.
  67. Nash, A. On the acoustical characteristics of a balloon. In Proceedings of the International Symposium on Room Acoustics, Seville, Spain, 10–12 September 2007; pp. 2761–2762. [Google Scholar]
  68. Llinares, J.; Llopis, A.; Sancho, J. Acústica Arquitectónica y Urbanística; Universitat Politècnica de València: València, Spain, 2008. [Google Scholar]
  69. Puyana-Romero, V.; Tamayo-Guamán, L.M.; Núñez-Solano, D.; Hernández-Molina, R.; Ciaburro, G. Artificial Neural Network-Based Model to Characterize the Reverberation Time of a Neonatal Incubator. In Innovations in Machine and Deep Learning: Case Studies and Applications; Rivera, G., Rosete, A., Dorronsoro, B., Rangel-Valdez, N., Eds.; Springer Nature: Cham, Switzerland, 2023; pp. 305–322. [Google Scholar] [CrossRef]
  70. Berzborn, M.; Bomhardt, R.; Klein, J.; Richter, J.G.; Vorländer, M. The ITA-Toolbox: An Open Source MATLAB Toolbox for Acoustic Measurements and Signal Processing. In Proceedings of the 43th Annual German Congress on Acoustics, Kiel, Germany, 6–9 March 2017; pp. 222–225. Available online: http://www.ita-toolbox.org/publications/ITA-Toolbox_paper2017.pdf (accessed on 16 April 2025).
  71. ISO 16283-1:2014; Acoustics—Field Measurement of Sound Insulation in Buildings and of Building Elements—Part 1: Airborne Sound Insulation. International Organization for Standardization: Geneva, Switzerland, 2014.
  72. Berger, V.; Zhou, Y. Kolmogorov–Smirnov Test: Overview. In Wiley StatsRef: Statistics Reference Online; Wiley: Hoboken, NJ, USA, 2014. [Google Scholar]
  73. Ostertagová, E.; Ostertag, O.; Kováč, J. Methodology and Application of the Kruskal-Wallis Test. Appl. Mech. Mater. 2014, 611, 115–120. [Google Scholar] [CrossRef]
  74. Lydersen, S. Adjustment of p values for multiple hypotheses: Why, when and how. Ann. Rheum. Dis. 2024, 83, 1254–1255. [Google Scholar] [CrossRef]
  75. Chen, S.Y.; Feng, Z.; Yi, X. A general introduction to adjustment for multiple comparisons. J. Thorac. Dis. 2017, 9, 1725–1729. [Google Scholar] [CrossRef]
  76. Cohen, J. Using Effect Size—Or Why the P Value Is Not Enough. J. Grad. Med. Educ. 2012, 4, 279–282. [Google Scholar]
  77. Coe, R. It’s the Effect Size, Stupid: What effect size is and why it is important. In Proceedings of the Conference of the British Educational Research Association, Exeter, UK, 11–14 September 2002. [Google Scholar]
  78. Heričko, T.; Šumak, B. Exploring Maintainability Index Variants for Software Maintainability Measurement in Object-Oriented Systems. Appl. Sci. 2023, 13, 2972. [Google Scholar] [CrossRef]
  79. Kerby, D.S. The Simple Difference Formula: An Approach to Teaching Nonparametric Correlation. Compr. Psychol. 2014, 3, 1. [Google Scholar] [CrossRef]
  80. Parker, R.I.; Hagan-Burke, S. Useful Effect Size Interpretations for Single Case Research. Behav. Ther. 2007, 38, 95–105. [Google Scholar] [CrossRef]
  81. Ben-Shachar, M.S.; Makowski, D.; Daniel Lüdecke Patil, I.; Wiernik, B.M.; Thériault, R.; Kelley, K.; Stanley, D.; Caldwell, A.; Burnett, J.; Karreth, J. Package ‘Effectsize ’. BugReports. 2024, pp. 87–91. Available online: https://easystats.github.io/effectsize/ (accessed on 16 April 2025).
  82. Cohen, J. Statistical Power Analysis for the Behavioral Sciences, 2nd ed.; Routledge: New York, NY, USA, 1988; 567p. [Google Scholar] [CrossRef]
  83. Wasserstein, R.L.; Lazar, N.A. The ASA’s Statement on p-Values: Context, Process, and Purpose. Am. Stat. 2016, 70, 129–133. [Google Scholar] [CrossRef]
  84. Gibbons, J.D.; Pratt, J.W. P-values: Interpretation and Methodology. Am. Stat. 2012, 29, 37–41. [Google Scholar]
  85. Berger, J.O.; Sellke, T. Testing a point null hypothesis: The irreconcilability of P values and evidence. J. Am. Stat. Assoc. 1987, 82, 112–122. [Google Scholar] [CrossRef]
  86. Sellke, T.; Bayarri, M.J.; Berger, J.O. Calibration of p Values for Testing Precise Null Hypotheses. Am. Stat. 2001, 55, 62–71. [Google Scholar] [CrossRef]
  87. Delampady, M. Lower Bounds on Bayes Factors for Interval Null Hypotheses. J. Am. Stat. Assoc. 1989, 84, 120–124. [Google Scholar] [CrossRef]
  88. Delapady, M.; Berger, J.O. Lower bounds of Bayes factors for multinomial distributions, with applications to Chi-Squared tests of fit. Ann. Stat. 1980, 8, 1295–1316. [Google Scholar]
  89. Rouder, J.N.; Speckman, P.L.; Sun, D.; Morey, R.D.; Iverson, G. Bayesian t tests for accepting and rejecting the null hypothesis. Psychon. Bull. Rev. 2009, 16, 225–237. [Google Scholar] [CrossRef]
  90. Bayesian Independent—Sample Inference—IBM Documentation. Available online: https://www.ibm.com/docs/en/spss-statistics/25.0.0?topic=statistics-bayesian-independent-sample-inference#fntarg_2 (accessed on 29 April 2024).
  91. Edwards, W.; Lindman, H.; Savage, L.J. Bayesian statistical inference for psychological research. Psychol. Rev. 1963, 70, 193–242. [Google Scholar] [CrossRef]
  92. Sabine, W.C. Collected Papers on Acoustics; Harvard University Press: Cambridge, MA, USA, 1922; p. 279. [Google Scholar]
  93. Inacio, O. Fundamentals of Room Acoustics; Engineering Acoustics: Barcelona, Spain, 2005. [Google Scholar]
  94. Zhang, Y.; Du, J.; Liu, Y.; Yang, T.; Liu, Z. Sound transmission between rooms coupled through partition with elastically restrained edges. In Internoise 2014; Australian Acoustical Society: Melbourne, Australia, 2014; pp. 1–12. [Google Scholar]
  95. Knudsen, V.O.; Harris, C.M. Reverberation in coupled spaces. In Acoustical Designing in Architecture; Acoustical Society of America (ASA): Honolulu, HI, USA, 1978. [Google Scholar]
  96. Kuttruff, H. Room Acoustics; Spon Press: London, UK, 2009; p. 389. [Google Scholar]
  97. Long, M. Architectural Acoustics; Stern, R., Levy, M., Eds.; Elsevier Academic Press: Amsterdam, The Netherlands, 2006. [Google Scholar]
  98. Longoni, H.C.; Turra, B. Identificación, Análisis y Control del Eco Flotante. 2012. Universidad Tecnológica Nacional Facultad Regional Córdoba, Mayo 2012, Argentina. Available online: https://www.profesores.frc.utn.edu.ar/electronica/fundamentosdeacusticayelectroacustica/pub/file/FAyE0812E1-Longoni-Turra(1).pdf (accessed on 16 April 2025).
  99. Fastl, H.; Zwicker, E. Psychoacoustics: Facts and Models; Springer: Cham, Switzerland, 2007. [Google Scholar]
  100. Puyana-Romero, V.; Núñez-Solano, D.; Fernández-Zacarías, F.; Jara-Muñoz, E.; Hernández-Molina, R. The Importance of Reverberation for the Design of Neonatal Incubators. Front. Pediatr. 2021, 9, 4–11. [Google Scholar] [CrossRef] [PubMed]
  101. Buchenau, U.; D’Angelo, G.; Carini, G.; Liu, X.; Ramos, M.A. Sound absorption in glasses. Rev. Phys. 2022, 9, 100078. [Google Scholar] [CrossRef]
  102. de Paiva, A. Neuroscience for Architecture: How Building Design Can Influence Behaviors and Performance. J. Civ. Eng. Archit. 2018, 12, 132–138. [Google Scholar]
  103. Zhang, X.; Spear, E.; Hsu, H.H.L.; Gennings, C.; Stroustrup, A. NICU-based stress response and preterm infant neurobehavior: Exploring the critical windows for exposure. Pediatr. Res. 2022, 92, 1470–1478. [Google Scholar] [CrossRef]
  104. Kahneman, D. Thinking, Fast and Slow; Farrar, Straus and Giroux: New York, NY, USA, 2011; p. 499. [Google Scholar]
  105. Haan Mde Dumontheil, I.; Johnson, M.H. Developmental Cognitive Neuroscience: An Introduction, 5th ed.; The Wiley Handbook of Developmental Psychopathology; Wiley: Hoboken, NJ, USA, 2023; pp. 179–196. [Google Scholar]
  106. Ulrich, R.S.; Zimring, C.; Zhu, X.; DuBose, J.; Seo, H.B.; Choi, Y.S.; Quan, X.; Joseph, A. A review of the research literature on evidence-based healthcare design. HERD 2008, 1, 61–125. [Google Scholar] [CrossRef]
  107. Attaianese, E. Environmental Design and Human Performance. A Literature Review. In Proceedings of the 20th Congress of the International Ergonomics Association (IEA 2018), Florence, Italy, 26–30 August 2018; Bagnara, S., Tartaglia, R., Albolino, S., Alexander, T., Fujita, Y., Eds.; Springer International Publishing: Cham, Switzerland, 2019; pp. 486–495. [Google Scholar]
  108. United Nations Department of Economic and Social Affairs. The 17 Goals. 2024. Sustainable Development Goals. Available online: https://sdgs.un.org/goals (accessed on 5 July 2024).
  109. Krueger, C.; Schue, S.; Parker, L. Neonatal intensive care unit sound levels before and after structural reconstruction. MCN Am. J. Matern. Child. Nurs. 2007, 32, 358–362. [Google Scholar] [CrossRef]
  110. Deng, Z.; Xie, H.; Kang, J. The acoustic environment in typical hospital wards in China. Appl. Acoust. 2023, 203, 109202. [Google Scholar] [CrossRef]
  111. Meng, Q.; Wu, Y. Sound Environment and Acoustic Perception in Hospitals. In Indoor Sound Environment and Acoustic Perception [Internet]; Meng, Q., Wu, Y., Eds.; Springer Nature: Singapore, 2024; pp. 125–163. [Google Scholar] [CrossRef]
  112. White, R.; Smith, J.; Shepley, M. Recommended Standards for Newborn ICU Design. J. Perinatol. 2013, 33, S2–S16. [Google Scholar] [CrossRef]
  113. Annerstedt, M.; Jönsson, P.; Wallergård, M.; Johansson, G.; Karlson, B.; Grahn, P.; Hansen, Å.M.; Währborg, P. Inducing physiological stress recovery with sounds of nature in a virtual reality forest—Results from a pilot study. Physiol. Behav. 2013, 118, 240–250. [Google Scholar] [CrossRef]
  114. Pallasmaa, J. The Eyes of the Skin: Architecture and the Senses; John Wiley & Sons, Ltd.: Hoboken, NJ, USA, 2012. [Google Scholar]
  115. Zumthor, P. (Ed.) Thinking Architecture; Birkhäuser: Basel, Switzerland, 2006. [Google Scholar]
Figure 1. Plan of the private room (a) and the open unit room (b) with the source and microphone arrangements. (c) Image of the acoustic measurements inside the open unit room at the Simulation Center of the University of the Americas (Quito, Ecuador).
Buildings 15 01411 g001
Figure 2. Incubator dome section and floor plan. Locations of the microphones and sound sources within the incubator. In the floor plan, black dots indicate the microphone locations, and red circles the locations of the sound sources. When the sound source is in location S1, the location L06 of the microphone is not used. Similarly happens with S2 and L05.
Buildings 15 01411 g002
Figure 3. Boxplot of the reverberation time (T) inside the incubator without mattress, considering the measurements conducted in the 28 microphone—sound source combinations of locations, when the incubator is in the open unit (OU—in light blue) and in the private room (PR—in blue), NICU types. The results for the frequency bands of the study (from 100 Hz to 5000 Hz) are represented on the horizontal axis, and the reverberation time (T) on the vertical axis. Within each box, the bottom line represents the first quartile, the middle line the second quartile or median, and the third line the third quartile. The dots are the outliers.
Buildings 15 01411 g003
Figure 4. Boxplot of the reverberation time (T) inside the incubator with mattress, considering the measurements conducted in the 28 microphone—sound source combinations of locations, when the incubator is in the open unit (OU—in light blue) and in the private room (PR—in blue) NICU types. The results for the frequency bands of the study (from 100 Hz to 5000 Hz) are represented on the horizontal axis, and the reverberation time (T) on the vertical axis. Within each box, the bottom line represents the first quartile, the middle line the second quartile or median, and the third line the third quartile. The dots are the outliers.
Buildings 15 01411 g004
Figure 5. Boxplot of the reverberation time (T) inside the open unit (OU) and the private room (PR) NICU types, considering the measurements conducted in the 10 microphone—sound source combinations of locations in the open unit (OU—in light blue) and the 8 combinations in the private room (PR—in blue) NICU types. The results for the frequency bands of the study (from 100 Hz to 5000 Hz) are represented on the horizontal axis, and the reverberation time (T) on the vertical axis. Within each box, the bottom line represents the first quartile, the middle line the second quartile or median, and the third line the third quartile. The dots are the outliers.
Buildings 15 01411 g005
Figure 6. Noise level differences (dB) between the open unit (OU) and the private room (PR) NICU types.
Buildings 15 01411 g006
Figure 7. Line graphs comparing the reverberation times in the private room inside and outside the incubator (a), in the open unit room inside and outside the incubator (b), in the incubators located in the open unit room and in the private room (c), and in both rooms outside the incubator (d).
Buildings 15 01411 g007
Table 1. Mann–Whitney U test results to evaluate whether there are differences in the reverberation time inside the incubator without the mattress when it is located in the open unit or in the private room NICU: p-value, adjusted p-value [74,75], Glass rank-biserial effect size, and interpretation of the effect size according to Cohen [82]. The results are shown for the one-third octave band frequency range between 100 Hz and 5000 Hz.
Without Mattress
FrequencyMann–Whitney UZp-ValueCorrected p-Value Nrc (Rank-Biserial)Interpretation [82]
F100156,788.000−6.7480.0000.00013080.222small
F125199,059.500−4.1500.0000.00013800.132small
F16044,704.000−25.1890.0000.00013670.801large
F200123,737.000−12.6330.0000.00013080.408moderate
F25018,428.000−28.8850.0000.00013670.918large
F31538,887.000−26.2230.0000.00013850.831large
F4003615.500−31.1900.0000.00013950.985large
F50043.500−31.6770.0000.00013941.000large
F63010.000−31.6890.0000.00013951.000large
F800173.500−31.6820.0000.00013970.999large
F1000109.000−31.6910.0000.00013971.000large
F12509976.000−30.3550.0000.00013970.957large
F16004387.000−31.1120.0000.00013970.981large
F20004678.000−31.0720.0000.00013970.980large
F250022.000−31.7030.0000.00013971.000large
F31501218.000−31.5410.0000.00013970.995large
F400017,018.000−29.4020.0000.00013970.927large
F500020,5451.500−3.8940.0000.00013970.123large
Table 2. Bayes factor results for two independent sample tests (mean difference, pooled standardized error difference, Bayes factor, and the 95% credible intervals [87,88]: reverberation time of the incubator without mattress, located in the open unit and the private unit room. The results are shown for the one-third octave band frequency range between 100 Hz and 5000 Hz.
Bayes Factor Two Independent Samples Test (Method = Rouder)Posterior Distribution Characterization for Independent Sample Mean
Mean Difference (PR-OU)Pooled Std. Error DifferenceBayes FactorInterpretation95% Credible Interval
Lower BoundUpper Bound
F100−0.5040.0560.000Extreme evidence for H1−0.629−0.380
F125−0.2840.0790.038Very strong evidence for H1−0.430−0.139
F160−0.8870.0310.000Extreme evidence for H1−0.957−0.818
F200−0.6590.0540.000Extreme evidence for H1−0.762−0.556
F250−0.7820.0200.000Extreme evidence for H1−0.827−0.738
F315−0.3630.0140.000Extreme evidence for H1−0.396−0.330
F400−0.8180.0140.000Extreme evidence for H1−0.851−0.785
F500−0.8320.0120.000Extreme evidence for H1−0.859−0.804
F630−0.6290.0080.000Extreme evidence for H1−0.647−0.611
F800−0.5130.0060.000Extreme evidence for H1−0.529−0.498
F1000−0.4090.0050.000Extreme evidence for H1−0.421−0.397
F1250−0.1890.0040.000Extreme evidence for H1−0.199−0.180
F1600−0.2800.0040.000Extreme evidence for H1−0.289−0.272
F2000−0.2480.0040.000Extreme evidence for H1−0.257−0.238
F2500−0.3190.0050.000Extreme evidence for H1−0.330−0.308
F3150−0.2350.0040.000Extreme evidence for H1−0.245−0.224
F4000−0.1050.0040.000Extreme evidence for H1−0.116−0.095
F5000−0.0230.0040.000Extreme evidence for H1−0.033−0.013
Table 3. Mann–Whitney U test results to evaluate whether there are differences in the reverberation time inside the incubator with mattress when it is located in the open unit or in the private room NICU: p-value, adjusted p-value [74,75], Glass rank-biserial effect size, and interpretation of the effect size according to Cohen [82]. The results are shown for the one-third octave band frequency range between 100 Hz and 5000 Hz.
With Mattress
FrequencyMann–Whitney UZp-ValueCorrected p-Value Nrc (Rank-Biserial)Interpretation [82]
F100162,864.500−6.9940.0000.00013230.226small
F125175,593.000−3.5430.0000.00012700.116small
F160123,386.000−13.6400.0000.00013430.436moderate
F200125,964.500−12.8520.0000.00013260.413moderate
F250121,114.500−14.3830.0000.00013590.458moderate
F31530,467.000−26.7480.0000.00013290.858large
F400563.000−31.3050.0000.00013550.997large
F50053.000−31.4980.0000.00013701.000large
F630290.000−31.5360.0000.00013790.999large
F8001.000−31.5920.0000.00013811.000large
F1000348.500−31.5440.0000.00013810.998large
F1250305.500−31.5500.0000.00013810.999large
F16001.000−31.5840.0000.00013801.000large
F20002.000−31.5840.0000.00013801.000large
F2500274.000−31.5460.0000.00013800.999large
F3150360.000−31.5260.0000.00013790.998large
F40009233.000−30.3230.0000.00013810.960large
F500061,175.500−23.1690.0000.00013800.734large
Table 4. Bayes factor results (mean difference, pooled standardized error difference, Bayes factor, and the 95% credible intervals [87,88]), for two independent samples, the reverberation time of the incubator with mattress located in the open unit and the private unit room, The results are shown for the one-third octave band frequency range between 100 and 5000 Hz.
Bayes Factor Two Independent Samples Test (Method = Rouder)Posterior Distribution Characterization for Independent Sample Mean
Mean Difference (PR-OU)Pooled Std, Error DifferenceBayes FactorInterpretation95% Credible Interval
Lower Bound Upper Bound
F100−0.1640.0350.000Extreme evidence for H1−0.236−0.092
F125−0.2530.0560.001Extreme evidence for H1−0.366−0.140
F160−0.1470.0130.000Extreme evidence for H1−0.173−0.121
F200−0.3730.0270.000Extreme evidence for H1−0.426−0.320
F250−0.0670.0080.000Extreme evidence for H1−0.082−0.052
F315−0.1830.0070.000Extreme evidence for H1−0.197−0.169
F400−0.7360.0090.000Extreme evidence for H1−0.757−0.715
F500−0.8000.0100.000Extreme evidence for H1−0.823−0.777
F630−0.5890.0090.000Extreme evidence for H1−0.611−0.568
F800−0.5650.0060.000Extreme evidence for H1−0.578−0.552
F1000−0.3940.0050.000Extreme evidence for H1−0.406−0.382
F1250−0.2660.0040.000Extreme evidence for H1−0.275−0.258
F1600−0.3200.0040.000Extreme evidence for H1−0.328−0.312
F2000−0.3320.0030.000Extreme evidence for H1−0.340−0.324
F2500−0.3230.0030.000Extreme evidence for H1−0.330−0.315
F3150−0.2250.0030.000Extreme evidence for H1−0.232−0.219
F4000−0.0940.0020.000Extreme evidence for H1−0.099−0.089
F5000−0.0270.0010.000Extreme evidence for H1−0.029−0.024
Table 5. Mann–Whitney U test results to evaluate whether there are differences in the reverberation time inside the open unit or in the private room NICU: p-value, Glass rank-biserial effect size, and interpretation of the effect size according to Cohen [82]. The results are shown for the one-third octave band frequency range between 100 and 5000 Hz.
In OU and PR (Incubator Without Mattress)
FrequencyMann–Whitney UZp-ValueCorrected p-Value Nrc (Rank-Biserial)Interpretation [82]
F10024.000−5.5890.0000.0001570.986large
F12522.500−5.5990.0000.0001570.987large
F16050.000−5.4180.0000.0001570.971large
F20020.000−5.6160.0000.0001570.988large
F25024.000−5.5890.0000.0001570.986large
F31524.000−5.5890.0000.0001570.986large
F40013.000−5.6620.0000.0001570.992large
F50020.000−5.6160.0000.0001570.988large
F63012.000−5.6690.0000.0001570.993large
F80020.000−5.6160.0000.0001570.988large
F100022.500−5.5990.0000.0001570.987large
F125013.000−5.6620.0000.0001570.992large
F1600171.000−4.6180.0000.0001570.896large
F200024.000−5.5900.0000.0001570.986large
F250012.000−5.6690.0000.0001570.993large
F3150350.000−3.4360.0010.0011570.774medium
F4000300.000−3.7660.0000.0001570.809medium
F5000460.000−2.7090.0070.0071570.692small
Table 6. Bayes factor results (mean difference, pooled standardized error difference, Bayes factor, and the 95% credible intervals [87,88]), for two independent samples, the reverberation time of the incubator without a mattress located in the open unit and the private unit room.
Bayes Factor Two Independent Samples Test (Method = Rouder)Posterior Distribution Characterization for Independent Sample Mean
Mean Difference (PR-OU)Pooled Std. Error DifferenceBayes FactorInterpretation95% Credible Interval
Lower BoundUpper Bound
F100−0.4330.0710.000Extreme evidence for H1−0.484−0.381
F125−1.3560.1150.000Extreme evidence for H1−1.427−1.285
F160−0.4200.0790.000Strong evidence for H1−0.466−0.373
F200−1.4200.0930.000Extreme evidence for H1−1.473−1.366
F250−0.8880.0830.000Extreme evidence for H1−0.937−0.840
F315−0.4980.0840.000Extreme evidence for H1−0.546−0.450
F400−0.7630.0890.000Extreme evidence for H1−0.815−0.712
F500−0.8120.0850.000Extreme evidence for H1−0.862−0.762
F630−0.6790.0730.000Extreme evidence for H1−0.721−0.637
F800−0.6210.0770.000Extreme evidence for H1−0.665−0.577
F1000−0.4600.0680.000Extreme evidence for H1−0.499−0.421
F1250−0.4090.0710.000Extreme evidence for H1−0.449−0.368
F1600−0.3220.0690.000Extreme evidence for H1−0.361−0.283
F2000−0.4550.0790.000Extreme evidence for H1−0.500−0.411
F2500−0.4470.0630.000Extreme evidence for H1−0.483−0.411
F3150−0.2740.0790.023Very strong evidence for H1−0.319−0.230
F4000−0.2510.0660.008Extreme evidence for H1−0.288−0.214
F5000−0.1340.0500.195Moderate evidence of H0−0.163−0.106
Disclaimer/Publisher’s Note: The statements, opinions and data contained in all publications are solely those of the individual author(s) and contributor(s) and not of MDPI and/or the editor(s). MDPI and/or the editor(s) disclaim responsibility for any injury to people or property resulting from any ideas, methods, instructions or products referred to in the content.

