Article

Study on Referential Methodology for Pathogenic Mechanisms of Invigorating Wind/Deficiency Wind in Natural Ventilation Environments

Department of Civil Engineering, Dalian University of Technology, Dalian 116024, China
*
Author to whom correspondence should be addressed.
These authors contributed equally to this work and should be considered as co-first authors.
Buildings 2025, 15(9), 1422; https://doi.org/10.3390/buildings15091422
Submission received: 31 March 2025 / Revised: 16 April 2025 / Accepted: 22 April 2025 / Published: 23 April 2025
(This article belongs to the Special Issue Indoor Environmental Quality and Human Wellbeing)

Abstract

:
The impact of wind direction on comfort and health remains underexplored in the field of natural ventilation. This study adopts the concepts of invigorating wind/deficiency wind from the “nine palaces and eight winds” theoretical framework in the Huangdi Neijing, integrating solar terms and wind direction as temporal-spatial elements into existing environmental factor analysis paradigms. Three key questions were explored, namely, the temporal principles of meteorological cycle division from an annual perspective, the impact of invigorating wind/deficiency wind on climatic stability during solar term cycles, and the spatiotemporal distribution characteristics of invigorating wind/deficiency wind. Multi-scale analyses were conducted using typical meteorological year data and real-time meteorological data from case cities. Results showed that solar term cycle divisions adjusted based on temperature variations better align with regional climatic characteristics. The ratio of invigorating wind/deficiency wind on solar term days may imply climatic stability within solar term cycles. Also, significant differences exist between deficiency wind and invigorating wind during high-disease-incidence solar terms, though their manifestations vary. These findings help to find new wind characteristics to explain the comfort and health effects of natural ventilation and will provide scientific foundations for further exploration of well-being in indoor environments.

1. Introduction

1.1. The Overlooked Characteristic of Wind Direction in Natural Ventilation Research

Natural ventilation is one of the most effective pathways in passive cooling strategies, primarily aiming to enhance indoor air quality (IAQ), thermal comfort through direct/indirect introduction of outdoor airflow, or energy efficiency of building operation [1,2,3]. Existing evaluation metrics for natural ventilation performance focus on three aspects: physical attributes of wind environments, human thermal comfort assessment, and environmental health effects [4]. Thermal comfort evaluation primarily investigates the impact of air movement on convective heat transfer at the human body surface, influencing thermal perception through indices such as predicted mean vote (PMV), standard effective temperature (SET), and universal thermal climate index (UTCI) [5]. Health effect studies about natural ventilation predominantly focus on parameters like air age and ventilation rate [6,7]. Physical attributes of wind environments emphasize air velocity, turbulence intensity, fluctuation frequency, and natural wind’s unsteady characteristics [8]. Wind direction has also been identified as a comfort-influencing factor, with Cao et al. [9] proposing directional variation sensitivity (DVS) as an evaluation variable for wind comfort. Sakiyama et al.’s review on naturally ventilated buildings incorporated multiple wind direction-related studies, focusing on improving ventilation efficiency through interventions like windcatchers [10]. At urban and neighborhood scales, studies have examined wind direction’s role in urban ventilation corridors and pedestrian thermal comfort [11,12], as well as its mechanisms in pollutant dispersion pathways [13,14,15]. Current research predominantly employs linear indicators to analyze wind’s health-comfort impacts, with insufficient attention to dynamic influences of its spatiotemporal attributes.

1.2. Spatiotemporal Coupling Health Effects of Wind Direction

Traditional Chinese culture suggests that seasonal and directional variations in wind contribute to distinct health risks, a perspective echoed in cross-cultural cases. The Chinook wind (westerly warm wind) prevalent in winter in Alberta, Canada, has been linked to migraine incidence [16]. Europe’s concept of “Föhn illness” similarly attributes adverse health effects to warm, dry winds [17]. Wind direction is not merely an indicator of airflow origin but rather an aerodynamic vector carrying inherent spatiotemporal attributes. Current environmental comfort-health evaluation systems demonstrate limitations in capturing the multidimensional spatiotemporal coupling characteristics inherent in wind direction effects.
The distinct monsoonal climate in China, characterized by pronounced seasonal variations, shapes a well-defined climatic pattern [18]. This geographical uniqueness has led traditional Chinese culture to systematically codify correlations between wind directions and climatic dynamics, phenological cycles, and human physiological responses.
The nine palaces and eight winds theory (from Huangdi Neijing·Spiritual Pivot) introduces an innovative perspective [19]: it dynamically couples wind direction with eight cardinal orientations and solar terms, defining pathogenic distinctions between “invigorating wind” (I-wind) (seasonally compliant) and “deficiency wind” (D-wind) (counter-seasonal). This theory introduces temporal and spatial dimensions to wind-environment-health correlations, expanding static environmental analysis to architectural design integrated with natural rhythms. While retaining core metrics like temperature, humidity, and wind speed, this study emphasizes spatiotemporal heterogeneity in natural ventilation and its associated differential health risks.

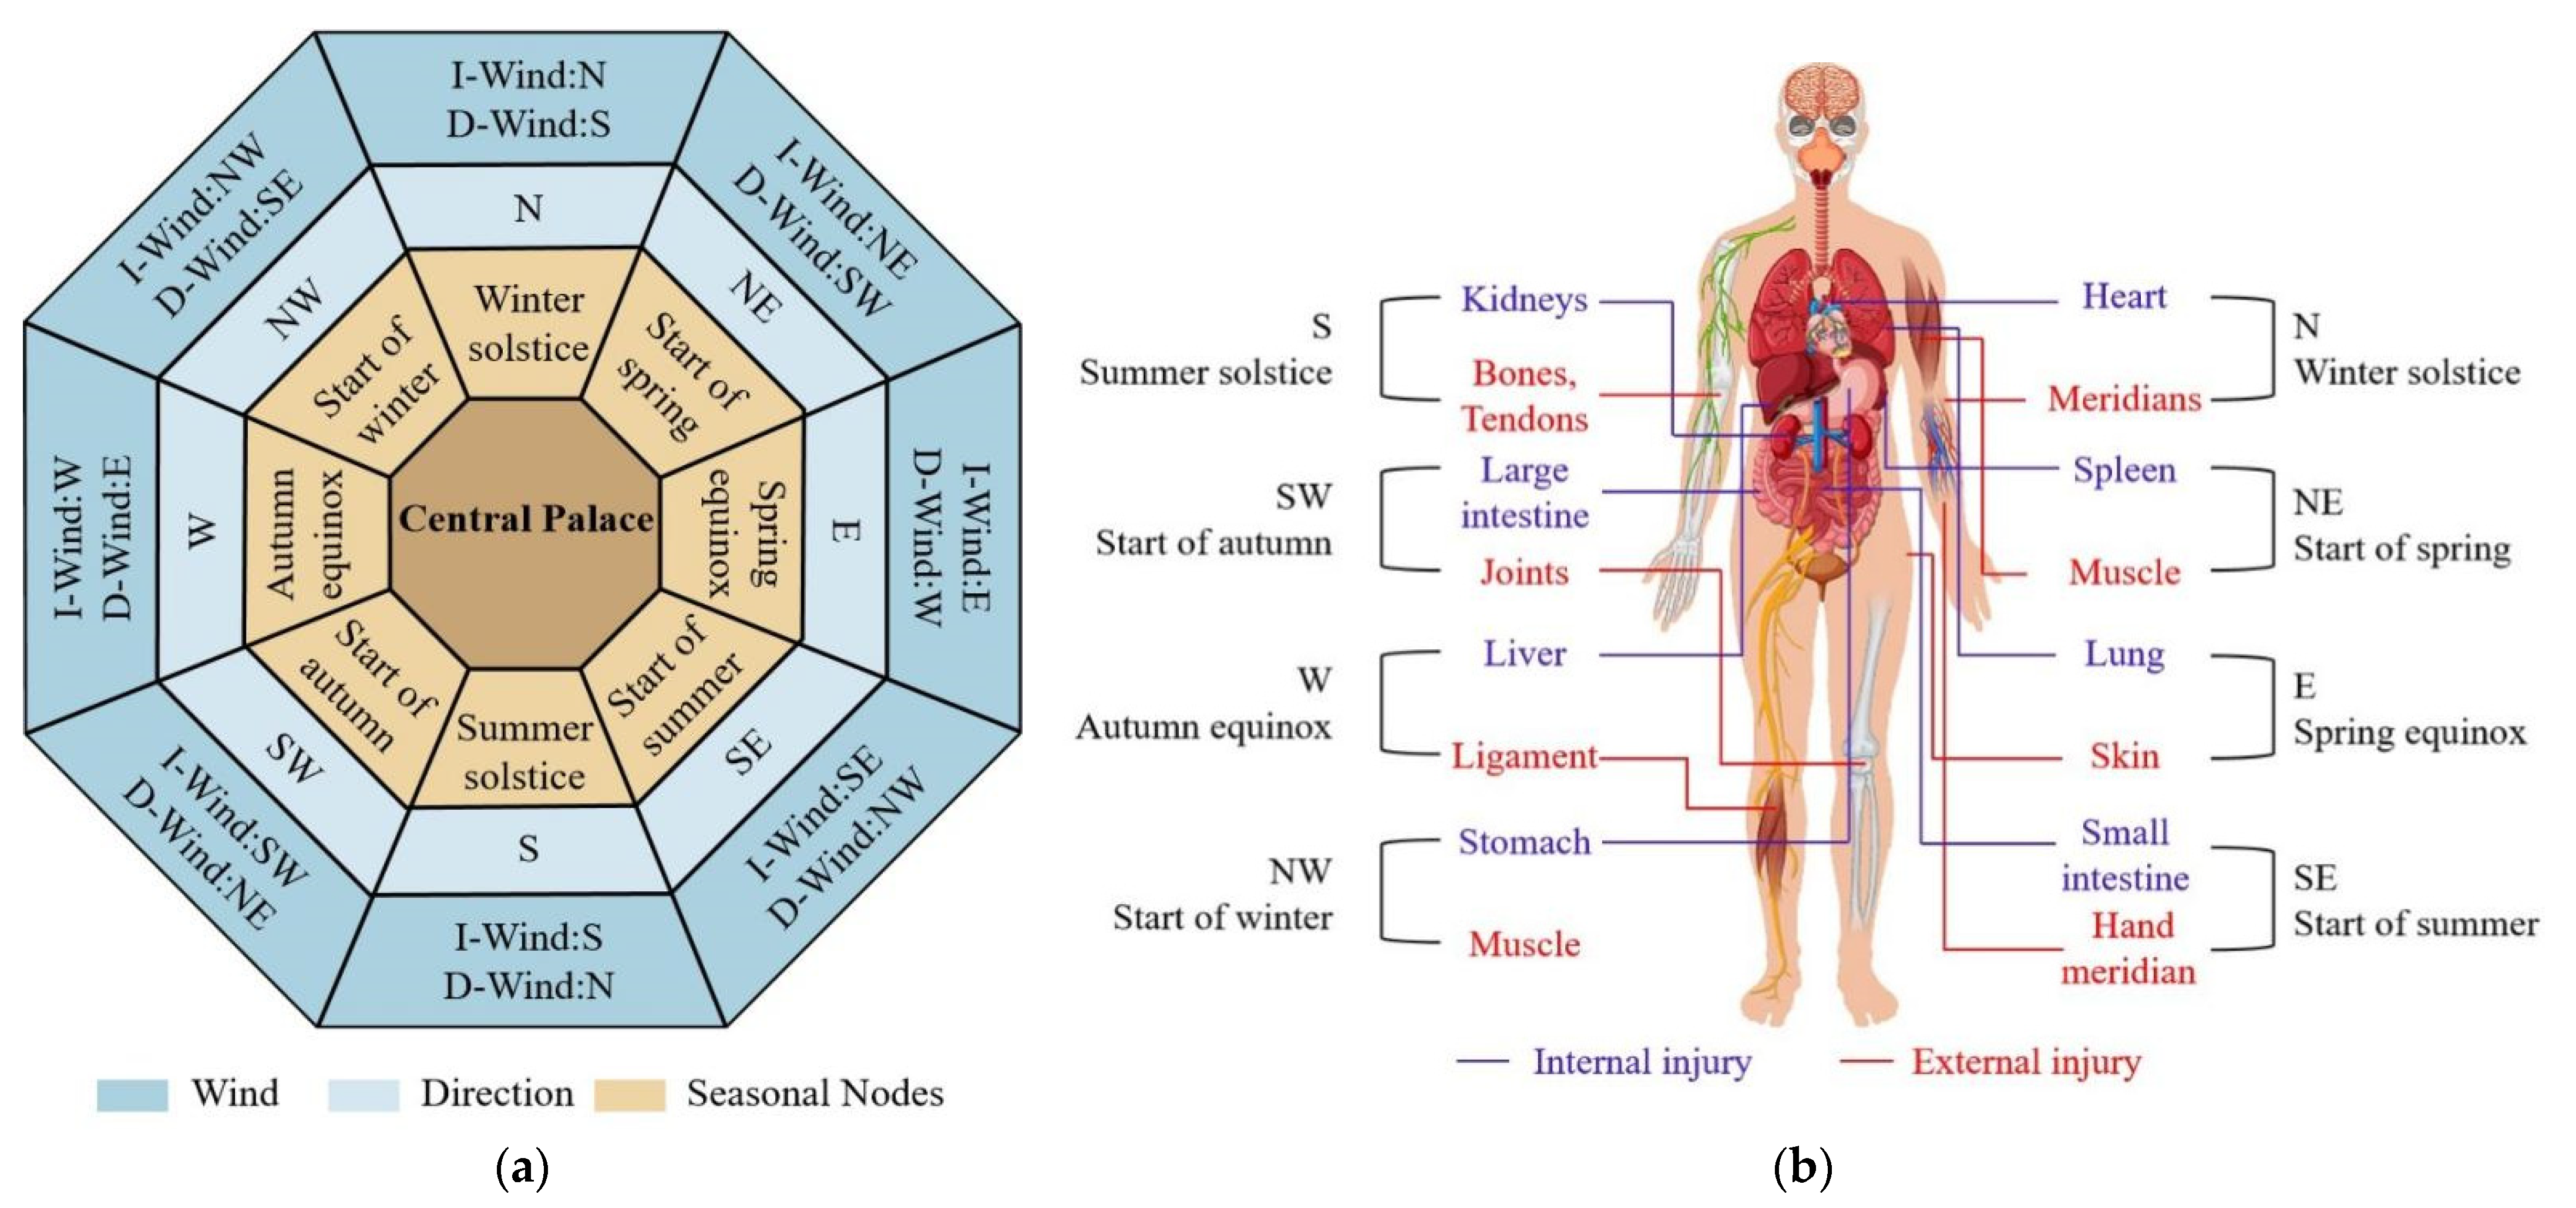
1.3. The Framework of Nine Palaces and Eight Winds Involving Solar Terms, Wind Direction, and Human Health Risks

The nine palaces and eight winds theory (the theory) originates from Huangdi Neijing, the first canonical text of traditional Chinese medicine, with its core content established between 33 BCE and 7 BCE (Han Dynasty) [19]. This text laid the philosophical foundation of “Qi, Yin-Yang, and the Five Elements”, enabling scholars to trace its empirical and mathematical principles [20,21]. Such foundations were rooted in ancient China’s capability to observe and document celestial and terrestrial phenomena since the Neolithic period [22]. A search across Chinese and English academic databases identified 48 studies on the nine palaces and eight winds theory, predominantly within traditional Chinese medicine research. Early studies focused on textual verification and historical analysis of the theory [23,24,25]. Recent work by Zhou applied the theory to clinical studies on stroke, offering novel interpretations of its pathogenesis [26]. Xu et al. (2020) proposed architectural wind environment design principles informed by the theory [27]. Li developed a medical-meteorological model grounded in the nine palaces and eight winds framework [20]. The core tenets of the theory are outlined below [28].
The nine palaces represent humans and eight cardinal directions and eight solar terms: the equinoxes (spring and autumn), solstices (summer and winter), and seasonal commencements (start of spring, summer, autumn, and winter). The eight winds represent their corresponding winds. Each solar term denotes both a specific day and the subsequent period until the next solar term. The dominant wind direction during a solar term cycle is termed invigorating wind (seasonally congruent winds indicating climatic stability with thermal/humidity fluctuations, traditionally considered health-promoting), while winds from the opposite direction are deficiency wind (non-seasonal winds causing abrupt meteorological changes and elevated pathogenic risks). Invigorating wind dominance on the solar term day implies climatic stability throughout the cycle. Deficiency wind dominance suggests potential climatic instability [29]. Invigorating wind benefits human health, whereas deficiency wind poses harm. For instance, during the winter solstice, the invigorating wind (north wind) promotes health, while the deficiency wind (south wind) exacerbates health risks. Figure 1 illustrates the theory’s framework, detailing the directional correlations of solar terms, definitions of invigorating/deficiency winds, and internal/external harm caused by various deficiency winds.
The exploration of the theory ultimately aims to develop spatiotemporally responsive natural ventilation strategies. However, the core objective of this study is a tentative translation of traditional theory into modern technological frameworks. Prior to validating this theory, two foundational hypotheses must be established: First, the theory emerged under ancient climatic conditions significantly distinct from modern contexts. The eastern Hu Line region in mainland China [30] (overlapping with the third topographic [31]) exhibits comparable monsoon interaction patterns influenced by Mongolian cold highs and oceanic warm-humid airflows [18]. Thus, we hypothesize this region’s applicability for the nine palaces and eight winds theory (Hypothesis 1). Second, substantial evidence links climatic abruptness to disease induction (e.g., respiratory and cardiovascular/cerebrovascular diseases) [32,33]. This supports the proposed “climate-health” hypothesis embodied by deficiency wind pathogenicity (Hypothesis 2). As a pioneering exploration, this paper examines three urban-scale deficiency wind phenomena through the lens of invigorating/deficiency wind theory.
This paper aims to answer the following question:
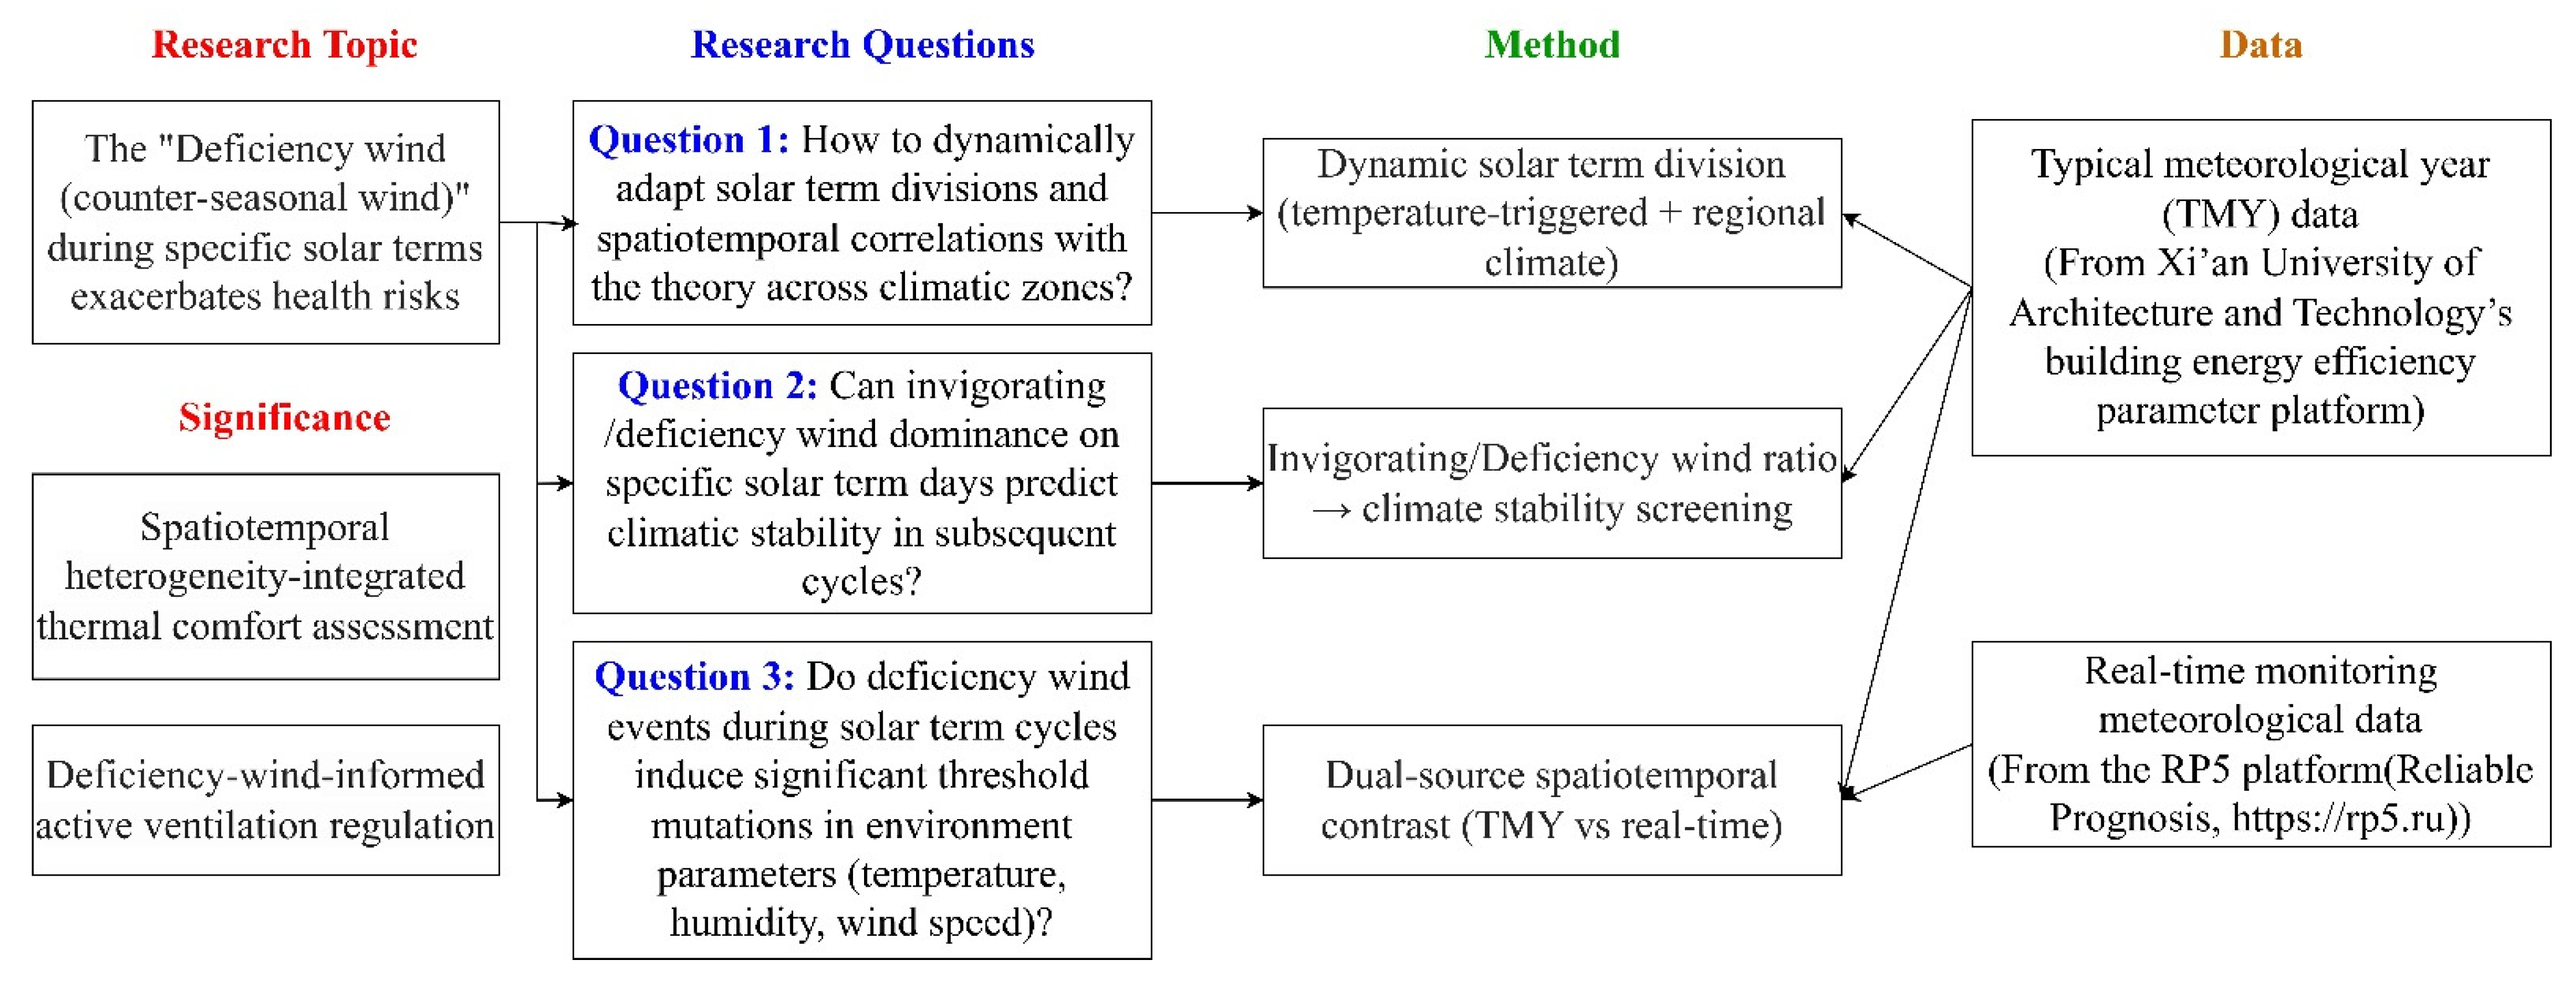
  • Question 1: How to dynamically adapt solar term divisions and spatiotemporal correlations with the theory across climatic zones?
  • Question 2: Can invigorating/deficiency wind dominance on specific solar term days predict climatic stability in subsequent cycles?
  • Question 3: Do deficiency wind events during solar term cycles induce significant threshold mutations in environmental parameters (temperature, humidity, wind speed)?
Finally, preliminary findings guide future prospects for establishing comprehensive spatiotemporal climatic evaluation indicators integrated with invigorating/deficiency wind theory.

2. Method

To address these three research questions, two-source meteorological data at Chinese urban scales were utilized for analysis, aiming to explore the characteristic differences between invigorating wind (I-wind) and deficiency wind (D-wind) under spatiotemporal variations across different regions. This study seeks to propose a novel perspective for assessing environmental and human health risks through the integrated framework of solar term-based temporal divisions and wind direction spatial classifications. For methodological demonstration purposes, selected case cities were analyzed as exemplars. The research framework of this study is displayed in Figure 2.

2.1. Meteorological Data Sources for Invigorating/Deficiency Wind Discrimination

Preliminary studies revealed significant discrepancies between urban meteorological station data and rooftop building meteorological station data. Comparative analysis showed rooftop stations are susceptible to local terrain and surrounding building shading effects, yielding generally weaker meteorological parameters than urban stations. Built environments significantly attenuate wind fields. Thus, urban-scale deficiency wind studies should prioritize data from open-area urban meteorological stations. A dual-data validation was conducted for provincial capitals and municipalities: typical meteorological year (TMY) data and real-time monitoring data were used to calculate invigorating/deficiency wind values. Results indicated substantial deviations between datasets, attributable to TMY data reflecting long-term wind trends versus real-time data capturing annual specificity. Therefore, comparative analyses of both datasets were performed. Based on these findings, this study established a dual-source data system (TMY and real-time monitoring) at urban scales to systematically address key research questions through comparative analysis. This approach ensures spatiotemporal representativeness while accounting for annual climatic specificity. TMY data were sourced from Xi’an University of Architecture and Technology’s building energy efficiency parameter platform [34] (https://buildingdata.xauat.edu.cn, accessed on 25 March 2025). The real-time data were obtained from the RP5 platform [35] (Reliable Prognosis, https://rp5.ru, accessed on 25 March 2025), which aggregates global urban/airport meteorological data with high-precision multidimensional parameters (temperature, relative humidity, wind speed, etc.).

2.2. Data Processing Methods

When answering Question 3, the analytical workflow for assessing differential impacts of invigorating/deficiency winds on meteorological parameters is illustrated in Figure 3. This methodology first involves defining the temporal periods of invigorating/deficiency wind across different solar terms throughout the year, with detailed procedures outlined in Section 2.2.1. Subsequently, standardized processing of meteorological data within these defined periods is conducted, as elaborated in Section 2.2.2. Finally, differential analysis of meteorological parameters between invigorating/deficiency wind periods within the same solar term is performed to clarify the characteristics of deficient wind, with comprehensive details provided in Section 2.2.3.

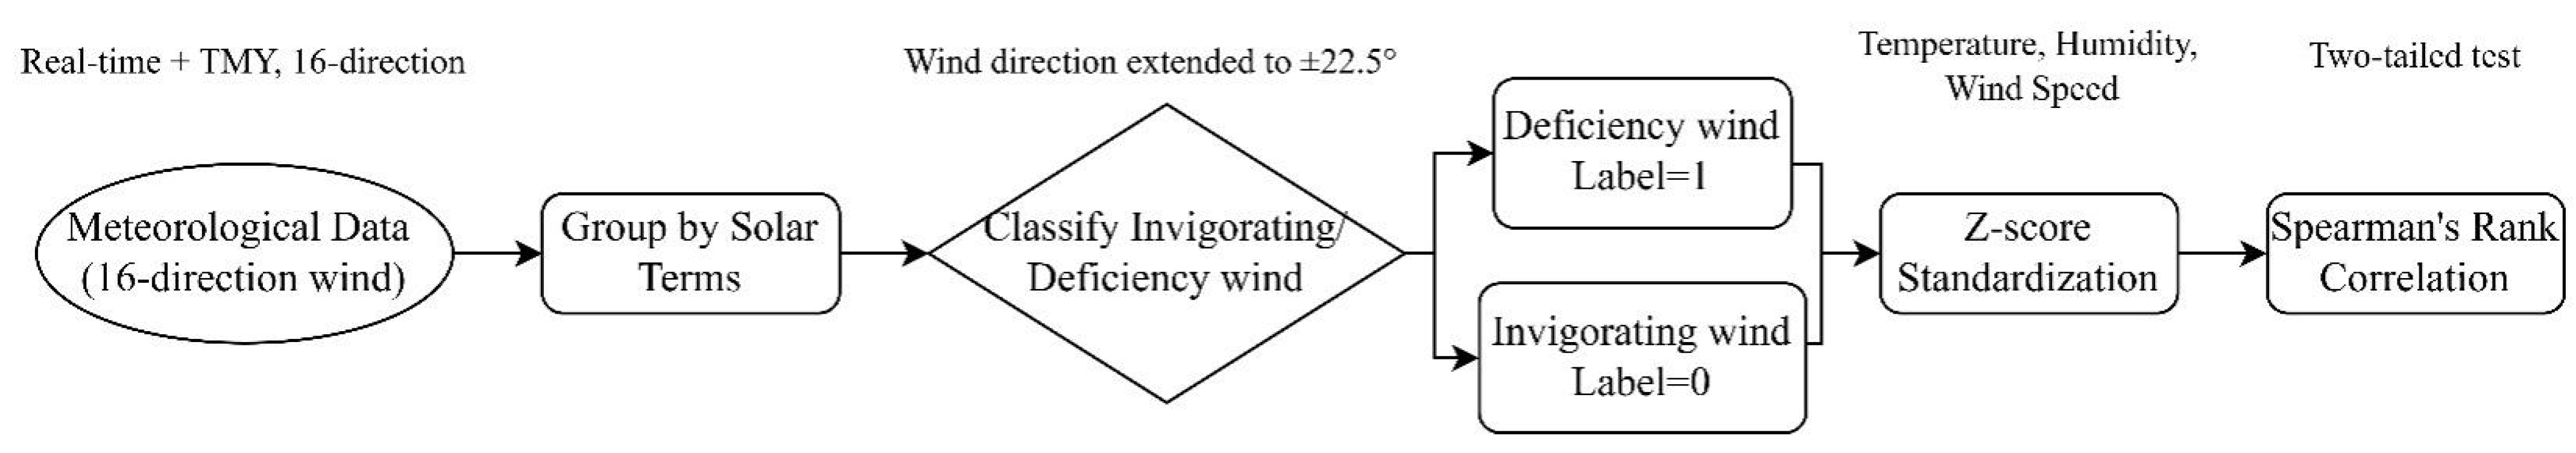
2.2.1. Grouping and Definition of Invigorating/Deficiency Winds

Meteorological data were segmented and classified into invigorating/deficiency winds based on eight solar terms (see Section 3.1). As the meteorological data (real-time and TMY) follow 16-direction wind classification, each primary direction spans a central angle of ±11.25° (half-interval extension to adjacent directions). To reduce discretization and better represent actual wind fields, the directional range was expanded to a central angle of ±22.5° (one adjacent direction on each side). For example, the invigorating wind direction for the winter solstice is north (N), defined as 337.5–22.5°, covering NNW (337.5°) to NNE (22.5°). Time periods matching invigorating/deficiency wind directions for each solar term were labeled as 1 (invigorating) or 0 (deficiency).

2.2.2. Meteorological Data Preprocessing

Temperature, relative humidity, absolute humidity, and wind speed were Z-score standardized (Equation (1)) to eliminate dimensional bias as follows:
Z = ( X μ ) / σ
where X is raw data, μ is variable mean, and σ is standard deviation.

2.2.3. Statistical Analysis of Differences

Spearman’s rank correlation coefficient (two-tailed test) was used to assess associations between invigorating/deficiency winds (binary variables) and standardized parameters (temperature, humidity, wind speed). Significance was determined by ρ absolute values and p-values (e.g., p ** < 0.001, p * < 0.05), with R2 calculated to quantify explanatory power. Statistical analyses were performed using SPSS 27 [36].
These methods were applied to analyze invigorating/deficiency wind differences during solar term cycles and deficiency wind impacts on meteorological parameters (Question 3).

3. Results

3.1. Spatiotemporal Distribution Characteristics of Invigorating/Deficiency Winds at Urban Scales

As noted earlier, the theory originated from climatic/astronomical patterns of ancient Central China. This study hypothesizes that the eastern Hu Line region aligns with the theory’s geographical premises. However, climatic and astronomical cycles exhibit asynchrony. For instance, southern China may experience spring blooms while northeast China remains snow-covered. Thus, meteorologically defined seasonal onset dates diverge from astronomical seasonal commencements (start of spring/summer/autumn/winter). Per Chinese national standard Climatic Season Division (QX/T152-2012) [37], the country is classified into regions with distinct/mild seasons based on the following:
Spring onset: 5 consecutive days with daily average temperature > 10 °C;
Summer onset: 5 consecutive days >22 °C;
Autumn onset: 5 consecutive days <22 °C;
Winter onset: 5 consecutive days <10 °C.
Meteorologist Song Yingjie mapped China’s meteorologically defined seasonal distributions during eight solar terms in the book Twenty-Four Solar Terms Chronicles, as shown in Figure 4 [18].
For Shenyang, Xi’an, and Changsha, meteorologically defined seasonal commencement dates were derived, with equinoxes/solstices calculated via equidistant division between adjacent commencements, generating region-specific eight solar term dates (Table 1).
Table 1 demonstrates significant deviations between meteorological solar term dates and their astronomical counterparts. This study asserts that deficiency wind pathogenicity correlates with actual climatic conditions, necessitating analyses based on meteorologically defined solar term dates.
Based on Table 1, new meteorologically defined nine palaces and eight winds diagrams for the three case cities were generated (Figure 5). Meteorological solar terms exhibit non-uniform temporal intervals, diverging from their original near-equal astronomical spacing.
Taking Shenyang (with the most pronounced solar term adjustments) as an example, meteorological parameters (temperature, relative humidity, and wind speed) under original and revised division principles were compared (Figure 6).
A comparative analysis of meteorological data between astronomical and meteorological solar term divisions in Shenyang revealed significant disparities concentrated in four seasonal nodes during winter and spring. For winter periods, the mean temperature during Start of Winter increased from −4.89 °C to −2.65 °C with an expanded standard deviation from 5.61 °C to 8.08 °C, while Winter Solstice exhibited a pronounced temperature rise from −8.4 °C to −0.78 °C accompanied by increased standard deviation from 6.05 °C to 7.76 °C, collectively indicating enhanced winter warming trends and amplified climatic instability post-adjustment. In spring seasons, Start of Spring demonstrated a temperature surge from 2.2 °C to 13.61 °C alongside reduced standard deviation from 7.32 °C to 4.91 °C, with mean wind speed increasing from 3.05 m/s to 3.44 m/s and its standard deviation rising from 1.87 m/s to 2.61 m/s. Similarly, Spring Equinox showed temperature elevation from 9.88 °C to 19.45 °C with decreased standard deviation from 5.67 °C to 4.65 °C, coupled with reduced mean wind speed from 3.53 m/s to 3.20 m/s and diminished standard deviation from 2.33 m/s to 1.76 m/s. These comprehensive findings demonstrate that the meteorological division better aligns with the region’s characteristic “warm and windy” spring climate patterns, substantiating the enhanced climatic representational capacity achieved through dynamic solar term recalibration. Notably, abrupt meteorological parameter shifts during seasonal transitions (e.g., temperature fluctuations) frequently trigger environmental instability, coinciding with both health risk escalation and deficiency wind prevalence. The temperature-centric meteorological solar term division method, by quantifying climatic mutation thresholds, substantially enhances the objectivity of deficiency wind identification.
Therefore, under the premise that the eastern Hu Line region aligns with the geographical adaptability of the Nine Palaces and Eight Winds theory, reconstructing solar term dates according to meteorological season division principles achieves organic integration of traditional cultural paradigms and modern climate science (Question 1).

3.2. Impact of Invigorating/Deficiency Wind Dominance Ratios on Intra-Cycle Climatic Stability

The theory integrates seasons (temporal) with cardinal directions, using solar terms as observation days to predict normal/abnormal weather. Timely wind/rain on these days indicates invigorating wind dominance, suggesting stable climatic conditions in the subsequent solar term cycle. Conversely, abnormal weather dominated by deficiency wind implies less moderate conditions in the following cycle. Using Typical Meteorological Year data, this study summarizes the invigorating/deficiency wind ratios calculated for the case cities (Shenyang, Xi’an, Changsha) on the day of the Eight Solar Terms, using the astronomical and meteorological division methods, as compiled in Table 2. Based on Table 2, Summer Solstice (blue-highlighted, high invigorating wind ratio) and Spring Equinox (green-highlighted, high deficiency wind ratio) were selected to analyze temperature/humidity variations over the subsequent month (Figure 7).
Figure 7 shows greater temperature/relative humidity fluctuations during deficiency wind-dominant periods compared to invigorating wind phases. Statistical analysis of standard deviations demonstrated significant variations in temperature and relative humidity parameters, with Shenyang exhibiting an 80% higher temperature differential between the Start of Spring and Summer Solstice with 58% relative humidity, Xi’an showing minimal thermal variation at 4% accompanied by 29% humidity, and Changsha registering a pronounced 142% temperature contrast coupled with 64% humidity, respectively. The post-Spring Equinox period displayed broader temperature variability than the post-Summer Solstice, with interquartile range (IQR) increases of 64.4% in Shenyang, 60.0% in Xi’an, and 66.1% in Changsha. Simultaneously, relative humidity ranges (max–min) expanded by 32.5%, 113.2%, and 23.4% in these cities, respectively. However, typical meteorological year data exclude extreme climate years, creating discrepancies with real observations, necessitating further investigation.
For Question 2 (“Does invigorating/deficiency wind dominance on solar term days predict climatic stability in subsequent cycles?”), analysis of typical meteorological year data revealed deficiency wind dominance (e.g., Spring Equinox) correlates with significantly larger temperature/humidity fluctuations within the following month than invigorating wind periods (e.g., Summer Solstice), suggesting lower climatic stability. This conclusion is limited by data sample size and the smoothing effect of typical meteorological year data on extreme climates, requiring validation with real-time observations.

3.3. Spatiotemporal Distribution and Pathogenic Patterns of Invigorating/Deficiency Winds During Solar Term Cycles

To explore environmental parameter responses under invigorating/deficiency wind patterns and their spatiotemporal links to disease incidence, Xi’an (warm-temperate semi-humid climate) and Changsha (subtropical humid climate) were selected as comparative study areas.
A 2025 doctoral thesis by our team [38] summarized disease-prone periods in both cities (Table 3).
Based on identified key solar term periods, this study selected typical meteorological year (TMY) data and 2024 observational datasets to systematically compare meteorological characteristics of invigorating/deficiency winds during three critical solar term cycles. The analysis focused on quantifying deficiency wind impacts on temperature, humidity, and wind speed. Comparative deficiency wind ratios for these periods are shown in Table 4, with detailed results for Changsha and Xi’an presented in Table 5 and Table 6, respectively. If the relative coefficient of a parameter is positive, it indicates that the parameter tends to increase when deficiency wind occurs, while a negative value suggests the opposite trend. The R2 value represents the explanatory power of deficiency wind regarding this phenomenon.
Analysis of TMY deficiency wind ratios in key solar term cycles reveals that, except for Changsha’s Start of Spring (SS: 11.7%), all other periods exceeded the directional average (12.5%). This elevated prevalence may correlate with locally documented disease-prone intervals.
Analysis of Table 5 reveals distinct deficiency wind patterns during Winter Solstice (WS), Start of Spring (SS), and Summer Solstice (SSu) in Changsha under TMY and 2024 conditions.
For Winter Solstice in TMY. Deficiency winds showed a strong positive correlation with temperature (ρ = 0.651 **, R2 = 42.4%), indicating southward deficiency winds induced cooling. Concurrently, they negatively correlated with relative humidity (ρ = −0.426 **) but positively with absolute humidity (ρ = 0.384 **), suggesting increased total moisture with reduced humidity. Wind speed exhibited minimal impact (ρ = 0.084).
The 2024 data mirrored TMY trends despite lower deficiency wind ratios (8.6% vs. 15.3%) and higher climatic stability, implying potential health impacts linked to deficiency wind prevalence during WS.
For Start of Spring in TMY. Weak positive correlations were observed between deficiency winds and temperature (ρ = 0.175 *) and wind speed (ρ = 0.144 *). However, no significant associations emerged in 2024, likely due to transitional seasonal complexity. Detailed investigations are required to clarify potential deficiency wind–health linkages during this period. Detailed investigations are required to clarify potential deficiency wind–health linkages during this period.
For Summer Solstice in TMY. Deficiency winds are strongly correlated with temperature decline (ρ = −0.476 **, R2 = 22.7%), alongside rising relative humidity (ρ = 0.373 **) and reduced wind speed (ρ = −0.188 *). Conversely, 2024 data showed significant wind speed enhancement (ρ = 0.465 **).
Analysis of Table 6 reveals the following patterns of deficiency wind-meteorological parameter correlations in Xi’an under TMY and 2024 conditions:
For Winter Solstice in TMY. Deficiency winds showed a significant negative correlation with temperature (ρ = −0.455 **, R2 = 20.7%), indicating cooling effects. Weak correlations with relative humidity (ρ = 0.067) and wind speed (ρ = −0.073), but strong negative correlation with absolute humidity (ρ = −0.462 **, R2 = 21.3%), suggesting dry air advection. In 2024, contrasting TMY trends, deficiency winds positively correlated with temperature (ρ = 0.254 **, R2 = 6.5%) and absolute humidity (ρ = 0.116 *, p = 0.036), while negatively with relative humidity (ρ = −0.231 **, R2 = 5.3%). Wind speed showed a weak positive correlation (ρ = 0.221 **, R2 = 4.9%), indicating anomalous climatic behavior.
For Start of Spring in TMY. No significant correlations with temperature (ρ = −0.038) or absolute humidity (ρ = −0.034). Positive correlation with relative humidity (ρ = 0.217 **, R2 = 4.7%) implied dry air masses. Significant negative wind speed correlation (ρ = −0.263 **, R2 = 6.9%). In 2024, weak negative temperature correlation (ρ = −0.180 **, R2 = 3.2%), positive relative humidity (ρ = 0.271 **, R2 = 7.3%), and absolute humidity (ρ = 0.187 **, R2 = 3.5%) links. Strong wind speed negative correlation (ρ = −0.465 **, R2 = 21.6%).
For Summer Solstice in TMY. Moderate negative temperature correlation (ρ = −0.231 **, R2 = 5.3%), weak positive relative humidity link (ρ = 0.199 **, R2 = 4.0%), and insignificant absolute humidity effects. Wind speed showed marginal positive correlation (ρ = 0.181 **, R2 = 3.3%). In 2024, no significant correlations between deficiency winds and any meteorological parameters (p > 0.05).
The 2024 anomalies (e.g., positive temperature–deficiency wind correlation during WS) highlight potential extreme climate disruptions, necessitating mechanistic validation through real-time monitoring.
This section integrates our research findings on disease-prone climatic periods in case cities Changsha and Xi’an, investigating the ratios and differential impacts of invigorating/deficiency winds during key solar term cycles. During Winter Solstice and Summer Solstice, both cities exhibited significant spatial-temporal differences in deficiency winds, primarily manifested through temperature-humidity variations. However, wind direction showed limited explanatory power for climatic parameter divergences during transitional seasons. Overall, applying the solar term division principles, this study confirms measurable differences between invigorating/deficiency winds in locally sensitive disease-prone periods. Nevertheless, unresolved questions remain regarding whether other wind directions exhibit similar disparities, geospatial interpretations of these patterns, and pathogenic mechanisms—all requiring further research.

4. Discussion

4.1. Epidemiological Validation of Regional Climate Classification Principles

To validate the alignment between meteorologically defined solar terms and peak morbidity periods in the case study city. The research conducted a systematic review of epidemiological data from case cities. For Shenyang, the study by Ye et al. identified a marked seasonal pattern in influenza prevalence from December to May [39]. While Ye et al. categorized this period as Shenyang’s “winter-spring transition”, our analysis redefines December to April as the Winter Solstice solar term cycle, during which D-wind predominance is climatologically significant. These findings robustly validate both the climate-adaptive solar term division framework and the hypothesized pathogenic linkage of D-wind dominance. An epidemiological study on respiratory infections corroborated this conclusion, reporting higher viral positivity rates from December to May [40]. For Changsha, a study on respiratory syncytial virus (RSV) in Hunan Province revealed that its primary epidemic period spans from late October to late April, encompassing late autumn, winter, and early spring [41]. According to the meteorological division based on eight solar terms, this timeframe closely aligns with three key solar terms: Start of Winter, Winter Solstice, and Spring Equinox. This correlation suggests that integrating solar term-based temporal classification frameworks could enhance the precision of defining seasonal disease distribution patterns for epidemiological surveillance. Such a methodology may provide a more systematic approach to delineating cyclical transmission dynamics of respiratory pathogens. For Xi’an, the elevated mortality rate from respiratory diseases in Xi’an, predominantly observed during December, January, and February [42], demonstrates substantial temporal alignment with the meteorological demarcation of Start of Winter to Winter Solstice in the traditional Chinese solar term system. Comparative analysis reveals that the eight-solar-term framework, grounded in meteorological principles, demonstrates superior spatiotemporal congruence with regionally endemic disease cycles compared to the conventional four-season classification system.

4.2. Seasonal Characteristics and Synergistic Climatic Effects of Deficiency Wind in Case Cities

Analysis of typical meteorological year data in Changsha and Xi’an reveals significant associations between deficiency wind events and climatic parameter anomalies. In Changsha’s Winter Solstice cycles, deficiency wind periods showed positive temperature correlation and negative correlation with relative humidity. Prior studies indicate that rising temperatures and declining humidity enhance virus survivability and transmissibility [43]. This aligns temporally with respiratory disease peaks (1 January–18 April) in Changsha. During Changsha’s Summer Solstice, deficiency winds correlated negatively with temperature, positively with relative humidity, and negatively with wind speed. High humidity environments have been linked to joint pain exacerbation [44]. Notably, most deficiency wind periods in both cities exhibited weak single-parameter explanations (R2 < 0.2), suggesting health risks arise from synergistic effects of temperature-humidity-wind speed co-variations rather than isolated factors. Traditional Chinese Medicine describes a “Bi syndrome” [45] caused by combined wind-temperature-humidity effects, characterized by rheumatism-like joint pain. A meta-analysis review notes contradictory conclusions in weather-health symptom associations [46], partly attributable to heterogeneous climate exposure classification methods. The invigorating/deficiency wind framework’s spatiotemporal division principles may offer new insights for such studies. The same review also cites three studies rejecting wind direction-pain associations [46]. However, the invigorating/deficiency wind spatiotemporal framework provides a novel perspective to re-examine this issue. Identical wind directions may exhibit divergent health impacts during deficiency vs. non-deficiency wind periods.

4.3. Limitation and Future Works

4.3.1. Limitation

The Nine Palaces and Eight Winds theory delineates a complex pathway through which natural forces influence human health. Theoretically, it proposes a unique astronomical-climatic temporal classification distinct from temperature-based frameworks, integrating cardinal direction-seasonal wind linkages and mechanisms of health impacts from climate-counteractive winds. Individual susceptibility and variability to deficiency wind effects remain underexplored in contemporary environmental health studies. Modern urban wind environments (e.g., building-induced microclimates) introduce multifactorial influences absent in ancient flat terrains, complicating indoor natural ventilation applications.
From the aspect of context in the research, limitations include Typical Meteorological Year data smoothing extreme events (e.g., Xi’an’s 2024 Summer Solstice deficiency wind ratio: 43.2%, +12.1% vs. TMY), necessitating extended observational validation of threshold stability. TMY’s smoothing effect may underestimate true health risks, as seen in Xi’an’s 2024 Winter Solstice temperature polarity reversal (ρ shift from −0.455 to 0.254), indicating non-linear climatic tipping points. Lack of single-year granular data (e.g., epidemiological records, pollutant concentrations) constrained detailed correlative analysis.

4.3.2. Future Work

This study preliminarily validated and quantified disease causation perspectives in Traditional Chinese Medicine (TCM), revealing extensive future research opportunities.
First, geographical analysis could refine region-specific definitions of invigorating/deficiency winds. Second, meteorology-TCM interdisciplinary studies should decode coupling mechanisms between solar term periodicity and deficiency wind pathogenicity in localized climates. Epidemiological cohort studies could establish exposure–response relationship maps linking deficiency wind spatiotemporal parameters (onset phase, duration, intensity gradients) to seasonal disease peaks, particularly focusing on dual fluctuations in solar term and diurnal cycles. Finally, building microenvironment features should inform active ventilation strategies based on invigorating/deficiency wind patterns. Integrating these traditional paradigms may create actionable interdisciplinary interfaces for dynamic threshold calibration in health-oriented architectural design. Addressing these challenges will reshape synergistic development pathways between cultural heritage and technological innovation in human settlement sciences.

5. Conclusions

The research integrates the invigorating/deficiency wind theory from the Nine Palaces and Eight Winds framework, employing theoretical and experimental methods to validate meteorological data sources for wind classification, reconcile meteorological seasons with astronomical solar terms, and analyze indoor hygrothermal regulation mechanisms and human comfort impacts under invigorating/deficiency winds. Key conclusions are as follows:
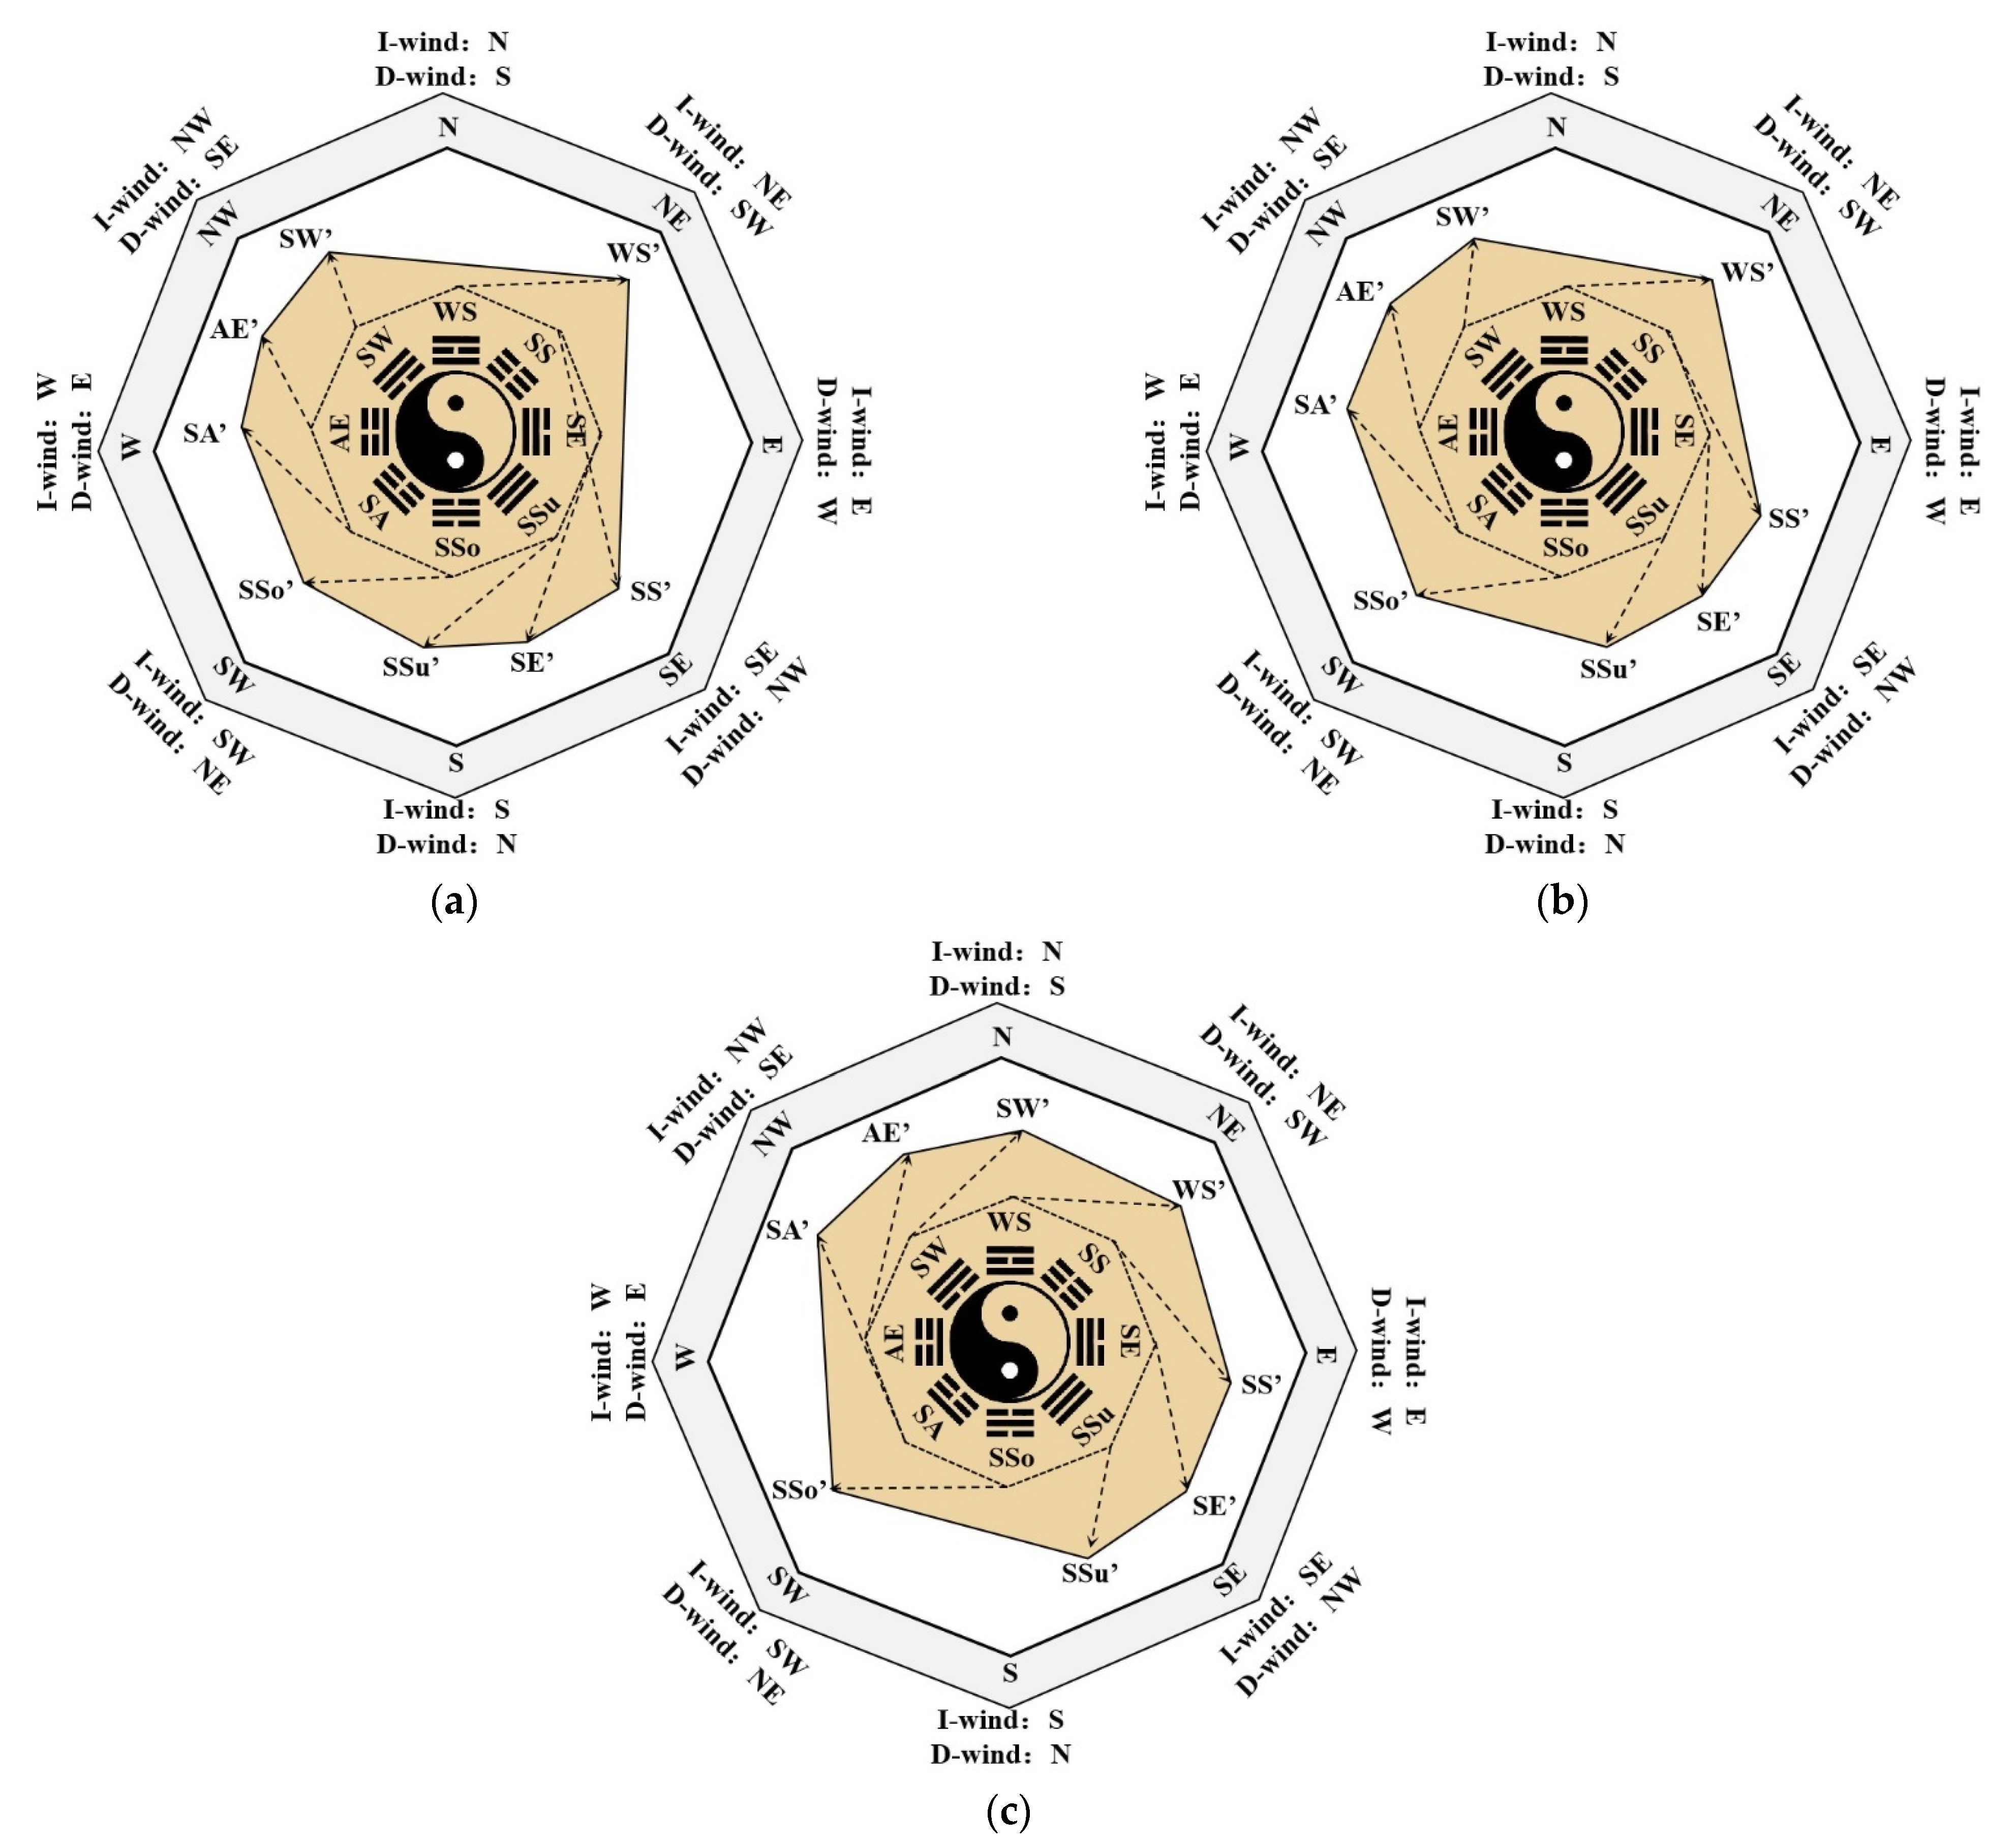
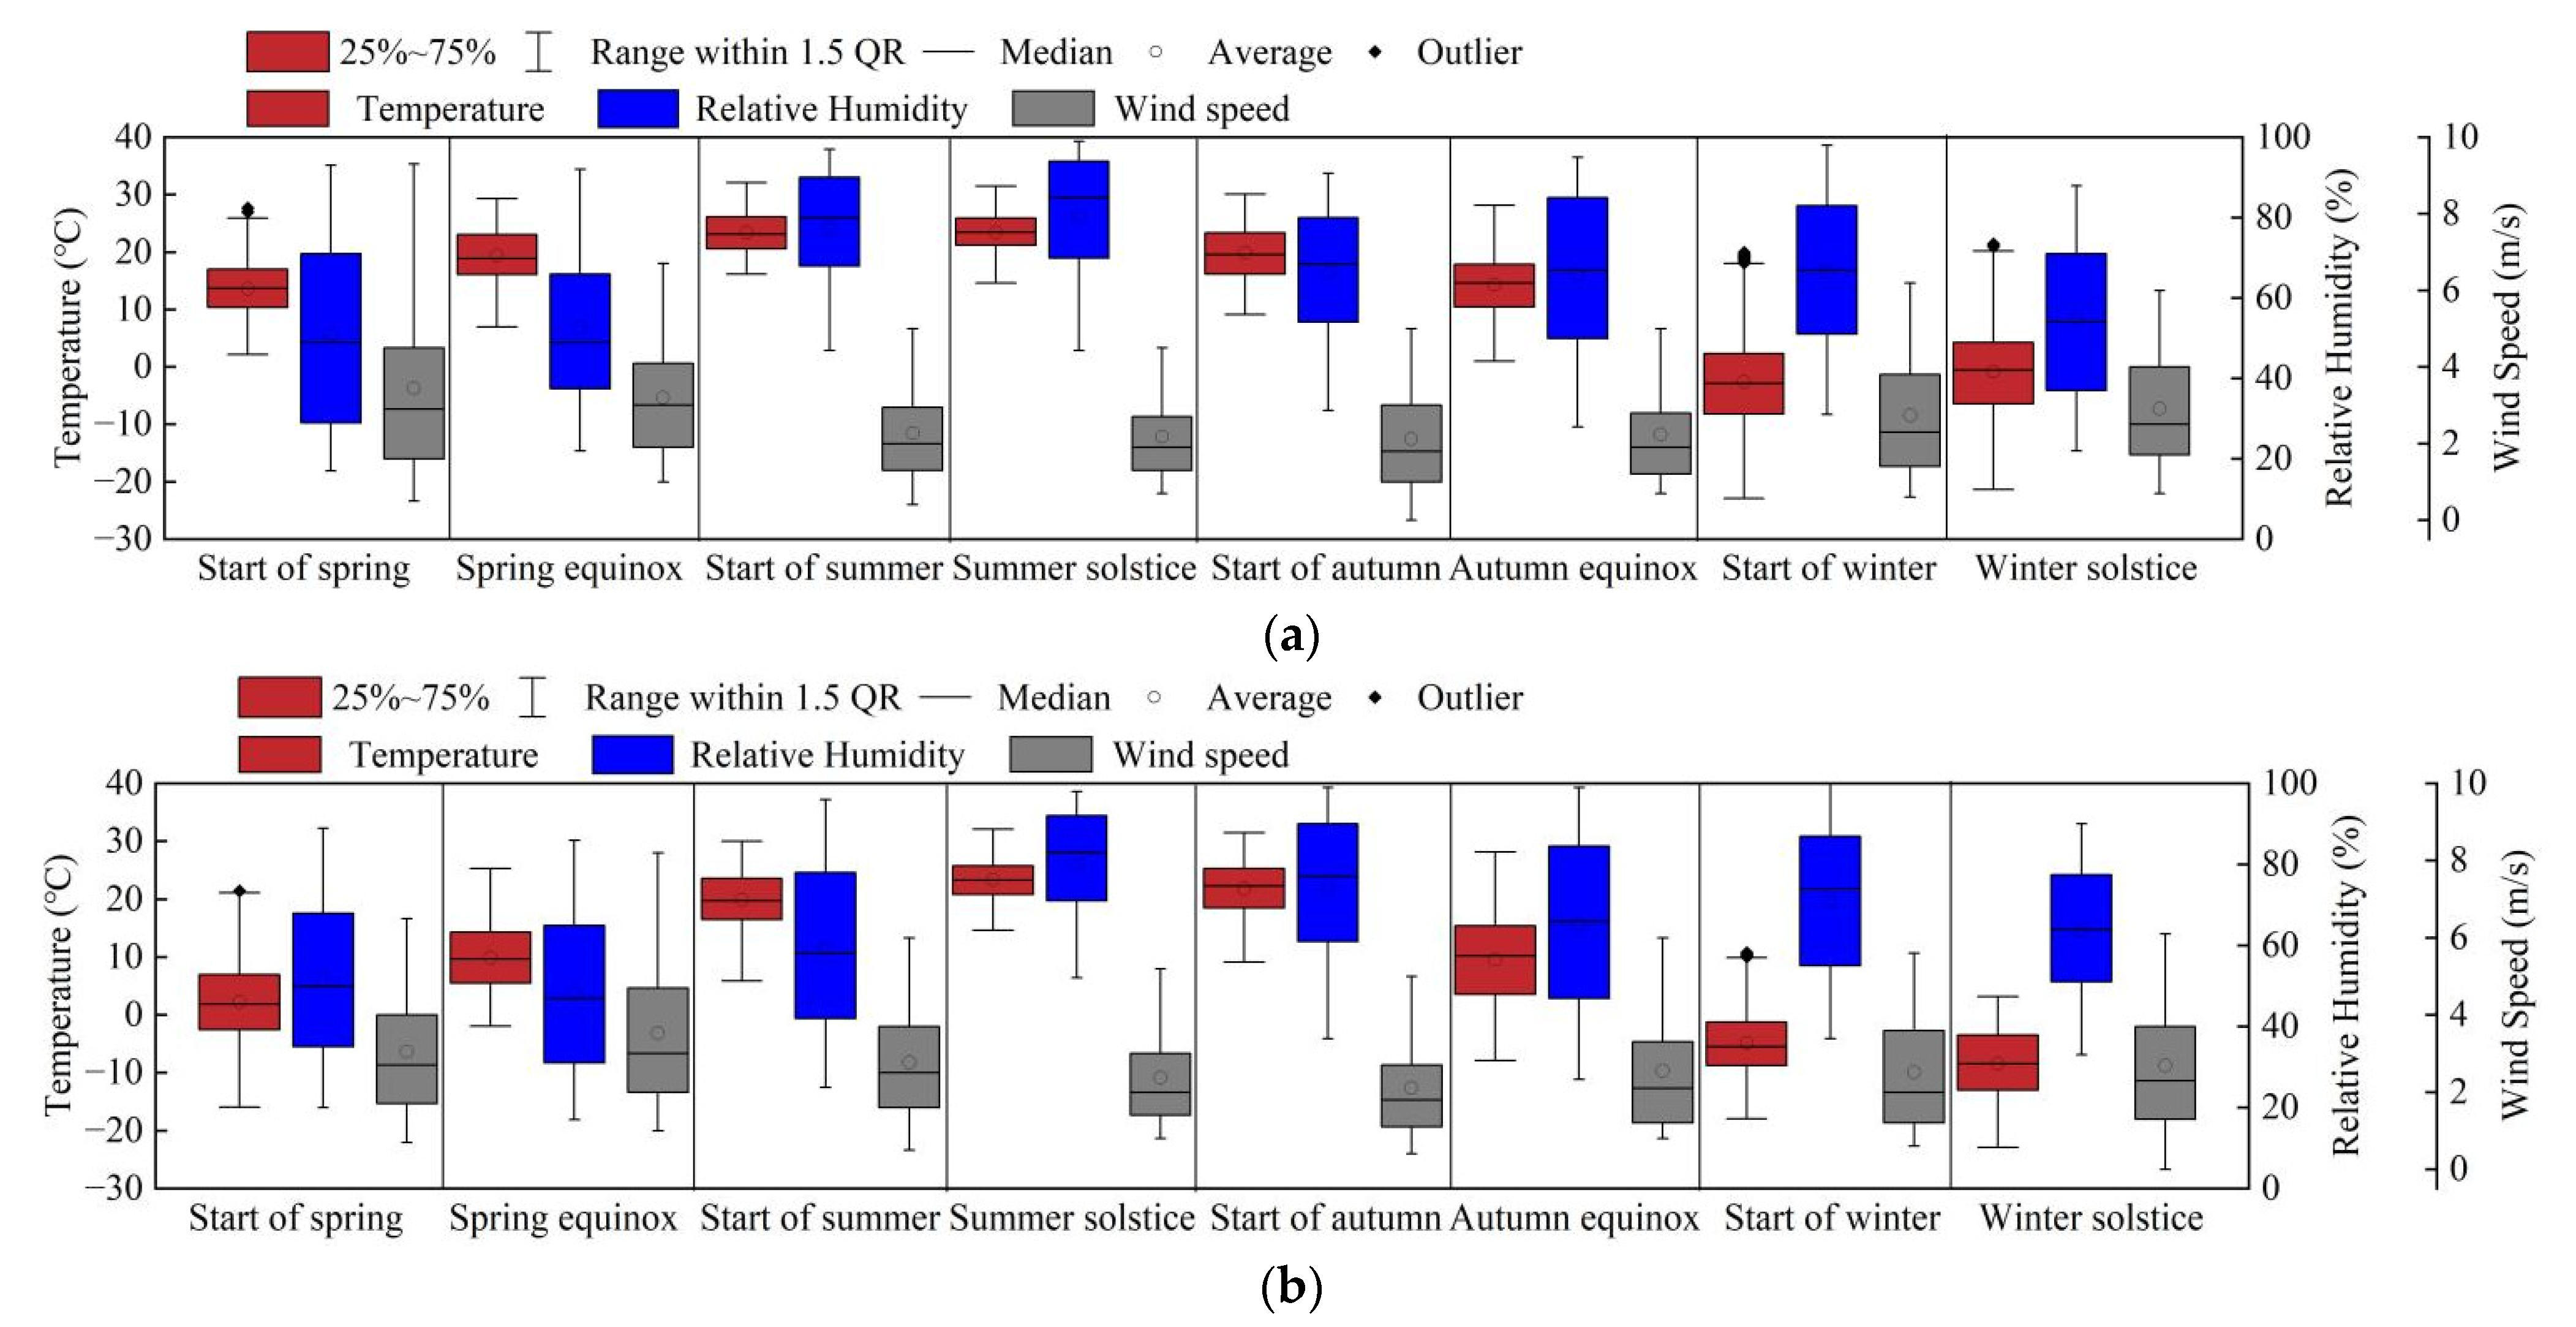
  • Question 1: Meteorological season division methods revealed nationwide spatial distributions of eight solar terms and four seasons, visualized through new Nine Palaces and Eight Winds diagrams for the representative cities of Shenyang, Xi’an, and Changsha. Significant offsets between meteorological season onsets and astronomical “Four Commencements” necessitate locally adaptive strategies for applying the theory’s pathogenic principles. For instance, Shenyang’s “meteorological Start of Spring” (14 April) exhibited a 70-day delay compared to the term date (4 February). During this period, the average temperature increased from 2.2 °C to 13.6 °C, with wind speed variability expanding by %. These observations align more closely with the climatic characteristics of Northeast China.
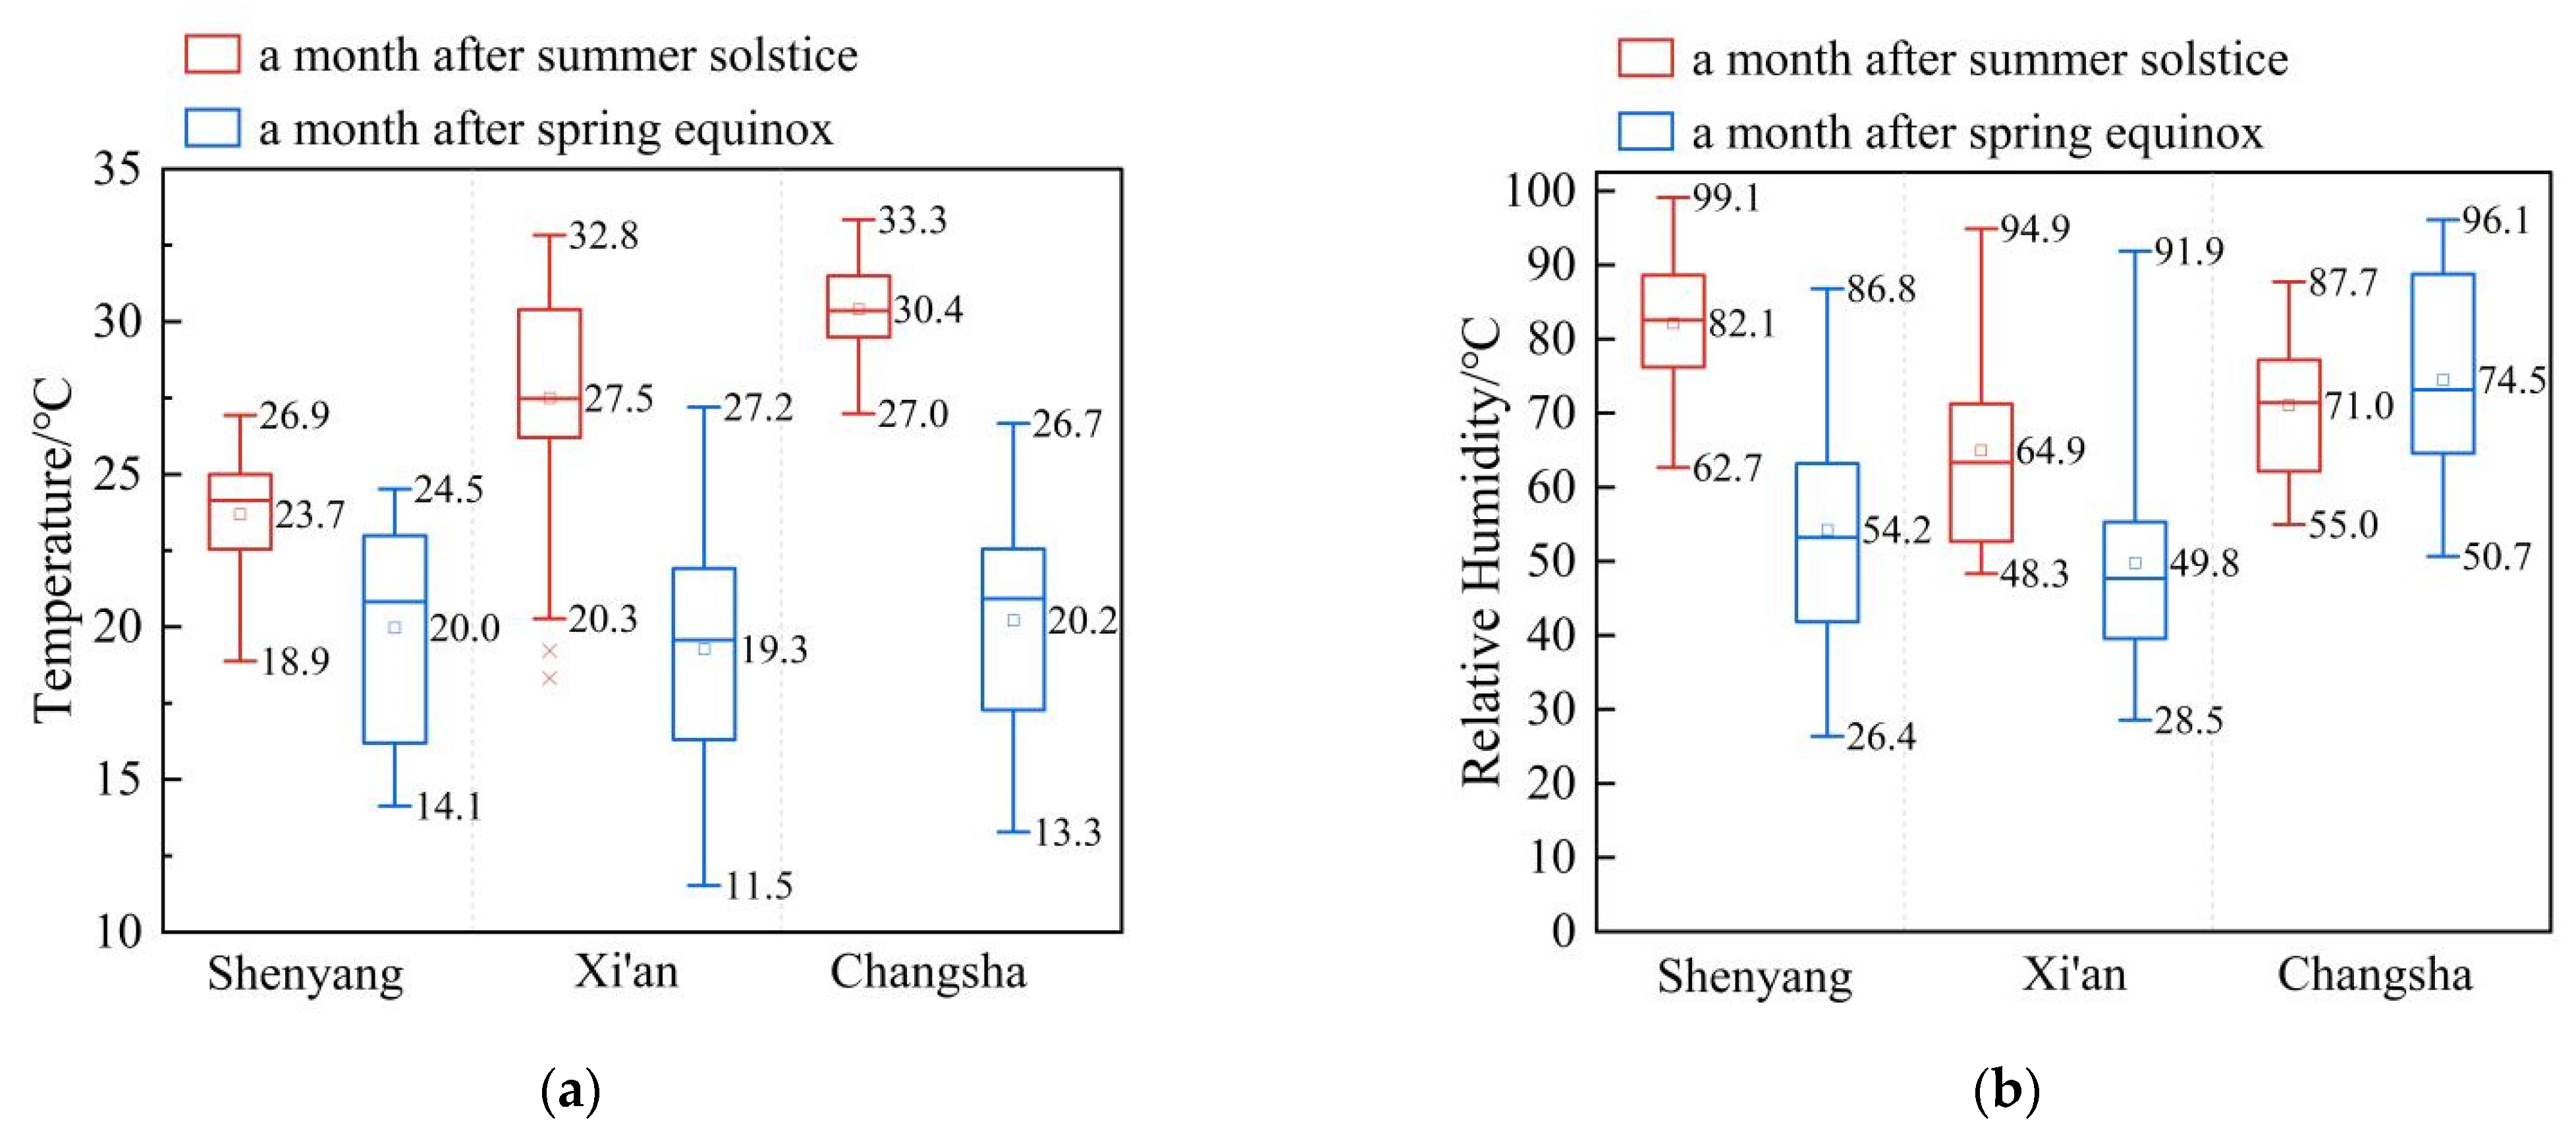
  • Question 2: Deficiency wind-dominant periods exhibited significantly greater temperature and humidity fluctuations compared to invigorating wind phases in three Chinese cities (Shenyang, Xi’an, Changsha). An average 63.5% increase in temperature IQR across the three cities (Shenyang: +64.4%, Xi’an: +60.0%, Changsha: +66.1%), alongside a peak 113.2% surge in relative humidity range (Xi’an). However, discrepancies arising from the exclusion of extreme climate years in typical meteorological year data necessitate further investigation.
  • Question 3: Cross-climate comparisons identified unique couplings: Changsha’s Winter Solstice deficiency winds created high-temperature/high-humidity conditions, predisposing the population to respiratory diseases. This phenomenon demonstrates a potential spatiotemporal overlap with the region’s peak incidence period of respiratory diseases (1 January to 18 April). Xi’an’s Winter Solstice deficiency winds showed low-temperature/low-humidity exposure. Changsha’s Summer Solstice combined low temperature/high humidity with wind speed disequilibrium, offering quantitative guidelines for climate-responsive architectural design.
This study pioneers a thermal comfort assessment framework incorporating spatiotemporal heterogeneity while establishing deficiency wind-driven active control strategies for natural ventilation systems, synergizing traditional climate adaptation wisdom with modern building science. The findings of this study are to encourage more exploration in the previously ignored wind characteristic of direction, i.e., invigorating/deficiency winds, and will enhance the understanding of the dynamics feature of naturally ventilated environments.

Author Contributions

Conceptualization, S.X., J.D. and B.C.; data curation, S.X. and J.D.; formal analysis, S.X. and J.D.; funding acquisition, J.D. and B.C.; investigation, S.X. and J.D.; methodology, S.X., J.D. and B.C.; project administration, B.C.; resources, S.X., J.D. and B.C.; supervision, B.C.; validation, S.X. and J.D.; visualization, S.X. and J.D.; writing—original draft, S.X. and J.D.; writing—review and editing, S.X., J.D. and B.C. All authors have read and agreed to the published version of the manuscript.

Funding

This research was funded by the National Natural Science Foundation of China, grant number 51978121, and Fundamental Research Funds for the Central Universities, grant number DUT23RC(3)036.

Data Availability Statement

The Typical Meteorological Year (TMY) datasets presented in this article are not readily available because the data are derived from a non-public database. Requests to access the datasets should be directed to the sources cited within this article. However, the real-time meteorological database are publicly available and it was cited in this article.

Conflicts of Interest

The authors declare no conflicts of interest.

References

  1. Jarrahi, A.; Aflaki, A.; Khakpour, M.; Esfandiari, M. Enhancing indoor air quality: Harnessing architectural elements, natural ventilation and passive design strategies for effective pollution reduction—A comprehensive review. Sci. Total Environ. 2024, 954, 176631. [Google Scholar] [CrossRef]
  2. Ma, Q.; Qian, G.; Yu, M.; Li, L.; Wei, X. Performance of Windcatchers in Improving Indoor Air Quality, Thermal Comfort, and Energy Efficiency: A Review. Sustainability 2024, 16, 9039. [Google Scholar] [CrossRef]
  3. Jiang, Z.; Kobayashi, T.; Yamanaka, T.; Sandberg, M. A literature review of cross ventilation in buildings. Energy Build. 2023, 291, 113143. [Google Scholar] [CrossRef]
  4. Ma, N.; Aviv, D.; Guo, H.; Braham, W.W. Measuring the right factors: A review of variables and models for thermal comfort and indoor air quality. Renew. Sustain. Energy Rev. 2021, 135, 110436. [Google Scholar] [CrossRef]
  5. Jendritzky, G.; De, D.R.; Havenith, G. UTCI—Why another thermal index? Int. J. Biometeorol. 2012, 56, 421–428. [Google Scholar] [CrossRef] [PubMed]
  6. Chenari, B.; Dias Carrilho, J.O.; Manuel, G.D.S. Towards sustainable, energy-efficient and healthy ventilation strategies in buildings: A review. Renew. Sustain. Energy Rev. 2016, 59, 1426–1447. [Google Scholar] [CrossRef]
  7. Zhong, H.-Y.; Sun, Y.; Shang, J.; Qian, F.-P.; Zhao, F.-Y.; Kikumoto, H.; Jimenez-Bescos, C.; Liu, X. Single-sided natural ventilation in buildings: A critical literature review. Build. Environ. 2022, 212, 108797. [Google Scholar] [CrossRef]
  8. Zhu, Y.; Luo, M.; Ouyang, Q.; Huang, L.; Cao, B. Dynamic characteristics and comfort assessment of airflows in indoor environments: A review. Build. Environ. 2015, 91, 5–14. [Google Scholar] [CrossRef]
  9. Xie, Z.; Cao, B.; Zhu, Y. A novel wind comfort evaluation method for different airflows by considering dynamic characteristics of wind direction and velocity. Build. Environ. 2023, 246, 110976. [Google Scholar] [CrossRef]
  10. Sakiyama, N.; Carlo, J.; Jürgen, F.; Garrecht, H. Perspectives of naturally ventilated buildings: A review. Renew. Sustain. Energy Rev. 2020, 130, 109933. [Google Scholar] [CrossRef]
  11. Lai, B.; Fu, J.M.; Guo, C.K.; Zhang, D.Y.; Wu, Z.G. Street Geometry Factors Influencing Outdoor Pedestrian Thermal Comfort in a Historic District. Buildings 2025, 15, 613. [Google Scholar] [CrossRef]
  12. Ma, C.; Chen, Y.; Gao, W.; Liu, B. Optimization of Landscape Spatial Configuration and Form for Thermal Comfort: A Case Study of Urban Square, Shanghai. Atmosphere 2023, 14, 1357. [Google Scholar] [CrossRef]
  13. Kobza, J.; Dul, L.; Geremek, M. The influence of NOx, temperature, wind and total radiation on the level of ozone concentration in the Upper Silesian agglomeration. Front. Public Health 2024, 12, 1485333. [Google Scholar] [CrossRef] [PubMed]
  14. Lv, Y.; Wang, X.D.; Liu, D. Predicting environmental pollutants in the apartment public space: Evaluating the impact of spatial enclosure and monitoring locations. Urban Clim. 2025, 59, 102277. [Google Scholar] [CrossRef]
  15. Song, X.C.; Zhang, Y.; Zhang, G.X.; Zhao, Y. Factors evaluation of PM2.5 diffusion in street canyons in Dalian based on numerical simulation. Build. Simul. 2025, 18, 619–639. [Google Scholar] [CrossRef]
  16. Cooke, L.J.; Rose, M.S.; Becker, W.J. Chinook winds and migraine headache. Neurology 2000, 54, 302–307. [Google Scholar] [CrossRef]
  17. Fletcher, R.J. “Fhn illness” and human biometeorology in the Chinook area of Canada. Int. J. Biometeorol. 1988, 32, 168–175. [Google Scholar] [CrossRef]
  18. Song, Y. Twenty-Four Solar Terms: Chinese Wisdom in Natural Rhythm; CITIC Press: Beijing, China, 2017. (In Chinese) [Google Scholar]
  19. Zhang, Q. Zhang Qicheng’s Complete Interpretation of Huangdi Neijing: Su Wen; Huaxia Press: Beijing, China, 2021. (In Chinese) [Google Scholar]
  20. Li, M. Research on the Medical Meteorological Foundations and Application Models of the Nine Palaces and Eight Winds in Huangdi Neijing. Ph.D. Thesis, Guangzhou University of Chinese Medicine, Guangzhou, China, 2023. (In Chinese). [Google Scholar]
  21. Yu, H. Research on the Nine Palaces and Eight Winds in Huangdi Neijing. Ph.D. Thesis, Beijing University of Chinese Medicine, Beijing, China, 2023. (In Chinese). [Google Scholar]
  22. Cheng, Z. A Comprehensive History of Chinese Astronomy; Shanghai People’s Press: Shanghai, China, 2016. (In Chinese) [Google Scholar]
  23. Wang, X.; Zhai, J. On Divination Methods, the Eight Trigrams, and the Luo Shu: Post-reading Notes on the ‘Nine Palaces and Eight Winds’ Chapter of the Lingshu Jing. Zhouyi Res. 1990, 2, 21–30. (In Chinese) [Google Scholar]
  24. Chang, L. A Study on the “Zangqi Fa Shi” (Visceral Qi Synchronicity with Seasonal Rhythms) Thought in Huangdi Neijing. Ph.D. Thesis, Beijing University of Chinese Medicine, Beijing, China, 2007. (In Chinese). [Google Scholar]
  25. Zhang, C. A Brief Discussion on the Chapter “Nine Palaces and Eight Winds”. Shanxi J. Tradit. Chin. Med. 1985, 1, 7–10. (In Chinese) [Google Scholar] [CrossRef]
  26. Zhou, D. Clinical Implications of the Nine Palaces and Eight Winds Theory in Stroke. J. Chin. Med. Lit. 2007, 1, 33–35. (In Chinese) [Google Scholar]
  27. Xu, S.; Chen, B.; Fan, X.; Song, X.; Wang, S. Scientific Interpretation and Empirical Study of Wind Environment Descriptions in Architectural Classics. Refrig. Air Cond. 2020, 34, 289–296. (In Chinese) [Google Scholar]
  28. Liu, X.; Li, Z. Yellow Emperor’s Canon of Medicine Spiritual Pivot (English-Chinese Bilingual Edition); Xi’an World Book Publishing Corporation: Xi’an, China, 2008. [Google Scholar]
  29. Tang, Y.; Zhang, B.; Gao, Y. Discussion on the Theory of Harmony Between Heaven and Human in “Xu Xie Zei Feng (Deficient Pathogenic Winds)” Based on Lingshu: Nine Palaces and Eight Winds. China J. Tradit. Chin. Med. Pharm. 2021, 36, 1331–1334. (In Chinese) [Google Scholar]
  30. Li, J.; Lu, D.; Xu, C.; Li, Y.; Chen, M. Spatial Differentiation and Dynamics of Population Distribution Across the Hu Line (Heihe-Tengchong Line). Acta Geogr. Sin. 2017, 72, 148–160. (In Chinese) [Google Scholar]
  31. Jiang, F.; Wu, X. The Basic Characteristics of the Three-Step Topography in Mainland China. Mar. Geol. Quat. Geol. 1993, 3, 15–24. (In Chinese) [Google Scholar] [CrossRef]
  32. Morabito, M.; Modesti, P.A.; Cecchi, L.; Crisci, A.; Orlandini, S.; Maracchi, G.; Gensini, G.F. Relationships between weather and myocardial infarction: A biometeorological approach. Int. J. Cardiol. 2005, 105, 288–293. [Google Scholar] [CrossRef] [PubMed]
  33. Zhao, N.; Cao, G.; Vanos, J.K.; Vecellio, D.J. The effects of synoptic weather on influenza infection incidences: A retrospective study utilizing digital disease surveillance. Int. J. Biometeorol. 2018, 62, 69–84. [Google Scholar] [CrossRef]
  34. Li, H.; Huang, J.; Hu, Y.; Wang, S.; Liu, J.; Yang, L. A new TMY generation method based on the entropy-based TOPSIS theory for different climatic zones in China. Energy 2021, 231, 120723. [Google Scholar] [CrossRef]
  35. RP5 Meteorological Service. Reliable Prognosis (RP5) Weather Archive. Available online: https://rp5.ru (accessed on 10 November 2024).
  36. IBM SPSS Statistics for Windows; IBM: Armonk, NY, USA, 2020.
  37. QX/T 152-2012; Climatic Season Classification. China Meteorological Administration: Beijing, China, 2012.
  38. Deng, J. Dynamic Indoor Climate Regulation Across Time Scales: Bridging Climate Variability and Epidemic Resilience. Ph.D. Thesis, Dalian University of Technology, Dalian, China, 2025. Not Published. [Google Scholar]
  39. Chen, Y.; Leng, K.; Lu, Y.; Wen, L.; Qi, Y.; Gao, W.; Chen, H.; Bai, L.; An, X.; Sun, B.; et al. Epidemiological features and time-series analysis of influenza incidence in urban and rural areas of Shenyang, China, 2010–2018. Epidemiol. Infect. 2020, 148, e29. [Google Scholar] [CrossRef]
  40. Zhang, T.; Zhao, Z.; Feng, C.; Meng, Y. Epidemiological analysis of common viruses causing acute respiratory infections in children in Shenyang area. J. Pathog. Biol. 2023, 18, 1315–1319. [Google Scholar]
  41. Xie, L.; Wang, T.; Yu, T.; Hu, X.; Yang, L.; Zhong, L.; Zhang, B.; Zeng, S. Seasonality of respiratory syncytial virus infection in children hospitalized with acute lower respiratory tract infections in Hunan, China, 2013–2022. Virol. J. 2024, 21, 62. [Google Scholar] [CrossRef]
  42. Mokoena, K.K.; Ethan, C.J.; Yu, Y.; Shale, K.; Liu, F. Ambient air pollution and respiratory mortality in Xi’an, China: A time-series analysis. Respir. Res. 2019, 20, 139. [Google Scholar] [CrossRef] [PubMed]
  43. Wolkoff, P.; Azuma, K.; Carrer, P. Health, work performance, and risk of infection in office-like environments: The role of indoor temperature, air humidity, and ventilation. Int. J. Hyg. Environ. Health 2021, 233, 113709. [Google Scholar] [CrossRef] [PubMed]
  44. Dorleijn, D.M.J.; Luijsterburg, P.A.J.; Burdorf, A.; Rozendaal, R.M.; Verhaar, J.A.N.; Bos, P.K.; Bierma-Zeinstra, S.M.A. Associations between weather conditions and clinical symptoms in patients with hip osteoarthritis: A 2-year cohort study. Pain 2014, 155, 808–813. [Google Scholar] [CrossRef] [PubMed]
  45. Zhang, E.Q. Bi Syndrome (Arthralgia Syndrome). J. Tradit. Chin. Med. 2010, 30, 145–152. [Google Scholar] [CrossRef]
  46. Beukenhorst, A.L.; Schultz, D.M.; McBeth, J.; Sergeant, J.C.; Dixon, W.G. Are weather conditions associated with chronic musculoskeletal pain? Review of results and methodologies. Pain 2020, 161, 668–683. [Google Scholar] [CrossRef]
Figure 1. Nine palaces and eight winds diagram. (a) Relationships between cardinal directions, solar terms, and invigorating/deficiency winds; (b) internal/external harm caused by various deficiency winds.
Buildings 15 01422 g001
Figure 2. The research questions, methods, and data of this study (illustration by the author).
Buildings 15 01422 g002
Figure 3. Flowchart of the statistical methodology for differential analysis.
Buildings 15 01422 g003
Figure 4. Nationwide distribution map of meteorologically defined seasons during eight solar terms [18].
Buildings 15 01422 g004
Figure 5. New nine palaces and eight winds diagram. (a) Shenyang; (b) Xi’an; (c) Changsha.
Buildings 15 01422 g005
Figure 6. Comparison of meteorological parameters in Shenyang: (a) under meteorological divisions; (b) under astronomical solar term divisions.
Buildings 15 01422 g006
Figure 7. Temperature and humidity variations in case cities one month after Summer Solstice (invigorating wind) and Spring Equinox (deficiency wind) based on typical meteorological year data. (a) Temperature. (b) Relative Humidity.
Buildings 15 01422 g007
Table 1. Summary table of meteorologically defined eight solar term dates for Shenyang, Xi’an, and Changsha cities.
CityStart of SpringSpring EquinoxStart of SummerSummer SolsticeStart of AutumnAutumn EquinoxStart of WinterWinter Solstice
Baseline
Date
4 February20 March6 May21 June8 August23 September8 November22 December
Shenyang14 April12 May9 June20 July30 August25 September21 October16 January
Xi’an21 March18 April16 May11 July5 September5 October4 November12 January
Changsha5 March6 April8 May20 July1 October31 October2 December18 January
Table 2. Summary of invigorating/deficiency wind ratios (%) for case cities under astronomical (T) and meteorological (Q) solar term divisions.
TypeCityMethodInvigorating/Deficiency Wind Ratios (%)
SSSESSuSSoSAAESWWS
I-windShenyangT54.24.20.029.28.38.30.00.0
Q4.20.00.04.20.00.08.38.3
Xi’anT0.00.00.08.34.20.00.00.0
Q0.00.00.08.30.00.020.80.0
ChangshaT0.08.34.225.00.00.00.00.0
Q4.20.020.820.88.34.20.00.0
D-WindShenyangT0.04.20.00.00.04.24.28.3
Q4.266.70.00.025.016.70.012.5
Xi’anT0.00.08.30.016.74.20.00.0
Q0.025.04.28.325.00.00.00.0
ChangshaT4.212.516.70.00.00.012.50.0
Q0.025.00.00.00.08.30.00.0
Note: T-astronomical division, Q-meteorological division; Green-highlighted: deficiency wind-dominant terms; Blue-highlighted: invigorating wind-dominant terms. SS for Start of Spring, SE for Spring Equinox, SSu for Start of Summer, SSo for Summer Solstice, SA for Start of Autumn, AE for Autumn Equinox, SW for Start of Winter, WS for Winter Solstice.
Table 3. Disease-prone periods and associated solar terms in Changsha and Xi’an [38].
CityKey PeriodsDisease TypesSolar TermsCityKey PeriodsDisease TypesSolar Terms
Changsha1 January–18 AprilRespiratory,
Cardiovascular
Winter Solstice,
Start of Spring
Xi’an26 January–15 AprilCardiovascularWinter Solstice,
Start of Spring
1–31 January,
1 March–18 April
Dermatological26 January–31 MarchRespiratory,
Dermatological
14 July–20 AugustDigestive,
Dermatological
Summer Solstice1 March–15 AprilDigestive
14–31 JulyRespiratory,
Cardiovascular
27–31 JulyCardiovascularSummer Solstice
Table 4. Deficiency wind ratios in TMY and 2024 data for key solar term cycles.
CityData TypeWinter SolsticeStart of SpringSummer Solstice
ChangshaSolar Term Period19 January–5 March5 March–6 April20 July–1 October
TMY Deficiency Ratio15.3%11.7%19.8%
2024 Deficiency Ratio8.6%8.4%28.8%
Xi’anSolar Term Period19 January–21 March21 March–18 April11 July–5 September
TMY Deficiency Ratio14.4%21.3%31.1%
2024 Deficiency Ratio4.2%16.2%43.2%
Table 5. Correlation analysis of deficiency winds and meteorological parameters in Changsha.
Solar TermsPrameterTemperatureRelative HumidityAbsolute HumidityWind Speed
Data SourceTMY2024TMY2024TMY2024TMY2024
Winter Solstice
(19 January~5 March)
Relative coefficients0.651 **0.547 **0.426 **0.451 **0.384 **0.451 **−0.084−0.157
R20.4240.2990.1810.2030.1470.2030.0070.025
Start of Spring
(3.5 March~6 April)
Relative coefficients0.175 **−0.260−0.0550.0880.1130.0200.144 *−0.064
R20.0300.0680.0030.0080.0130.0000.0210.004
Summer Solstice
(20 July~1 October)
Relative coefficients0.476 **0.516 **0.373 **0.347 **0.276 **−0.0700.188 **0.465 **
R20.2270.0000.1390.1200.0760.0050.0350.216
Note: Spearman’s ρ = correlation coefficient; R2 = coefficient of determination; * p < 0.05; ** p < 0.01 (two-tailed). The bold indicate significant associations.
Table 6. Correlation analysis of deficiency winds and meteorological parameters in Xi’an.
Solar TermsParameterTemperatureRelative HumidityAbsolute HumidityWind Speed
Data SourceTMY2024TMY2024TMY2024TMY2024
Winter Solstice
(19 January~21 March)
Relative coefficients0.455 **0.254 **0.0670.231 **0.462 **0.116 *−0.0730.221 **
R20.2070.0650.0040.0530.2130.0130.0050.049
Start of Spring
(21 March~18 April)
Relative coefficients−0.0380.180 **0.217 **0.271 **−0.0340.187 **0.263 **0.465 **
R20.0460.0320.0470.0730.0430.0350.0690.216
Summer Solstice
(11 July~5 September)
Relative coefficients0.231 **−0.0110.199 **0.009−0.0790.0690.181 **0.070
R20.0530.0000.0400.0000.0060.0050.0330.005
Note: Spearman’s ρ = correlation coefficient; R2 = coefficient of determination; * p < 0.05; ** p < 0.01 (two-tailed). The bold indicate significant associations.
Disclaimer/Publisher’s Note: The statements, opinions and data contained in all publications are solely those of the individual author(s) and contributor(s) and not of MDPI and/or the editor(s). MDPI and/or the editor(s) disclaim responsibility for any injury to people or property resulting from any ideas, methods, instructions or products referred to in the content.

