Article

Seismic Performance Analysis of Middle Column Joints with T-Stub Steel Connections Considering Cumulative Damage

1
Hubei Key Laboratory of Theory and Application of Advanced Materials Mechanics, Wuhan University of Technology, Wuhan 430070, China
2
Henan International Joint Laboratory of New Civil Engineering Structure, Luoyang Institute of Science and Technology, Luoyang 471023, China
*
Authors to whom correspondence should be addressed.
Buildings 2025, 15(9), 1429; https://doi.org/10.3390/buildings15091429
Submission received: 21 March 2025 / Revised: 8 April 2025 / Accepted: 17 April 2025 / Published: 24 April 2025
(This article belongs to the Section Building Structures)

Abstract

:
In this paper, the quasi-static reciprocating loading test was carried out for the T-stub steel middle column joints with blind-bolt connections. As the thickness of the T-stub steel increased, the damage failure modes were different. The load–displacement curve, cumulative energy dissipation, equivalent viscous damping coefficient, damage index and other characteristics of the joints were analysed. When T-stub steel was used as a connector, its thickness affected the damage development mode. As the thickness of T-stub steel increased, the bearing capacity and plastic displacement were improved, the energy dissipation capacity was significantly increased, and the rotational stiffness retention ability of the joint was improved, but the damage index value was not significantly increased. Finally, the damage index and the rotational stiffness degradation coefficient under each loading level were numerically fitted, and the polynomial and exponential rotational stiffness models were established, taking into account the damage index. These two models took into account the reduction in rotational stiffness caused by damage under each level of load, and the rotational stiffness under each loading level could be obtained from the damage index and the initial rotational stiffness.

1. Introduction

Under the action of seismic load, the brittle failure of welding can be avoided when the joints are connected by bolts. The stiffness and strength of bolted joints lie between those of fully rigid joints and hinged joints [1,2]. When comparing and analysing the plane beam–column joints with different forms of bolt connections, it was found that the plastic deformation of T-shaped steel connection joints is larger, and the energy dissipation capacity is stronger [3]. At the same time, it was found that the seismic performance of the strong axis connection between the T-shaped steel flange and the H-shaped steel column flange is much better than that of the weak axis connection between the T-shaped steel flange and the H-shaped steel web [4]. The steel tube column is adopted to avoid the problem that the mechanical properties of the strong axis and the weak axis are too different. However, when assembling the beam–column joints, the multi-section steel tube column is spliced by the through-bolt, or the hole on the steel tube column wall is tightened by the ordinary bolt, which makes the assembly process complicated. Therefore, in this paper, the high-strength bolts in the T-shaped steel connection column are replaced by unilateral bolts, which is convenient for unilateral fastening during the initial installation, and also convenient for the re-assembly of the replacement parts when the local damage of the later joint needs to be replaced. At the same time, it ensures that the mechanical properties of the joints in different directions are not much different.
Before the unilateral bolt is applied to the beam–column connection node, it is ensured that its own tensile performance and shear performance meet the engineering requirements. Different types of unilateral bolts have different mechanical properties. Regarding the Hollo-bolt unilateral bolt, Tizani et al. [5] and Amin et al. [6,7] carried out tensile tests on it and on the improved unilateral bolt, respectively. In the proposed initial stiffness model, the expansion deformation stiffness of the casing limb and the tensile stiffness of the bolt rod are considered. Regarding the unilateral bolt fastened with threads, Liu et al. [8,9] proposed the tensile strength bearing capacity under two failure modes: hole thread failure and flange yielding with hole thread failure. In the parameter analysis, it was found that the ratio of bolt diameter to column wall thickness, pre-tightening force and flange width affect the failure mode and mechanical performance [10,11,12,13]. Wang [14] deduced the yield-bearing capacity of four failure modes in the tensile test of T-head square-neck unilateral bolt connections. Regarding the Ajax one-side bolt and its improved form, Yao et al. [15] believed that its tensile bearing capacity and stiffness are comparable to those of welding. When it is used as a shear connector in concrete, its average shear bearing capacity is 12% higher than that of ordinary bolts [16,17]. The shear performance of the thread-fixed unilateral bolt with an elliptical bolt head can reach the theoretical value [18,19]. In this paper, nested unilateral bolts are used. When the bolts and sleeves are shear fractured, the shear bearing capacity is three times higher than the nominal shear strength [20]. It can be seen from the above that when the tensile and shear properties of unilateral bolts can be fully utilised, the mechanical properties of unilateral bolts are no less than those of standardised high-strength bolts, and the rapid connection between closed assembled components can be realised. Its mechanical properties are related to factors such as connectors, column walls and bolt positions.
The joints show good bending resistance when using different types of blind-bolted steel beam–steel tube column connections. The component method proposed by Eurocode 3 [21] provides an idea of how to analyse the load-carrying capacity and rotational stiffness of bolted connections. The bending moment–bearing capacity and rotational stiffness of Hollo-bolt end-plate connections are influenced by the thickness and type of end plates [22]. Regarding the Ajax one-side bolted joints, Lee et al. [23] believed that if the thickness of the end plate was not more than 20 mm, increasing the thickness of the end plate could improve the stiffness of the joint. Above 20 mm, the stiffness of the joint is mainly determined by the flexibility of the cylindrical surface. The initial tensile stiffness of the joint is proposed, taking into account the tension of the blind bolt, the deflection of the T-stub steel end plate and the deflection of the column flange. In the case of the extended T-stub steel with back face support joints [24] and the grooved side plate blind-bolted beam-to-column joints [25], the thickness of the connecting plate and the friction between the connecting plate and the contact surface are considered to have a significant influence on the initial stiffness of the joints. Wang et al. [26] tested the threaded fixed blind-bolted joints. The blind-bolted plate and the H-shaped stiffener in the column help improve the initial stiffness. The former has no obvious effect on improving the yield bending moment and the ultimate bending moment. The yield bending moment and ultimate bending moment of the latter joint are higher than those of the ordinary-nut fixed bolt connection. Tahir et al. [27] carried out experimental and numerical studies on flush and extended end-plate joints of blind rotary bolt connections and improved the beam size and end plate thickness to significantly increase the connection stiffness and ultimate bending moment of the joint. Based on the T-type blind bolt proposed in reference [14], Sun et al. [28] believed that the slotted bolt hole in the vertical direction of the T-type blind-bolted end-plate connection (TOBC) is superior to the horizontal direction, and the gap between the filler block and the bolt hole does not affect the bending performance. Li et al. [29,30] developed the self-locking blind bolt and proposed the initial stiffness model of the self-locking end-plate joint. Wang et al. [31,32] conducted cyclic loading tests on the mid-column joints of slip-critical blind bolts with extended end-plate connections. Two failure modes, beam buckling and column buckling, were observed. There was a significant pinching phenomenon in the moment–rotation curve during the column buckling failure. The initial stiffness of the joints was significantly improved by the use of inner diaphragms, thickened column walls and filled concrete. Unilateral bolts are used in beam–column joints. The bending capacity and bending stiffness of the joints are worthy of attention. The thickness of the end plate, the thickness of the column wall, the size of the beam section, the length of the thread and the material properties determine the different damage and failure modes of the joints. This study found that the form of the connector is mostly the end plate, and the T-shaped steel connector is relatively uncommon. When nested unilateral bolts are applied to the beam–column joints, the existing literature is very limited. In short, the seismic performance of the joints connected by nested unilateral bolts and T-shaped steel needs to be further studied. A unified seismic design method has not been formed in the existing specifications.
Under the action of an earthquake, the damage to the structure accumulates as the number of load cycles increases, eventually leading to damage [33]. Park et al. [34] first proposed the damage index to evaluate the degree of damage development in reinforced concrete members. The damage index is represented by the letter D. Kumar et al. [35] considered that the damage does not occur before yielding, so Park’s damage model was modified. Behnamfar et al. [36] applied the model to evaluate the damage evolution of steel frames. Castiglioni et al. [37] evaluated welded beam–column joints with damage indices of energy, deformation and combined forms, respectively. It is considered that the cumulative energy reduction damage index model is more consistent with the actual phenomenon of the specimen, and its damage accumulation process is superior to all other damage models. Yu [38] considered that the degradation of stiffness and strength of the component is synchronous, which is basically consistent with the damage development process. The seismic damage model of the component is described by stiffness degradation and cumulative residual deformation.
In summary, Ajax one-side bolts, Hollo-hollo and thread-fixed blind bolts are more widely used in steel tube column–steel beam end-plate connection joints. From the perspective of analysing the stiffness, strength, deformation, ductility and other performance indicators of the connections under seismic loading exceeding the design limit for the first time, it is assumed that the whole structure is damaged. This process does not consider the influence of cumulative damage on structural performance, relying only on the deformation criteria outlined in China′s earthquake code. As a result, it may not fully guarantee the goal of ensuring repairability under moderate earthquakes and collapse prevention under major earthquakes. In addition, with regard to the steel structure, the main objects of damage assessment are welded joints and H-shaped steel column-H-shaped steel beam joints connected by ordinary bolts. Therefore, the mechanical performance analysis of nested blind-bolt T-stub steel connection joints under seismic loading, considering cumulative damage, is limited, especially in terms of evaluating the stiffness degradation of the joints from a damage perspective. Therefore, this paper takes the steel tube column-H-stub beam connection joints with nested blind bolts and T-stub steel as the research object. Based on the research on the seismic performance of the joint, the seismic performance of such prefabricated joints is evaluated from the perspective of damage accumulation, and the relationship between damage and joint stiffness degradation is explored. The main contents of the article are as follows. The second part introduces the test situation, including the design of the specimen, the mechanical properties of the material, the test device and the loading scheme. The third part describes the failure phenomenon of the specimen during the quasi-static test, and analyses the hysteretic behaviour, cumulative energy dissipation, equivalent viscous damping coefficient and rotational stiffness of the specimen. In the fourth part, the damage index of the middle column joint is calculated. Through curve fitting, two types of rotational stiffness degradation models, polynomial model and exponential model considering the damage index, are established and verified, which reflect the degree of stiffness degradation caused by seismic damage. The fifth part aims to summarise the seismic damage performance of the middle column joints of blind-bolted connections.

2. Test Overview

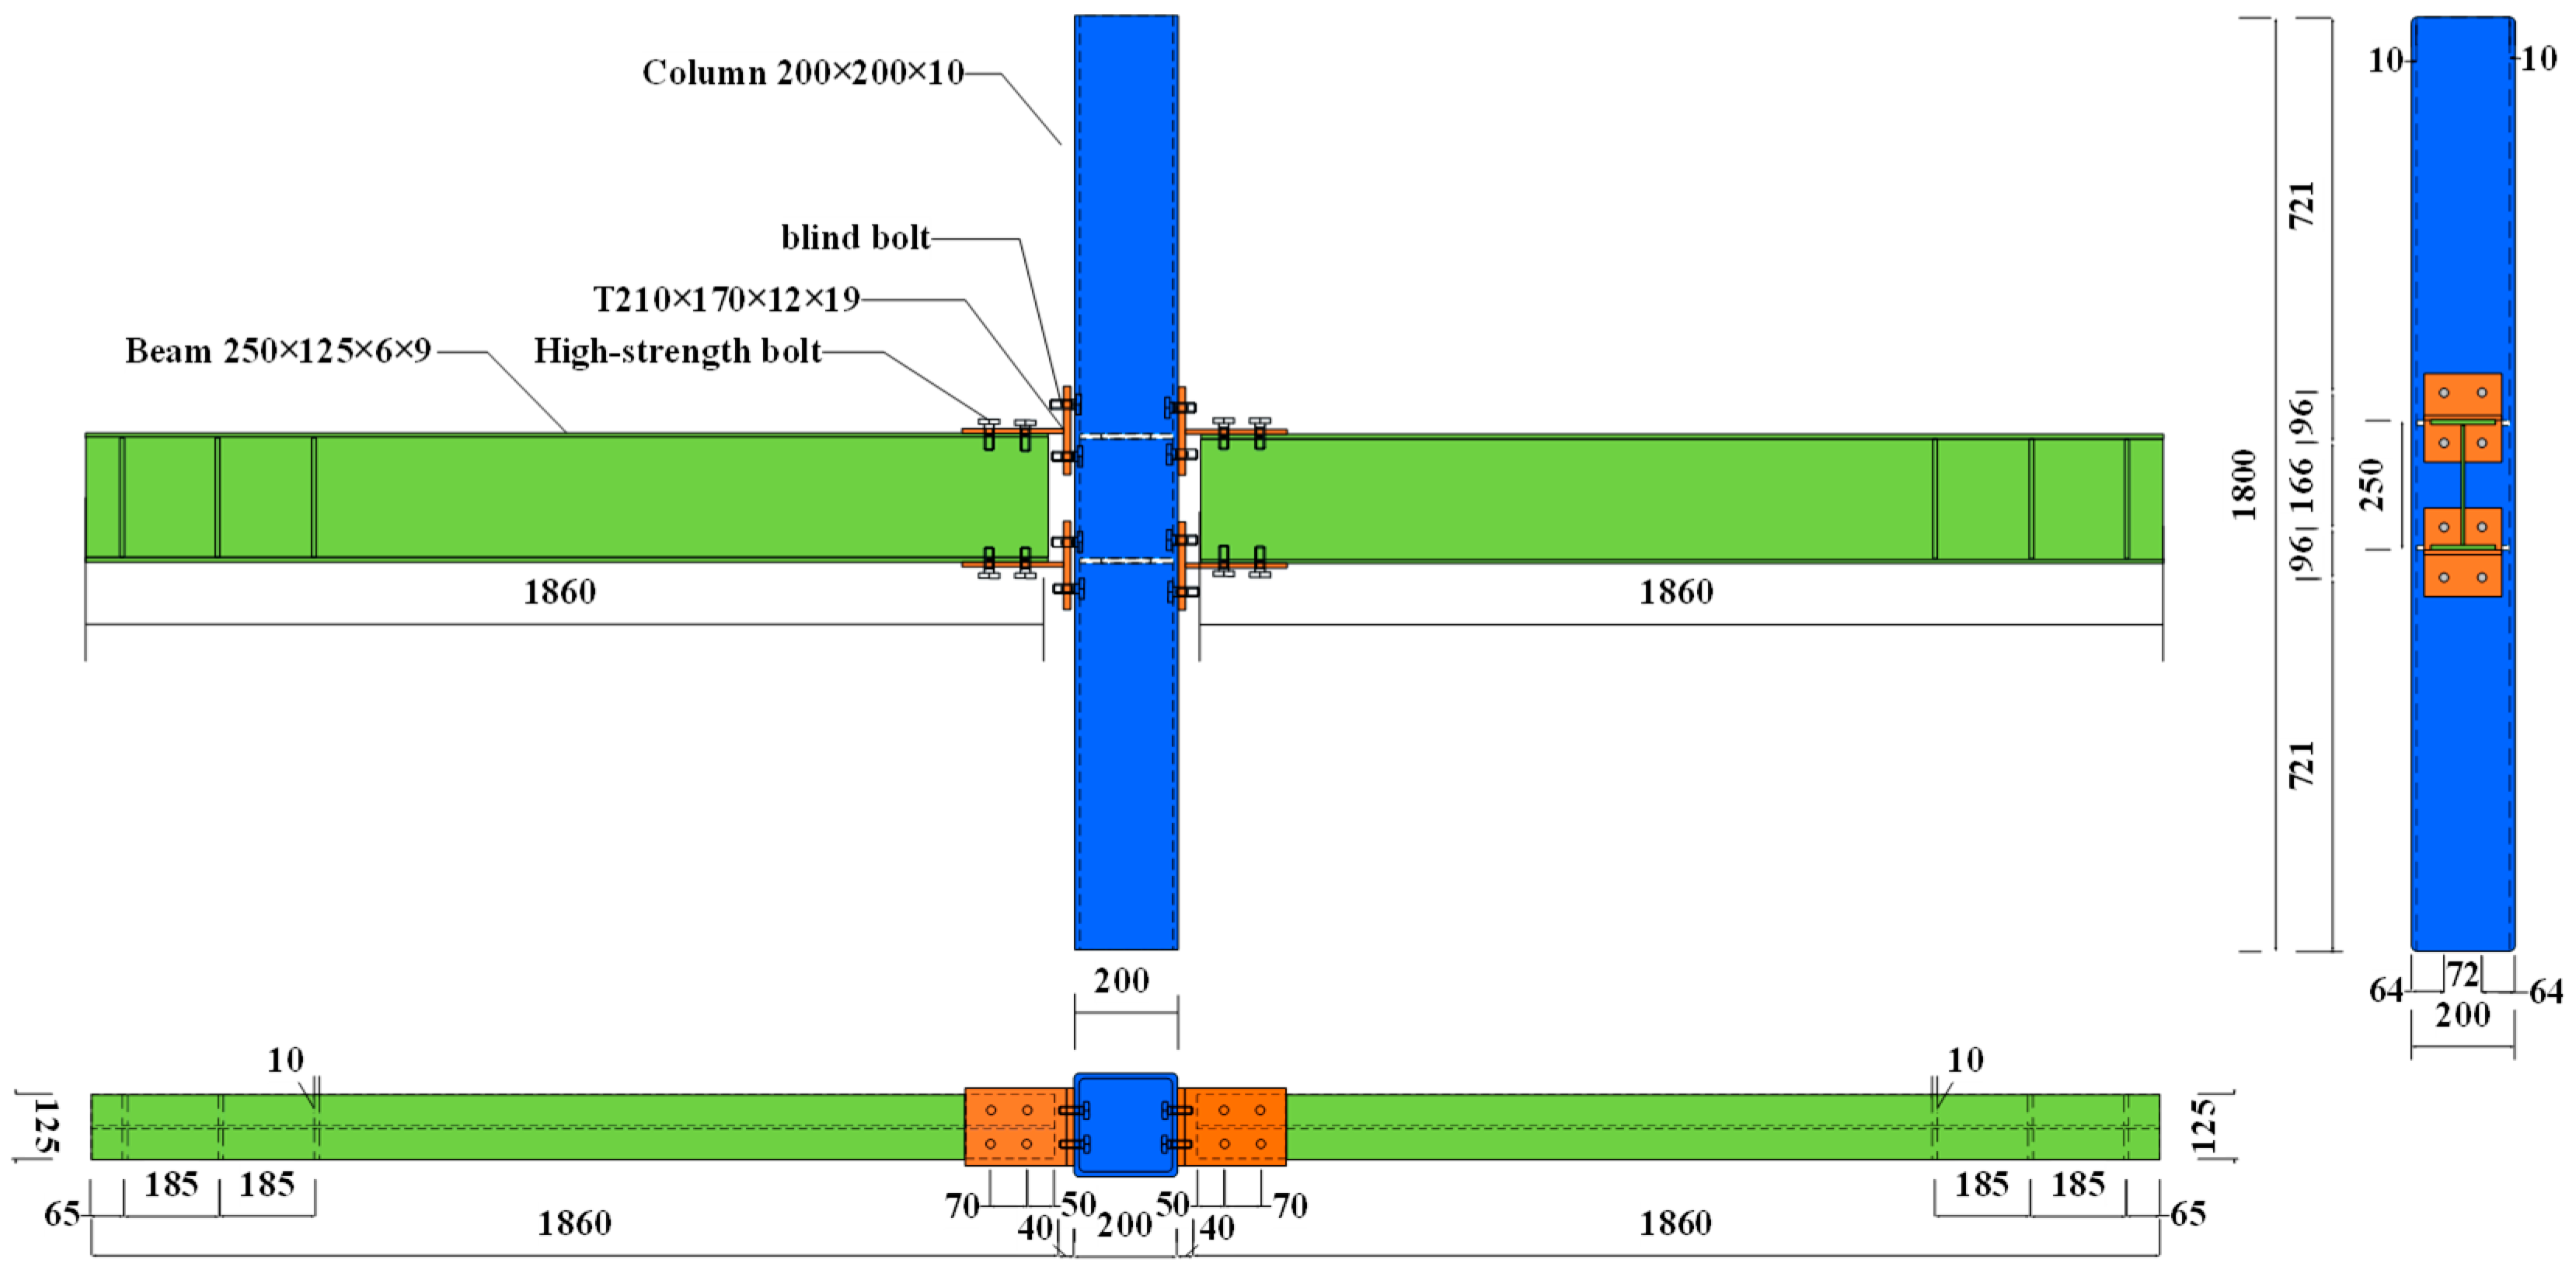
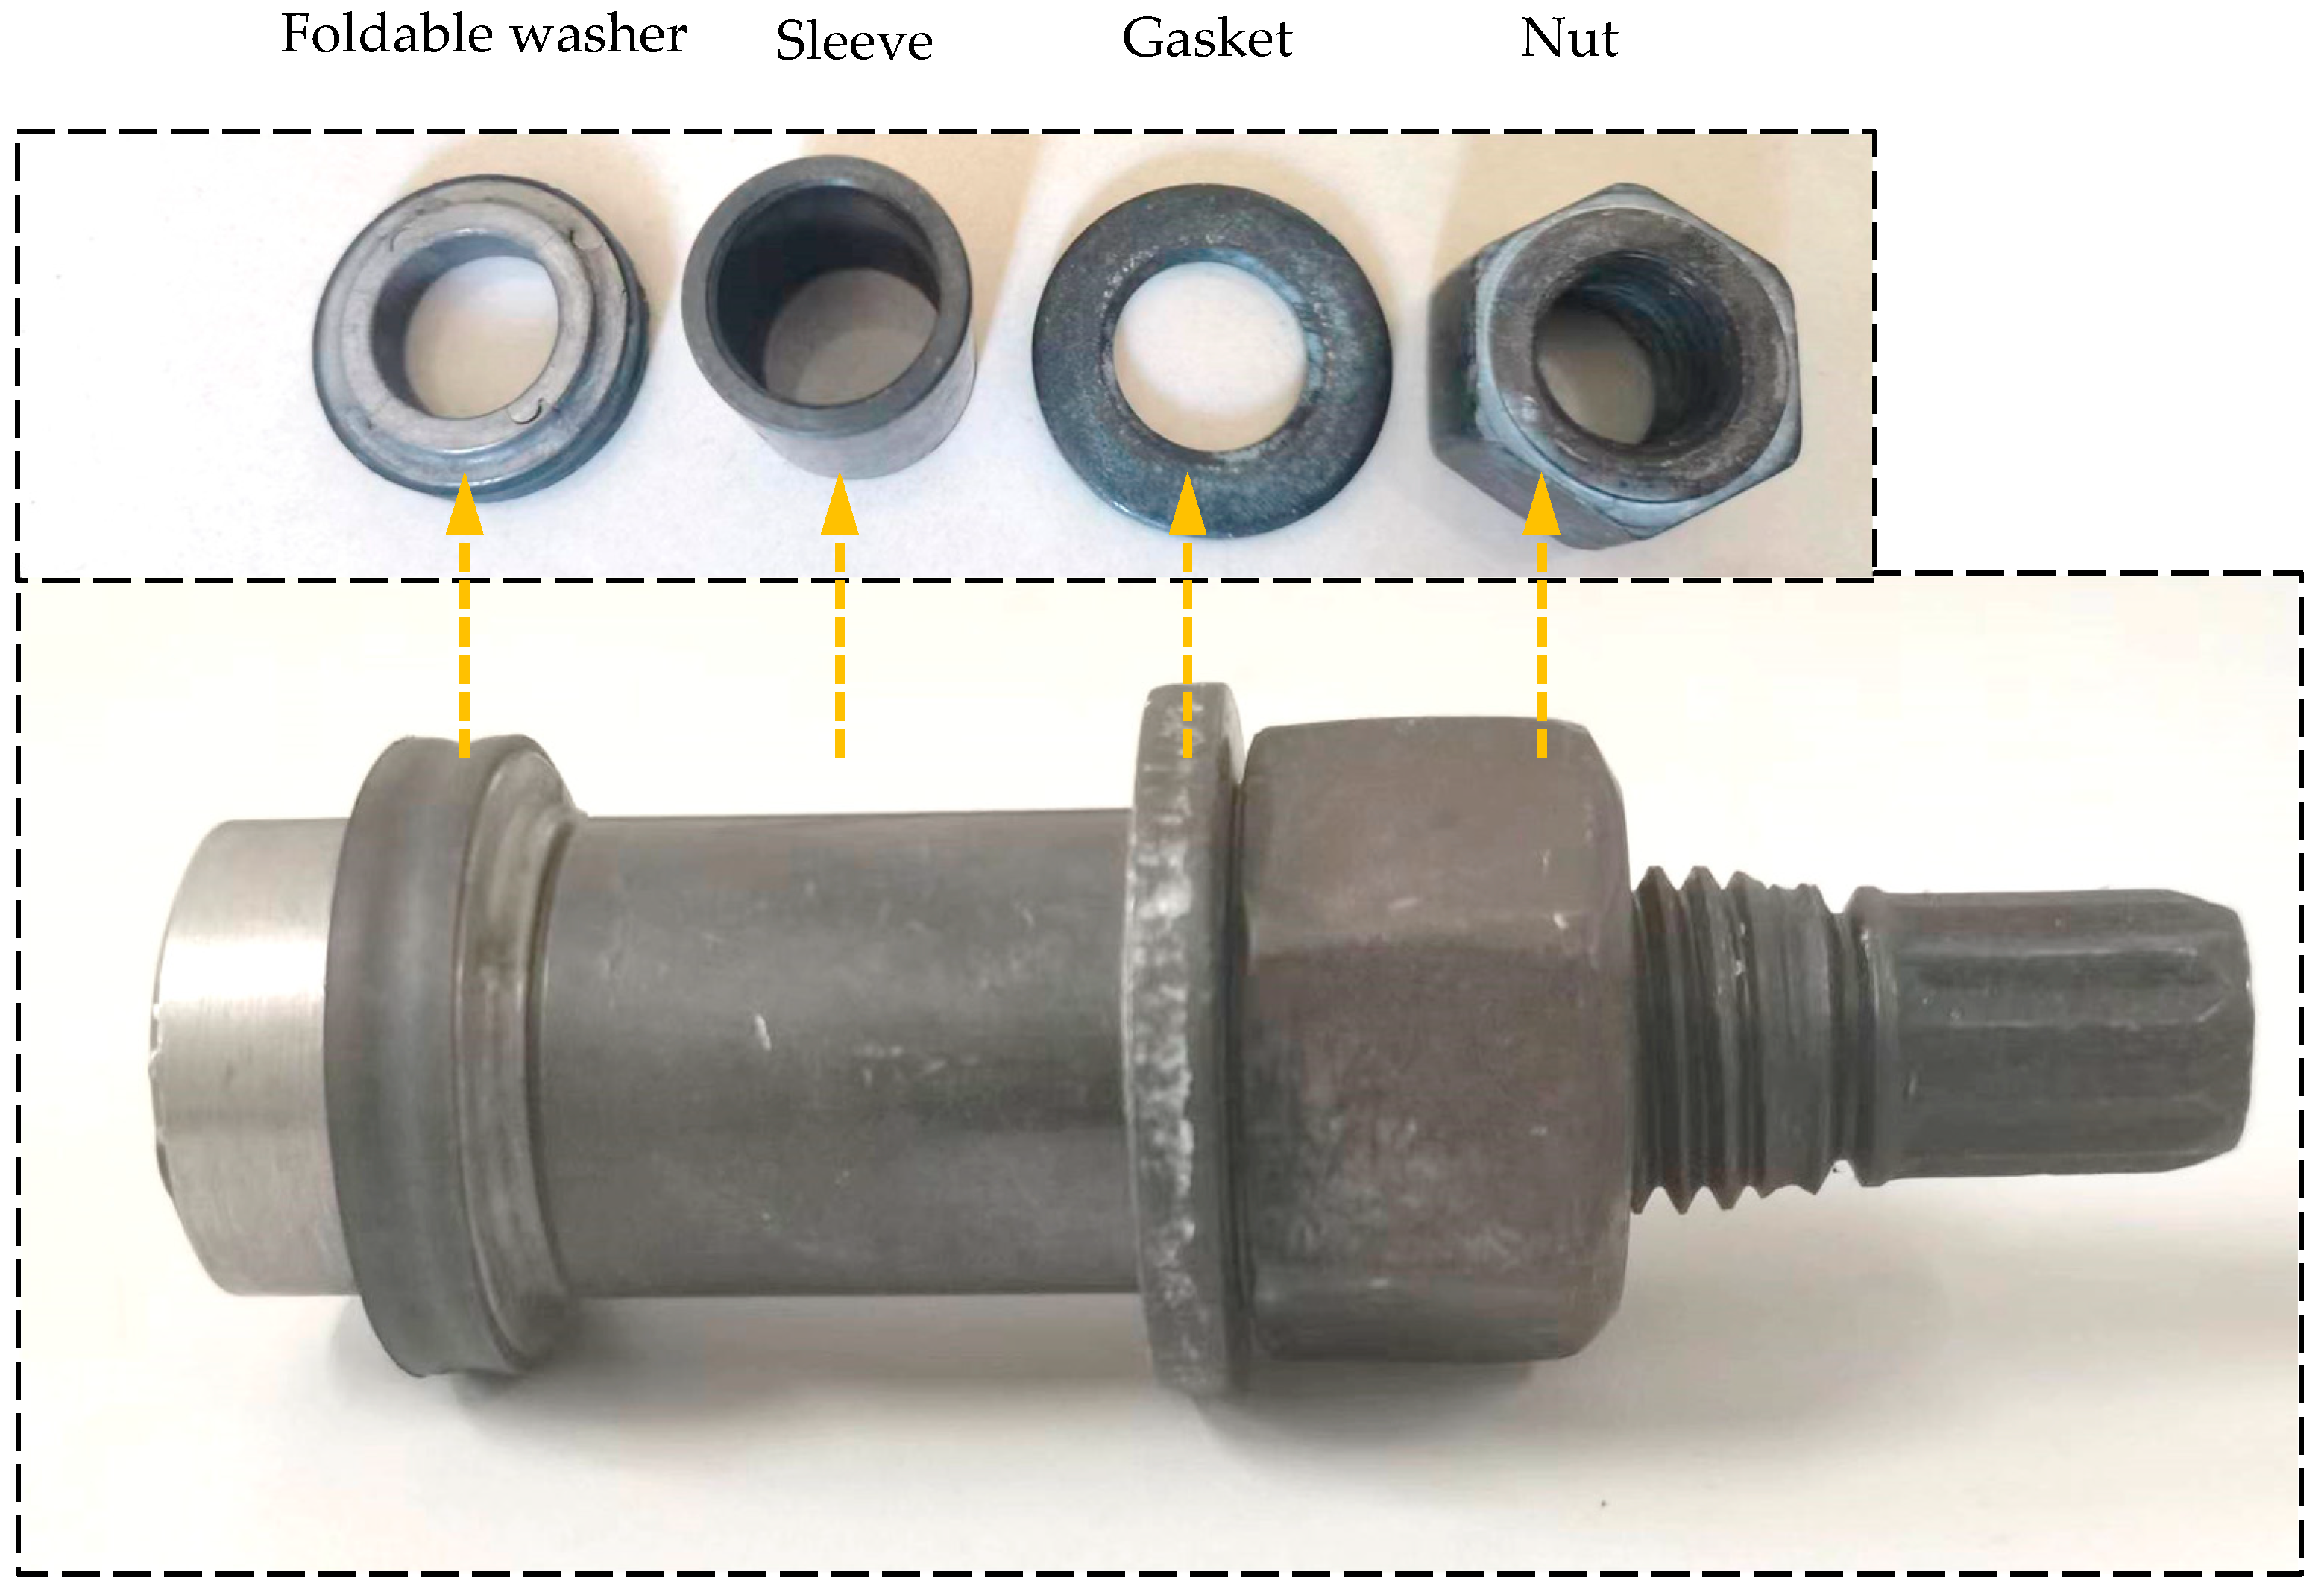
2.1. Specimen Design

The specimens were taken from the internal middle column joints in the multi-storey frame structure and designed according to the 1:2 scale model [39]. The size and material of the sample prototype are in line with the engineering application. In view of the limited test area, the size of all beam and column members is half that of the prototype, and the steel model is unchanged. The beam–column members in the specimen were prefabricated at the factory, and the specimen grinding, bolting, strain gauge, spray painting, frame displacement meter, wiring and other installation operations were carried out at the test site. To investigate the effect of increasing the thickness of the T-stub on the damage and failure mechanism of the joint, the specimen SMJ-2 was designed with a larger thickness of the T-stub and compared with the base specimen SMJ-1 [40]. The T-stub of the latter was T210 × 170 × 9 × 14. Figure 1 shows the model diagram of joint SMJ-2. A square steel tube column with a length of 1800 mm was adopted, the east and west side beams were symmetrical, and the length of the beam was 1860 mm. The steel tubular column and the H-stub steel beam were connected by a T-stub steel. The section height of the T-stub steel was 210 mm, the width was 170 mm, and the web thickness and flange thickness were 12 mm and 19 mm, respectively. Domestic nested 10.9 M16 blind bolts and ordinary high strength bolts were used. The structural diagram of the blind bolts, which consist of sleeves, nuts, gaskets and collapsible washers, is shown in Figure 2. The collapsible washer was placed inside the column wall and plays a key fastening role. Q235 B steel was used for the steel beams and square steel tubular columns. Standard specimens were made and material performance tests were carried out [37,38]. The mechanical properties of the materials are given in Table 1.

2.2. Mechanical Properties of Material
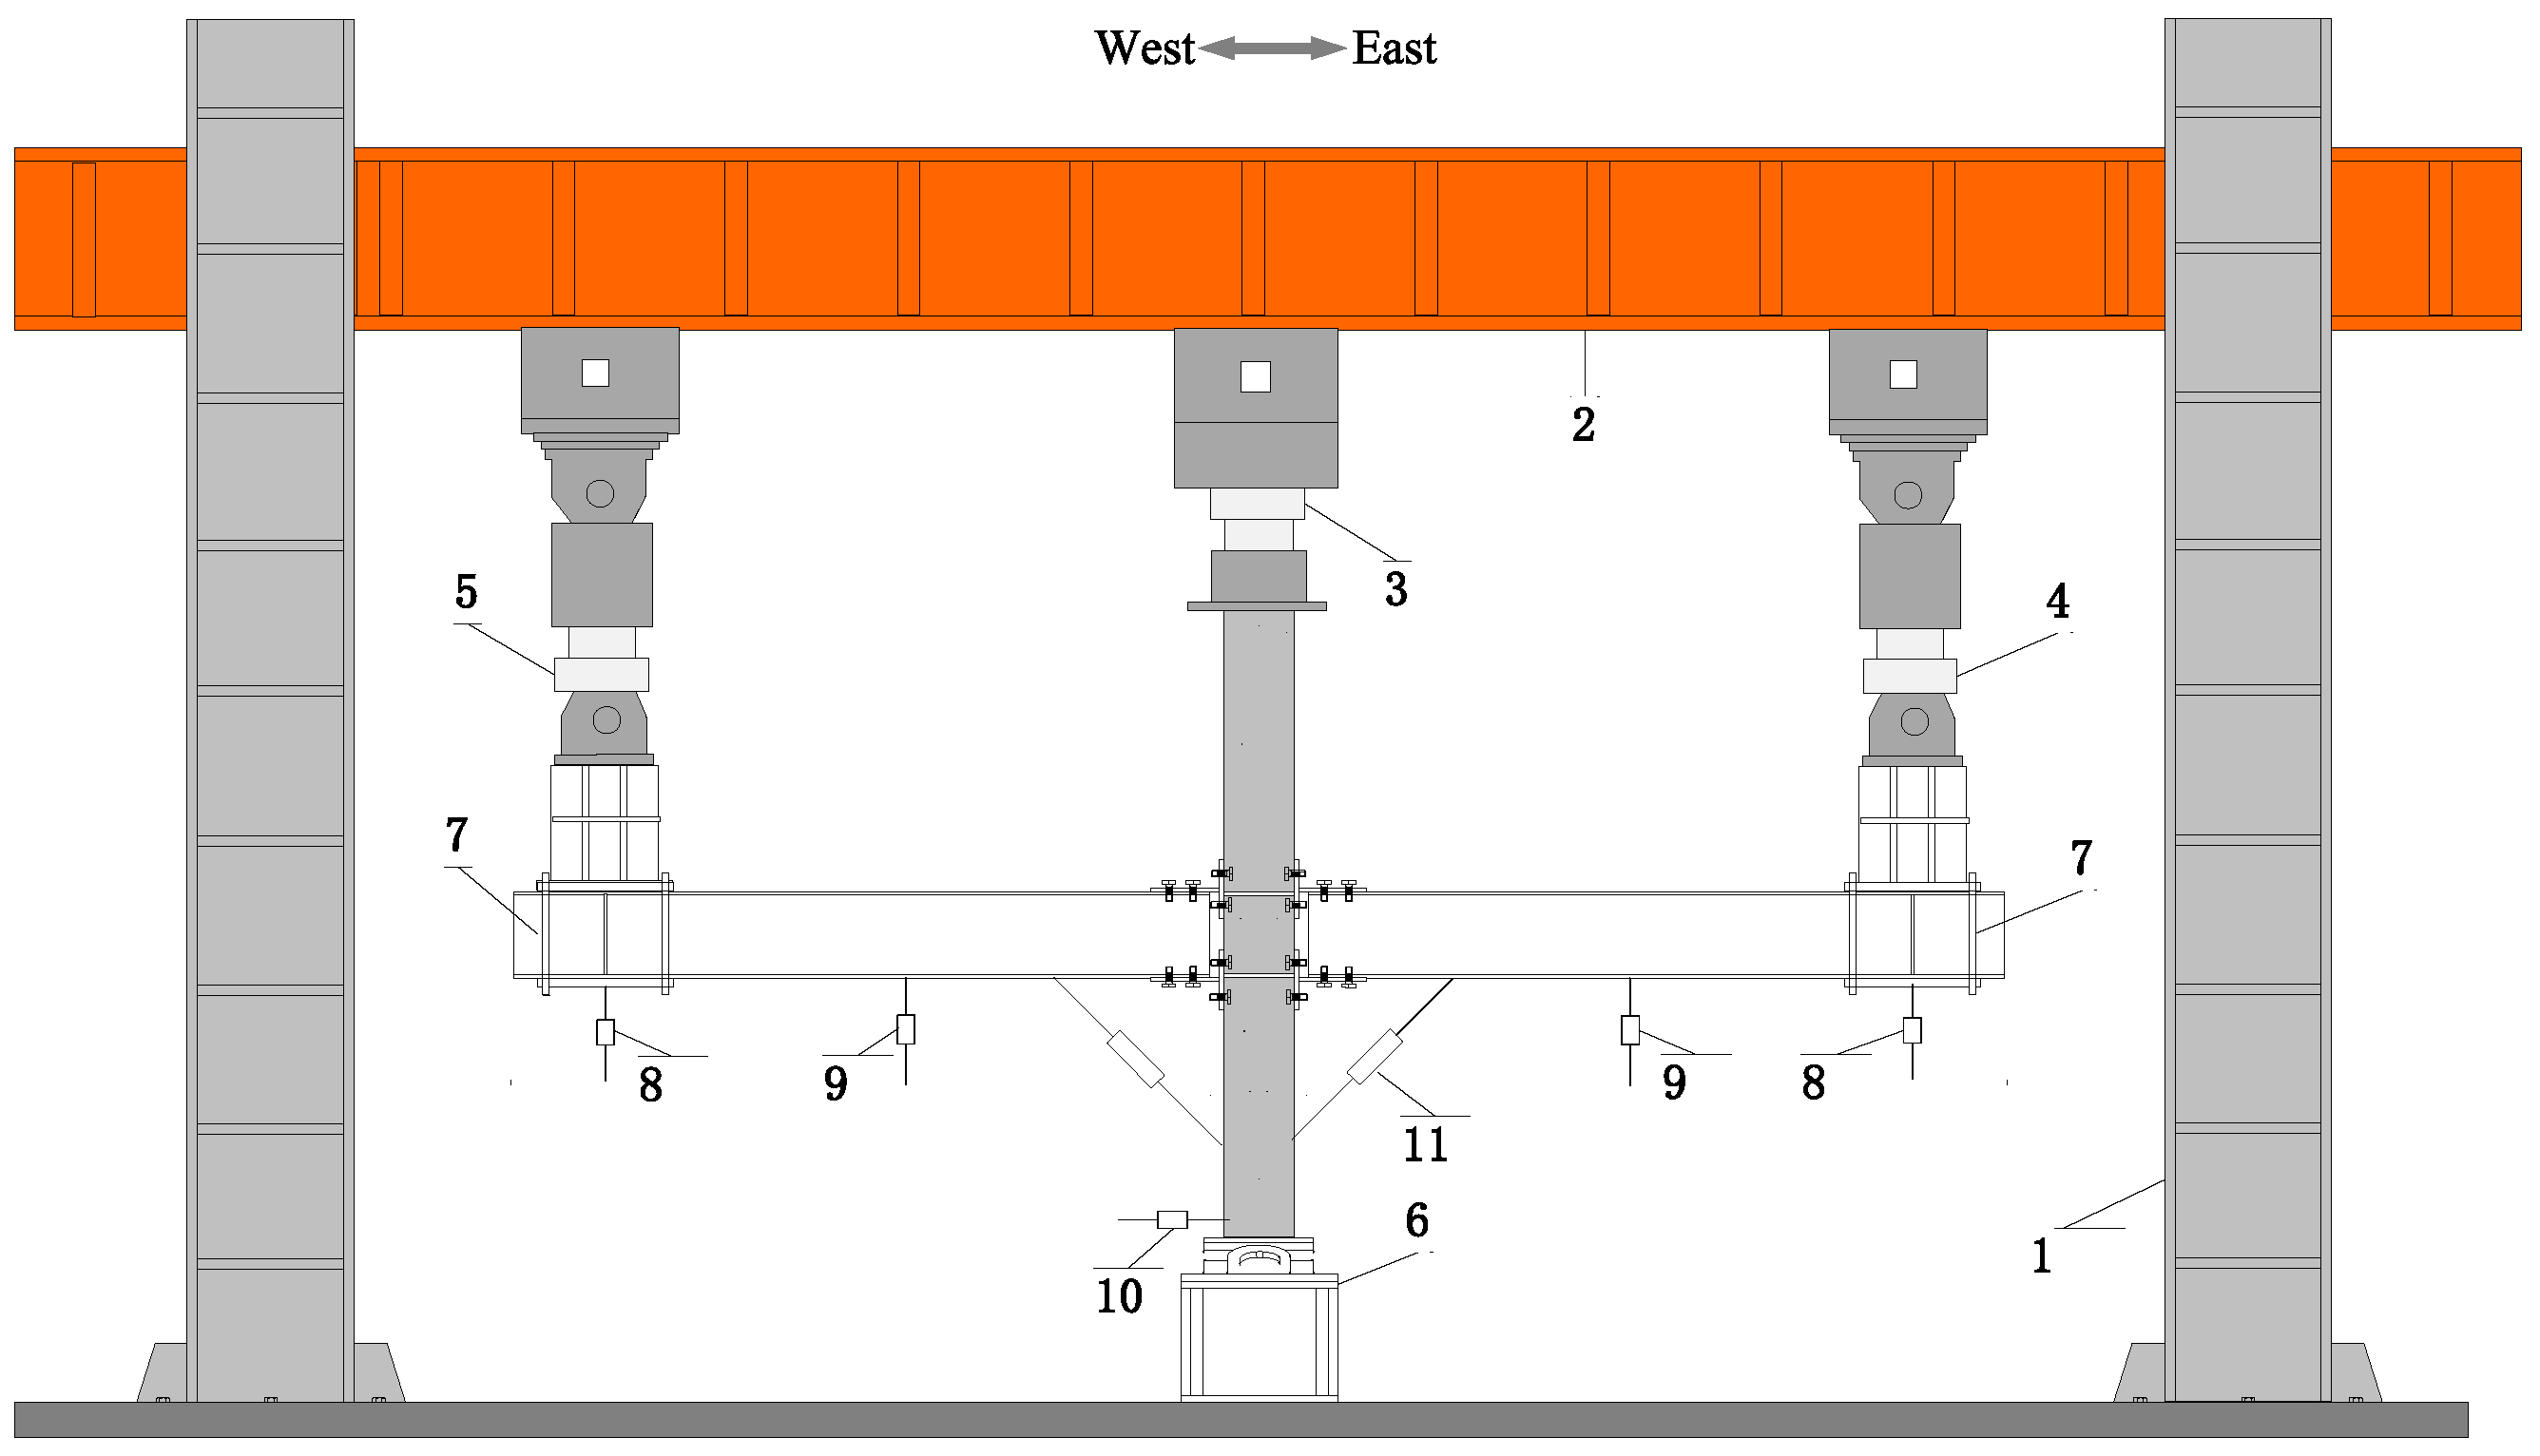
The steel beam, square tube column and connector are all made from Q235 B steel. At room temperature, the standard specimens are placed on a 300 kN material testing machine for the material tensile performance test [41,42]. The measured results of each group of specimens are averaged. The yield strength, tensile strength, elastic modulus and elongation of the steel are shown in Table 1. The 20 MnTiB alloy steel is used in the fabrication of 10.9-grade single-sided bolts, which exhibit an elongation at break of the bolt of 14%.

2.3. Test Device

The test device consists of a cross beam, a rigid reaction frame and a six-channel electro-hydraulic servo loading system. The rigid reaction frame is connected to the reaction wall by a horizontal beam to play a stabilising role. The beam is bolted to the rigid reaction frame and three hydraulic actuators are installed on the beam to apply the vertical load. The top of the column is constrained by the electro-hydraulic servo loading system. The lower end of the actuator head is connected to the top of the column by bolts to simulate the boundary of the top of the column and apply vertical downward axial pressure. The electro-hydraulic servo actuator model is 200 tonnes, with a built-in force sensor and a magnetostrictive linear displacement sensor. The load and displacement are applied through the system terminal control. The bottom of the column is constrained by a fixed hinged support to simulate the inflection point of the simulated column. The beam ends of the west and east beams are loaded vertically downwards by the west 1000 kN actuator and the east 1000 kN actuator, respectively, to simulate the internal force at the inflection point. The model of the electro-hydraulic servo actuator is 100 tonnes, and the maximum displacement that can be applied is 250 mm. To prevent the out-of-plane bending deformation of the beam end in the north–south direction, two limit devices are installed at the beam ends. The test device diagram of SMJ-2 is shown in Figure 3.

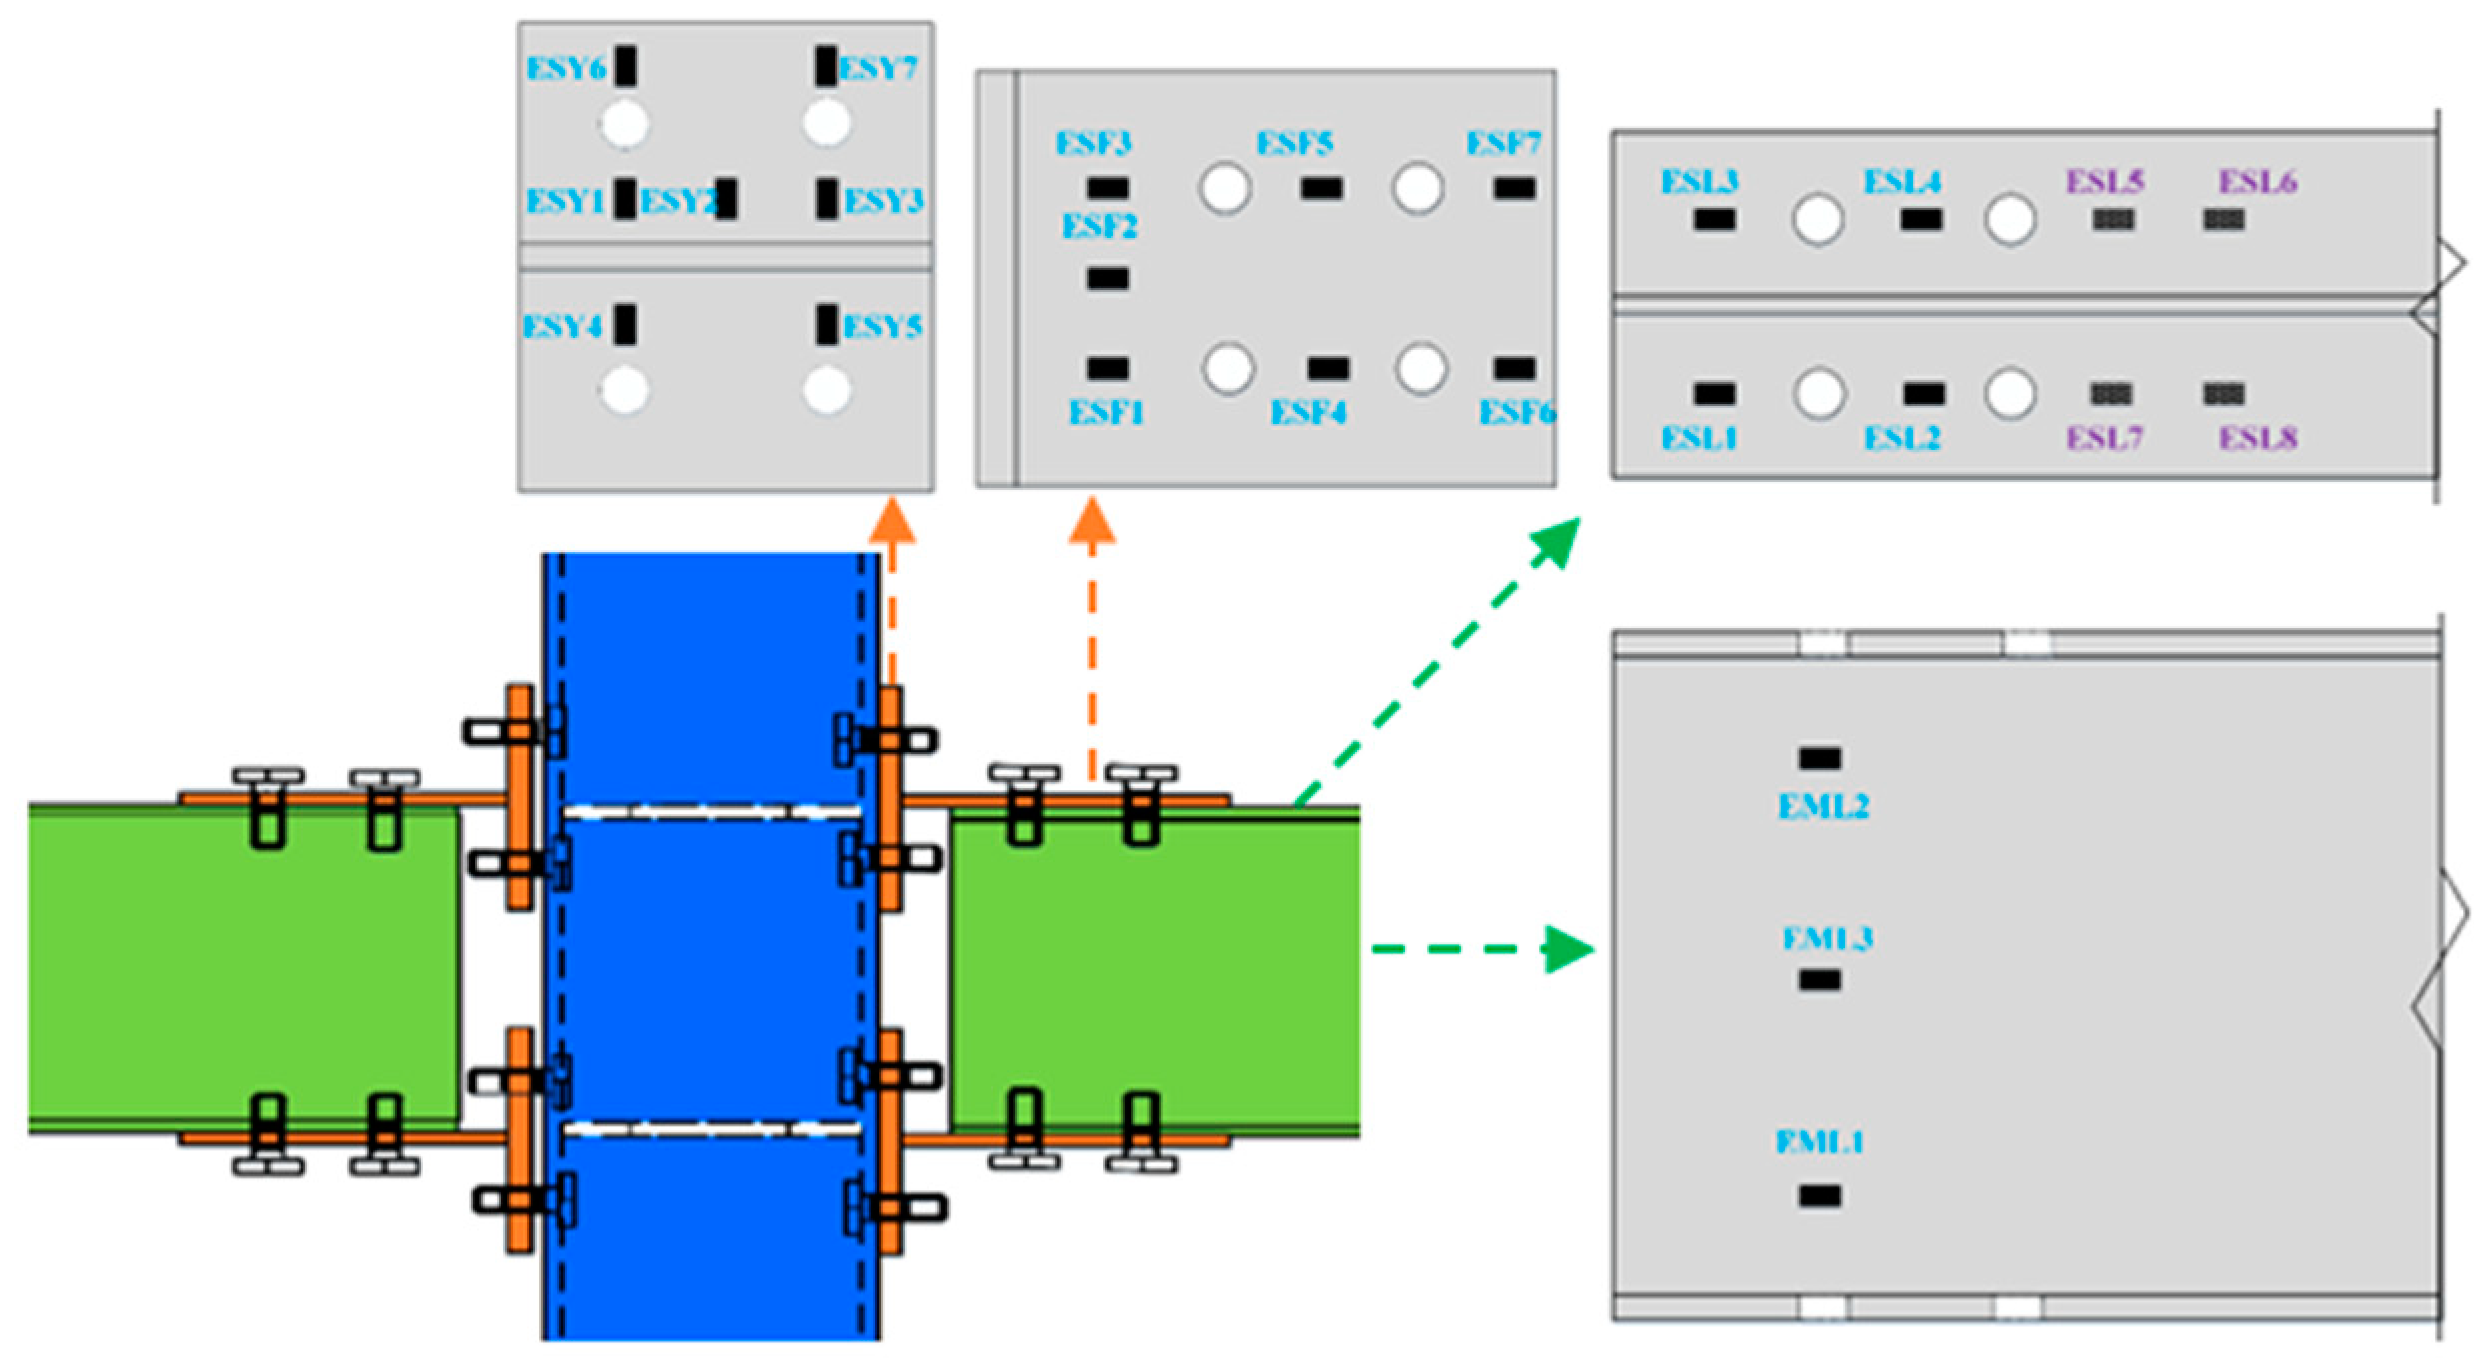
2.4. Measurement Arrangement

The arrangement of the displacement gauges on the specimen is shown in Figure 3. The displacement gauges are placed at the end of the east and west beams and in the beam, respectively, to measure the vertical displacement at the corresponding position. The displacement gauge is placed at the bottom of the column to measure the horizontal displacement at the bottom of the column. The cable displacement gauge is placed at the flange of the beam and column to measure the relative rotation angle of the beam and column. To measure the strain in different parts of the joint area, the arrangement of the T-stub steel in the east beam and the placement of strain gauges on the flange and web of the beam are shown in Figure 4. Seven vertical strain gauges are placed on the T-beam flange and seven transverse strain gauges are placed on the T-beam web to monitor the strain development of the T-beam flange and web respectively. Four strain gauges are placed on the inside of the top flange of the beam. At the same time, four strain gauges are placed on the outside of the top flange of the beam to measure the yield of the flange of the beam. At the same time, three strain gauges are placed at the location of the beam web corresponding to the outermost row of bolts to analyse the strain of the beam web. Due to symmetry, the arrangement of the strain gauges of the west beam is the same as that of the east beam, and the strain gauge of the blind bolt is located inside the root of the bolt shank.

2.5. Loading Method

First, a 2000 kN hydraulic actuator was used to apply an axial force with an axial compression ratio of 0.25 to the top of the column and hold it unchanged. Two 1000 kN actuators simultaneously applied vertical asymmetric loads to the east beam and west beams, with a positive axial force and a negative tensile force. According to the load–displacement loading system shown in Figure 5, in the pre-loading stage, the load starts from 0, and the load of each stage of the east and west columns increases by 1.65 mm, with the direction being opposite. Each loading level was cycled once to check that the strain gauge and the displacement meter were working properly, and the strain gauge reading was observed until some parts yielded. The yield value reaches the measured value of the material tensile test, and the yield displacement and yield load are determined to be the current load displacement and load. The yield displacement is denoted by δ y . In the formal loading stage, the load displacement was increased linearly by a multiple of the yield displacement, which is 1 δ y , 2 δ y , 3 δ y , etc., and the corresponding loading levels are 1, 2, 3, etc. The loading of each stage is repeated three times. During the loading process, the test phenomenon is observed, and the test phenomenon is recorded and summarised at the end of each stage of loading. The test is terminated when the load–displacement curve drops to 85% of the ultimate load, or when the member exhibits significant plastic deformation, such as fracture.

3. Test Results

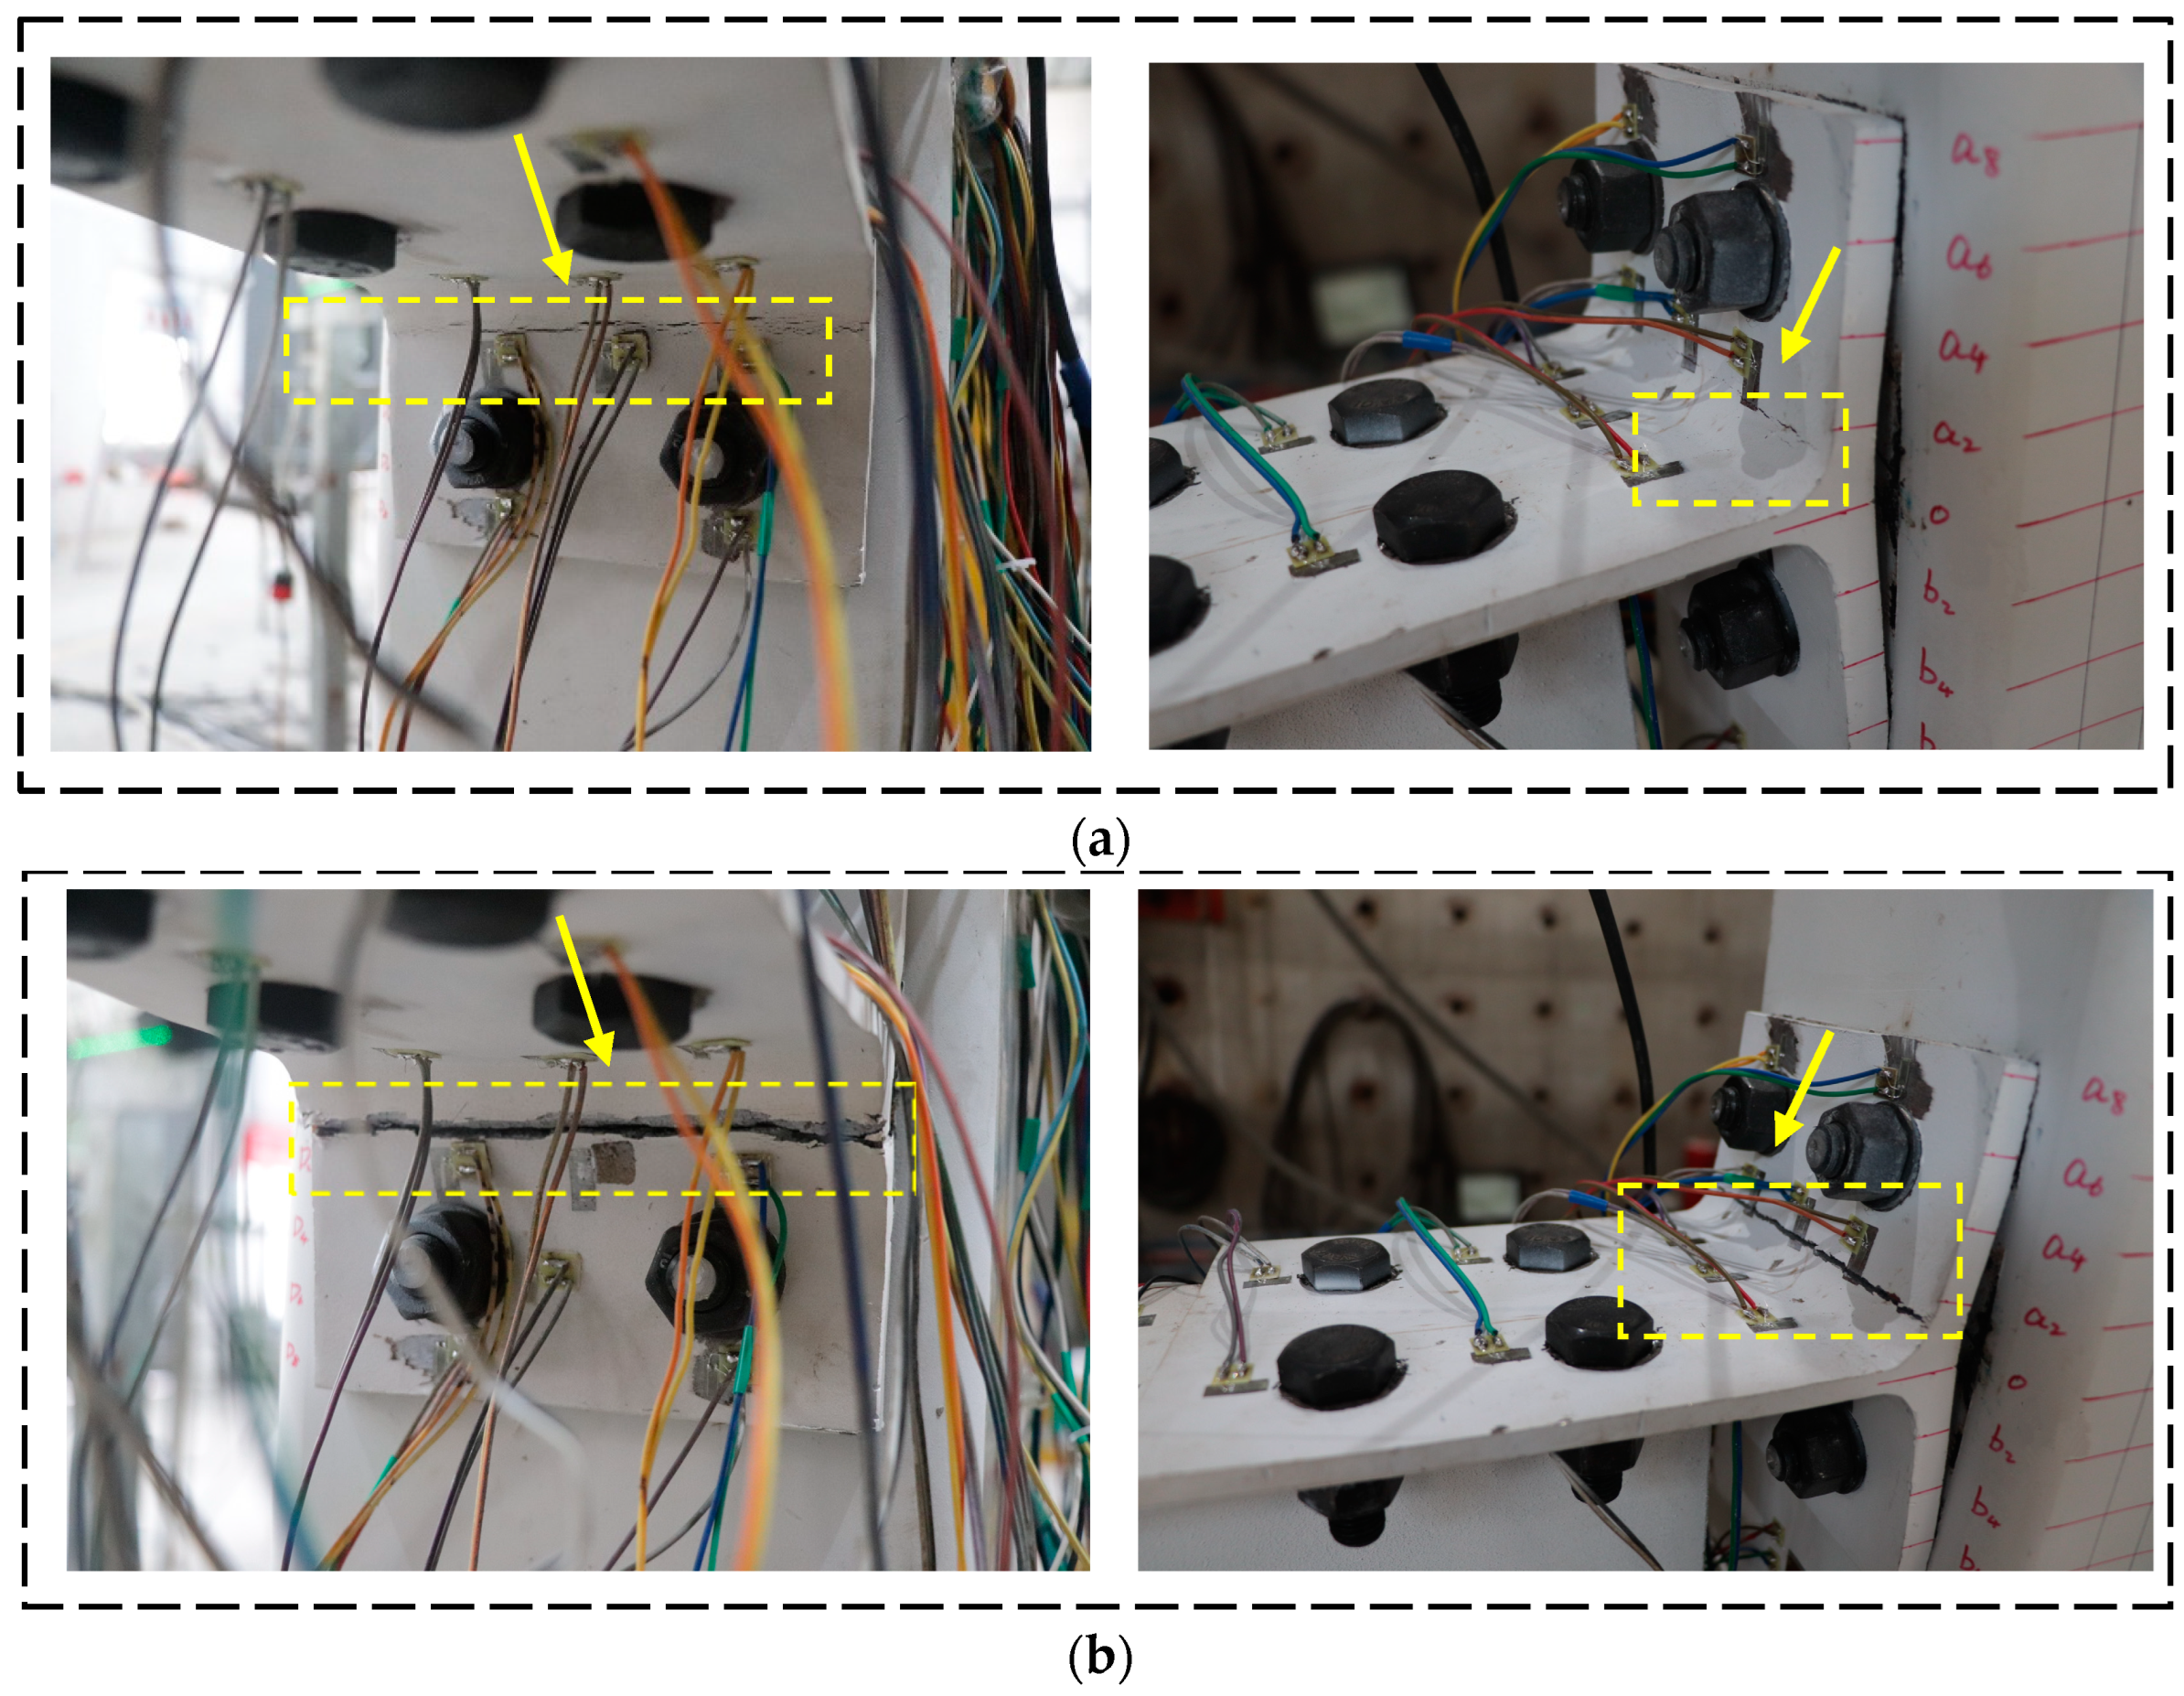
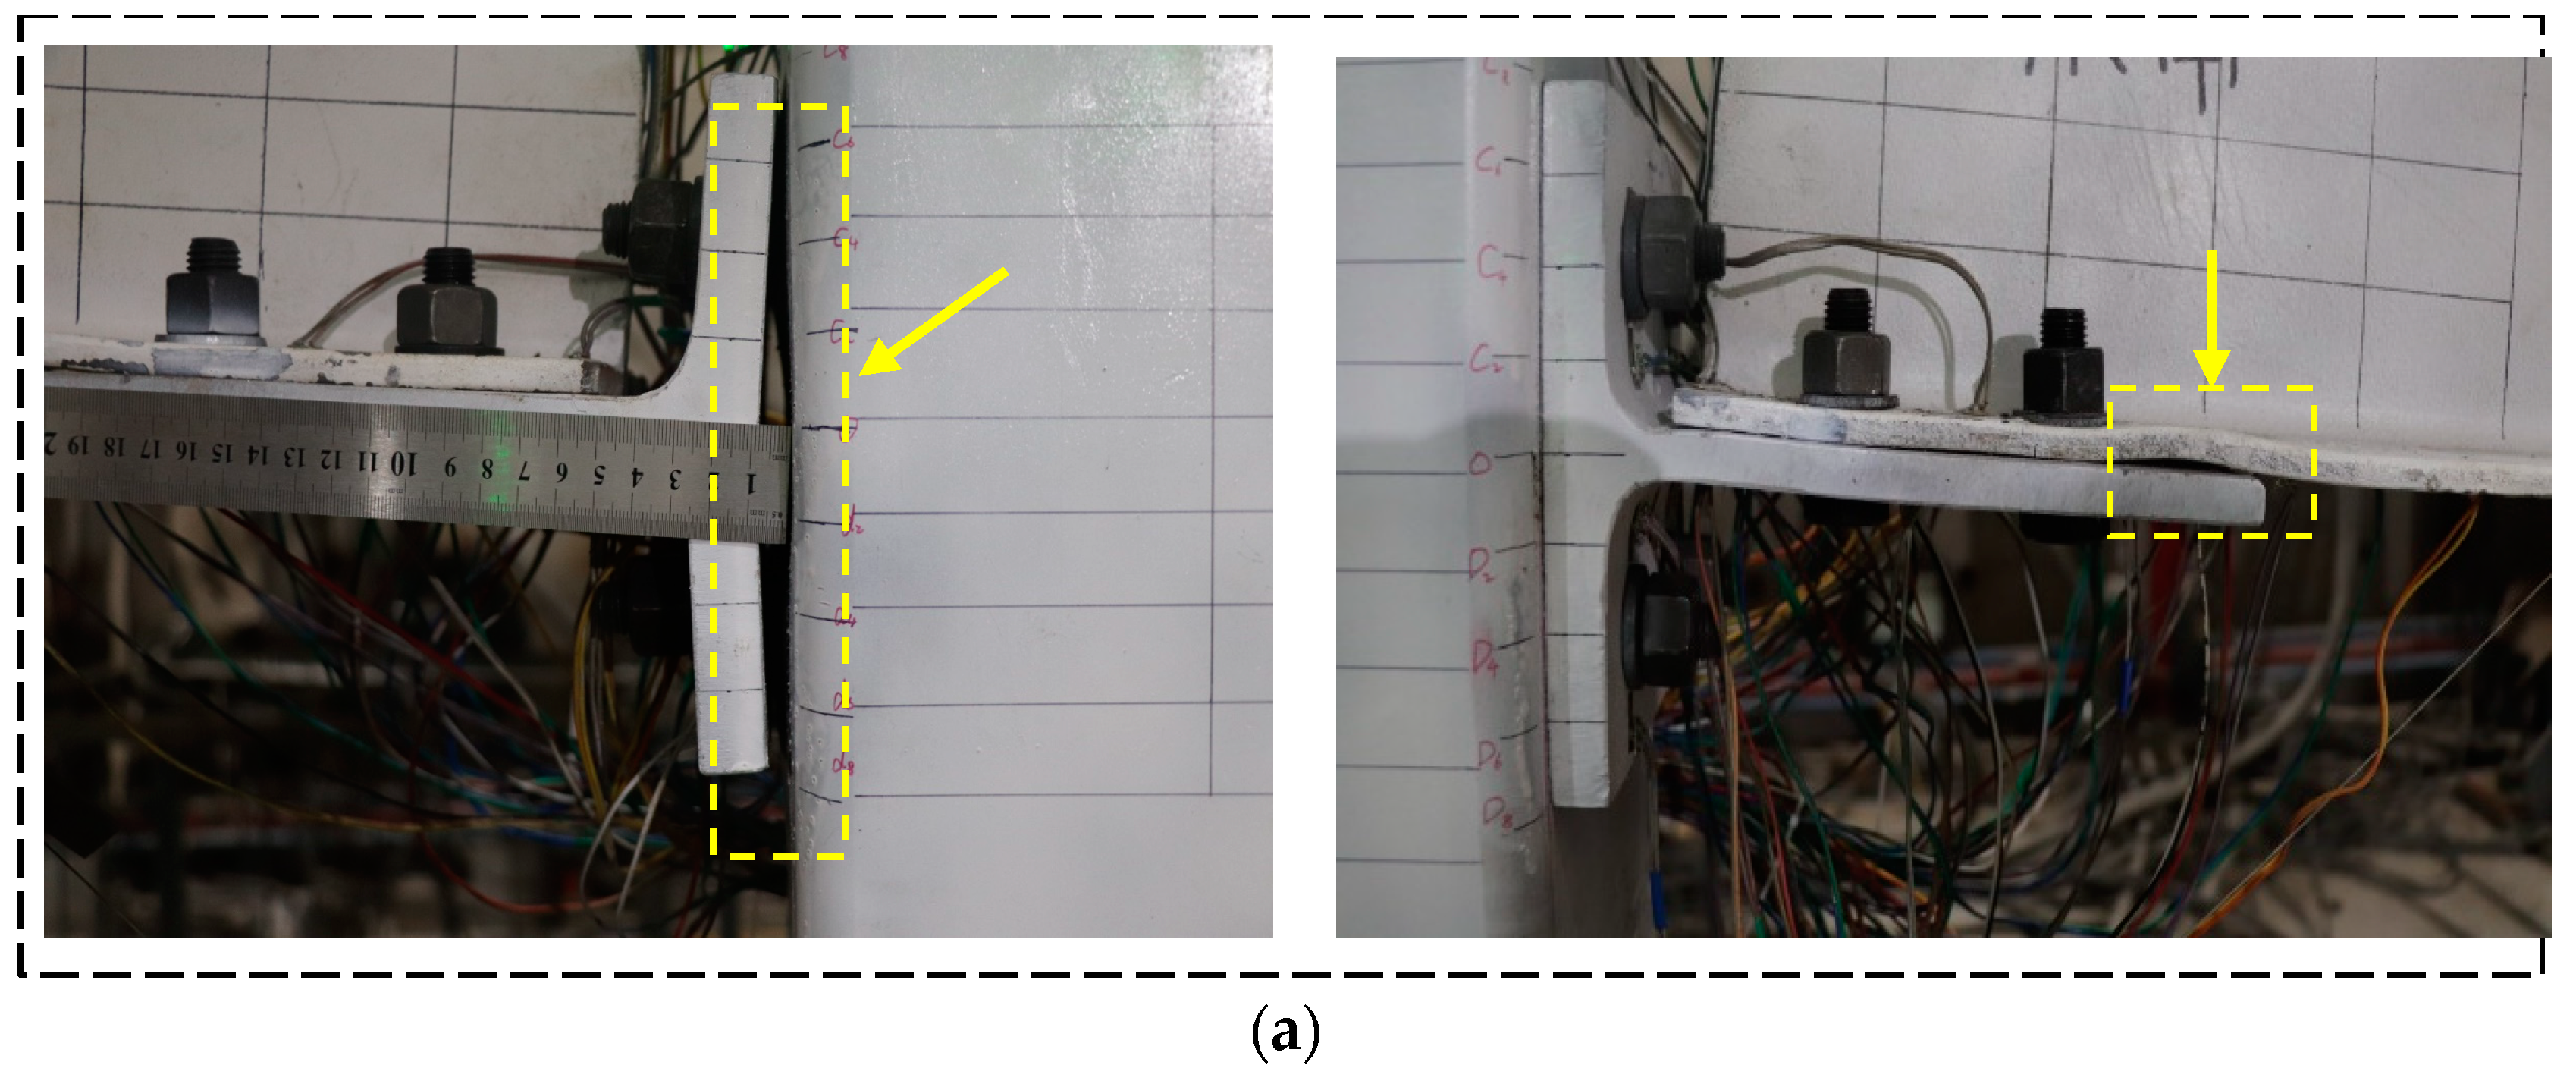
3.1. Damage Progression

The damage development process of the specimen is shown in Table 2. The web, flange and beam flange of the T-stub steel yielded sequentially, and the damage occurred at the initial stage, but the test phenomenon was not obvious. When the fourth and fifth level loads were applied, the damage developed rapidly. Cracks appeared at the root of the T-stub steel flange on the tensile side of SMJ-1, and the cracks continued to expand and spread to the other side. The specimen was close to failure, as shown in Figure 6a. At the sixth level load, the T-stub steel crack on the eastern underside ran through the entire flange thickness of the specimen and complete damage occurred, as shown in Figure 6b. Regarding SMJ-2, obvious damage phenomena were observed at the fourth and fifth level loads. The tensile side column wall of SMJ-2 was slightly buckled, and the compression side beam flange was slightly buckled. With the development of plasticity, the specimen was close to damage failure, and the phenomenon of column wall buckling and beam flange buckling was obvious, as shown in Figure 7a. Since the T-stub steel has no obvious plastic deformation, the monotonic load was finally applied to the specimen, and the final failure phenomenon is shown in Figure 7b. As the thickness of the T-stub steel increased, the damage mechanism of the joint changed. The tensile plastic zone of the joint was shifted from the root of the T-stub steel flange of SMJ-1 to the corresponding column wall of the blind bolt of SMJ-2. The compressive plastic zone of the joint was shifted from the root of the T-stub steel web of SMJ-1 to the beam flange at the end of T-stub steel web of the SMJ-2.
In general, when the middle column joints are connected by welds, brittle failure of the welds is more likely to occur, and shear failure of the H-shaped steel column joint area is also more likely to occur, with bolt fracture occurring in more severe cases. Bending deformation of the end plate is very common. In this paper, the middle column joint of the T-stub steel connection is characterised by the fracture of the T-stub steel flange and the buckling of the column wall, which belongs to the ductile failure, and there is no brittle failure of the weld fracture, which is beneficial to earthquake resistance. Since the shear deformation of the joint zone of the square steel tube column is not large, it confirms that the steel tube column has advantages over the H-shaped steel column. In addition, the bolts did not break, indicating the feasibility of using bind bolts.

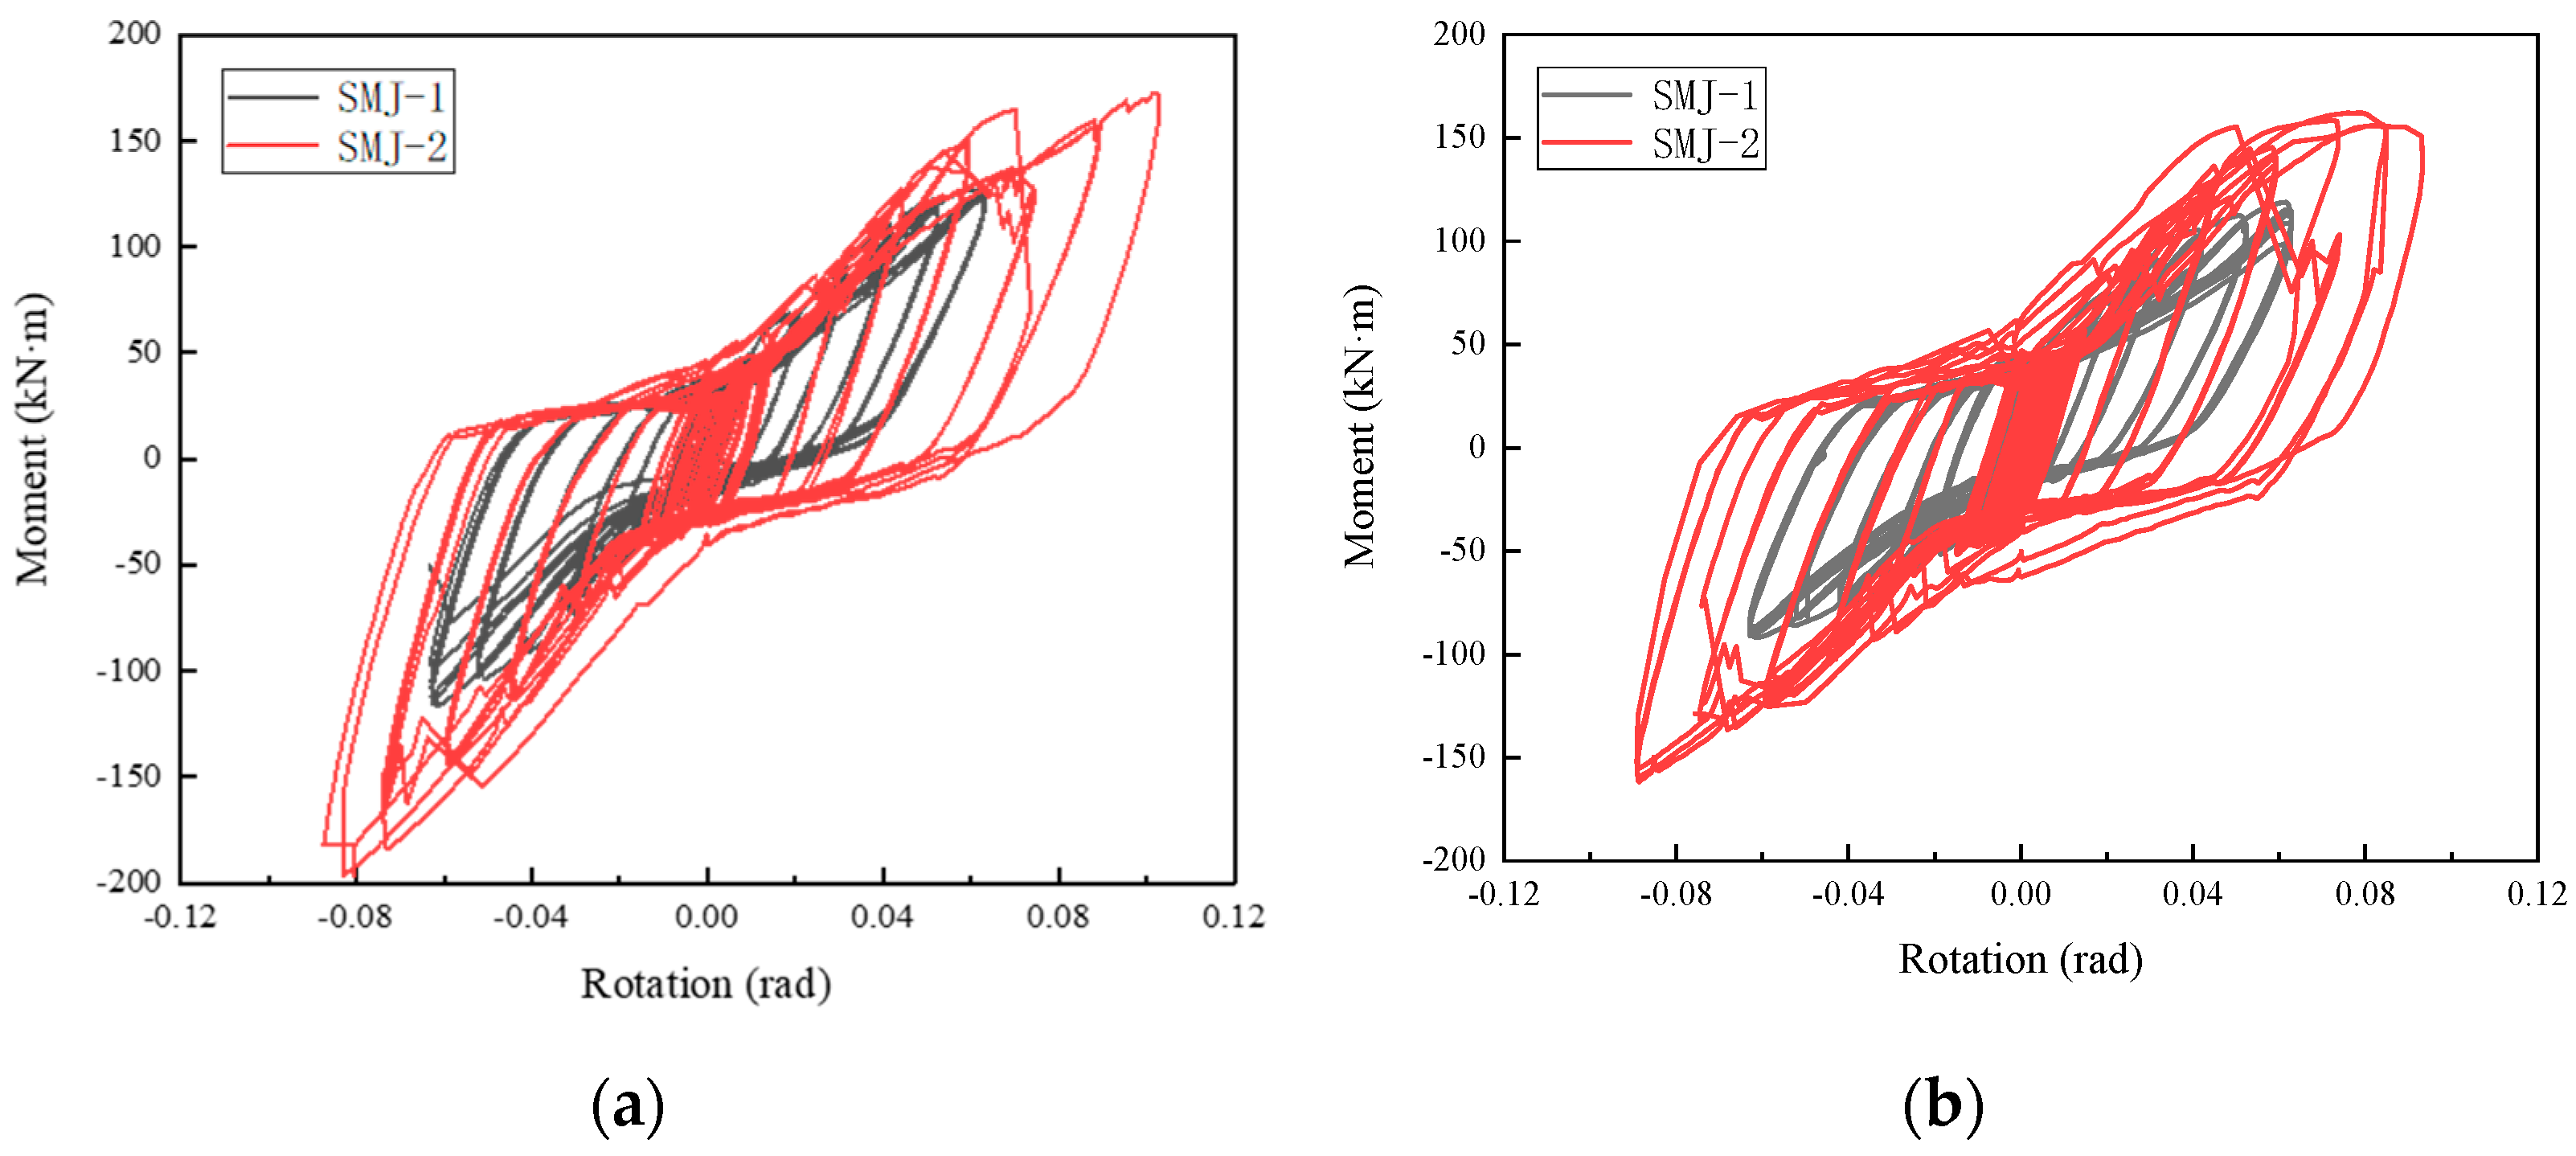
3.2. Moment–Rotation Curve

The moment–rotation curve of the joint is shown in Figure 8. The moment–rotation curves of the east and the west beams were bow-shaped, reflecting a certain pinching phenomenon during the loading and unloading process. The main reason for the pinching is that slip occurs inside the joint, in the compression zone. At the end of unloading in the tension zone, a gap forms between the T-stub steel and the column wall, which is not eliminated. When the actuator applies the compressive load in the opposite direction, the gap is closed first, and this is when the slip phenomenon occurs. Compared with the west beam, the slip of the east beam was relatively large during the loading process. Compared with SMJ-1, the slip phenomenon of SMJ-2 was reduced during the loading process. This was because the stiffness of the T-stub steel of SMJ-2 is high, and almost no deformation occurred under tension. The gap caused by the buckling of the column wall was the main cause of the slip. When the fifth level load was applied, the actuator became unstable due to excessive displacement, resulting in a jagged load. By increasing the thickness of T-stub steel, the load capacity and plastic displacement of the specimen were improved, the envelope area of the hysteresis loop was significantly increased, and the energy dissipation capacity was improved. After the fifth level load, the load capacity of the east beam and the west beams of SMJ-2 was downloaded under the effect of positive thrust, and the load capacity of SMJ-1 did not decrease significantly. In comparison, the average positive ultimate displacement and ultimate load capacity of SMJ-2 were 0.0868 rad and 161.65 kN·m, respectively. After the thickness of the T-stub steel was increased, the ultimate displacement and ultimate load capacity of SMJ-2 were 39.21% and 33.26% higher than those of SMJ-1, respectively. The hysteresis curve of the specimen shows an obvious reduction in stiffness. The trend of the peak point of the hysteresis curve is observed, and there is no obvious descending section. The load on the east beam of SMJ-2 at the time of failure is 152.87 kN, and the residual strength is large.

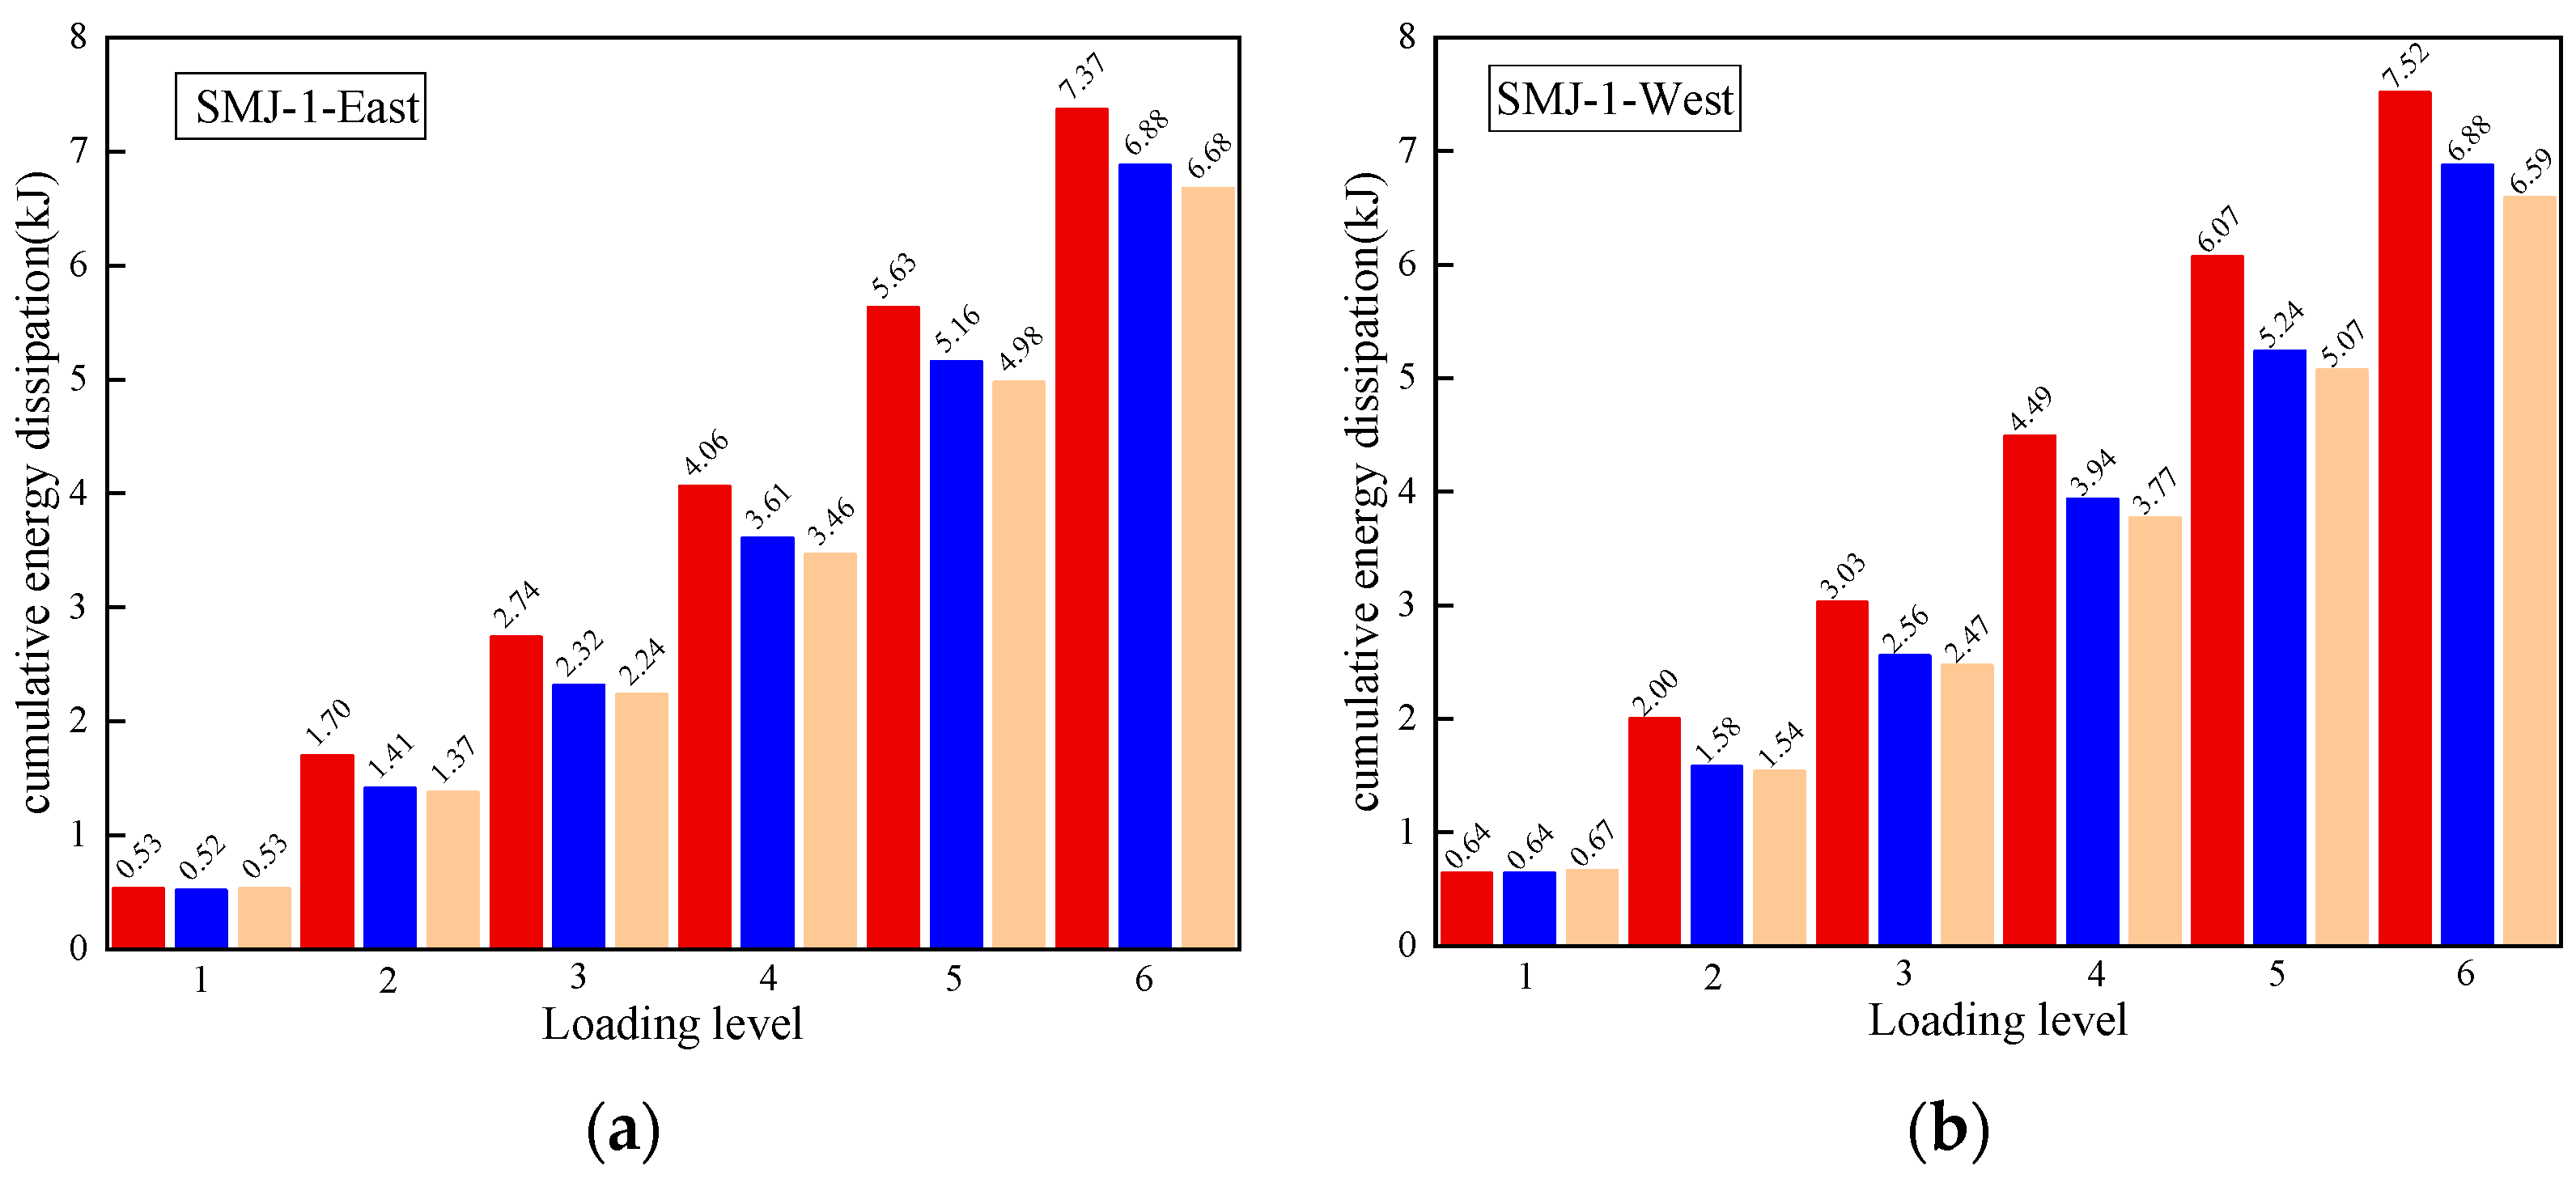
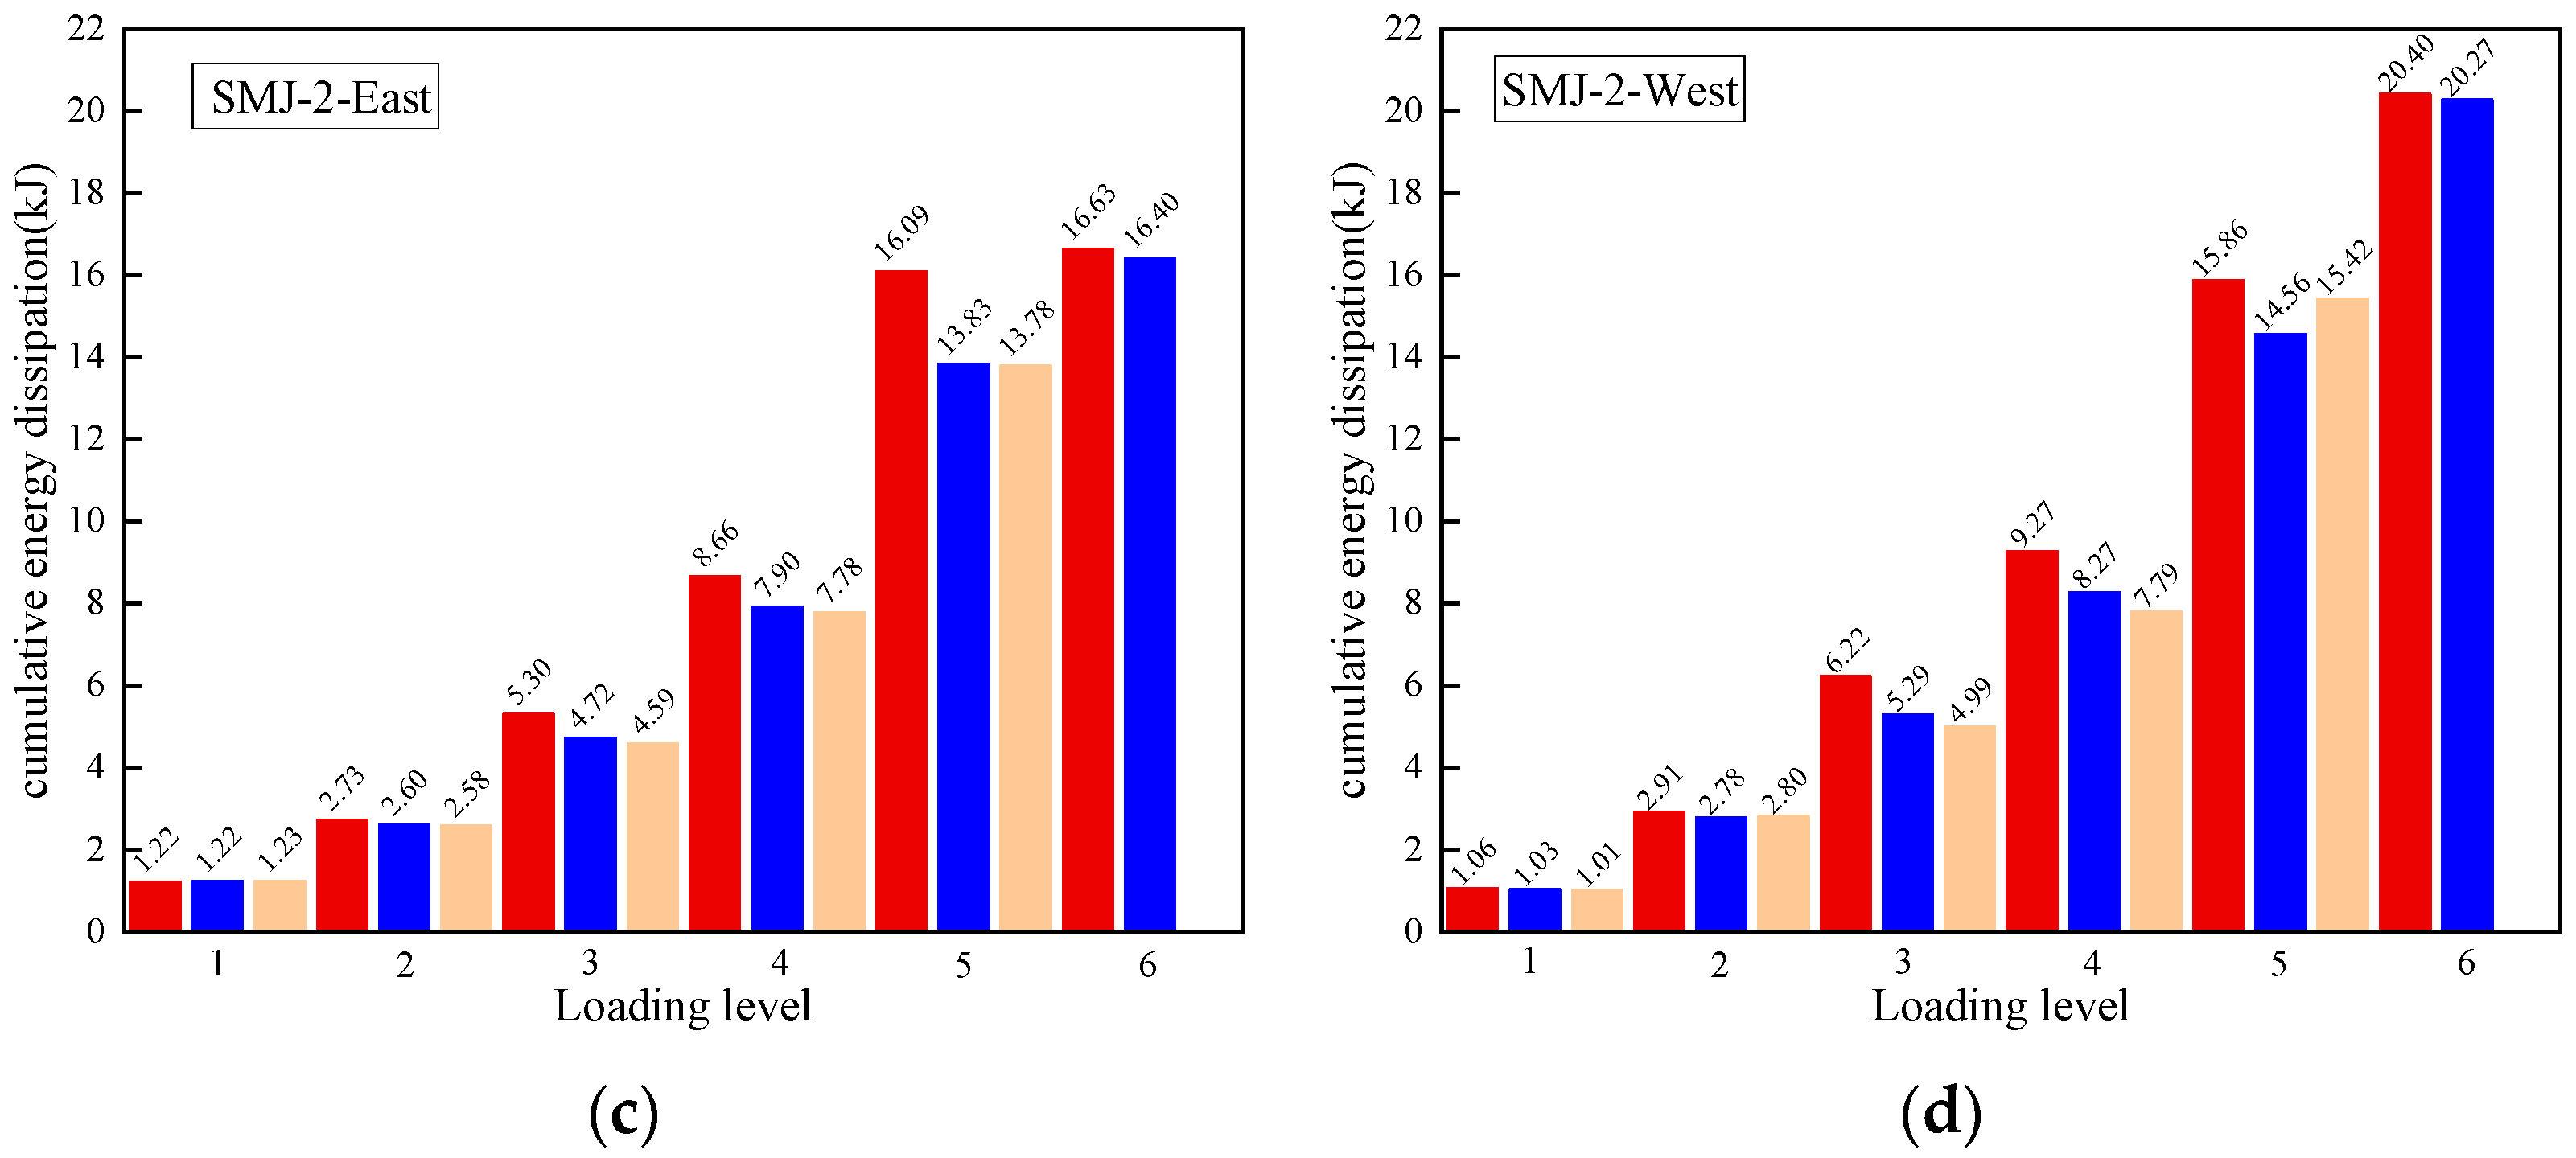
3.3. Cumulative Energy Dissipation

Figure 9 shows the cumulative energy consumption of the joints. At the same loading level, the cumulative energy consumption of the joints gradually decreased as the number of cycles increased. As the loading level increased, the energy consumption of the specimens gradually increased. At the last loading level, the energy consumption was the highest. The maximum energy consumption of the east and west beams of SMJ-2 was 16.63 kJ and 20.40 kJ, respectively. Compared with SMJ-1, the cumulative energy consumption of SMJ-2 increased by 148% as the thickness of the T-stub steel flange increased from 14 mm to 19 mm, and the thickness of the web increased from 9 mm to 12 mm. As both beam ends of the joint were controlled to load simultaneously, the cumulative energy consumption of the east beam was slightly less than that of the west beam within the allowable error range. At the same loading level, the cumulative energy dissipation of the east and the west beams showed a more pronounced asymmetry as plastic deformation increased.

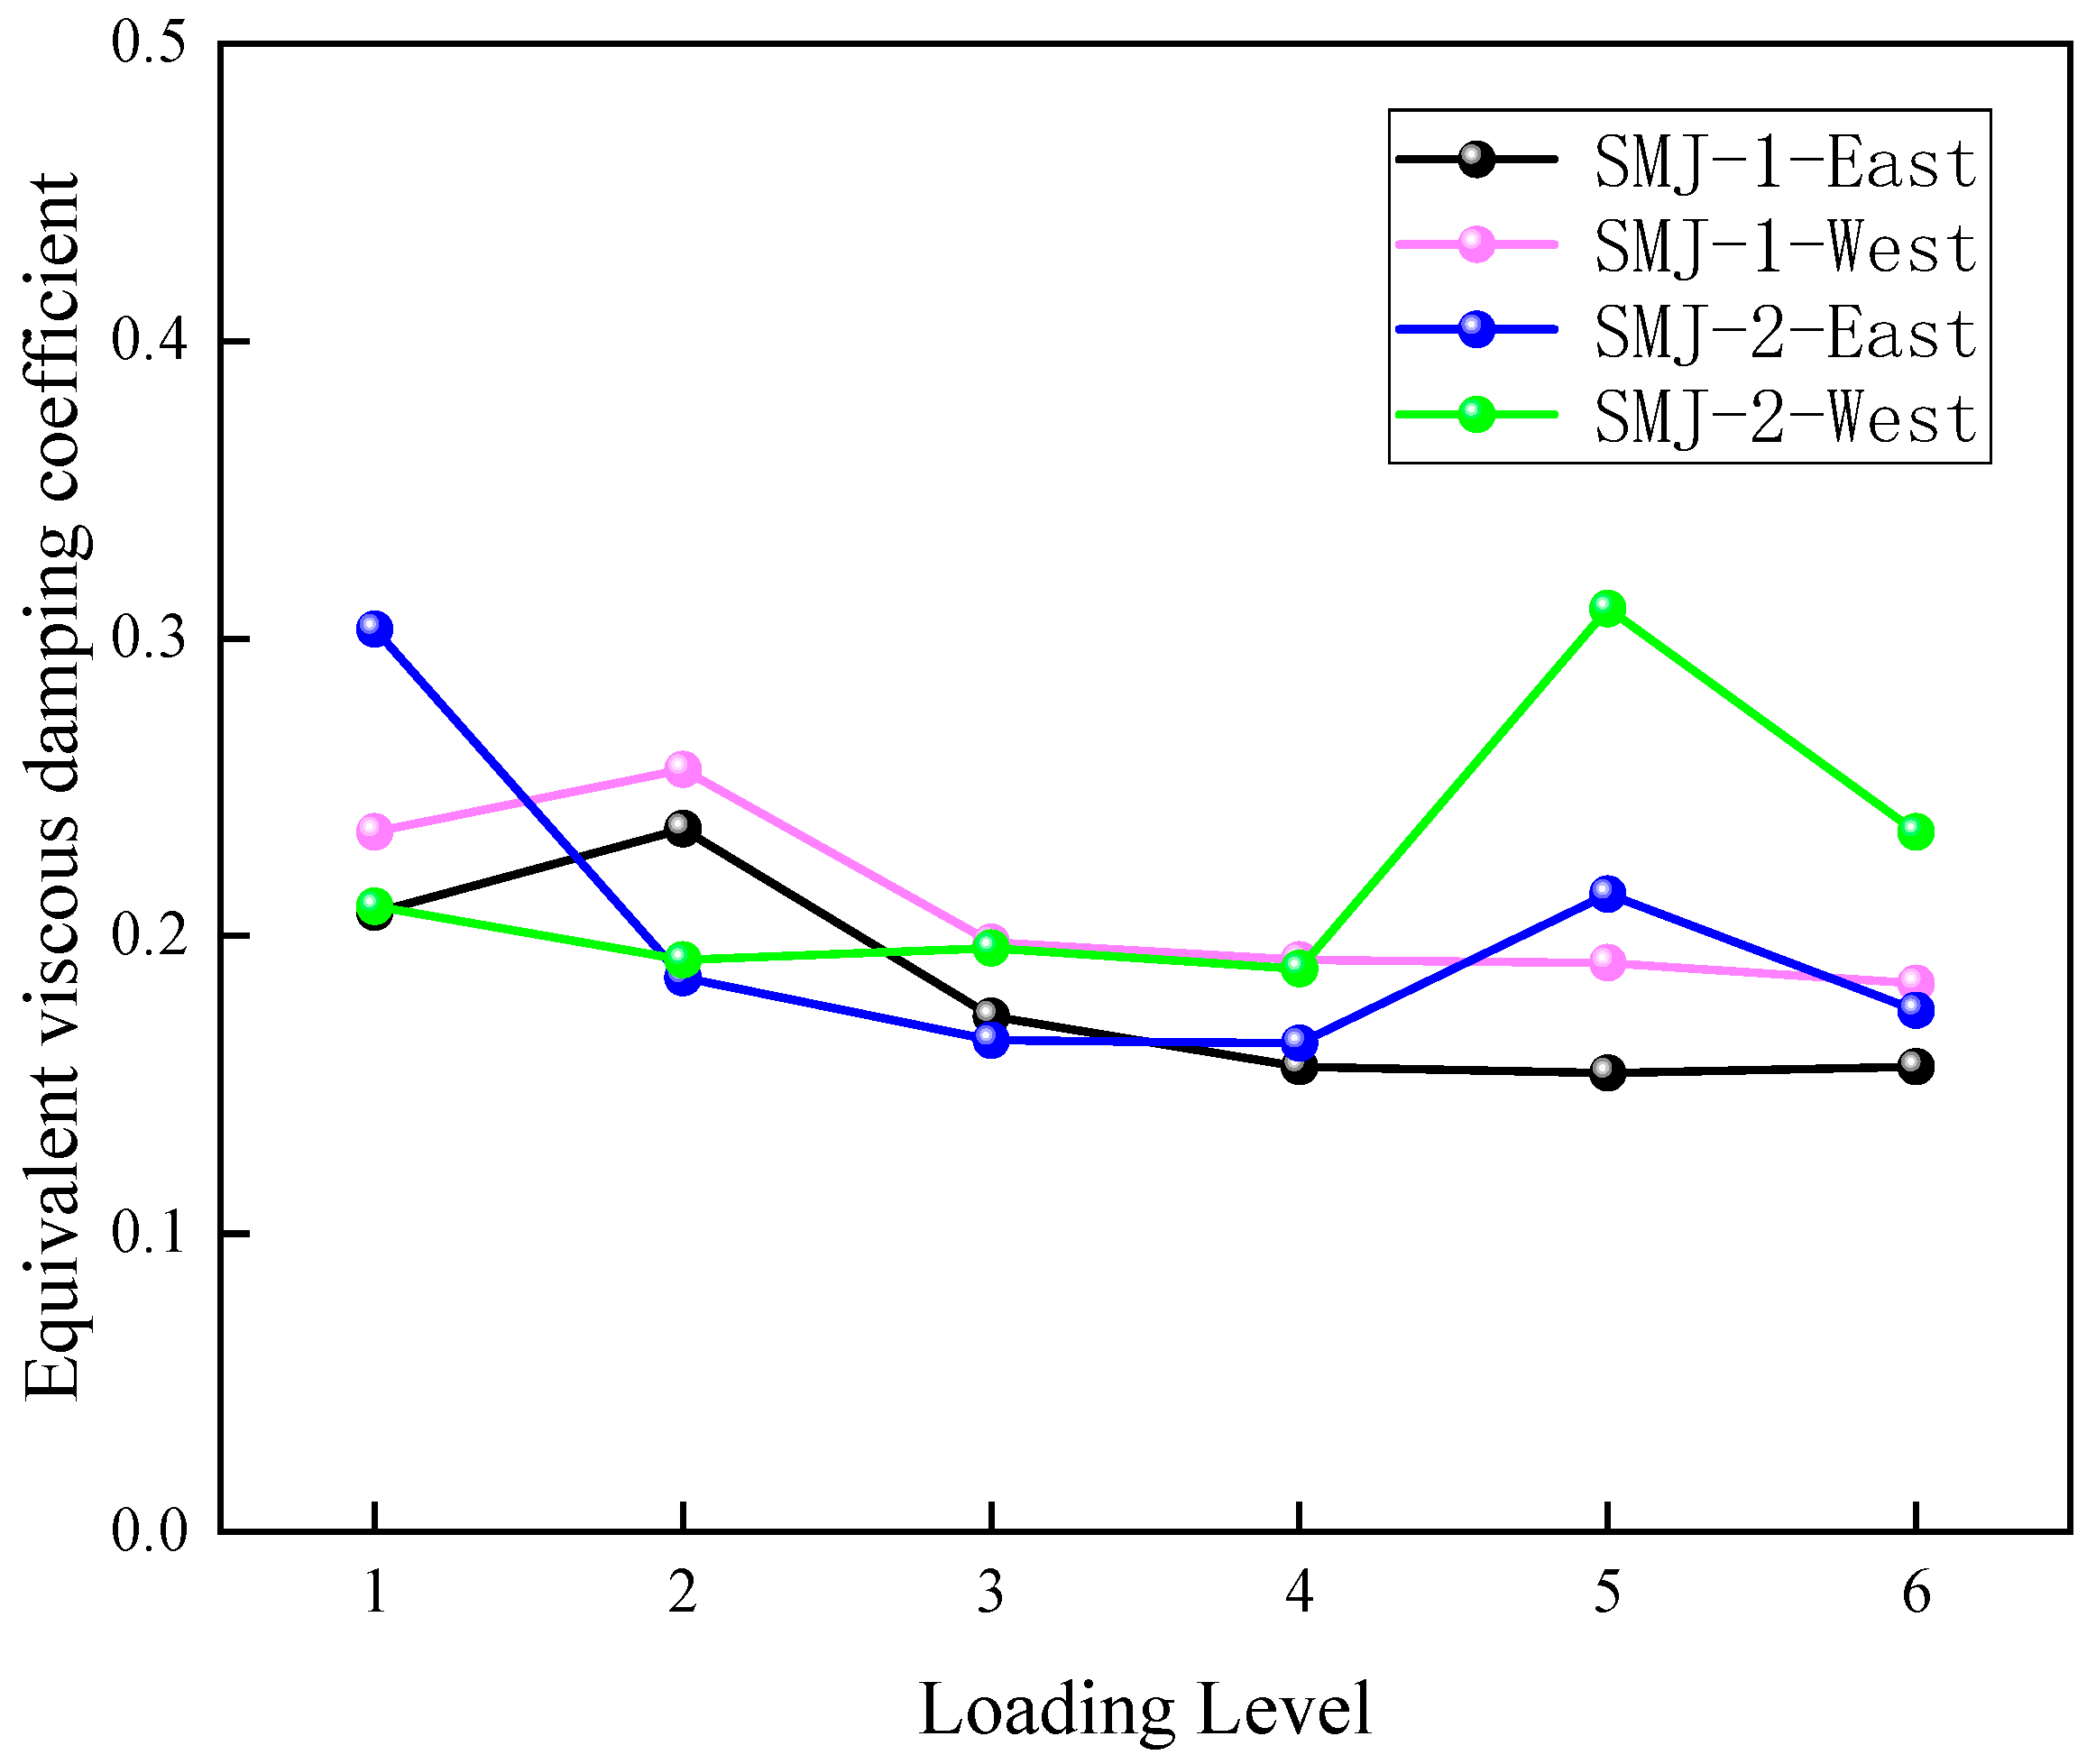
3.4. Equivalent Viscous Damping Coefficient

The equivalent viscous damping coefficient of the joint reflects the energy dissipation capacity of the joint under earthquake action [43], as shown in Figure 10. With the increase in the loading level, the equivalent viscous damping coefficient generally showed a downward trend. After the fourth level of loading, the equivalent viscous damping coefficient of SMJ-1 tended to stabilise, indicating that the joints with large plastic deformation of the T-stub steel absorb and dissipate the seismic action at an early stage. The equivalent viscosity coefficient of SMJ-2 suddenly increased to 0.262 after the fourth loading level, which was due to the large plastic angular displacement of the joint at this time, which improved the ability of the joint to absorb and dissipate earthquakes. It could be seen that after increasing the thickness of the T-stub steel, the energy dissipation capacity of the joints was significantly improved in the later stage.

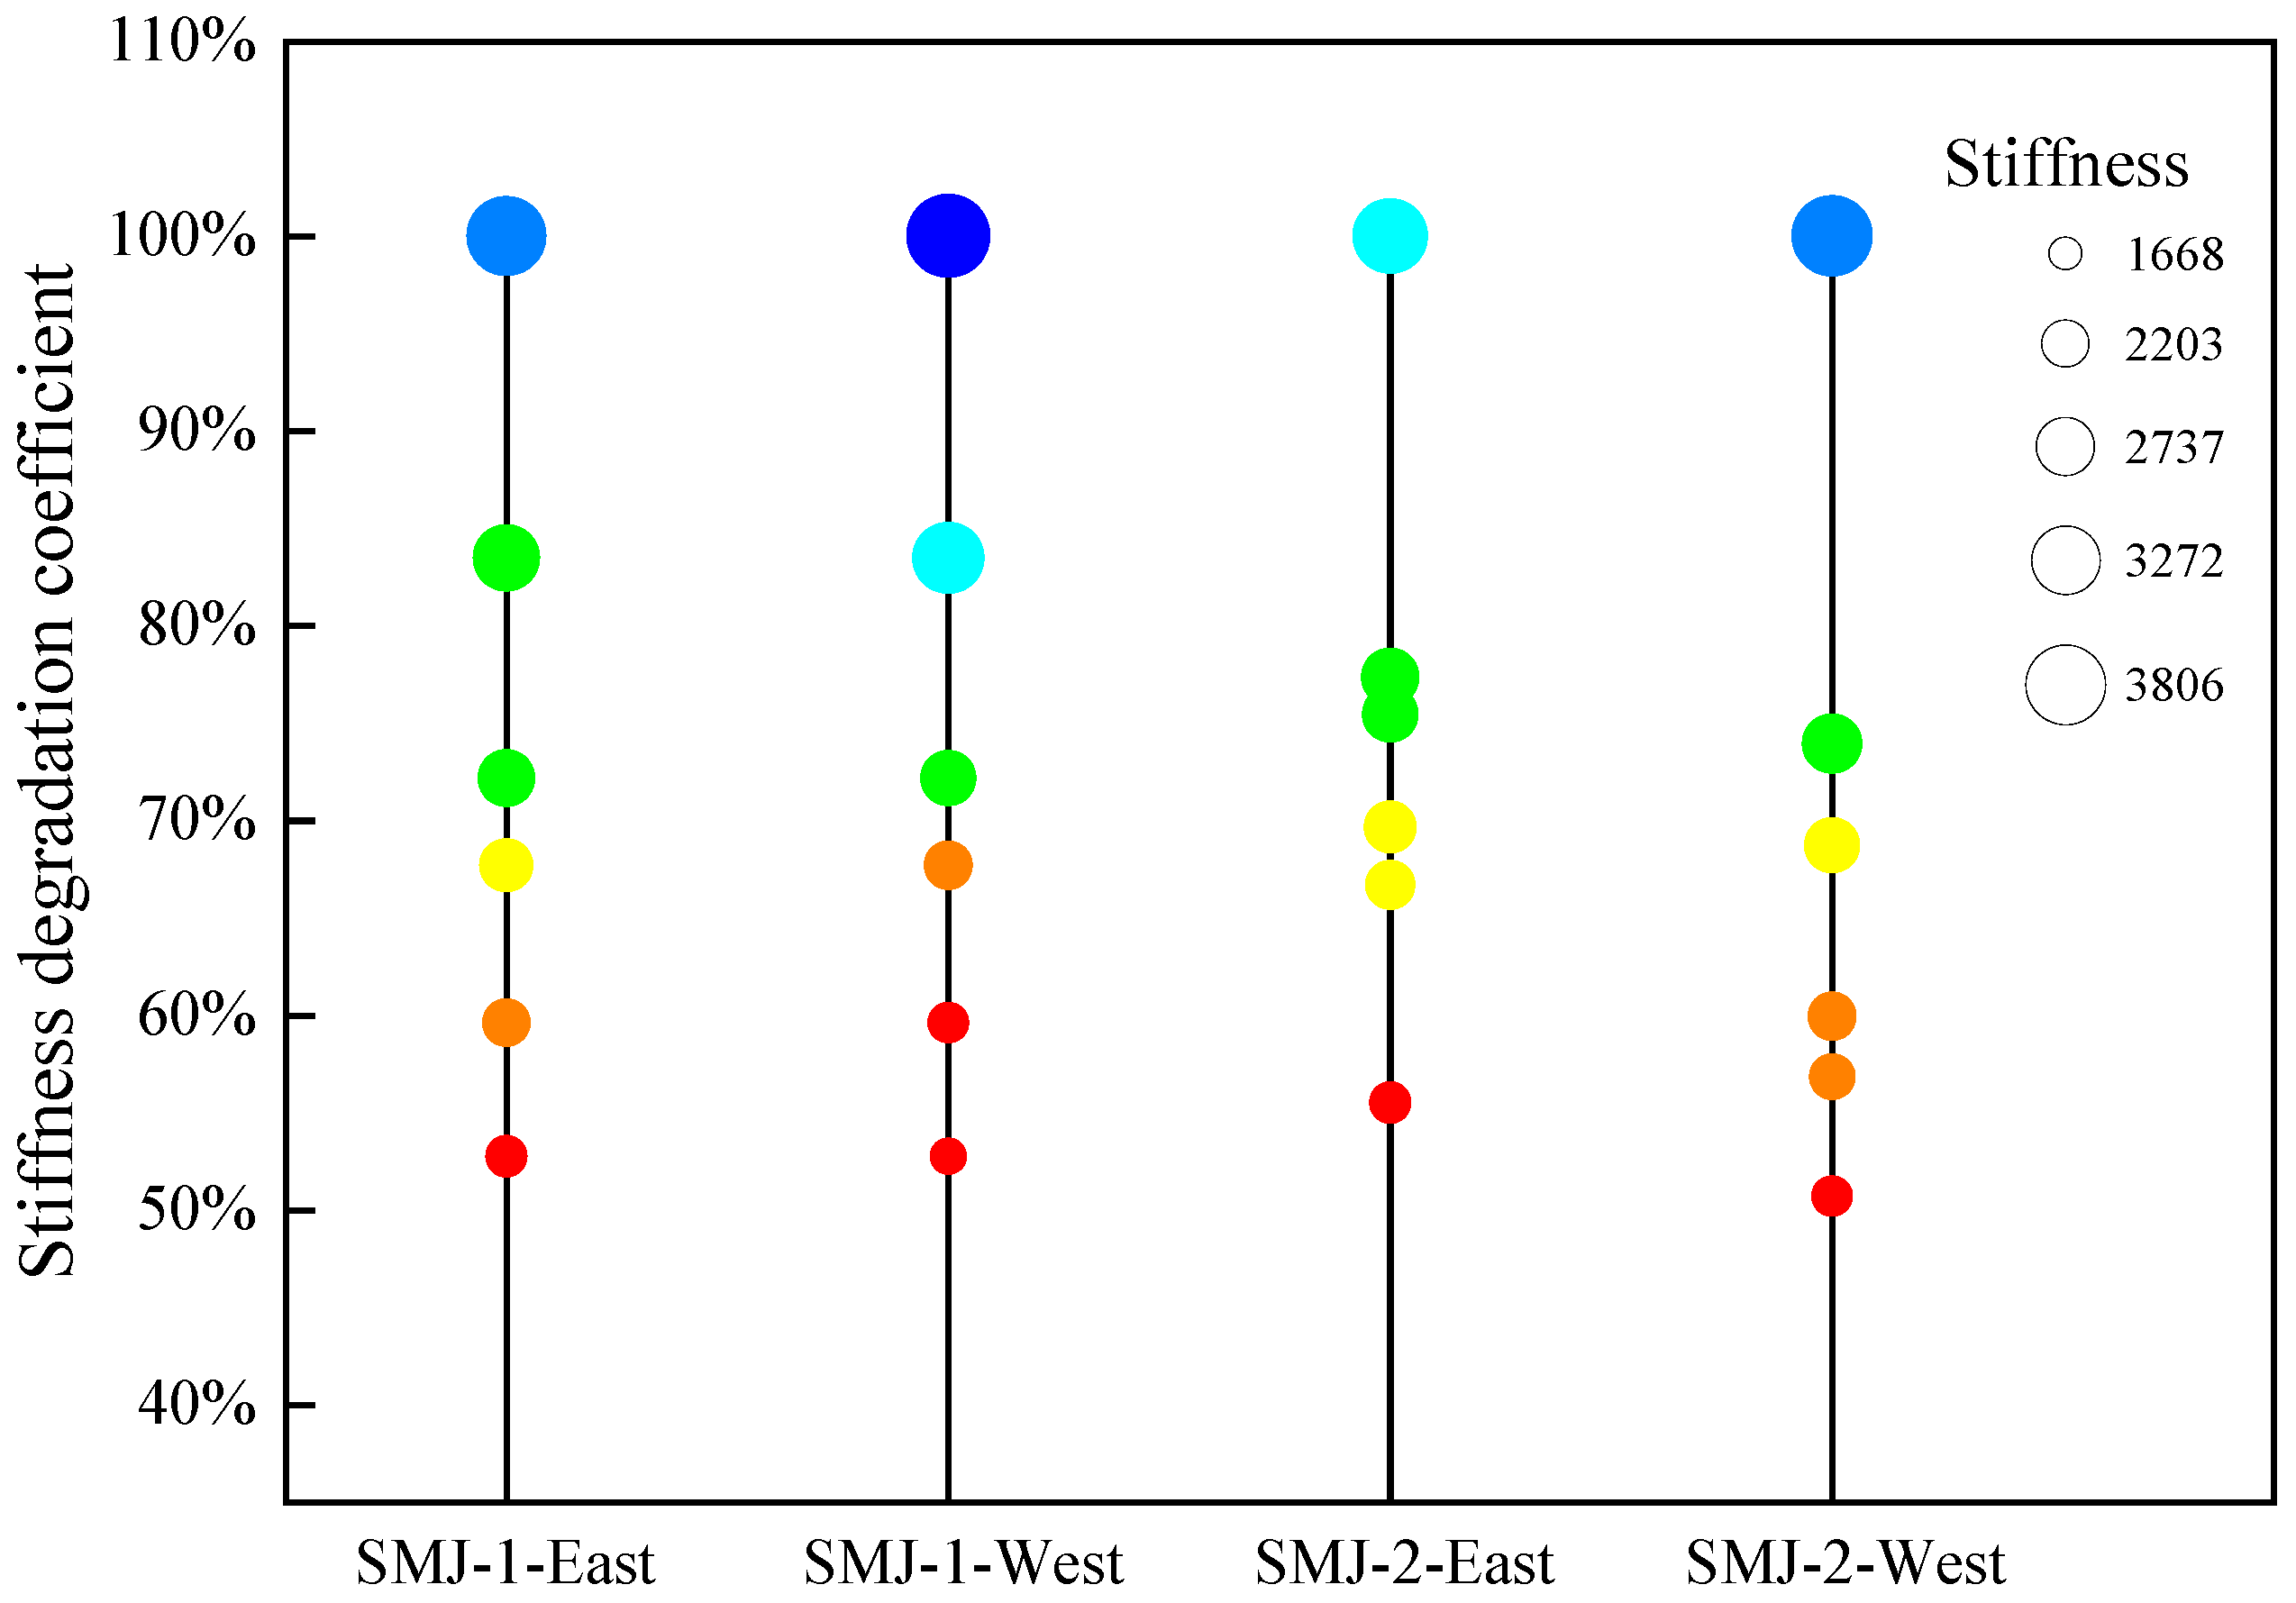
3.5. Rotational Stiffness

As the damage accumulates, the stiffness of the component will degrade. The definition of the stiffness degradation coefficient e in reference [44] is as follows:
e = K i K 0
where K 0 is the initial stiffness, K i is the stiffness of the i t h level load.
Figure 11 shows the stiffness degradation coefficient of the test. The initial stiffness of the east and west beams of SMJ-2 was 3418 kN·m/rad and 3701 kN·m/rad, respectively. This was because the tensile load-bearing capacity of the east beam was smaller than the compressive load-bearing capacity when the east actuator acted on the east beam, resulting in the difference in the initial stiffness of the east beam and the west beams. Compared with SMJ-1, the initial rotational stiffness of SMJ-2 was not significantly improved, but after the third loading level, the rotational stiffness of SMJ-2 was gradually became higher than that of SMJ-1. The average stiffness degradation coefficient of SMJ-2 was lower than that of SMJ-1 before the initial two levels. From the third loading level onward, the average stiffness degradation coefficient of SMJ-2 was higher than that of SMJ-1, indicating that as the thickness of the T-stub steel increased, although the stiffness degradation of SMJ-2 (with larger thickness) began slightly earlier than in SMJ-1, SMJ-2 demonstrated good stiffness retention at the later stages of loading.

4. Cumulative Damage
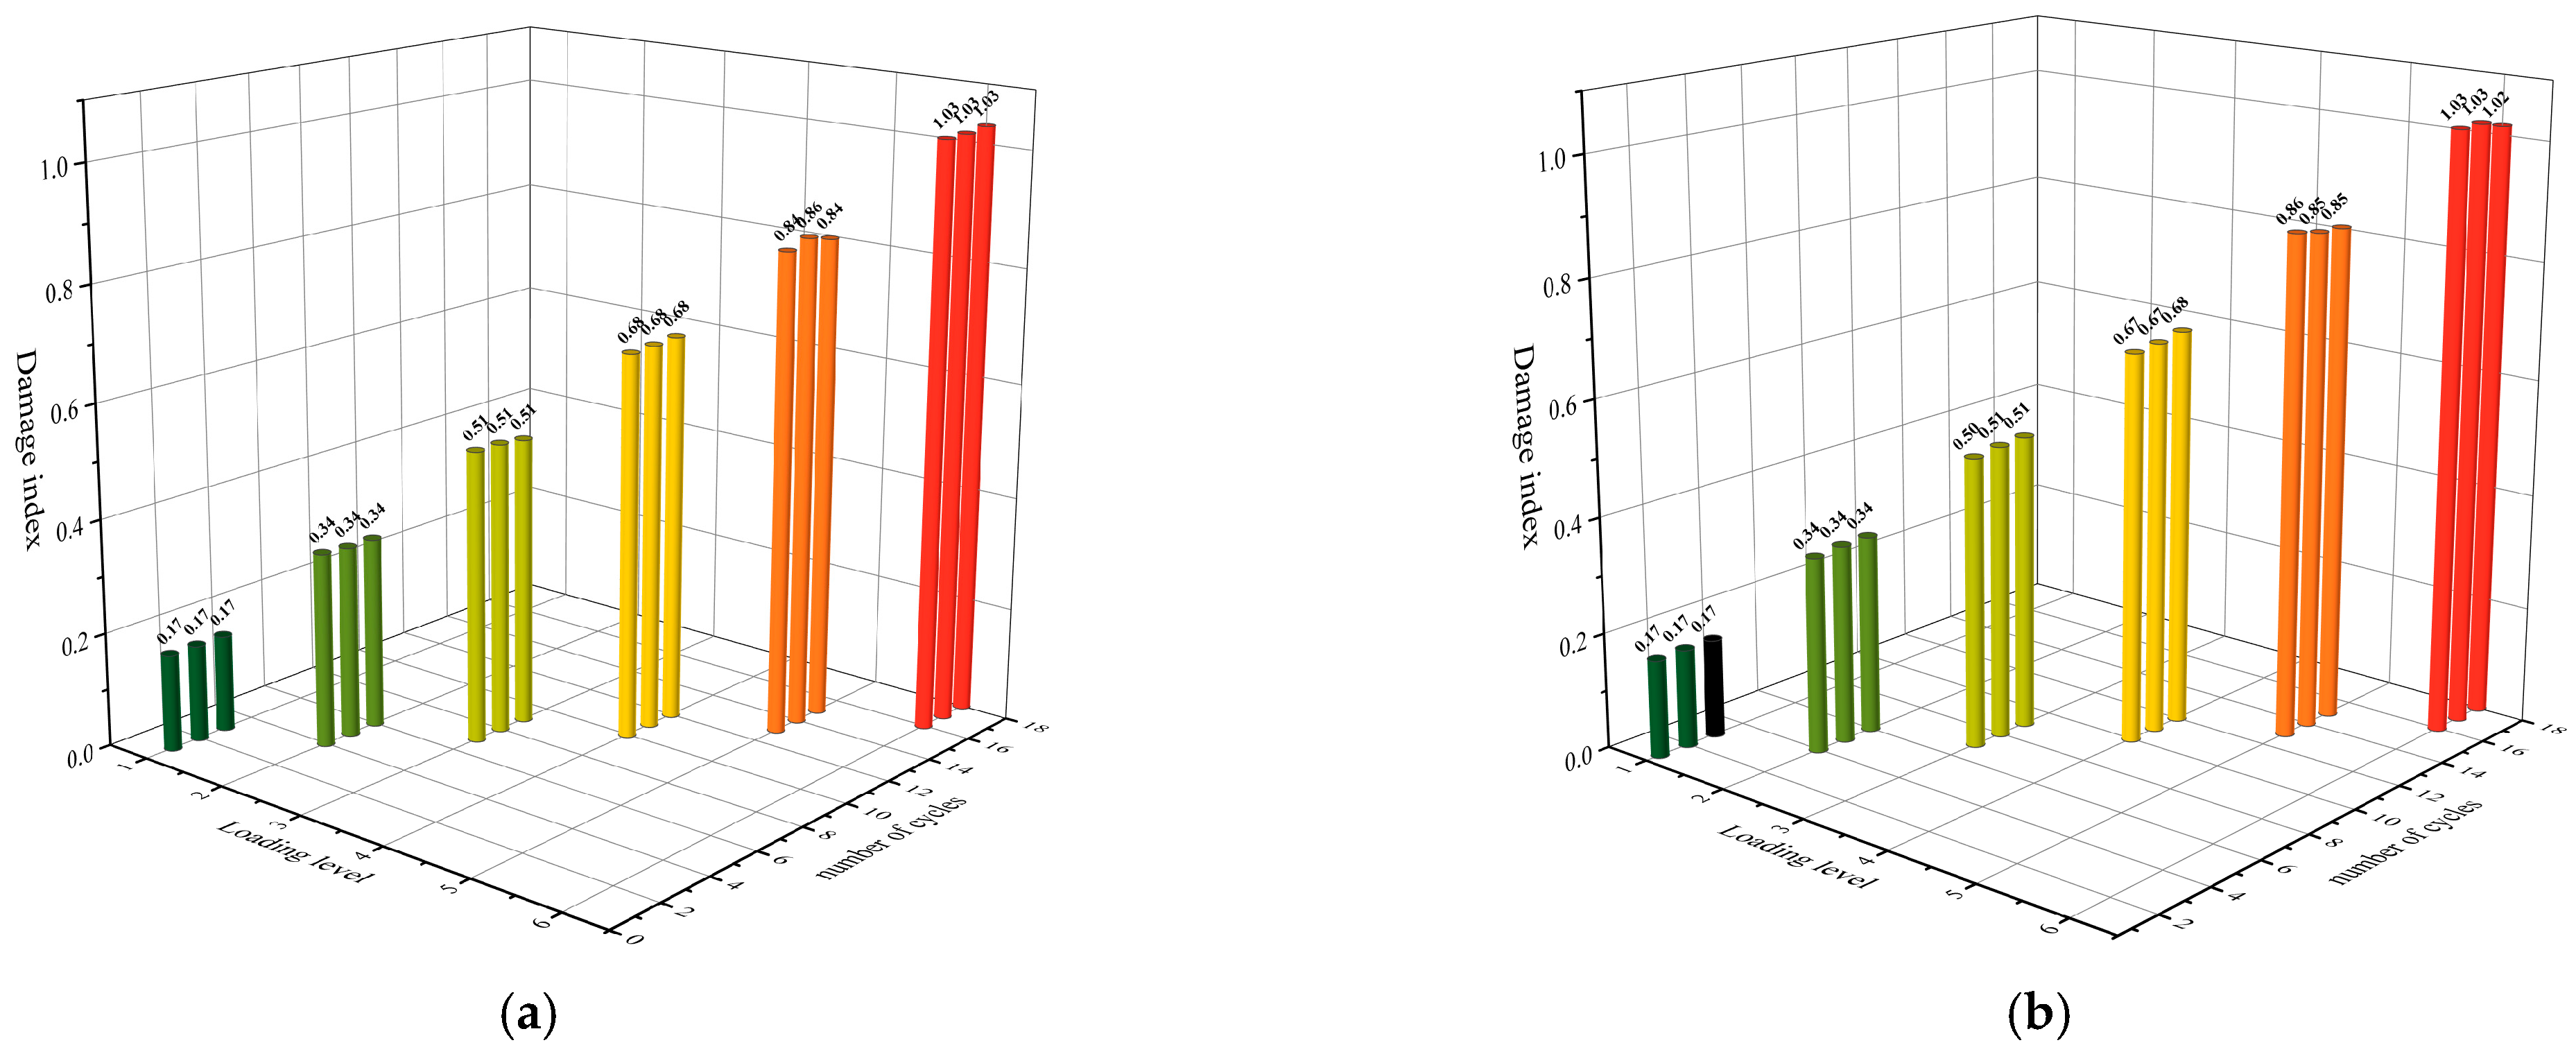
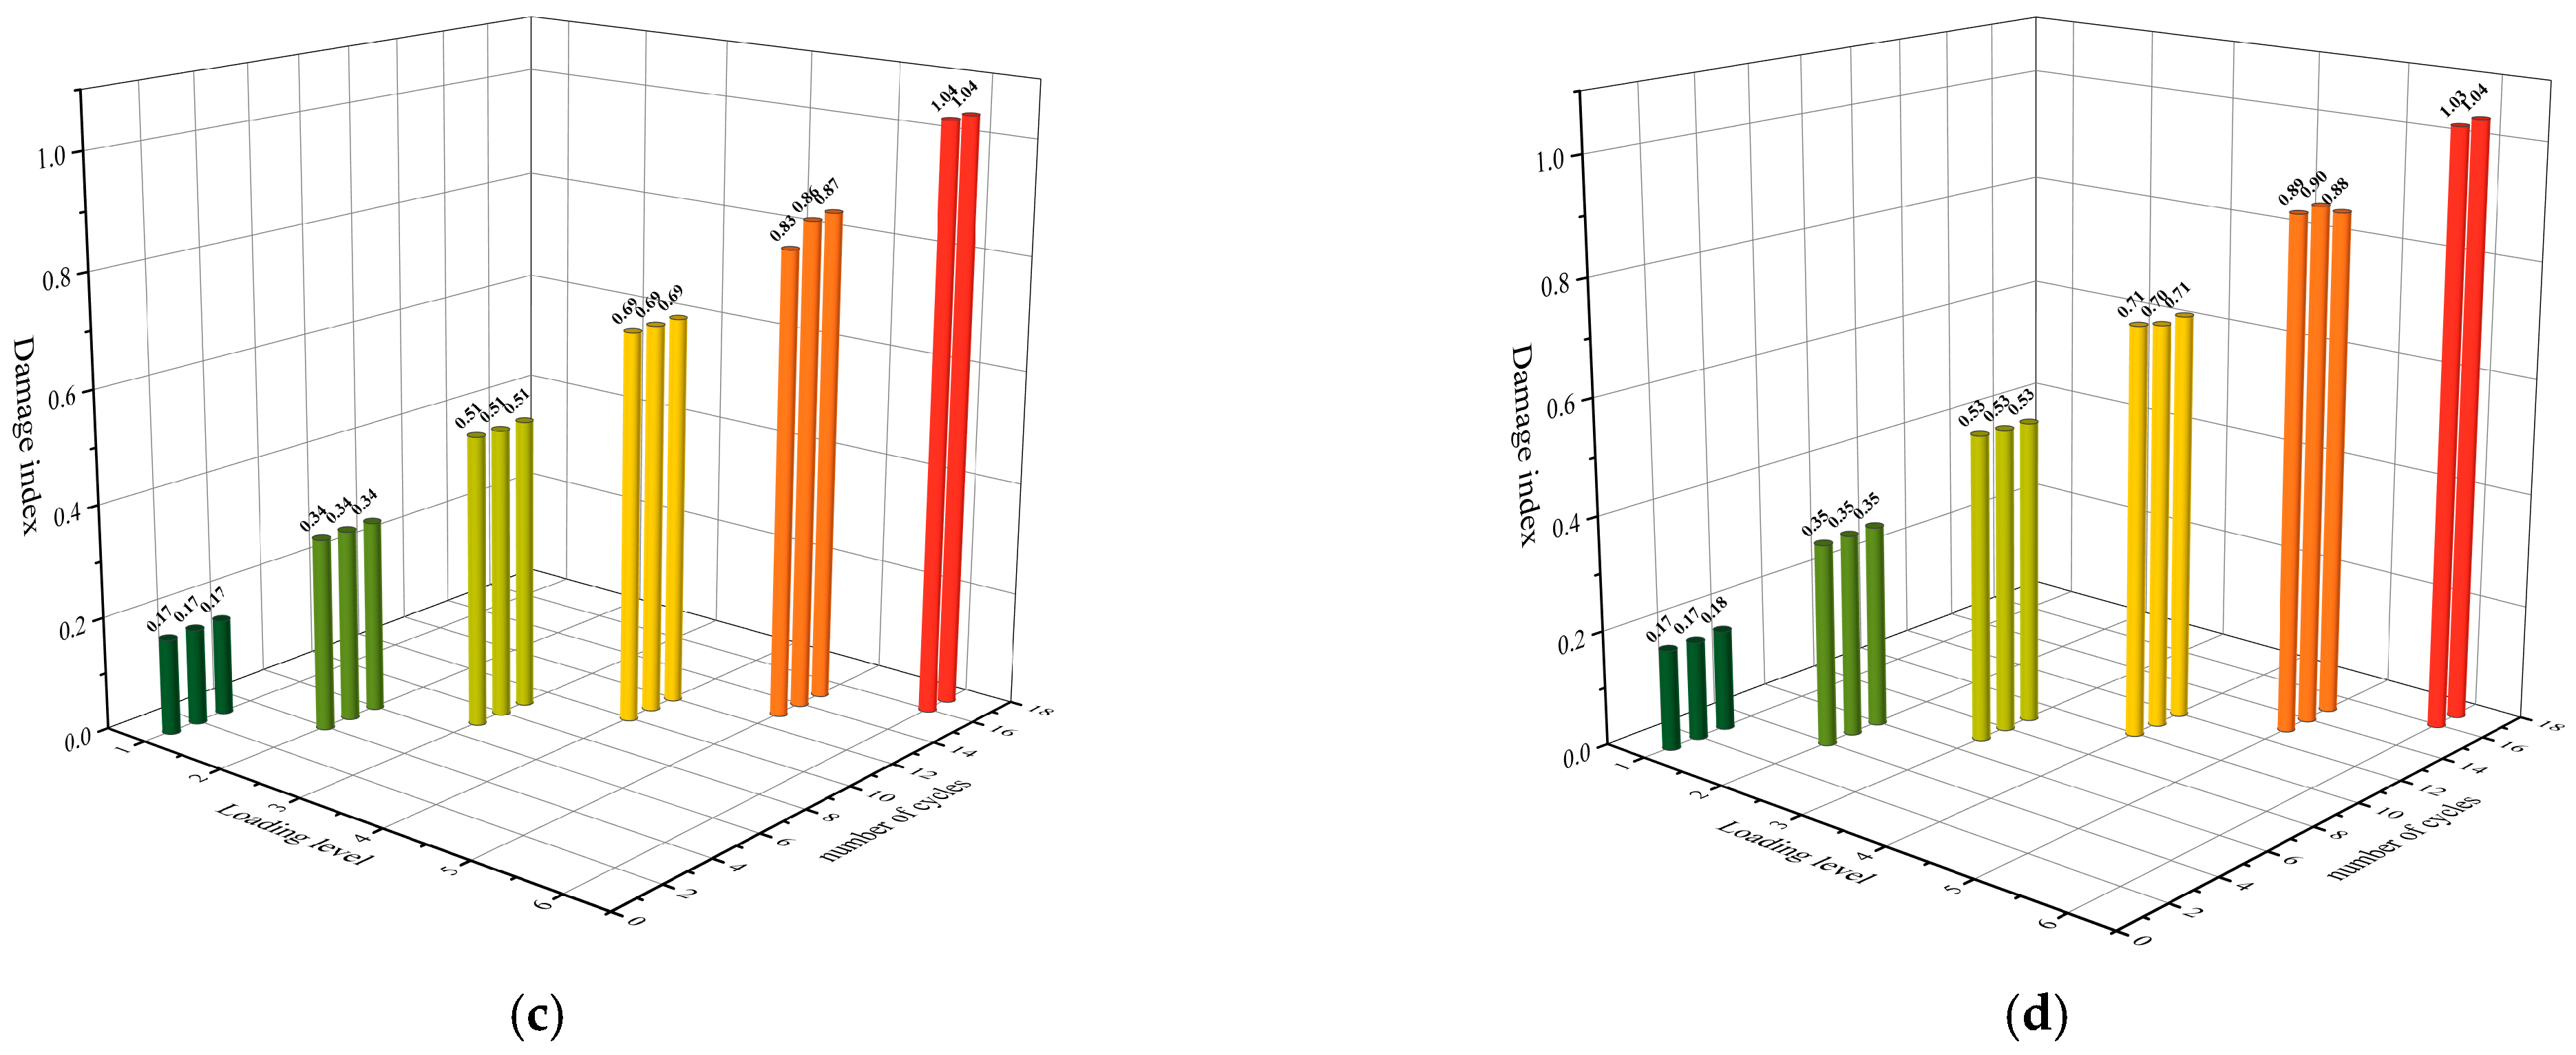
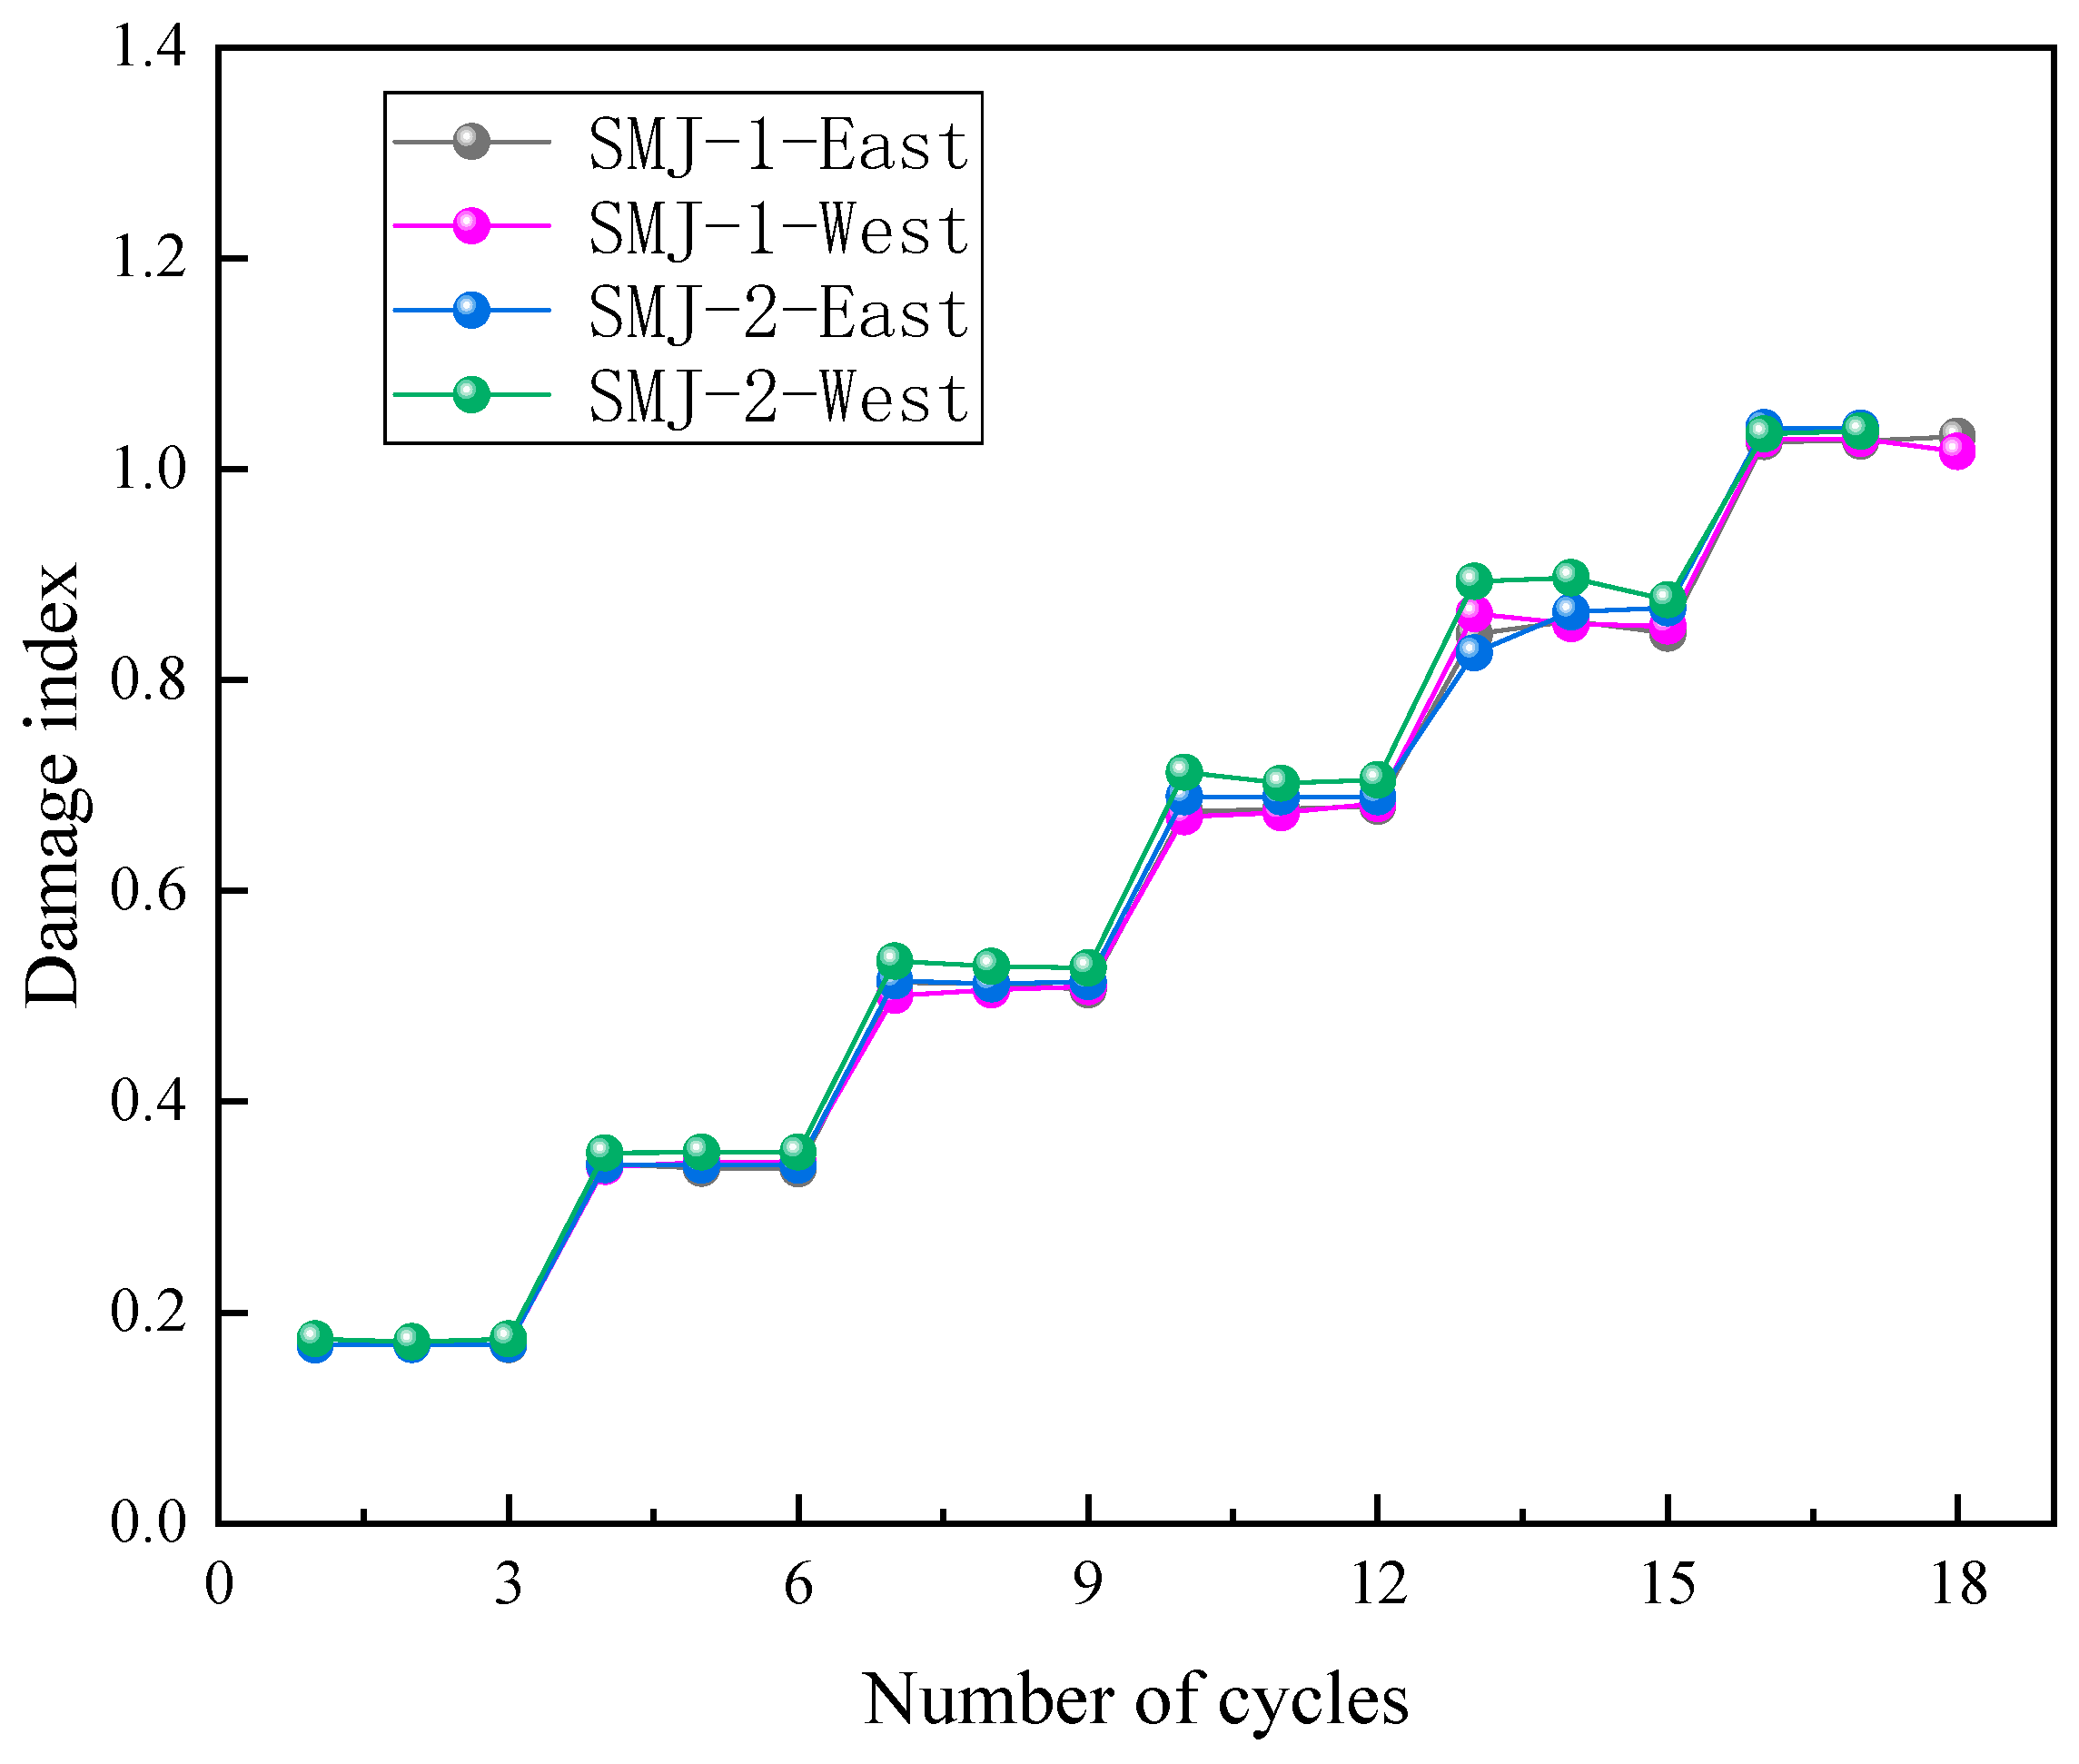
4.1. Damage Index

The plastic deformation and energy dissipation of the components under seismic loading cause structural damage to accumulate continuously. The damage index is used to evaluate the degree of damage of the components during an earthquake. In this paper, the damage index calculation method presented in reference [34] is adopted:
D = δ m δ u + β Q y δ u d E
where δ m is the maximum deformation of each load, δ u is the ultimate deformation, Q y is the calculated yield strength, and d E is the calculated cumulative hysteretic energy dissipation. For steel structures, a β value of 0.025 is adopted.
The damage index of the specimen is shown in Figure 12. At the beginning of formal loading, three load cycles were carried out for each loading level. The damage index increased significantly as the loading level increased. At the same loading level, the increase in the damage index value with the increase in the number of cycles was small. This was because, as the loading level increased, the plastic deformation of the component, combined with the cumulative hysteretic energy dissipation, contributed to damage accumulation. In contrast, at the same loading level, only the increase in hysteretic energy dissipation resulted in a certain amount of damage. At the fifth level of loading, the damage index of the specimen was close to 1, and the specimen showed an obvious damage pattern. At the sixth level of loading, the average damage indices of the SMJ-1 east and west beams were 1.03 and 1.02, respectively, as shown in Figure 12a,b. The average damage indices of the SMJ-2 east and west beams were 1.04 and 1.03, respectively, as shown in Figure 12c,d. The specimen was completely destroyed, and the damage value predicted by the model was slightly higher when evaluating such joints.
The damage Indices of the four beams are compared in Figure 13. Before the second loading level, the damage indices of the two specimens were almost the same. Starting from the third loading level, the damage index of SMJ-2 was significantly greater than that of SMJ-1, and as the loading level increased, the difference between the damage values of SMJ-2 and SMJ-1 gradually increased. When the structure was completely destroyed, the damage values were almost equal. It may be that increasing the thickness of the T-stub steel did not cause a significant increase in the damage value of the component, but it aggravated the damage of the structure in the later stage of plastic development.

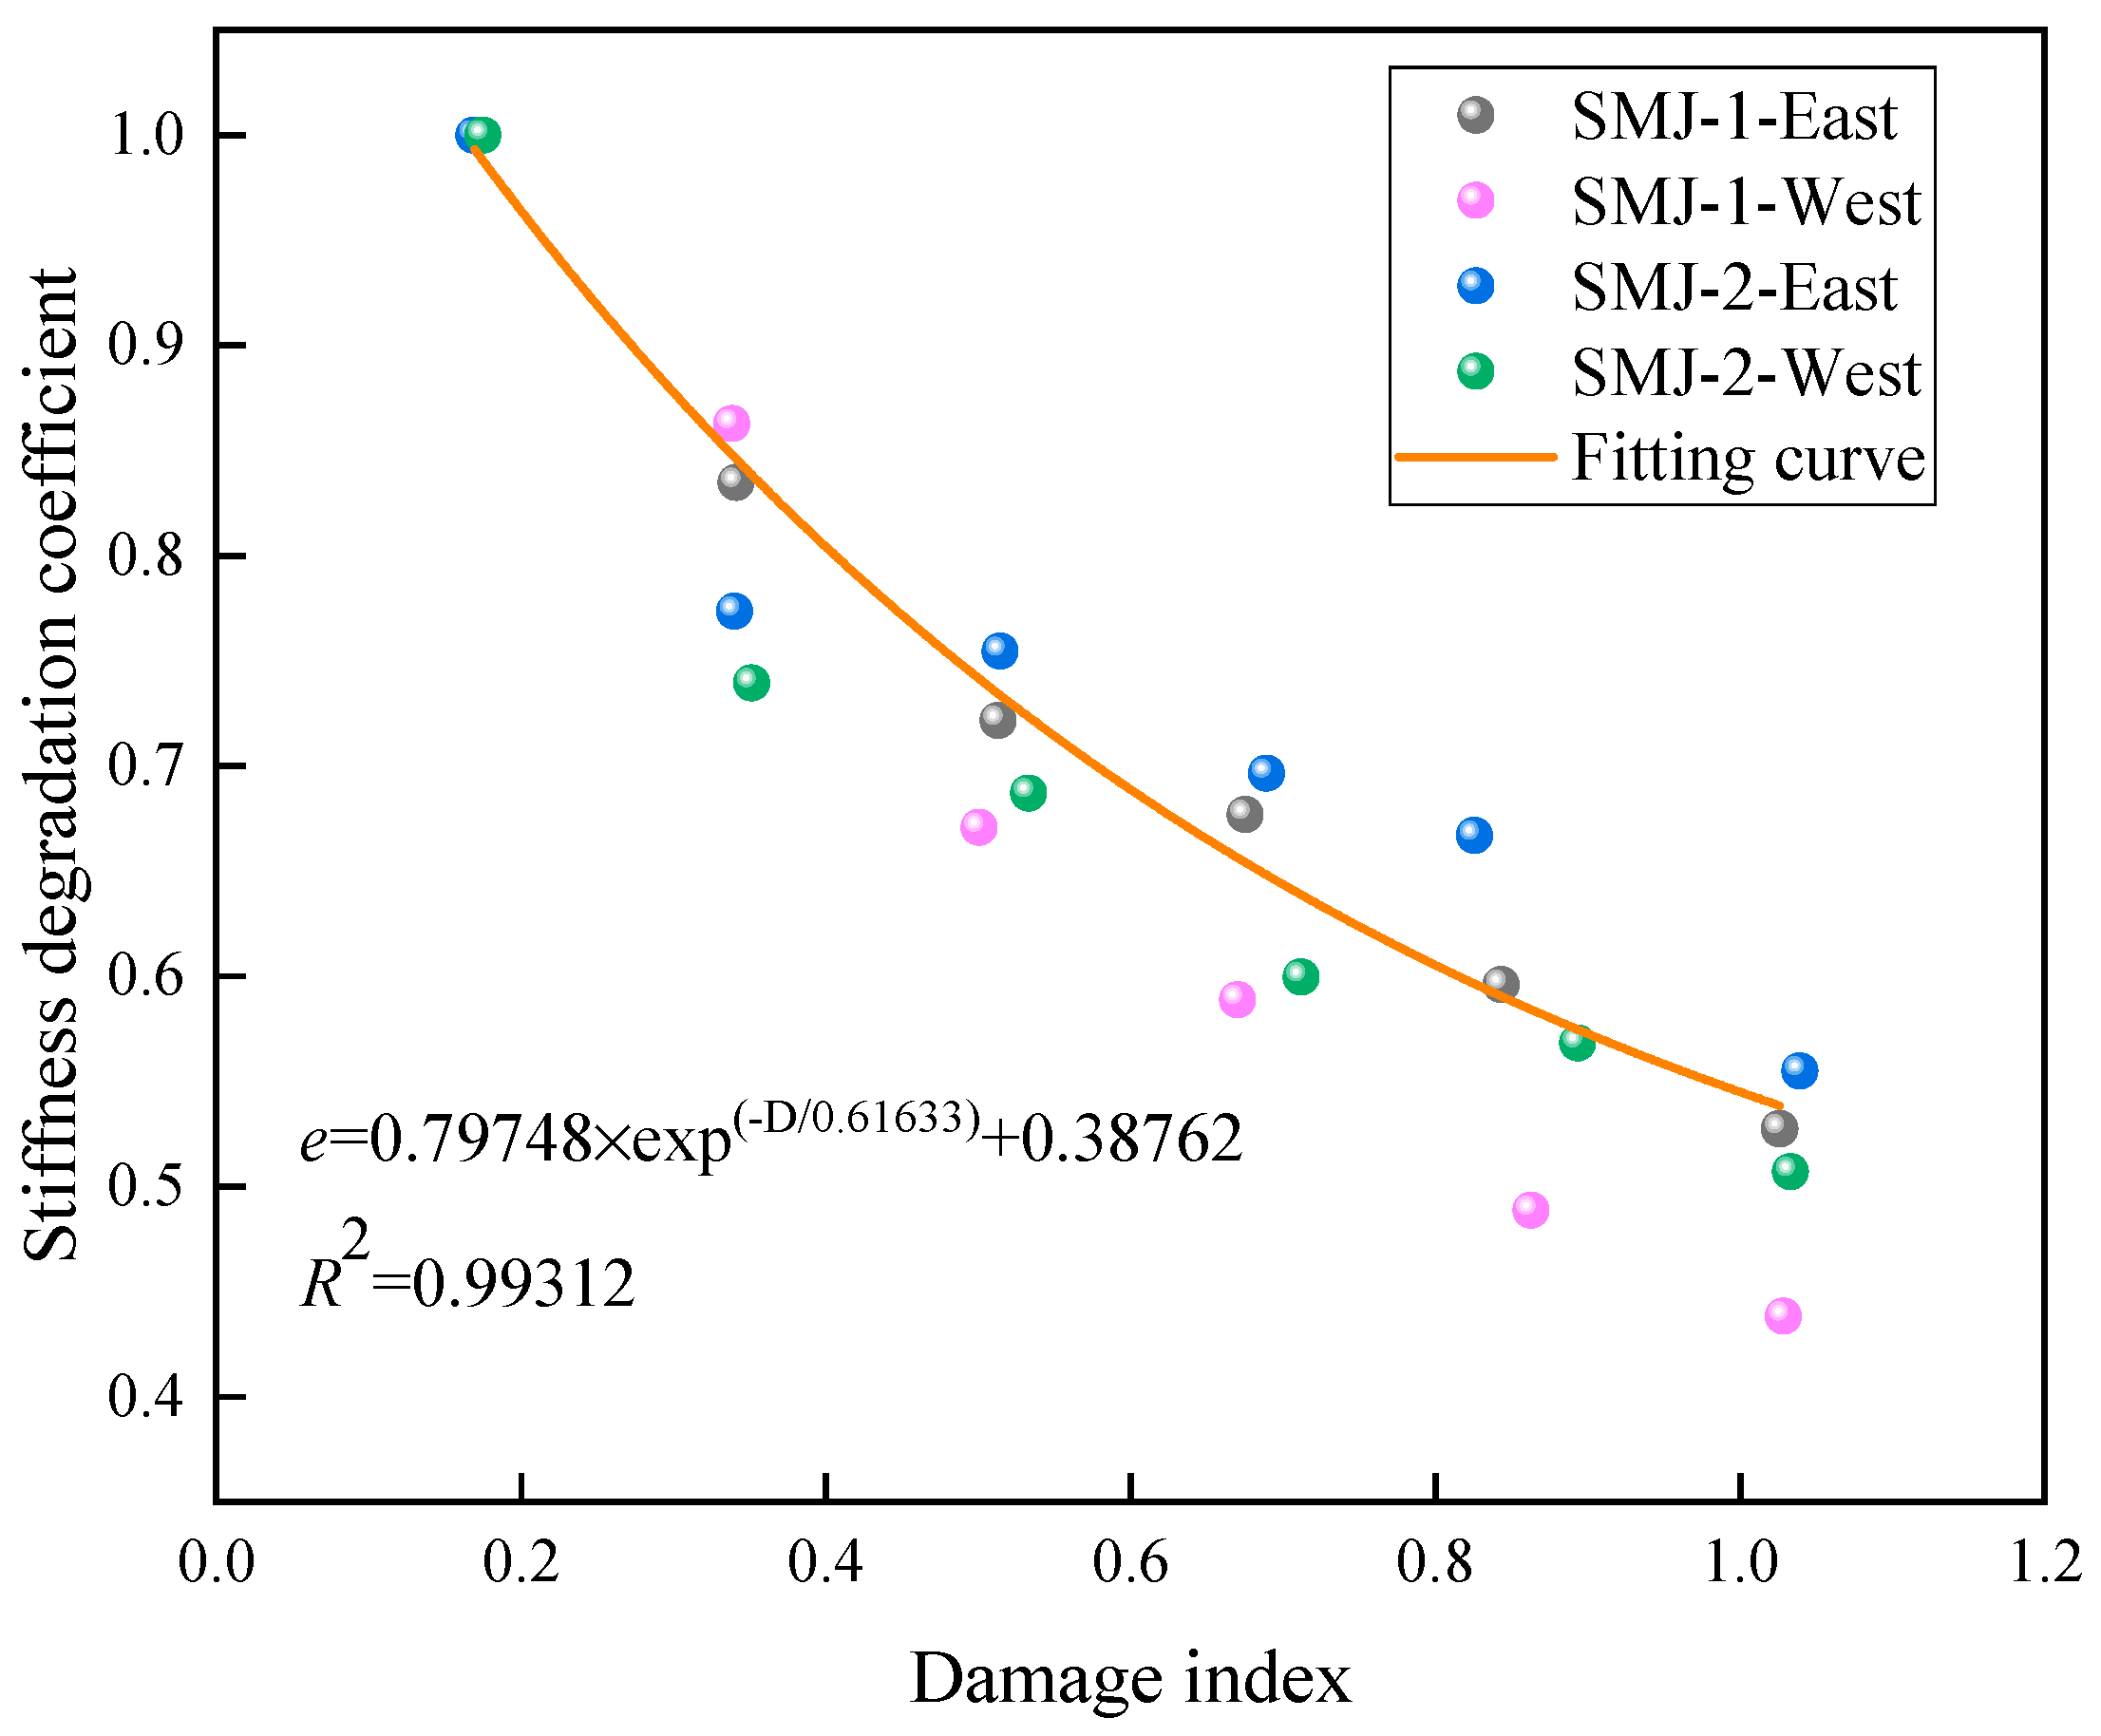
4.2. Establishment of Rotational Stiffness Model Considering Damage Index

As the loading level increased, the reduction in rotational stiffness was severe, which was consistent with the increase in the damage index. At the same loading level, the slight increase in the damage index also indicated that the strength degradation was not obvious. Therefore, this part focuses on the analysis of the relationship between the damage index and the stiffness degradation coefficient and establishes a rotational stiffness model considering damage. The purpose was to study the degradation of rotational stiffness at different loading levels due to the development of the damage mechanism and to conveniently evaluate the rotational stiffness of joints from the perspective of damage.

4.2.1. Polynomial Model

Figure 14 shows the stiffness degradation coefficients of the east and west beams of the two specimens at different damage indexes. As the damage index increased, the stiffness degradation coefficient showed a non-linear downward trend. Therefore, the quadratic polynomial in the polynomial model was selected to fit all the data. The coefficient of determination R2 was 0.98965, reflecting the good accuracy of the fit. The red curve in Figure 14 is the fitting curve, and the polynomial function corresponding to the curve is as follows:
e = 1.14177 − 0.9787D + 0.38012D2
Substituting Formula (1) into Formula (3), the rotational stiffness of each level load was obtained:
Ki = K0 × (1.14177 − 0.9787D + 0.38012D2)
where e is the stiffness degradation coefficient, K 0 is the initial rotational stiffness, K i is the secant stiffness of the i t h level load, and D is the damage index of each level load.

4.2.2. Exponential Model

Figure 15 shows the stiffness degradation coefficients of the east and west beams of the two specimens at different damage indexes. As the damage index increased, the stiffness degradation coefficient showed a non-linear downward trend. Therefore, the quadratic polynomial in the polynomial model was selected to fit all the data. The coefficient of determination R2 was 0.98965, reflecting the good accuracy of the fit. The red curve in Figure 15 is the fitting curve, and the polynomial function corresponding to the curve was as follows:
e = 0.79748 × exp ( D / 0.61633 ) + 0.38762
By substituting Formula (1) into Formula (3), the rotational stiffness of each level load was obtained:
K i = K 0 × [ 0.79748 × exp ( D / 0.61633 ) + 0.38762 ]
where e is the stiffness degradation coefficient, K 0 is the initial rotational stiffness, K i is the secant stiffness of the i t h level load, and D is the damage index of each level load.

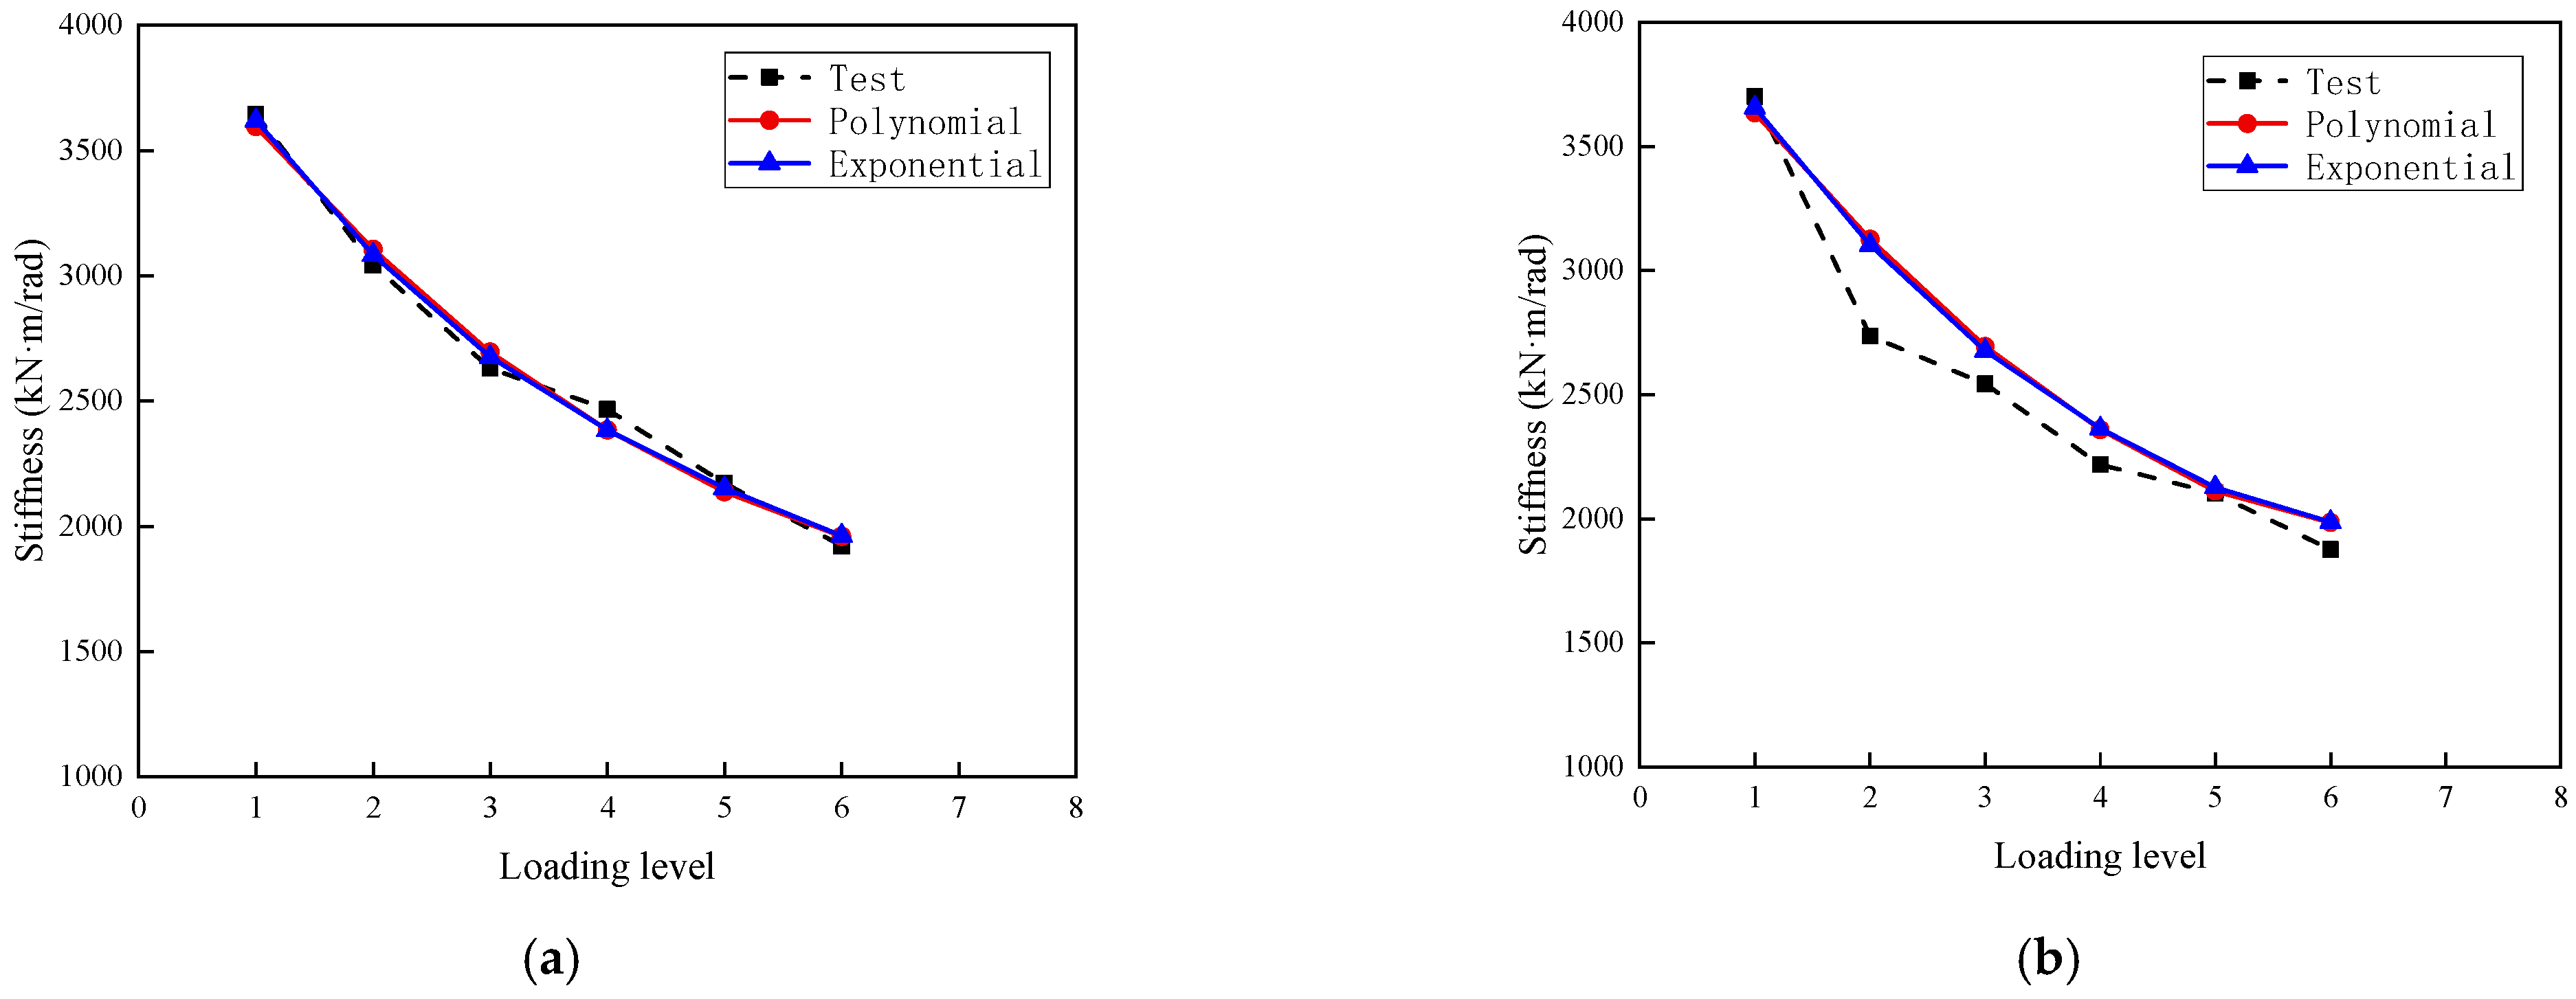
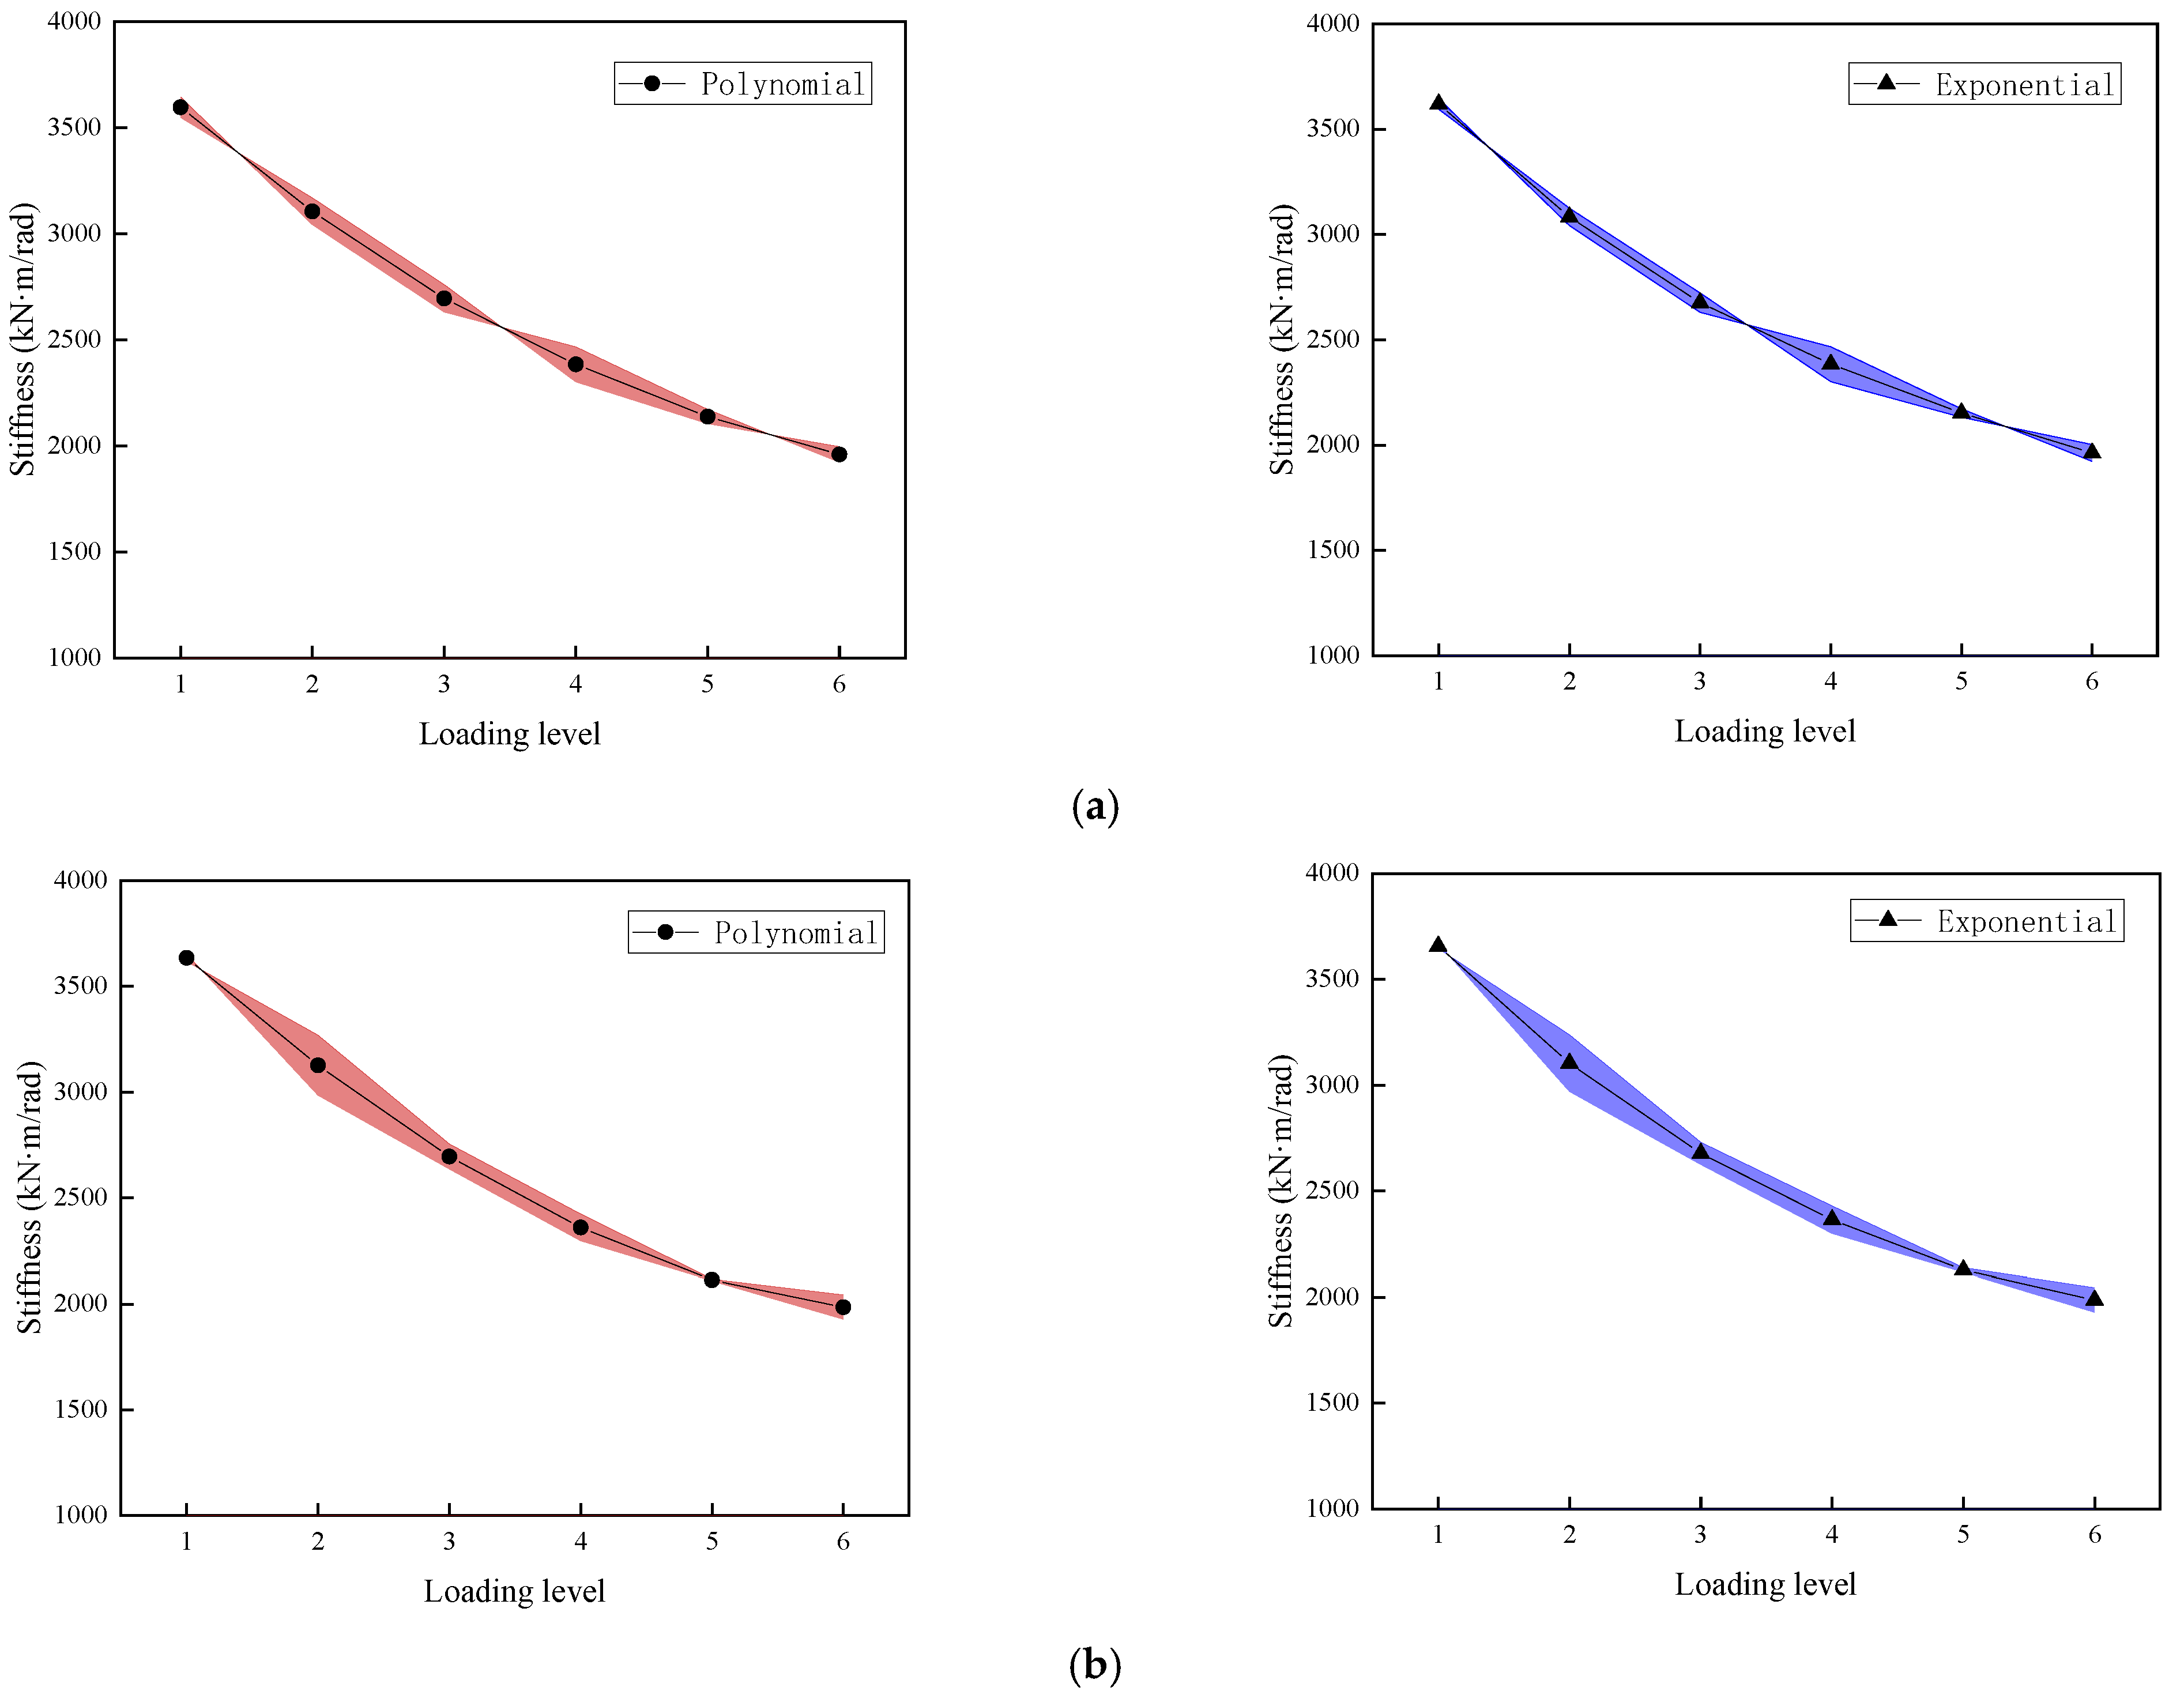
4.3. Experimental Verification

The rotational stiffness of the test specimen was calculated theoretically by using the rotational stiffness calculation formulae proposed in Formulae (4) and (6), respectively, and compared with the rotational stiffness under each loading level obtained from the test, as shown in Figure 16. The stiffness values obtained by the polynomial function and the exponential function were close to each other, which was basically consistent with the experimental values, indicating that the stiffness values obtained by these two expressions are reasonable. For SMJ-1, which features a small T-stub steel thickness, the theoretical stiffness value of the first three loading levels was higher than the experimental value. From the fourth loading level, the theoretical stiffness value was less than the experimental value. For SMJ-2, which features a large T-stub steel thickness, the stiffness values of the two models were generally larger than the test values, but as the loading level increased, this gap gradually narrowed. This was due to the fact that the stiffness of SMJ-2 was greatly reduced at the second level of test loading, while the reduction in the two models was slower.
Figure 17 shows the error band between the theoretical calculation value and the experimental value of the rotational stiffness of the two specimens. As shown in Figure 17a, the maximum error rate of SMJ-1 occurred at the fourth loading level. The error rate of the polynomial model and the exponential models was 3.4%. The specimen finally reached about 2% when it was destroyed at the sixth loading level, and the error rate of the exponential model was slightly lower than that of the polynomial model. As shown in Figure 16b, the maximum error rate of SMJ-2 occurred at the second loading level. The error rates of the polynomial model and the exponential models were 14.2% and 13.4%, respectively, and finally reached 5.8% when the sixth loading level was destroyed. At the same time, it was found that the calculated rotational stiffness values of the two models were lower than the initial rotational stiffness values due to the existence of the damage index value when the first level load was applied at the initial stage of loading. Therefore, it was recommended to use the two models to evaluate the stiffness degradation of the joints from the second loading level.
Through analysis, it was known that the polynomial function model and the exponential function model proposed in this paper reasonably reflected the influence of the damage development process of the joint on the reduction of rotational stiffness. The two models were suitable for the evaluation of the whole process rotational stiffness of the joints with a smaller T-stub steel thickness. For the joints with a larger T-stub steel thickness, the stiffness value in the early stage of theoretical calculation was larger, but the stiffness evaluation in the later stage of loading was also more reasonable. In general, the stiffness value calculated by the exponential model was closer to the experimental value. However, the two models depend on the value of the damage index, and the results are more reasonable when the damage value is 0 in the elastic stage.

5. Conclusions

I The following main conclusions were drawn from the analysis of the seismic damage behaviour of the middle column joints with blind-bolted connections.
  • For the same size of the beam and column, the damage region of the beam–column joint was shifted from the root of the T-stub steel flange to the vicinity of the bolt hole of the column wall as the thickness of the T-stub steel increased.
  • The load–displacement curve was pinched. As the thickness of the joint increased, the ultimate load capacity and ultimate displacement of SMJ-2 were significantly higher than those of SMJ-1. The energy consumption of SMJ-2 was significantly higher than that of SMJ-1. However, the energy consumption of SMJ-1, which had a thinner T-stub steel, was higher in the early stage than in the later stage, while the energy consumption of the thicker SMJ-2 was improved in the later stage.
  • At the beginning of the test, the rotational stiffness of the specimens with different thicknesses of T-stub steel was not much different. At the plastic stage, the rotational stiffness and stiffness degradation coefficient of SMJ-2, which had a thicker T-stub steel, were higher than those of SMJ-1. Increasing the thickness of the T-stub steel helped to reduce the rate of stiffness degradation.
  • The damage index value increased significantly with the increase in the loading level, and the increase was not large at the same loading level, indicating that it was reasonable to consider the plastic deformation and the cumulative hysteretic energy at the same time. The increase in the thickness of the T-stub steel would aggravate the damage of the joints in the later stage of the plastic stage, but the increase in the damage index was not significant.
  • Two types of rotational stiffness models considering damage index were proposed: a polynomial function model and an exponential function model, respectively. They reflect the rotational stiffness of such blind-bolted joints at different stages of damage development. Rotational stiffness was calculated by the damage index value and the initial rotational stiffness instead of the bending moment capacity and rotation of each level load. Both models could be used to evaluate rotational stiffness. Compared to the polynomial model, the exponential model was more advantageous in evaluating the rotational stiffness of the T-stub steel joints with smaller thickness.
  • It is suggested that the thickness of the T-stub steel flange of the joint is greater than the thickness of the column wall, in order to avoid the fracture of the connector. When evaluating the rotational stiffness degradation of the joints, the rotational stiffness model considering the damage index is recommended. For evaluating the stiffness over the whole process of the joints with small T-stub steel thickness, the exponential model is preferred. The polynomial model is a good choice for evaluating the stiffness of the thicker joints of T-shaped steel in the later stage of plasticity.

Author Contributions

Conceptualization, S.Y. and X.W.; methodology, H.L.; validation, Y.C.; formal analysis, Y.L.; writing—original draft preparation, H.L.; writing—review and editing, H.L.; supervision, S.Y.; funding acquisition, X.W. All authors have read and agreed to the published version of the manuscript.

Funding

This work was funded by the Central Plains Science and Technology Innovation Leading Talents Program (No. 214200510002). This work was supported by the Education Department of Henan Province Project (No. 25B560018) and the Henan Provincial Department of Science and Technology Project (No. 24210230018), and Natural Science Foundation of Henan Province of China (No. 252300421260).

Data Availability Statement

The testing and analysis data used to support the findings in this study are included within the article.

Conflicts of Interest

The authors declare no conflict of interest.

References

  1. Luo, L.; Qin, J.; Zhao, D.; Wu, Z. Seismic Behavior of Extended End-Plate Connections Subjected to Cyclic Loading on the Top-Side of the Column. Materials 2020, 13, 3724. [Google Scholar] [CrossRef] [PubMed]
  2. Luo, L.; Du, M.; Yuan, J.; Shi, J.; Yu, S.; Zhang, Y. Parametric Analysis and Stiffness Investigation of Extended End-Plate Connection. Materials 2020, 13, 5133. [Google Scholar] [CrossRef] [PubMed]
  3. Wang, X.W. Research on Beam-to-Column Connections of Steel Frame. Ph.D. Thesis, Wuhan University of Technology, Wuhan, China, 2003. [Google Scholar]
  4. BU, X.; Gu, Q.; Wang, X.W. Experimental Study on the Seismic Performance of Three-Dimensional Beam to Middle Column Connection with T-Stub. Eng. Mech. 2017, 34, 105–116. [Google Scholar]
  5. Wang, Z.Y.; Tizani, W.; Wang, Q.Y. Strength and initial stiffness of a blind-bolt connection based on the T-stub model. Eng. Struct. 2010, 32, 2505–2517. [Google Scholar] [CrossRef]
  6. Amin, M.N.; Zaheer, S.; Alazba, A.A.; Saleem, M.U.; Niazi, M.U.K.; Khurram, N.; Amin, M.T. A Component-Based Study of the Effect of Diameter on Bond and Anchorage Characteristics of Blind-Bolted Connections. PLoS ONE 2016, 11, e0149490. [Google Scholar] [CrossRef]
  7. Tizani, W.; Abd Rahman, N.; Pitrakkos, T. Fatigue life of an anchored blind-bolt loaded in tension. J. Constr. Steel Res. 2014, 93, 1–8. [Google Scholar] [CrossRef]
  8. Zhu, X.; Wang, P.; Liu, M.; Tuoya, W.; Hu, S. Behaviors of one-side bolted T-stub through thread holes under tension strengthened with backing plate. J. Constr. Steel Res. 2017, 134, 53–65. [Google Scholar] [CrossRef]
  9. Wulan, T.; Ma, Q.; Liu, Z.; Liu, M.; Song, J.; Cai, J.; Wang, P. Experimental study on T-stubs connected by thread-fixed one-side bolts under cyclic load. J. Constr. Steel Res. 2020, 169, 106050. [Google Scholar] [CrossRef]
  10. Zhang, Y.; Wang, P.; Liu, M.; Liu, Y.; Zhang, B.; Zhou, S.; Chen, J. Numerical studies on yield line patterns of thread-fixed one-side bolted endplate connection to square hollow section column under tension. J. Constr. Steel Res. 2020, 173, 106262. [Google Scholar] [CrossRef]
  11. Zhang, Y.; Liu, M.; Ma, Q.; Liu, Z.; Wang, P.; Ma, C.; Sun, L. Yield line patterns of T-stubs connected by thread-fixed one-side bolts under tension. J. Constr. Steel Res. 2020, 166, 105932. [Google Scholar] [CrossRef]
  12. Wulan, T.; Wang, P.; Li, Y.; You, Y.; Tang, F. Numerical investigation on strength and failure modes of thread-fixed one-side bolted T-stubs under tension. Eng. Struct. 2018, 169, 15–36. [Google Scholar] [CrossRef]
  13. Liu, M.; Zhu, X.; Wang, P.; Tuoya, W.; Hu, S. Tension strength and design method for thread-fixed one-side bolted T-stub. Eng. Struct. 2017, 150, 918–933. [Google Scholar] [CrossRef]
  14. Wang, P.; Sun, L.; Zhang, B.; Yang, X.; Liu, F.; Han, Z. Experimental studies on T-stub to hollow section column connection bolted by T-head square-neck one-side bolts under tension. J. Constr. Steel Res. 2021, 178, 106493. [Google Scholar] [CrossRef]
  15. Yao, H.; Goldsworthy, H.; Gad, E. Experimental and numerical investigation of the tensile behavior of blind-bolted T-stub connections to concrete-filled circular columns. J. Struct. Eng. 2008, 134, 198–208. [Google Scholar] [CrossRef]
  16. Hosseini, S.M.; Mamun, M.S.; Mirza, O.; Mashiri, F. Behaviour of blind bolt shear connectors subjected to static and fatigue loading. Eng. Struct. 2020, 214, 110584. [Google Scholar] [CrossRef]
  17. Oktavianus, Y.; Goldsworthy, H.M.; Gad, E. Group behavior of double-headed anchored blind bolts within concrete-filled circular hollow sections under cyclic loading. J. Struct. Eng. 2017, 143, 04017140. [Google Scholar] [CrossRef]
  18. Wang, P.; Wulan, T.; Liu, M.; Qu, H.; You, Y. Shear behavior of lap connection using one-side bolts. Eng. Struct. 2019, 186, 64–85. [Google Scholar] [CrossRef]
  19. Wan, C.; Bai, Y.; Ding, C.; Zhu, L.; Yang, L. Mechanical performance of novel steel one-sided bolted joints in shear. J. Constr. Steel Res. 2020, 165, 105815. [Google Scholar] [CrossRef]
  20. Gao, X.; Wang, W.; The, L.H.; Zhuang, L. A novel slip-critical blind bolt: Experimental studies on shear, tensile and combined tensile–shear resistances. Thin-Wall. Struct. 2022, 170, 108630. [Google Scholar] [CrossRef]
  21. DSF/PREN 1993-1-8; Eurocode 3: Design of Steel Structures—Part 1-8: Design of Joints. European Committee for Standardization: Brussels, Belgium, 2005.
  22. Wang, J.; Spencer, B.F., Jr. Experimental and analytical behavior of blind bolted moment connections. J. Constr. Steel Res. 2013, 82, 33–47. [Google Scholar] [CrossRef]
  23. Lee, J.; Goldsworthy, H.M.; Gad, E.F. Blind bolted T-stub connections to unfilled hollow section columns in low rise structures. J. Constr. Steel Res. 2010, 66, 981–992. [Google Scholar] [CrossRef]
  24. Lee, J.; Goldsworthy, H.M.; Gad, E.F. Blind bolted moment connection to unfilled hollow section columns using extended T-stub with back face support. Eng. Struct. 2011, 33, 1710–1722. [Google Scholar] [CrossRef]
  25. Lee, J.; Goldsworthy, H.M.; Gad, E.F. Blind bolted moment connection to sides of hollow section columns. J. Constr. Steel Res. 2011, 67, 1900–1911. [Google Scholar] [CrossRef]
  26. Wang, P.; Sun, L.; Liu, M.; Zhang, B.; Hu, X.; Yu, J. Experimental studies on thread-fixed one-side bolted connection of beam to hollow square steel tube under static bending moment. Eng. Struct. 2020, 214, 110655. [Google Scholar] [CrossRef]
  27. Tahir, M.M.; Mohammadhosseini, H.; Ngian, S.P.; Effendi, M.K. I-beam to square hollow column blind bolted moment connection: Experimental and numerical study. J. Constr. Steel Res. 2018, 148, 383–398. [Google Scholar] [CrossRef]
  28. Sun, L.; Liu, M.; Liu, Y.; Wang, P.; Zhao, H.; Sun, J.; Shang, Y. Studies on T-shaped one-side bolted connection to hollow section column under bending. J. Constr. Steel Res. 2020, 175, 106359. [Google Scholar] [CrossRef]
  29. Li, G.; Zhang, J. Analysis Model of Tensile Stiffness of Self-lock One-side Bolt for Steel Structure. J. Archit. Civ. Eng. 2018, 35, 1–7. [Google Scholar]
  30. Li, G.; Duan, L.; Lu, Y.; Zhang, J.H. Initial Rotational Stiffness of H shaped Beams to RHS Column Endplate Connections Using Blind Bolts. J. Tongji. Univ. (Nat. Sci.) 2018, 46, 565–573. [Google Scholar]
  31. Wang, W.; Li, M.X.; Chen, Y.Y.; Jian, X. Cyclic behavior of endplate connections to tubular columns with novel slip-critical blind bolts. Eng. Struct. 2017, 148, 949–962. [Google Scholar] [CrossRef]
  32. Li, G.; Ma, R.; Wang, W.; Chen, Z.M.; He, M.J.; Hou, Z.X.; Wang, Y.B.; Chen, Y.Y. Research Achievements of Key Technology of High-Efficiency Bolted Connection in Steel Structures. Prog. Steel Build. Stuct. 2020, 22, 1–20+28. [Google Scholar]
  33. Xu, Q.; Zheng, S.; Cheng, Y. Seismic vulnerability of steel framework in service based on structural damage. J. Vib. Shock 2015, 34, 162–167. [Google Scholar]
  34. Park, Y.; Ang, A.H. Mechanistic Seismic Damage Model for Reinforced Concrete. J. Struct. Eng. 1985, 111, 722–739. [Google Scholar] [CrossRef]
  35. Kumar, S.; Usami, T. A note on the evaluation of damage in steel structures under cyclic loading. J. Struct. Eng. 1994, 40, 177–188. [Google Scholar]
  36. Behnamfar, F.; Hosseini, R.A.; Habiby, Y.M. A procedure for damage-based seismic design of moment frame structures. Bull. Earthq. Eng. 2022, 20, 5877–5904. [Google Scholar] [CrossRef]
  37. Castiglioni, C.A.; Pucinotti, R. Failure criteria and cumulative damage models for steel components under cyclic loading. J. Constr. Steel Res. 2009, 65, 751–765. [Google Scholar] [CrossRef]
  38. Yu, H. Research on Seismic Damage Model of Reinforced Concrete Structure. Master’s Thesis, Chongqing University, Chongqing, China, 2004. [Google Scholar]
  39. GB50017-2017; Standard for Design of Steel Structures. China Architecture & Building Press: Beijing, China, 2017. (In Chinese)
  40. Lin, Y.; Wang, X.; Gong, J.; Wang, S.; Sun, H.; Liu, H. Seismic Performance of an Exterior Joint between a Square Steel Tube Column and an H-Shape Steel Beam. Sustainability 2023, 15, 3856. (In Chinese) [Google Scholar] [CrossRef]
  41. GB/T 2975-2018; Steel and Steel Products-Location and Preparation of Samples and Test Pieces for Mechanical Testing, Standardization Administration. China Standards Press: Beijing, China, 2018. (In Chinese)
  42. GB/T228.1-2021; Metallic Materials-Tensile Testing-Part 1: Method of Test at Room Temperature. China Standards Press: Beijing, China, 2021. (In Chinese)
  43. JGJ/T 101-2015; Specification for Seismic Test of Buildings. China Architecture & Building Press: Beijing, China, 2015. (In Chinese)
  44. Huang, J.; Gao, X.; Zhou, J.; Wang, Y.; Zeng, Z.; Wang, F. Seismic Experiment and Design Suggestion for BRB-Concrete Frame Bent Structure. J. Beijing Univ. Tech. 2020, 46, 879–891. [Google Scholar]
Figure 1. Specimen model diagram of SMJ-2 (Unit: mm).
Buildings 15 01429 g001
Figure 2. Structure of nested blind bolt.
Buildings 15 01429 g002
Figure 3. Test device diagram. 1—Reaction frame; 2—cross beam; 3—2000 kN actuator; 4—east 1000 kN actuator; 5—west 1000 kN actuator; 6—fixed hinged support; 7—limit device; 8—displacement gauge at beam end; 9—displacement gauge at beam middle1; 10–displacement gauge at column bottom; 11—pull-wire displacement gauge.
Buildings 15 01429 g003
Figure 4. Arrangement of strain gauges.
Buildings 15 01429 g004
Figure 5. Loading system.
Buildings 15 01429 g005
Figure 6. Experimental phenomena of SMJ-1. (a) crack growth. (b) crack fracture.
Buildings 15 01429 g006
Figure 7. Experimental phenomena of SMJ-2. (a) The obvious buckling of column wall and beam flange. (b) The severe buckling of column wall and beam flange.
Buildings 15 01429 g007aBuildings 15 01429 g007b
Figure 8. Moment–rotation curve. (a) East beam. (b) West beam.
Buildings 15 01429 g008
Figure 9. Cumulative energy dissipation. (a) East beam of SMJ-1. (b) West beam of SMJ-1. (c) East beam of SMJ-2. (d) West beam of SMJ-2.
Buildings 15 01429 g009aBuildings 15 01429 g009b
Figure 10. Equivalent viscous damping coefficient.
Buildings 15 01429 g010
Figure 11. Stiffness degradation coefficient.
Buildings 15 01429 g011
Figure 12. The damage index of the specimen. (a) East beam of SMJ-1. (b) West beam of SMJ-1. (c) East beam of SMJ-2. (d) West beam of SMJ-2.
Buildings 15 01429 g012aBuildings 15 01429 g012b
Figure 13. Damage index comparison.
Buildings 15 01429 g013
Figure 14. Polynomial model fitting.
Buildings 15 01429 g014
Figure 15. Exponential model fitting.
Buildings 15 01429 g015
Figure 16. Comparison of rotational stiffness. (a) SMJ-1. (b) SMJ-2.
Buildings 15 01429 g016
Figure 17. Error band analysis of rotational stiffness. (a) SMJ-1. (b) SMJ-2.
Buildings 15 01429 g017
Table 1. Mechanical properties of steel.
Sampling PositionYield Strength/MPaTensile Strength/MPaElastic Modulus/GPaElongation/%
Column345490.720930.3
Flange of beam252439.7198.732.2
Web of beam279.7442195.734.5
Flange of T-stub steel257.344022132.2
Web of T-stub steel278.7442.3200.730.5
Table 2. Main test phenomena of joints.
Loading Level1234~56
SMJ-1Yield of T-stub steel webYield of T-stub steel flangeFlange yielding of beamCracks in the flange of T-stub steel on the tensile side East lower T-stub steel flange fracture
SMJ-2Yield of T-stub steel webYield of T-stub steel flangeFlange yielding of beambuckling of column wall/buckling of beam flangeThe severe buckling of column wall and beam flange
Disclaimer/Publisher’s Note: The statements, opinions and data contained in all publications are solely those of the individual author(s) and contributor(s) and not of MDPI and/or the editor(s). MDPI and/or the editor(s) disclaim responsibility for any injury to people or property resulting from any ideas, methods, instructions or products referred to in the content.

