Article

Optimizing the Mixture Design of Manufactured Sand Concrete for Highway Guardrails in Mountainous Terrain

by
Jianping Gao
1,
Pan Zhou
1,*,
Sigui Zhao
2,
Qian Yang
3,
Kang Gu
4,
Qingnan Song
4 and
Zhengwu Jiang
4
1
School of Civil Engineering, Chongqing Jiaotong University, Chongqing 400074, China
2
Guizhou Daowu Highway Construction Co., Ltd., Guiyang 550001, China
3
Guizhou Hongxin Chuangda Engineering Detection & Consultation Co., Ltd., Guiyang 550014, China
4
Key Laboratory of Advanced Civil Engineering Materials of Ministry of Education, School of Materials Science and Engineering, Tongji University, Shanghai 201804, China
*
Author to whom correspondence should be addressed.
Buildings 2025, 15(9), 1436; https://doi.org/10.3390/buildings15091436
Submission received: 13 March 2025 / Revised: 14 April 2025 / Accepted: 23 April 2025 / Published: 24 April 2025
(This article belongs to the Special Issue Trends and Prospects in Cementitious Material)

Abstract

:
Concrete quality is essential for highway guardrails in mountainous terrain to overcome freeze–thaw cycles, and manufactured sand (MS) concrete is potentially a more sustainable construction material. This paper aims to optimize the mechanical strength and freeze-thaw resistance of MS concrete for highway guardrails. The effects of water-to-binder (W/B) ratio (0.38–0.42), air-entraining agent (AEA) (0–0.5‱), fly ash (FA) (10–30%) and binder contents (360–380 kg/m3) on the properties of MS concrete were investigated. The mechanism behind the factors was further studied with scanning electron microscopy (SEM) and mercury injection porosimetry (MIP). Results showed that increasing W/B ratio, AEA and FA contents led to the reduction of compressive strength, but improved freeze–thaw resistance by reducing the mass loss during the cyclic freeze–thaw. SEM and MIP illustrated that the increase in W/B ratio and AEA addition increased the pore volume and caused a more porous structure, but increasing FA and binder contents densified the structure of MS concrete. This is consistent with the evolution of compressive strength and freeze–thaw resistance. This study offers an optimization method to obtain MS concrete with good compressive strength and freeze–thaw resistance for highway construction.

1. Introduction

At present, infrastructure construction is essential for the social and economic development of China. And highway construction plays a vital role in infrastructure construction, especially for the areas without convenient transportation [1,2]. Guizhou Province in China is mostly occupied, in terms of landforms, by mountains, with mountains and hills accounting for 92.5% of the area [3]. This mountainous terrain greatly restricts the province’s communication with other areas. Therefore, highway construction is necessary for the further development of Guizhou Province.
Due to the mountainous terrain in Guizhou Province, mountain roads are the main types of highway construction. And concrete is the main construction materials used for mountain roads [4]. As a result, the quality of mountain roads is largely dependent on the performance of concrete during the service life. According to an existing data analysis, there are 59 sections with more than or equal to 30 days of freezing in Guizhou Province; the proportion of subgrade sections is 13.6%, and the proportion of bridge sections is 86.4%. Among the sections with more than 30 days of annual freezing days, the frozen sections with an altitude of more than 1000 m accounted for 13.6%, and the frozen sections with an altitude of less than 500 m accounted for 10.2%. The increase in freezing days largely increased the probability of damage to guardrail concrete. As seen, the freeze–thaw process is a common phenomenon in this area. Moreover, it also brings a threat to the freeze–thaw damage in concrete used for mountain roads [5], which should not be neglected.
The mechanical performance and degradation behavior of traditional concrete under freeze–thaw processes is well-studied. Traditional concrete is mainly composed of river sand (RS), coarse aggregate and a binder component, including Portland cement and supplementary cementitious materials. With sustainable development and the technological advance of the concrete industry, RS has been gradually replaced by manufactured sand (MS) as the fine aggregate for concrete preparation in recent years [6]. MS sourced from crushing rock can make up for the deficiency of RS. The utilization of MS mitigates the overexploitation of river resources and contributes to the aquatic ecological balance. Moreover, the cost and carbon emission induced by the transportation of RS can be reduced. Therefore, MS utilization has significant environmental and economic benefits. As compared to RS particles, the shapes of MS particles are more irregular [7,8,9,10]. As a result, the characteristics of mortar as well as concrete prepared with MS are quite different from those prepared with RS. Furthermore, the utilization of MS instead of RS in concrete was found to improve the mechanical performance [11,12,13,14] and durability [15,16,17]. This indicated that MS concrete was prospectively a better choice than RS concrete as the construction material in the future. As mentioned above, the mountainous terrain in Guizhou Province provides abundant rock resources for MS production. Therefore, concrete prepared with MS should be encouraged in highway construction. However, the approaches to improving the mechanical performance of MS concrete need further investigation. Moreover, the freeze–thaw resistance of MS concrete, simulated in its conditions of service, lacks study [18].
In previous studies, several approaches have been confirmed to effectively improve the properties of RS concrete. As known to all, an increase in water-to-binder (W/B) ratio usually leads to a strength reduction in concrete because the increase in air content weakens the compactness of concrete structure [19]. However, the W/B ratio is also closely related to freeze–thaw damage in concrete. The moisture that exists in concrete may induce inner force and microcracks during the freeze–thaw process, which potentially lead to concrete degradation and reduce the service life of structures [20,21,22]. Oyunbileg et al. [23] studied the freeze–thaw resistance of high-strength concrete with different W/B ratios. They found that high strength and high freeze–thaw resistance can be obtained at a low W/B ratio. Chen et al. [24] incorporated fly ash (FA) into recycled aggregate concrete and found that the partial substitution of cement with FA improved both the compressive strength and frost resistance of concrete. Li et al. [25] investigated the effects of low- and high-volume FA on the freeze–thaw resistance of recycled aggregate concrete. They found that the addition of low-volume FA (≤30%) effectively improved the resistance of concrete to freeze–thaw cycles, while high-volume FA (≥50%) had a negative effect. Pushpalal et al. [26] introduced the air-entraining agent (AEA) into concrete with high-volume FA to study the freeze–thaw durability. The demand of AEA was found to increase with the increase in FA content. Gonzalez et al. [27] found that the addition of AEA at a low content had a positive impact on the freeze–thaw resistance of concrete. Onuaguluchi and Banthia [28] supposed that the volumetric change of concrete induced by freeze–thaw processes depended on the W/B ratio and AEA incorporation. Apart from the factors mentioned above, binder content also has been reported to affect the freeze–thaw resistance of concrete [29,30]. However, it is unknown whether the mentioned factors have a similar effect on the properties of MS concrete, which still needs further investigation.
In this paper, the authors try to investigate the evolution of the mechanical strength and freeze–thaw resistance of MS concrete by comprehensively studying different factors, including W/B ratio, AEA, FA and binder contents. Scanning electron microscopy and mercury injection porosimetry are also included to analyze the underlying mechanism. This study is an innovative attempt toward the performance optimization of MS concrete and aims to guide the preparation and application of MS concrete during highway construction in mountainous terrain.

2. Materials and Methods
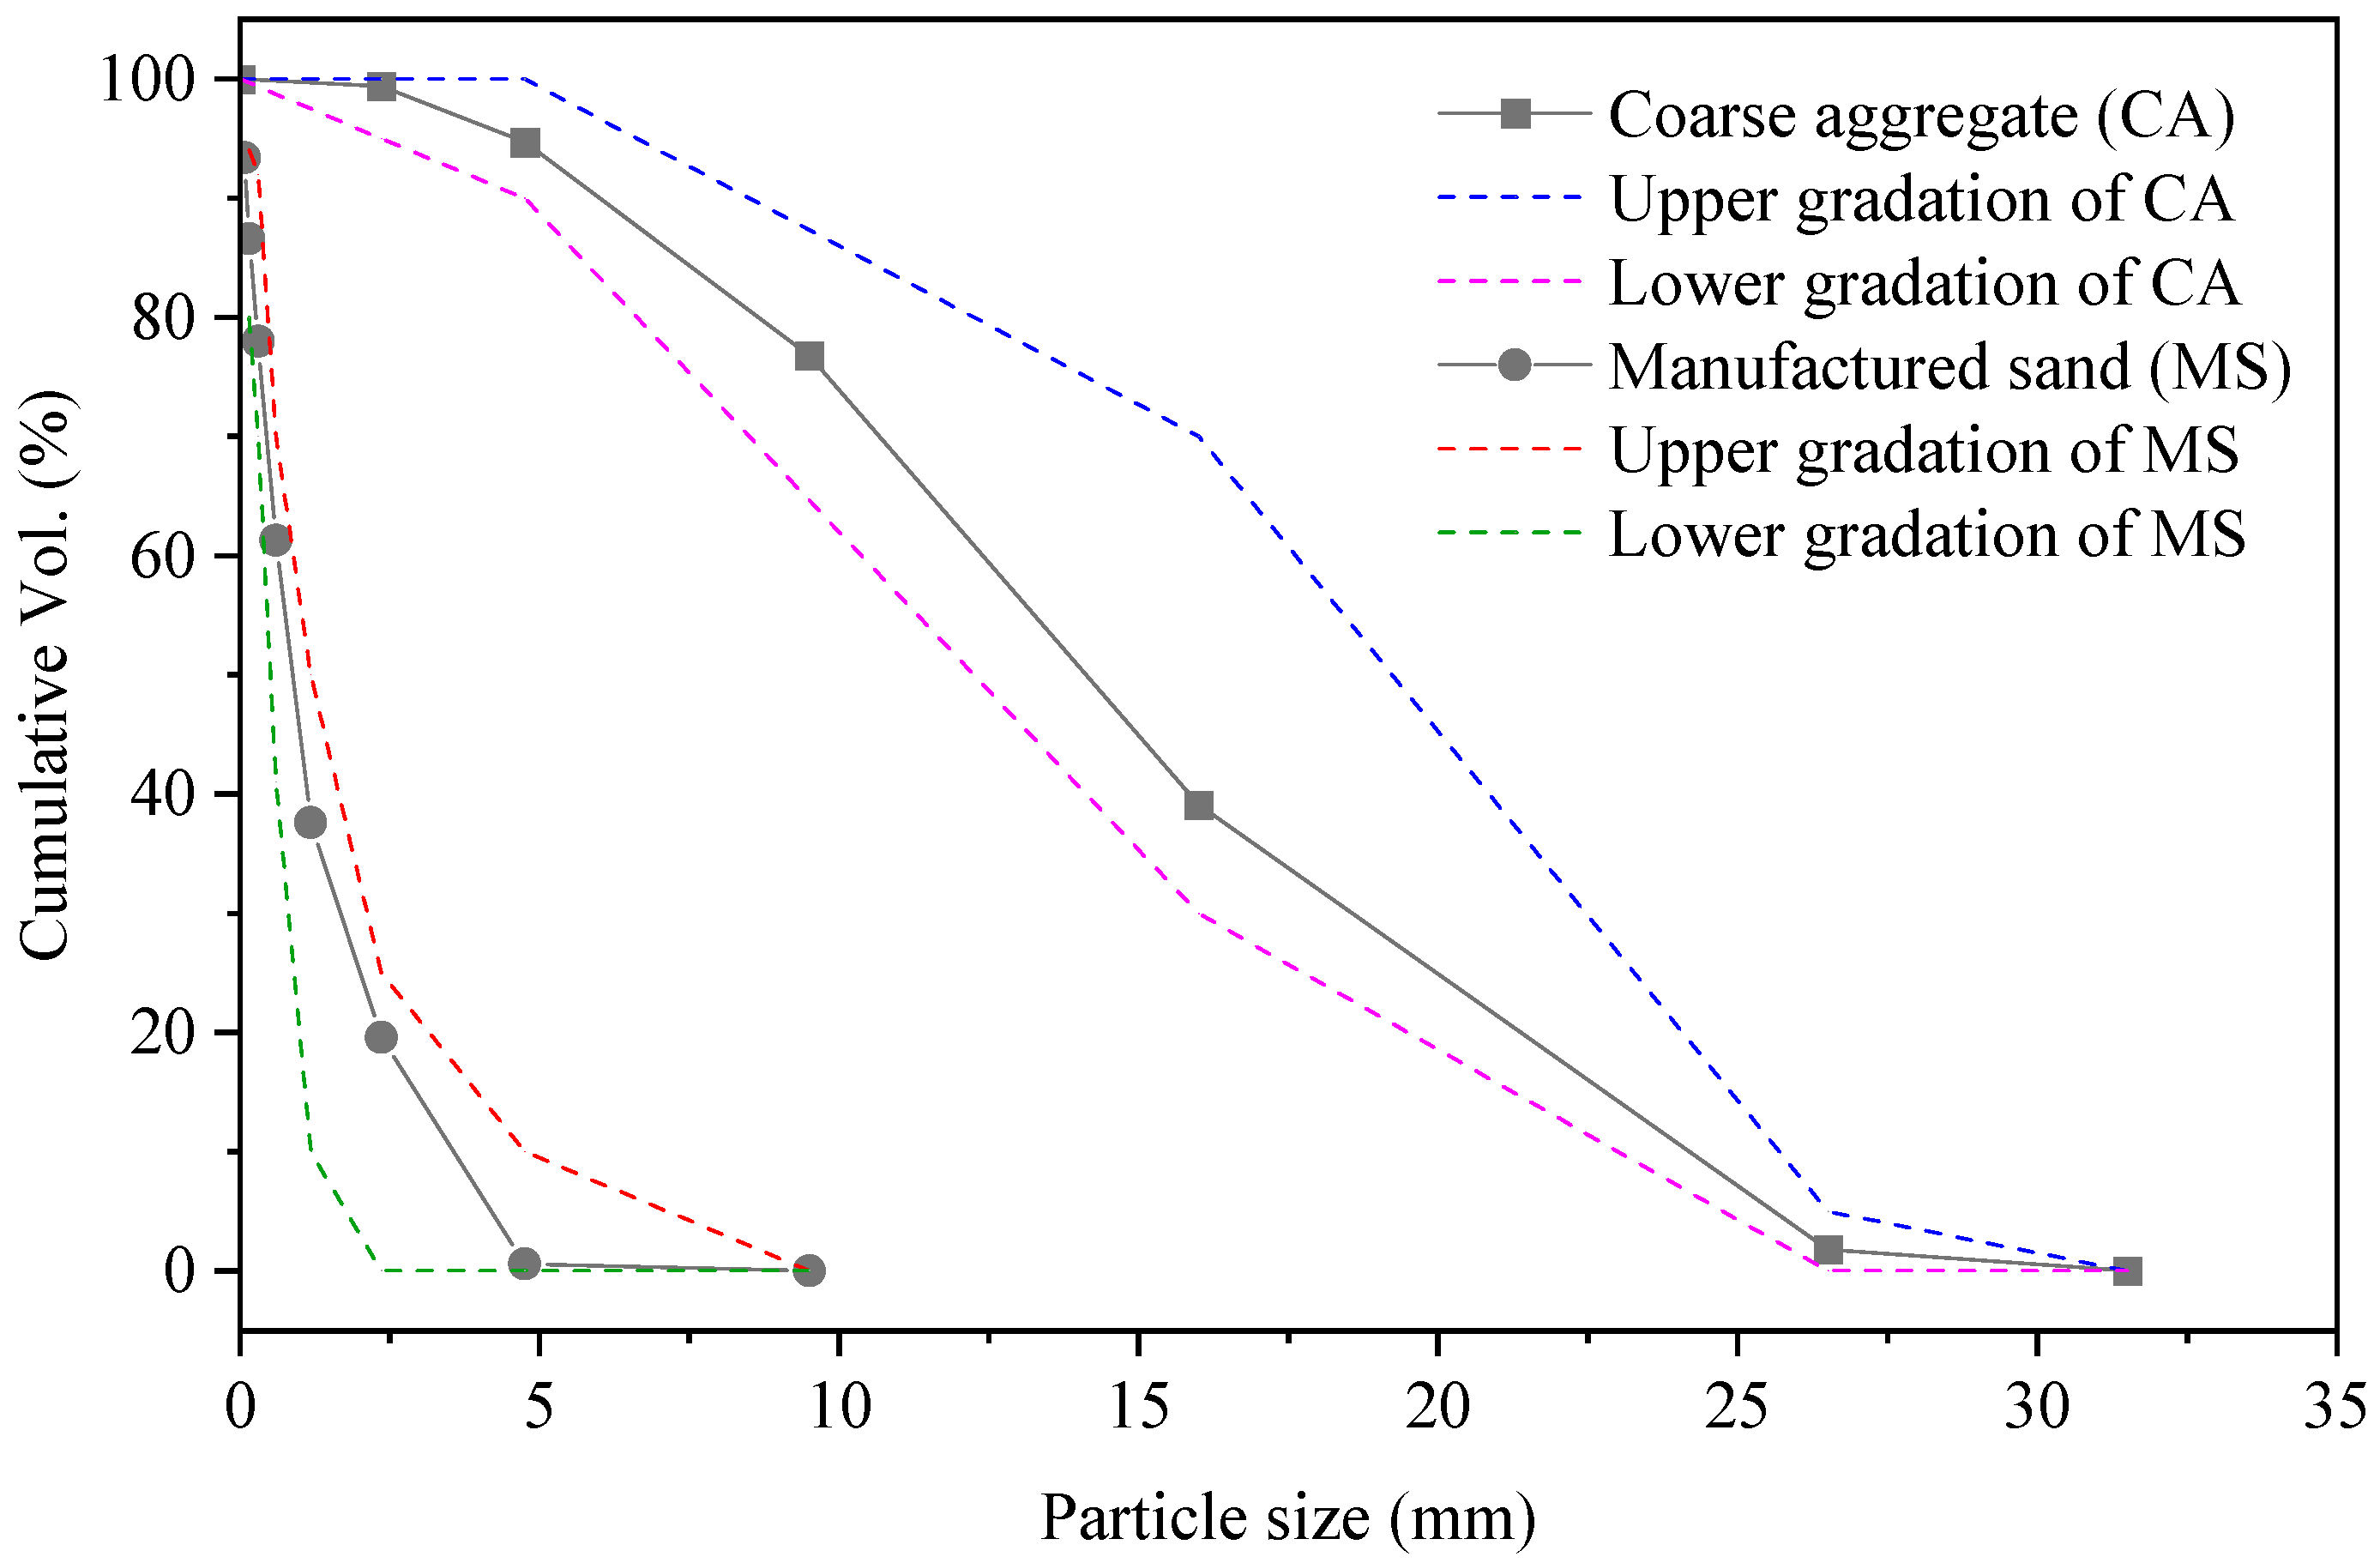
2.1. Raw Materials

The cement used in this study was P·O 42.5 Ordinary Portland cement (OPC), produced by Zhengan Southwest cement Co., Ltd., Chengdu, China. The fly ash (FA) was Class F Grade II, produced by Guizhou Mingchuan Fly Ash Co., Ltd. (Tongzi Power Plant), Zunyi, China. Table 1 shows the basic properties of P·O 42.5 OPC. Table 2 shows the water demand, fineness, reactive index and chemical compositions of FA. As seen, FA with a relatively high reactivity was used in this study. Manufactured sand (MS) and coarse aggregate (CA) were sourced from Guizhou Daowu Highway Construction Co., Ltd., Zunyi, China. Figure 1 shows the particle size distribution of MS and CA. It can be seen that the particle size of MS ranged from 0 mm to 10 mm, while that of CA ranged from 0 mm to 32 mm. To prepare MS concrete, MS was sieved to a particle size of 0~4.75 mm and CA was sieved to a particle size of 5~25 mm. Table 3 and Table 4 further show the parameters of MS and CA. As seen, the mud contents in MS and CA were less than 0.2%, and they had a similar apparent density. The additives used in this study were KZ-P1 polycarboxylate superplasticizer as water-reducing agent (WRA) and sodium dodecyl sulfate (C12H25SO4Na) as air-entraining agent (AEA). The water used for concrete preparation was tap water.

2.2. Mix Design and Concrete Preparation

Table 5 lists the mixture designs for the preparation of MS concrete. It can be seen from the mass ratio of concrete that the contents of sand, coarse aggregate and WRA were fixed, while parameters including FA content (10~30%), W/B ratio (0.38~0.42), AEA content (0~0.5‱) and binder content (360~380 kg/m3) were adjusted to study the effect of these factors on MS concrete. During the mixing process, the weighed binder (OPC and FA), sand and coarse aggregate were first added into the mixing machine. When the machine was started, the weighed water with WRA and AEA (if applicable) was poured into the machine for further mixing. After the mixing process was finished, cubic molds with a size of 150 × 150 × 150 mm were used for concrete casting.

2.3. Testing Methods

Concrete specimens were demolded after 24 h of casting and further treated with standard curing (20 ± 2 °C, RH 95%). After 7 days and 28 days of standard curing, concrete specimens were compressed with the compression machine according to ASTM C39 [31]. Concrete specimens with 28 days of standard curing were also used for freeze–thaw testing. The freeze–thaw resistance of concrete was tested with a freeze–thaw cyclic box, according to ASTM C666 [32].
Moreover, samples were selected from concrete after 28 days of standard curing for pore size distribution and microstructural analysis. Concrete samples were dried in an oven to remove free water. The pore size distribution of the samples with a size of less than 10 × 10 × 10 mm was performed with a high-performance automatic mercury porosimeter. The morphologies of the samples, after coating with gold, were observed with a scanning electron microscope.

3. Results and Discussion

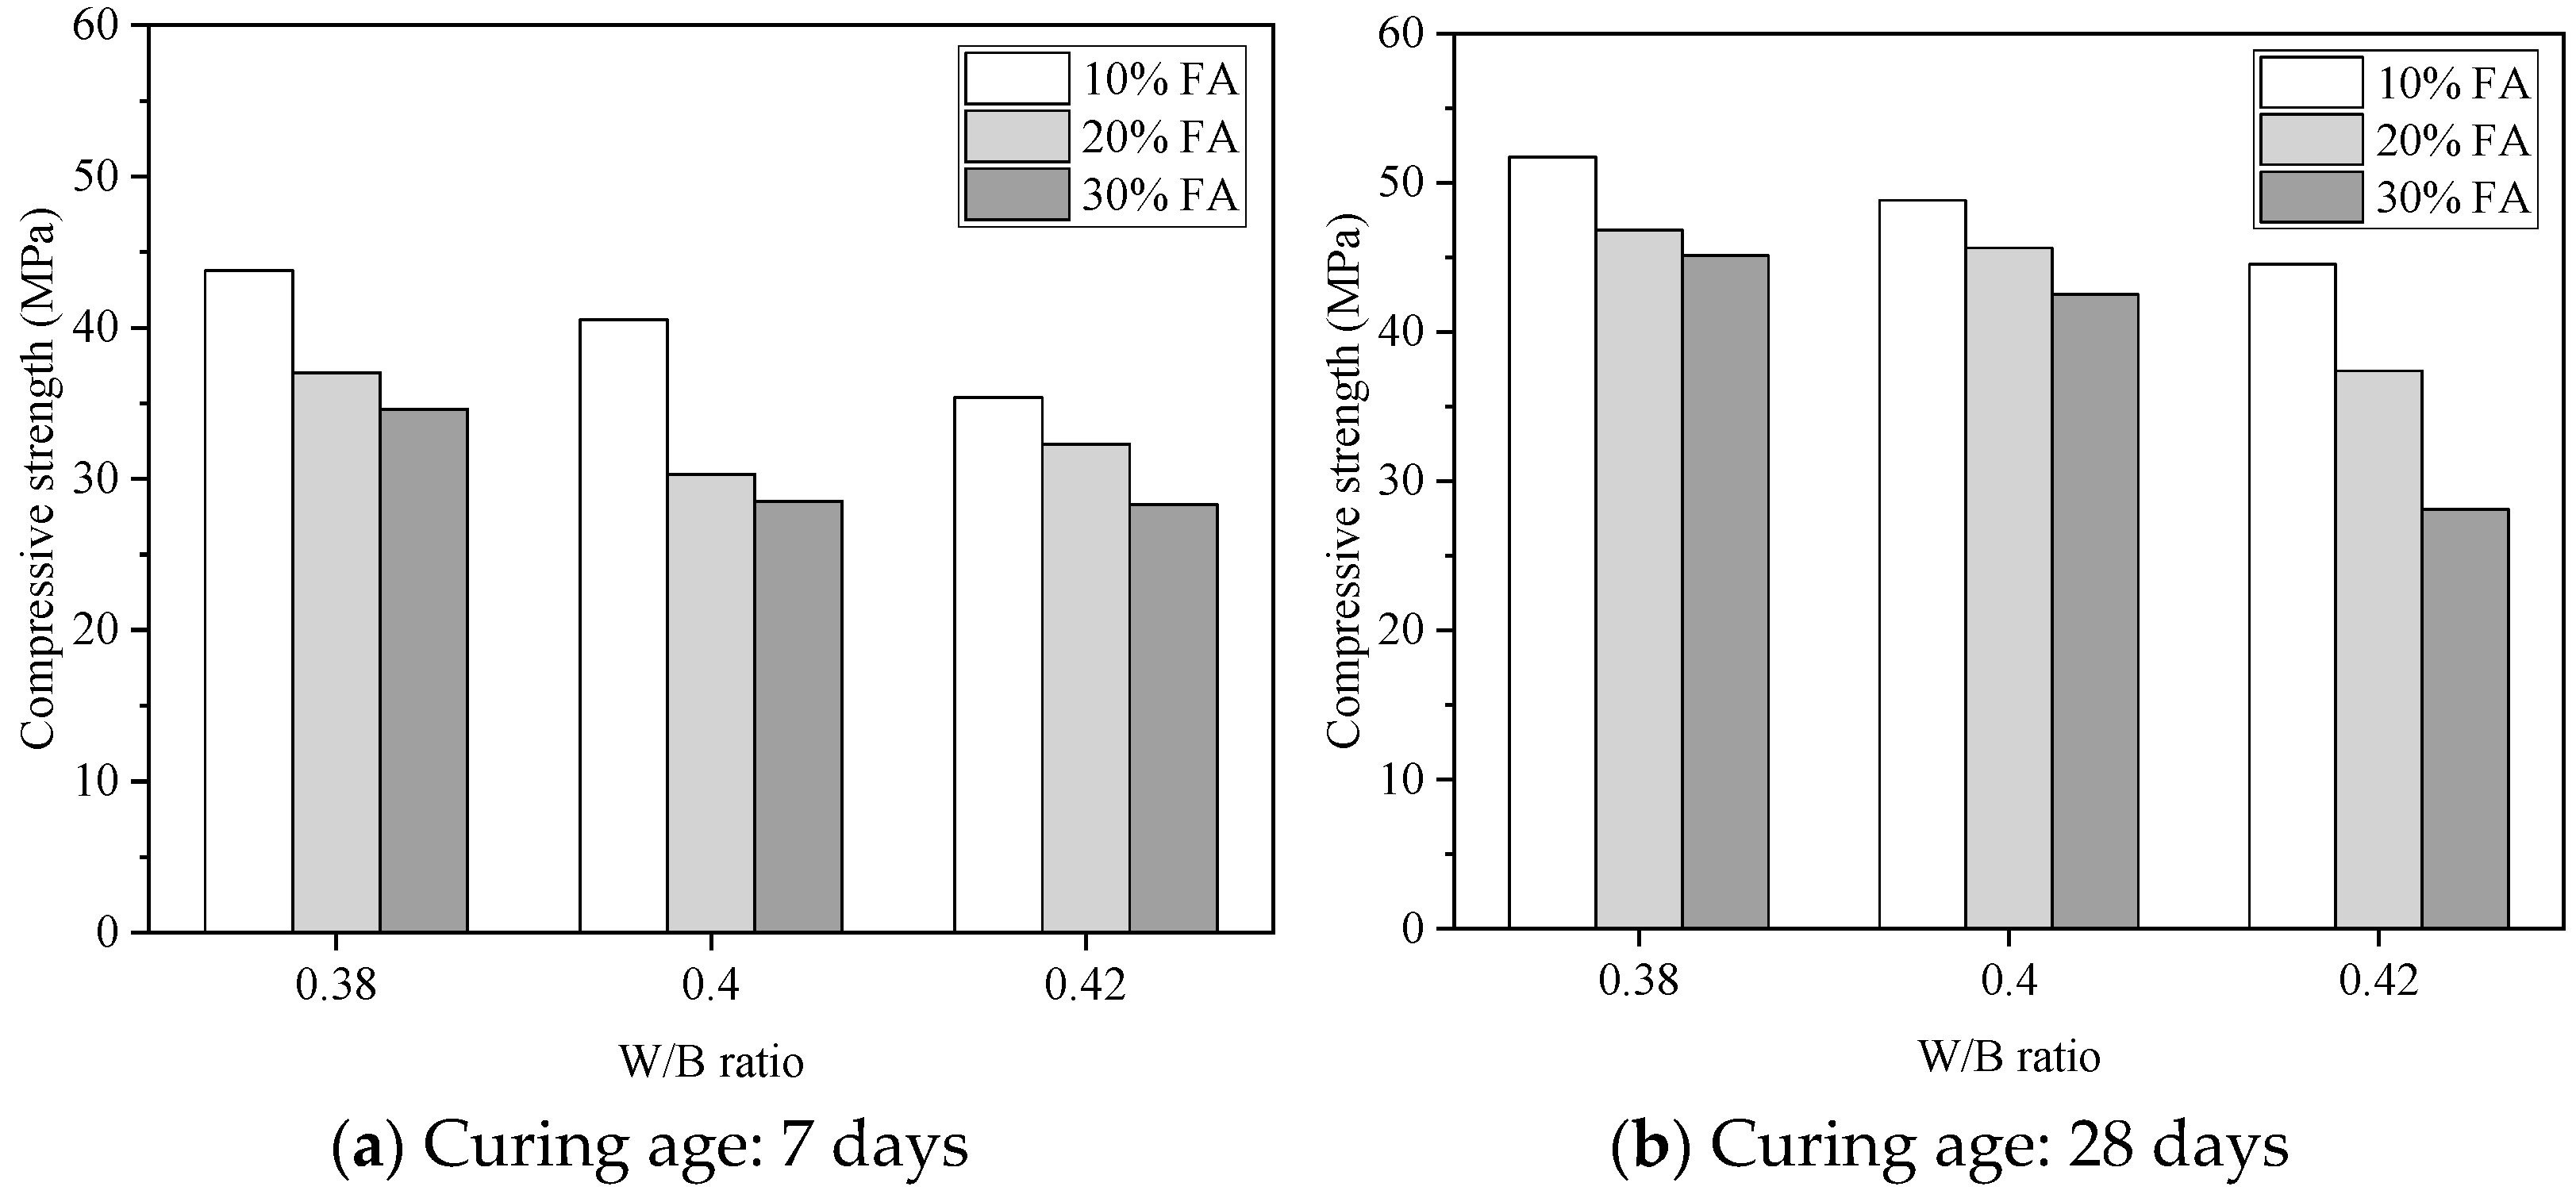
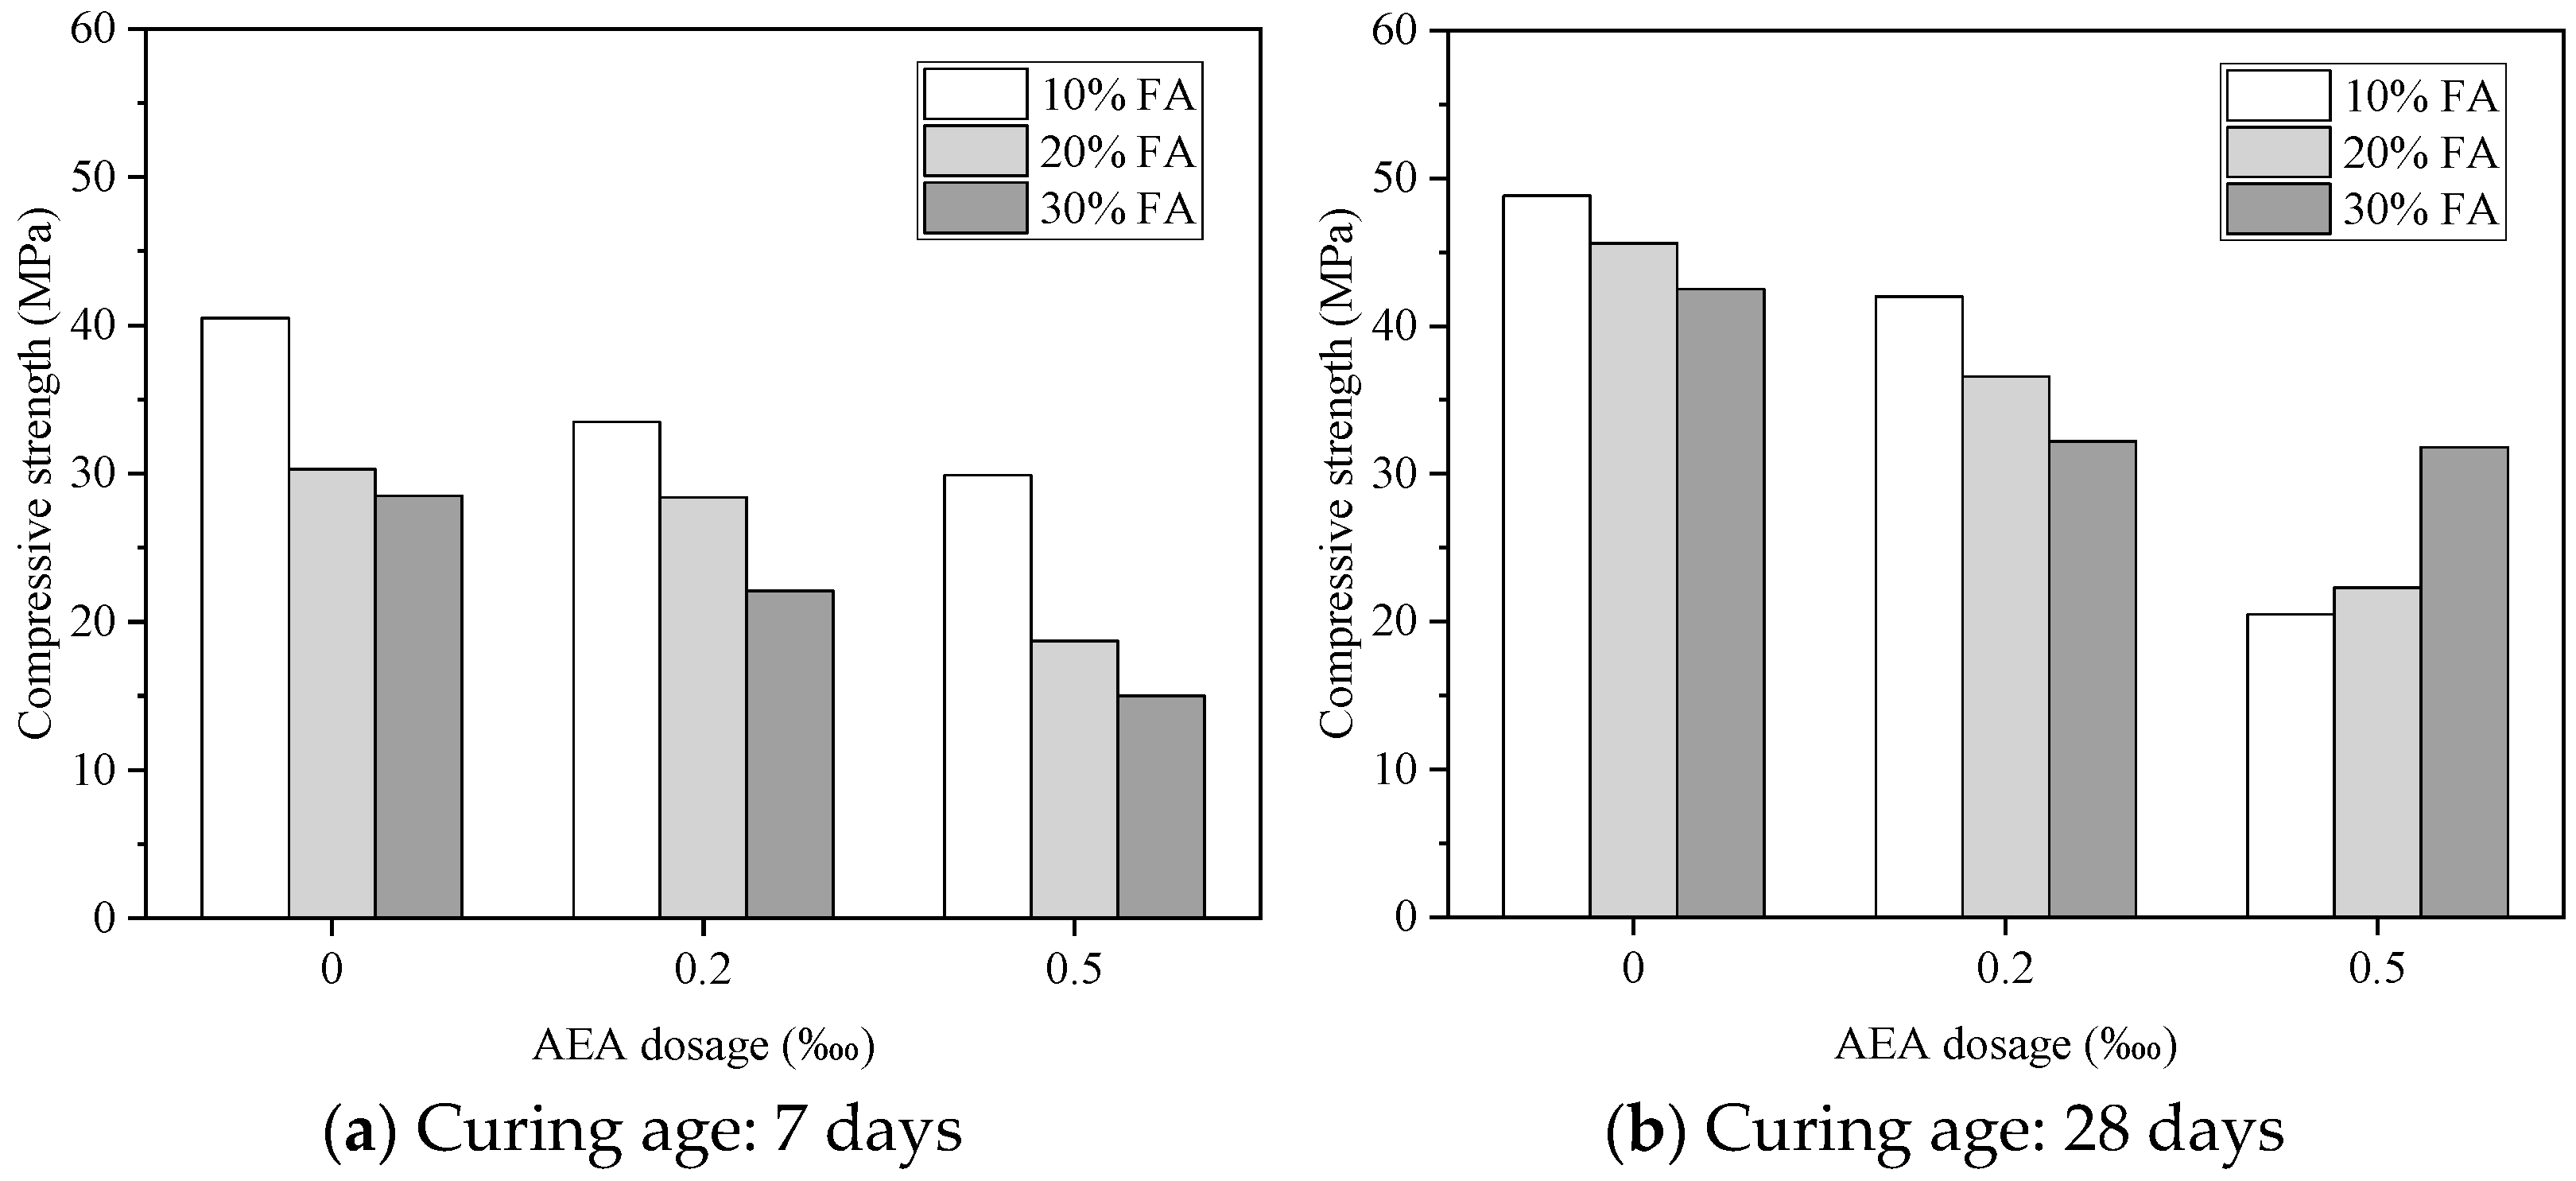
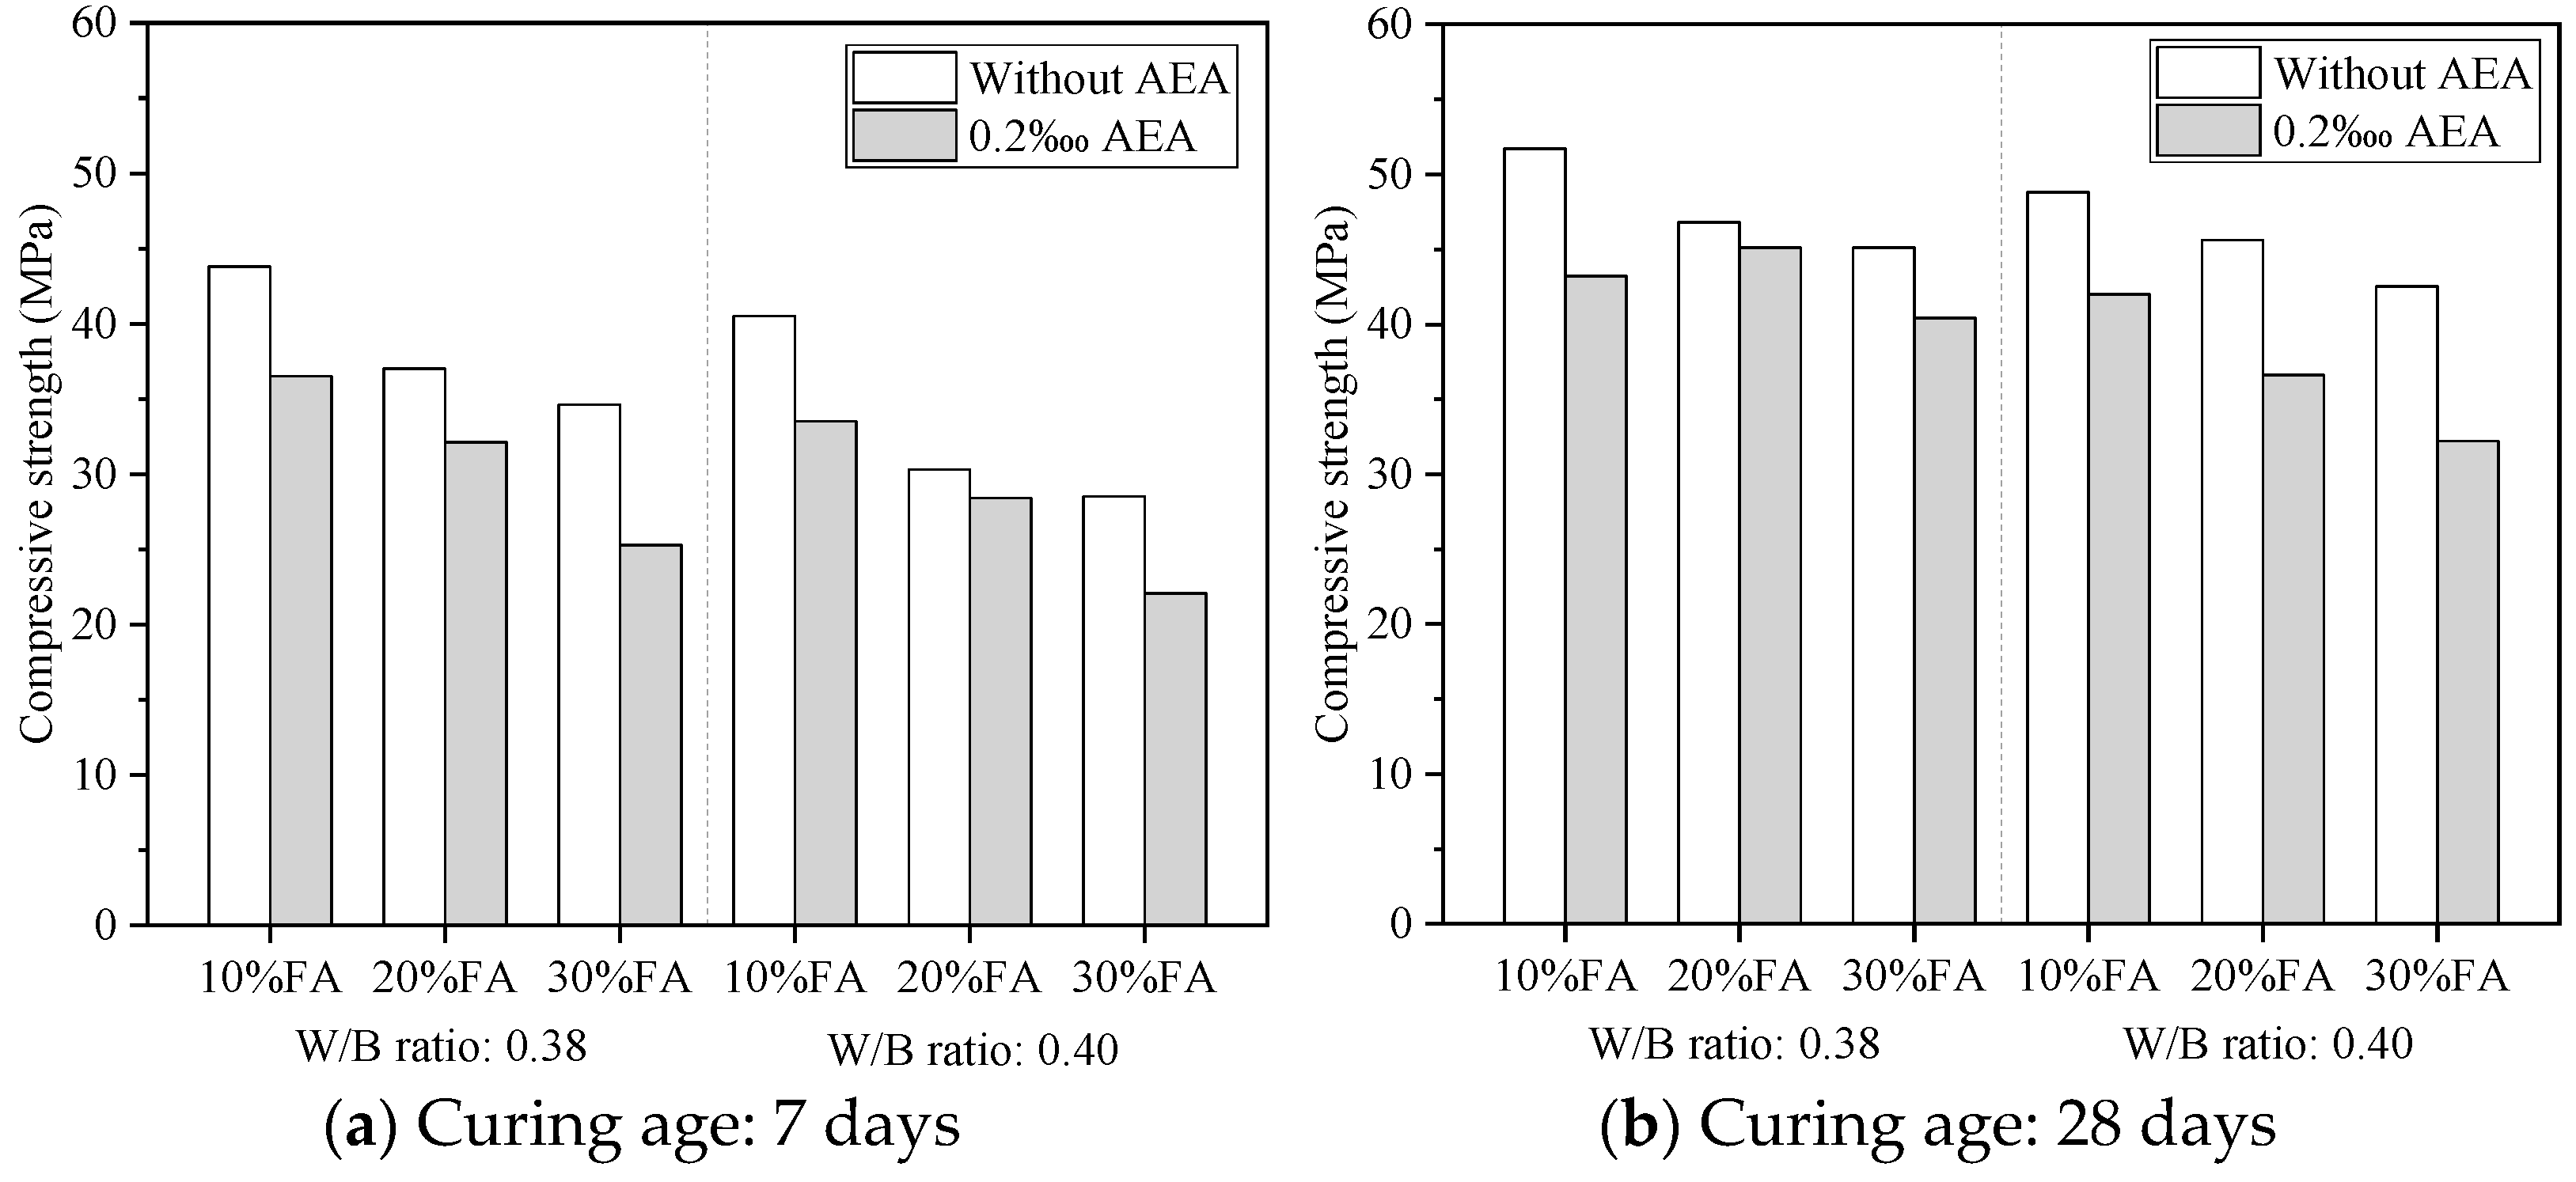
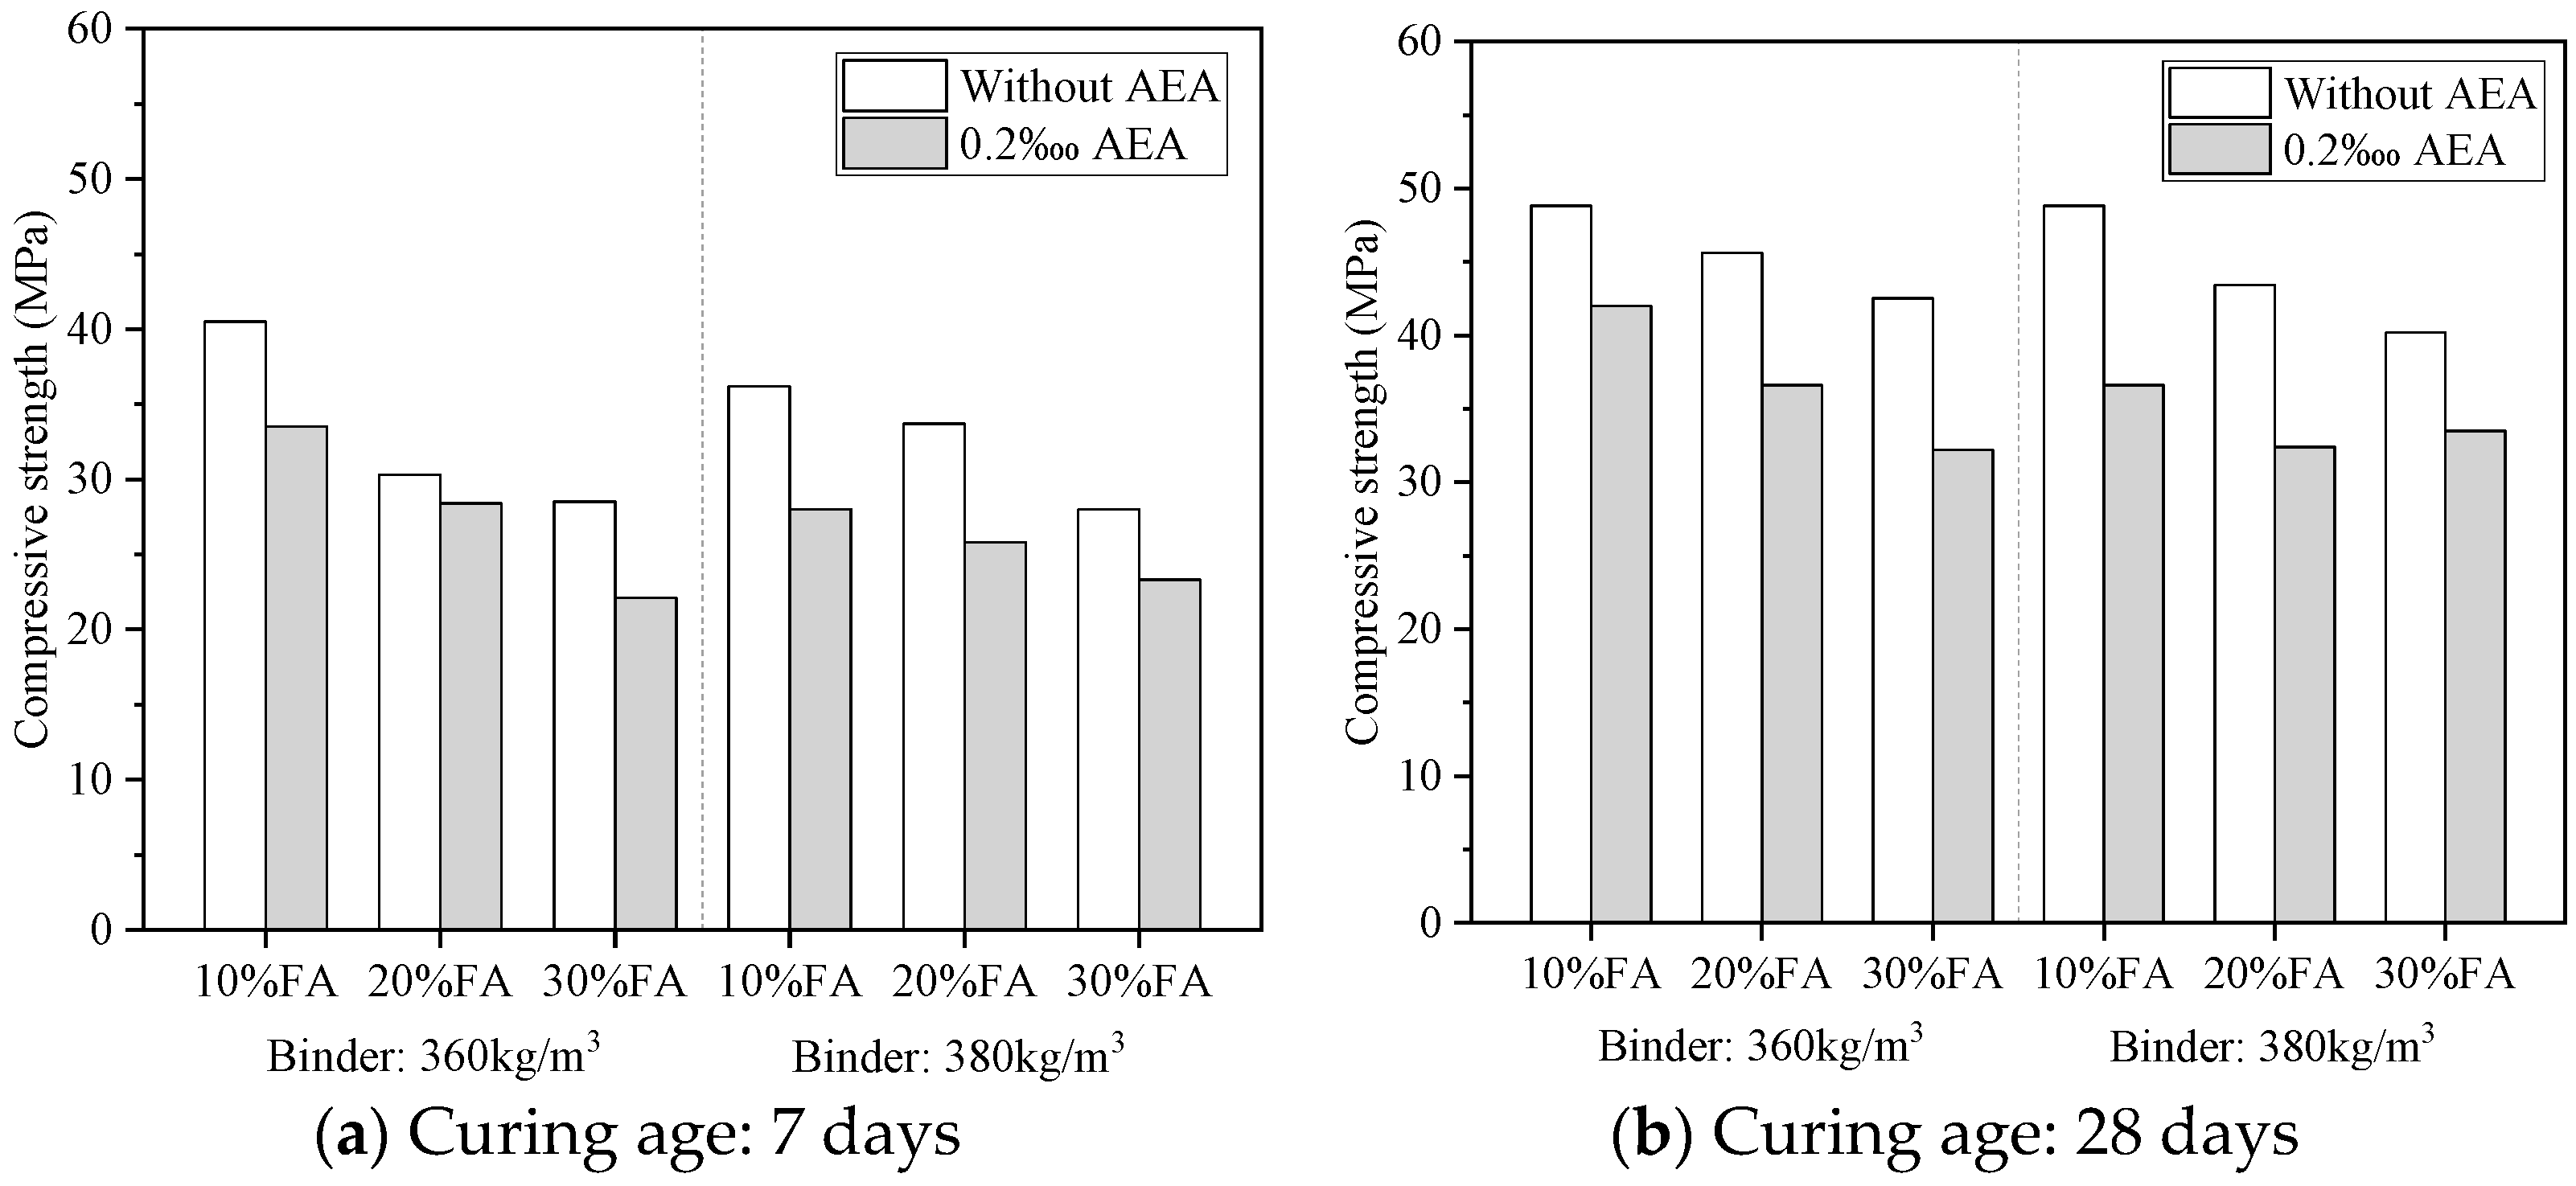
3.1. Compressive Strength

Figure 2 shows the effects of different W/B ratios and FA contents on the compressive strength of MS concrete. For the specimens with 7 days and 28 days of standard curing, compressive strength not only decreased with the increase in W/B ratio, but also decreased as the FA content increased from 10% to 30%. At 7 days, the highest strength was 43.8 MPa, obtained by the specimens with a W/B ratio of 0.38 and FA content of 10%, while the lowest strength was 28.1 MPa obtained by the specimens with a W/B ratio of 0.42 and FA content of 30%. With the increase in curing age, the compressive strength of all the specimens increased. At 28 days, the highest strength was 51.7 MPa, obtained by the specimens with a W/B ratio of 0.38 and FA content of 10%, while the lowest strength was 28.3 MPa, obtained by the specimens with a W/B ratio of 0.42 and FA content of 30%.
As seen in Figure 2, the 28-day compressive strength of concrete specimens with a W/B ratio of 0.4 was slightly reduced as compared to those with a W/B ratio of 0.38. However, the increase in W/B ratio to 0.42 led to a significant strength reduction. The increase of W/B ratio slowed down the hydration reaction and incorporated more pores into the concrete, which loosened the concrete structure and lowered the compressive strength. Therefore, a W/B ratio of 0.4 was adopted to further study the effect of AEA dosage on the compressive strength of MS concrete containing different FA contents, and the results are shown in Figure 3. For the specimens with 7 days of standard curing, compressive strength decreased with the increase in AEA dosage. For instance, the highest strength was 40.5 MPa, obtained by the specimens without AEA and with an FA content of 10%, while the lowest strength was 15 MPa, obtained by the specimens with an AEA dosage of 0.5‱ and an FA content of 30%. At 28 days, the increase in FA content lowered the compressive strength of specimens without AEA and with an AEA dosage of 0.2‱, but enhanced the compressive strength of specimens with an AEA dosage of 0.5‱. The highest strength was 48.8 MPa, obtained by the specimens without AEA and with an FA content of 10%, while the lowest strength was 20.5 MPa, obtained by the specimens with an AEA dosage of 0.5‱ and an FA content of 10%.
It can be seen in Figure 3 that the increase in AEA dosage from 0.2‱ to 0.5‱ largely affected the compressive strength. Therefore, an AEA dosage of 0~0.2‱ and a W/B ratio of 0.38~0.4 were further adopted to compare the compressive strength of MS concrete with different AEA dosages and W/B ratios, and the results are shown in Figure 4. For the specimens with 7 days and 28 days of standard curing, compressive strength decreased with the increase in both W/B ratio from 0.38 to 0.4 and AEA dosage from 0 to 0.2‱. The highest strength was obtained by the specimens without AEA and with a W/B ratio of 0.38 and an FA content of 10%, while the lowest strength was obtained by the specimens with an AEA dosage of 0.2‱, W/B ratio of 0.4 and FA content of 30%.
In order to mitigate the negative impact of AEA addition on the compressive strength of concrete, the approach to increasing binder content from 360 kg/m3 to 380 kg/m3 was adopted. Figure 5 shows the effect of binder content on the compressive strength of MS concrete with and without AEA addition. It can be seen that the increase in binder content led to the strength reduction of most concrete specimens at 7 days. After 28 days of standard curing, the compressive strength of specimens with a binder content of 380 kg/m3 was close to those with a binder content of 360 kg/m3. As a result, the increase in binder content from 360 kg/m3 to 380 kg/m3 had less impact on improving the compressive strength of MS concrete.

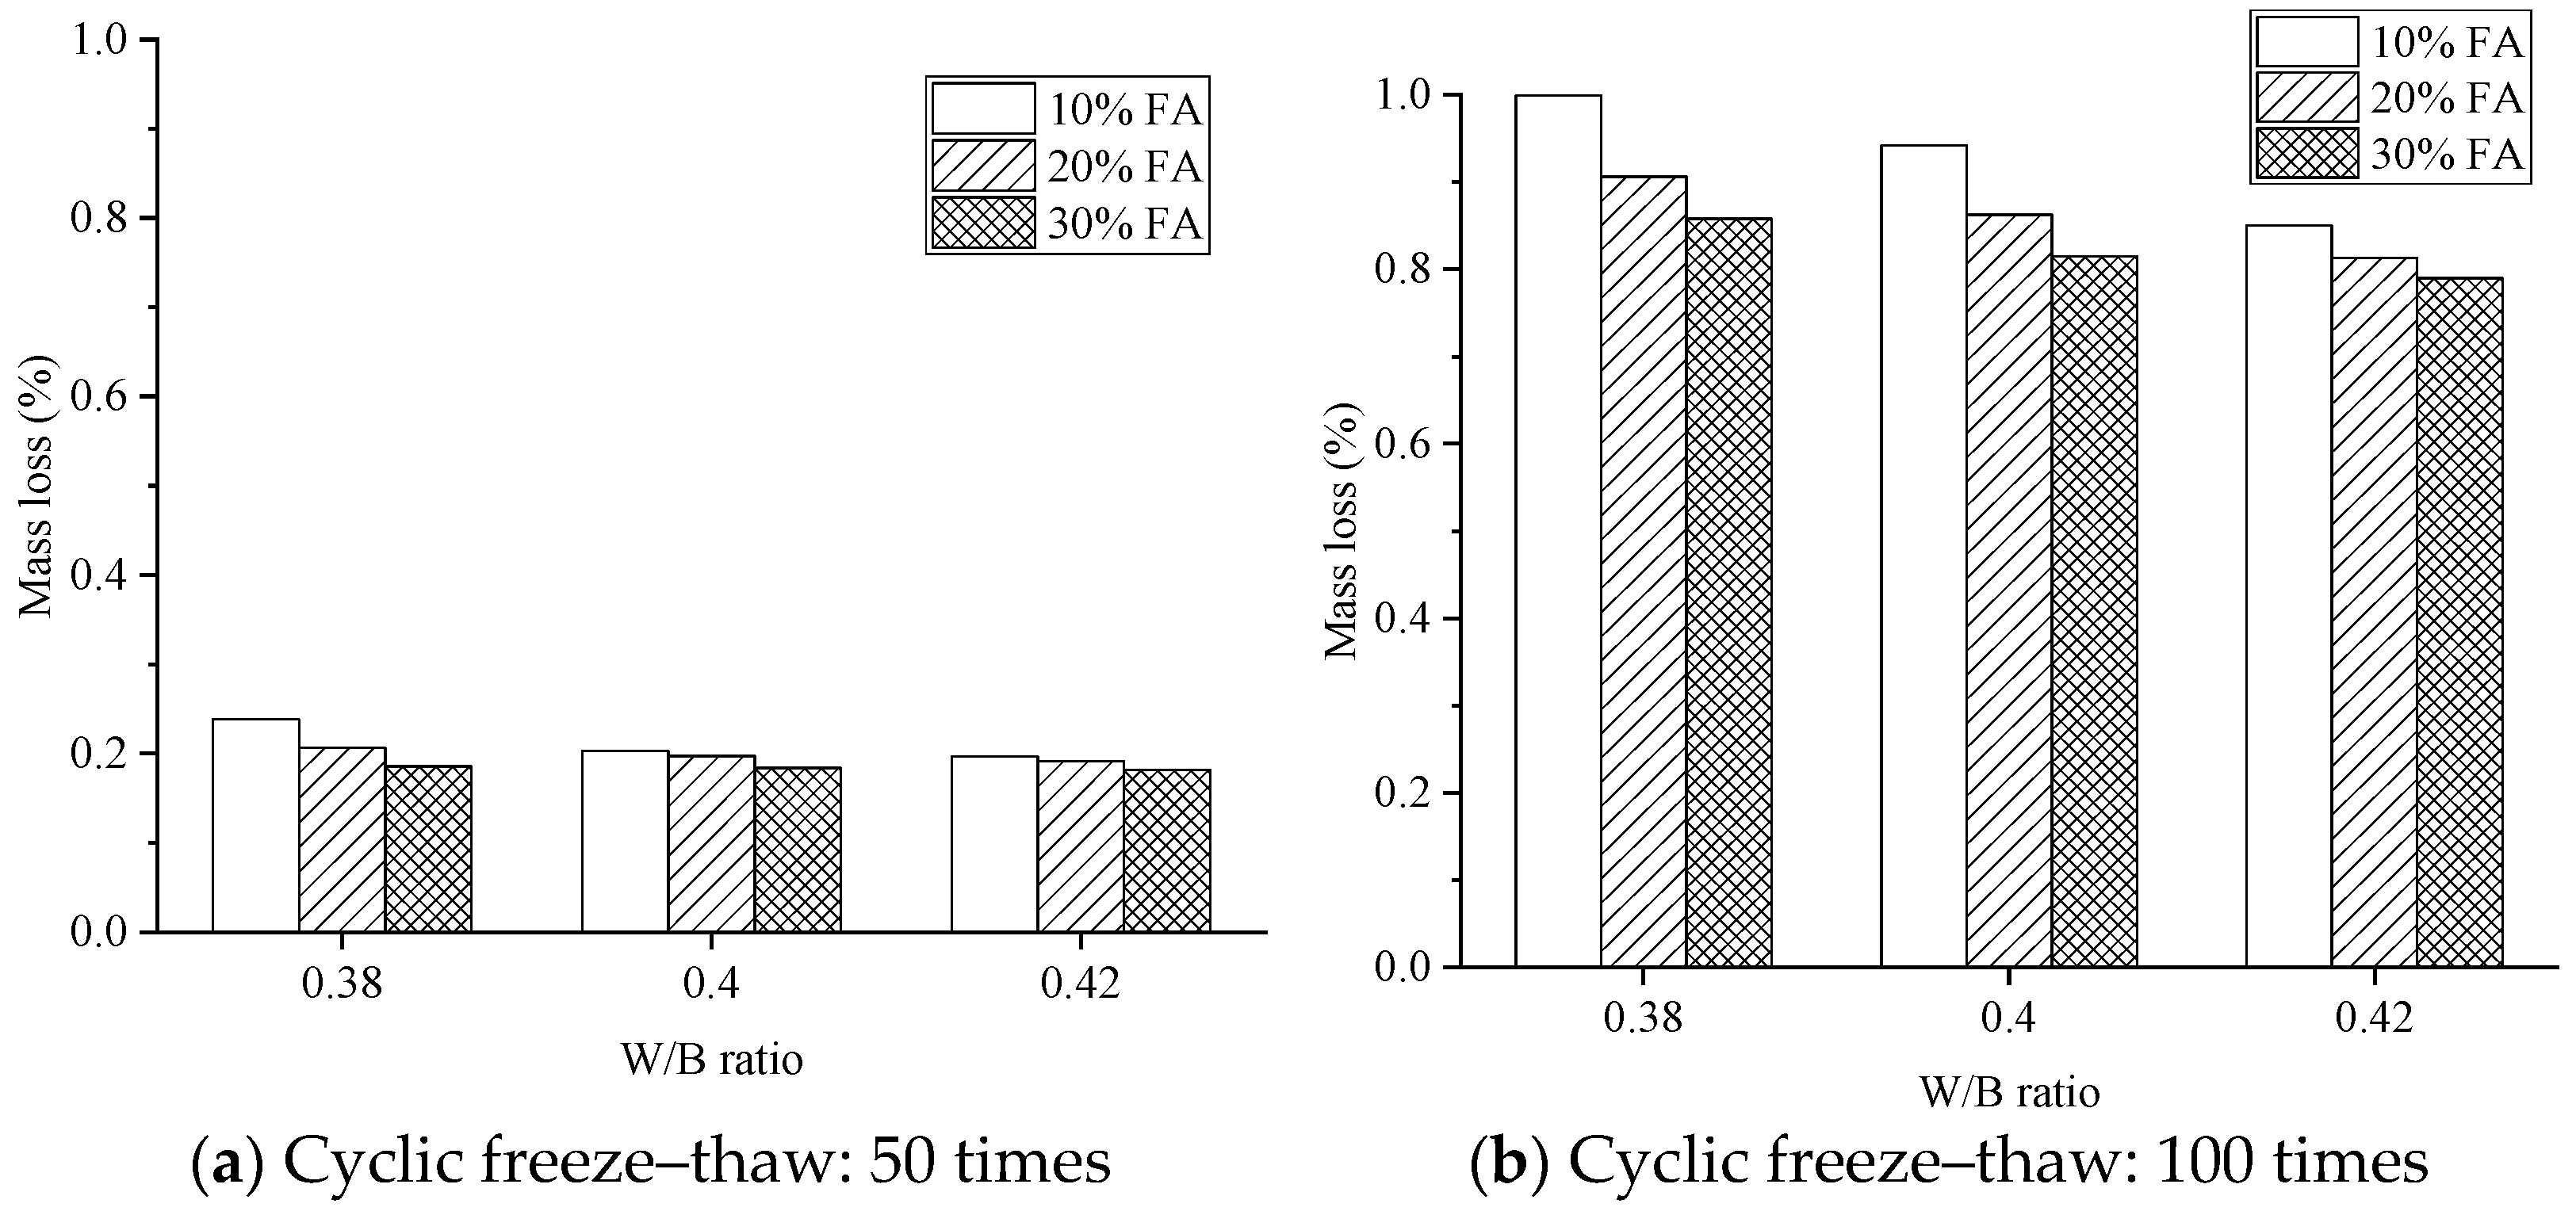
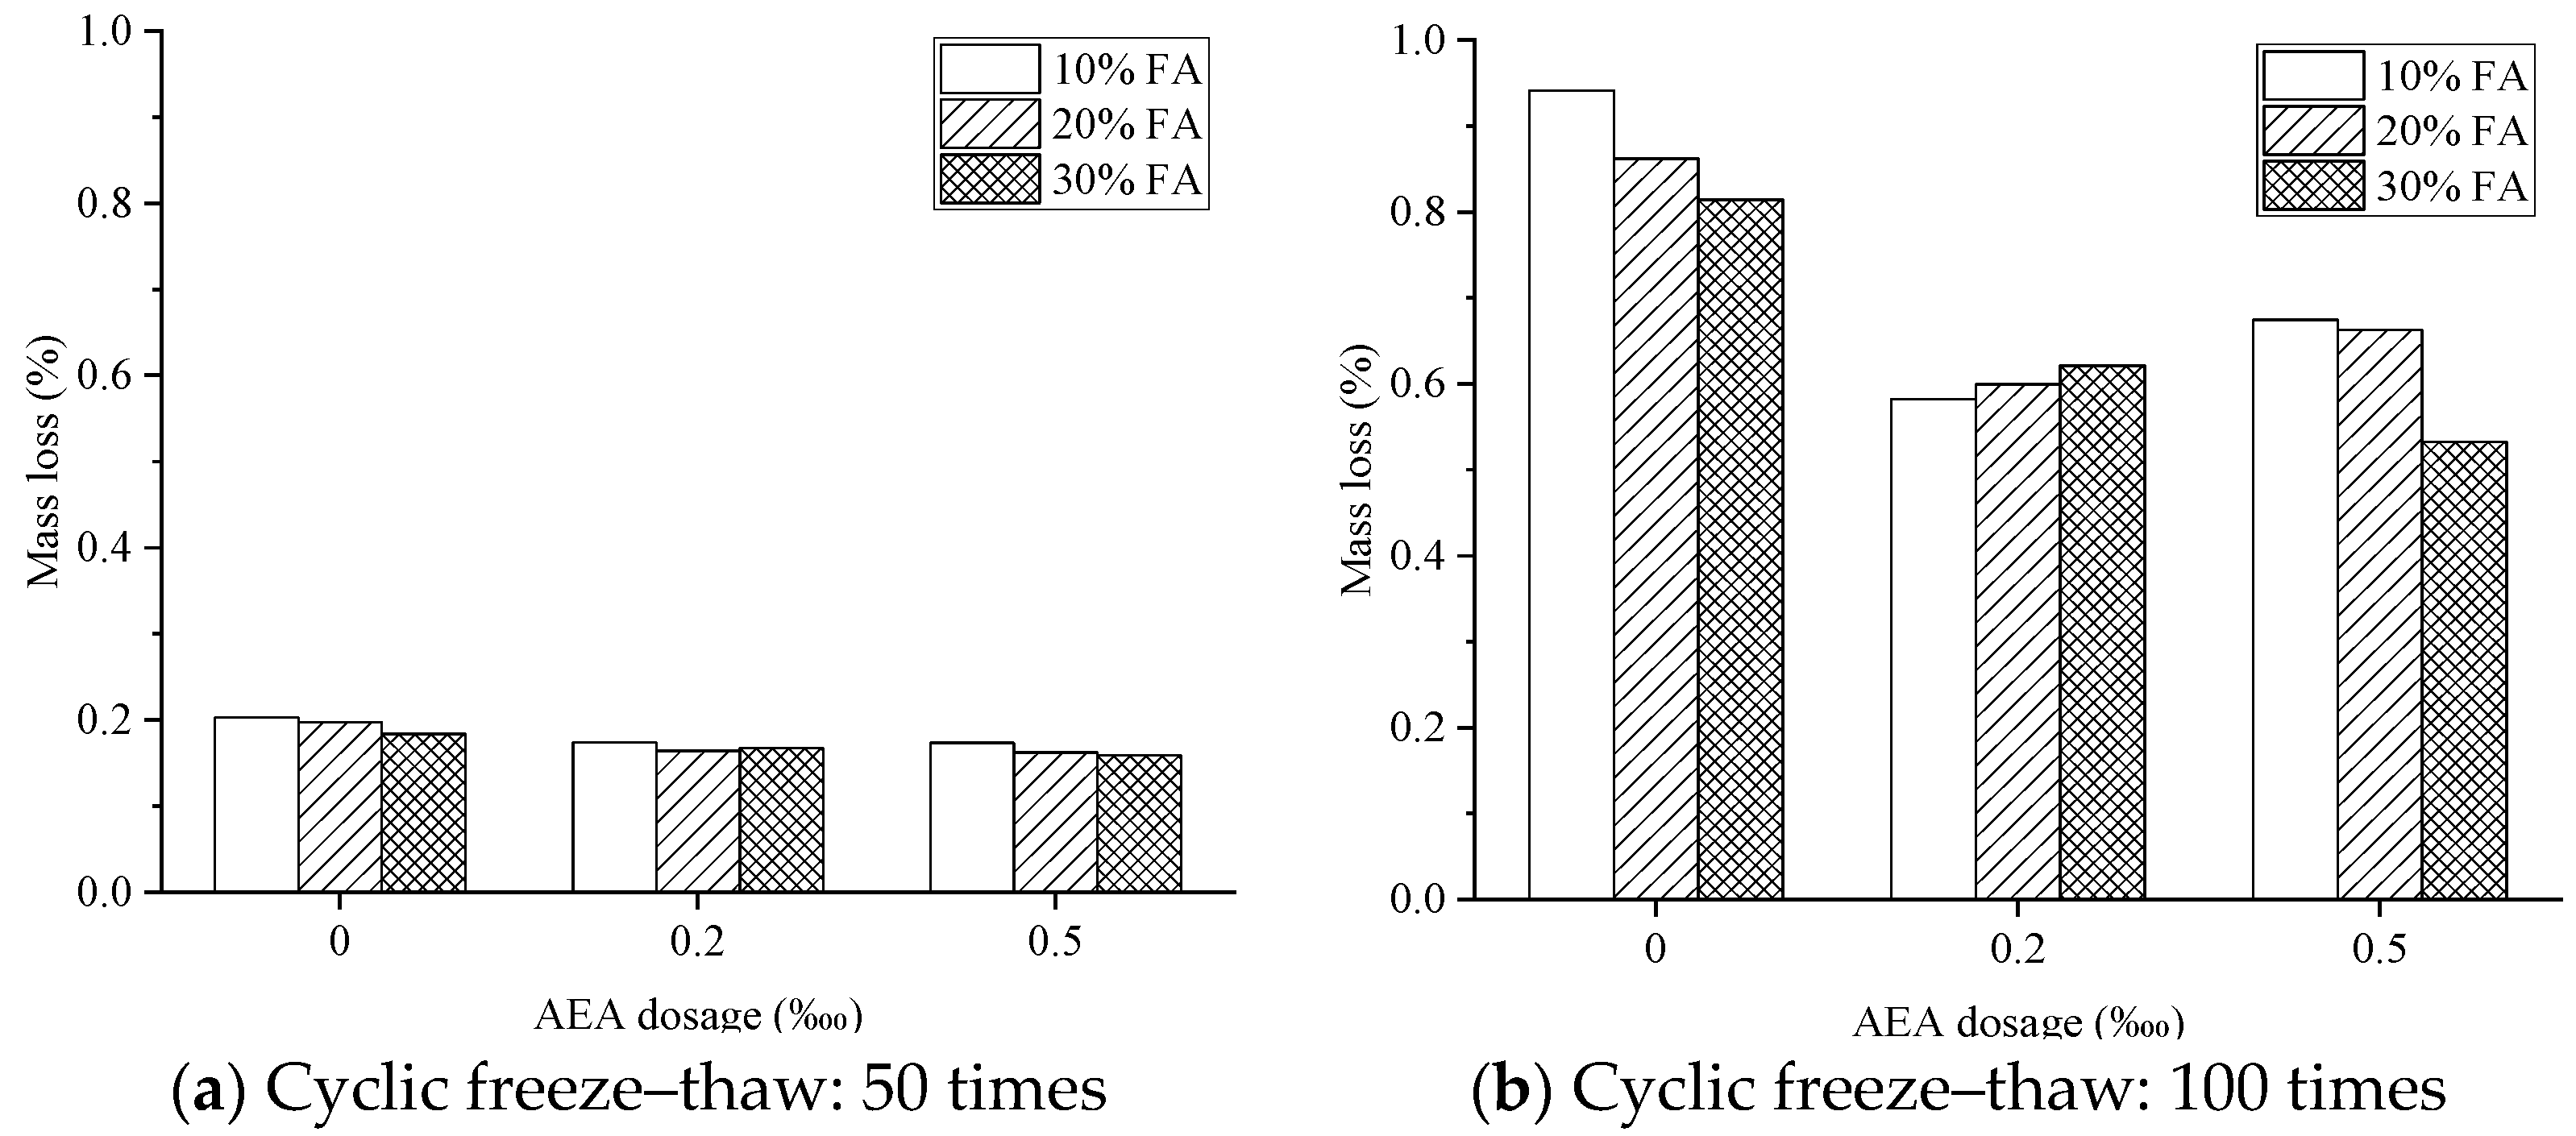
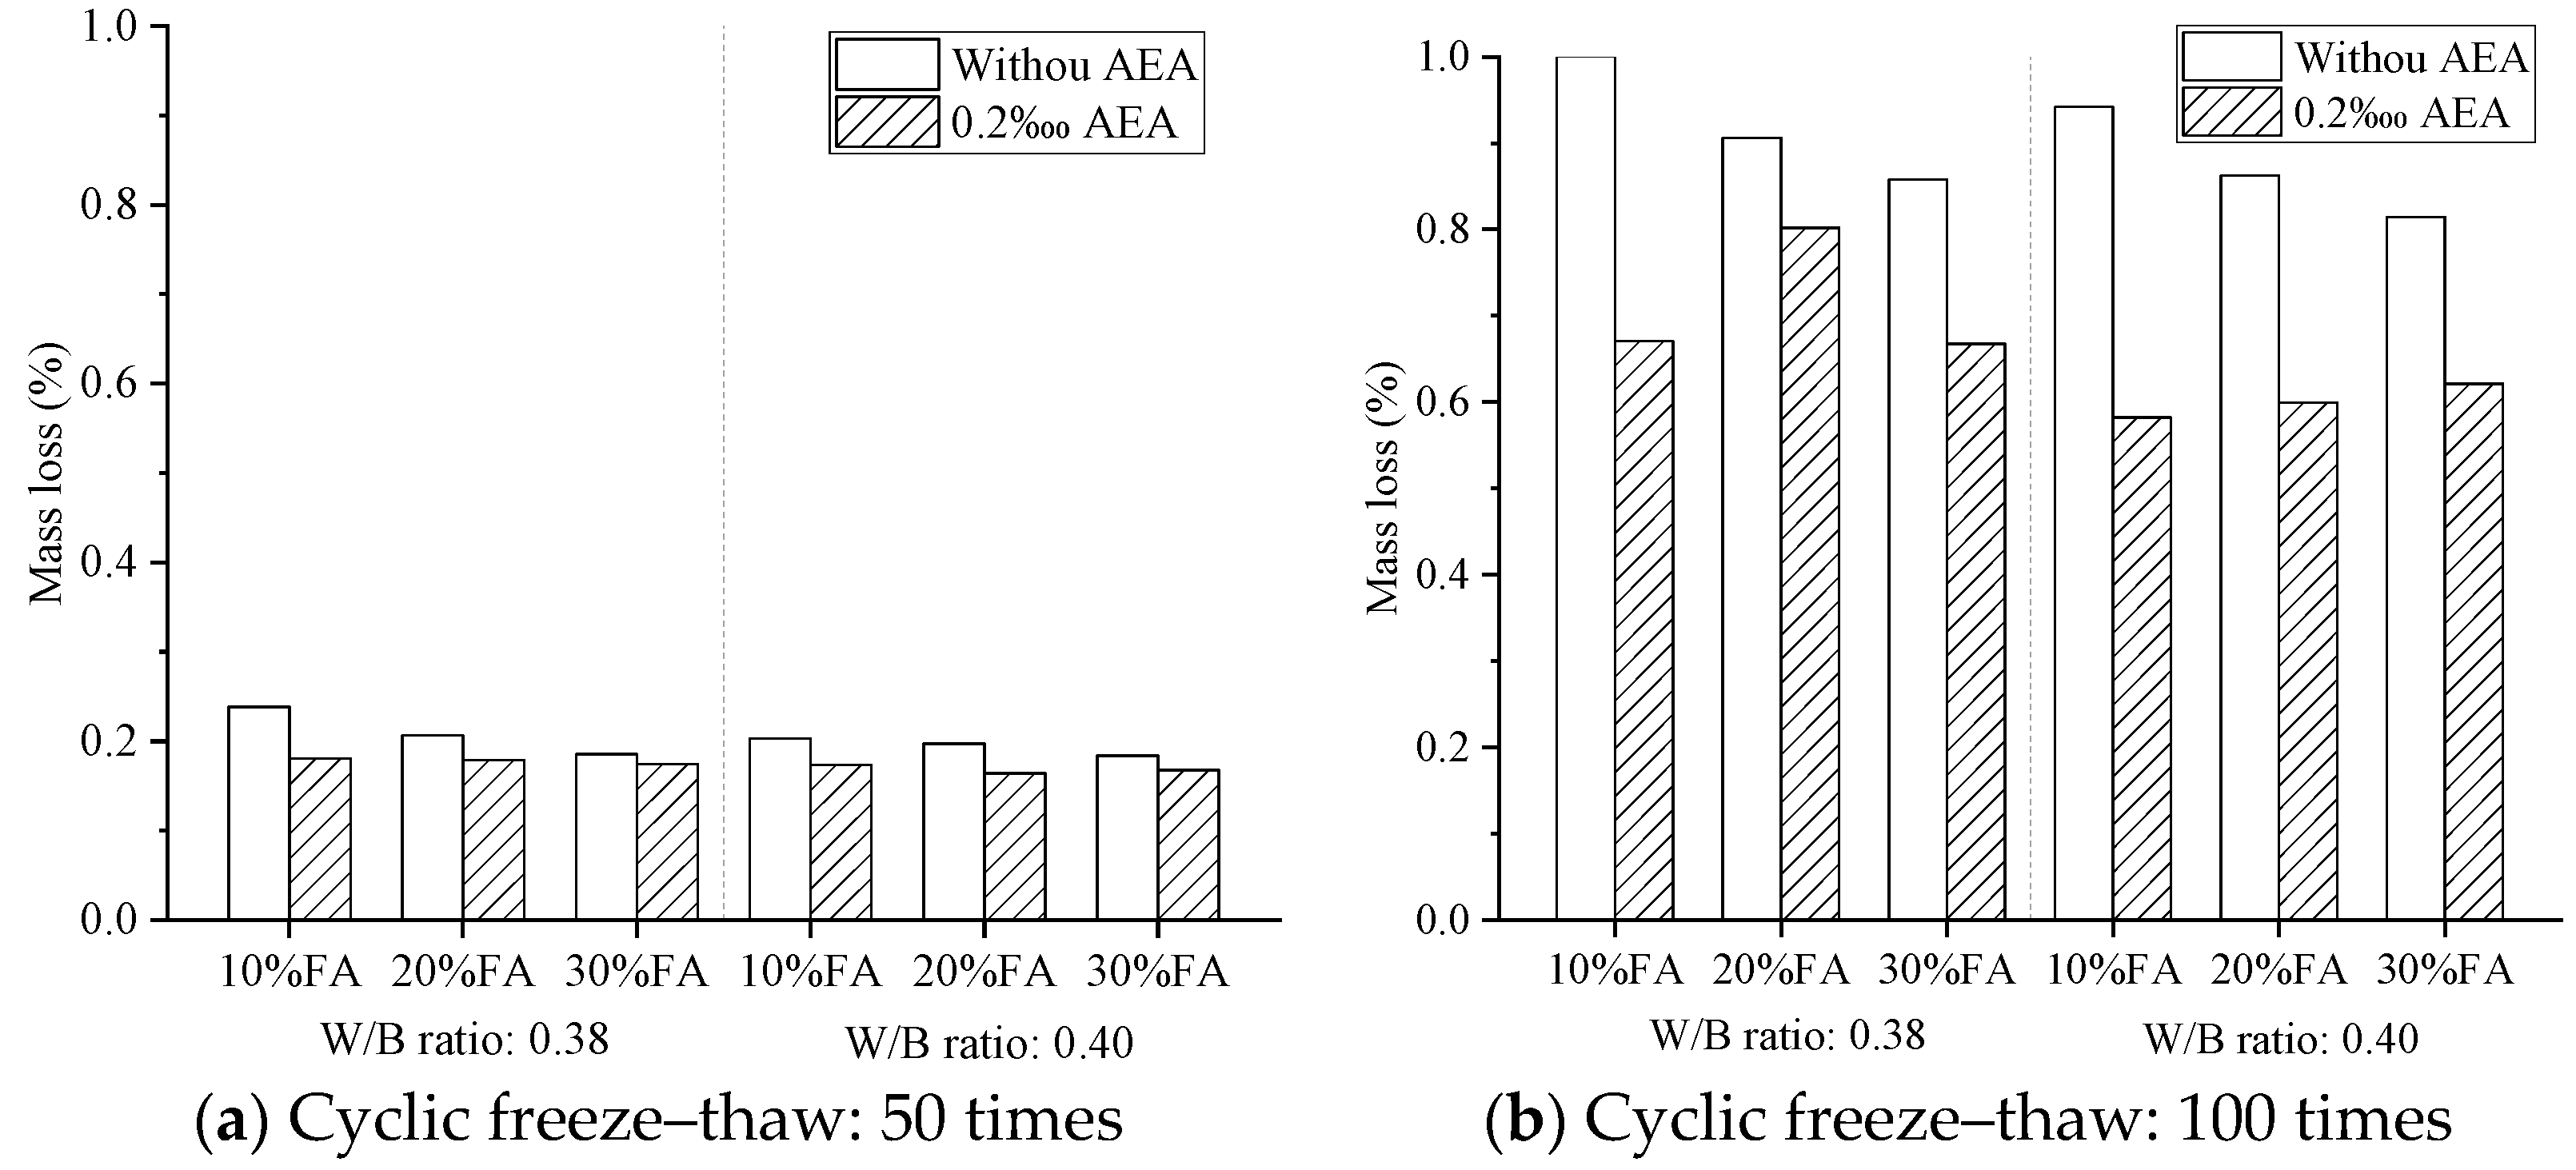
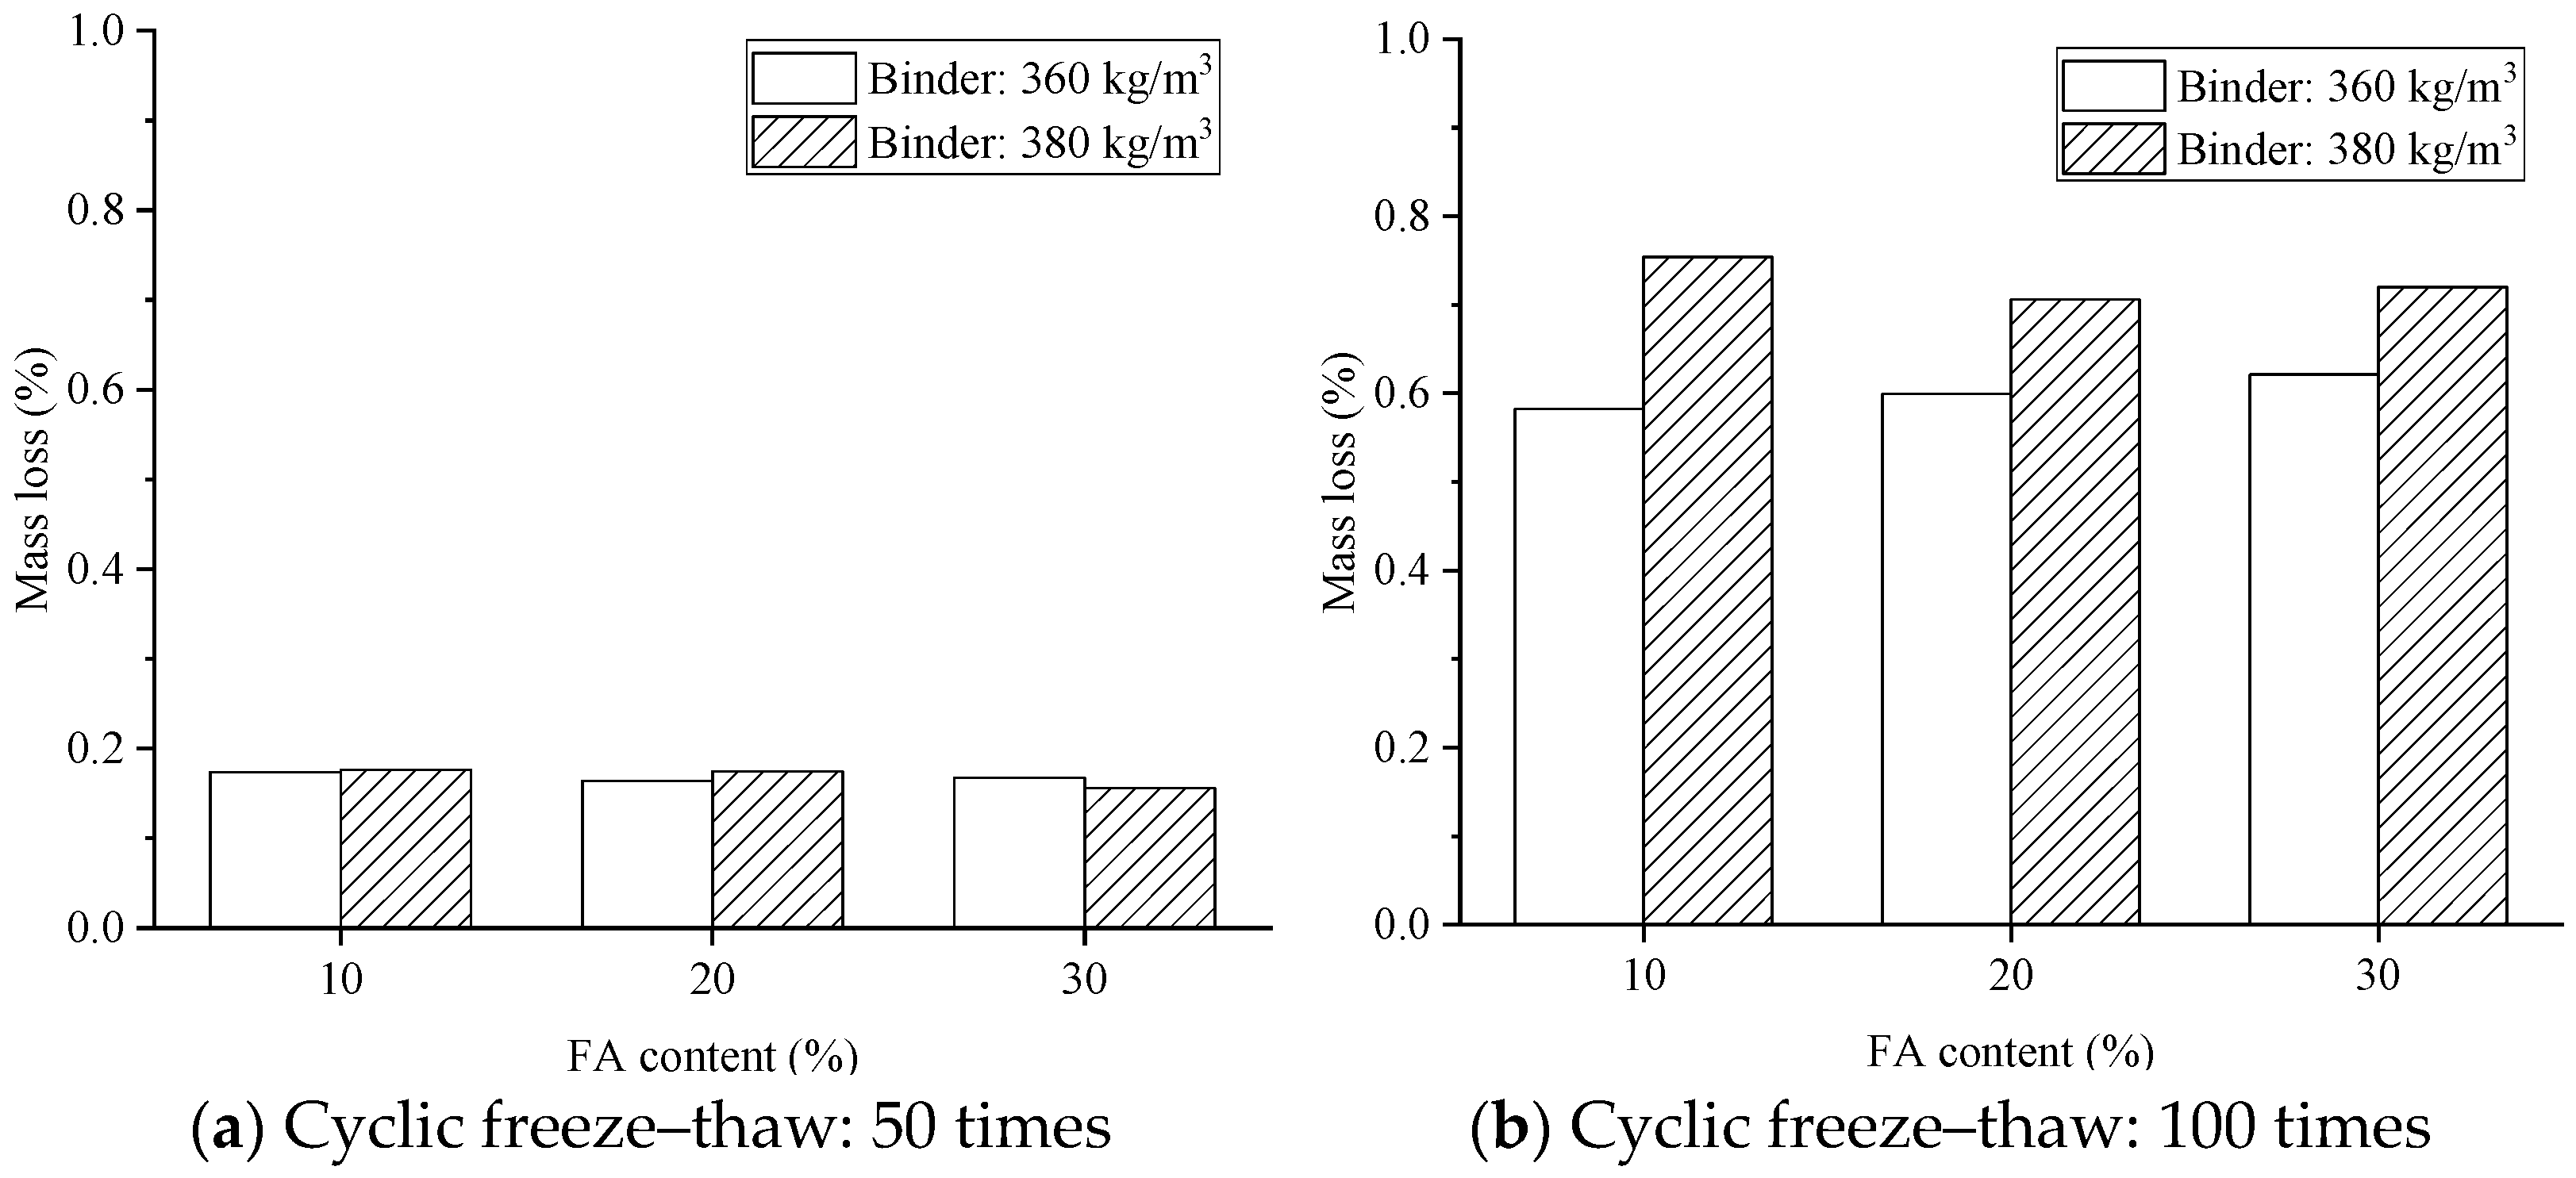
3.2. Freeze–Thaw Resistance

MS concrete specimens with 28 days of standard curing also underwent freeze–thaw cycle to evaluate their freeze–thaw resistance. Figure 6 shows the effects of different W/B ratios and FA contents on mass loss in MS concrete after cyclic freeze and thaw. For the specimens after 50 cycles and 100 cycles of freeze and thaw, mass loss not only decreased with the increase in W/B ratio, but also decreased with the increase in FA content. After 100 cycles, the highest mass loss was almost 1% for the specimens with a W/B ratio of 0.38 and FA content of 10%, while the lowest mass loss was 0.79% for the specimens with a W/B ratio of 0.42 and an FA content of 30%. This indicated that a higher W/B ratio and a higher FA content could improve the freeze–thaw resistance of MS concrete.
Considering the effect of W/B ratio on the compressive strength and mass loss of MS concrete as mentioned above, a W/B ratio of 0.4 was also adopted to study the effect of AEA dosage (0~0.5‱) on the freeze–thaw resistance of MS concrete containing different FA contents. As seen in Figure 7a, the mass loss of concrete with 50 cycles slightly decreased as the AEA dosage increased from 0 to 0.5‱. After 100 cycles, the mass loss in specimens with AEA dosages of 0.2‱ and 0.5‱ was obviously lower than those without AEA. The lowest mass loss was 0.53% for the specimens with an AEA dosage of 0.5‱ and FA content of 30%. This indicated that the addition of AEA effectively improved the freeze–thaw resistance of MS concrete.
Considering the effect of AEA dosage on the compressive strength and mass loss of MS concrete, an AEA dosage of 0.2‱ was further adopted to compare the mass loss of MS concrete with different AEA dosages and W/B ratios. The experimental results are shown in Figure 8. As seen, the increase in W/B ratio led to the reduction of mass loss after 50 and 100 cycles, regardless of whether AEA was added or not. After 100 cycles, the highest mass loss was obtained by the specimens without AEA and with a W/B ratio of 0.38 and FA content of 10%, while the lowest mass loss was 0.58%, obtained by the specimens with an AEA dosage of 0.2‱, W/B ratio of 0.4 and FA content of 10%. It can be seen that the improvement in freeze–thaw resistance by AEA addition was better than that caused by the increase in W/B ratio and FA content.
The effect of binder content (360~380 kg/m3) on mass loss in MS concrete was also investigated, and the results are shown in Figure 9. After 50 cycles, the mass loss in MS concrete with a binder content of 360 kg/m3 was close to that with a binder content of 380 kg/m3. However, after 100 cycles, the mass loss in MS concrete with a binder content of 380 kg/m3 was higher than that with a binder content of 360 kg/m3. The highest mass loss was 0.75%, obtained by the specimens with a binder content of 380 kg/m3 and FA content of 10%, while the lowest mass loss was 0.58%, obtained by the specimens with a binder content of 360 kg/m3 and FA content of 10%. This indicated that the increase in binder content had a negative impact on the freeze–thaw resistance of MS concrete.

3.3. Pore Size Distribution

To further investigate the effects of these parameters on the evolutions of the compressive strength and freeze–thaw resistance of MS concrete from the micro aspect, the pore size distribution of MS concrete was analyzed. The experimental results are shown in Figure 10. As seen in Figure 10a, MS concrete with an FA content of 10% had a total pore volume of more than 0.037 mL/g. The increase in FA content from 10% to 30% significantly reduced the total pore volume to 0.021 mL/g. Moreover, two sharp peaks were observed in Figure 10b for MS concrete containing an FA content of 10%, while no obvious peak was observed for MS concrete containing an FA content of 30%. This indicated that the increase in FA content densified the microstructure of MS concrete. Figure 10c,d shows the pore size distribution of MS concrete with different W/B ratios. MS concrete with a W/B ratio of 0.38 had a total pore volume of 0.010 mL/g, which was lower than that with a W/B ratio of 0.4. This illustrated that the increase in W/B ratio resulted in a more porous structure of MS concrete. Figure 10e,f shows the pore size distribution of MS concrete with and without AEA. MS concrete with an AEA dosage of 0.2‱ had a total pore volume of 0.026 mL/g, which was higher than that without AEA. Furthermore, an obvious peak was observed in Figure 10f for MS concrete with AEA addition. MS concrete with a more porous structure was obtained after adding AEA. Figure 10g,h shows the pore size distribution of MS concrete with different binder contents. MS concrete with a binder content of 380 kg/m3 had a total pore volume of 0.017 mL/g, which was lower than that with a binder content of 360 kg/m3. This illustrated that the increase in binder content compacted the microstructure of MS concrete.

3.4. Microstructural Observation

Apart from the pore size distribution, morphological characteristics of MS concrete were also analyzed. SEM images of MS concrete after 28 days of standard curing are given in Figure 11. For MS concrete with an FA content of 10%, shown in Figure 11a, microstructure was mainly composed of hydration products. Spherical FA particles could hardly be seen, indicating that FA was fully reacted during the hydration process. The high hydration degree of the cementitious system contributed to the binder strength between sand and aggregates, thereby providing a higher mechanical strength. After FA content was increased to 30%, more spherical FA particles with different sizes were observed in the matrix (Figure 11b). This indicated that the content of FA was excessive and could not be fully reacted, thereby lowering the hydration degree of the binder system. As a result, MS concrete with a higher FA content presented a lower compressive strength, as shown in Figure 2. However, unreacted FA particles with different sizes filled in the matrix during the hydration process to adjust the microstructure by the filler effect, as shown in Figure 11c. Also, CSH gel can generate among FA particles to form a homogeneous structure, as shown in Figure 11d. CSH gel is the key component of concrete and is ultimately responsible for the mechanical behavior of cementitious materials [33]. This is consistent with the lower cumulative pore volume obtained by MS concrete with an FA content of 30%, as shown in Figure 10a. Furthermore, the mass loss in MS concrete due to cyclic freeze and thaw was reduced with the increase in FA content. After an AEA dosage of 0.2‱ was incorporated into MS concrete, the microstructure turned out to be much looser due to the incorporation of more pores, as shown in Figure 11e. The addition of AEA introduced numerous stable closed tiny air bubbles into concrete. This offered tiny cavities for volumetric expansion induced by the conversion of water to ice during the frost process. As a result, the heaving pressure and hydrostatic pressure can be relieved. When AEA dosage was increased to 0.5‱, a much more porous microstructure was observed, as shown in Figure 11f. This is consistent with the reduction in compressive strength in Figure 3 and the increase in pore volume in Figure 10e due to AEA addition. The porous microstructure also improved the freeze–thaw resistance of MS concrete, which is in line with the reduction in mass loss due to AEA addition, as shown in Figure 7. Figure 11g,h shows the microstructure of MS concrete with a binder content of 380 kg/m3. It can be seen that the increase in binder content resulted in more hydration products, building a much more compact structure. This is consistent with the reduction in pore volume shown in Figure 10g. However, the increase in binder content also led to the presence of microcracks, probably induced by the formation of excess hydration products with large crystals. This is in line with the increase in mass loss, as shown in Figure 9, and the lower improvement in compressive strength, as shown in Figure 5.

4. Conclusions

This paper mainly studied the effect of different raw material parameters, including water-to-binder (W/B) ratio, air-entraining agent (AEA), fly ash (FA) and binder content on the mechanical strength and freeze–thaw resistance of manufactured sand (MS) concrete. The conclusions are drawn as follows:
(1) The increase in W/B ratio from 0.38 to 0.42 led to an increase in pore volume in MS concrete, thereby reducing the compressive strength. The compressive strength at 28 days for MS concrete containing 10% FA was reduced from 51.7 MPa to 44.5 MPa as the W/B ratio increased. Meanwhile, increasing W/B ratio led to a reduction in the mass loss in MS concrete after cyclic freeze and thaw, indicating the improvement in freeze–thaw resistance;
(2) The increase in FA content from 10% to 30% reduced the pore volume in MS concrete, but also reduced the number of hydration products. This led to a reduction in compressive strength. The compressive strength at 28 days for MS concrete with a W/B ratio of 0.38 was reduced from 51.7 MPa to 45.1 MPa. The freeze–thaw resistance of MS concrete was improved with the increase in FA content;
(3) The addition of AEA resulted in a porous microstructure in MS concrete, which is consistent with the increase in pore volume after adding AEA. The cumulative pore volume was increased from 0.021 mL/g to 0.026 mL/g after adding AEA. Meanwhile, the compressive strength of MS concrete was reduced with the increase in AEA dosage from 0 to 0.5‱. However, AEA addition effectively improved the freeze–thaw resistance of MS concrete;
(4) Increasing binder content from 360 kg/m3 to 380 kg/m3 reduced the pore volume of MS concrete. The cumulative pore volume was reduced from 0.026 mL/g to 0.017 mL/g as the binder content increased. However, the increase in binder content also led to the presence of microcracks due to the excess generation of large crystals. Therefore, the increase in binder content had less impact on improving the compressive strength and freeze–thaw resistance of MS concrete.

Author Contributions

Conceptualization, J.G. and Z.J.; methodology, P.Z.; validation, S.Z. and Q.Y.; formal analysis, K.G.; investigation, P.Z. and Q.S.; resources, S.Z. and Q.Y.; data curation, P.Z.; writing—original draft preparation, P.Z.; writing—review and editing, K.G., Q.S. and Z.J.; supervision, J.G.; project administration, S.Z. All authors have read and agreed to the published version of the manuscript.

Funding

This research received no external funding.

Data Availability Statement

The original contributions presented in this study are included in the article. Further inquiries can be directed to the corresponding author.

Conflicts of Interest

Author Sigui Zhao is employed by the Guizhou Daowu Highway Construction Co., Ltd. Author Qian Yang is employed by the Guizhou Hongxin Chuangda Engineering Detection & Consultation Co., Ltd. The remaining authors declare that the research was conducted in the absence of any commercial or financial relationships that could be construed as a potential conflict of interest.

References

  1. Luo, S.; Bai, T.; Guo, M.; Wei, Y.; Ma, W. Impact of freeze-thaw cycles on the long-term performance of concrete pavement and related improvement measures: A review. Materials 2022, 15, 4568. [Google Scholar] [CrossRef] [PubMed]
  2. Huang, Z.; Xu, H.; Li, J.; Luo, N. Has highway construction narrowed the urban–rural income gap? Evidence from Chinese cities. Pap. Reg. Sci. 2020, 99, 705–723. [Google Scholar] [CrossRef]
  3. Huang, X.; Wang, S.; Zhou, Y. Soil organic carbon change relating to the prevention and control of rocky desertification in Guizhou Province, SW China. Int. J. Glob. Warm. 2018, 15, 315–332. [Google Scholar] [CrossRef]
  4. Griffiths, S.; Sovacool, B.K.; Furszyfer Del Rio, D.D.; Foley, A.M.; Bazilian, M.D.; Kim, J.; Uratani, J.M. Decarbonizing the cement and concrete industry: A systematic review of socio-technical systems, technological innovations, and policy options. Renew. Sustain. Energy Rev. 2023, 180, 113291. [Google Scholar] [CrossRef]
  5. Wang, Y.; Gu, H.; Gu, C.; Shao, C.; Jiang, Z.; Wang, Y.; Chen, X. Analysis of concrete damage evolution in cold regions under combined freeze-thaw cycle-crack effect. Constr. Build. Mater. 2024, 456, 139296. [Google Scholar] [CrossRef]
  6. Shen, W.; Liu, Y.; Wang, Z.; Cao, L.; Wu, D.; Wang, Y.; Ji, X. Influence of manufactured sand’s characteristics on its concrete performance. Constr. Build. Mater. 2018, 172, 574–583. [Google Scholar] [CrossRef]
  7. Cortes, D.D.; Kim, H.K.; Palomino, A.M.; Santamarina, J.C. Rheological and mechanical properties of mortars prepared with natural and manufactured sands. Cem. Concr. Res. 2008, 38, 1142–1147. [Google Scholar] [CrossRef]
  8. Leleu, S.L.; Valdes, J.R. Experimental study of the influence of mineral composition on sand crushing. Geotechnique 2007, 57, 313–317. [Google Scholar] [CrossRef]
  9. Gonçalves, J.P.; Tavares, L.M.; Toledo Filho, R.D.; Fairbairn, E.M.R.; Cunha, E.R. Comparison of natural and manufactured fine aggregates in cement mortars. Cem. Concr. Res. 2007, 37, 924–932. [Google Scholar] [CrossRef]
  10. Safiddine, S.; Debieb, F.; Kadri, E.H.; Menadi, B.; Soualhi, H. Effect of crushed sand and limestone crushed sand dust on the rheology of cement mortar. Appl. Rheol. 2017, 27, 12–20. [Google Scholar] [CrossRef]
  11. Ding, X.X.; Li, C.Y.; Xu, Y.Y.; Li, F.L.; Zhao, S.B. Experimental study on long-term compressive strength of concrete with manufactured sand. Constr. Build. Mater. 2016, 108, 67–73. [Google Scholar] [CrossRef]
  12. Li, B.X.; Ke, G.J.; Zhou, M.K. Influence of manufactured sand characteristics on strength and abrasion resistance of pavement cement concrete. Constr. Build. Mater. 2011, 25, 3849–3853. [Google Scholar] [CrossRef]
  13. Benabed, B.; Kadri, E.-H.; Azzouz, L.; Kenai, S. Properties of self-compacting mortar made with various types of sand. Cem. Concr. Compos. 2012, 34, 1167–1173. [Google Scholar] [CrossRef]
  14. Singh, D.; Zaman, M.; Commuri, S. Inclusion of aggregate angularity, texture, and form in estimating dynamic modulus of asphalt mixes. Road Mater. Pavement Des. 2012, 13, 327–344. [Google Scholar] [CrossRef]
  15. Menadi, B.; Kenai, S.; Khatib, J.; Ait-Mokhtar, A. Strength and durability of concrete incorporating crushed limestone sand. Constr. Build. Mater. 2009, 23, 625–633. [Google Scholar] [CrossRef]
  16. Bederina, M.; Makhloufi, Z.; Bounoua, A.; Bouziani, T.; Quéneudec, M. Effect of partial and total replacement of siliceous river sand with limestone crushed sand on the durability of mortars exposed to chemical solutions. Constr. Build. Mater. 2013, 47, 146–158. [Google Scholar] [CrossRef]
  17. Ren, Q.; De Schutter, G.; Jiang, Z.; Chen, Q. Multi-level diffusion model for manufactured sand mortar considering particle shape and limestone powder effects. Constr. Build. Mater. 2019, 207, 218–227. [Google Scholar] [CrossRef]
  18. Liu, J.; Xu, L.; Liu, J.; Wang, W.; He, R. Experimental study on manufactured sand concrete containing mineral admixture under freeze-thaw cycles. Constr. Build. Mater. 2024, 453, 138759. [Google Scholar] [CrossRef]
  19. Li, W. Analysis of the influence water-cement ratio on concrete strength. E3S Web Conf. 2021, 283, 01016. [Google Scholar] [CrossRef]
  20. Peng, R.; Qiu, W.; Teng, F. Three-dimensional meso-numerical simulation of heterogeneous concrete under freeze-thaw. Constr. Build. Mater. 2020, 250, 118573. [Google Scholar] [CrossRef]
  21. Zhang, S.; Fan, Y.; Shah, S. Study on deformation characteristics and damage model of NMK concrete under cold environment. Buildings 2022, 12, 1431. [Google Scholar] [CrossRef]
  22. Gu, C.; Sun, W.; Guo, L.; Wang, Q.; Liu, J.; Yang, Y.; Shi, T. Investigation of microstructural damage in ultrahigh-performance concrete under freezing-thawing action. Adv. Mater. Sci. Eng. 2018, 2018, 3701682. [Google Scholar] [CrossRef]
  23. Oyunbileg, D.; Amgalan, J.; Batbaatar, T.; Temuujin, J. Evaluation of thermal and freeze-thaw resistances of the concretes with the silica fume addition at different water-cement ratio. Case Stud. Constr. Mater. 2023, 19, e02633. [Google Scholar] [CrossRef]
  24. Chen, C.; Lu, C.; Lu, C.; Wei, S.; Guo, Z.; Zhou, Q.; Wang, W. Synergetic effect of fly ash and ground-granulated blast slag on improving the chloride permeability and freeze–thaw resistance of recycled aggregate concrete. Constr. Build. Mater. 2023, 365, 130015. [Google Scholar] [CrossRef]
  25. Li, Y.; Wang, R.; Li, S.; Zhao, Y.; Qin, Y. Resistance of recycled aggregate concrete containing low- and high-volume fly ash against the combined action of freeze–thaw cycles and sulfate attack. Constr. Build. Mater. 2018, 166, 23–34. [Google Scholar] [CrossRef]
  26. Pushpalal, D.; Danzandorj, S.; Narantogtokh, B.; Nishiwaki, T.; Sashka, U.; Erdenebat, S.; Sambuu, C. Freezing-thawing durability and chemical characteristics of air-entrained sustainable concrete incorporated high-calcium fly ash in high-volume. J. Build. Eng. 2024, 89, 109307. [Google Scholar] [CrossRef]
  27. Gonzalez, D.C.; Mena, A.; Minguez, J.; Vicente, M.A. Influence of air-entraining agent and freeze-thaw action on pore structure in high-strength concrete by using CT-Scan technology. Cold Reg. Sci. Technol. 2021, 192, 103397. [Google Scholar] [CrossRef]
  28. Onuaguluchi, O.; Banthia, N. Entrained air and freeze-thaw durability of concrete incorporating nano-fibrillated cellulose (NFC). Cem. Concr. Compos. 2024, 150, 105582. [Google Scholar] [CrossRef]
  29. WawrzeĔczyk, J.; Juszczak, T.; Molendowska, A. Effect of binder composition on the structure of cement paste and on physical properties and freeze-thaw resistance of concrete. Procedia Eng. 2016, 161, 73–78. [Google Scholar] [CrossRef]
  30. Ugurlu, A.I.; Karakoç, M.B.; Ozcan, A. Effect of binder content and recycled concrete aggregate on freeze-thaw and sulfate resistance of GGBFS based geopolymer concretes. Constr. Build. Mater. 2021, 301, 124246. [Google Scholar] [CrossRef]
  31. ASTM C39; Standard Test Method for Compressive Strength of Cylindrical Concrete Specimens. ASTM International Committee: West Conshohocken, PA, USA, 2018.
  32. ASTM C666; Standard Test Method for Resistance of Concrete to Rapid Freezing and Thawing. ASTM International Committee: West Conshohocken, PA, USA, 2008.
  33. Izadifar, M.; Dolado, J.S.; Thissen, P.; Ukrainczyk, N.; Koenders, E.; Ayuela, A. Theoretical elastic constants of tobermorite enhanced with reduced graphene oxide through hydroxyl vs epoxy functionalization: A first-principles study. J. Phys. Chem. C 2023, 127, 18117–18126. [Google Scholar] [CrossRef]
Figure 1. Particle size distribution of coarse aggregate (CA) and manufactured sand (MS).
Buildings 15 01436 g001
Figure 2. Compressive strength of MS concrete with different W/B ratios and FA contents.
Buildings 15 01436 g002
Figure 3. Compressive strength of MS concrete with different FA contents and AEA dosages.
Buildings 15 01436 g003
Figure 4. Compressive strength of MS concrete with different W/B ratios and AEA dosages.
Buildings 15 01436 g004
Figure 5. Compressive strength of MS concrete with different binder contents and AEA dosages.
Buildings 15 01436 g005
Figure 6. Mass loss in MS concrete with different W/B ratios and FA contents.
Buildings 15 01436 g006
Figure 7. Mass loss of MS concrete with different FA contents and AEA dosages.
Buildings 15 01436 g007
Figure 8. Mass loss of MS concrete with different W/B ratios and AEA dosages.
Buildings 15 01436 g008
Figure 9. Mass loss in MS concrete with different binder contents.
Buildings 15 01436 g009
Figure 10. Pore size distribution of MS concrete: (a) Cumulative pore volume of F10 and F30; (b) Log differential intrusion of F10 and F30; (c) Cumulative pore volume of F30 and F30W1; (d) Log differential intrusion of F30 and F30W1; (e) Cumulative pore volume of F30 and F30Y1; (f) Log differential intrusion of F30 and F30Y1; (g) Cumulative pore volume of F30J and F30Y1 and (h) Log differential intrusion of F30J and F30Y1.
Buildings 15 01436 g010
Figure 11. SEM images of MS concrete: (a) F10 with Mag ×1000; (b) F30 with Mag ×1000; (c) F30 with Mag ×5000; (d) F30 with Mag ×37,000; (e) F30Y1 with Mag ×1000; (f) F30Y2 with Mag ×180; (g) F30J with Mag ×6000 and (h) F30J with Mag ×15,000.
Buildings 15 01436 g011
Table 1. Basic properties of P·O 42.5 cement.
Density
(g/cm3)
Specific Area
(m2/kg)
Water Consumption
(%)
Setting Time
(min)
Stability
(mm)
Flexural Strength
(MPa)
Compressive Strength (MPa)
InitialFinal3d28d3d28d
3.1131827.21983250.55.07.830.550.6
Table 2. Parameters of fly ash.
Water Demand
(%)
Finneess
(%)
Reactive Index
(%)
SO3
(%)
f-CaO
(%)
LOI
(%)
9820731.580.325.38
Table 3. Parameters of manufactured sand.
Mud Content
(%)
MB Value
(g/kg)
Stone Powder Content
(%)
Crushing Index
(%)
Apparent Density
(kg/m3)
Packing Density
(kg/m3)
Porosity
(%)
0.20.57.3202716165639.0
Table 4. Parameters of coarse aggregate.
Mud Content
(%)
Flatness and Elongation Ratio
(%)
Crushing Index
(%)
Apparent Density
(kg/m3)
0.13.582708
Table 5. Mixture design for manufactured sand concrete.
Mixture NotationBinder
(kg/m3)
W/B RatioFA
(%)
AEA
(‱)
Mass Ratio of Concrete (kg/m3)
OPCFASandCoarse AggregateWRAWater
5–10 mm5–25 mm
F10W13600.3810-324368741039233.6136.8
F20W13600.3820-288728741039233.6136.8
F30W13600.3830-2521088741039233.6136.8
F103600.4010-324368741039233.6144
F203600.4020-288728741039233.6144
F303600.4030-2521088741039233.6144
F10W23600.4210-324368741039233.6151.2
F20W23600.4220-288728741039233.6151.2
F30W23600.4230-2521088741039233.6151.2
F10Y13600.40100.2324368741039233.6144
F20Y13600.40200.2288728741039233.6144
F30Y13600.40300.22521088741039233.6144
F10Y23600.40100.5324368741039233.6144
F20Y23600.40200.5288728741039233.6144
F30Y23600.40300.52521088741039233.6144
F10J3800.40100.2342388741039233.8152
F20J3800.40200.2304768741039233.8152
F30J3800.40300.22661148741039233.8152
Disclaimer/Publisher’s Note: The statements, opinions and data contained in all publications are solely those of the individual author(s) and contributor(s) and not of MDPI and/or the editor(s). MDPI and/or the editor(s) disclaim responsibility for any injury to people or property resulting from any ideas, methods, instructions or products referred to in the content.

