Article

Overall Buckling Behavior and Design of Steel Stiffened Box Section Columns Under Axial Compression

1
Guangdong Yejian Construction Drawing Review Center Co., Ltd., Guangzhou 510062, China
2
Department of Bridge Engineering, Tongji University, Shanghai 200092, China
3
School of Civil Engineering, Fuzhou University, Fuzhou 350116, China
*
Author to whom correspondence should be addressed.
Buildings 2025, 15(9), 1474; https://doi.org/10.3390/buildings15091474
Submission received: 27 March 2025 / Revised: 18 April 2025 / Accepted: 25 April 2025 / Published: 26 April 2025
(This article belongs to the Special Issue Advanced Analysis and Design for Steel Structure Stability)

Abstract

:
This study experimentally and numerically investigated the overall buckling behavior of steel box column components. Two box section specimens were fabricated for axial compression tests. Prior to the tests, the material properties, initial geometric imperfections and residual stress were measured. In addition, an extended parameter analysis was conducted using a finite element model validated by experimental results to evaluate the impact of geometric defects and residual stresses on the bearing capacity of unstiffened and stiffened box section columns. A novel column curve was proposed based on massive datasets of parametric models. The short and long column specimens exhibited typical strength failure and buckling failure modes, respectively. The initial geometric imperfections and residual stresses slightly reduced the buckling strength from the models, with a maximum reduction in buckling strength owing to initial geometric imperfections of 5.2% and that owing to residual stresses of 6.52%. The unstiffened and stiffened box columns have the same stability coefficient when the slenderness ratio is the same. Additionally, the ultimate load capacity calculation formula for stiffened box columns proposed in this paper averages 2.20% higher than Class C curves in JTG D64-2015, lies between Japanese and U.S. codes, and demonstrates good accuracy.

1. Introduction

Owing to their inherently good axial compression performance, steel box columns possess high bending moments of inertia in both the transverse and longitudinal directions when applied to bridge structures. Thus, steel box columns are widely used in the design of actual bridge substructures [1]. The loads borne by bridge structures have increased along with the increases in bridge spans and road traffic demand. Unlike concrete structures, such compressed components frequently encounter instability issues owing to the relative flexibility of steel box columns as well as the large bending moments and axial forces at the base [2,3]. Therefore, the stability of steel box columns [4] has become an important research direction for many scholars, both domestically and internationally. The existing studies have focused on overall buckling analysis of box-section columns, but the influence of stiffeners on column-like buckling behavior remains unexplored. Susantha et al. [5] designed box-shaped steel-bridge piers with different yield points and conducted mechanical tests. Under the condition of a smaller wall plate width-to-thickness ratio, box-shaped steel bridge piers with a lower yield point exhibited relatively better stability and ductility. Ban et al. [6] used a verified model to calculate a large number of columns with different cross-sectional dimensions and lengths for box-shaped sections of steel as well as proposed corresponding column curves and design formulas. To investigate the influence of steel strength, Ban et al. [7] conducted analyses on six high-strength steel columns and derived corresponding column curves suitable for high-strength steel members based on their results. With further research, Shi et al. [8] discovered that the influence of imperfections on box-section columns decreases with increasing steel grade and further developed a new theoretical column curve based on the Perry–Robertson formula and thereby introduced a defect parameter that is unrelated to the steel strength. To facilitate comparison with Ban et al.’s research findings, Lei et al. [9] conducted axial compression tests on 10 thin-walled box section columns, and their results indicated that the overall stability bearing capacity of long columns was higher than the Class C column curve suggested by the Chinese specifications, being closer to that of the Class B column curve. Furthermore, given that thin-walled structures may also exhibit plate-like buckling behavior, Radwan et al. [10] used numerical simulation methods to study the nonlinear interaction and equivalent relationship between the local and overall buckling of welded box section compressed members when relevant buckling occurred and further put forward an equivalent coefficient for the defects of relevant buckling effects.
Most existing studies focus on conventional box section members. However, to prevent the instability of plate elements leading to structural failure, bridge box columns typically incorporate stiffening ribs to enhance their stable load-carrying capacity [11,12,13]. Furthermore, research on stiffening ribs is predominantly concentrated in the field of stiffened plates. Because of the presence of these ribs, members exhibit more complex welding effects and deformation behaviors. Hence, Nian-Zhong Chen et al. [14] proposed a reliability assessment method for the compressive strength of plate-stiffened panels under axial compression. Khedmati [15] analyzed the ultimate strength of open-stiffened plates under in-plane axial compressive loads and thoroughly compared the effects of different parabolic curvature ratios on the buckling strength and performance of such stiffened plates. Liu et al. [16] Cao et al. [17]. And Li et al. [18] systematically investigated weld filler deposition and heat input effects through experimental studies and finite element simulations. Their work captured the evolution of residual stresses and deformations in various stiffened plate configurations (including L-joints, T-joints, etc.) throughout the welding process, subsequently developing a simplified computational method for residual stress distribution. Shin et al. [19] used a multilinear constitutive relationship to study analytical models of conventional steel and high-performance steel and further put forward the calculation formula for the in-plane compressive strengths of flange-stiffened plates that are suitable for use with high-strength steels. Rahbar-Ranji [20,21] derived an expression for the effective widths of plate-stiffened panels by considering the coupling effect of flexural torsional buckling. Subsequently, the elastic buckling stress of the L-shaped stiffened plates under the interaction of bending and torsional buckling was analyzed using the equilibrium method. Sadamoto et al. [22] studied the force behaviors of plate stiffeners under different geometric defect conditions and proposed corresponding plate-shell analysis methods based on the different buckling behaviors that occur at failure. Khalaf et al. [23] investigated the effects of geometric imperfections on thin-walled steel plate structures and found that welding additional prestressed stiffeners could effectively enhance the buckling resistance of the plates. It can be concluded that extensive research in the field of stiffened plates has investigated both the buckling behavior of stiffeners and the influence of residual stresses induced by welded ribs, thereby providing fundamental support for studies on stiffened box columns.
Although stability theories for both conventional box sections and stiffened members have become well-established, current standards in China [24] lack explicit provisions for determining the compressive buckling capacity of stiffened steel box columns. Therefore, unlike conventional unstiffened box sections, it is essential to investigate the influence of stiffeners on the structural performance of steel box sections. lack explicit provisions for the compressive stability bearing capacity of stiffened steel box columns. Therefore, it is necessary to explore the effects of stiffening ribs on a steel box section and compare them with those on a conventional box section. Owing to the limitations of the loading device tonnage, this study fabricated two specimens based on a conventional box section, conducted corresponding measurements of the residual stress and initial geometric imperfections, and performed compressive stability tests. The analysis included the measurement results, failure modes, and load–displacement curves. Based on the aforementioned experimental results, a corresponding finite element method model was established, and the influencing factors of box-shaped members with longitudinal stiffeners as well as the overall stability mechanism of box-shaped members were further explored. Subsequently, the impacts of the initial geometric imperfections and welding residual stress on the overall stability performance of the box-shaped members were analyzed. By conducting a batch of calculations on the overall stability calculation models with different construction dimensions, a method for the overall stability calculation of box-shaped members with longitudinal stiffeners is proposed. The proposed method provides a reasonable theoretical basis for the future compressive overall stability design of stiffened steel box columns.

2. Experimental Design and Results

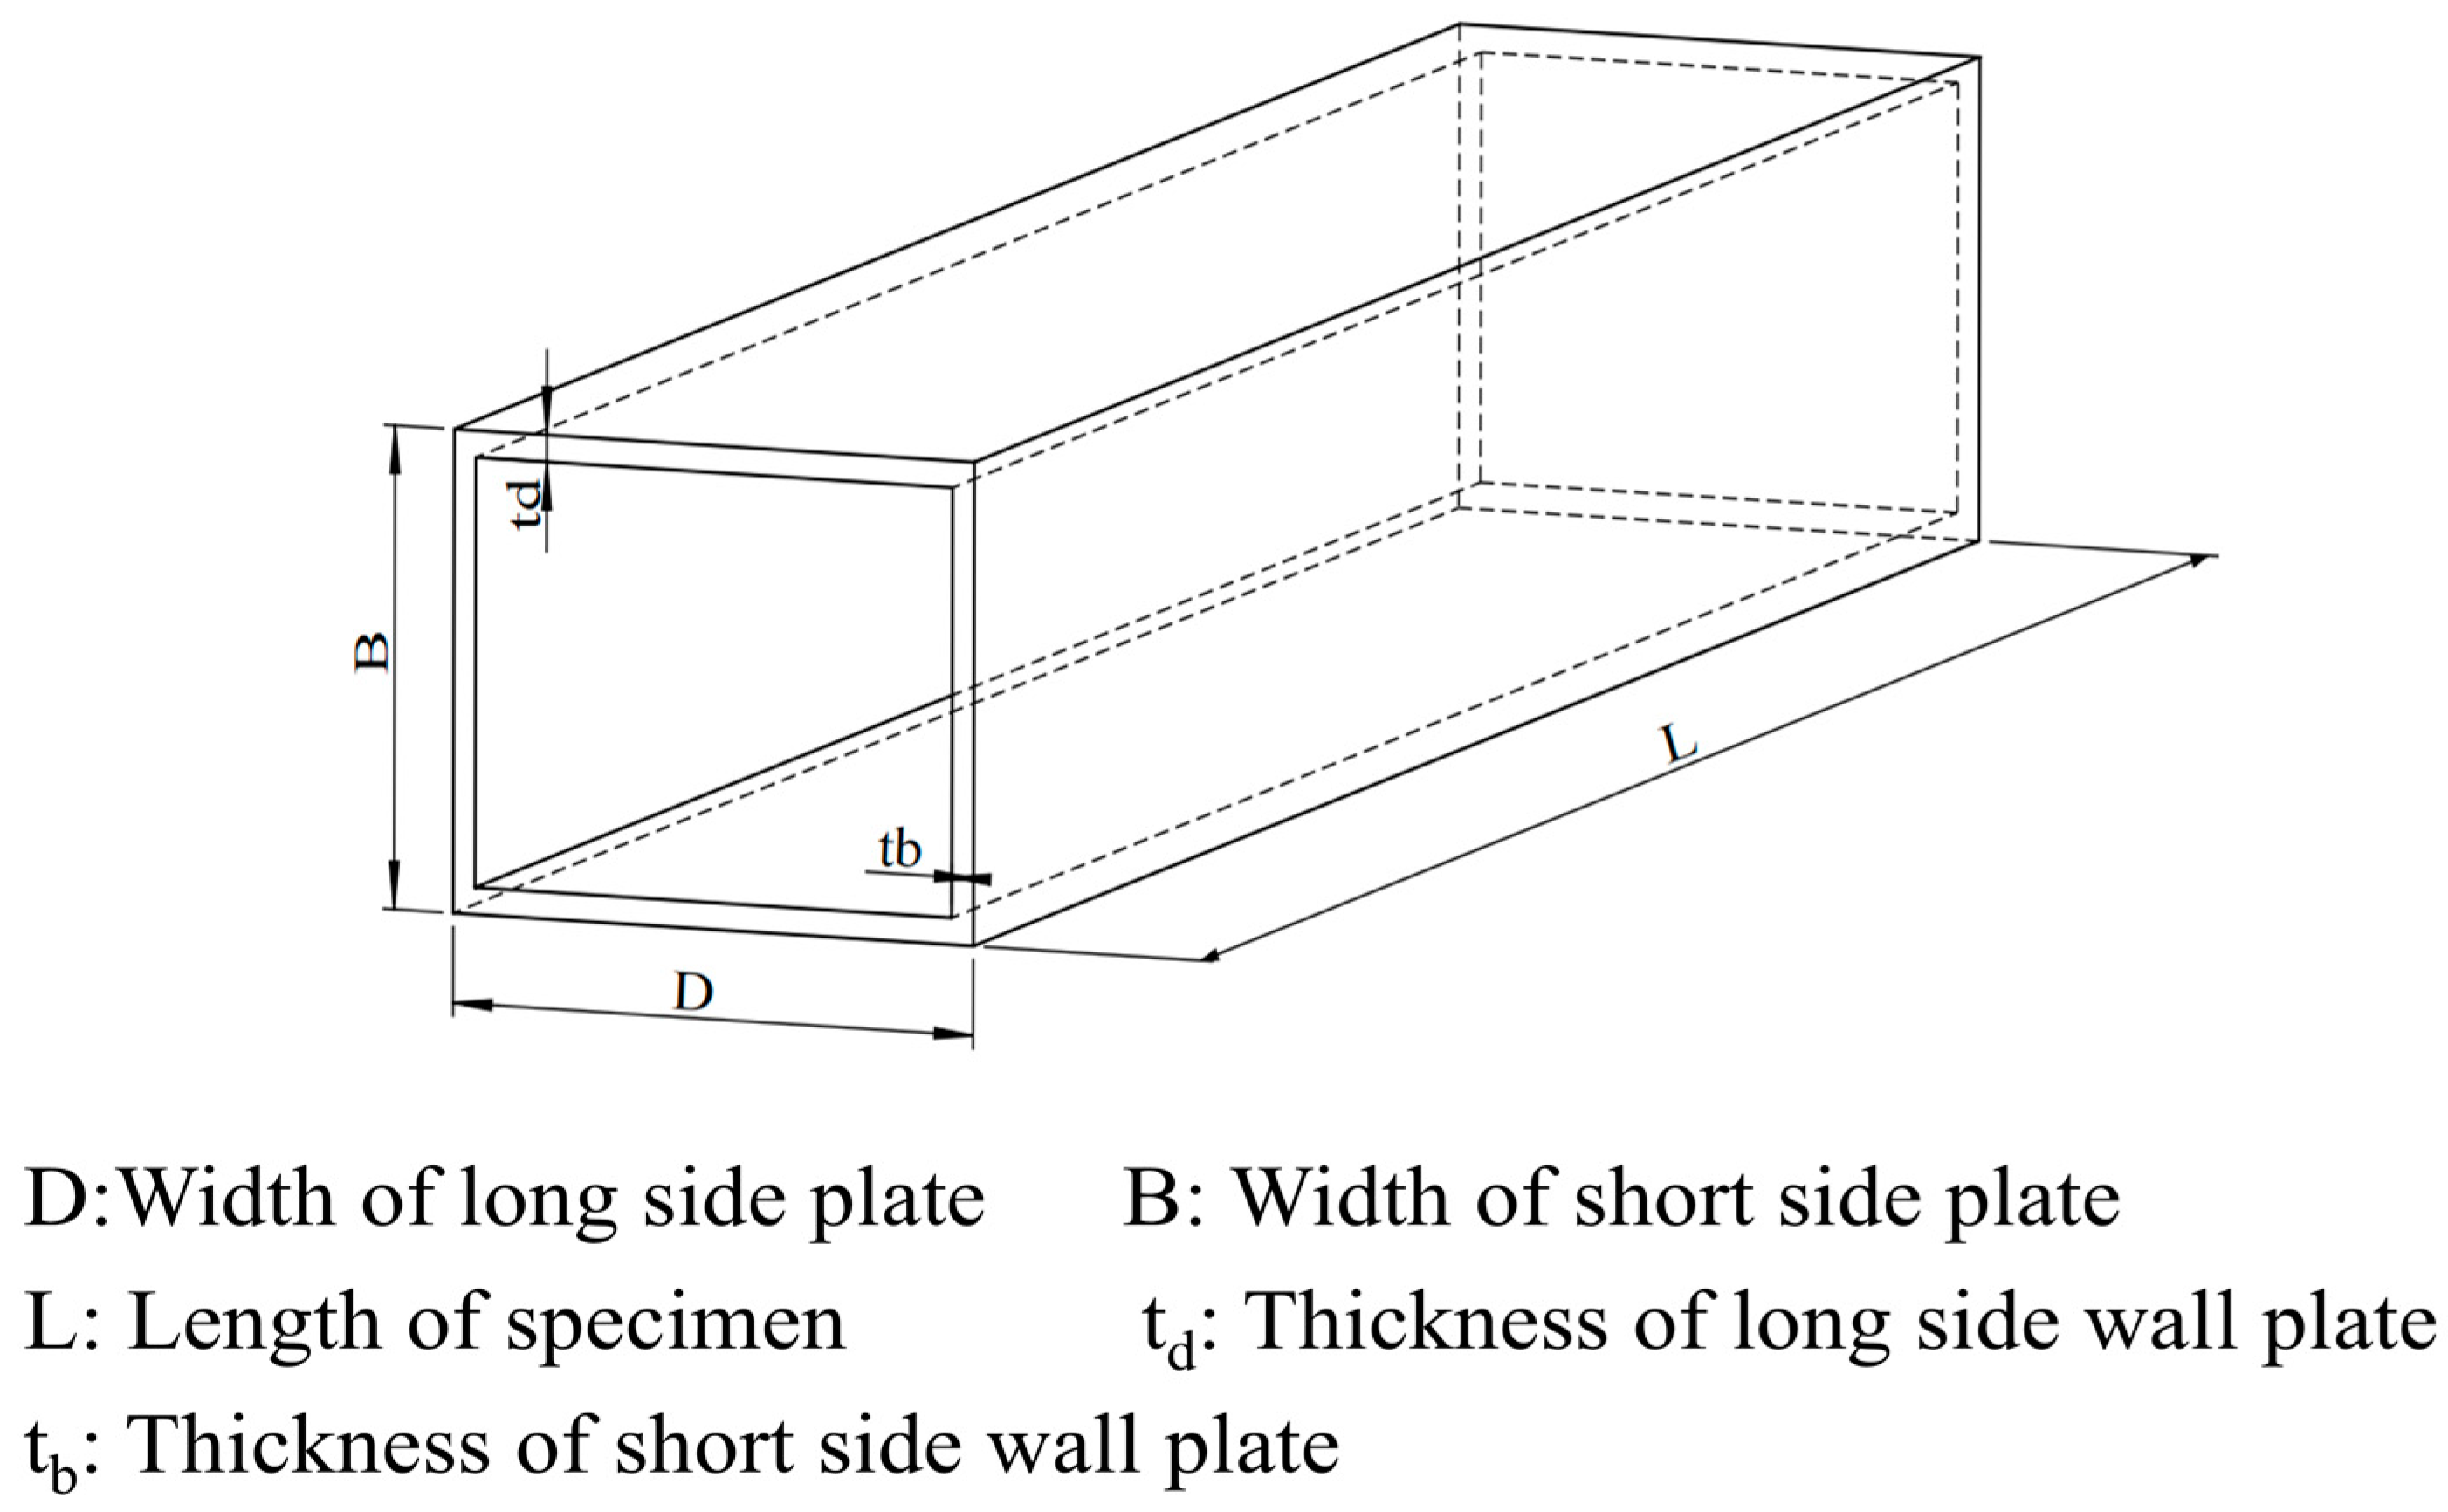
2.1. Specimen Design

For this experiment, two box section overall stability specimens were designed according to the theory of column buckling. Considering the dimensional and loading capacity limitations of the testing machine, box sections measuring 0.24 × 0.16 m were selected. Figure 1 depicts a diagram of each specimen. The experiment included one specimen for each size: 0.24 m and 4.2 m long columns. The longer side plates had a width-to-thickness ratio of 24, while the shorter side plates had a ratio of 16. The material of the test specimen is Q345 steel. Through the tensile test, its yield strength was obtained as 395 MPa. Table 1 lists the design dimensions of the box-shaped stabilized specimens.

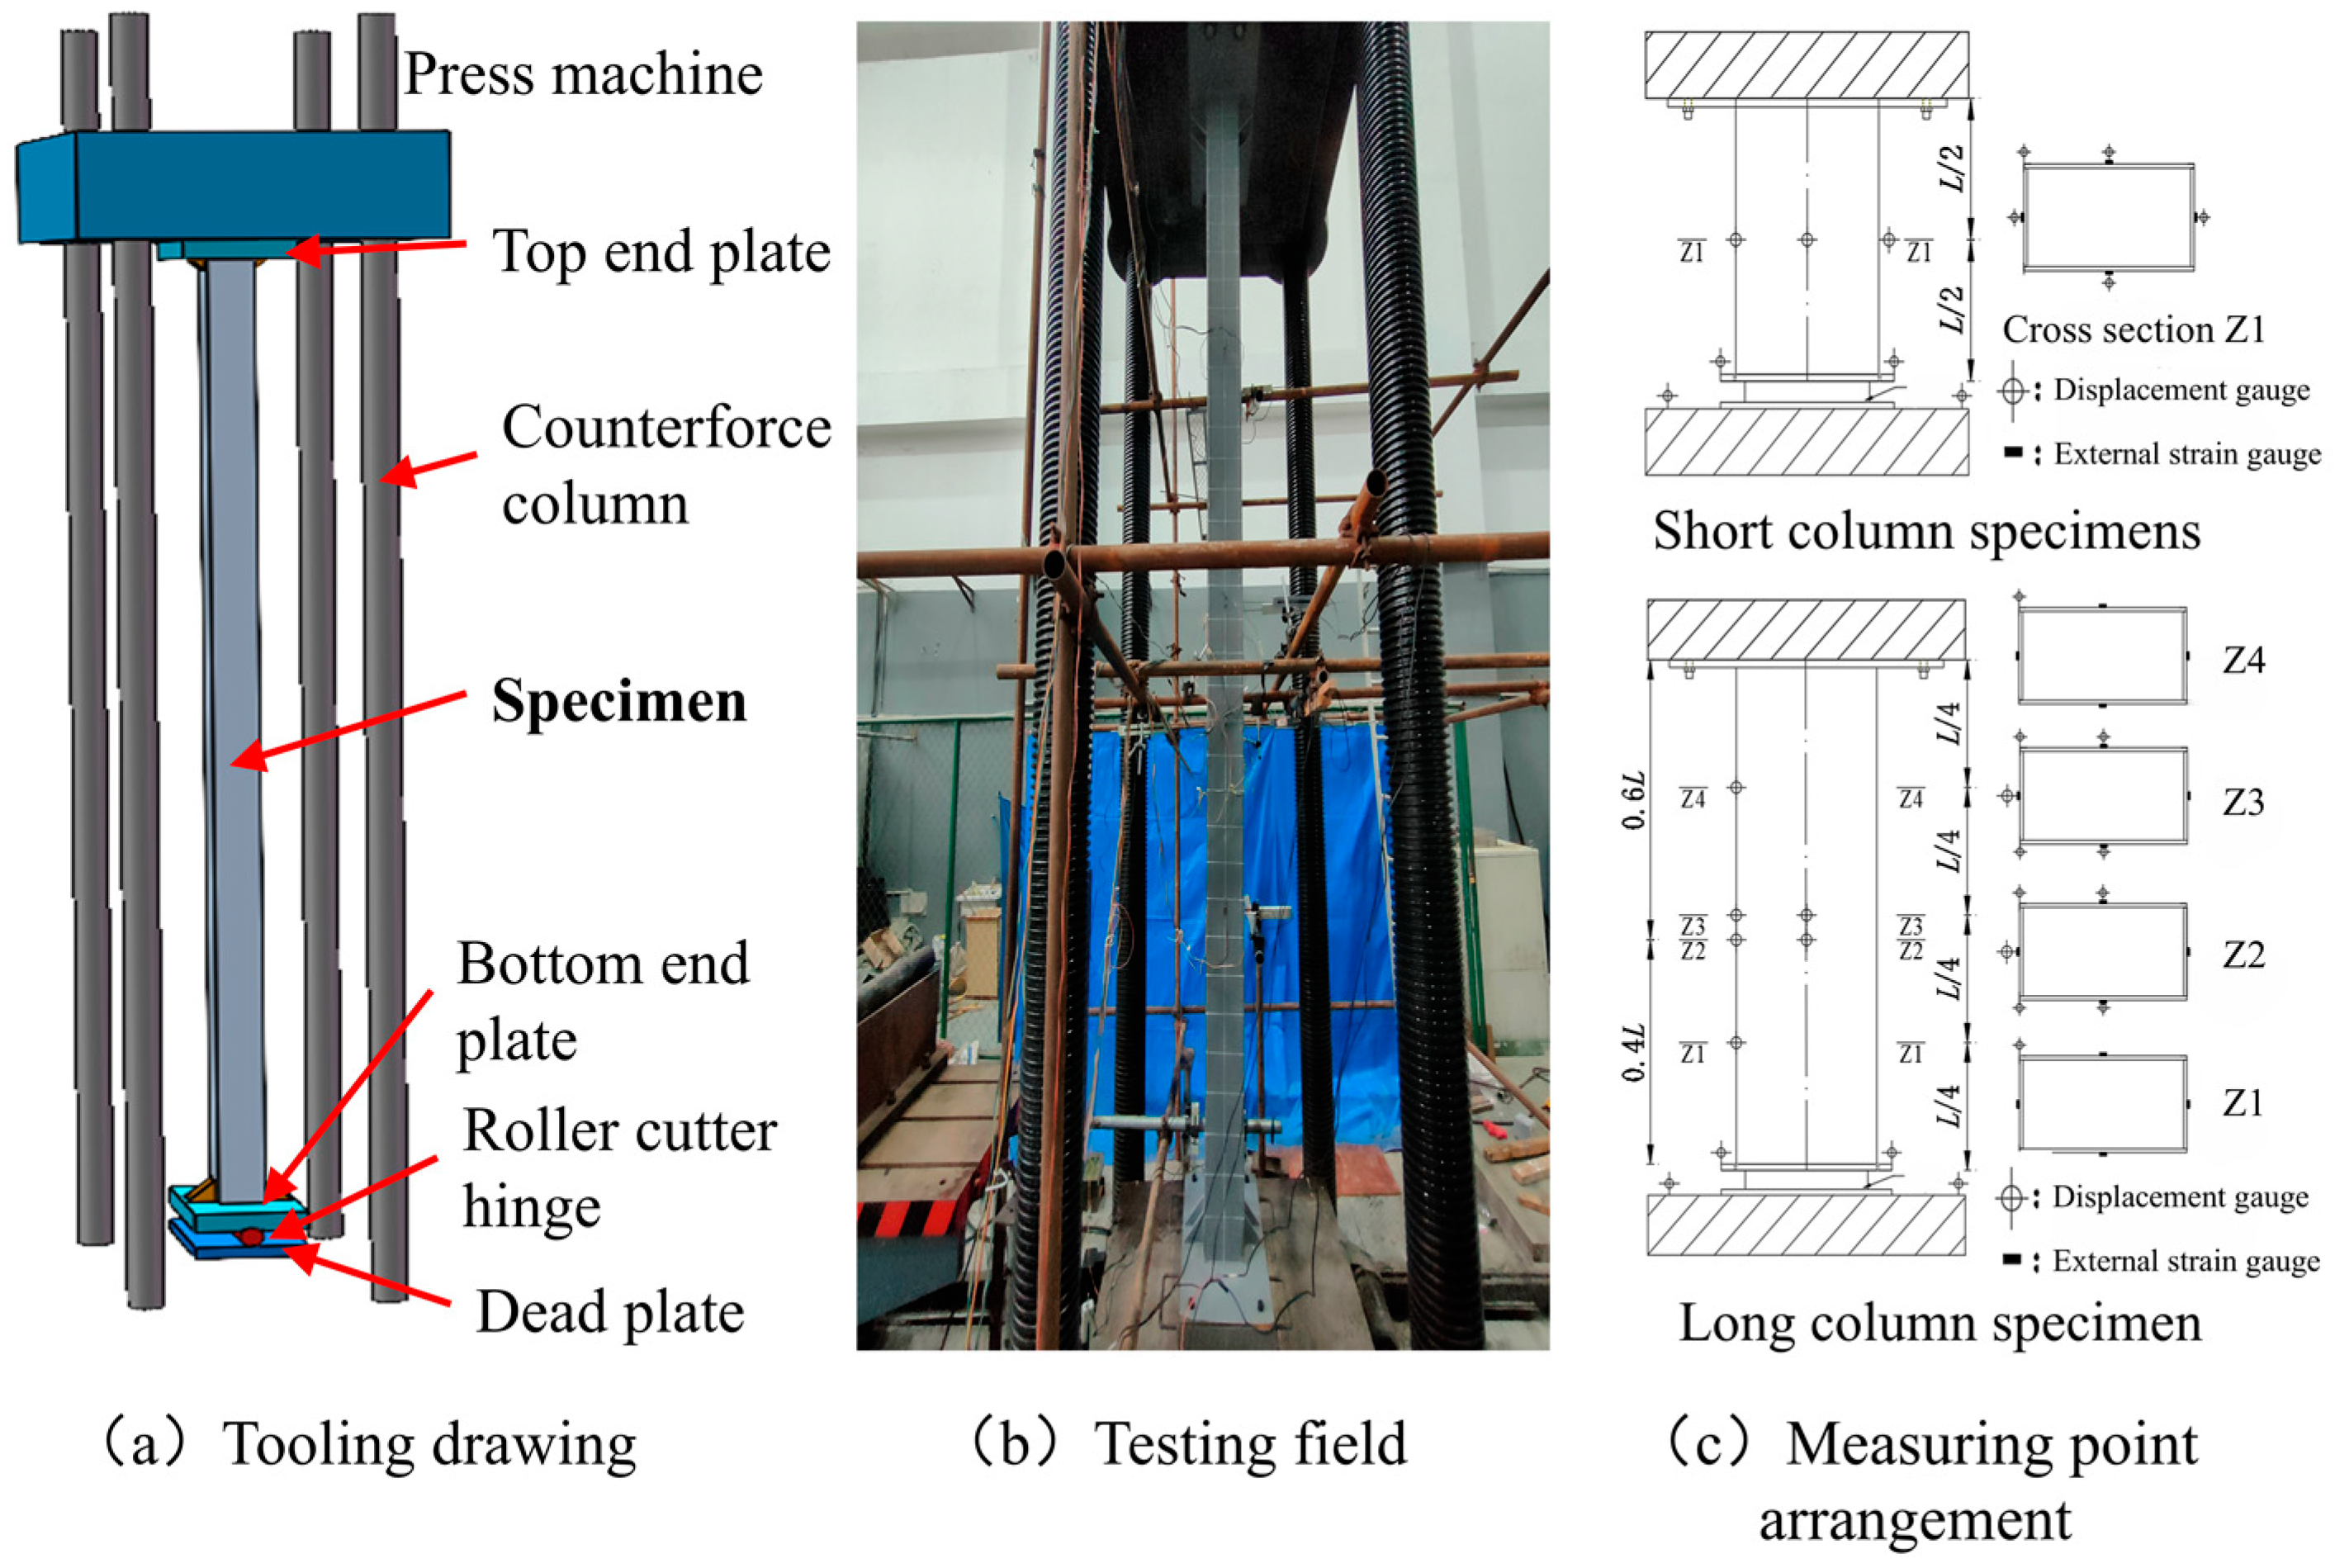
2.2. Loading System and Scheme

The experiments were conducted using a long-column pressure-testing machine, located at the Geotechnical Hall of Fuzhou University, with a maximum testing capacity of 10,000 kN. Prior to the commencement of the axial compression tests, preliminary loading was applied to approximately 10–20% of the estimated ultimate load. The loading process was divided into two stages. The first stage involved load-controlled loading with each increment set at approximately 100 kN. Upon reaching approximately 70% of the estimated ultimate load, the second stage of loading was initiated by employing displacement-controlled loading at a rate of 0.1 mm/s, which continued until significant structural deformation was observed, at which point the loading ceased. The corresponding test loads were acquired using a load-recording device integrated with the pressure machine and static strain acquisition systems (JM3813).
In the actual forced processes of bridge substructure piers, the boundary conditions are akin to a form with one end fixed and the other end hinged. Considering that the lifting hydraulic pump of the pressure machine is located at the bottom, we set a simply supported boundary at the bottom of the specimen, allowing it to rotate around the weak axis, as shown in Figure 2a. The specimen was bolted to the loading device through the top end plate to simulate the fixed boundary. This approach not only reduces safety hazards during the testing process but also ensures the load-bearing performance of the specimen under actual compression. Figure 2a,c shows the loading device’s schematic illustration and the positions of the measurement points. The displacement transducers were manufactured by Jmmay with a measuring range of 50 mm, while the longitudinal strain gauges employed were BF-120-3AA strain gauges.

2.3. Initial Imperfections and Residual Stresses

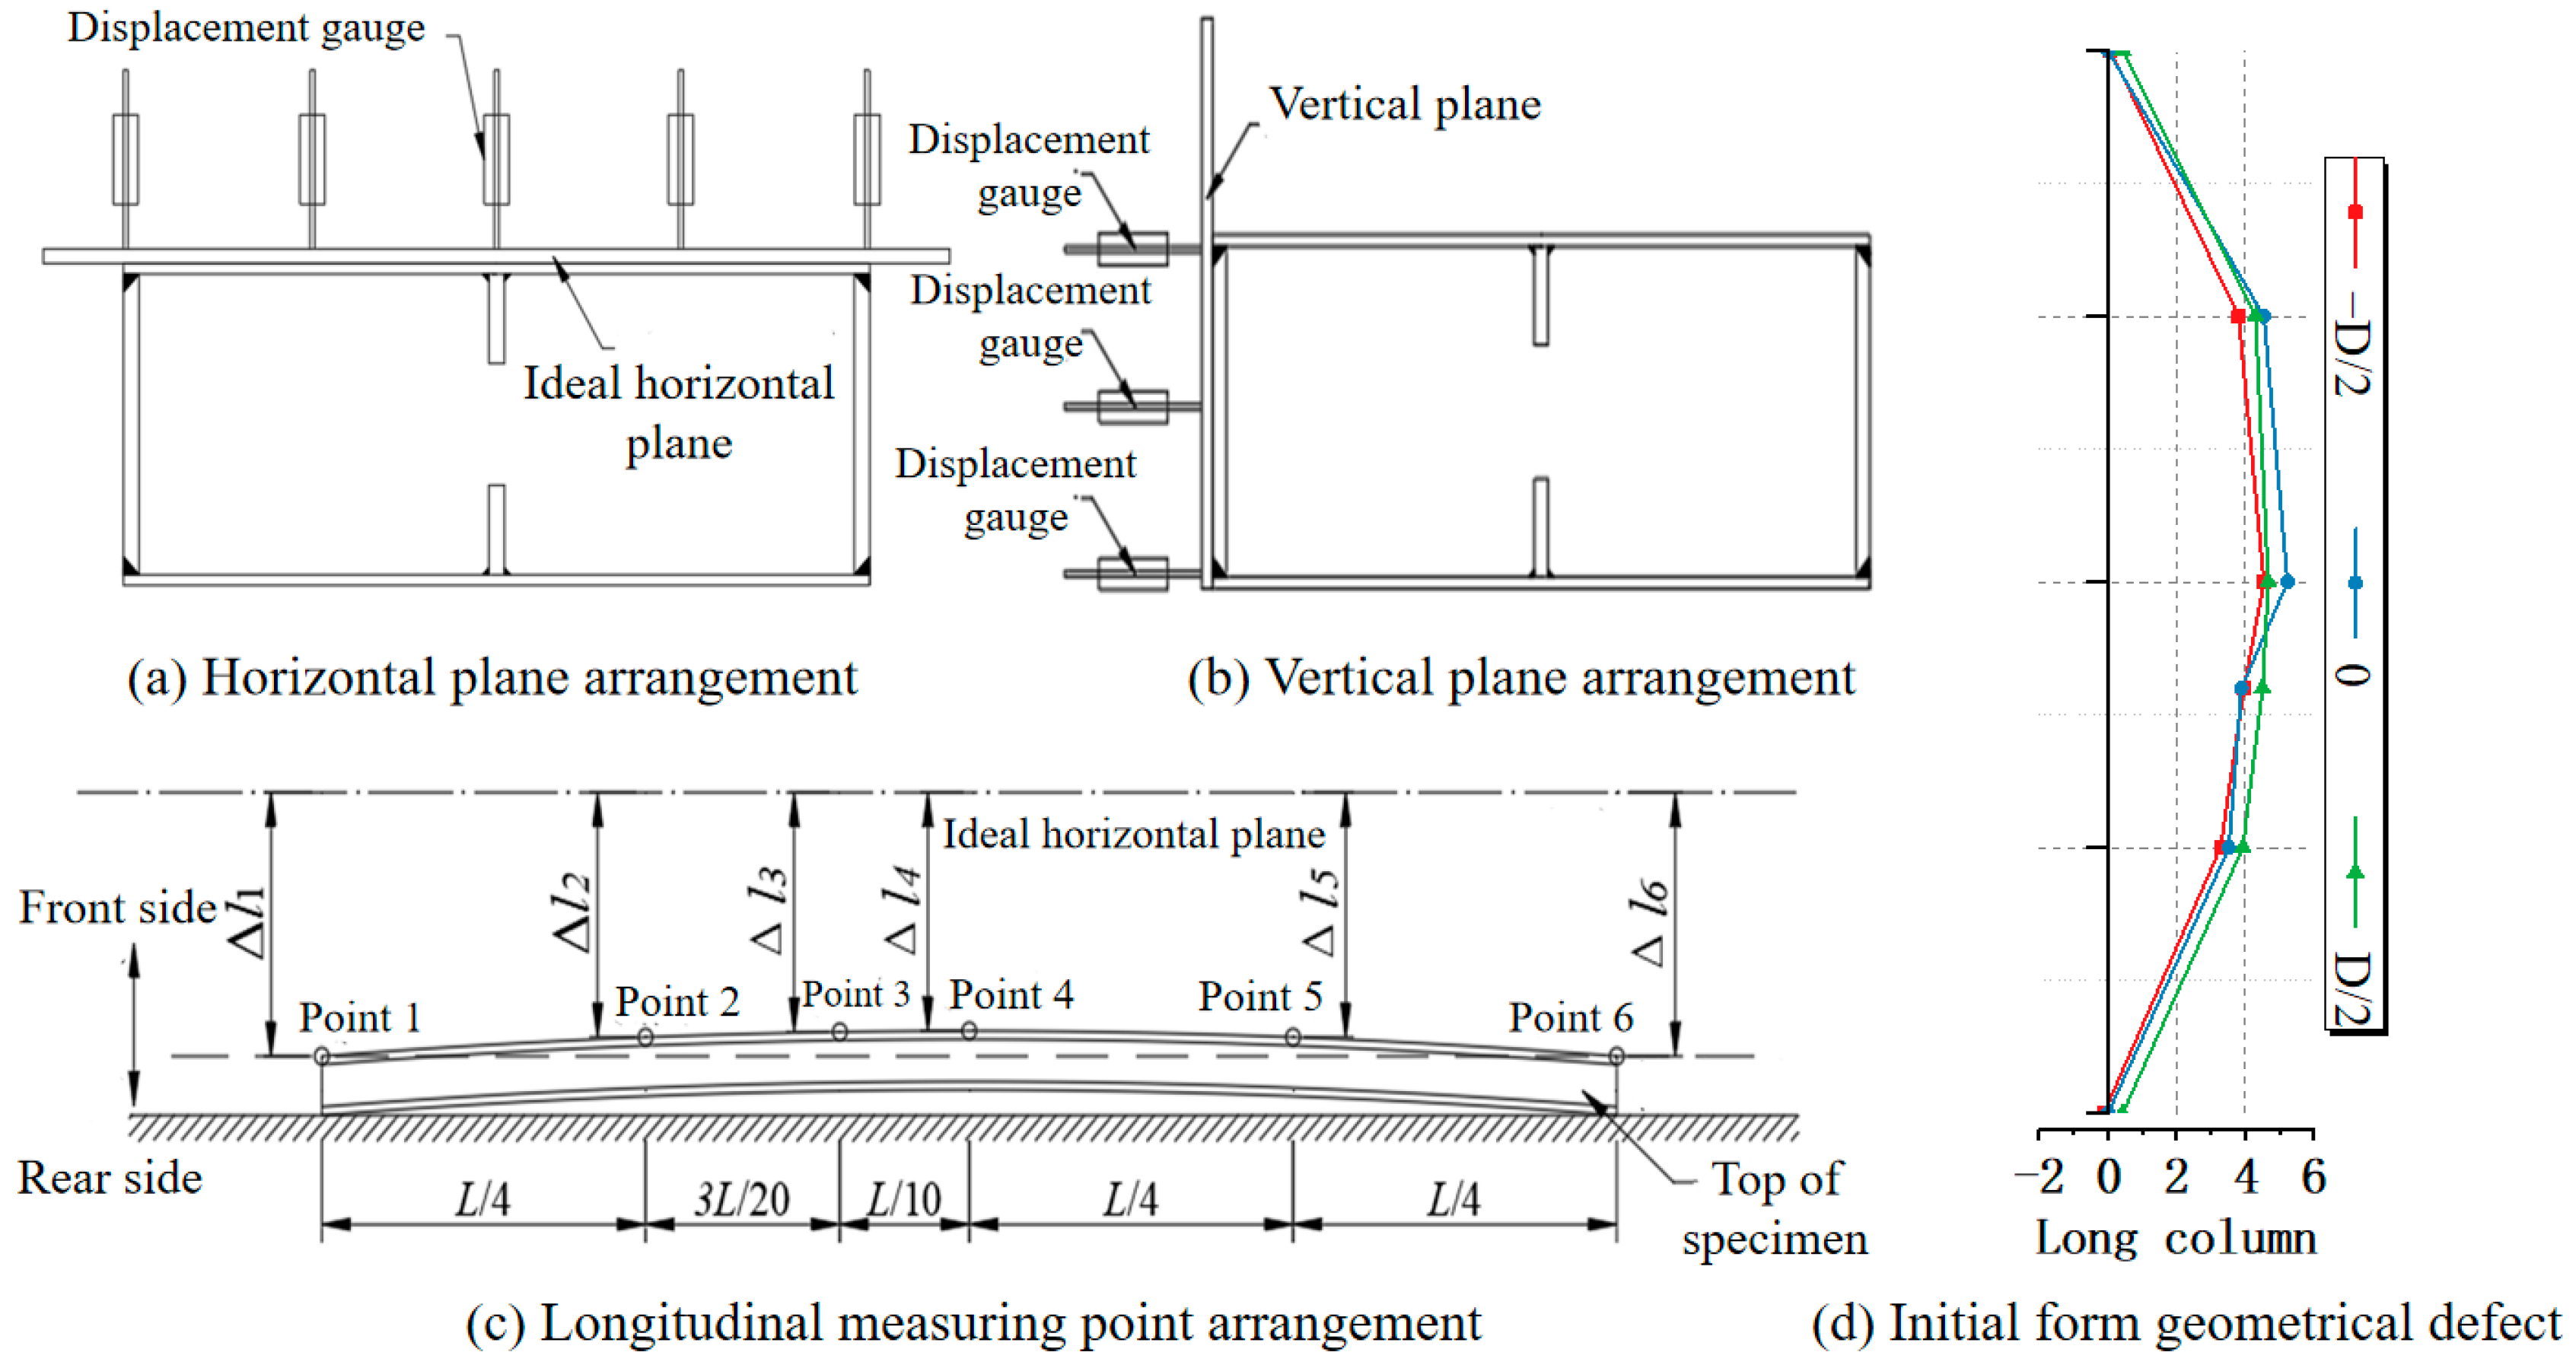
2.3.1. Initial Geometric Imperfections

The initial deformations of box section components are influenced by the manufacturing and transportation processes. According to reliable research [25], short columns are significantly affected by local defects, whereas long columns are primarily affected by the overall deformation. Therefore, the initial geometric imperfections of the specimens were measured. In the measurement scheme, local imperfections were measured by establishing horizontal and vertical planes and positioning displacement transducers within the test setup to monitor deformations in critical regions (as shown in Figure 3a,b). In contrast, overall imperfections were measured using a laser instrument to establish a level surface in conjunction with a Vernier caliper (as depicted in Figure 3c).
For the short column specimens, the local initial imperfection amplitude of the longer edge wall plate is 1/467 of the plate width, and that of the shorter edge wall plate is 1/248 of the plate width, both of which meet the specification [24] requirement for plate deviation: Δ = min(b/100, 3). Figure 3d shows that the long-column specimens exhibit an initial deformation in the form of a sine half-wave. The overall geometric imperfection ratio for the specimens, denoted by δv/b, is 1/799, which exceeds the acceptance specification [24].

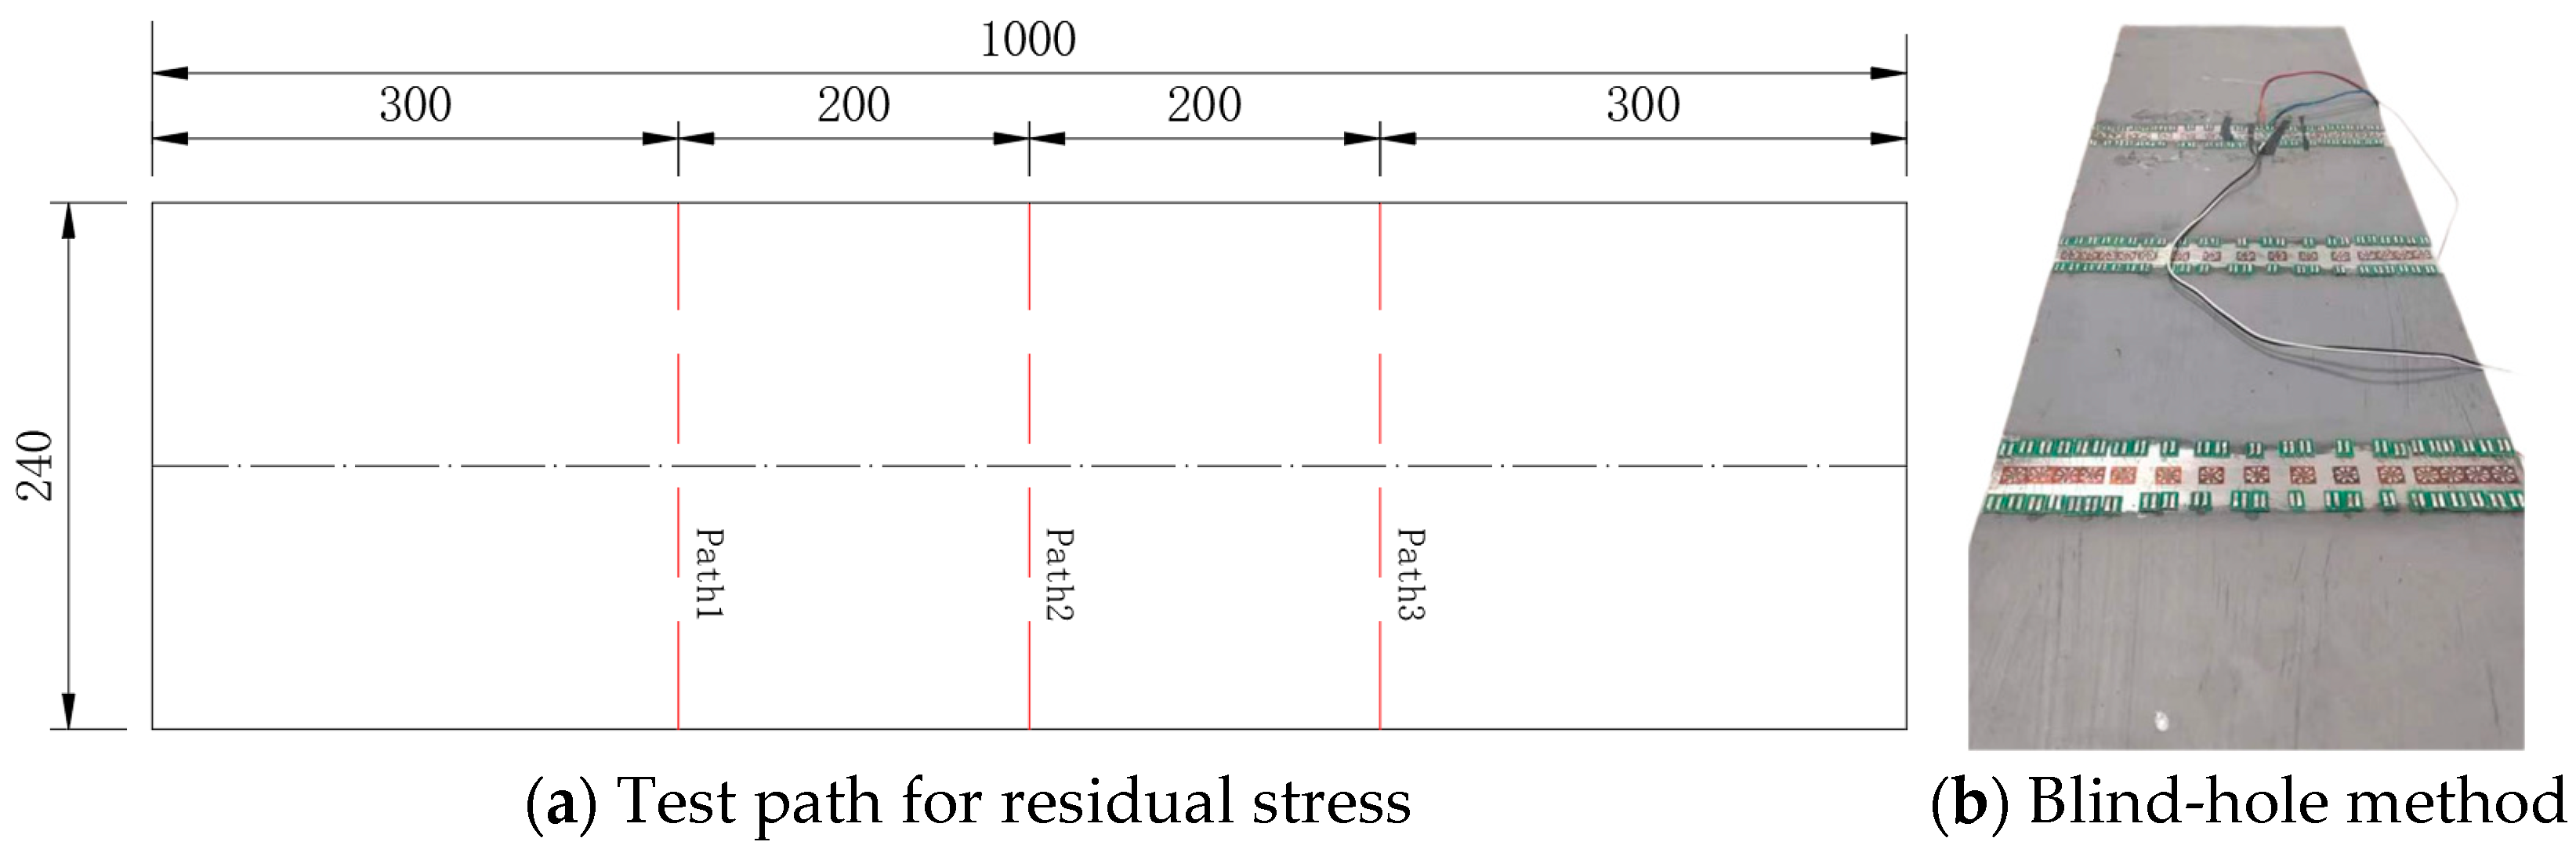
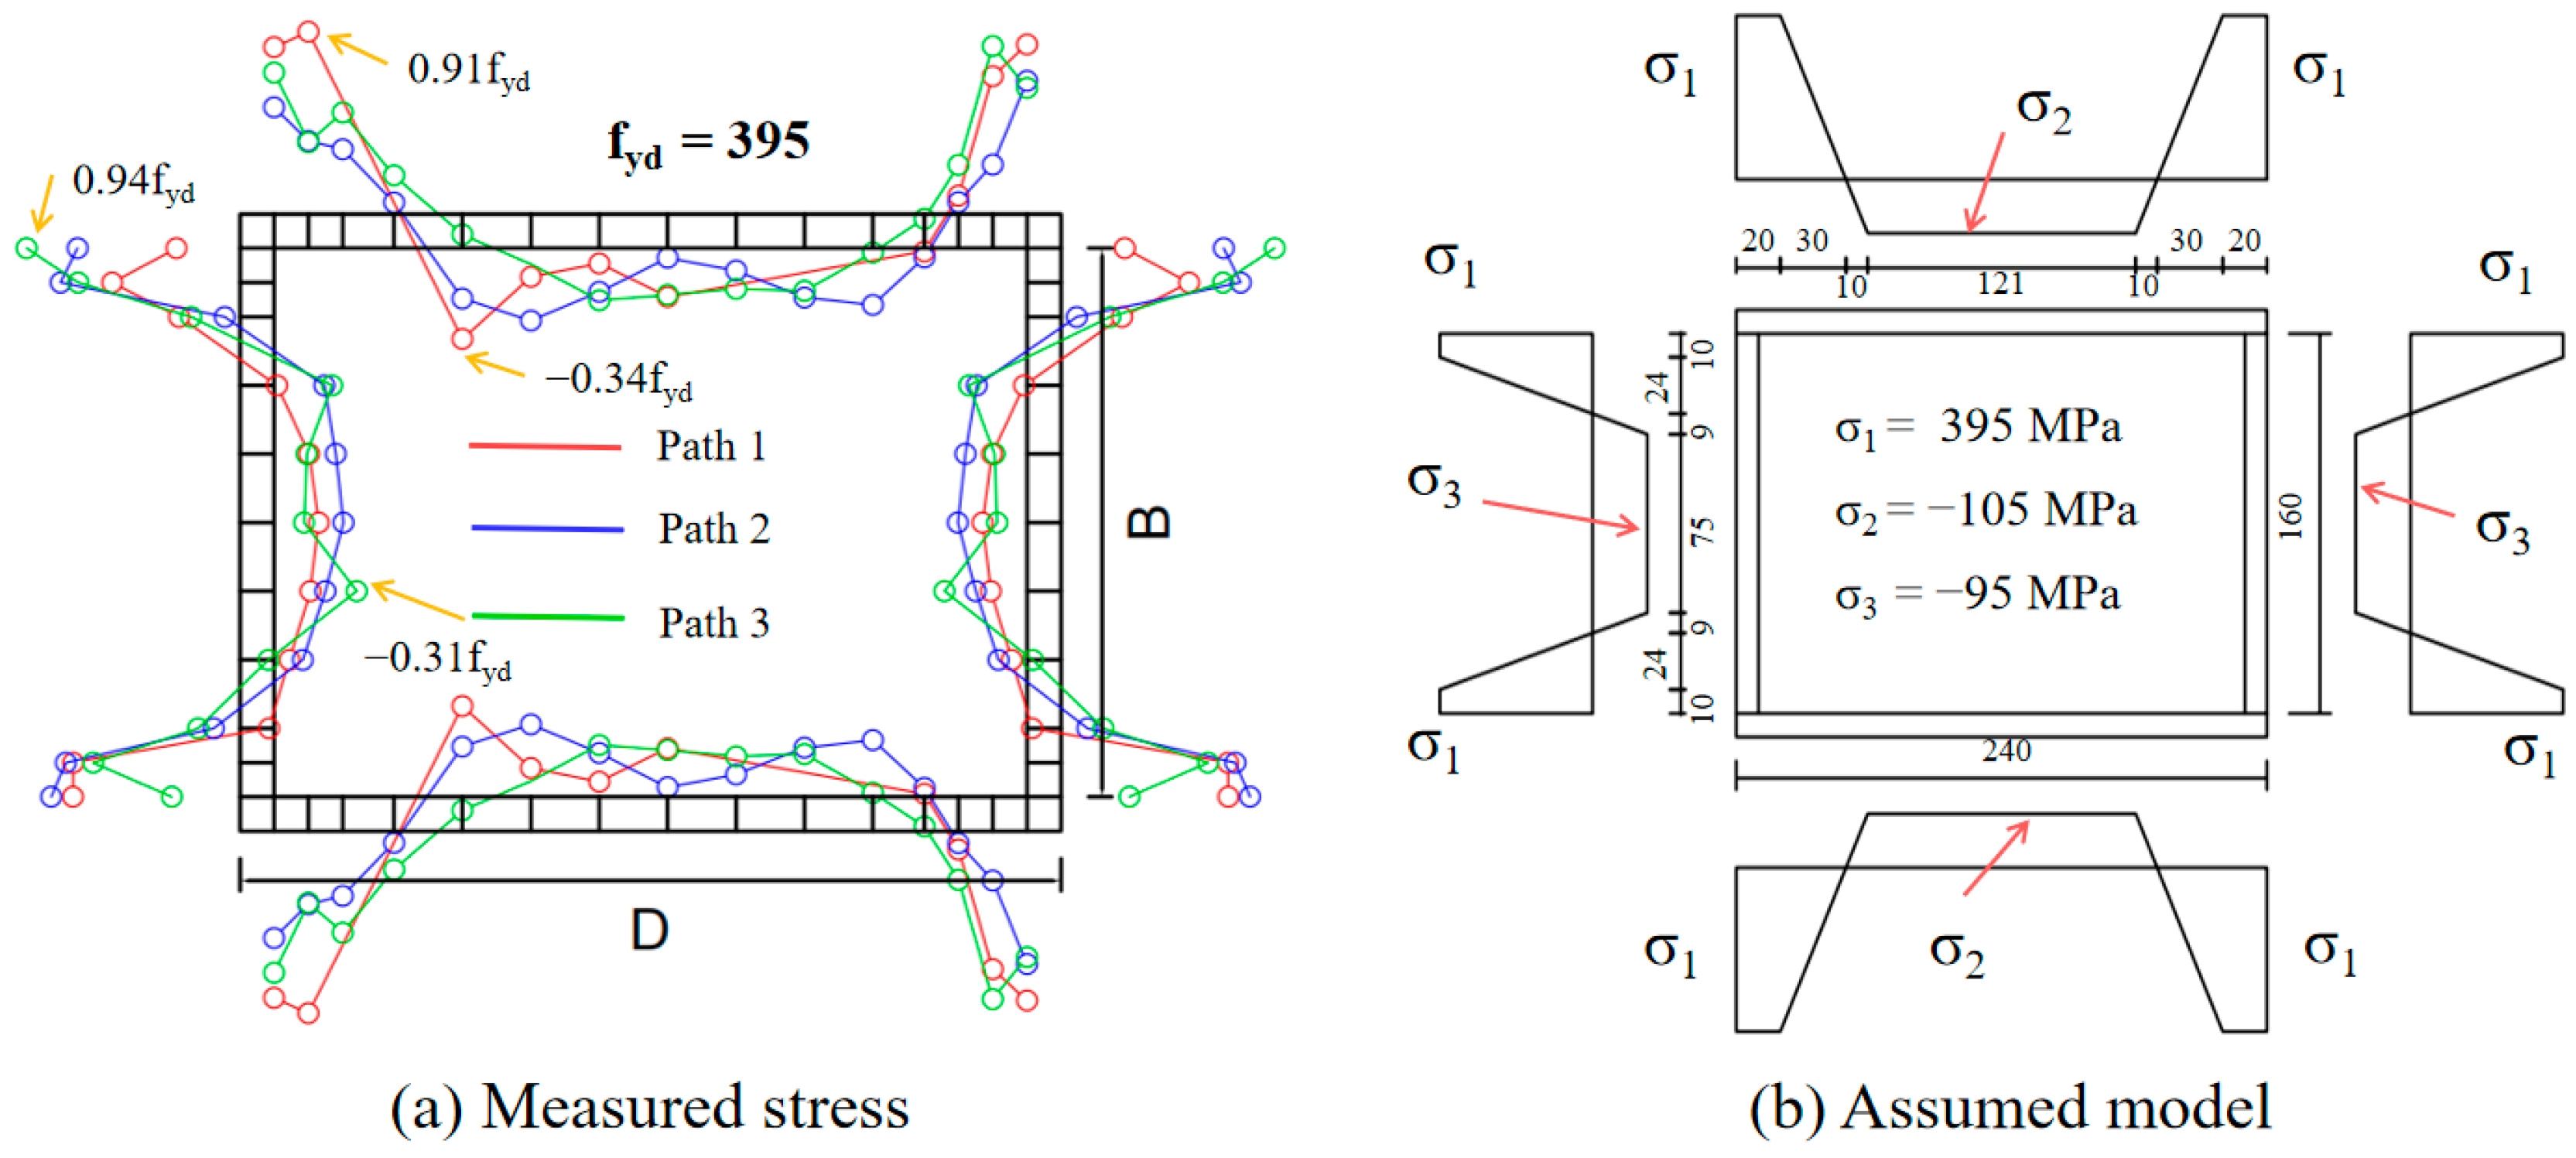
2.3.2. Residual Stresses

In this study, the blind-hole method was employed to measure the residual stresses in unstiffened box specimens. To eliminate thermal effects from weld initiation and termination, residual stress measurements were conducted on 1 m long specimens. The cross-sectional dimensions of these specimens matched those used for compression testing. Starting from 0.3 m away from each end, measurements were taken at three distinct cross-sections spaced at 0.2 m intervals, as illustrated in Figure 4. The longitudinal distribution pattern and specific values of the residual stresses in the welded box sections were obtained, and an analysis of the measurement results followed. The blind-hole method induced changes in the surrounding stress field by drilling holes in the specimen surface, and the corresponding strain changes were measured using strain gauges mounted around the holes. The testing instruments used are the ZDL-II residual stress drilling equipment manufactured by Zhengzhou Research Institute of Mechanical Engineering and the TJ120-1.5-φ1.5 strain rosette. The magnitude of the residual stress at these locations was calculated using the appropriate formula. Figure 5 shows a simplified model of the residual stress measurement results obtained using the blind-hole method.
Figure 5a shows that for the specimen, the residual tensile stresses exhibit peak values at the edges of the weld seams; the long plates achieve a maximum value of 0.91 fyd (fyd = 395 MPa), while that of the short plates is 0.94 fyd. In contrast, the central regions of the plates, which are farther from the weld seams, are characterized by compressive stress areas. The long plates achieve a peak value of residual compressive stress at 0.34 fyd, while that of the short plates is 0.31 fyd. Figure 5 visually demonstrates the evolution of residual stresses. Taking the long plate as an example, the stress transitions from tensile stress at the weld zone (0.91 fyd) to compressive stress at the mid-plate region (0.34 fyd). This observation leads to the conclusion that the residual stress distribution in plate members follows a transitional pattern from tensile stress near the weld to compressive stress away from it, with the stress magnitude gradually decreasing and becoming more uniformly distributed. The above results are in line with the magnitudes of the actual residual stresses in the box section components reported in the literature [13,14,15], where the peak values of the residual tensile stress fall between 0.6 and 1.0 fyd and those of the residual compressive stress range from 0.2 to 0.5 fyd. It can be concluded that the verified simplified residual stress model, as shown in Figure 5b, can be used for predicting residual stresses in box section components.

2.4. Experimental Results

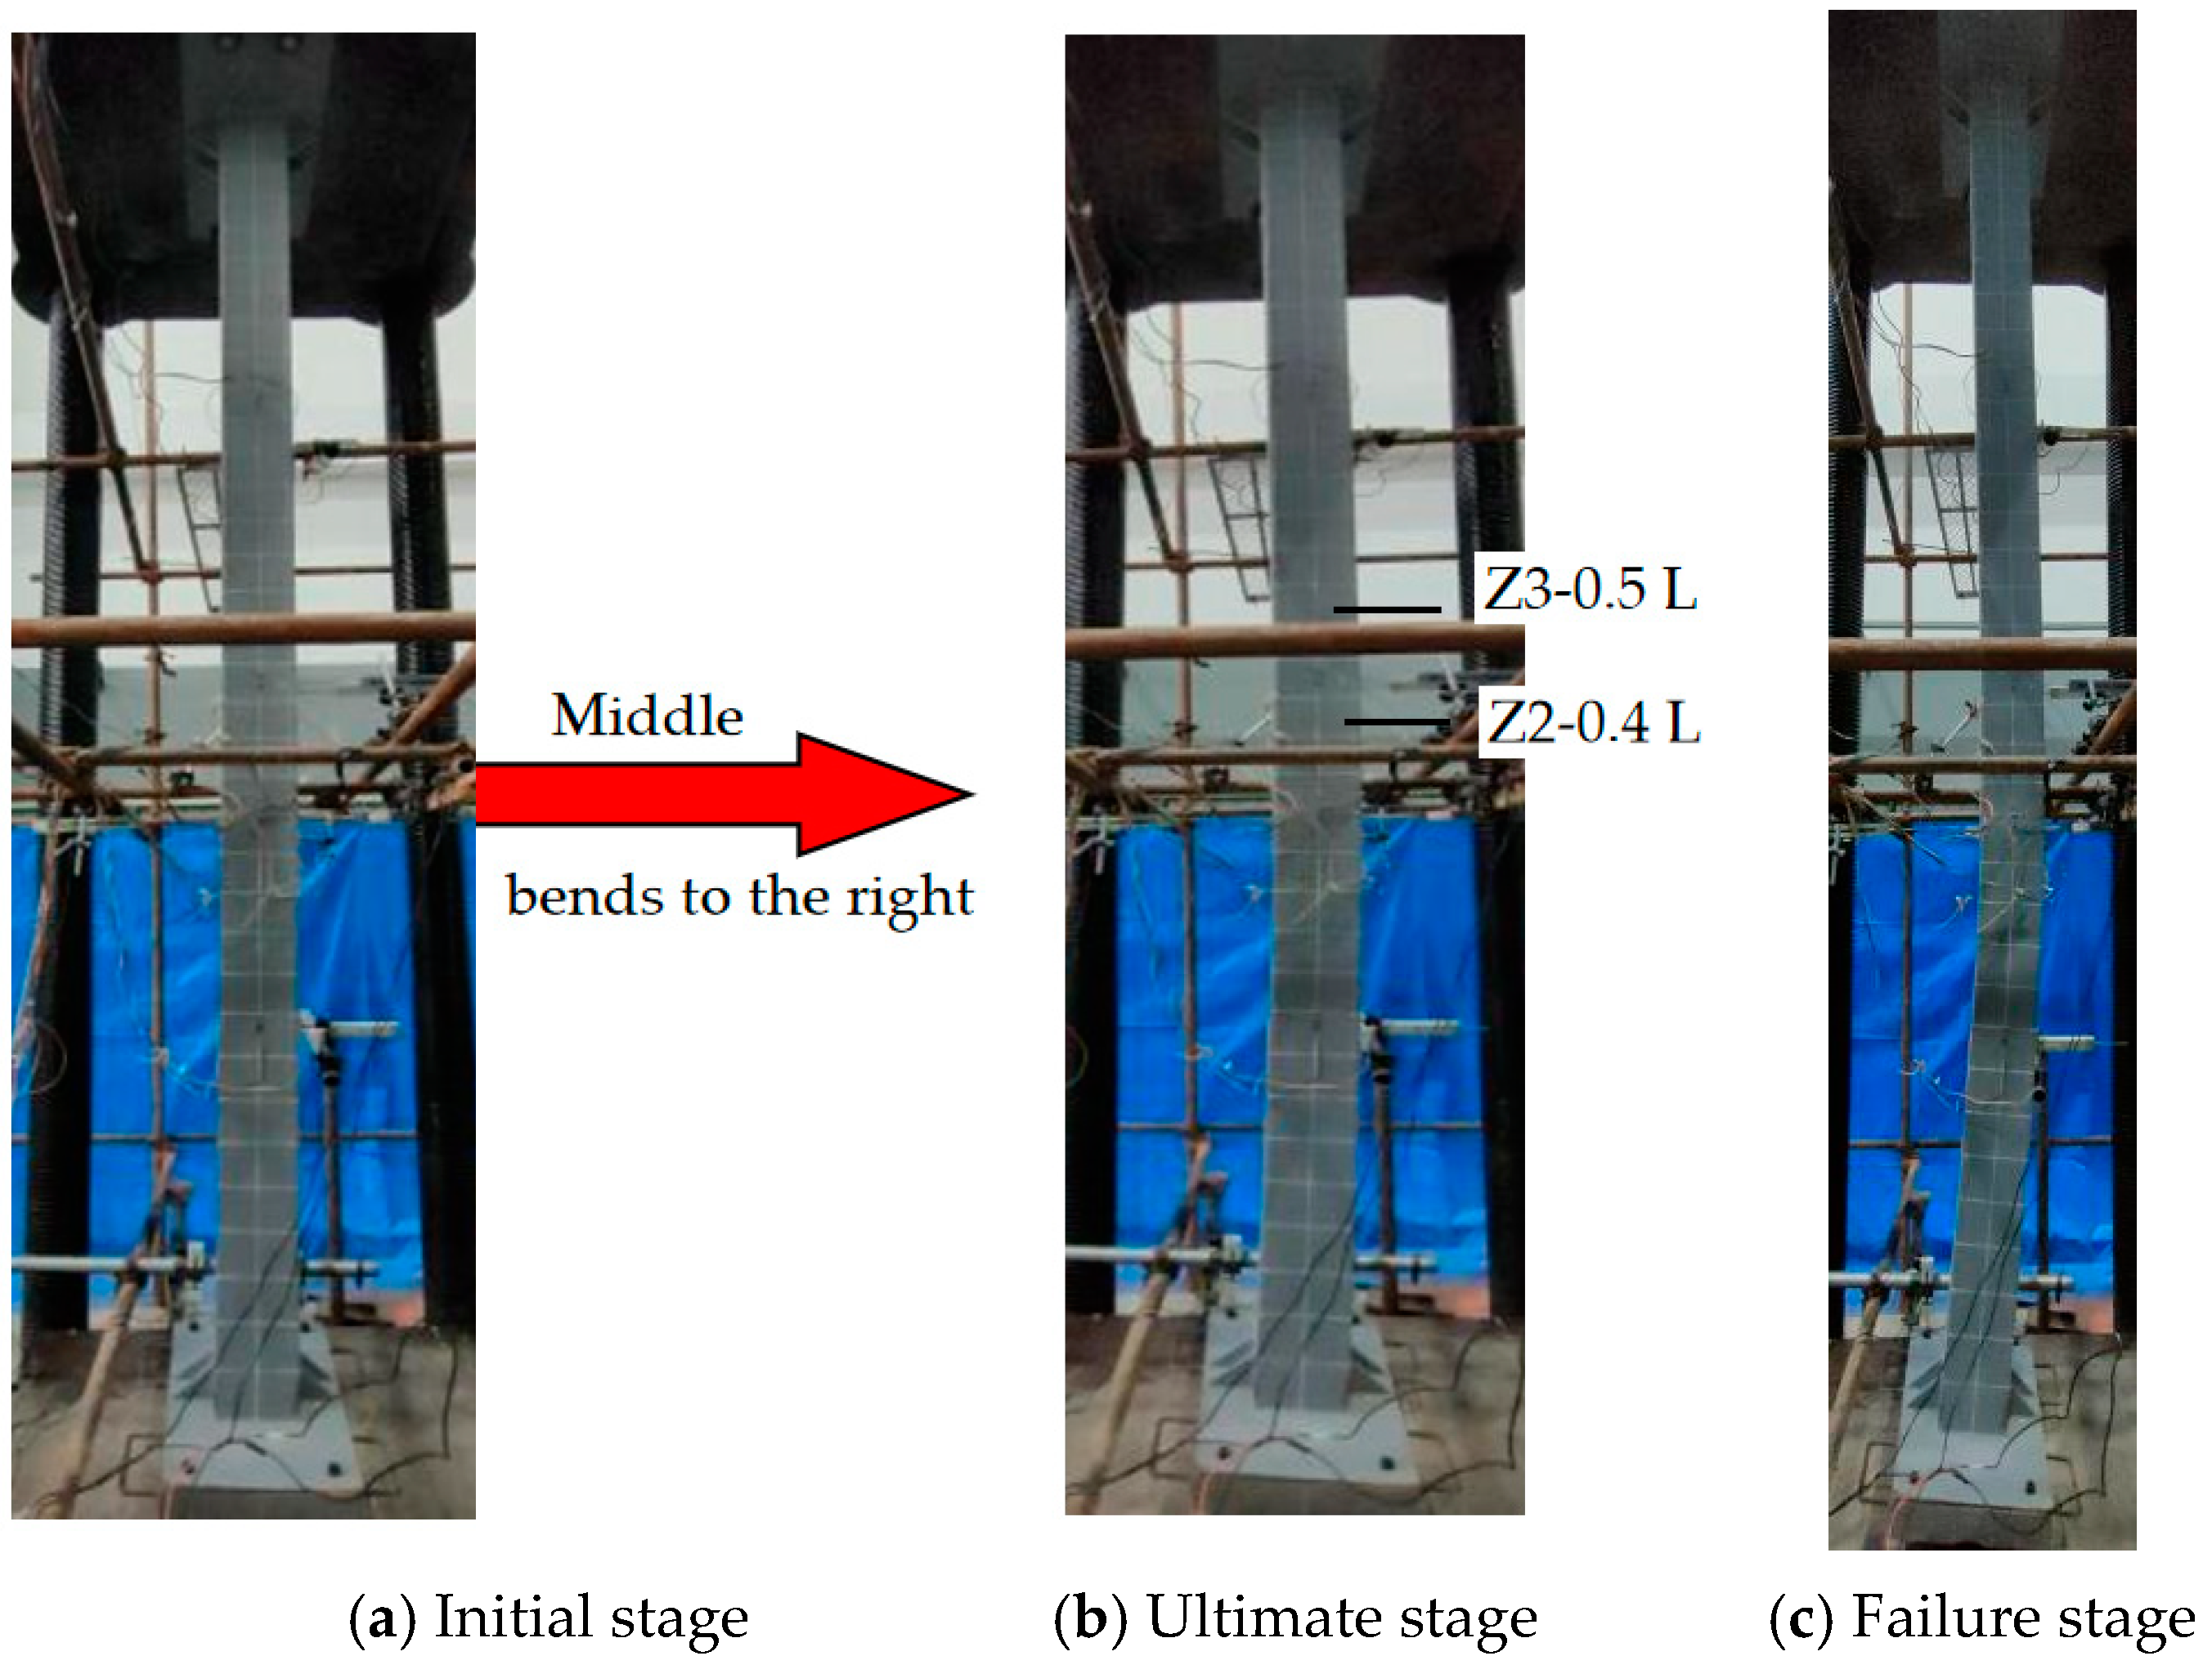
2.4.1. Experimental Phenomena

Figure 6 shows the deformation behavior and ultimate failure deformation of an ES-240-240 (short columns) specimen under loading. Initially, the short columns did not exhibit significant deformation upon loading. When the load reached 3099.8 KN (90% of the ultimate load-bearing capacity), Figure 6a shows a noticeable inclination of the bottom pivot was observed, with a slight bending tendency in the middle section of the specimen. Upon reaching 3452.9 KN (peak load, abbreviated as Pk), the inclination of the bottom pivot increased significantly, and the specimen underwent bending deformation to the right, as depicted in Figure 6b. Subsequently, when the load decreased to 2980.6 KN (0.86 Pk), the specimens ultimately failed. At this point, the specimen exhibited a general bending deformation to the right, and all the wall plates exhibited distinct out-of-plane local bulging deformations, as depicted in Figure 6c.
Figure 7 shows the deformation behavior of the ES-240-4200 (long columns) specimen under loading. Initially, the long columns did not exhibit significant deformation upon loading. Figure 7a shows a noticeable trend of bending toward the right at the midsection of the specimen was observed when the load reached 1801.5 KN, which corresponds to 86% of the ultimate load-bearing capacity. With an increase in the load, the bending tendency at the midsection of the specimen increased. Upon reaching 2087.4 KN (Pk), the specimen exhibited a pronounced bending deformation toward the right at its midsection. It can be concluded from Figure 7b that the bending deformation of the cross-section Z2 is slightly larger than that of the cross-section Z3, which is caused by the fixed boundary at the top and the simply supported boundary at the bottom. The out-of-plane deformation of the specimen increased rapidly with the gradual reduction in the load. When the load was reduced to 1699.3 kN (0.81 Pk), the specimen failed and loading ceased. In the failure stage, the specimen exhibited substantial deflection to the right at a height of approximately 0.4 L, as depicted in Figure 7c.

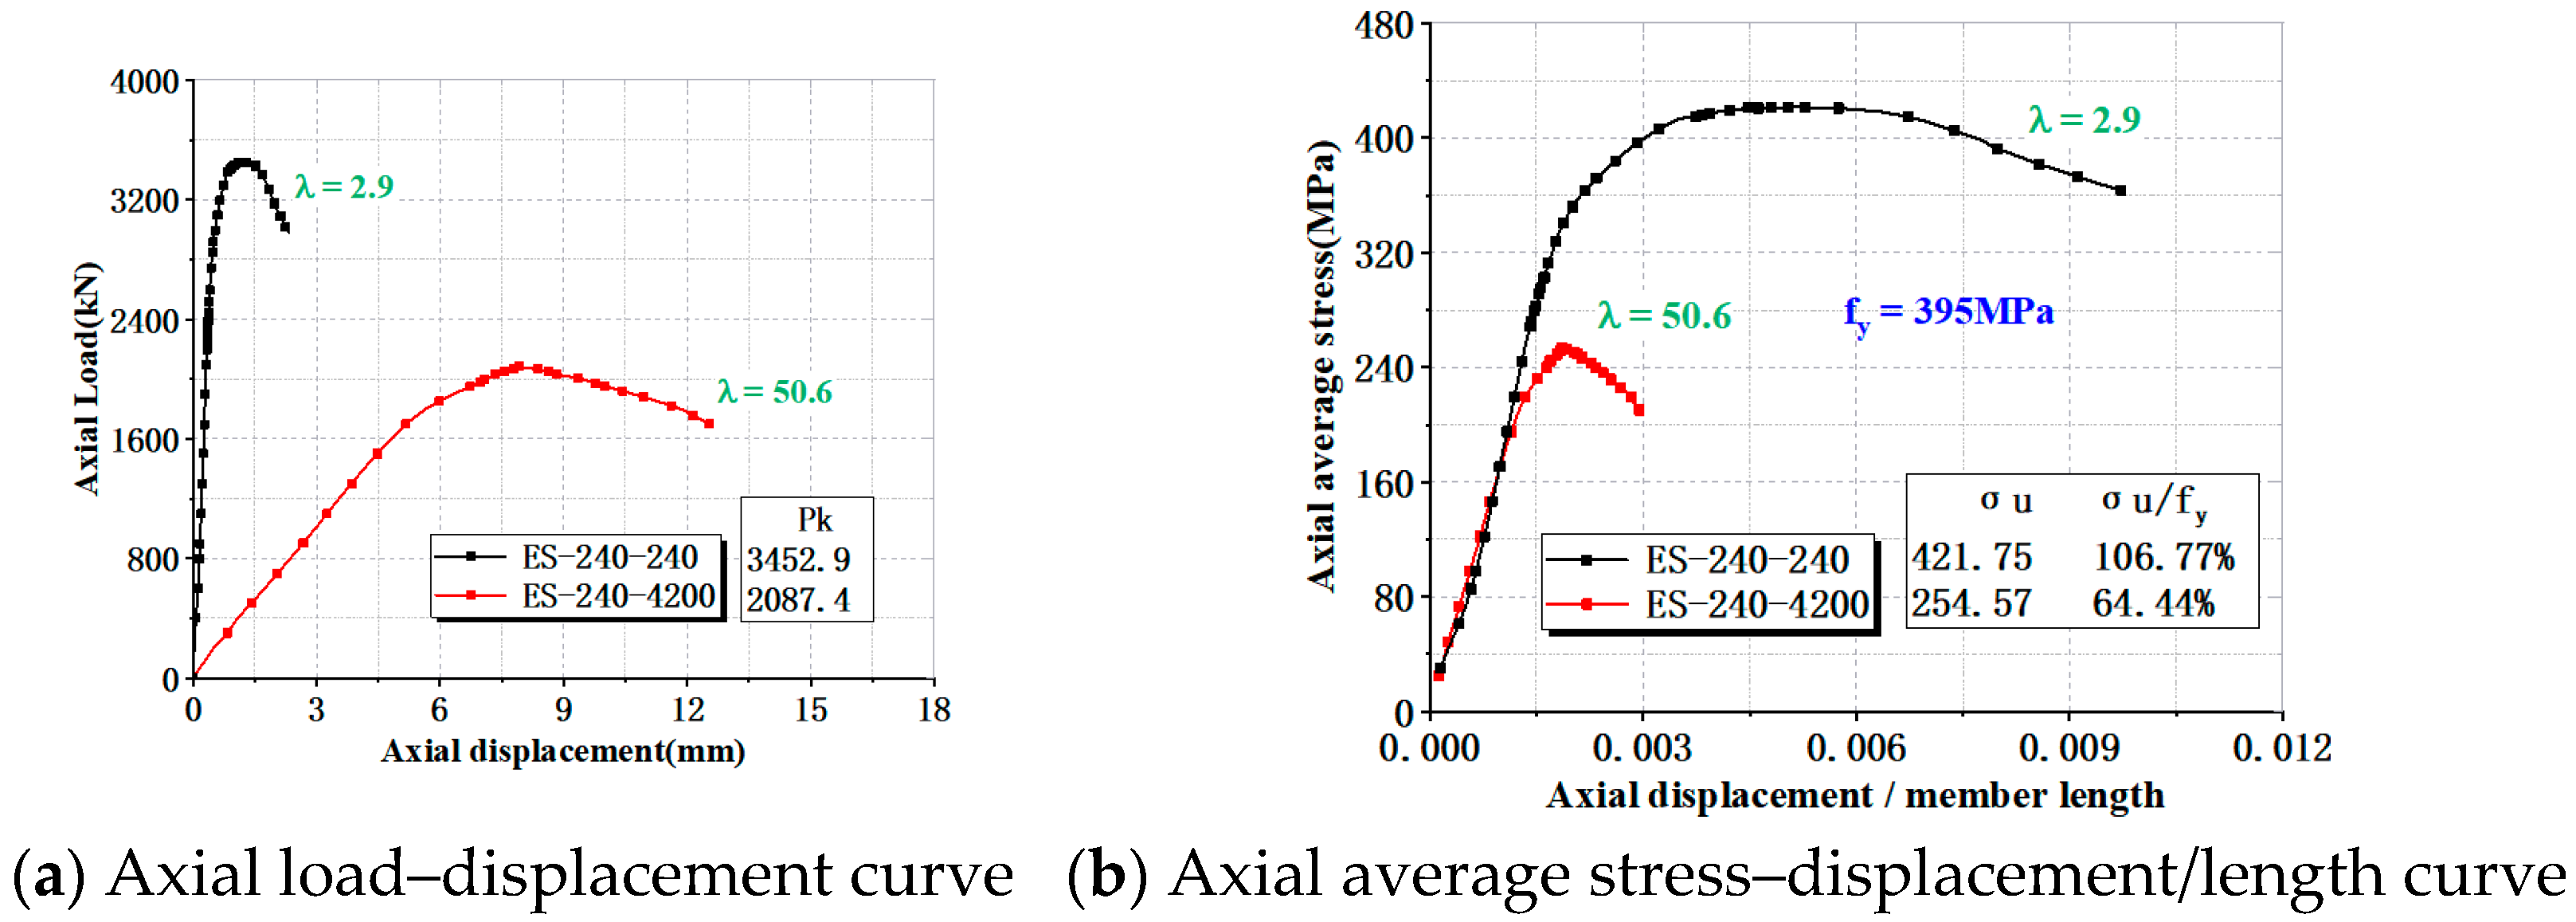
2.4.2. Load–Displacement Curve

To elucidate the load–displacement relationships of various specimens during the loading process, the acquired data were processed to obtain the corresponding axial average stress–displacement curves. For ease of comparison, the axial displacement of each specimen was normalized by its respective component length. Figure 8 depicts the axial load–displacement and average stress-displacement/length curves for each specimen.
As depicted in Figure 8, the specimens have gone through three stages, namely the elastic section, the stiffness degradation section and the descending section. For the short columns (slenderness ratio of 2.9), the curve shows a distinct “yield segment” upon reaching the peak load, which reflects the characteristics of strength failure. For the long columns (slenderness ratio of 50.6), the range of stiffness degradation section is obviously reduced, and it decreases rapidly after reaching the peak load, showing obvious instability characteristics. In addition, the ratios of ultimate bearing capacity to measured yield strength of the short columns and long columns are 1.07 and 0.64, respectively. This directly demonstrates that short columns maintain considerable resistance even at yield strength, whereas long columns experience significant reduction in axial resistance due to overall buckling. It can be concluded that with the increase in slenderness ratio, the bearing capacity of the specimen decreases, the range of the stiffness degradation section decreases, and the instability phenomenon is more significant.

3. Numerical Study

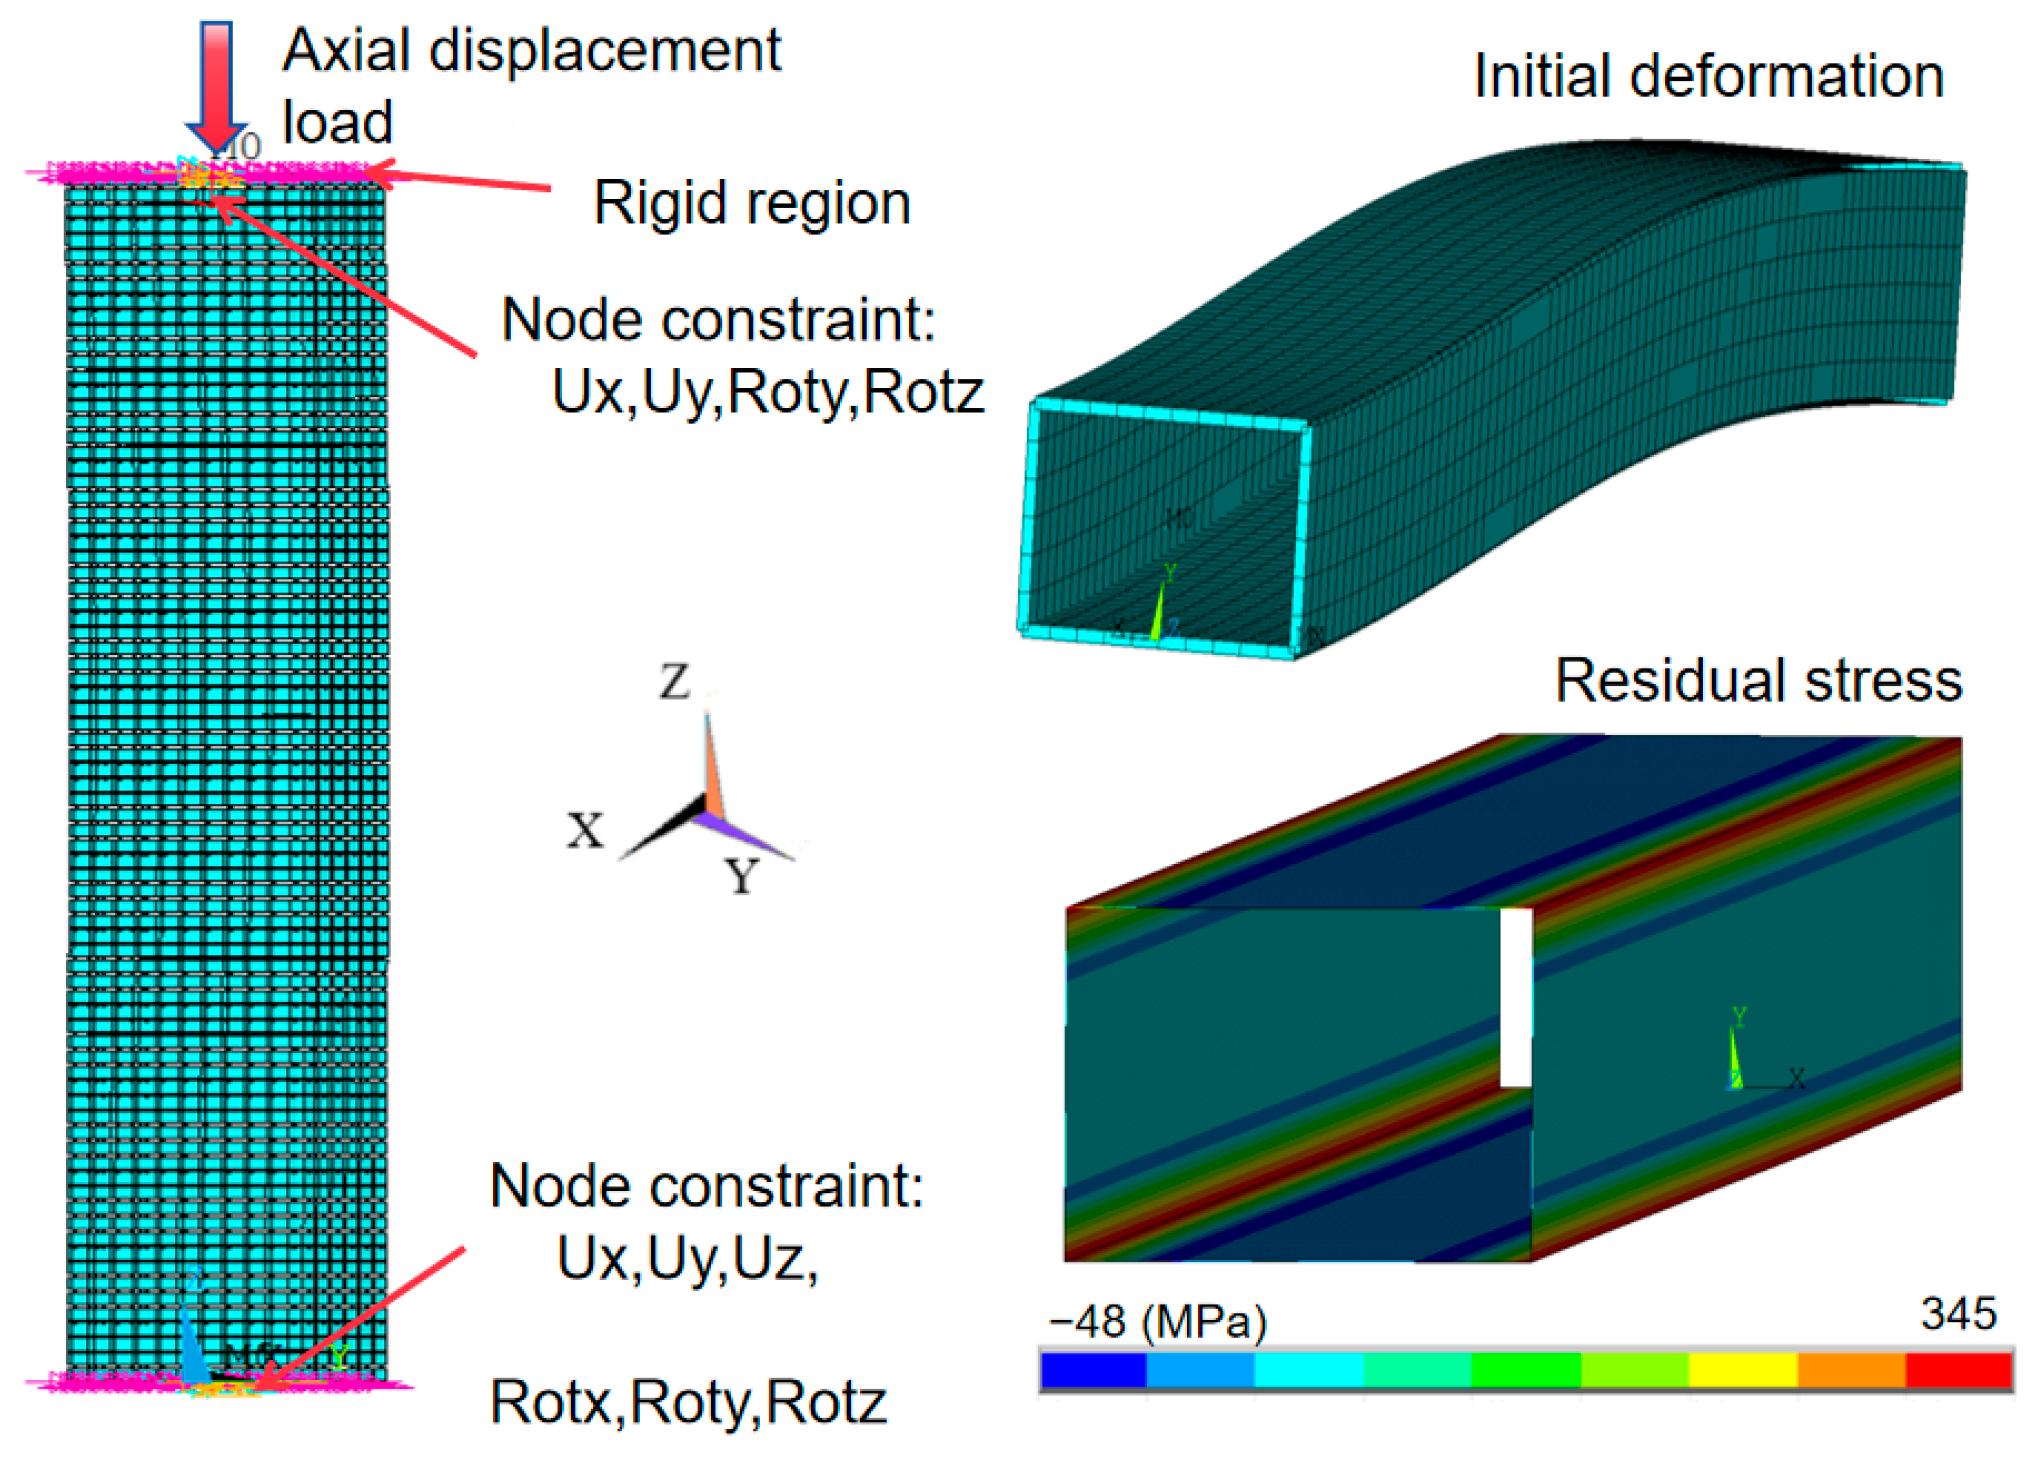
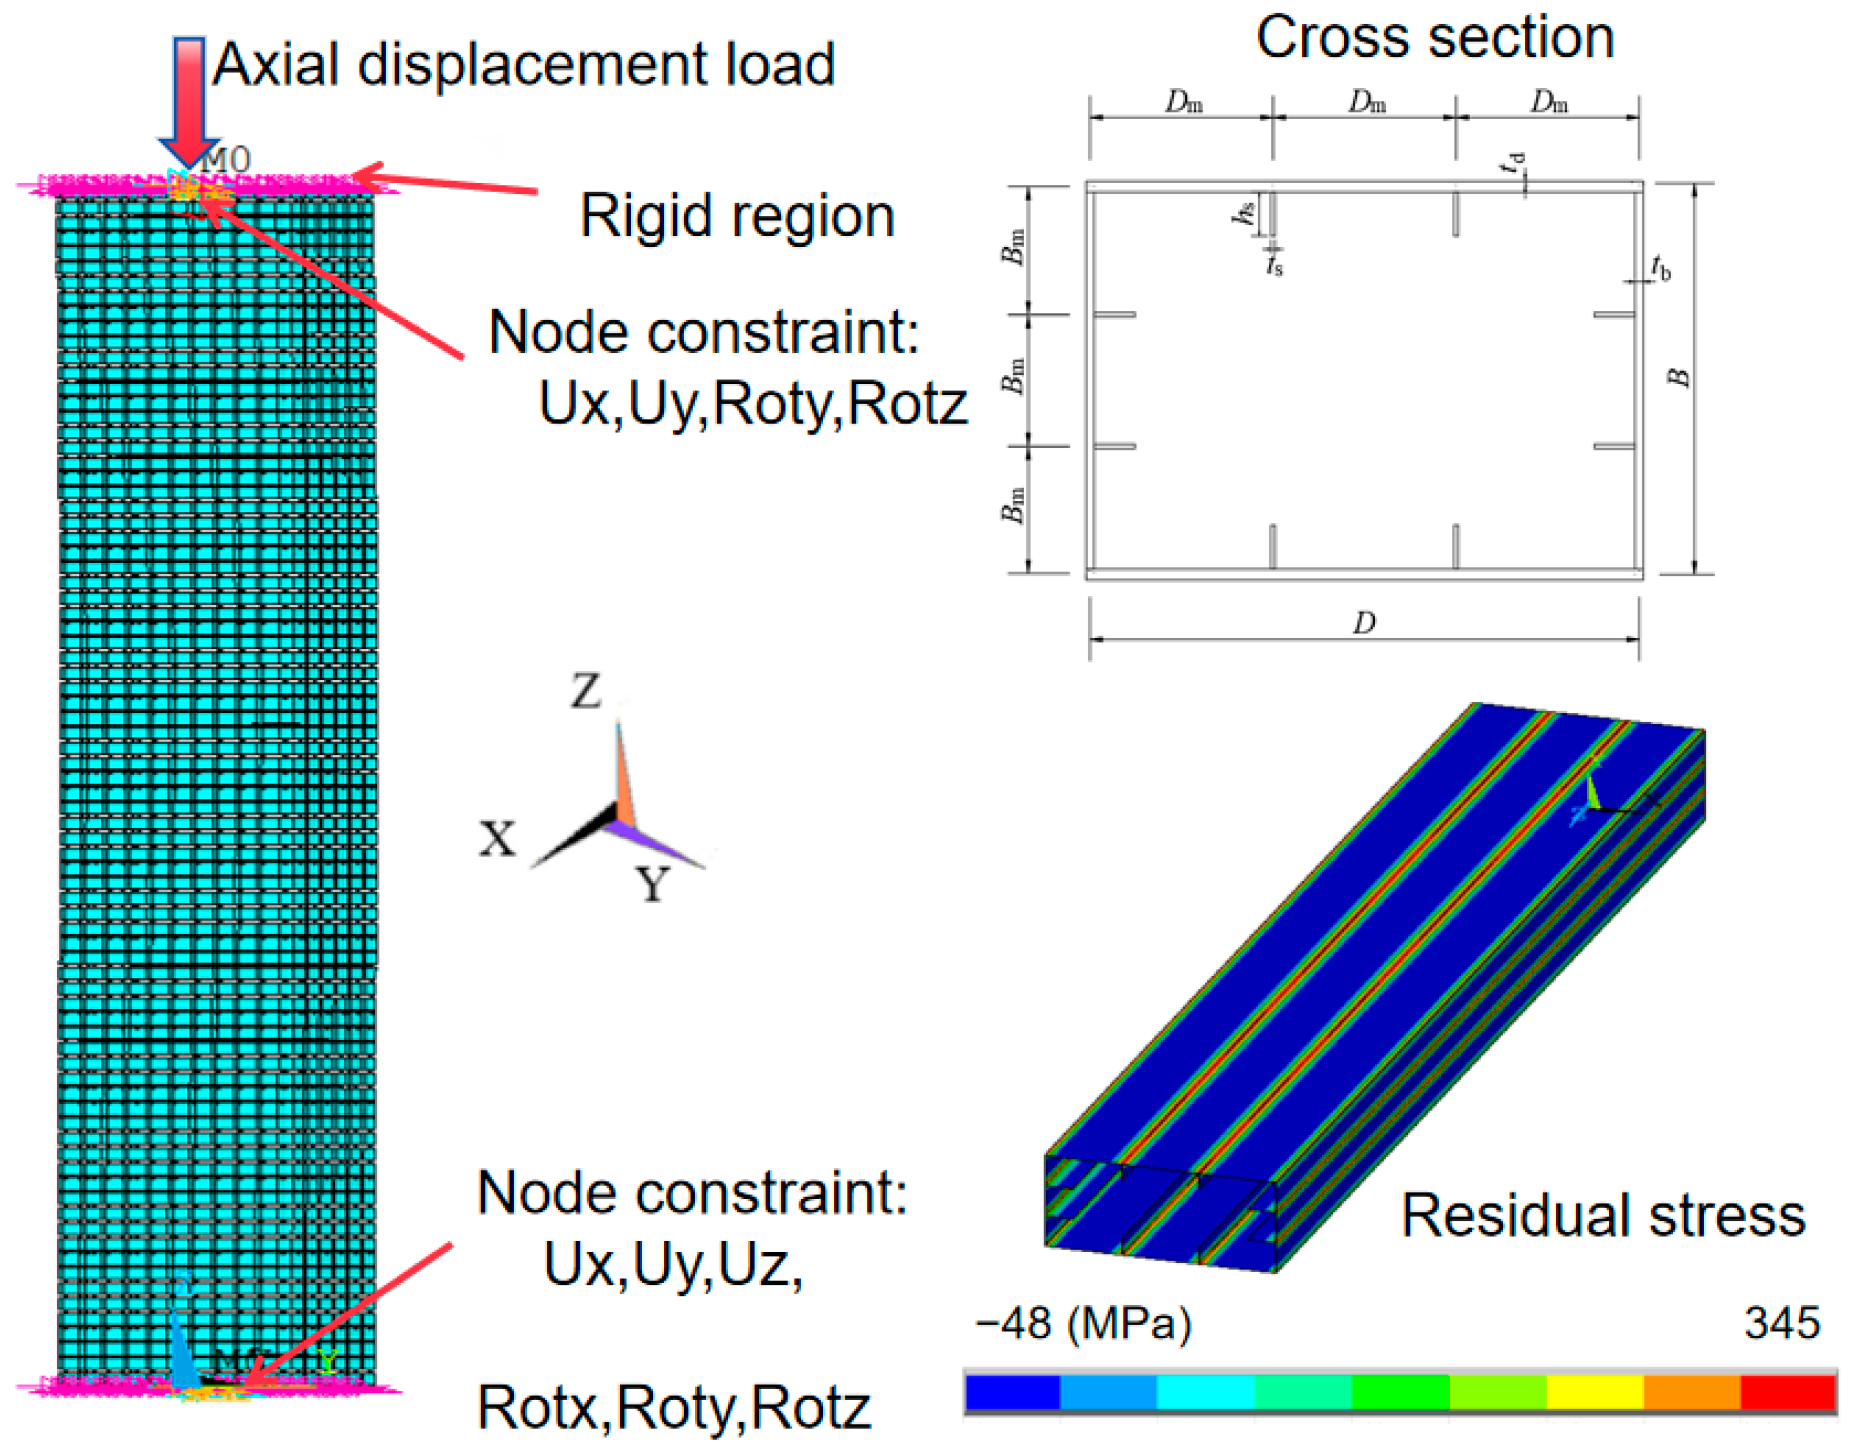
3.1. Finite Element Model

The experimental observations detailed in Section 2.4 show that a distinct overall buckling failure occurs for slender-long columns, whereas short columns experience strength failure accompanied by local deformation. The shell elements can effectively simulate the failures of short columns, whereas beam elements can accelerate the computational process of flexural buckling. Therefore, numerical simulations were conducted using BEAM188 and SHELL181 elements of ANSYS 19.2 software. The experimental study employed conventional bridge steel, which exhibits a well-defined yield plateau in its stress–strain response. Accordingly, a bilinear elastic-plastic constitutive model was adopted with an elastic modulus of 210 GPa and a yield strength of 395 MPa (as measured experimentally). Boundary conditions were established by creating MASS21 mass elements at both ends of the model, coupling all nodes on the corresponding end faces to simulate rigid end plates, with one end fixed axially and the other end simply supported to bear axial displacement load [26,27]. Through analysis of different mesh sizes, it was determined that a mesh size of approximately 20 mm can achieve accurate numerical simulations. Initial geometric imperfections were applied based on the different imperfections considered in Section 2.3.1, incorporating the recommended residual stress values from Section 2.3.2. Figure 9 shows the finite element model of the box section without longitudinal stiffeners for overall stability. The initial deformation of the imperfection test was taken into account by updating the node coordinate. In addition, the results of blind hole tests were introduced using the initial stress method to consider the influence of residual stress.

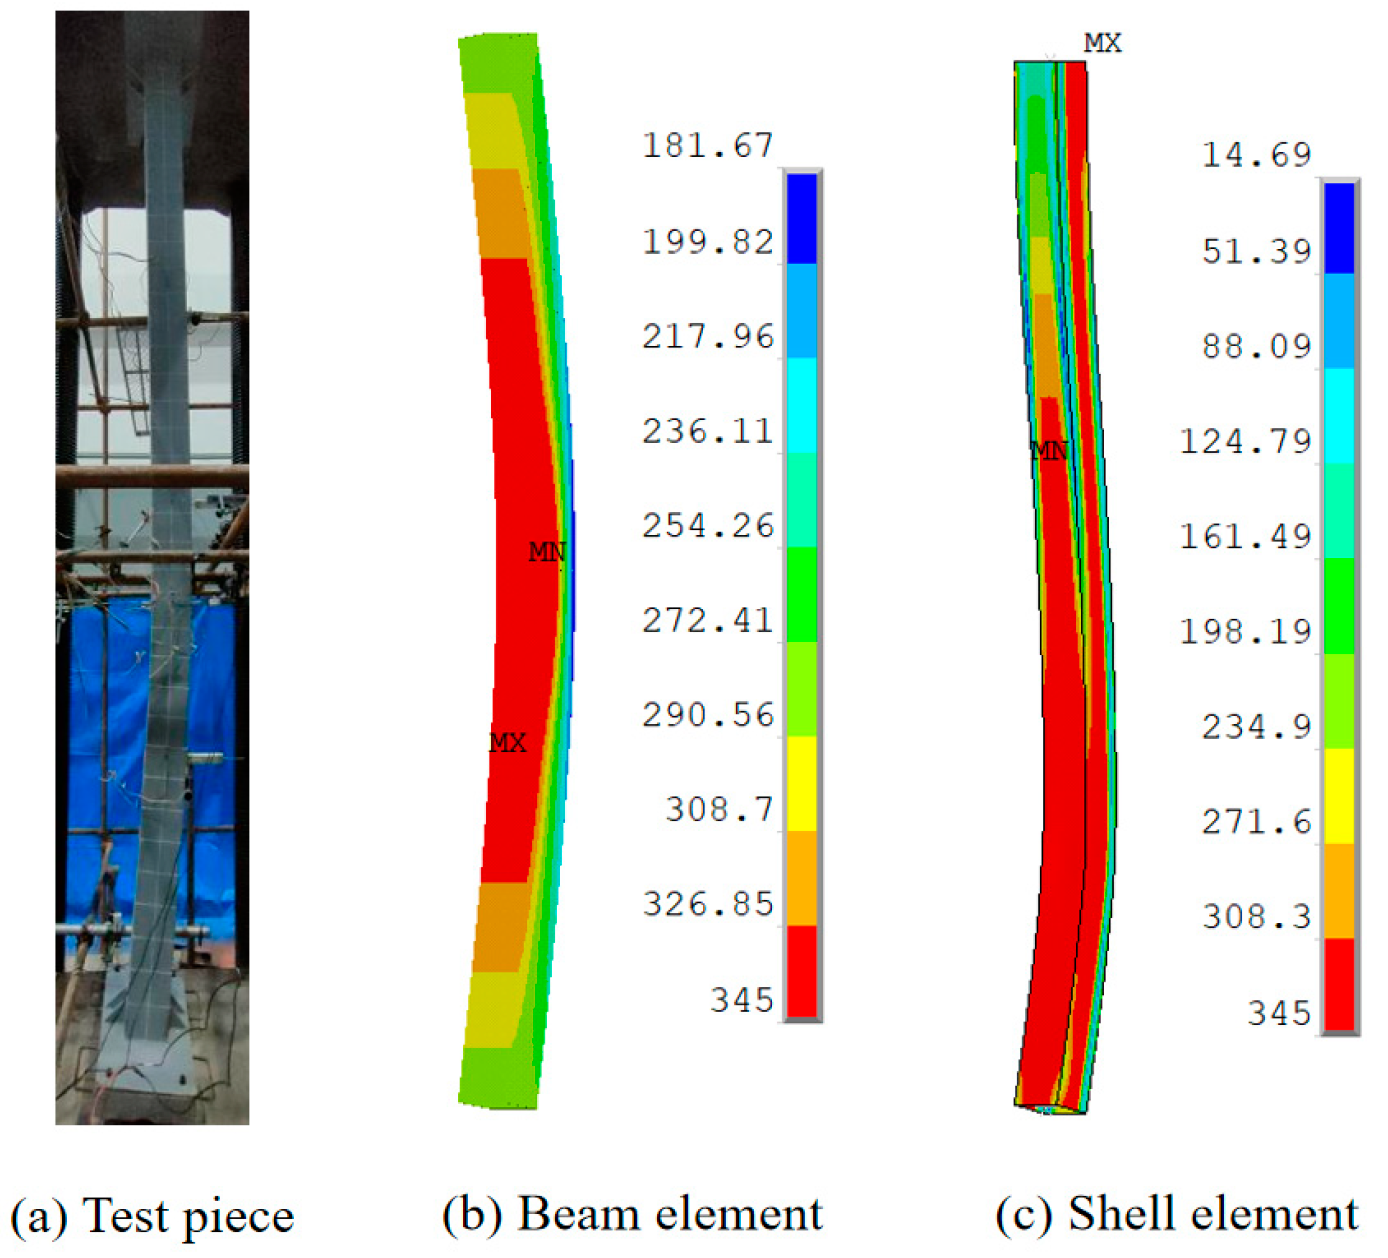
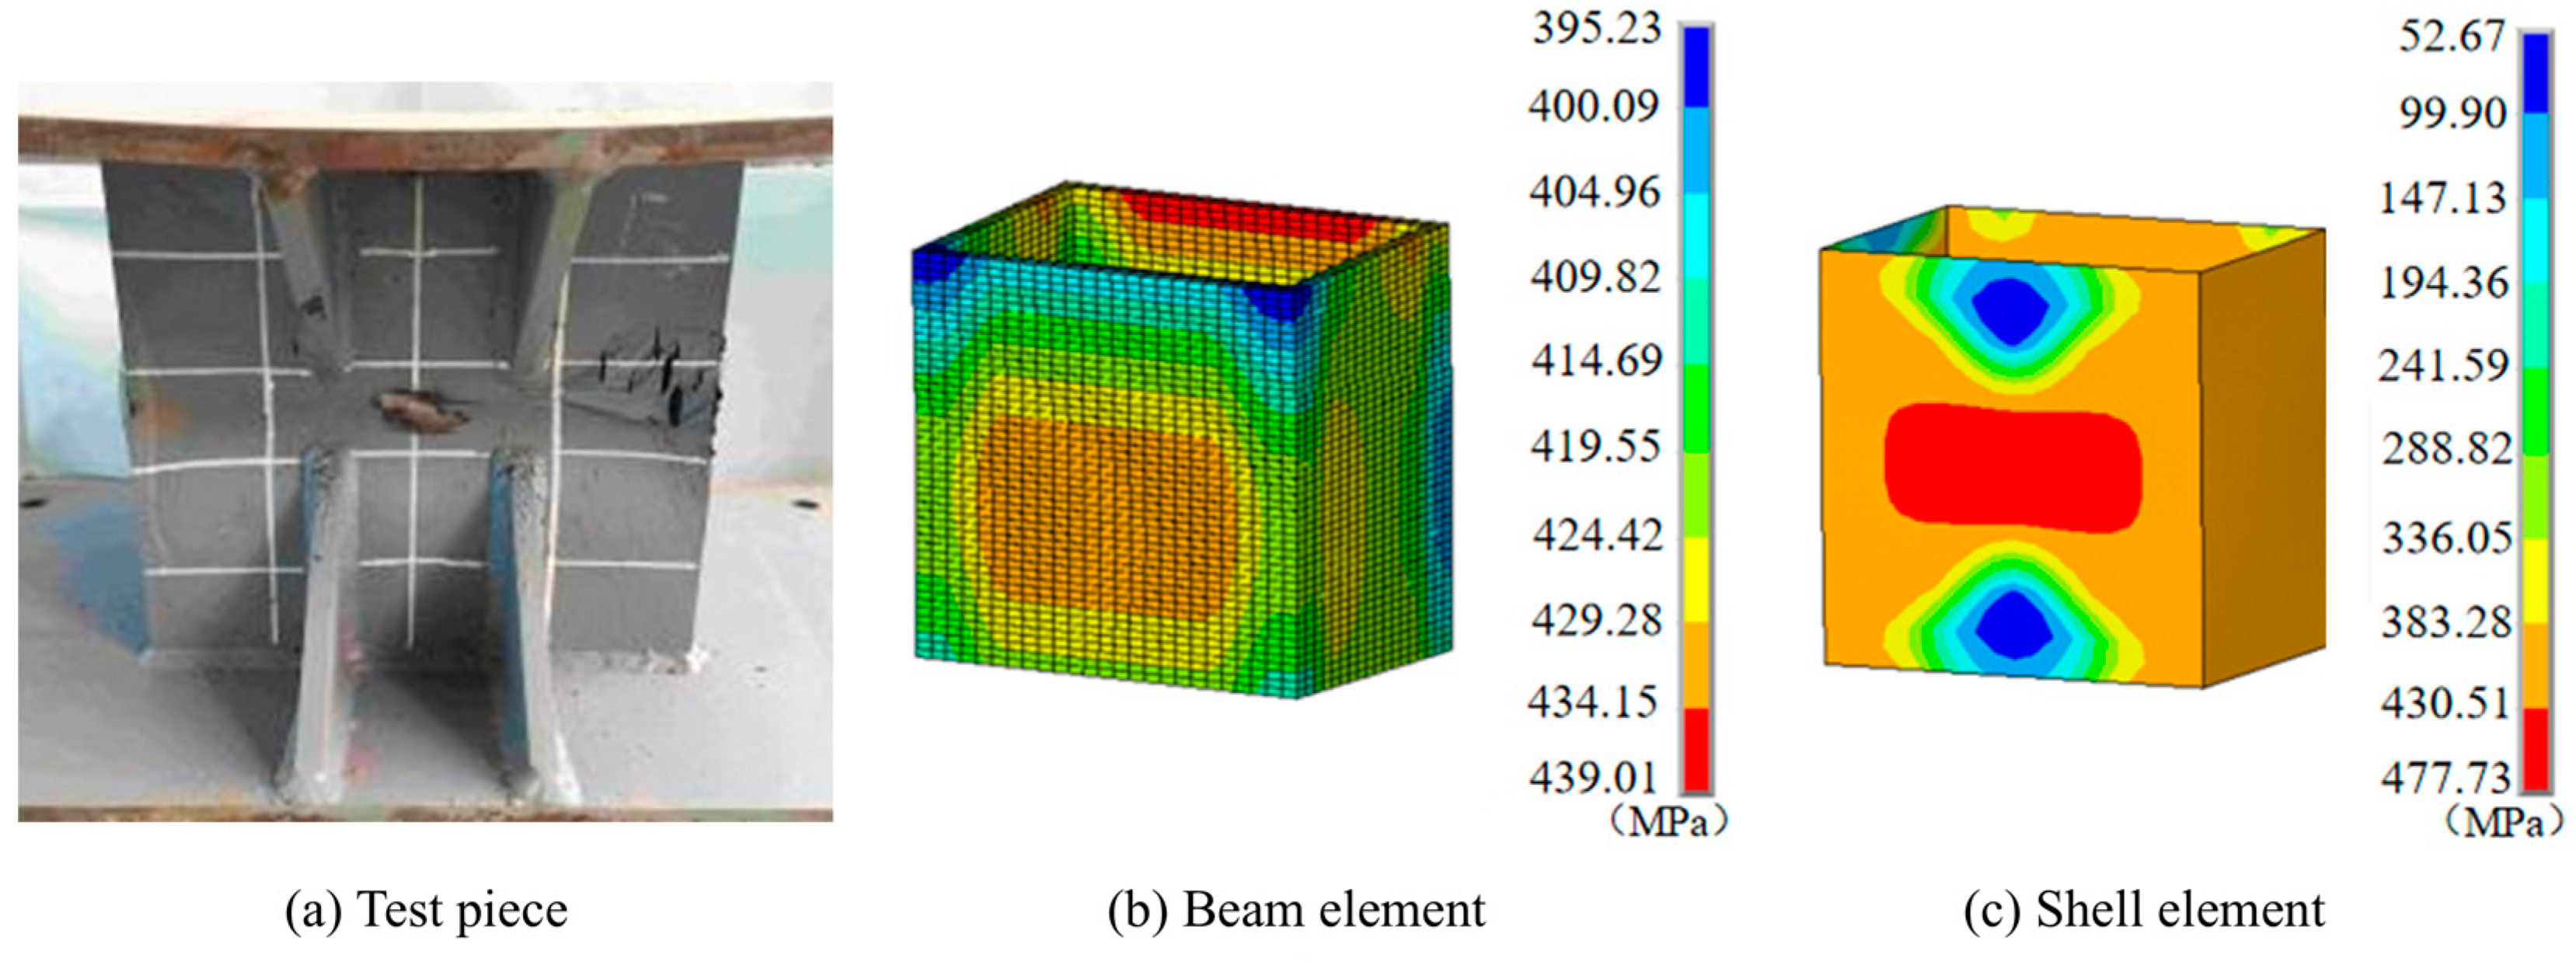
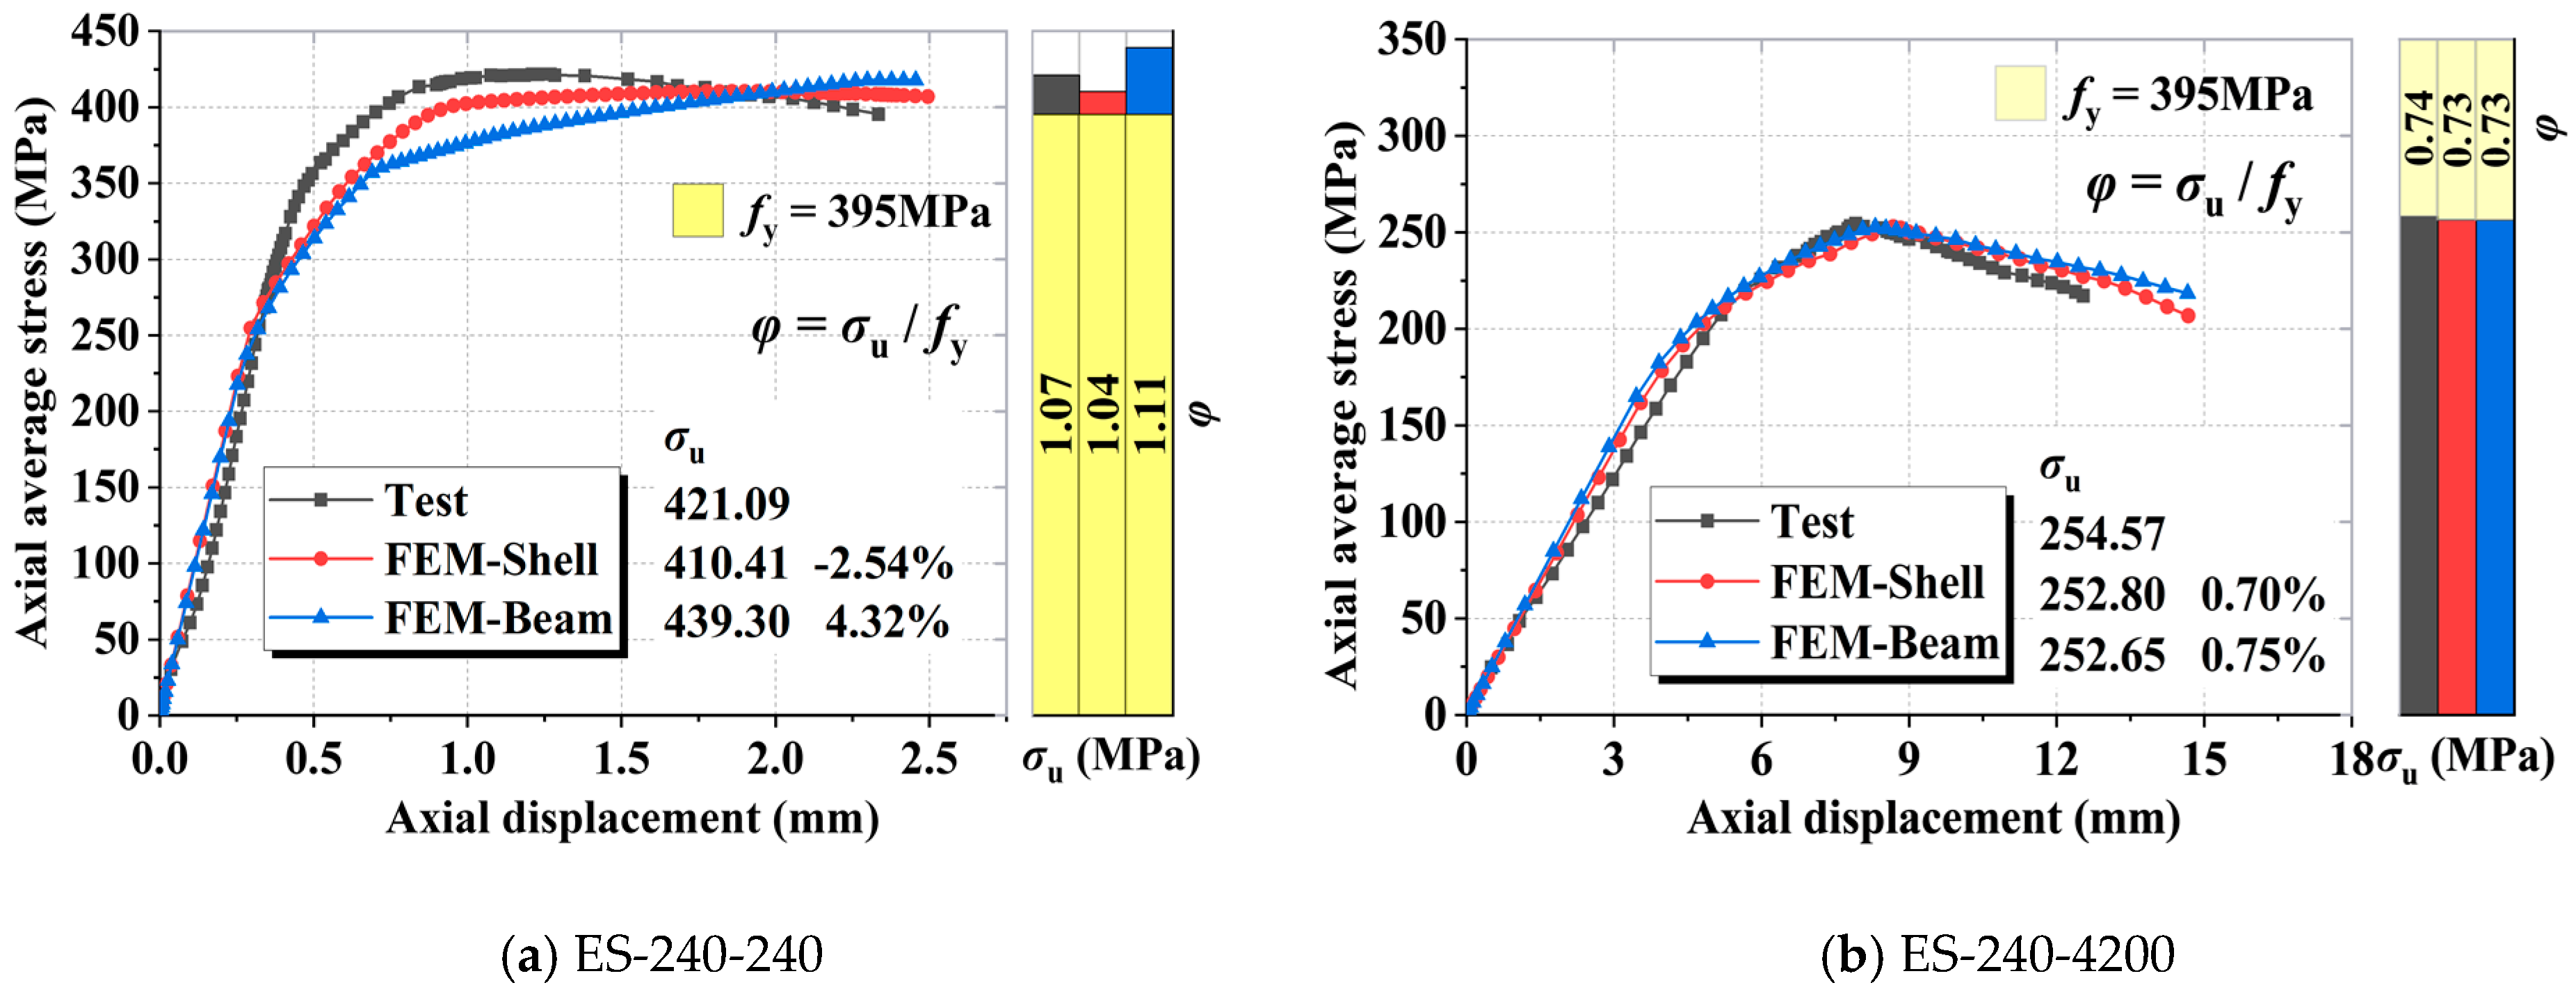
3.2. Finite Element Model Verification

For the long column and its two corresponding types of element models, a distinct overall flexural buckling failure was observed. Figure 10 shows that at the location of maximum deformation of the long side plate member of the long column, the stress reached 354.9 MPa, which was close to the yield strength of the material. This reflects the overall buckling of the long-column specimen under the action of axial force and second-order effect. For the short column, the stress diagram in Figure 11 shows that the Mises stress at the maximum deformation of the long side plate was nearly equal to the tensile strength, reflecting the characteristics of strength failure.
For the short column, Figure 12a shows that the load–displacement curves of both closely overlap in the initial linear segment, indicating the accuracy of the material property test results. In the intermediate stiffness degradation phase, the curves of both specimens are largely aligned, demonstrating that the boundaries and initial geometric imperfections set in both the experiment and finite element simulation correspond to the actual conditions. In the later descending phase, the short column specimens simulated with shell elements exhibit a small “yield platform” after reaching the ultimate load-carrying capacity with a relatively small drop. In contrast, the beam elements, owing to their inability to simulate local plate deformations, result in a certain discrepancy in the curve trend. For the long column, the finite element models simulated using the two types of elements indicate a trend that is essentially consistent with the experimentally measured load–displacement curves of the specimens, as shown in Figure 12b. Therefore, SHELL181 elements will be used for simulation in the subsequent parametric analysis to obtain more accurate results.

3.3. Parametric Discussion

This section builds upon a previously validated nonstiffened box section model (NS) via experiments and finite element simulations. Additional model samples, which were difficult to realize experimentally, were introduced to study the damage mechanisms of the stiffened box section model (S) and the factors affecting the overall stability. The setting of the model dimensions adhered to the principle of a single variable, changing the slenderness ratio of the model by changing its length. In conjunction with the cross-sectional form of the steel bridge pier columns, two plate stiffeners were located on the long and short edges of the model. The stiffened box columns were modeled according to the simulation method in Section 3.1, as shown in Figure 13. The out-of-plane displacement at the midsection of the member, taken as 0.03 times the member length, was used as the ultimate failure criterion. Building upon Zhao et al.’s research on T-joints with flat plate stiffeners [28,29], the present study references the self-equilibrating residual stress calculation formula established in their work for analyzing stiffener residual stresses. Table 2 lists the detailed construction dimensions of both box girder types.

3.3.1. Influence of Initial Geometric Imperfections

Various initial geometric imperfections are often exhibited during the actual fabrication processes of steel structures. Among these imperfections, the initial curvature of the model and initial eccentricity under load are the most typical. Therefore, this section focuses on these two types of typical initial geometric imperfections and analyzes their impacts on the overall stability and load-bearing capacity of stiffened box sections.
(1)
Initial curvature
In the stability theory of thin-walled structure, the initial curvature of the model is typically characterized by a sinusoidal half-wave shape, with the peak of the sine wave representing the amplitude of the initial curvature at the midspan. Since the Chinese code GB 50017-2017 [30] stipulates that the initial curvature does not exceed the tolerance at span length/1000, the parameter settings fluctuate within that range. The effects of the initial curvature amplitudes of L/750, L/1000 and L/1500 on the ultimate bearing capacity of models with different slenderness ratios are considered, respectively.
Figure 14 illustrates that the influence of the initial curvature amplitude on the load-bearing capacity followed the same pattern for both the stiffened and nonstiffened box sections, all demonstrating a gradual reduction in the stability bearing capacity of the members as the defect amplitude increased. Taking Members S as examples, when the imperfection amplitude increased from L/1500 to L/1000, the ultimate load-bearing capacity of each member decreased by 0.9%, 1.7%, 5.2% and 3.1%. When the imperfection amplitude increased from L/1000 to L/750, the ultimate load-bearing capacity of each member decreased by 1.2%, 1.7%, 4.3% and 3.0%, respectively. These results indicate that, for a member with a lower slenderness ratio, the initial curvature amplitude has a minimal impact on the overall stability and load-bearing capacity. As the slenderness ratio increases, the effect of the initial curvature amplitude on the load-bearing capacity first increases and then decreases.
(2)
Initial eccentricity
The influence of varying eccentricities on the ultimate bearing capacity of two types of models is illustrated in Figure 15. It can be found that the influence of the eccentricity amplitude on the load-bearing capacity followed the same pattern for both the stiffened and nonstiffened box sections. As the eccentricity increased, the ultimate average stress for the models NS and S exhibited a decreasing trend. Taking Members S as examples, when the eccentricity increased from L/1500 to L/1000, the ultimate load-bearing capacity of each member decreased by 0.7%, 2.0%, 4.7%, and 3.4%. When the eccentricity was further increased from L/1000 to L/750, the ultimate load-bearing capacity of each member decreased by 0.9%, 2.0%, 4.0% and 3.1%. These results indicate that as the slenderness ratios of the model increased, the impact of eccentricity on the load-bearing capacity initially increased and then decreased.

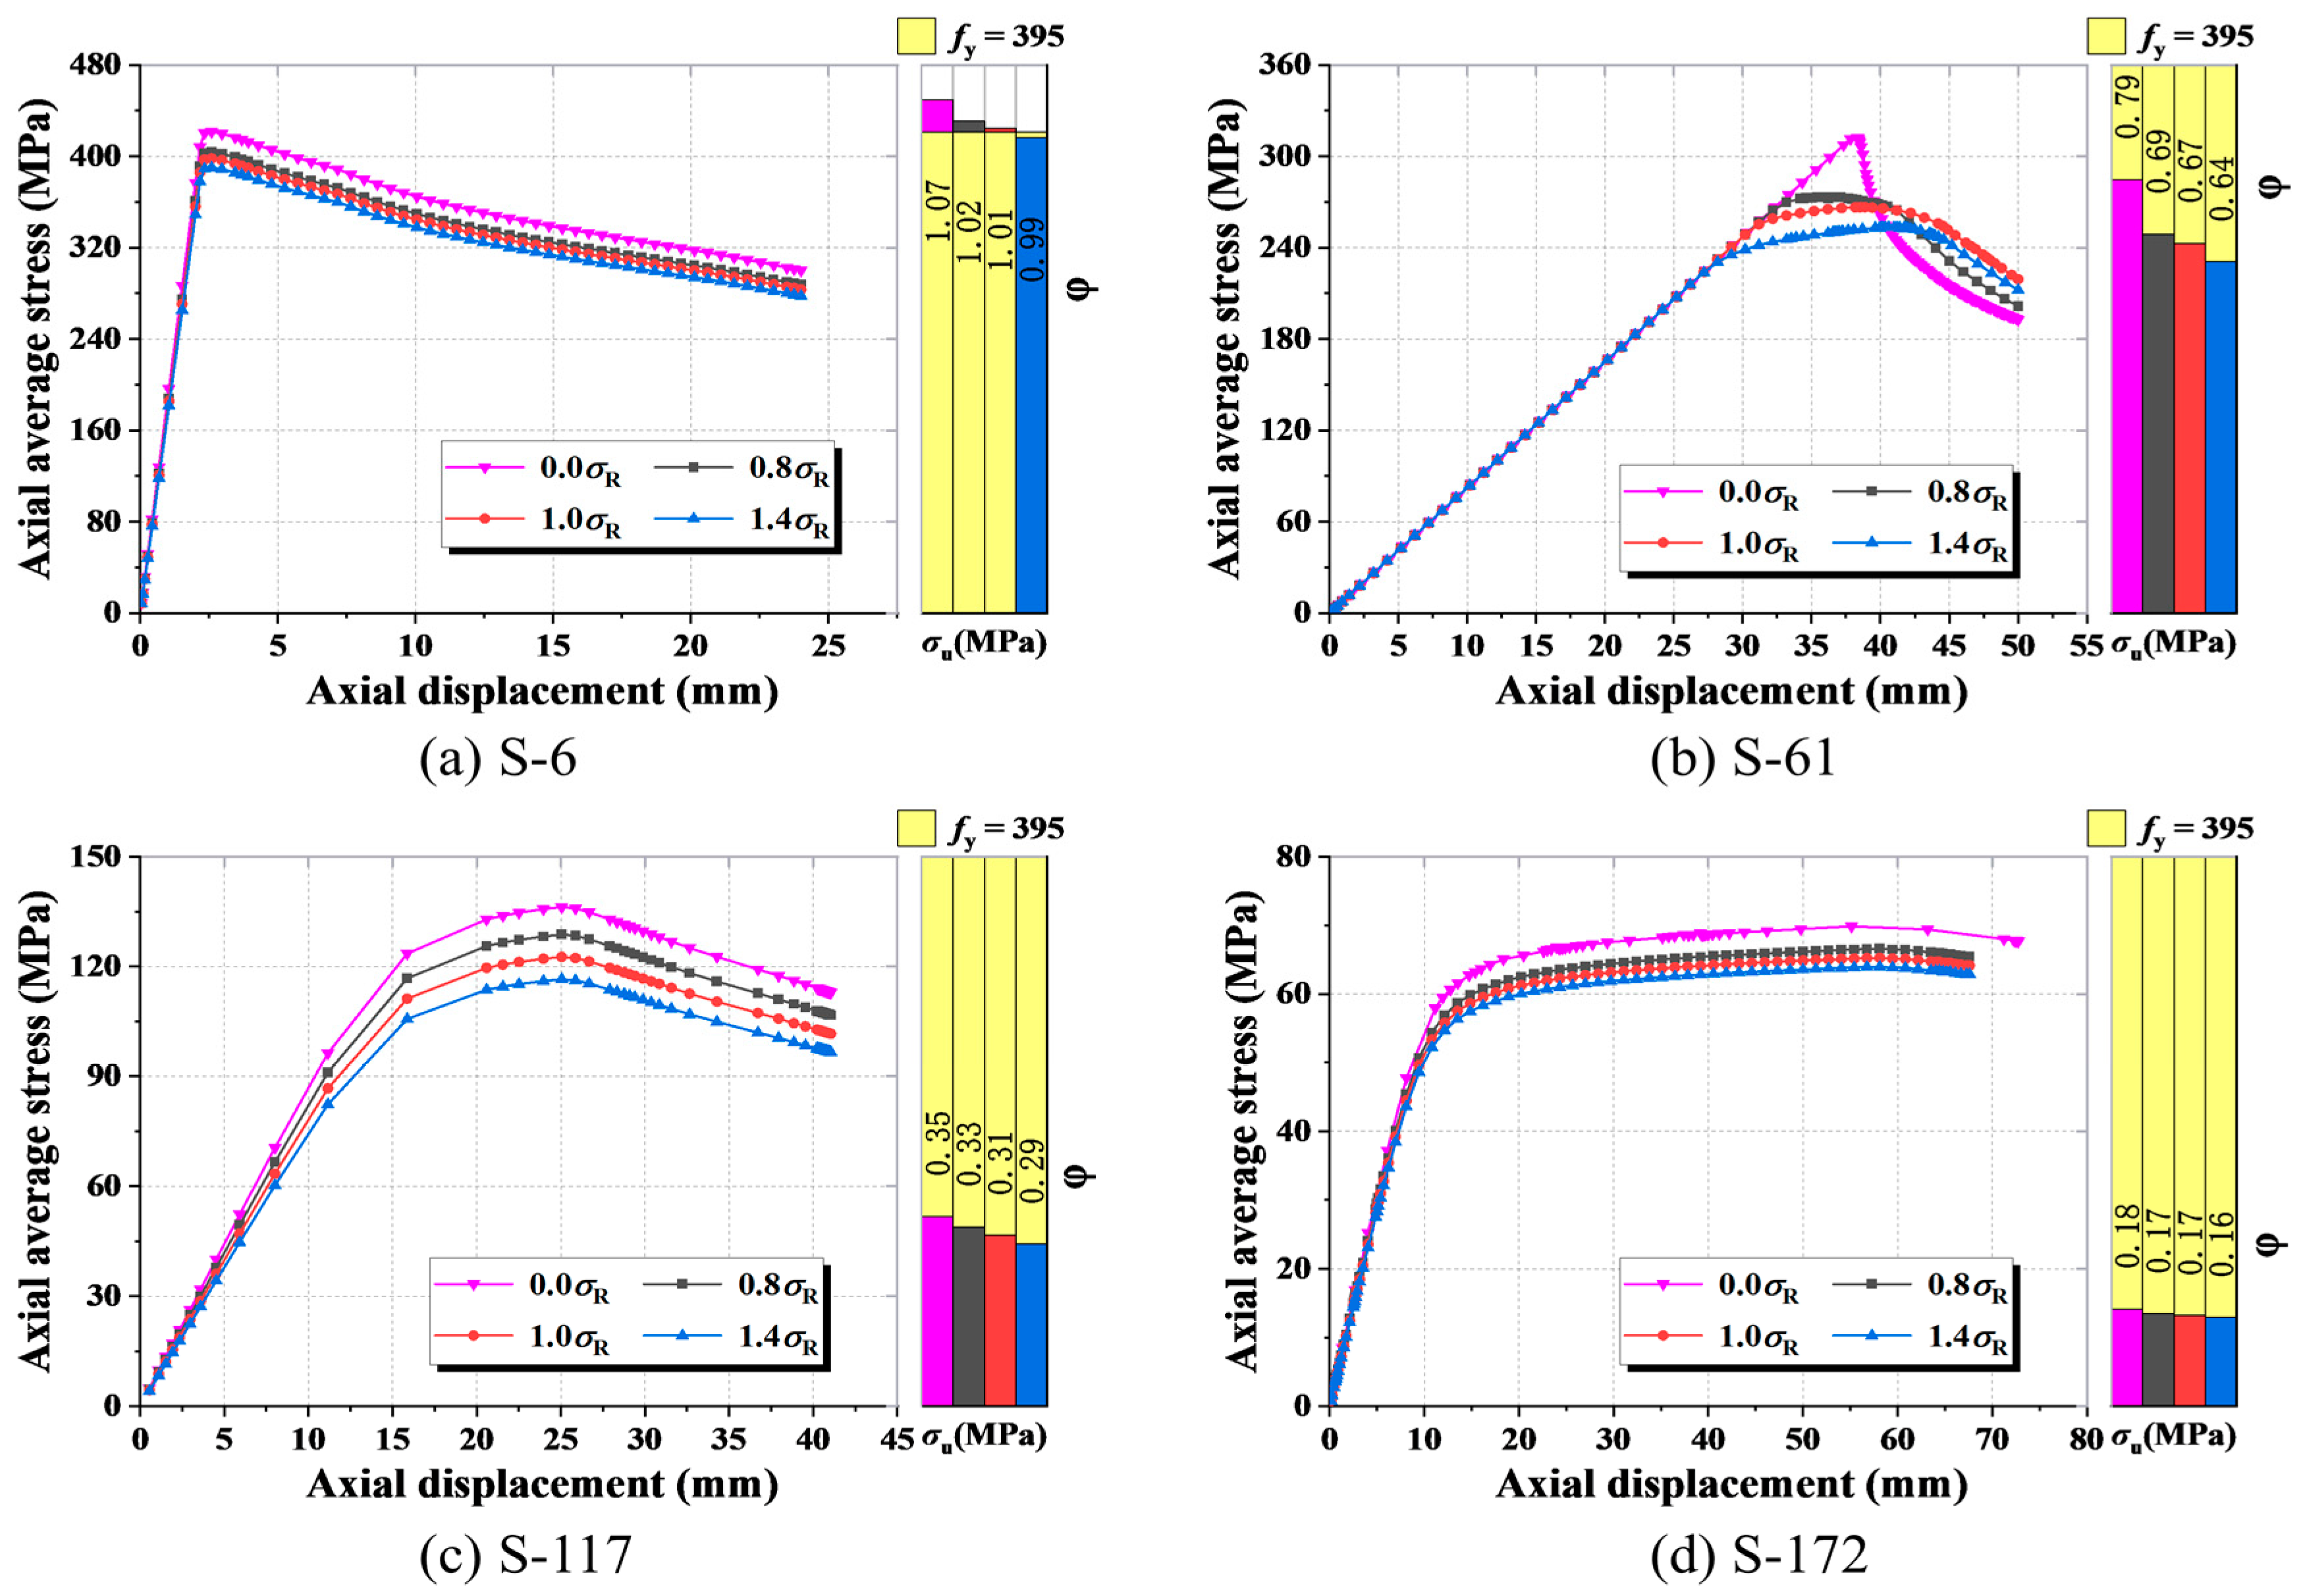
3.3.2. Influence of Residual Stresses

Reliable studies have indicated that thermal effects generated during welding processes significantly impact thin-walled box structures [6,7,8]. Therefore, based on the simplified residual stress distribution pattern in Figure 5b, this section investigates the influence laws of different residual stresses on two types of members by adopting 0.8, 1.0, and 1.4 multiples of the peak residual compressive stress (abbreviated as σR) described above. Figure 16 and Figure 17, respectively, illustrate the influence of residual stress on the NSs and the Ss.
As depicted in Figure 16 and Figure 17, a comparison of the peak load–displacement curve values for various models under different magnitudes of residual compressive stress distribution reveals a pattern: for both the NS and S of box sections, there is a consistent trend of a greater residual compressive stress implying a lower ultimate load-bearing capacity of the model. Taking NS-172 and S-172 as examples, increasing the residual stress from 0 σR to 1 σR reduced their peak values and their ultimate load capacities by 5.44% and 6.52%, respectively. Further augmenting the residual stress to 1.4 σR resulted in additional reductions of 9.24% and 11.95% in their ultimate load capacities. These results confirm that the presented experimental and simulation methods are equally applicable to the study of stiffened-type box sections in terms of the residual stress distribution.
Furthermore, the distribution of welding residual compressive stresses significantly influences the overall stability of structural models. As detailed below, when accounting for welding residual stresses, there is a noticeable reduction in the axial stiffness of the models. This decrease becomes more pronounced as the included residual compressive stresses increase. These results occurred because, for models not considering residual stresses, the compressed side is only subjected to axial pressure from the load and bending compressive stresses owing to second-order effects. When the distribution of welding residual stresses is considered, the residual compressive stresses are superimposed, which leads to a more rapid attainment of the yield strength.

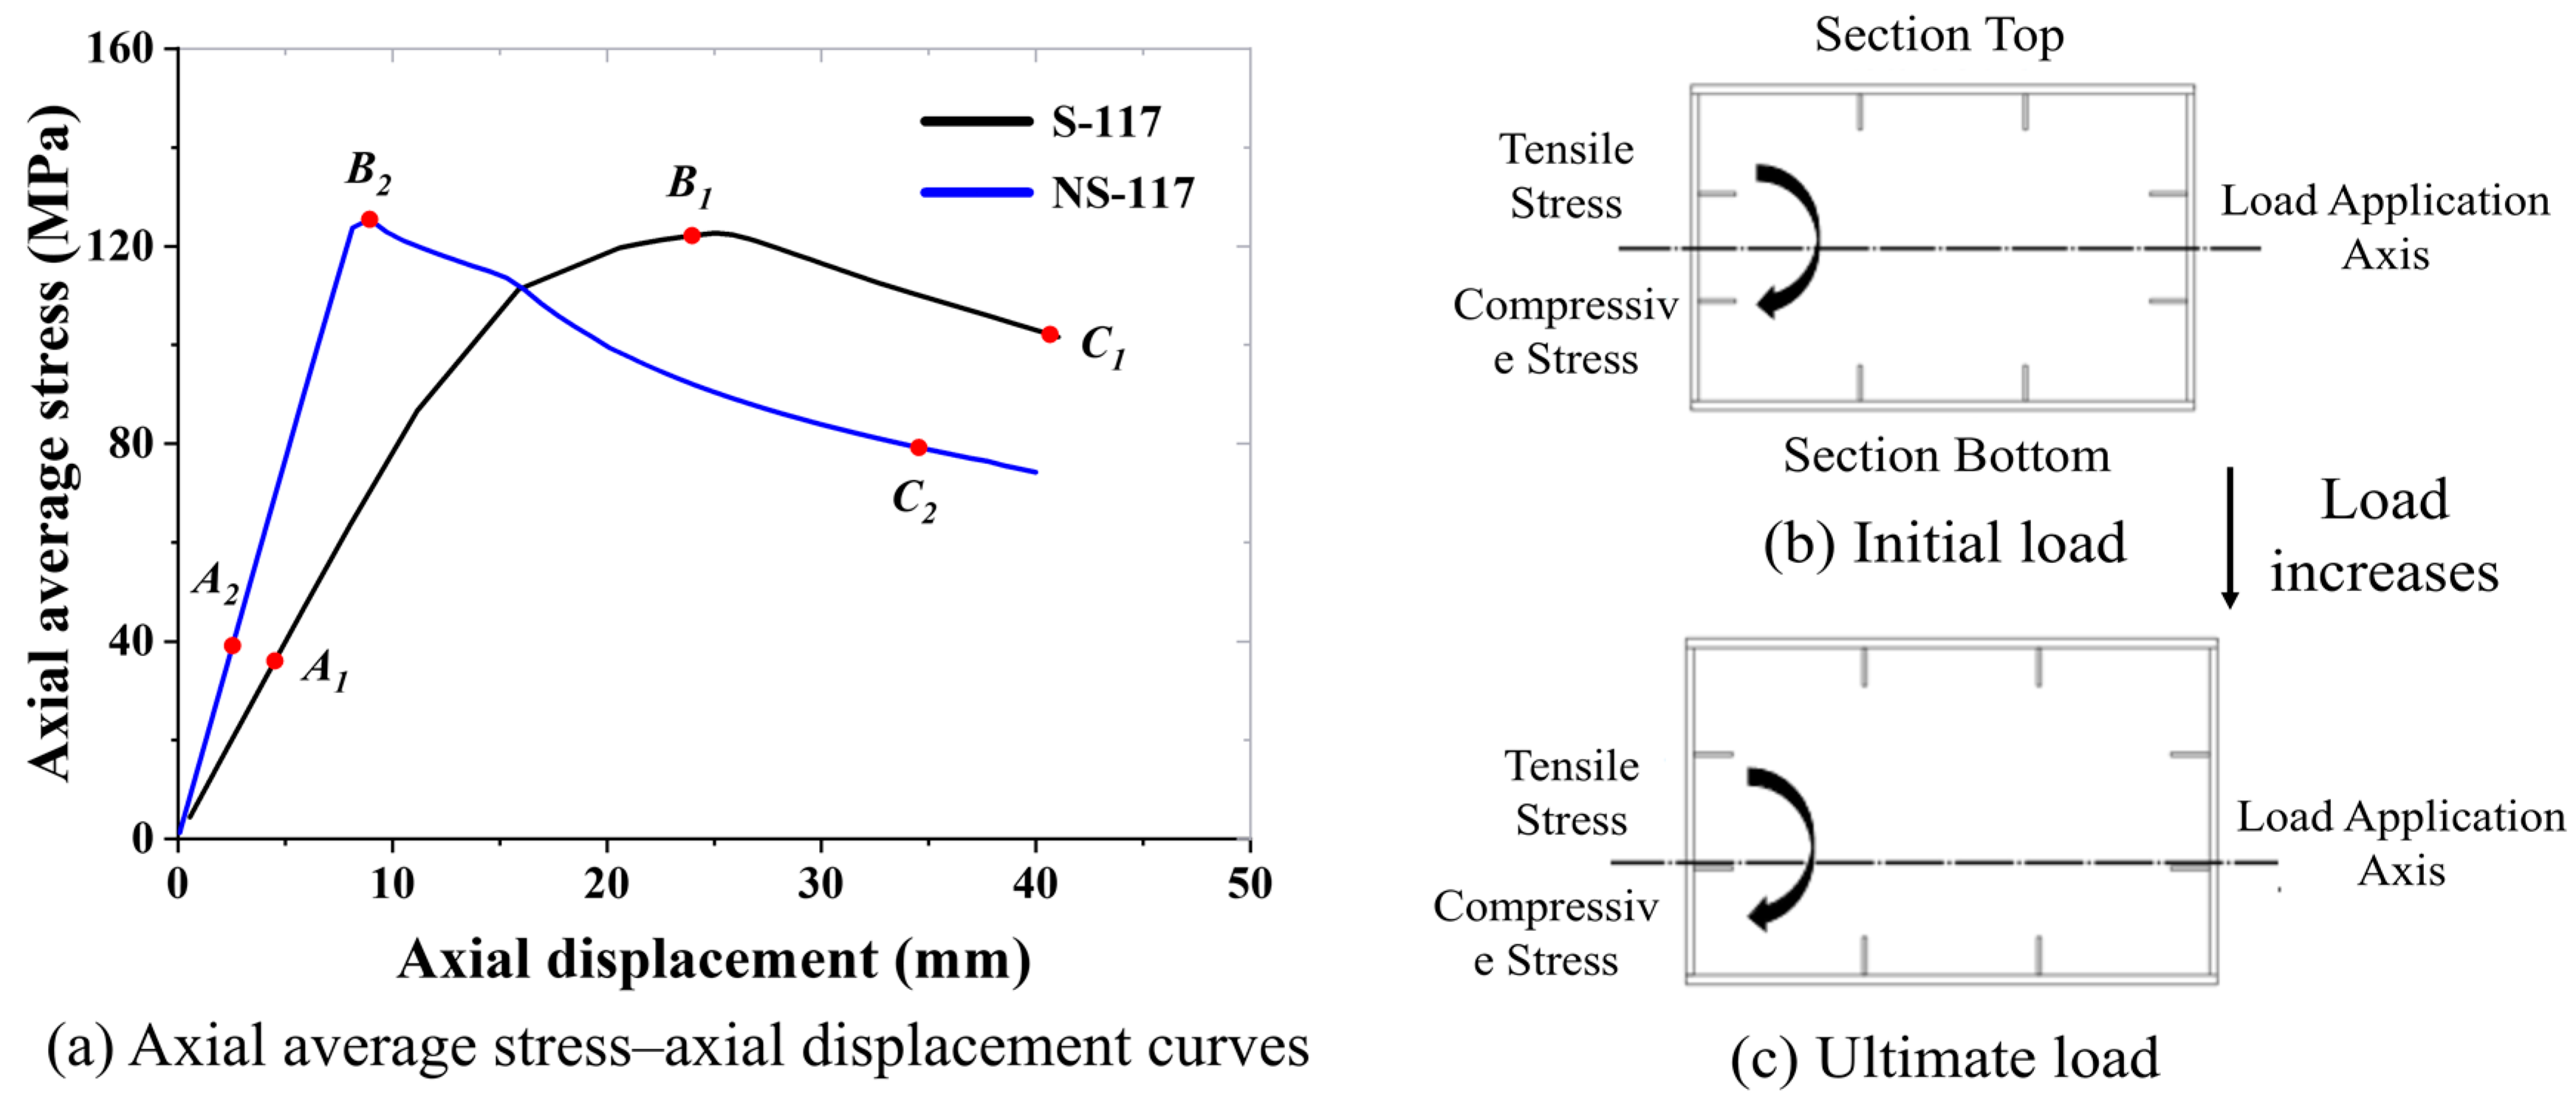
3.4. Force Mechanism of Box Section Columns

To elucidate the similarity in the force mechanisms and failure processes during the overall instability of the two types of box sections, this section considers the models with the highest slenderness ratios, namely, S-117 and NS-117, as examples to analyze the failure mechanisms of overall instability. Considering that the models exhibited significant bending deformation in the middle section at the moment of ultimate failure, this study focused on stress changes in the midsection during the initial loading phase, at the ultimate load capacity, and at the moment of final failure. This analysis aimed to clarify the force mechanisms of the box sections under overall stability conditions, with both ends simply supported.
Figure 18 shows the axial average stress–axial displacement curves for the S-117 and NS-117 models along with the variations in the load application points. Figure 19 shows stress contour plots.
It can be observed that S-117 and NS-117 exhibit similar mechanical performance characteristics. These characteristics can be summarized as follows:
(1)
In the initial stage of loading, owing to the small out-of-plane initial deformation at the midsection, the model is in a state of axial compression, and the axial stress–displacement curves show a linear increase, as depicted in Figure 19a,b. As the load increased, the load application axis at the midsection of the member shifted in the direction opposite to the out-of-plane deformation, as shown in Figure 18b,c. At this point, the bottom of the section is compressed and subjected to a state in which the bending and axial compressive stresses were superimposed owing to the second-order effects of the model. The second-order effect of the model increases with the increase in the out-of-plane bending deformation of the model, resulting in the tensile side at the top of the section gradually changing from compression to tension.
(2)
As shown at point B in Figure 18a, most of the sections at the bottom of the model section reach the ultimate bearing capacity. The residual tensile stress area at the top of the section also exceeds the tensile yield strength under the combined effects of the bending tensile stress and axial compressive stress, as shown in Figure 19c,d. These results suggest that the bending tensile stress caused by the second-order effect is obviously higher than the axial compression stress and welding residual compressive stress of the model. Therefore, the influence of the second-order effect cannot be ignored.
(3)
When the model enters the load drop section, the out-of-plane deformation further increases, whereas the axial load decreases, making the bending tensile stress at the top of the section more pronounced. The area subjected to tensile yielding expanded rapidly from the weld locations to the surrounding plate, whereas the bottom of the section essentially reached the compressive yield strength, as shown in Figure 19e,f. The member ultimately failed, as indicated by point C in Figure 18a.
In summary, the overall instability modes of the two types of box models were similar, with similar stress mechanisms and failure processes. Simultaneously, during the initial stage of model loading, the influence of the second-order effect was insignificant. With an increase in the load, the influence of the second-order effect gradually increased, and the failure of the model section was aggravated.

4. Proposed Stability Calculation Formulas for Stiffened Box Columns

4.1. Calculate the Construction Size of the Model

To enrich the understanding of the overall stability performance of stiffened and unstiffened box section columns across a range of slenderness ratios, this section develops supplementary computational models covering a wide range of slenderness ratios for both unstiffened and stiffened box cross-sections, based on common geometric parameters of steel bridge piers and columns. Specifically, 783 additional models were designed for unstiffened box sections by varying member length, the width-to-thickness ratio of the long side web, the width-to-thickness ratio of the short side web, and the width-to-thickness ratio of the stiffeners. For stiffened box sections, 1008 supplementary models were created under similar parametric variations, as shown in Table 3.

4.2. Calculation Formula for the Overall Stability Coefficient of Stiffened Box Columns

The previous simulation results show that for models experiencing overall instability only, the use of BEAM188 beam elements ensures computational accuracy while reducing the iterative calculation time for each model. Consequently, the BEAM188 beam element is used in modeling for calculating the formula derivation.
(1)
Batch calculation results
By employing post-processing procedures, the axial ultimate average stress (σu) of each model was extracted. The ratio of the ultimate average stress (σu) to the yield strength (fy), denoted as χ = σu/fy, is adopted as the overall stability reduction factor for the structural model. Figure 20 presents the batch calculation results for the overall stability of the box section model under simply supported conditions at both ends.
Figure 20a shows that under the premise of a 95% confidence interval, the curve fitted for the nonstiffened box section closely approximates the curve of Column B, indicating that standard clauses can be safely adopted. By comparing the column curves of the stiffened box sections, a good fit was observed, further suggesting that the application of the simulation methods used in this study for nonstiffened box sections to stiffened box sections is feasible. Therefore, the subsequent study utilizes the column curves of these stiffened box sections to propose a modified calculation formula for the overall stability of stiffened steel box columns.
(2)
Calculation formula for the overall stability reduction factor.
Research on the overall buckling stability of welded steel structures has been predominantly conducted by scholars worldwide via finite element simulations and column buckling tests to ascertain the ultimate bearing capacity. Through modification of the imperfection coefficient in the Perry–Robertson formula, an enhanced column curve was derived. This section presents a nonlinear regression analysis of the imperfection coefficient based on extensive numerical simulation results. With a 95% confidence level, the modified imperfection coefficient is given by Equation (1), with the corresponding fitting results illustrated in Figure 20b. The final overall buckling curve, represented by the modified Perry–Robertson formula, is given in Equation (2). It is worth noting that this equation maintains formal consistency with the computational formulations specified in the JTG-D64-2015 [24], GB-50017-2017 [30], and Eurocode 3 [31].
ε 0 = 0.45 λ ¯ 0.21 .
λ 0.21 : χ = 1 λ > 0.21 : χ = 1 2 1 + 1 λ 2 1 + ε 0 1 + 1 λ 2 1 + ε 0 2 4 λ 2 .
To simulate the application of the formulas, take a steel stiffened column with an actual slenderness ratio (λ) of 34 and a yield strength (fy) of 345 MPa as an example. The normalized slenderness ratio ( λ ¯ ) of this steel-stiffened column is 0.44. The imperfection factor ( ε 0 ) can be obtained from Equation (1), yielding a result of 0.10. Finally, the overall stability reduction coefficient (χ) is calculated using Equation (2), resulting in a value of 0.89.

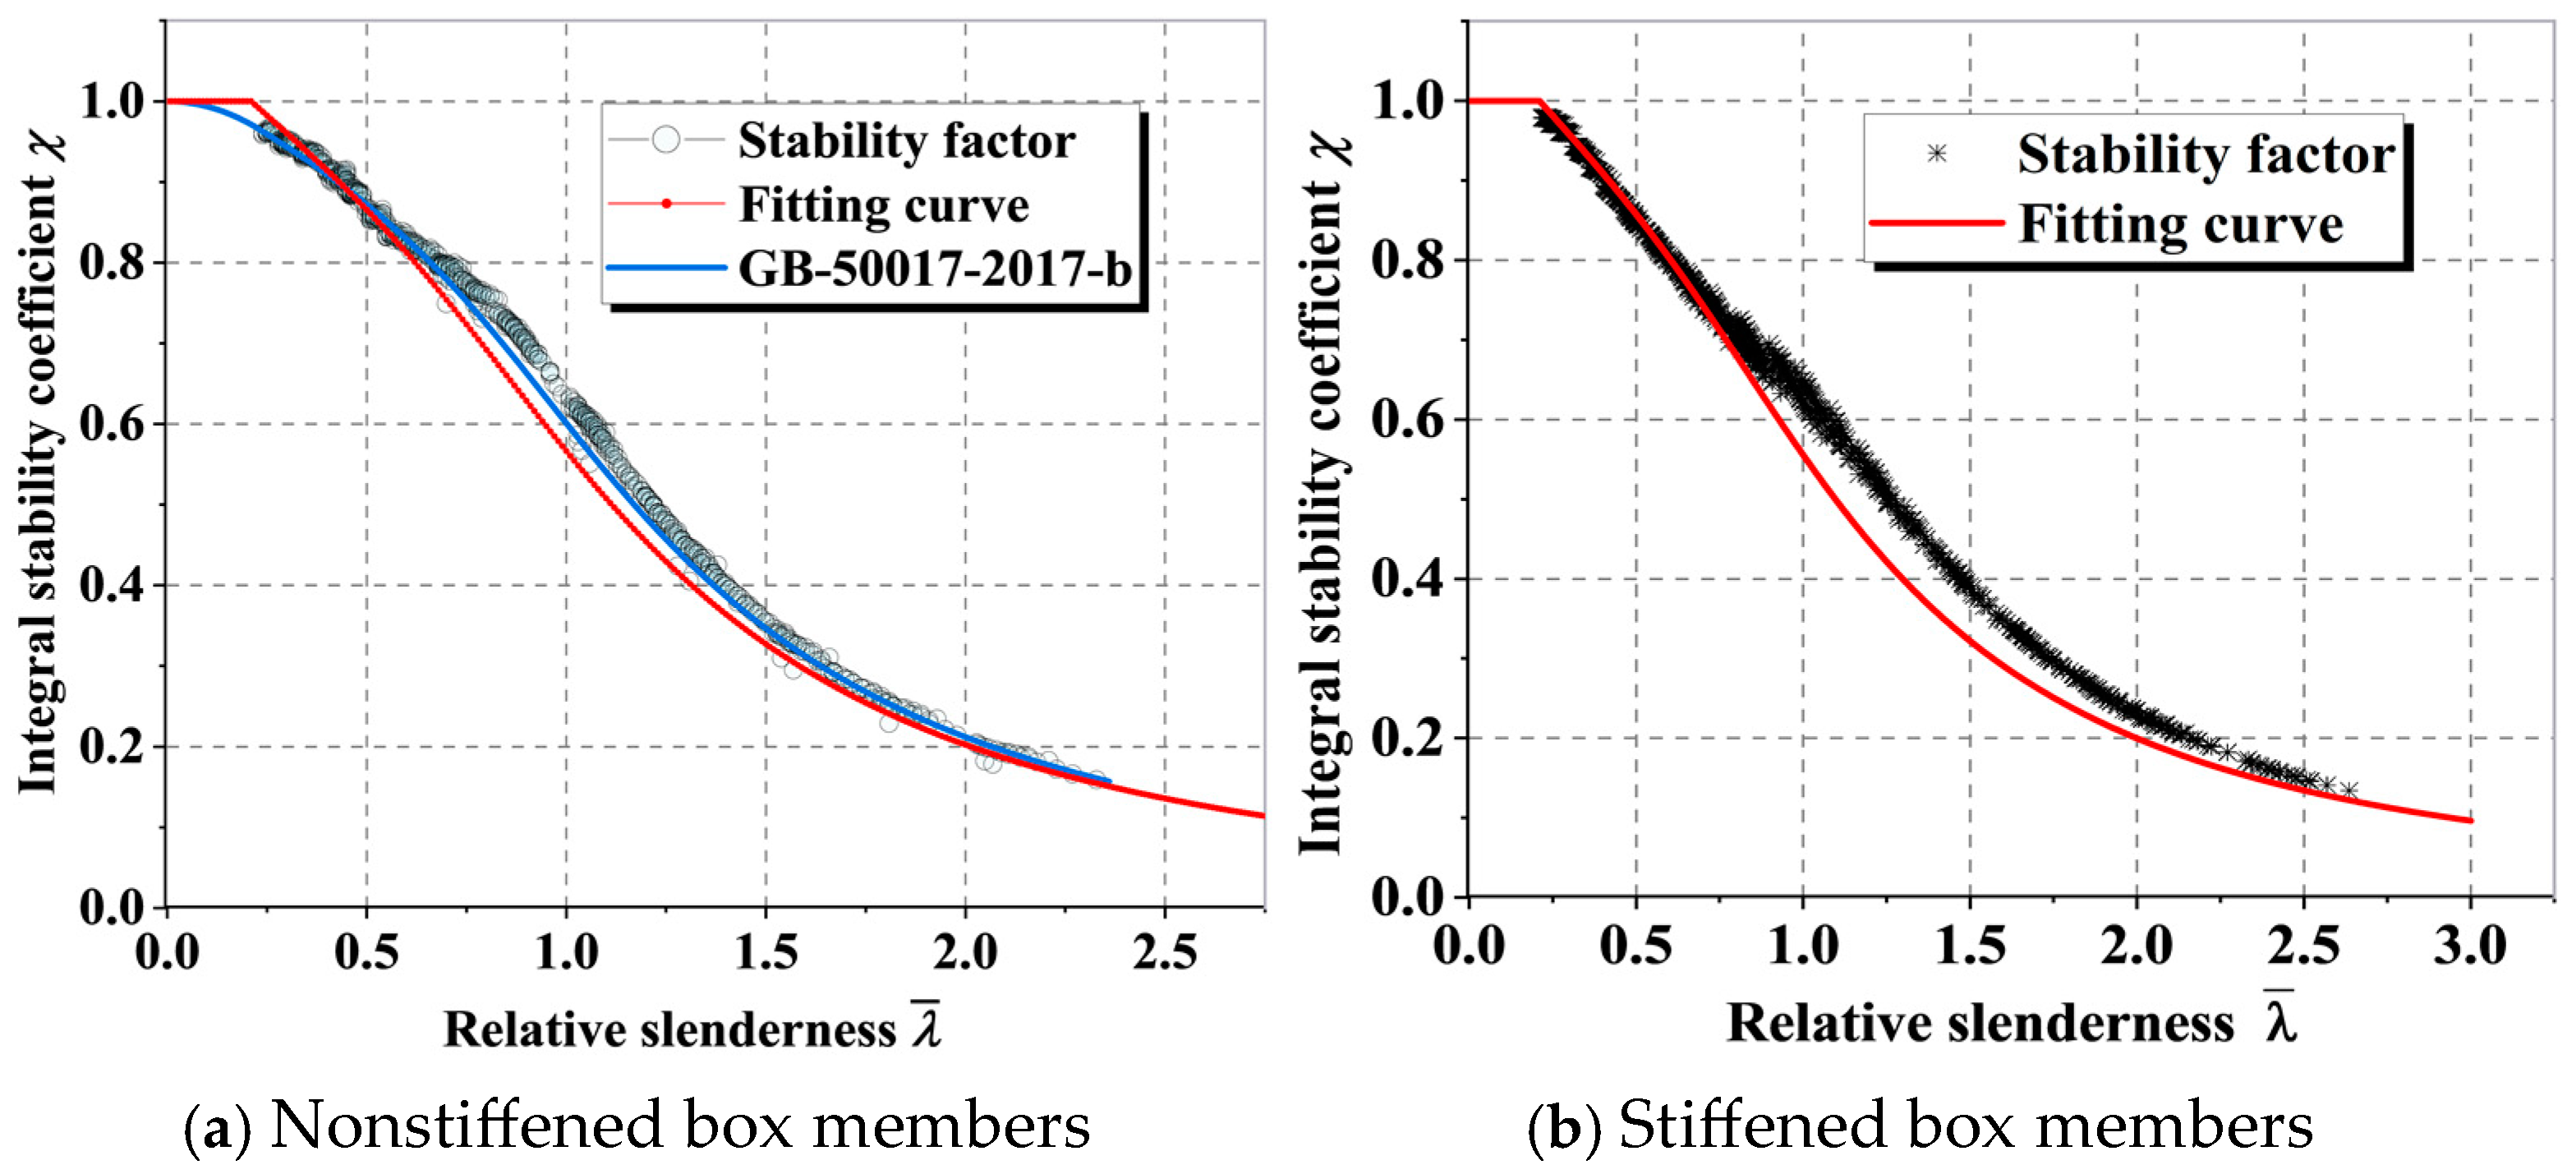
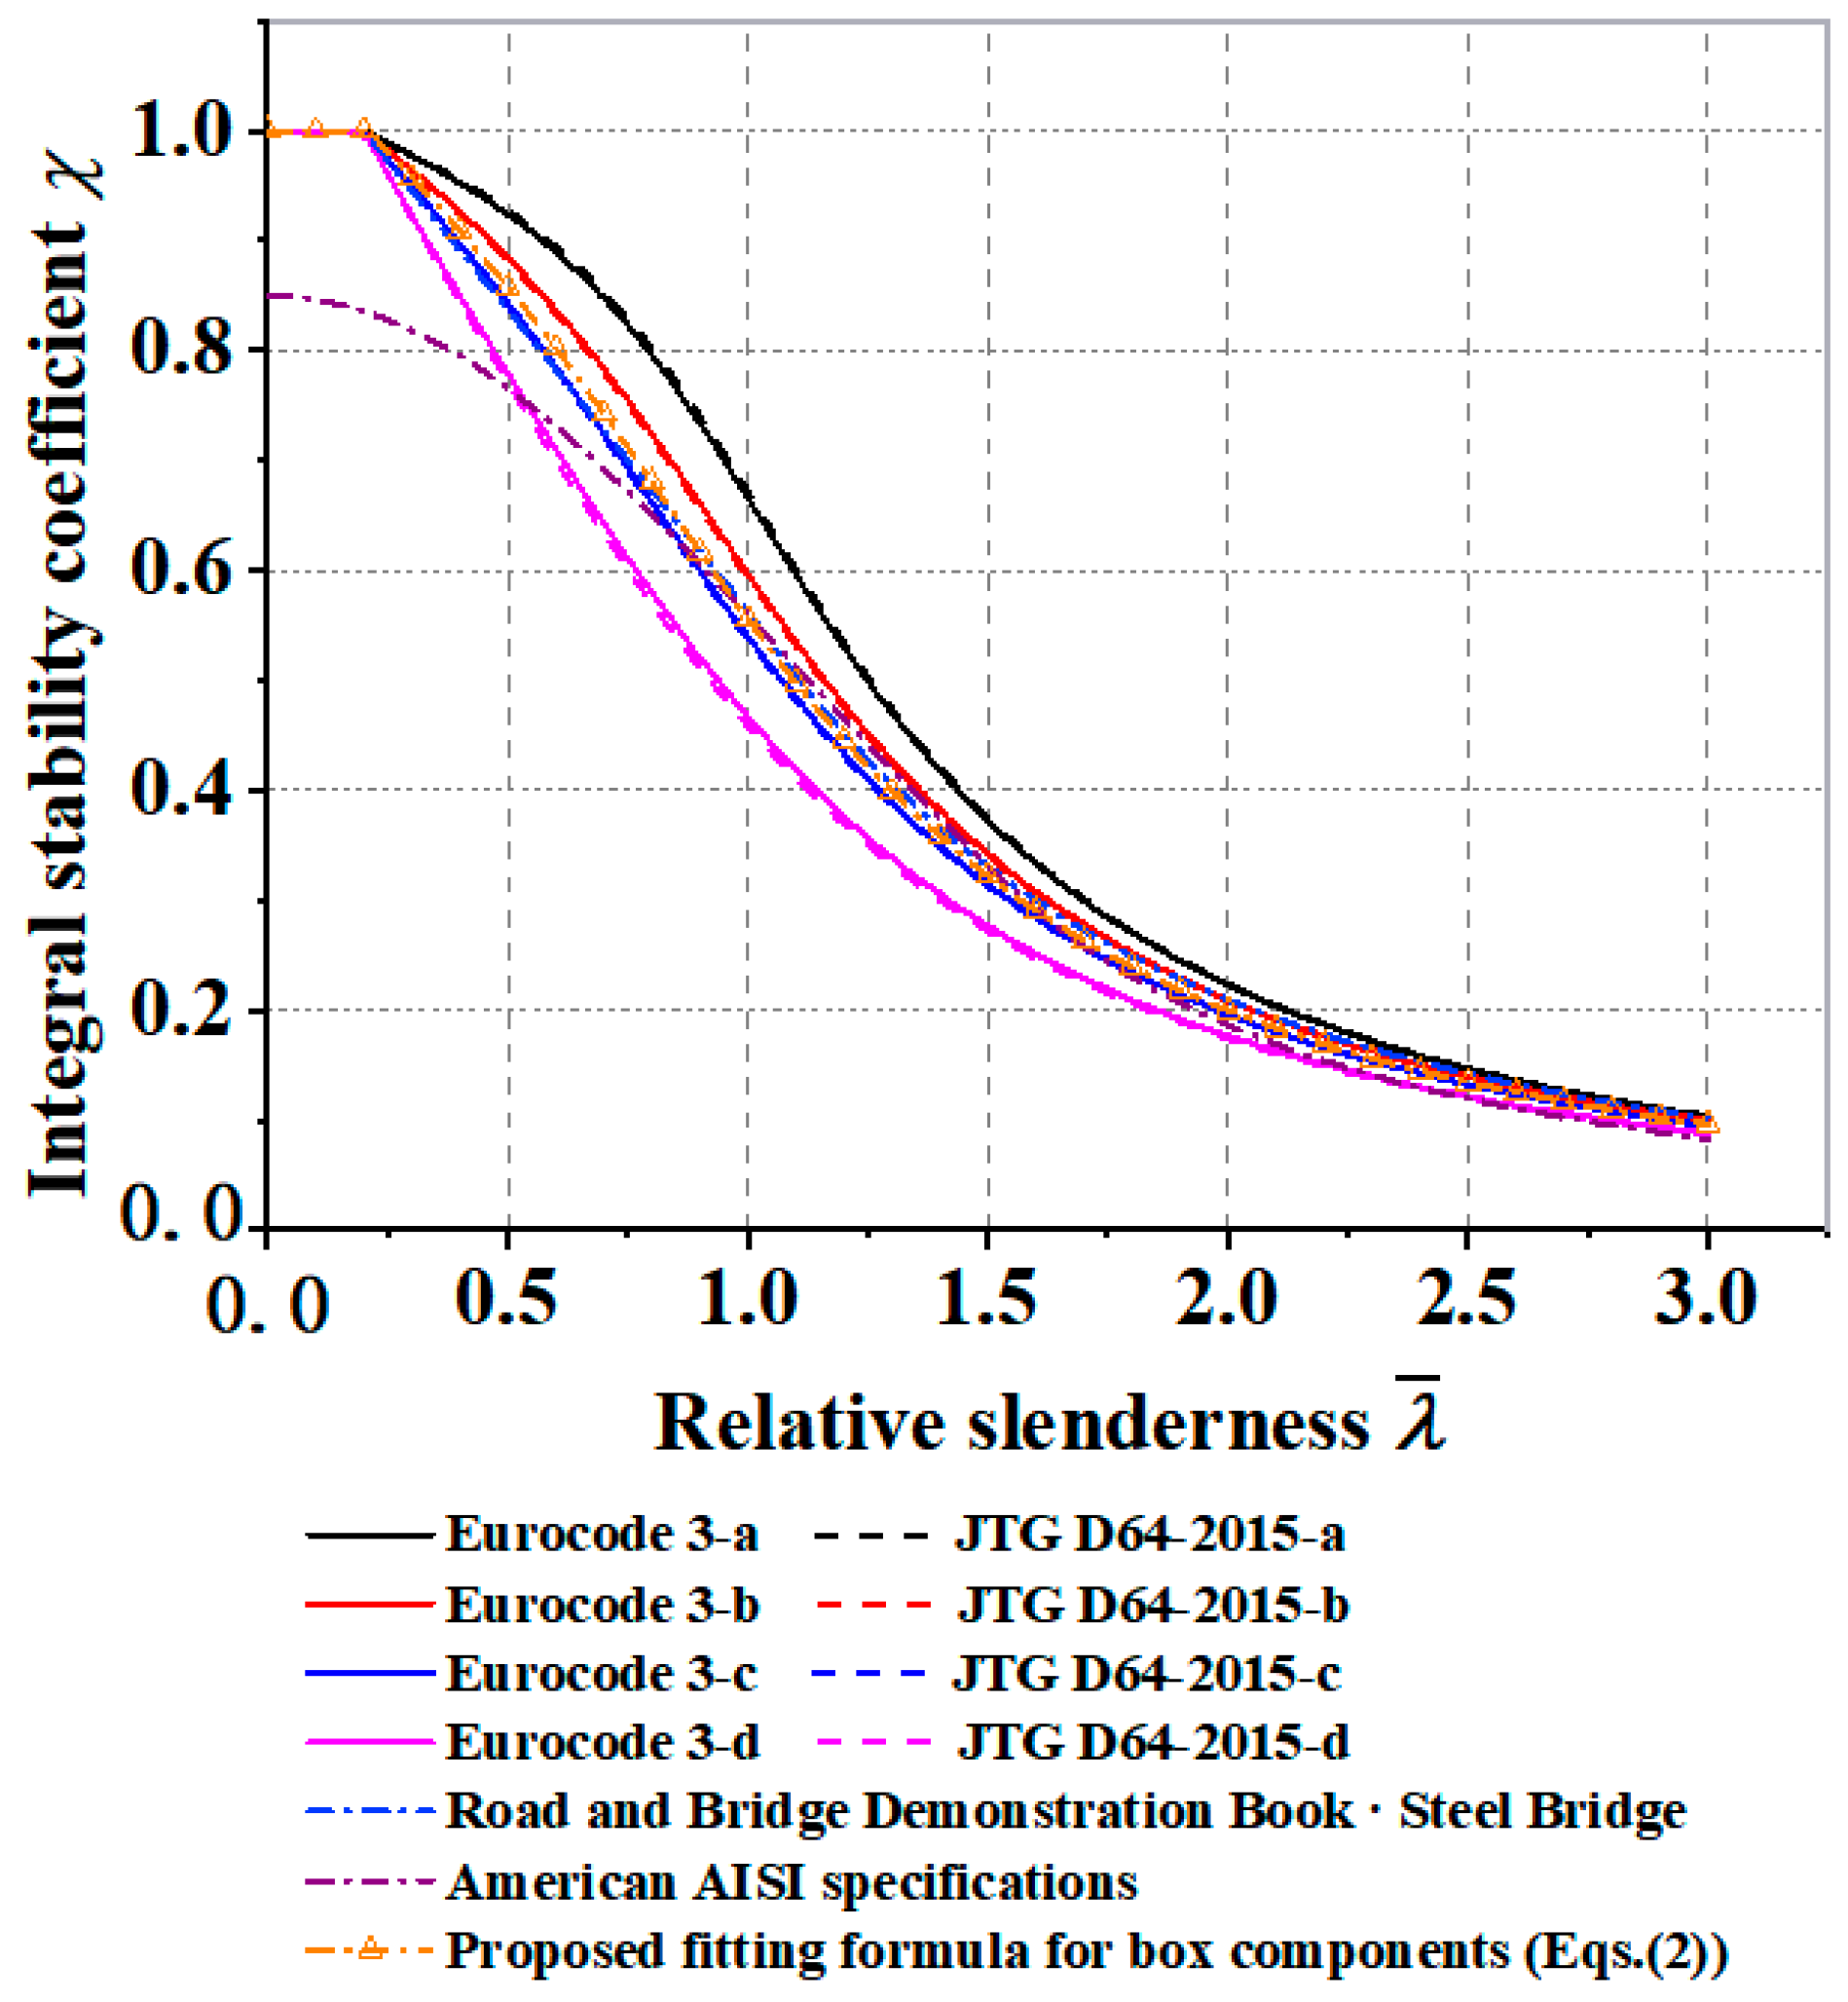
4.3. Comparative Analysis of the Overall Stability Coefficient

To verify the accuracy of the overall stability correction calculation formulas for box sections, this study compared the fitted correction calculation formulas with those specified in the Chinese codes (JTG-D64-2015) [24], (EN 1993-1-5) [31], Japanese codes [32],and American codes (AISI) [33], as depicted in Figure 21.
Figure 21 shows the following: (1) Since GB 50017-2017 [30] and Eurocode 3 [33] share similar design principles, the results are further compared with Eurocode 3. The overall stability correction calculation formula (Equation (2)) for the stiffened box section column proposed in this section is generally positioned between the Class B and Class C column curves of the Eurocode 3. Compared with the current JTG D64-2015 [24], the proposed curve is slightly above the Class C column curve, with an overall average deviation of 2.20%. In contrast, Equation (2) demonstrates closer alignment with the Class C column curve specified in Eurocode 3, exhibiting a reduced overall average deviation of 1.21%. (2) Compared with Japanese and American code, the overall average deviation of the box section overall stability calculation formula (Equation (2)) from the Japanese code [31] is −2.38%. Moreover, compared with the AISI [32], Equation (2) shows an overall average deviation of 7.69%. Therefore, within the normalized slenderness ratio range of 0.21 to 2.0, the calculation results for the overall stability bearing capacities of box sections using the American standard yield relatively conservative estimates, whereas the Japanese standard produces comparatively larger values.

5. Conclusions

This article conducted experimental and numerical studies on box section columns. The welding residual stress and initial geometrical imperfection of the column specimens were measured separately, and axial compression tests were carried out. A parametric study based on a validated finite element model was carried out, taking into account the effects of defects and residual stresses. By analyzing the results of a large number of model calculations, the formulas for the overall stability discount factor of stiffened and unstiffened box section columns are proposed. The following conclusions were drawn:
(1)
For box-shaped specimens in the overall stability tests, the experimental failure mode manifested as significant out-of-plane local bulging deformation of the wall plates in short column specimens and significant overall buckling deformation toward one side in the middles of the long column specimens. Short columns (λ = 2.9) exhibited a distinct yield plateau after the peak of the load curve, manifesting as strength failure, whereas long columns (λ = 50.6) demonstrated rapid post-peak load decline characteristic of buckling. The stability coefficients of the two columns are 1.07 and 0.64, respectively, indicating that increasing slenderness ratios reduce specimen load-carrying capacity and exacerbate buckling phenomena.
(2)
As the slenderness ratio increased, the influences of the initial geometric imperfections and residual stresses on the ultimate load-bearing capacities of the models showed a trend of first increasing and then decreasing. The initial curvature caused a maximum reduction in buckling strength of 5.2%, the initial eccentricity caused a maximum reduction in buckling strength of 4.7%, and the residual stresses caused a reduction in buckling strength of 6.52%.
(3)
Curves spanning a broad slenderness ratio range were calculated based on box-shaped specimens, and the Perry–Robertson formula was modified to derive fitted curves for two member categories. The curve for unstiffened members agreed well with the Class B column curves of China’s specifications, validating the formula’s accuracy. Since both member types exhibited consistent buckling modes, an overall stability modification formula for stiffened steel box columns was sestablished.
(4)
The modified formula in this study lies between the Class B and Class C column curves of Eurocode 3 and JTG D64-2015 [24] specifications (with an average 2.20% higher than Class C in JTG D64-2015 [24]) and is positioned between Japanese and U.S. specifications while being slightly lower than the Japanese code. Comparisons with various codes demonstrate the formula’s high accuracy, which can provide a reference for engineering applications.

Author Contributions

B.S., conceptualization, funding acquisition, writing—review and editing. J.L., supervision, conceptualization, funding acquisition. Q.Z., supervision, methodology, project administration. P.C., software, writing—original draft, visualization, F.R., visualization, writing—review and editing, visualization. H.P., project administration, supervision. All authors have read and agreed to the published version of the manuscript.

Funding

This work was funded by the Guangdong Provincial Department of Housing and Urban-Rural Development [2023-K19-424337].

Data Availability Statement

Data will be made available on request.

Conflicts of Interest

Authors Bing Shangguan and Jie Li were employed by the company Guangdong Yejian Construction Drawing Review Center Co., Ltd. The remaining authors declare that the research was conducted in the absence of any commercial or financial relationships that could be construed as a potential conflict of interest.

References

  1. Usami, T.; Zheng, Y.; Ge, H.B. Recent research developments in stability and ductility of steel bridge structures General Report. J. Constr. Steel Res. 2000, 55, 183–209. [Google Scholar] [CrossRef]
  2. Aboulella, F. Analysis of Cable stayed Bridges Supported by Flexible Towers. J. Struct. Eng. 1988, 12, 2741–2754. [Google Scholar] [CrossRef]
  3. Wang, P.; Yang, C.G. Parametric studies on cable stayed bridges. Comput. Struct. 1996, 60, 243–260. [Google Scholar] [CrossRef]
  4. Qu, Z. Research on Substructure Design and Construction Technology of Cross-Sea Bridge. Ph.D. Thesis, Tongji University, Shanghai, China, 2007. [Google Scholar]
  5. Susantha, K.; Aoki, T.; Kumano, T.; Yamamoto, K. Applicability of low-yield-strength steel for ductility improvement of steel bridge piers. Eng. Struct. 2005, 27, 1064–1073. [Google Scholar] [CrossRef]
  6. Ban, H.; Shi, G.; Shi, Y.; Wang, Y. Overall buckling behavior of 460 MPa high strength steel columns: Experimental investigation and design method. J. Constr. Steel. Res. 2012, 74, 140–150. [Google Scholar] [CrossRef]
  7. Ban, H.; Shi, G.; Shi, Y.; Bradford, M.A. Experimental investigation of the overall buckling behaviour of 960 MPa high strength steel columns. J. Constr. Steel. Res. 2013, 88, 256–266. [Google Scholar] [CrossRef]
  8. Ban, H.; Shi, G. Overall buckling behaviour and design of high-strength steel welded section columns. J. Constr. Steel. Res. 2018, 143, 180–195. [Google Scholar] [CrossRef]
  9. Gao, L.; Zheng, Y.Z.; Bai, L.Y.; He, X.H.; Ni, M. Research on overall stability of BS700 high-strength steel columns with box section. J. Constr. Steel Res. 2022, 189, 107090. [Google Scholar] [CrossRef]
  10. Radwan, M.; Kövesdi, B. Equivalent geometrical imperfections for local and global interaction buckling of welded square box section columns. Structures 2023, 48, 1403–1419. [Google Scholar] [CrossRef]
  11. Klitchieff, J.M.; Belgrade, Y. On the stability of plates reinforced by longitudinal ribs. J. Appl. Mech. 1949, 16, 74–76. [Google Scholar] [CrossRef]
  12. Cox, H.L. Computation of initial buckling stress of sheet stiffener combinations. J. R. Aeronaut. Soc. 1954, 58, 634–638. [Google Scholar] [CrossRef]
  13. Martin, D.W.; Cox, H.L. The buckling modes of longitudinally stiffened at panel. Aeronaut. Q. 1963, 14, 346–398. [Google Scholar] [CrossRef]
  14. Chen, N.-Z.; Soares, C.G. Reliability assessment of post-buckling compressive strength of laminated composite plates and stiffened panels under axial compression. Int. J. Solids Struct. 2007, 44, 7167–7182. [Google Scholar] [CrossRef]
  15. Khedmatia, M.R.; Edalat, P. A numerical investigation into the effects of parabolic curvature on the buckling strength and behaviour of stiffened plates under in-plane compression. Lat. Am. J. Solids Struct. 2010, 7, 249–264. [Google Scholar] [CrossRef]
  16. Liu, X.; Chung, K.-F.; Huang, M.; Wang, G.; Nethercot, D.A. Thermomechanical parametric studies on residual stresses in S355 and S690 welded H-sections. J. Constr. Steel Res. 2019, 160, 387–401. [Google Scholar] [CrossRef]
  17. Cao, X.; Wang, H.; Chen, Y.; Shen, S.; Tao, Z.; You, M.; Kim, S.-E.; Kong, Z. Experimental and numerical study of residual stresses in 550 MPa high strength steel welded angle sections. Structures 2023, 56, 104907. [Google Scholar] [CrossRef]
  18. Li, Y.; Xue, J.; Qi, L.; Wang, X.; Yuan, Z.; Xue, G. Residual stress model of welded steel L-shaped and T- shaped sections. J. Constr. Steel Res. 2024, 218, 108724. [Google Scholar] [CrossRef]
  19. Shin, D.K.; Van Dat, B.; Kim, K. Compressive strength of HPS box girder flanges stiffened with open ribs. J. Constr. Steel Res. 2014, 95, 230–241. [Google Scholar] [CrossRef]
  20. Rahbar-Ranji, A. Effective breadth/web concept for elastic coupled buckling analysis in flat-bar stiffened plates. Eng. Struct. 2014, 80, 316–322. [Google Scholar] [CrossRef]
  21. Rahbar-Ranji, A. Eigenvalue Analysis of Flexural-torsional Buckling of Angle-bar Stiffened Plates. Int. J. Steel Struct. 2016, 16, 823–830. [Google Scholar] [CrossRef]
  22. Sadamoto, S.; Tanaka, S.; Taniguchi, K.; Ozdemir, M.; Bui, T.Q.; Murakami, C.; Yanagihara, D. Buckling Analysis of Stiffened Plate Structures by an Improved Meshfree Flat Shell Formulation. Thinwalled Struct. 2017, 117, 303–313. [Google Scholar] [CrossRef]
  23. Khalaf, H.I.; Chodorowska, D.; Al-Sabur, R.; Kubit, A.; Macek, W. Comprehensive exploration of technological tensioning effects in welded thin plate girders: An in-depth investigation. J. Braz. Soc. Mech. Sci. Eng. 2024, 46, 572. [Google Scholar] [CrossRef]
  24. JTG D64-2015; Code for Design of Highway Steel Structure Bridge. China Communications Press: Beijing, China, 2015.
  25. Qingtian, S. Study on the Mechanical Characteristics and Failure Mechanism of Steel Pylon of Cable-Stayed Bridge. Ph.D. Thesis, Tongji University, Shanghai, China, 2003. [Google Scholar]
  26. Shi, G.; Ban, H.Y.; Bijlaard, F.S.K. Tests and numerical study of ultra-high strength steel columns with end restraints. J. Constr. Steel Res. 2012, 70, 236–247. [Google Scholar] [CrossRef]
  27. Ma, T.Y.; Hu, Y.F.; Liu, X.; Li, G.Q.; Chung, K.F. Experimental investigation into high strength Q690 steel welded H-sections under combined compression and bending. J. Constr. Steel Res. 2017, 138, 449–462. [Google Scholar] [CrossRef]
  28. Zhao, Q.; Chen, P.; Zhang, J. Local Stability Test and Design Method for Steel Bridge Plate Stiffeners. China J. Highw. Transp. 2022, 35, 49–61. [Google Scholar]
  29. Zhao, Q.; Chen, P.; Zhang, J. Experimental Study on Overall Stability of I-rib Stiffened Plate Under Compression. J. Basic Sci. Eng. 2023, 31, 1297–1311. [Google Scholar]
  30. GB 50017-2017; Steel Structure Design Standard. China Construction Industry Press: Beijing, China, 2017.
  31. Eurocode 3; Design of Steel Structures-Part 1–5: Plated Structural Elements. European Committee for Standardization (CEN): Brussels, Belgium, 2005.
  32. JRA-2017; Road and Bridge Demonstration Book-Tongjie (II Steel Bridge). March 14 Years of Pingcheng. Japan Road Association: Tokyo, Japan, 2017.
  33. Translation of Steel and Light Structure Laboratory, Tongji University. American Steel Structure Design Manual; Tongji University Press: Shanghai, China, 2006; Volume I. [Google Scholar]
Figure 1. Specimen diagram.
Buildings 15 01474 g001
Figure 2. Loading setup.
Buildings 15 01474 g002
Figure 3. Geometric defect measurement.
Buildings 15 01474 g003
Figure 4. Residual stress test.
Buildings 15 01474 g004
Figure 5. Residual stress.
Buildings 15 01474 g005
Figure 6. ES-240-240 test phenomenon.
Buildings 15 01474 g006
Figure 7. ES-240-4200 test phenomenon.
Buildings 15 01474 g007
Figure 8. Compression curve.
Buildings 15 01474 g008
Figure 9. Finite element model.
Buildings 15 01474 g009
Figure 10. Comparison results of ES-240-4200.
Buildings 15 01474 g010
Figure 11. Comparison results of ES-240-240.
Buildings 15 01474 g011
Figure 12. Comparison of the load–displacement curves of the specimens.
Buildings 15 01474 g012
Figure 13. Stiffened box column finite element model.
Buildings 15 01474 g013
Figure 14. Influence of initial curvature on axial ultimate average stress.
Buildings 15 01474 g014
Figure 15. Influence of initial eccentricity on axial ultimate average stress.
Buildings 15 01474 g015
Figure 16. Influence of welding residual stress on NSs.
Buildings 15 01474 g016
Figure 17. Influence of welding residual stress on Ss.
Buildings 15 01474 g017
Figure 18. Axial average stress–displacement curves of models and changes in the load position.
Buildings 15 01474 g018
Figure 19. Axial stress in midspan (unit: MPa).
Buildings 15 01474 g019
Figure 20. Calculation results for box-shaped overall stability members.
Buildings 15 01474 g020
Figure 21. Comparison of column curves in different countries.
Buildings 15 01474 g021
Table 1. Design size of the two specimens.
SpecimenLength (mm)D (mm)B (mm)td (mm)tb (mm)
ES-240-2402402401601010
ES-240-420042002401601010
Table 2. Dimensions of the stiffened and unstiffened box section models.
ModelDm (mm)td (mm)Bm (mm)tb (mm)Rib Height (mm)Rib Thickness (mm)L (mm)Slenderness Ratio
NS-62401016010//4006
NS-612401016010//420061
NS-1172401016010//8000117
NS-1722401016010//11,800172
S-6240101601080812006
S-61240101601080812,00061
S-117240101601080823,000117
S-172240101601080833,800172
Table 3. Stiffened steel box calculation model size.
tb (mm)Bm (mm)ts (mm)hs (mm)td (mm)Dm (mm)L × 10 (m)Number
10160/200//10/12/16/18/20200/250/300/350/400/500/6000.25/0.3//0.4/0.45/0.75/0.9/1.05/1.2396
12250//10/12/16/18/20250/300/350/400/500/6000.25/0.3//0.4/0.45/0.75/0.9/1.05/1.2225
16300//10/12/16/18/20300/350/400/500/6000.25/0.3//0.4/0.45/0.75/0.9/1.05/1.2162
20300/35012/16120/16020/25/30/36/40400/500/600/700/800/9000.25/0.3//0.4/0.45/0.75/0.9/1.05/1.2468
254002020020/25/30/36/40400/500/600/700/800/900/10001/1.5/2/2.5/3/3.75/4.5/6/7.5270
304502020020/25/30/36/40400/500/600/700/800/900/10001/1.5/2/2.5/3/3.75/4.5/6/7.5270
Grand total1791
Disclaimer/Publisher’s Note: The statements, opinions and data contained in all publications are solely those of the individual author(s) and contributor(s) and not of MDPI and/or the editor(s). MDPI and/or the editor(s) disclaim responsibility for any injury to people or property resulting from any ideas, methods, instructions or products referred to in the content.

