Article

Scenario Testing of the Energy and Environmental Performance of “The Glasgow House”

Mackintosh Environmental Architecture Research Unit, Glasgow School of Art, 167 Renfrew Street, Glasgow G36RQ, UK
*
Author to whom correspondence should be addressed.
Buildings 2014, 4(3), 580-604; https://doi.org/10.3390/buildings4030580
Submission received: 25 April 2014 / Revised: 15 August 2014 / Accepted: 3 September 2014 / Published: 22 September 2014
(This article belongs to the Special Issue Low Carbon Housing Design: Selected Papers from 2013 PLEA Conference)

Abstract

:
This paper describes the results from a 12-month study of two prototype low energy dwellings built for Glasgow Housing Association (GHA). The houses are intended for mainstream and social tenure within Glasgow and contain a range of energy reducing features including one house with a thermally heavy clay block wall and one house using a conventional timber frame and both houses have sunspaces, Mechanical Ventilation with Heat Recovery (MVHR), solar thermal system and low energy lighting. The dwellings have been subject to an innovative monitoring strategy by MEARU, whereby test occupants (students recruited from the School of Architecture) have been asked to inhabit the buildings for six two-week periods using occupancy ‘scripts’ that determine their internal behaviour. The scenarios thus simulate varying patterns of occupancy in both houses simultaneously and the performance of the houses can then been compared. Indications are that although the clay block house had a poorer thermal performance, it did have other qualitative advantages, and consumption differences could be eliminated by exploiting the thermal mass. The performance of the active systems, including the MVHR system, was found to be problematic, and specific scenarios were undertaken to explore the implications of this.

Graphical Abstract

1. Introduction

It seems extraordinary given the level of investment in housing and its importance, not only to contemporary objectives of climate change and sustainability, but also the everyday lives of people who live in them in terms of comfort, health and satisfaction, that its performance is not systematically evaluated. Of even greater concern is that when such evaluation does take place it is becoming increasingly apparent that a performance gap exists between predicted and actual energy use [1,2,3,4] with energy use varying by up to five times predictions [5]. The scale of this gap could undermine the carbon reduction milestones and timelines set forth by public policy [6] as buildings’ operational energy demands account for nearly half of carbon emissions in the UK [7].
Furthermore, questions are arising about the environmental performance of housing in the context of energy reduction. For example, research has highlighted the possible consequences on indoor air quality of greater airtightness [8,9]. As health and well-being are likely to remain as significant agendas for building occupants and landlords, there could be a significant risk for the energy reduction agenda if low energy homes become associated with problems of discomfort or health.
In assessing the performance of housing there are also ethical dimensions that are rarely considered. Monitoring of occupied houses can be problematic, both in terms of access, but also confounding occupancy variables, and techniques are not yet sufficiently well-developed [10]. Discussion of poor energy performance frequently refers to effects of occupancy, sometimes characterised as “misuse” [11]. However, a converse view is that people live in buildings that are in effect experiments, and so are the subjects of these trials. The resulting question is: what are the effects of buildings on occupants? There is clearly a moral, ethical and ultimately a professional responsibility on those who produce these buildings, as clients, designers and contractors to ensure that they function well and that there are no unintended negative consequences.
This paper describes the results of a study undertaken on the “Glasgow House”, funded under the UK Technology Strategy Board (TSB) Building Performance Evaluation (BPE) programme, which used test occupants recruited from students at the Mackintosh School of Architecture (MSA) to examine the performance of these houses.

2. Description of the Development

The “Glasgow House” is a prototype reduced energy dwelling developed by Glasgow Housing Association (GHA), one of the largest landlords in Europe. It is an attempt to develop a new model of low energy, flexible, affordable housing that would be a solution for both social and private rented sectors, and housing for sale. In May 2009, GHA commissioned a house design that would use passive principles along with tried, tested, simple and low maintenance technologies to reduce heating and hot water bills for GHA tenants to £100 a year. The aim was to provide an exemplar house that could be delivered on a large scale in housing development and regeneration projects throughout the city.
The final design incorporated high levels of thermal efficiency using a clay block with external insulation to provide thermal mass, highly insulated roof cassettes and high performance windows, airtight construction, sunspaces, solar thermal hot water collectors, mechanical ventilation heat recovery (MVHR), low energy lighting and high efficiency appliances. Whilst the intention was not to achieve Passivhaus standard, the performance was to get as close to this as possible within the increasingly rigid cost constraints facing the social housing sector. In the summer of 2010, GHA undertook to construct two pilot dwellings to examine issues of buildability, affordability and performance (Figure 1). Due to unfamiliarity with the clay block system, a decision was made to also construct two spatially identical houses using a more conventional highly insulated timber frame system which is the standard form of construction used by GHA’s development partner organisation City Building LLP.
Figure 1. The Glasgow House: Plots 1 and 2 (left); Plots 3 and 4 (right).
Buildings 04 00580 g001
There are four houses, two of each construction type, two of which are complete, the other two left unfinished to show construction systems. (Plot 1, Clay block complete; Plot 2, Clay block incomplete; Plot 3, Timber frame complete; Plot 4, Timber Frame incomplete). These were built at the Skills Academy in Norfolk Street. Glasgow, utilising trainee and apprentice construction workers, and are available for site visits for interested professionals and users.
The dwellings are three-storey semi-detached townhouses (Figure 2). Accommodation comprises entrance lobby, hall, open plan living/kitchen/dining, sunspace, and utility room on the ground floor, three bedrooms and bathroom on the first floor and one bedroom and plant/store on the second floor. They have been orientated on an east-west axis. This was deliberate and was intended to examine a non-optimum orientation that may be required in future developments.
The clay block wall system has a 6 mm render, 100 mm insulation, 365 mm clay block and 12 mm mineral plaster. The timber frame is 100 mm brickwork, 60 mm cavity, breather membrane on 9 mm Oriented Strand Board (OSB) sheathing board, 145 mm insulation between studs and 37.5 mm insulated plasterboard with 25 mm insulation (Figure 3). Roof construction is prefabricated timber cassettes filled with 300 mm insulation finished with rubber slates on Plots 1 and 2, and conventional slates on Plots 3 and 4. Heating in both dwellings is by means of a conventional gas-fired central heating system, with a 28 kW condensing boiler located in the ground floor utility room, serving radiators, fitted with TRV’s in each apartment. There is a programmer located at the boiler and a thermostat located in the ground floor hall space. This was a conscious decision to avoid a radically different heating system that would not be familiar to occupants. The boiler supplies a thermal store for hot water located in the top floor plant space and this is supplemented by a solar thermal hot water heating system. Panels are located on both the east and west facing roof slopes. The dwellings also have an MVHR system that extracts from the kitchen (not from the cooker hood which is recirculating unit only) and both bathrooms/utility spaces. The unit is located in the loft space and uses 100 mm flexible ducting supplying air to registers in the ceilings of the living room and bedrooms. Both houses have sunspaces located off the living rooms. As well as providing amenity value, these are also intended to act as buffer and ventilation pre-heat spaces. There are no undercuts to doors, and no trickle vents in any rooms except the attic space bedroom windows.
Figure 2. Floor plans.
Buildings 04 00580 g002
Figure 3. Plot 1 (left) and Plot 3 (right) wall construction.
Buildings 04 00580 g003

2.1. The Monitoring Study

As the buildings were not available for sale or tenure they provided a unique opportunity to make a side-by-side comparison of two alternative forms of construction in otherwise identical designs, and to undertake a study of their relative performance under a range of controlled occupancy conditions. So rather than examining similar houses under varying occupancies, which is normally the case, this study examines different houses under identical controlled occupancies. Following completion of the dwellings, a pilot study was undertaken by the Mackintosh Environmental Architecture Research Unit (MEARU) on behalf of GHA during February of 2011 to test the feasibility of a comparative performance analysis of the dwellings. Following this, funding was received from the Technology Strategy Board (TSB) Building Performance Evaluation (BPE) programme. The study, conducted between January 2011 and March 2012, undertook a standard TSB BPE Phase 1 analysis for both houses, which includes: airtightness testing; a co-heating test; U-value testing; thermography; MVHR testing. This was followed by a series of six occupancy studies that used varying occupancy regimes that tested the environmental performance of the houses and users perceptions of comfort and environmental quality.
Commissioning checks revealed some problems with the active systems, in particular a failure of the solar thermal system in Plot 1. As this is a roof integrated unit, replacement of the unit would have required roof works, and so both units were disabled for the scenario tests. Defects were also found with the MVHR system and these are discussed in the Environmental Performance section.

2.2. Scenario Testing

The scenarios were generally two-week periods of occupancy during which both houses were inhabited by volunteer residents (n = 4 in each house), recruited from students at the MSA. The occupants were given an occupancy script that determined their general activity. Care was taken to ensure identical occupancy and behaviour in both houses. Information was collected through ticksheets and diaries about their detailed activity, such as cooking, window opening, frequency of shower use, etc. Qualitative assessment was undertaken during the occupancy scenarios, including surveys, interviews and comfort polling which was used to assess thermal comfort and air quality.
Over the specified time periods, internal temperature (°C), relative humidity (%) and CO2 concentration (ppm) was monitored in all apartments, kitchens and utility rooms of both dwellings. Measurements of these parameters were made at 1-min intervals using Eltek GD-47 transmitters and recorded as a 5-min mean value on Eltek RX250AL data loggers. In the case of sunspaces and bathrooms, due to the limitations of access to mains power supply, temperature and relative humidity only were monitored using Gemini Tinytag Ultra data loggers with data synchronised to the same time intervals as the Eltek equipment. No specific sub metering was used in the project so comparative assessment of energy use was based on mains gas and electricity consumption over the course of the monitoring period. Data loss due to logger failure occurred during week 1 of SC5, and energy consumption data was lost in SC6.
These regimes were based on occupancy profiles derived from other monitoring projects undertaken by MEARU, common to housing stock owned by GHA, but also investigated some issues that arose during the project, for example the impacts of the MVHR system:
  • SC1 (2–16 December 2012). A standard occupancy based on Standard Assessment Procedure (SAP) assumptions—intended to provide a base case and comparison with SAP assumptions about occupancy. Four occupants, heating on 07:00–09:00 and 19:00–23:00, TRVs at 2, thermostat at 18 °C. Not occupied during the day. Window opening restricted, and recorded.
  • SC2 (12–26 March 2013). Standard occupancy, with variation in the use of the MVHR system to test the effects of disabling the MVHR system in a reasonably airtight house. Four occupants, heating on 07:00–09:00 and 19:00–23:00, TRVs at 2, thermostat at 20 °C. Week 1 MVHR filters had 50% occlusion; Week 2 the MVHR system was turned off. Window opening restricted, and recorded.
  • SC3 (16–23 April 2013). Continuous daytime occupancy simulating the effects of an extended occupancy period, for example older people or unemployed. Two occupants, same heating regime as SC2, but occupied constantly.
  • SC4 (13–27 August 2013). Originally, summer occupancy but revised to unoccupied testing looking at sunspace and thermal mass identifying the benefits in terms of heating and temperature stability. No heating or occupancy, MVHR system running in normal mode.
  • SC5 (8–19 October 2013) Examination of continuous vs. intermittent heating regime—comparing the relative performance of a continual low level heating regime versus a standard intermittent two-period regime. Four occupants, restricted window opening. Week 1 heating on 07:00–09:00 and 17:00–23:00. Thermostat was set to 20 °C and all radiator TRVs were set to 4. Week 2 heating on 07:00 and 23:00 with the thermostat retained at 20 °C and all TRVs set to “2”.
  • SC6 (19–30 November 2013). Comparison of natural vs. mechanical ventilation regimes—comparing one week with MVHR only with a second week using natural ventilation only. Heating as SC2. Week 1 MVHR only, restricted window opening. Week 2 MVHR disabled and window opening allowed.
Information on a number of the dwelling characteristics and building systems were revealed through the scenario testing. Some scenarios provided more useful data than others and some technical issues were encountered, for example intermittent failure of logging equipment, and the summer scenario was hampered by very poor summer weather and focused instead on the sunspace. In this paper, information is taken across the scenarios to make comparison of the issues affecting the thermal and environmental performance of the dwellings.

3. Energy Consumption

The original target figure for energy for space and water heating was 20 kW·h/m2 for both houses. Annual measured consumption was 89 kW h/m2 for Plot 1 and 67 kW·h/m2 for Plot 3, however these figures do not account for uncontrolled occupancy outwith the scenarios or other differences, for example the failure of the solar thermal system in Plot 1 that resulted in both systems being turned off.
The scenarios provided a much more accurate comparison of the relative consumption of the two houses. In energy terms, Plot 3 consumed less energy than Plot 1 during all the scenarios except SC5. In the base case, SC1 that used a standard SAP regime, this was 3.15 kW·h/m2 in Plot 1 and 2.10 kW·h/m2 in Plot 3. This relative performance in terms of fabric was confirmed in a whole house fabric heat loss (co-heating) test conducted on both houses simultaneously (using electrical resistance heating to maintain a continuous temperature of 25 °C), in which Plot 1 used 1.53 kW·h/m2 and Plot 3 used 1.26 kW·h/m2. Given that the tested airtightness was reasonably close and there is identical roof and floor construction, the differences are therefore likely to be primarily due to varying wall fabric performance. In these houses, additional heat loss would occur through the party walls to Plots 2 and 4, which are unheated.
The design U-value for the project was originally considered as 0.15 W/m2·K and was derived from project specifications and drawings. Using as-built construction information gave a theoretical design performance of 0.17 W/m2·K. Testing initially undertaken in April 2012 gave a result for the through wall construction of 0.32 W/m2·K in Plot 1 and it was evident that this result warranted further investigations. Repeat testing in November 2012 initially indicated a figure of 0.27 W/m2·K. When the full data set was checked, the test did not pass the assessment relative to the 5% accepted error of International Organization for Standardization (ISO) 9869 and the calculated R-value was highly uncertain. However, towards the end of the test period the resistance values can be seen to stabilize (Figure 4), and it was found that using the last 3 days of data created a data set which met all the test criteria.
Figure 4. U-value test—thermal resistances.
Buildings 04 00580 g004
This gave U-values for the walls of 0.23 W/m2·K for plot 1, and 0.18 W/m2·K for Plot 3—both 0.17 W/m2·K design values. It is unclear exactly why the thermal resistance profile takes so long to reach a point of stability but it is likely to be the result of a combination of the prevailing weather conditions, heat regime within the house (noting the properties were not occupied throughout) and thermal mass effects (although these are accounted for in the calculations). Plot 1 walls remain 26% higher than the design values. Possible explanations for this could include test error, effects at block edges, filling of end joints and thicker mortar joints (noted in the adjacent Plot 2), dynamic effects due to the mass or the proximity to a window opening, or possible moisture absorption in the external insulation, and are subject to on-going investigation. It is noted that previous whole wall tests on similar construction have produced comparable results [10], however certification obtained from the German Institute of Construction Technology confirmed the measured conductivity of the blocks as 0.11 W/m·K.
Nevertheless, overall thermal integrity was good in both houses. Thermographic imaging revealed some weakness, particularly at windows and window openings and doors, particularly seals (Figure 5).
Figure 5. Thermal weaknesses at window openings. (a) Dormer window external thermographic image; (b) Dormer window internal thermographic image; (c) Construction of the dormer detail; (d) Internal view of finished dormer window.
Buildings 04 00580 g005
The relative airtightness of the houses (Table 1) is also similar although it is noted that there has been a decrease in airtightness performance of 25% in Plot 1 and 15% in Plot 3 in the two years since the houses were first constructed.
Table 1. Air permeability test results.
TestTest DatePressurisation (m3/h/m2 @ 50 Pa)Depressurisation (m3/h/m2 @ 50 Pa)Mean Value (m3/h/m2 @ 50 Pa)March/April 2012 Final Mean ValueNovember 2010 Mean Value (m3/h/m2 @ 50 Pa)
P1-Test 127 March 20123.454.804.134.033.02
P1-Test 210 Aril 20123.284.593.93
P3-Test 127 March 20123.174.934.054.063.47
P3-Test 210 Aril 20123.274.854.06
The possibility of exploiting the thermal mass of Plot 1 was examined in SC5, which tested different heating regimes. In this scenario, a two-period heating regime with higher thermostat settings (07:00–09:00 and 17:00–23:00, TRVs 4, 20 °C thermostat) in week 1 was compared to a one-period heating regime with lower settings (07:00–23:00, TRVs 2, 20 °C thermostat) in week 2.
This appeared to be beneficial in the case of the more thermally massive construction of Plot 1—i.e., the dwelling could be heated at a low level during the day with the heat being absorbed by thermal mass and then being released back to the space during the periods of occupation. In this case, consumption was closer to that of Plot 3, and less than in the previous week, despite lower external temperatures (Table 2). This is similar to the relatively better performance of Plot 1 during the co-heating test, which requires a continuous internal temperature of 25 °C.
Table 2. Energy consumption SC1, co-heating and SC5, week 1 and week 2.
Test typeExternal Temperature.Plot 1 (kW·h/m2)Plot 3 (kW·h/m2)P1:P3
Scenario 1 (2 weeks)1.0 °C3.652.101.73
Co-heating Test (1 week)7.0 °C1.541.261.22
Scenario 5 (Week 1)8.6 °C0.310.221.45
Scenario 5 (Week 2)6.8 °C0.290.281.05

4. Environmental Performance

4.1. Ventilation

In these studies, CO2 is being used as an indicator of ventilation rates. Levels of CO2 correlate well with human occupancy and levels above 1000 ppm are indicative of poor ventilation rates. The provenance of this is well evidenced [12] and corresponds to a ventilation rate of 8 L/s per person [13,14]. This figure is also cited in a review of literature looking at the associations between ventilation rates and CO2 levels with health outcomes, which concluded: “Almost all studies found that ventilation rates below 10 L/s per person in all building types were associated with statistically significant worsening in one or more health or perceived air quality outcomes” [15]. Associations between health and CO2 levels have been found in office buildings [16] and associations between CO2 levels and Total Volatile Organic Compounds (TVOCs) have been identified [17]. Wargoki notes associations between CO2 levels and health and concludes: “The ventilation rates above 0.4 ac/h or CO2 below 900 ppm in homes seem to be the minimum level to protect against health risks based on the studies reported in the scientific literature” [18].
A particular area of investigation therefore concerned ventilation and indoor air quality. Whilst it has been shown that MVHR can achieve energy reduction [19], good air quality and associated health benefits [20], recent research has identified a number of problems in relation to MVHR systems [21].
In the pilot study conducted in 2011, a number of defects were identified in the MVHR system. These included crushed and damaged ducts, additional bends, a high amount of 100 mm flexible ducting being used, debris in the duct from construction, filters being dirty (Figure 6), and the unit being connected using the horizontal spigots, which restrict airflow. The system had been re-commissioned prior to SC1, with some remedial work undertaken, but some areas of ductwork were inaccessible and could not be replaced or repaired.
Figure 6. Mechanical Ventilation with Heat Recovery (MVHR) filters, dirt accumulation between scenarios.
Buildings 04 00580 g006
Airflow testing of the MVHR was undertaken and the results are shown in Table 3. This clearly shows that the systems remain out of balance, which will reduce the system efficiency. In addition to problems with the system itself, there are no door undercuts and therefore no means of enabling airflow through the building when bedroom or bathroom doors are closed.
Table 3. Measured MVHR airflow rates.
RoomPlot 1Plot 3
Extract PositionsHigh Rate (L/s)Low Rate (L/s)High Rate (L/s)Low Rate (L/s)
Utility/WC7.235.499.235.64
Kitchen9.816.8112.118
Bathroom9.36.38.265.35
Total26.3418.629.618.99
Supply PositionsHigh Rate (L/s)Low Rate (L/s)High Rate (L/s)Low Rate (L/s)
Living Room5.644.517.277.34
Bedroom 19.317.458.698.64
Bedroom 28.136.236.536.9
Bedroom 37.85.963.884.26
Attic Room8.426.697.277.48
Total39.330.8433.6434.62
Difference12.9812.244.0415.63
Of note are the values for individual rooms compared with a desired ventilation rate of 8 L/s per person. Given that most rooms could reasonably be expected to have several occupants, this provision appears deficient. There is no other provision for background ventilation in the dwelling, so concerns were raised about consequences should the MVHR system fail or be disabled. Furthermore, the location of the unit in the loft will compromise regular and effective filter cleaning and general maintenance. It was also found that the filters quickly became dirty between scenarios, a period of weeks rather than months.
The effects of blockage and system failure were investigated in SC2, when the system was first occluded (simulating filter blockage) in week 1, and then turned off in week 2. Occupants were asked not to open windows during this period.
Whilst on the one hand this may seem like an extreme scenario, in fact there are a number of circumstances in which this may reflect real life. Firstly, there is evidence of MVHR systems being disabled for a number of reasons, including noise, lack of understanding and concerns over energy use [22,23]. Secondly, contemporary housing achieving greater airtightness still relies on trickle vents, which are frequently closed. A recent survey of 200 post-2010 regulation houses by the authors found that 80% kept trickle vents closed in the winter. Thirdly, in TSB BPE projects currently being monitored in Scotland, 12 out of 21 dwellings (57%) have “overshot” the building standards requirement (for mechanical ventilation) of 5 m3/h·m2, but do not have the required mechanical ventilation provision [24].
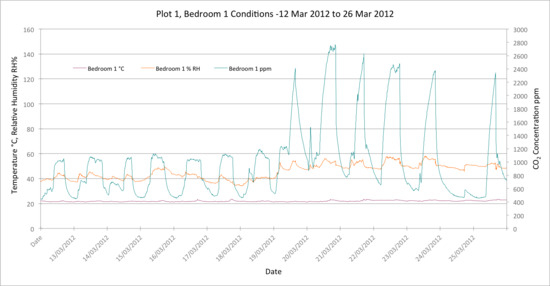
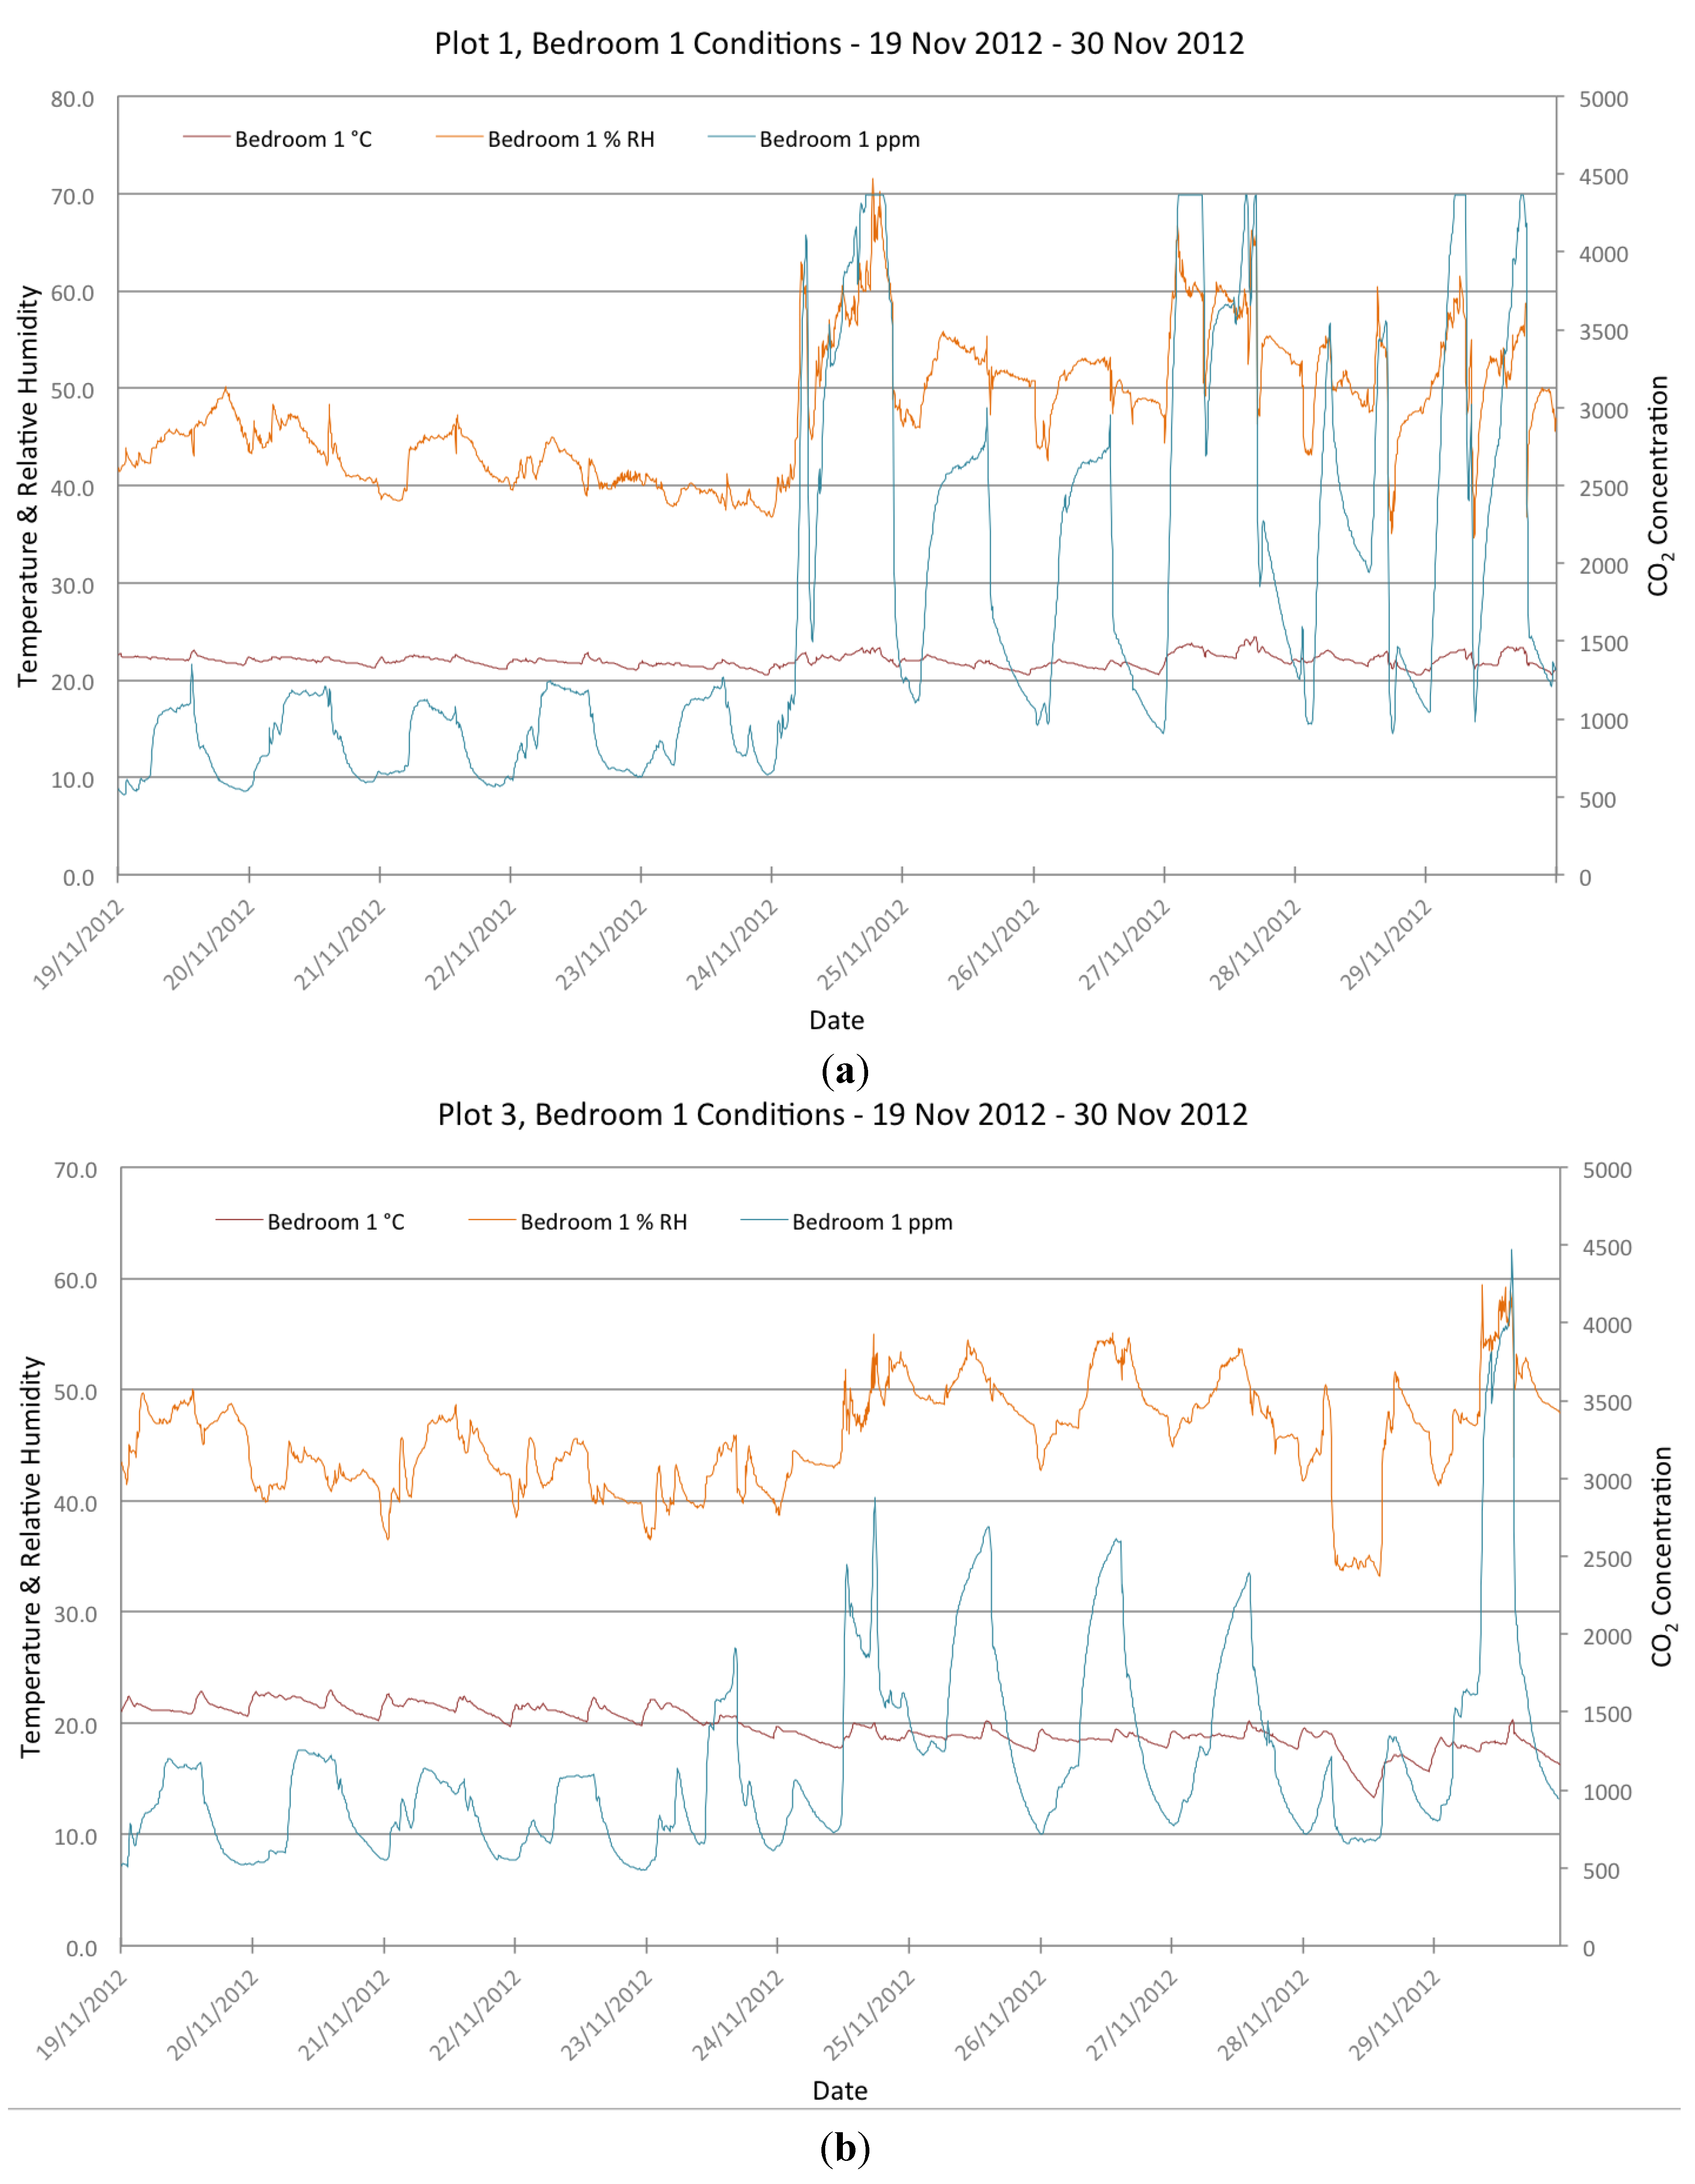
Conditions deteriorated in all apartments, but the effects were most marked in the bedrooms (Figure 7 and Figure 8). During the first week of occupation, the same diurnal relationship of CO2 concentration and RH is evident through all apartments. In general, the peaks in CO2 concentration are comparable to those seen in SC1 and this suggests that the impact on performance of the 50% occlusion is limited. Higher CO2 levels are noted in the attic room, which had two occupants (Figure 7). Measured airflow in this period was similar to the un-occluded period, suggesting that fan speed is increased (with a consequent energy penalty). In week 2, when the system was disabled, the impact on CO2 is far more pronounced. The peaks in CO2 concentration reach levels, particularly in bedrooms, that are indicative of very poor ventilation rates. This also extends to include water vapor as RH levels are seen to incrementally increase independent of the internal temperature.
In SC6, this problem was revisited, with more detailed investigation of effects on user comfort and perception, when comparing MVHR use with natural ventilation. In week 1, the dwellings were reliant on the MVHR system and in week 2 the system was again disabled, but window opening was allowed.
It is apparent that there is a marked deterioration in mean CO2 levels in the dwellings between the two weeks (Table 4). The living room effects are apparent where peaks of CO2 are experienced during periods of high occupancy, but adaptive behaviour leading to window opening mitigates these (Figure 9). However, the difference is marked when comparing the bedrooms, in which week 2 conditions are very much worse (Figure 10).
Occupant perception of air quality in both dwellings and over both weeks is perceived as being generally good by the residents with values close to “4” with low standard deviation consistently achieved (Table 5). Between the two weeks, there is very little change in perception of IAQ in Plot 3 while in Plot 1 the IAQ is seen to be less stuffy.
Figure 7. (a) CO2 temp and RH levels SC2, Plot 1, Bedroom 1; (b) CO2 temp and RH levels SC2, Plot 3, Bedroom 1.
Buildings 04 00580 g007
Figure 8. (a) CO2 temp and levels SC2, Plot 1, Bedroom 4 (attic); (b) CO2 temp and RH levels SC2, Plot 3, Bedroom 4 (attic).
Buildings 04 00580 g008
Table 4. Whole house mean CO2 concentration SC6.
PeriodMean CO2 Concentration
Plot 1Plot 3
Week 1822.6 ppm939.0 ppm
Week 21422.2 ppm1371.6 ppm
Figure 9. (a) CO2 temp and RH levels SC6, Plot 1, Living room; (b) CO2 temp and RH levels SC6, Plot 3, Living room.
Buildings 04 00580 g009
Table 5. Mean occupant internal air quality perception, SC6.
PeriodMean Internal Air Quality Perception (standard deviation)
Plot 1Plot 3
Week 14.38 (0.14)4.75 (0.32)
Week 23.78 (0.22)4.79 (0.33)
Figure 10. (a) CO2 temp and RH levels SC6, Plot 1, Bedroom 1; (b) CO2 temp and RH levels SC6, Plot 3, Bedroom 1.
Buildings 04 00580 g010
In the bedrooms, an identical pattern to the first week of SC2 was observed, with very high CO2 levels recorded overnight. From the monitored data it is clear that the actual Indoor Air Quality (IAQ) was markedly worse during the second week; therefore, it is worth considering why the residents would not perceive this.
The obvious explanation is the model of adaptive comfort [25]; having the opportunity to ventilate directly made the occupants feel more in control and capable of altering the environment as they require. However, it would appear that this model does not apply to bedrooms overnight. Windows are not opened to ameliorate air quality—as might be expected, people who are asleep do not perceive and therefore act to change their environment. This is significant as not only are conditions very poor, but the occupants are exposed to them for long periods of time.

4.2. Humidity

The effects of ventilation on relative humidity may also be observed and mean, maximum and minimum values are shown in Table 6. In the scenarios, the occupants were the principal source of moisture, along with cooking and showers, the frequency of which was observed. There was no provision for clothes washing or drying in the properties.
Table 6. Relative humidity levels SC1 and SC2.
Room TypeSC1SC2
Plot 1 Plot 3Plot 1 Week 1Plot 1 Week 2Plot 3 Week 1Plot 3 Week 2
LivingMax77.4074.5042.3373.6053.4066.20
Mean41.9038.4036.3042.6038.1346.13
Min50.0446.3363.4042.6030.7036.80
Bed 1Max52.9059.2049.9058.1047.9056.60
Mean35.3038.1040.7250.5937.1446.20
Min42.1145.9134.1040.4030.3037.30
Bed 2Max55.7055.6049.7056.6046.4052.50
Mean37.8036.9041.2949.5537.2645.26
Min44.3143.4835.0040.8029.3037.30
Bed 3Max56.4061.2054.5066.3046.8056.00
Mean38.5039.1043.2751.1436.9644.31
Min44.6747.7835.6043.8029.7039.40
AtticMax54.0052.8055.7060.8048.0054.30
Mean38.0037.7045.0152.3638.9446.64
Min44.8544.9436.5020.4033.2037.70
Looking first at SC1, RH levels generally remain within a reasonable range, with a tendency toward lower RH, but there is a correlation between the underperformance of the MVHR system and indicative RH values. Mean RH is 41.90 with peaks of 77.40 in Plot 1 living room (which has a delivery rate of 4.51 L/s, compared to 38.40 with a maximum of 74.50 in Plot 3 living room (which has a delivery rate of 7.34 L/s). Similar trends are observed in the bedrooms, with worse delivery rates corresponding to higher RH levels.
This pattern is less conclusive in SC2. Given the interference with flow rates caused by the occlusion this might be expected. However, RH levels increase by an average of 20% when the MVHR is disabled in Week 2. Overall, RH levels remained with reasonable bounds under normal conditions.

4.3. Temperature

In the original pilot study, the standard regime had set TRVs to 4 and the thermostat was set to 21 °C. This was found to produce temperatures that were uncomfortably high, despite very cold external conditions (Figure 11) and there was an indication that the fabric of Plot 1 was becoming warm, with an increasing temperature profile during the week. To address this in the second week, the TRVs were set to 2 and the thermostat was set to 20 °C and the change in heating regime resulted in a more stable thermal environment.
However, despite the heating being controlled by TRVs and the thermostat, with no input from occupants, a rise in temperature in response to warmer external conditions is evident. This may suggest that the TRVs and thermostat are not exercising the degree of fine control that may be required to maintain thermal equanimity. The temperatures achieved in week 1 also suggest that the heating systems may be oversized for such thermally efficient dwellings, which if inadequately controlled would lead to overheating, or excessive energy use if (as was the case in the first week of the pilot study) occupants resorted to opening windows. Should the thermostat be set to higher temperatures and the TRVs turned to 5, very high temperatures would be achieved.
Figure 11. Pilot study, average temperatures Plot 1 and Plot 3.
Buildings 04 00580 g011
With the heating regimes that were set up in the test scenarios, the temperatures remained stable and at reasonable levels. In SC1 with TRVs set at 2 and the thermostat set at 18 C, temperatures were relatively cool, with living rooms having a mean of 15.83 °C for Plot 1 and 16.78 °C for Plot 3. The controls were adjusted for later scenarios with the thermostat at 20 °C. In SC3, which had a two period heating system, but continuous occupancy, living rooms had a mean of 20.31 °C in Plot 1 and 22.41 °C in Plot 3, and bedroom 1 had means of 21.58 °C in Plot 1 and 22.34 °C in Plot 3.
In SC5, which compared an intermittent heating regime in week 1 with a continuous heating in week 2, comfort polling asked residents to rate the thermal comfort at 8 pm each evening while in the dwelling. The ratings were based on a seven-point scale with 1 being much too cold and 7 much too warm, with a value of 4 identified as the “neutral” and most comfortable rating. This indicated that although both dwellings performed well, Plot 1 had an improved performance in the second week, despite the reduced energy consumption (Table 7). This outcomes underpins findings from other scenarios, which tended to rate Plot 1 as being more comfortable and less prone to overheating.
Table 7. Mean comfort levels SC5 week 1 and week 2.
Mean Thermal Comfort (standard deviation)Plot 1Plot 3
Week 14.48 (0.60)4.61 (0.35)
Week 24.18 (0.48)4.45 (0.47)
Effects on temperature due to the variation in ventilation regime were apparent in SC6. In the second week, there was a greater degree of window opening that appears to impact on temperature more in the thermally light Plot 3 than in Plot 1. In Plot 1, the living room had a mean temperature of 21.8 °C in week 1 and 21.4 °C in week 2. In Plot 3, the living room week 1 mean was 22.6 °C, which dropped to 19.8 °C in week 2. It is apparent that the fabric in Plot 1 retains its temperature with a more liberal window opening regime. Comparing the air and surface temperature in Figure 12 clearly shows the relationship and is indicative of the benefits of the thermal mass at maintaining temperature with greater ventilation. This would have important implications for comfort and energy consumption, particularly in conjunction with a low level continuous heating regime.
Figure 12. Comparison of air and surface temperatures SC6 (with MVHR vs. window opening).
Buildings 04 00580 g012
The effects of thermal mass in the sunspace were also examined in SC4 and have been reported previously [26]. In this scenario, an unoccupied profile was used to avoid incidental gains but the MVHR system was left running. The effect of thermal mass in the sunspaces was apparent (Figure 13). Due to an irony of construction, in Plot 1 the sunspace is finished with white render on rigid board insulation, whilst in Plot 3 it is finished with a dark brindle brick outer leaf. The sunspaces are double height and temperatures readings were taken at both the lower and upper floor and shown in Table 8.
Table 8. Comparison of Plots 1 and 3 sunspace mean, maximum and minimum temperature values at two altitudes.
LocationPlot 1Plot 3
Ground floorAbs Max47.9 °C40.4 °C
Abs Min21.8 °C23.4 °C
Mean26.1 °C27.1 °C
Max/Min Range26.1 °C17.1 °C
First floorAbs Max51.9 °C48.5 °C
Abs Min22.4 °C25.1 °C
Mean29.7 °C30.6 °C
Max/Min Range29.5 °C23.4 °C
Figure 13. SC4 sunspace temperatures ground floor/first floor Plot 1; ground floor/first floor Plot 3.
Buildings 04 00580 g013
At present, there is no effective means of utilising these gains. There is no vent between the sunspace and the living or bedrooms, and so the only way to ensure air movement would be to open the door to these spaces, a relatively uncontrolled strategy.
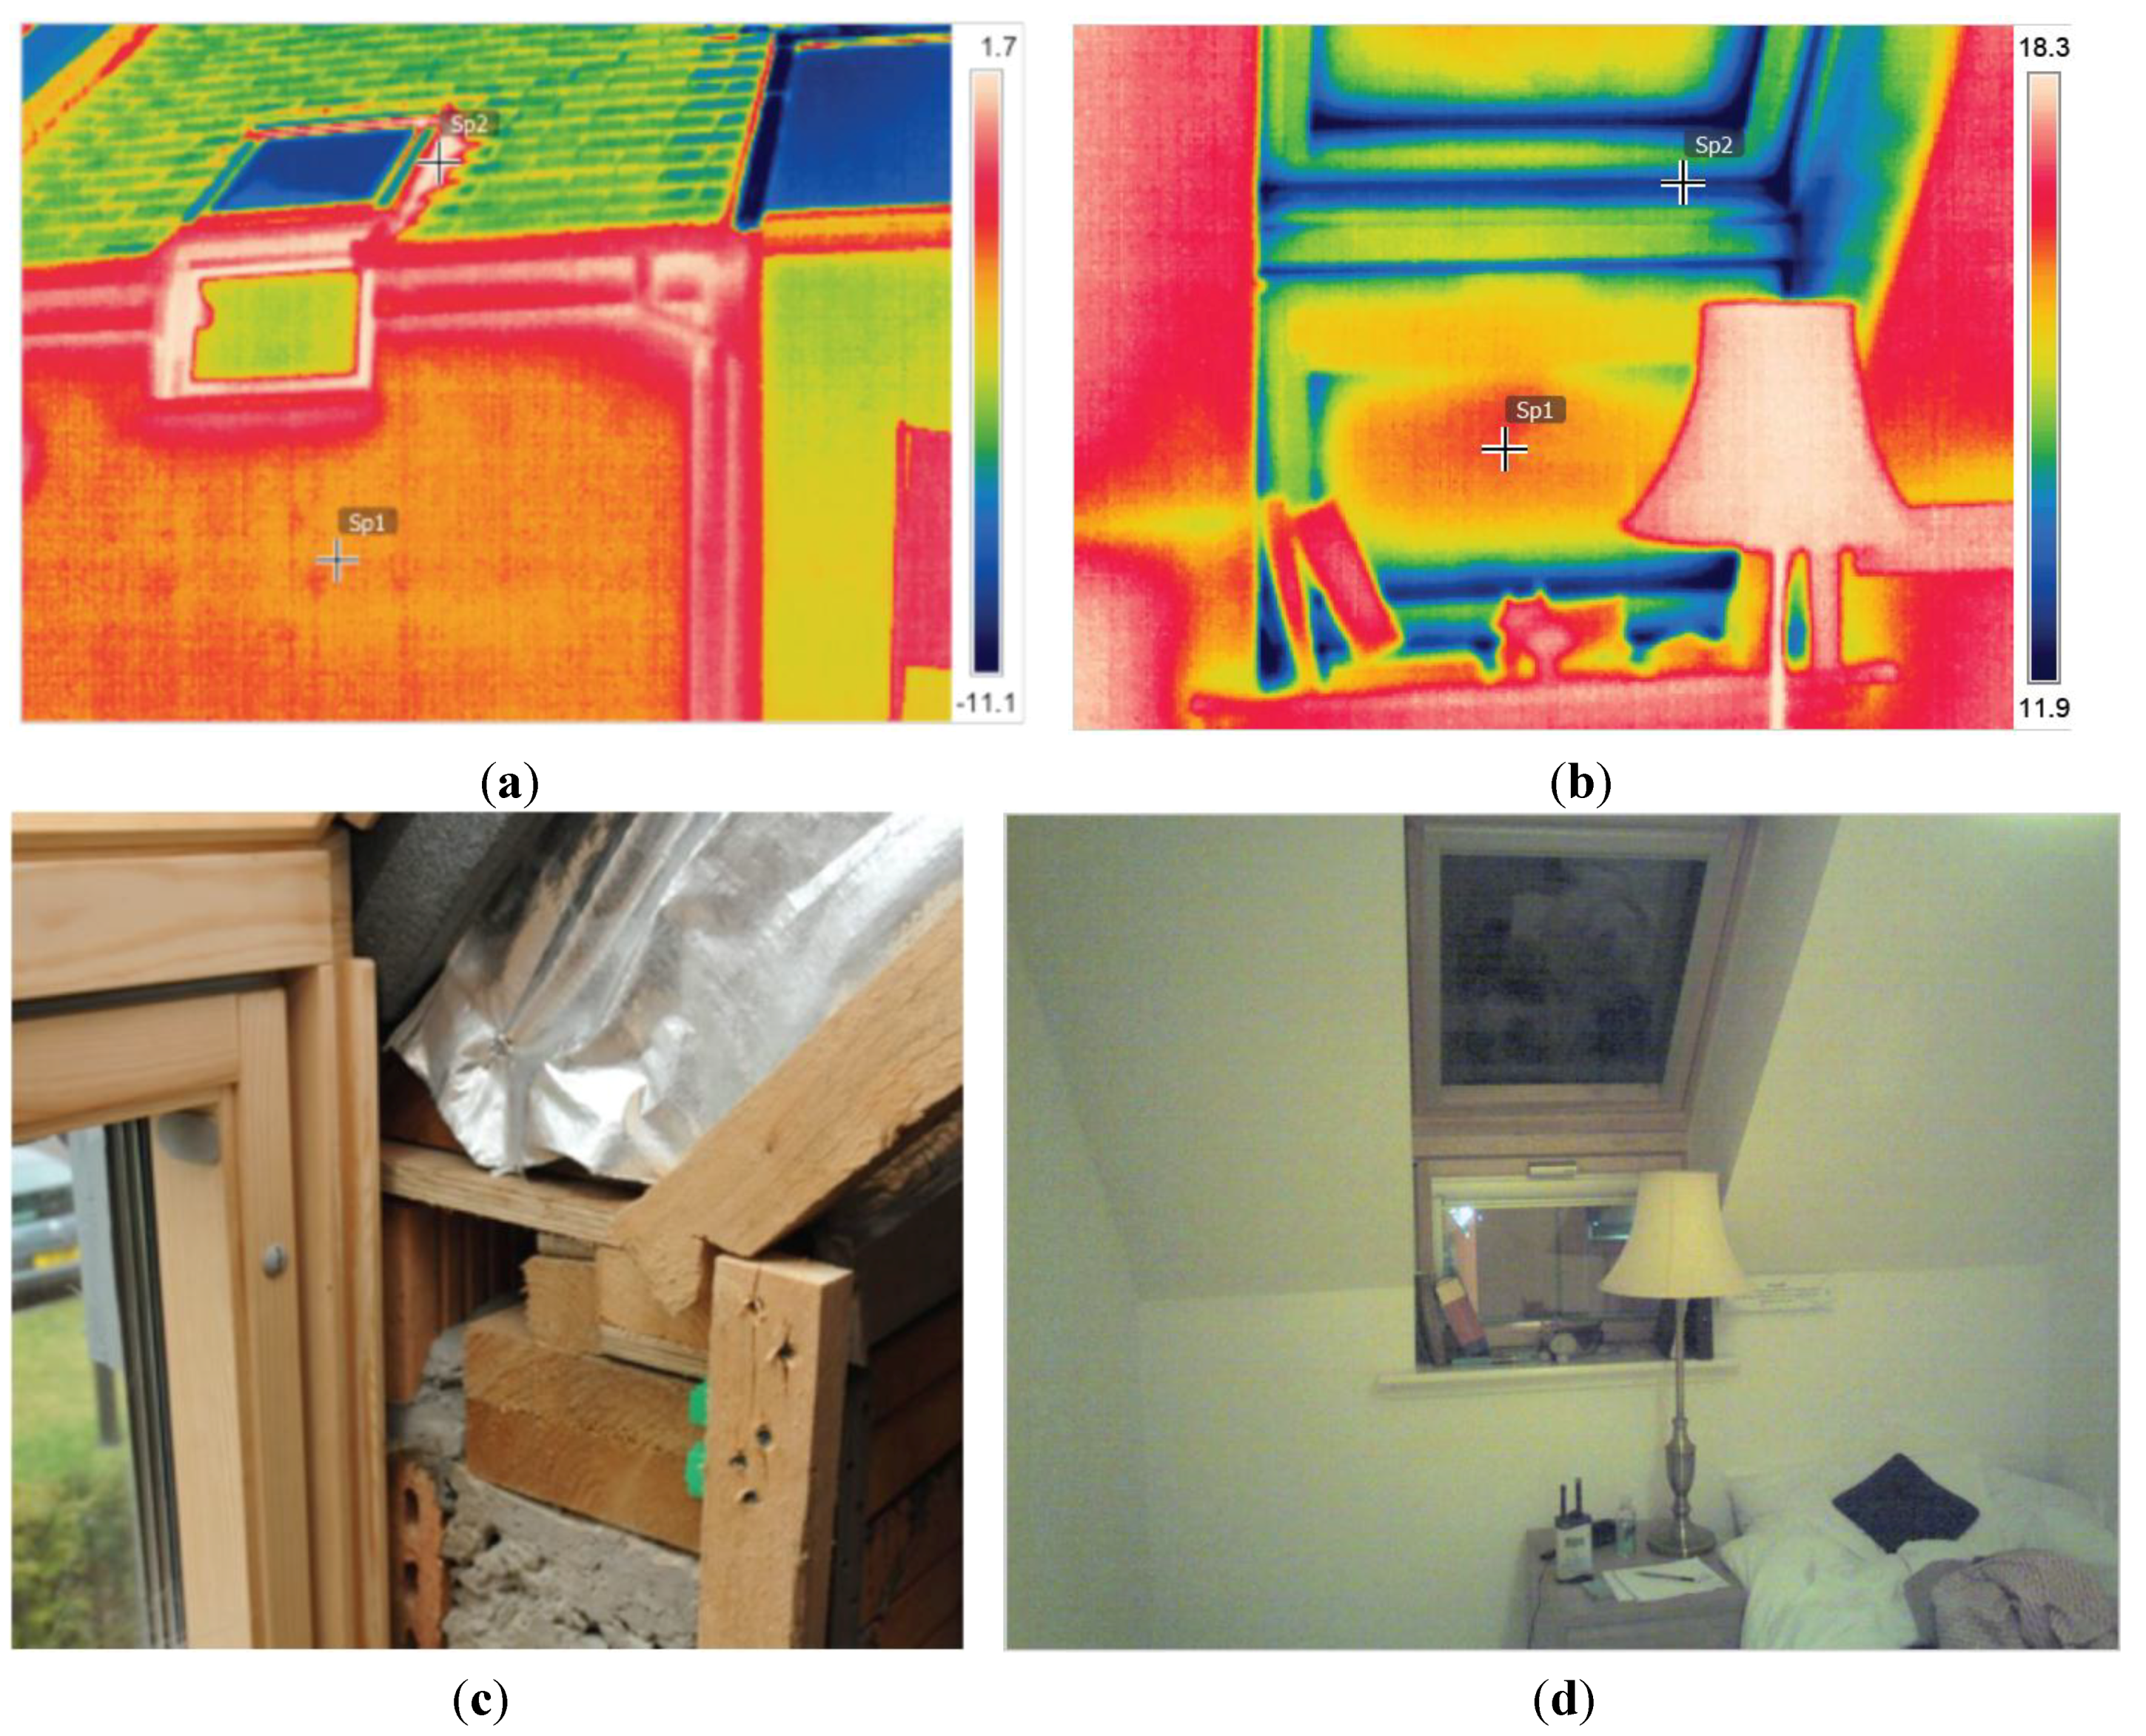
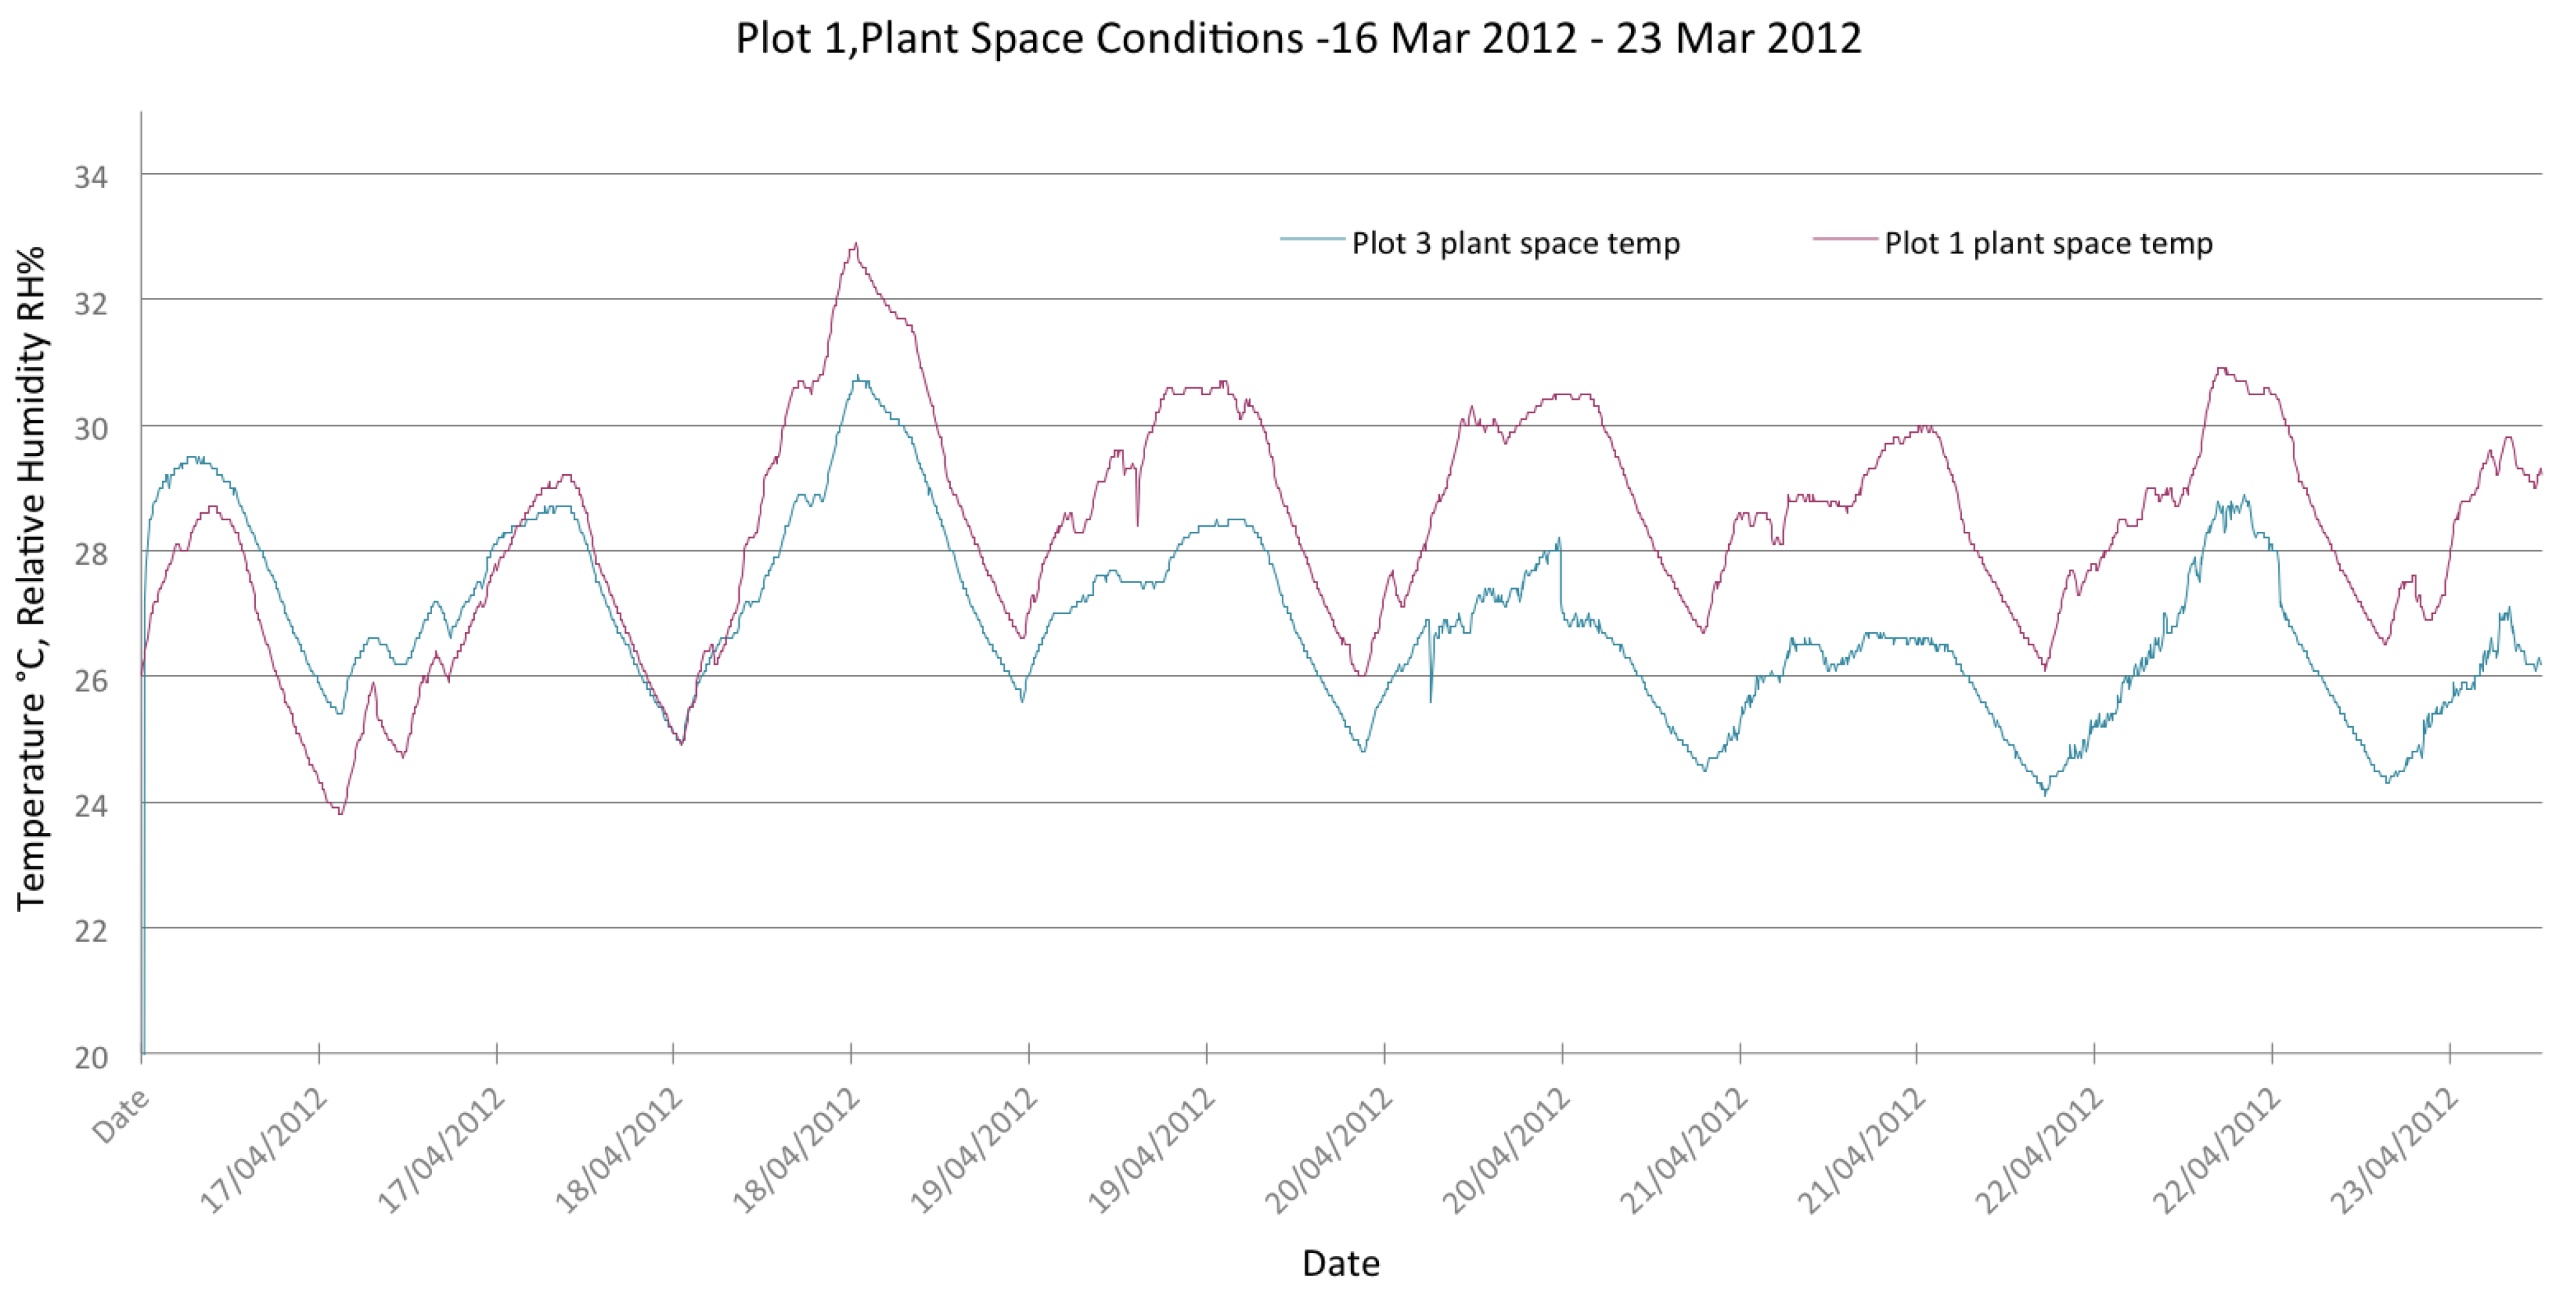
Some issues of overheating were also identified. A particular—and avoidable—source of this was the hot water system. The commissioning tests identified that the pipework from the hot water and solar thermal system was uninsulated. The solar thermal store is located in a top floor plant space and temperatures here were seen to be remaining between 25 °C and 30 °C (Figure 14).
Figure 14. SC3 plant space temperatures Plots 1 and 2.
Buildings 04 00580 g014
Thermographic imaging revealed the impact of this on adjacent spaces, particularly the attic bedroom, which tended to experience higher average temperatures (Table 9).
Table 9. SC3 mean temperatures.
RoomPlot 1Plot 3
Living20.3122.41
Bed 121.5822.34
Bed 221.5923.48
Bed 321.0623.34
Attic 21.8423.85
Plant28.3826.87

5. Discussion

The differences between energy consumption between design values and actual performance are due to a combination of factors. These include the poorer than anticipated fabric performance, MVHR inefficiencies, inadequate heating control, heat loss from the hot water heating system, and lack of solar thermal input. The contribution of the sunspace is limited. The heating system is oversized and a radiator is provided in the thermally weak draught lobby. Some differences are specific to these test houses, for example, heat loss to the unheated adjacent houses, but the hot water consumption here will be lower than that of a fully occupied house.
The problems that relate to the active systems—the solar thermal system, hot water pipework insulation, MVHR system—are both predictable and avoidable, however in all these cases repair is difficult in these houses. The integrated nature of the solar thermal system, whilst architecturally desirable, makes replacement more difficult; access to the MVHR ductwork is restricted and larger diameters could not be accommodated; hidden pipework cannot be accessed to apply insulation. The cost and responsibility of maintenance and repair is therefore a crucial issue and should be factored into choices about appropriate systems. The frequency of filter cleaning was found to be much higher than predicted, but in a real world situation the location of the unit in the loft would have compromised this. In this study, issues of user understanding were minimised due to the nature of the occupants, however some issues were apparent, for example, the ventilation boost function switch gave no indication that it was working, making it easy to leave on accidentally. These problems could be mitigated through improved design and installation.
The difficulties in identifying an effective heating control strategy—in a controlled experiment—indicate the shortcoming of these systems for maintaining a thermal balance. A trial and error approach had to be taken to get temperatures to acceptable conditions. Although controls were set and not changed, overall temperatures varied with external environment. This is an important observation as failure to adequately control heating systems is frequently seen as an occupant issue, despite criticisms of control systems and their usability [27].
Although improving the MVHR to achieve a balanced system would improve the energy efficiency, there is also a need to improve delivery rates capable of meeting accepted standards for adequate ventilation, and this could impact on overall energy use due to increased fan power. It would also need to be integrated into the overall design, for example through larger, straighter rigid ducts, provision for cross flow, and the location of the unit. It would seem that issues of ventilation have become detached from requirements for energy efficiency, both in terms of legislation, but also in the minds of designers. One opportunity that exists here would be to extract air from the very warm plant space—not only would this increase available extract volumes, but it would also ameliorate the overheating problems in this space, distributing the heat to other parts of the building, and would be an excellent drying area.
The overall fabric performance was lower than expected. Some caution is required with regard to the figures obtained by in-situ testing, but appears to be borne out of the evaluations and underpinned by differences in assumed values for materials. The form of clay block construction was unfamiliar and was undertaken by trainee apprentices, so overall build quality may be lower than expected. Reviewing the construction it is apparent that the area of the normal calculated build-up construction is relatively small. Substantial areas of non-standard construction, including window and door surrounds, corners, wall and floor junctions will give rise to additional losses.
The scenarios were able to demonstrate the benefit of the thermal mass, both in terms of energy consumption and also qualitative experience, but the need to relate this to an appropriate heating and ventilation regime is clear. In situations where overheating occurred without purging, the overall temperatures increased in Plot 1. However, in situations where a continuous low level heating regime is desirable, for example housing for older people, it may be beneficial in terms of both comfort and running costs. It also provided improved thermal performance in situations where more liberal window opening took place. Given the costs, limitations and difficulties encountered with the MVHR system, a more fabric first approach of thermal mass and natural ventilation could also be effective. In this dwelling, available thermal mass was limited to the walls as an earlier proposal for concrete intermediate floors was omitted.
An important consideration for a natural ventilation strategy would be the bedrooms at night, which were found to be problematic. Ventilation supply rates were low and there was no other provision for background ventilation. For natural ventilation to be effective and to engage effectively with thermal mass, robust night-time ventilation provision is required. It is suggested that the inability of occupants to engage with ventilation systems overnight introduces a sleeping risk for ventilation, which should be addressed through design and legislation.
The sunspace is a useful addition to the overall quality and amenity of the dwelling. As well as providing additional living space and abundant natural light, it also provides a space for other functions, for example clothes drying, and taking into account its overall performance gives an effective U-value for the living room and bedroom glazing of 0.6 W/m2·K. It was also used in the pilot study as a ventilation ‘reservoir’. In this instance, if the living room became too warm, opening the door to the sunspace allowed some heat to escape and relatively cool air to be introduced. Although providing an immediate response, this would not have the same energy penalty as opening windows to the outside. In its present form, it was making little contribution for preheat ventilation, there being no direct connection between the sunspace and adjacent rooms. Whilst opening the doors to the spaces from the living rooms and bedrooms would enable warm air to circulate through the house, this may not be a practical solution; firstly, as it may be seen as a security risk by occupants, and secondly, it is relatively uncontrolled and could lead to excessive heat gain or loss. The provision of controllable vents, or the connection of the spaces to a mechanical system could facilitate delivery of pre-warmed ventilation air into the space, increasing ventilation provision without a consequent energy penalty.
Early modelling of the houses indicated that the performance was highly sensitive to the MVHR efficiency, which suggested that the overall consumption could vary from 23 to 52 kW·h/m2 without the MVHR system. Subsequent modelling of the houses using the as-built data suggest that with optimum systems the annual space heating load could be 34.7 kW·h/m2 for Plot 1 and 34.6 kW·h/m2 for Plot 3.

6. Conclusions

The actual energy consumption for space and water heating is around three times the predicted value. Although in pure energy terms Plot 3 outperformed Plot 1, the latter scored better in qualitative terms, and scenario testing identified several instances where the mass would have beneficial effects in terms of both energy use and comfort.
Nevertheless, overall consumption is estimated to be in the order of £390–£490 per year for Plot 1 and £350–£370 for Plot 3 for space and water heating, within limits of affordability for the size and type of house. This could be reduced with fabric improvements, optimization of the solar thermal and MVHR systems, and a more closely sized and better-controlled heating system. The sunspaces could be used to reduce heat loss, assist with ventilation and removal of moisture from key activities such as clothes drying. Consideration of qualitative and functional elements, for example thermal comfort and removal of moisture, should be included in any assessment of options, rather than relying entirely on energy pay-back as a decision metric.
The inclusion of active systems needs careful consideration in terms of matching design intention with actual performance, which in these houses was problematic. This raises questions for the client about how such systems can be included in an affordable and beneficial way. Performance requirements, maintenance costs and user interaction are key variables.
Whilst there are potential beneficial effects in terms of reducing ventilation losses and maintaining indoor air quality through the use of MVHR systems, it is clear that these rely on careful design, procurement, installation, maintenance and user interaction. Loss of air-tightness over time will also undermine its effectiveness. The implications of system failure are significant, and can present a real risk to the quality of internal environments and over time, to the health of residents as well as increasing energy consumption.
This project is a clear demonstration of the benefits of undertaking a process of building performance evaluation, and strongly supports the decision to undertake construction of these prototypes, and the lessons learned are being fed into projects that are now on site. Scenario testing developed insights, and although not widely applicable, provided a methodologically sound approach for the examination of key issues.

Acknowledgments

We would like to thank Glasgow Housing Association and the Glasgow City Building Skills Academy for their assistance and cooperation during this project. The project reported here is part of the Technology Strategy Board’s Building Performance Evaluation programme and acknowledgement is made of the financial support provided by that programme. Specific results and their interpretation remain the responsibility of the project team.

Conflicts of Interest

The authors declare no conflict of interest.

References

  1. Monahan, S.; Gemmell, A. How Occupants Behave and Interact with Their Homes. Available online: http://www.nhbcfoundation.org/Publications/Research-Review/How-occupants-behave-and-interact-with-their-homes-NF35 (accessed on 26 March 2013).
  2. Good Homes Alliance Monitoring Programme 2009-11: Technical Report Results from Phase 1: Post-Construction Testing of a Sample of Highly Sustainable New Homes. Available online: http://www.goodhomes.org.uk/downloads/members/gha-monitoring-report-approved.pdf (accessed on 10 April 2013).
  3. National House Building Council Foundation. Low and Zero Carbon Homes: Understanding the Performance Challenge—NF41. Available online: http://www.nhbcfoundation.org/Portals/0/NF_Pubs1/NF41.pdf (accessed on 10 April 2014).
  4. Green Construction Board Buildings Working Group. The Performance Gap: Causes & Solutions. 2012. Available online: http://www.greenconstructionboard.org/index.php/resources/performance-gap (accessed on 23 May 2013).
  5. Gill, Z.M.; Tierney, M.I.; Pegg, I.M.; Allan, N. Measured energy and water performance of an aspiring low energy/carbon affordable housing site in the UK. Energy Build. 2011, 43, 117–125. [Google Scholar]
  6. Climate Change Act 2008; UK Government: London, UK, 2008.
  7. Department for Environment, Food and Rural Affairs, HM Government. Securing the Future: Delivering UK Sustainable Development Strategy; HM Government: London, UK, 2005.
  8. Crump, D.; Dengel, A.; Swainson, M. Indoor Air Quality in Highly Energy Efficient Homes—A Review; IHS BRE Press: London, UK, 2009. [Google Scholar]
  9. Davis, I.; Harvey, V. Zero Carbon: What Does It Mean to Homeowners and Housebuilders? NHBC Foundation: Milton Keynes, UK, 2008. [Google Scholar]
  10. Stevenson, F.; Hom, B. Developing occupancy feedback from a prototype to improve housing production. Build. Res. Inf. 2010, 38, 549–563. [Google Scholar]
  11. How People Use and Misuse Buildings; Technology Strategy Board/Economic and Social Research Council (TSB/ESRC): London, UK, 2008.
  12. Porteous, C. Sensing a Historic Low-CO2 Future. In Chemistry, Emission Control, Radioactive Pollution and Indoor Air Quality; Mazzeo, N., Ed.; InTech: Rijeka, Croatia, 2011. [Google Scholar]
  13. Appleby, A. Indoor Air Quality and Ventilation Requirements. In Buildings and Health, the Rosehaugh Guide to the Design, Construction, Use and Management of Buildings; Royal Institute of British Architects Publications Ltd.: London, UK, 1990; pp. 167–193. [Google Scholar]
  14. CIBSE Guide A: Environmental Design, 7th ed.; Chartered Institute of Building Services Engineers: London, UK, 2006.
  15. Seppänen, O.A.; Fisk, W.J.; Mendell, M.J. Association of ventilation rates and CO2 concentrations with health and other responses in commercial and institutional buildings. Indoor Air 1999, 9, 226–252. [Google Scholar]
  16. Erdmann, C.A.; Steiner, K.; Apte, M. Indoor Carbon Dioxide Concentrations and Sick Building Syndrome Symptoms in the Base Study Revisited: Analyses of the 100 Building Dataset; Lawrence Berkeley National Laboratory: Berkeley, CA, USA, 2002; pp. 443–448. [Google Scholar]
  17. Batterman, S.; Peng, C. TVOC and CO2 concentrations as indicators in indoor air quality studies. Am. Ind. Hyg. Assoc. 1995, 56, 55–65. [Google Scholar]
  18. Wargocki, P. The effects of ventilation in homes on health. Int. J. Vent. 2013, 12, 101–118. [Google Scholar]
  19. Mardiana-Idayu, A.; Riffat, S.B. Review on heat recovery technologies for building applications. Renew. Sustain. Energy Rev. 2012, 16, 1241–1255. [Google Scholar]
  20. Mlecnik, E.; Schütze, T.; Jansen, S.J.T.; de Vries, G.; Visscher, H.J.; van Hal, A. End-user experiences in nearly zero-energy houses. Energy Build. 2012, 49, 471–478. [Google Scholar]
  21. Balvers, J.; Bogers, R.; Jongeneel, R.; Kamp, I.; van Boerstra, A.; van Dijken, F. Mechanical ventilation in recently built Dutch homes: Technical shortcomings, possibilities for improvement, perceived indoor environment and health effects. Archit. Sci. Rev. 2012, 55, 4–14. [Google Scholar]
  22. Ventilation and Indoor Air Quality Task Group. Mechanical Ventilation with Heat Recovery in New Homes; Interim Report for Zero Carbon Hub; Ventilation and Indoor Air Quality Task Group: London, UK, 2012. [Google Scholar]
  23. Gill, Z.M.; Tierney, M.J.; Pegg, I.M.; Allan, N. Low-energy dwellings: The contribution of behaviours to actual performance. Build. Res. Inf. 2010, 38, 491–508. [Google Scholar]
  24. Sharpe, T.R.; Porteous, C.D.A.; Foster, J.; Shearer, D. An assessment of environmental conditions in bedrooms of contemporary low energy houses in Scotland. Indoor Built Environ. 2014, 2014. [Google Scholar] [CrossRef]
  25. Nicol, J.F.; Humphreys, M.A. Adaptive thermal comfort and sustainable thermal standards for buildings. Energy Build. 2002, 34, 563–572. [Google Scholar]
  26. Shearer, D.; Porteous, C.P.A. Winter Performance of 2-Storey Solar Buffer Spaces in Glasgow Demonstration Houses. In Proceedings of the Eurosun 2012, Rijeka, Croatia, 17–21 September 2012.
  27. Peffer, T.; Pritoni, M.; Meier, A.; Aragon, C.; Perry, D. How people use thermostats in homes: A review. Build. Environ. 2011, 46, 2529–2541. [Google Scholar]

