1. Introduction
Internationally there is a perennial problem in collating reliable data about energy use. This makes it much harder to assess progress towards energy efficiency objectives and to introduce effective policies [
1]. The United Kingdom has made considerable progress in producing detailed, systematic statistics covering different sectors of the economy. However, even in countries which regularly gather detailed data, there are limits to the understanding that can be gleaned from national statistics [
2]. For energy use in the building sector, bottom-up surveys are an important complement to aggregate figures based on energy sales. This is particularly true when it comes to uses that are highly dependent on behaviour, such as for household appliances.
Within the UK, homes account for more than a quarter of the national energy use and carbon dioxide emissions. More energy is consumed in housing than either the road transport or industry sectors. Moreover, residential energy use has been rising by an average of 0.4% a year since 1970 [
3]. Consequently, housing represents a significant opportunity for emissions reductions if the UK is to meet its targets for 2050. In 2008, the UK introduced legally binding national targets to cut greenhouse gas emissions by 80% by 2050, compared with 1990 levels [
4]. As part of meeting this requirement, the Government and its Department of Energy and Climate Change (DECC) have identified a need to reduce electricity consumption in the home [
5].
Electricity, as a proportion of total household energy use, varies from year to year, but in 2012 it accounted for 22%, or 109 TW·h [
3]. In the UK, the carbon intensity of grid electricity is high compared to natural gas, which makes up almost two-thirds of residential energy use [
6]. This is due to losses in electricity generation and the primary fuels, and means that, despite making up less than a quarter of the energy consumed, electricity accounts for 48% of household emissions; almost 60 million tonnes of CO
2 annually. Electricity consumption in the home has grown by two-fifths over the past 44 years [
3], and the Office of Gas and Electricity Markets (Ofgem), has expressed concerns about maintaining sufficient electricity generating capacity, and ensuring the UK can continue to meet its peak electricity demand [
7].
In 2010, DECC, in conjunction with the Department for Environment, Food and Rural Affairs (DEFRA) and the Energy Saving Trust, commissioned the Household Electricity Survey (HES) to improve the understanding of residential energy performance. The following section provides an overview of the HES. Further details are available elsewhere [
8,
9,
10].
1.1. The Household Electricity Survey
Electricity use was metered in 250 owner-occupier dwellings across England during 2010 and 2011. Of these, 26 were monitored for a full year, and the remainder for one month, each on a rolling basis throughout the timeframe of the survey. For each home, metering was attached centrally to the distribution boards, and to key individual appliances. These recorded electricity use at 10 min intervals for a year or 2 min intervals for a month. Most of the analysis was performed at a resolution of ten minutes, the two minute records having been combined to make longer intervals. However, the 2 min data was used where the finer resolution was appropriate. The mean annual electricity consumption for the HES sample was 4093 kW·h, compared with 4154 kW·h for the UK in 2011 [
11].
The number of appliances monitored per household varied between 13 and 85, and covered wet and cold appliances, as well as Information and Communication Technology (ICT) equipment, some consumer electronics and lighting. For homes that were monitored for a single month only, Meter Point Administration Number (MPAN) data was also collected, which provided total household electricity use for the year 2010. Although similar studies have been conducted elsewhere (e.g., [
12]), the scale and resolution of the monitoring makes the HES the most detailed electricity use survey ever undertaken in the UK.
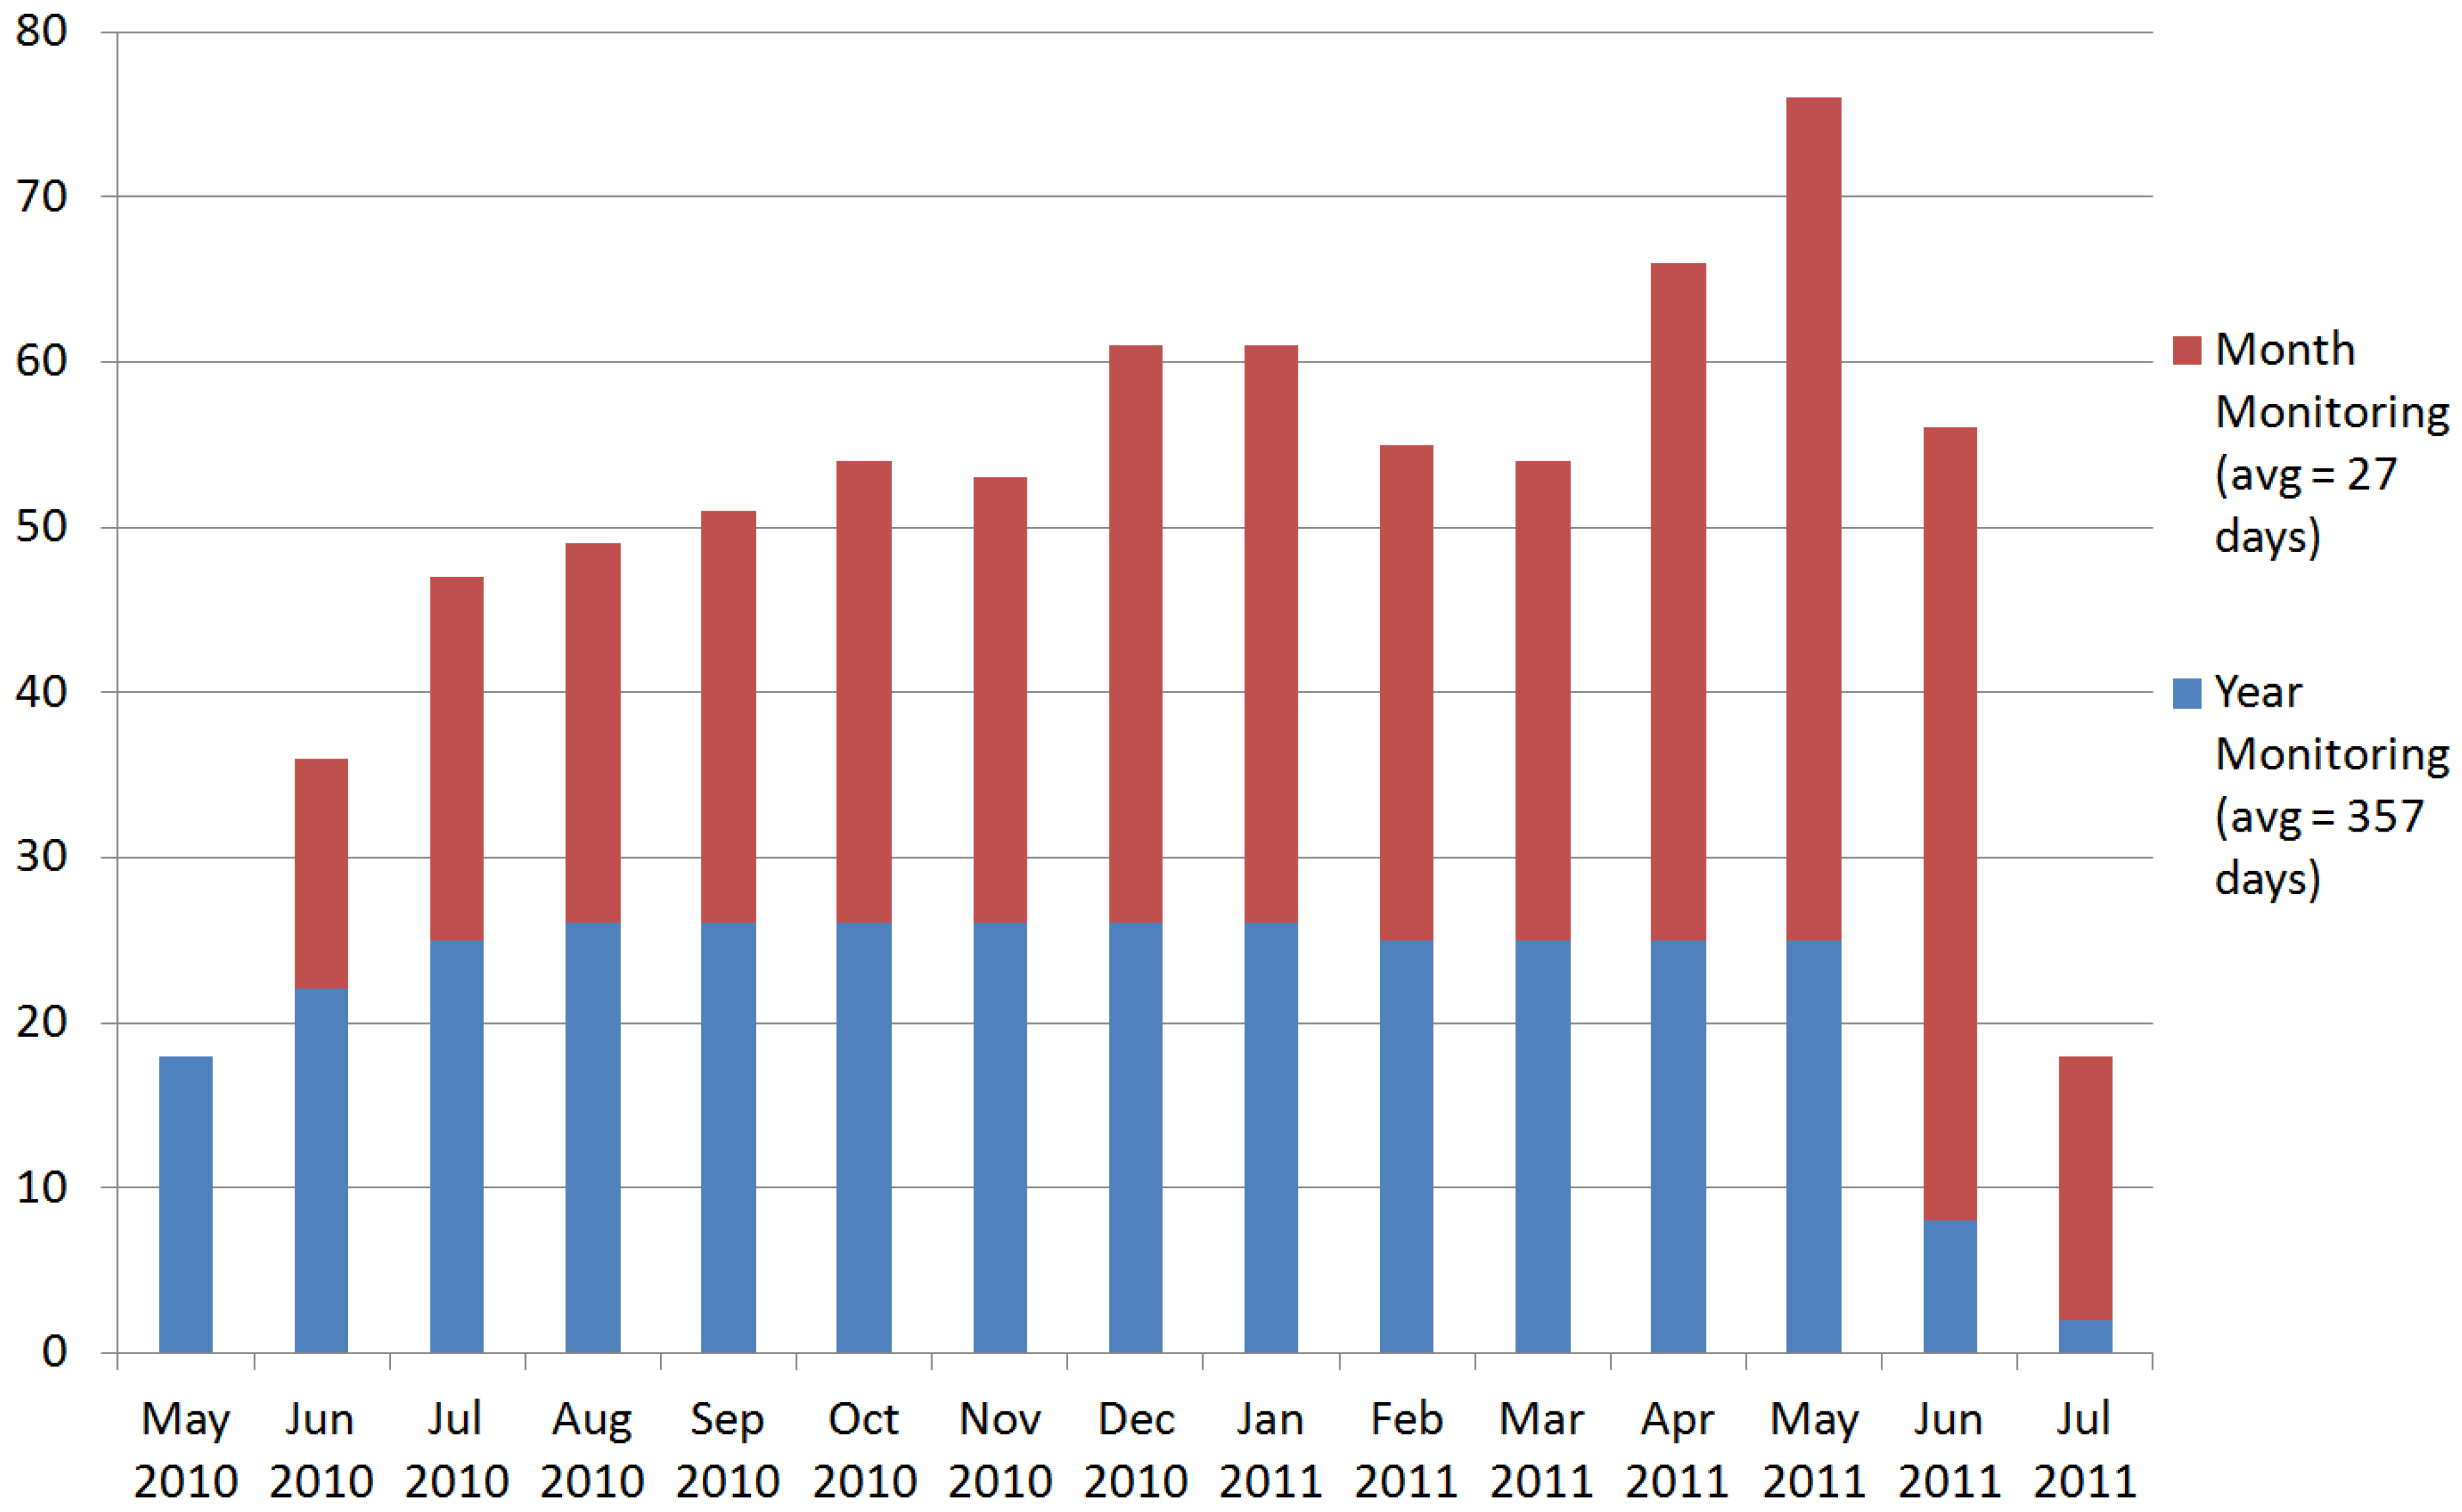
Figure 1 below shows the breakdown of monitoring, split between the monthly and yearly houses. The precise period of monitoring varied from house to house, and did not always line up with the calendar. Therefore, the average monitoring period is also shown on the chart.
Figure 1.
Number of homes monitored, month by month.
Figure 1.
Number of homes monitored, month by month.
For each of the participating households, a survey was carried out to gather information on the electrical appliances and lighting within the building. Information collected included key variables such as model and energy efficiency ratings for white appliances, and lamp type and rated power for lighting. Finally, a questionnaire was completed by the occupants covering the residents’ working and social status, and their attitudes to energy use and climate change. This questionnaire was similar to the “tracker” surveys carried out each year by DEFRA [
13]. It also covered the measures the households take to reduce electricity consumption. For example, 77% of the HES households claimed to fill the kettle only as much as necessary “quite often or more”, and 89% washed their clothes no warmer than 40 °C.
The dwellings included in the study cover much of England, and were selected to be broadly representative of the UK in terms of both physical and social factors, such as occupant social grade and employment status, household size and property age [
8]. However, the HES sample differs notably from the national housing stock in three important respects. Firstly tenure (social and rented housing, which make up roughly 35% of the UK total [
14], were excluded) and secondly household beliefs (the HES participants were found to be more energy-conscious than the UK average). Only nine of the households have electricity as the primary source of space heating, although 28% of the overall sample did include some form of secondary electric heating.
Table 1 summarises the dwellings monitored.
Table 1.
Characteristics of households in the Household Electricity Survey (HES) sample.
Table 1.
Characteristics of households in the Household Electricity Survey (HES) sample.
| Data | Reported values | Month monitoring | Year monitoring |
|---|
| No. of households | – | 224 | 26 |
| No. of occupants | Mean | 2.7 | 2.4 |
| Dwelling size (m2) | Mean | 96 | 103 |
| No. of appliances | Mean | 45 | 40 |
| Social grade (%) * | A–B | 34 | 19 |
| – | C1–C2 | 52 | 69 |
| – | D–E | 13 | 12 |
1.2. Aims of This Paper
The HES presents a unique opportunity to examine current electricity use in UK homes. This article endeavours to use the data to improve the understanding of the relationship between behaviour, household social factors, and energy performance. More specifically, it builds upon prior work carried out by the authors [
10], to produce new conclusions in two key research areas:
How does electricity demand vary in a dwelling over time? This analysis focuses on two important aspects of energy profiles: the base load, and the peak load.
How does electricity use vary between dwellings? This analysis examines the relationship between energy consumption, and different house, and household factors.
2. Domestic Electricity Use
Although the HES represents the most detailed residential electricity monitoring project undertaken in the UK at the time of writing, there have been smaller, similar studies that have explored the drivers of domestic energy use.
In the late 1990s, a study into the electricity demand in 30 UK homes found that occupancy and income were the main variables driving both total electricity use and daily demand profiles [
15]. More recent studies have also found correlations between household income and electricity consumption, and examined the interrelationships between income and other variables. A study carried out in 2008 of data aggregated to small geographic areas determined that income is a key factor affecting residential energy use, but that a number of other variables were also critical, including the type of dwelling, tenure, and household size (
i.e., the number of occupants) [
16]. An examination of the National Energy Efficiency Data-framework (NEED), a large database of annual energy consumption in UK buildings, found that while electricity use varies with dwelling tenure, the underlying driver was likely to be household income [
17]. Other variables found to correlate non-linearly to differences in electricity use included household and dwelling sizes. The analysis of NEED also observed different performance in homes of different ages, with mean electricity use in pre-1919 homes 10% higher than the overall stock. However, this relationship was less clear, and posited to be due to the changing trends in built form and fabric over time, as well as the uncertain nature of refurbishments. Analysis of household tenure was also covered in a study of 27 homes in Northern Ireland, which found far higher annual electricity use in owner-occupied homes than rented ones [
18]. More specifically examining the relative impact of income and other factors, a multi-variate regression analysis of the electricity consumption in homes in Portugal found that, while income is a key driver, the impact of this variable is reduced once related factors including house type, size and occupancy are taken into account [
19]. However, studies have noted large differences in energy demand across Europe [
20] suggesting that the results cannot necessarily be assumed to be valid for the UK.
In addition to the differences in average annual electricity use, the complexity of occupant behaviour has been examined in many of the studies mentioned above. Most reference large variations in annual energy use between ostensibly similar dwellings, as well as differences in the daily demand profiles. It has been noted that behaviour in individual households varies from day to day and that coincidences of appliance use, particularly those with electric heating elements, are a key factor in determining the peak demand [
15]. Unsurprisingly, the factors that impact on household electricity demand profiles have been found to overlap with those of annual consumption, with the time and magnitude of peak demand found to vary with income, dwelling size and household size [
18].
At the scale of individual domestic appliances, differences in typical user behaviour have been observed between households. For instance, a recent study found higher mean daily hours of television use in local authority and social housing, compared with owner-occupied homes [
21]. Elsewhere, a study of 72 homes found that, while the energy consumption for different appliances typically rises with the dwelling’s total electricity consumption, the correlation varies with appliance type [
22]. The difficulty of considering these factors in energy modelling was noted in a recent major review, which highlighted the need for domestic models to better account for the range of appliance electricity use [
23]: SAP and BREDEM, the well established building regulations models adapted for a number UK building stock models (e.g., [
24,
25]) estimate appliance electricity consumption based solely on occupancy and floor area.
3. Data Processing
The raw HES dataset consists of electrical energy readings, for individual appliances and on the distribution board circuits, recorded for between a month and a year for 250 homes. Consequently, prior to carrying out any analysis, significant data processing was required. This is outlined below:
- a)
Unknown Energy Use: The HES incorporates considerable appliance-scale monitoring. However, comparison between the electricity profile data and the household appliance surveys revealed that not all appliances were individually monitored in every household. For example one household owned six televisions, of which only three were monitored. Where the distribution circuit-level monitoring showed electricity use that could not be assigned to a specific appliance, this was recorded as “unknown”. On average, across the HES sample, unknown uses account for 20% of the household total electricity consumption.
- b)
Incomplete Readings: In some instances, readings were missing for parts of the day, typically at the start and end of the dwelling’s monitoring period. Partial day records were removed. One or two days were removed from five households and 14 days (out of 42) were removed from one household. There were no instances where an appliance’s data was completely lost, due to missing readings.
- c)
Incorrect or Misclassified Readings: In a few cases, the monitored electricity profiles for individual appliances were significantly different to what would be expected for the appliance type. Where this occurred, the data was amended if possible. Some appliances were reclassified based on the household appliance survey data or the characteristics of the profile–for example several electric cookers that never used more than a few Watts were in fact extractor fans for gas cookers. Sometimes, a profile classified as a single appliance was in fact a number of appliances on the same socket. For example, one classified as a light shared a socket with a cordless phone and radio. Finally, unreasonable spikes in the profiles (such as a DVD player briefly using more than 2 kW) were removed and the profile data smoothed. The data from 90 appliances were reclassified.
- d)
Duplicate Readings: Occasionally, profiles in the HES were duplicated, or one profile included another. This was particularly common with audiovisual appliances, presumably because of the use of daisy-chained power blocks. For example, a multi-way extension cable feeding a TV, set top box and DVD player, might be monitored as a whole at the wall, but the DVD player might also be monitored separately. Where duplicate readings were found, these were extracted. In all, 22 appliances data records were found to be either duplicates or incorporated in another profile.
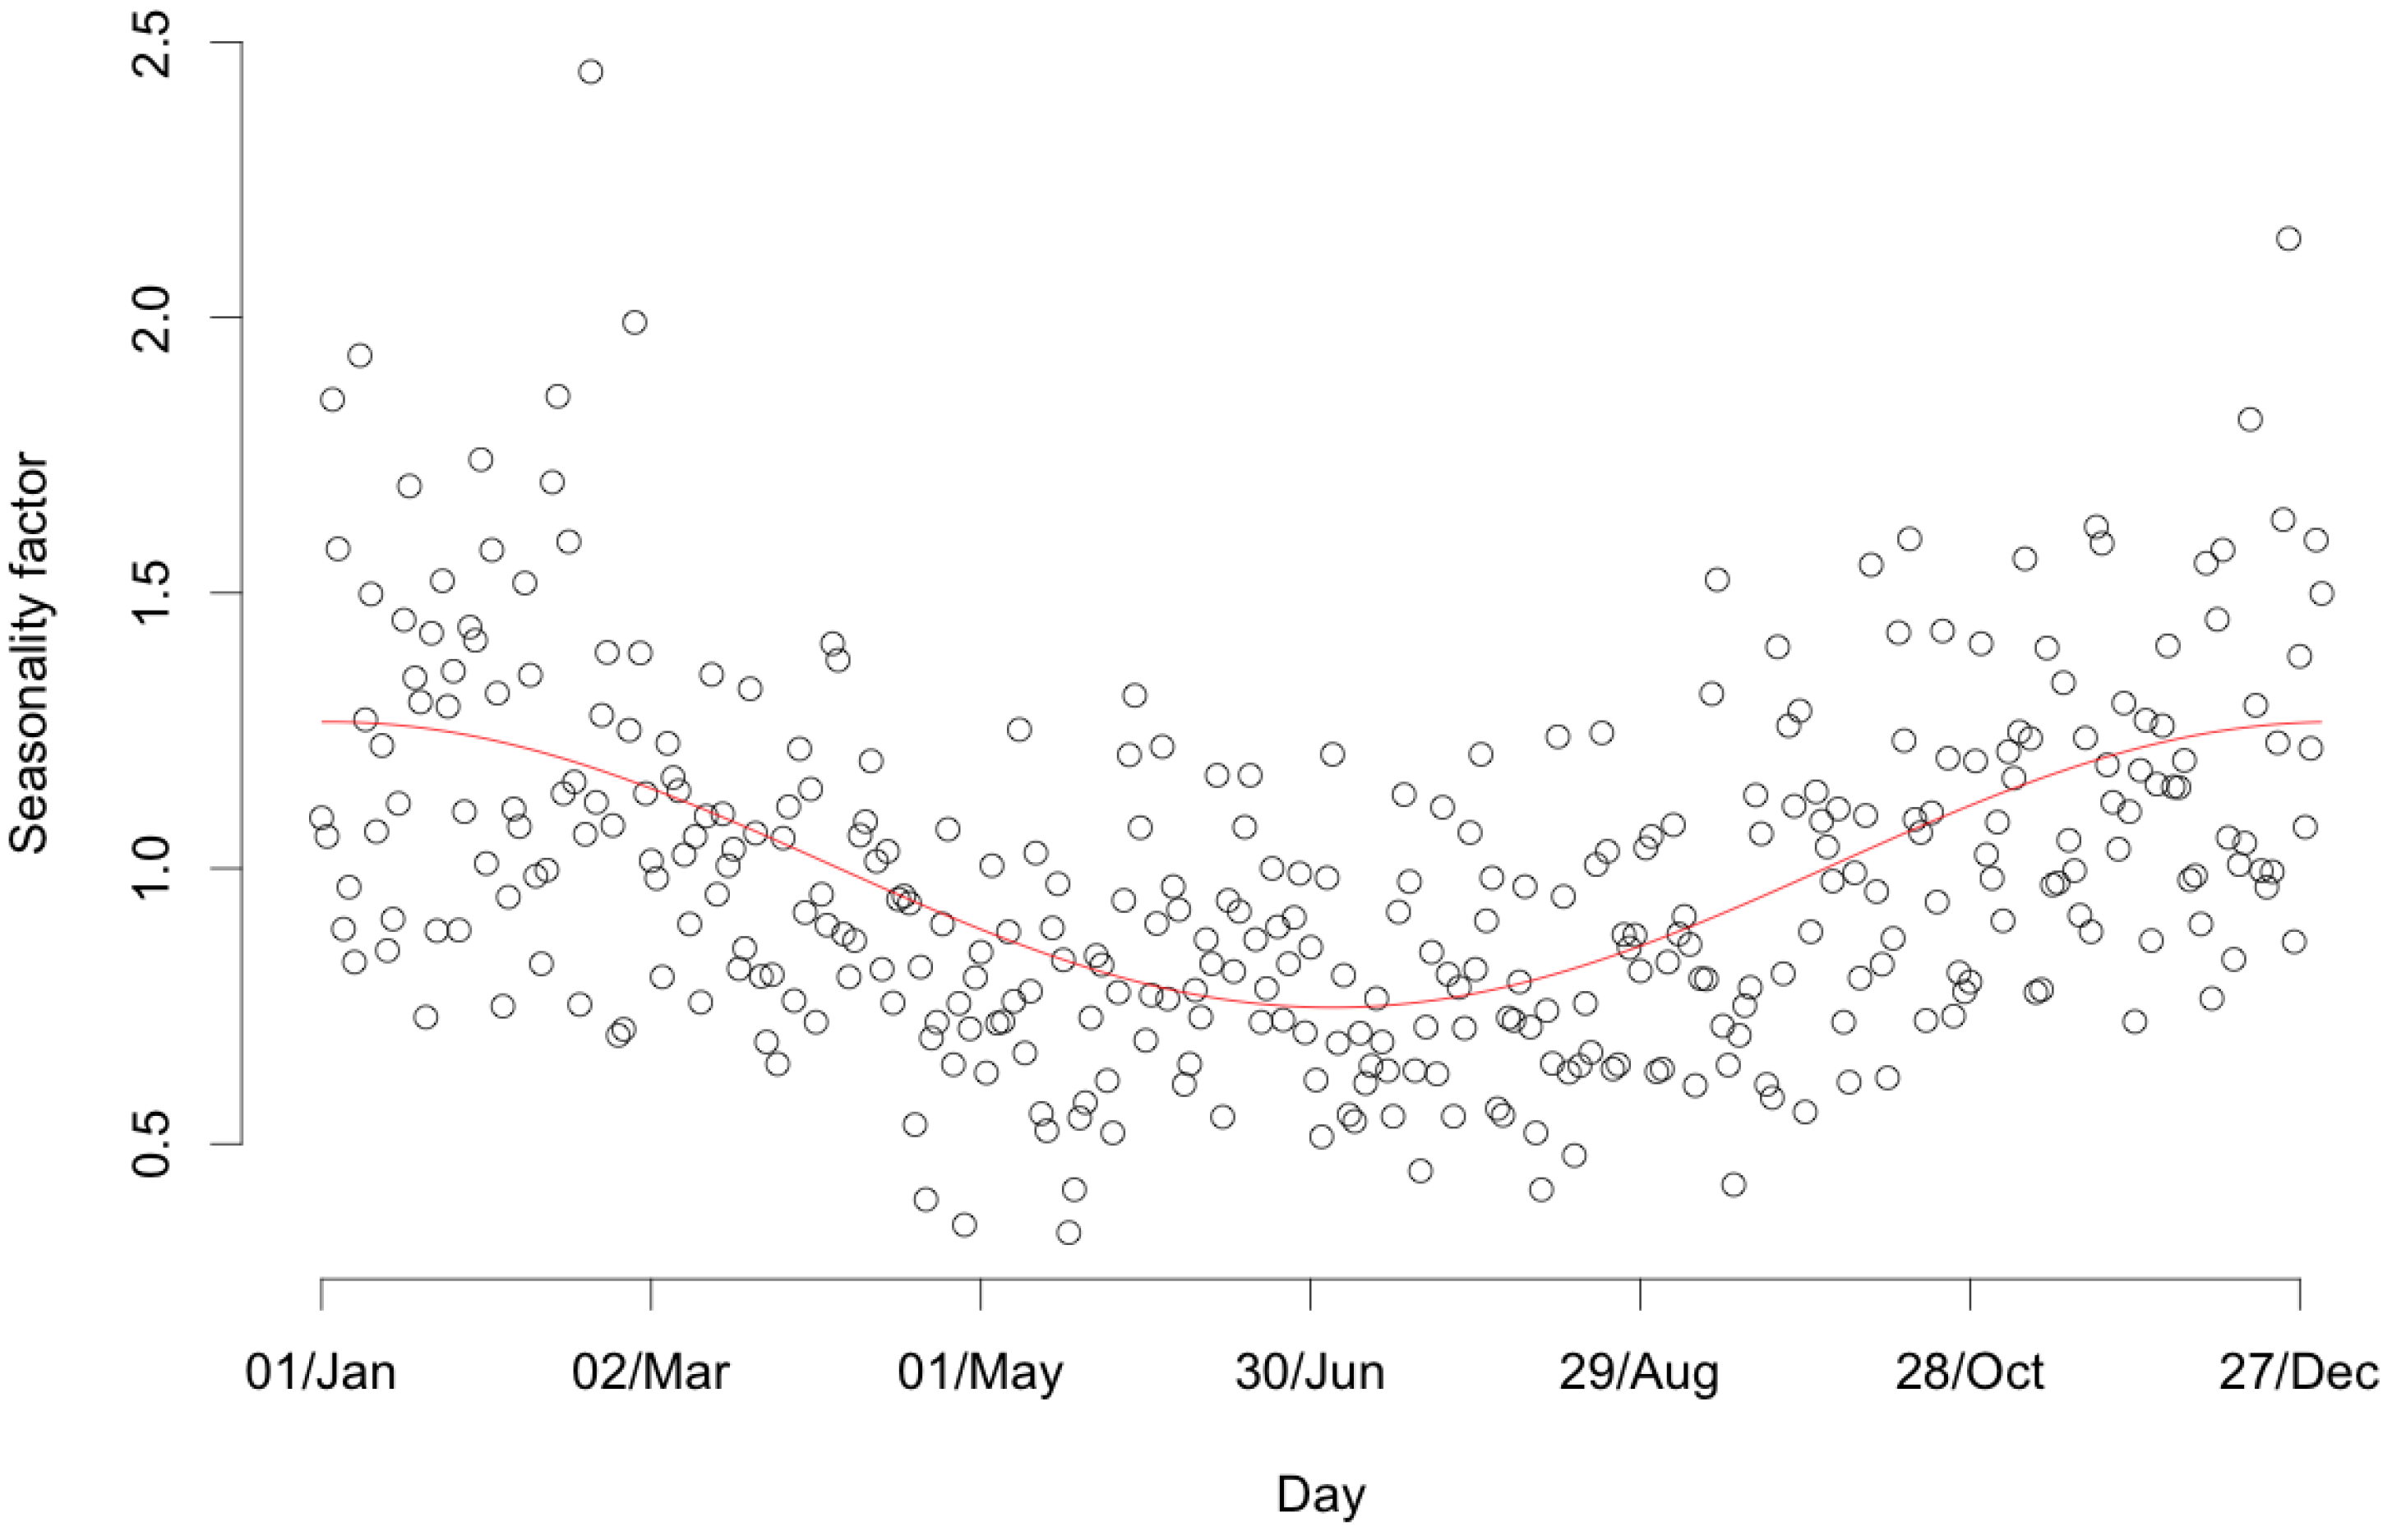
This study includes analysis of annual electricity use as well as the daily profiles of electrical demand. Therefore, in addition to the processing outlined above, it was necessary to scale up the results for the households monitored for only one month. Seasonal adjustment factors were used to account for variations in use through the year, caused by changes in occupant behaviour as well as the weather (see
Figure 2).
Figure 2.
Seasonal adjustment factor used for annualising washing energy data.
Figure 2.
Seasonal adjustment factor used for annualising washing energy data.
For example, lighting is typically more heavily used in winter, when the evenings are dark and the daytimes not particularly bright, whereas refrigerators and freezers usually need more energy in the summer because the ambient temperature is higher. Washing energy use is often similarly seasonal, particularly for tumble dryers, since many households use a washing line for drying clothes when weather permits. Seasonal adjustment factors were generated for each appliance group by assigning best-fit sine or cosine curves to the data from the 26 households monitored for an entire year.
Figure 2 presents the seasonal curve (in red) generated from the normalised raw monthly readings for each home monitored for a year (black circles) for washing appliances.
The seasonal adjustment process adds a level of uncertainty to any analysis, compared with examining the raw monitored data. Therefore, where possible, the unadjusted data has been used in the analysis presented here. The energy use profile analyses use the unadjusted data, while the sections examining annual consumption use the seasonally adjusted data.
Following the data processing, household electricity consumption was grouped by appliance type. Eleven categories were used, as shown in
Table 2, along with the average annual electricity use for each. The figures presented are the mean for the entire HES sample. For example, homes with solely gas-based water heating have been included in the calculation as 0 kW·h/year, and homes with back-up immersion heaters may have very low annual electricity consumption.
Table 2.
Summary of the eleven categories of electricity use. ICT: Information and Communication Technology; AV: Audiovisual Appliances.
Table 2.
Summary of the eleven categories of electricity use. ICT: Information and Communication Technology; AV: Audiovisual Appliances.
| Category | Appliances | Mean annual energy |
|---|
| Cold appliances | Fridges, freezers and fridge freezers. | 566 kW·h (13.8%) |
| Cooking | Electric hobs and ovens, kettles, microwaves, toasters and other small cooking appliances (excluding gas cooking). | 448 kW·h (10.9%) |
| Lighting | Internal and external lights, on lighting circuits or lamps plugged into sockets. | 483 kW·h (11.8%) |
| Audiovisual | TVs, games consoles, set top boxes, hi-fi systems, radios and other AV appliances. | 537 kW·h (13.1%) |
| ICT | Computers, monitors, printers, scanners and networking equipment. | 207 kW·h (5.1%) |
| Washing appliances | Washing machines, washer-dryers, tumble dryers and dishwashers. | 437 kW·h (10.7%) |
| Showers | Electric showers. | 112 kW·h (2.7%) |
| Water heating | Immersion heaters (excluding gas water heating). | 85 kW·h (2.1%) |
| Space heating | Electric fires and other space heating appliances (excluding gas space heating). | 227 kW·h (5.5%) |
| Other | Other appliances not in the above categories, including hair dryers, massage beds, aquariums and pond pumps. | 173 kW·h (4.2%) |
| Unknown | Electricity use recorded on electrical socket circuits but not recorded at the appliance level. We do not know what this energy was used for. | 819 kW·h (20.0%) |
5. Discussion and Conclusions
The Household Electricity Survey presents a unique opportunity to examine the current energy performance of the residential building stock in England. This article builds on work previously carried out by the authors, and examines the characteristics of base load and peak electricity use-two key parts of residential electricity profiles. It also explores the difference in energy performance between households.
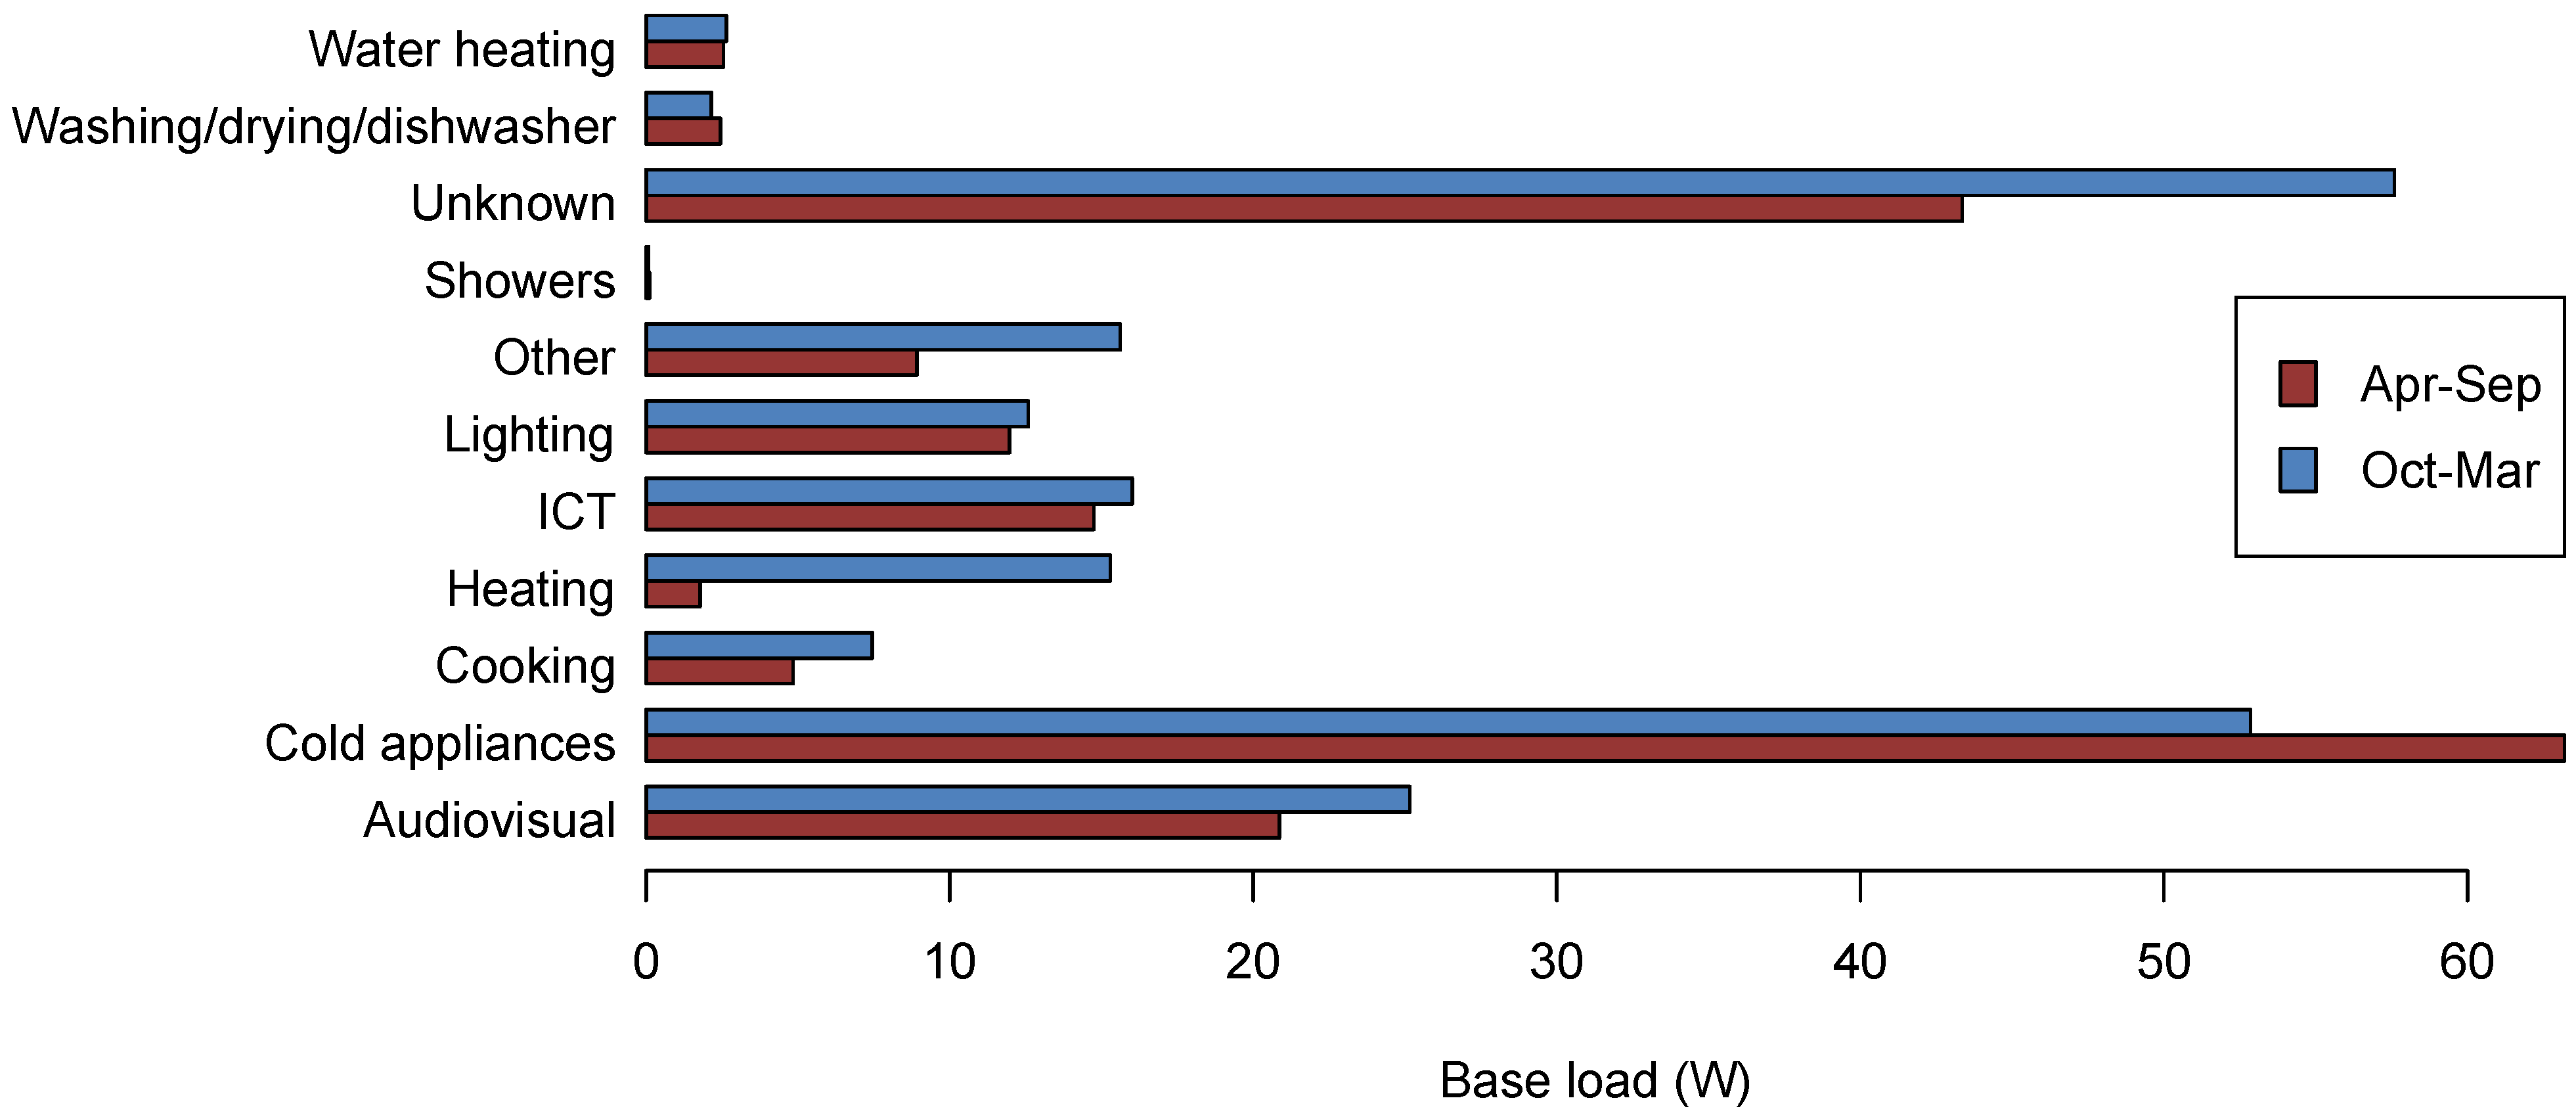
The majority of known domestic base load power is used to run fridges and freezers, which on average account for more than two-fifths of the total. Even during the winter, when the ambient temperatures are more favourable, these appliances remain the largest component of base load. This means that improvements in the efficiency of cold appliances have the potential to make a larger impact on base load power than interventions to other appliances.
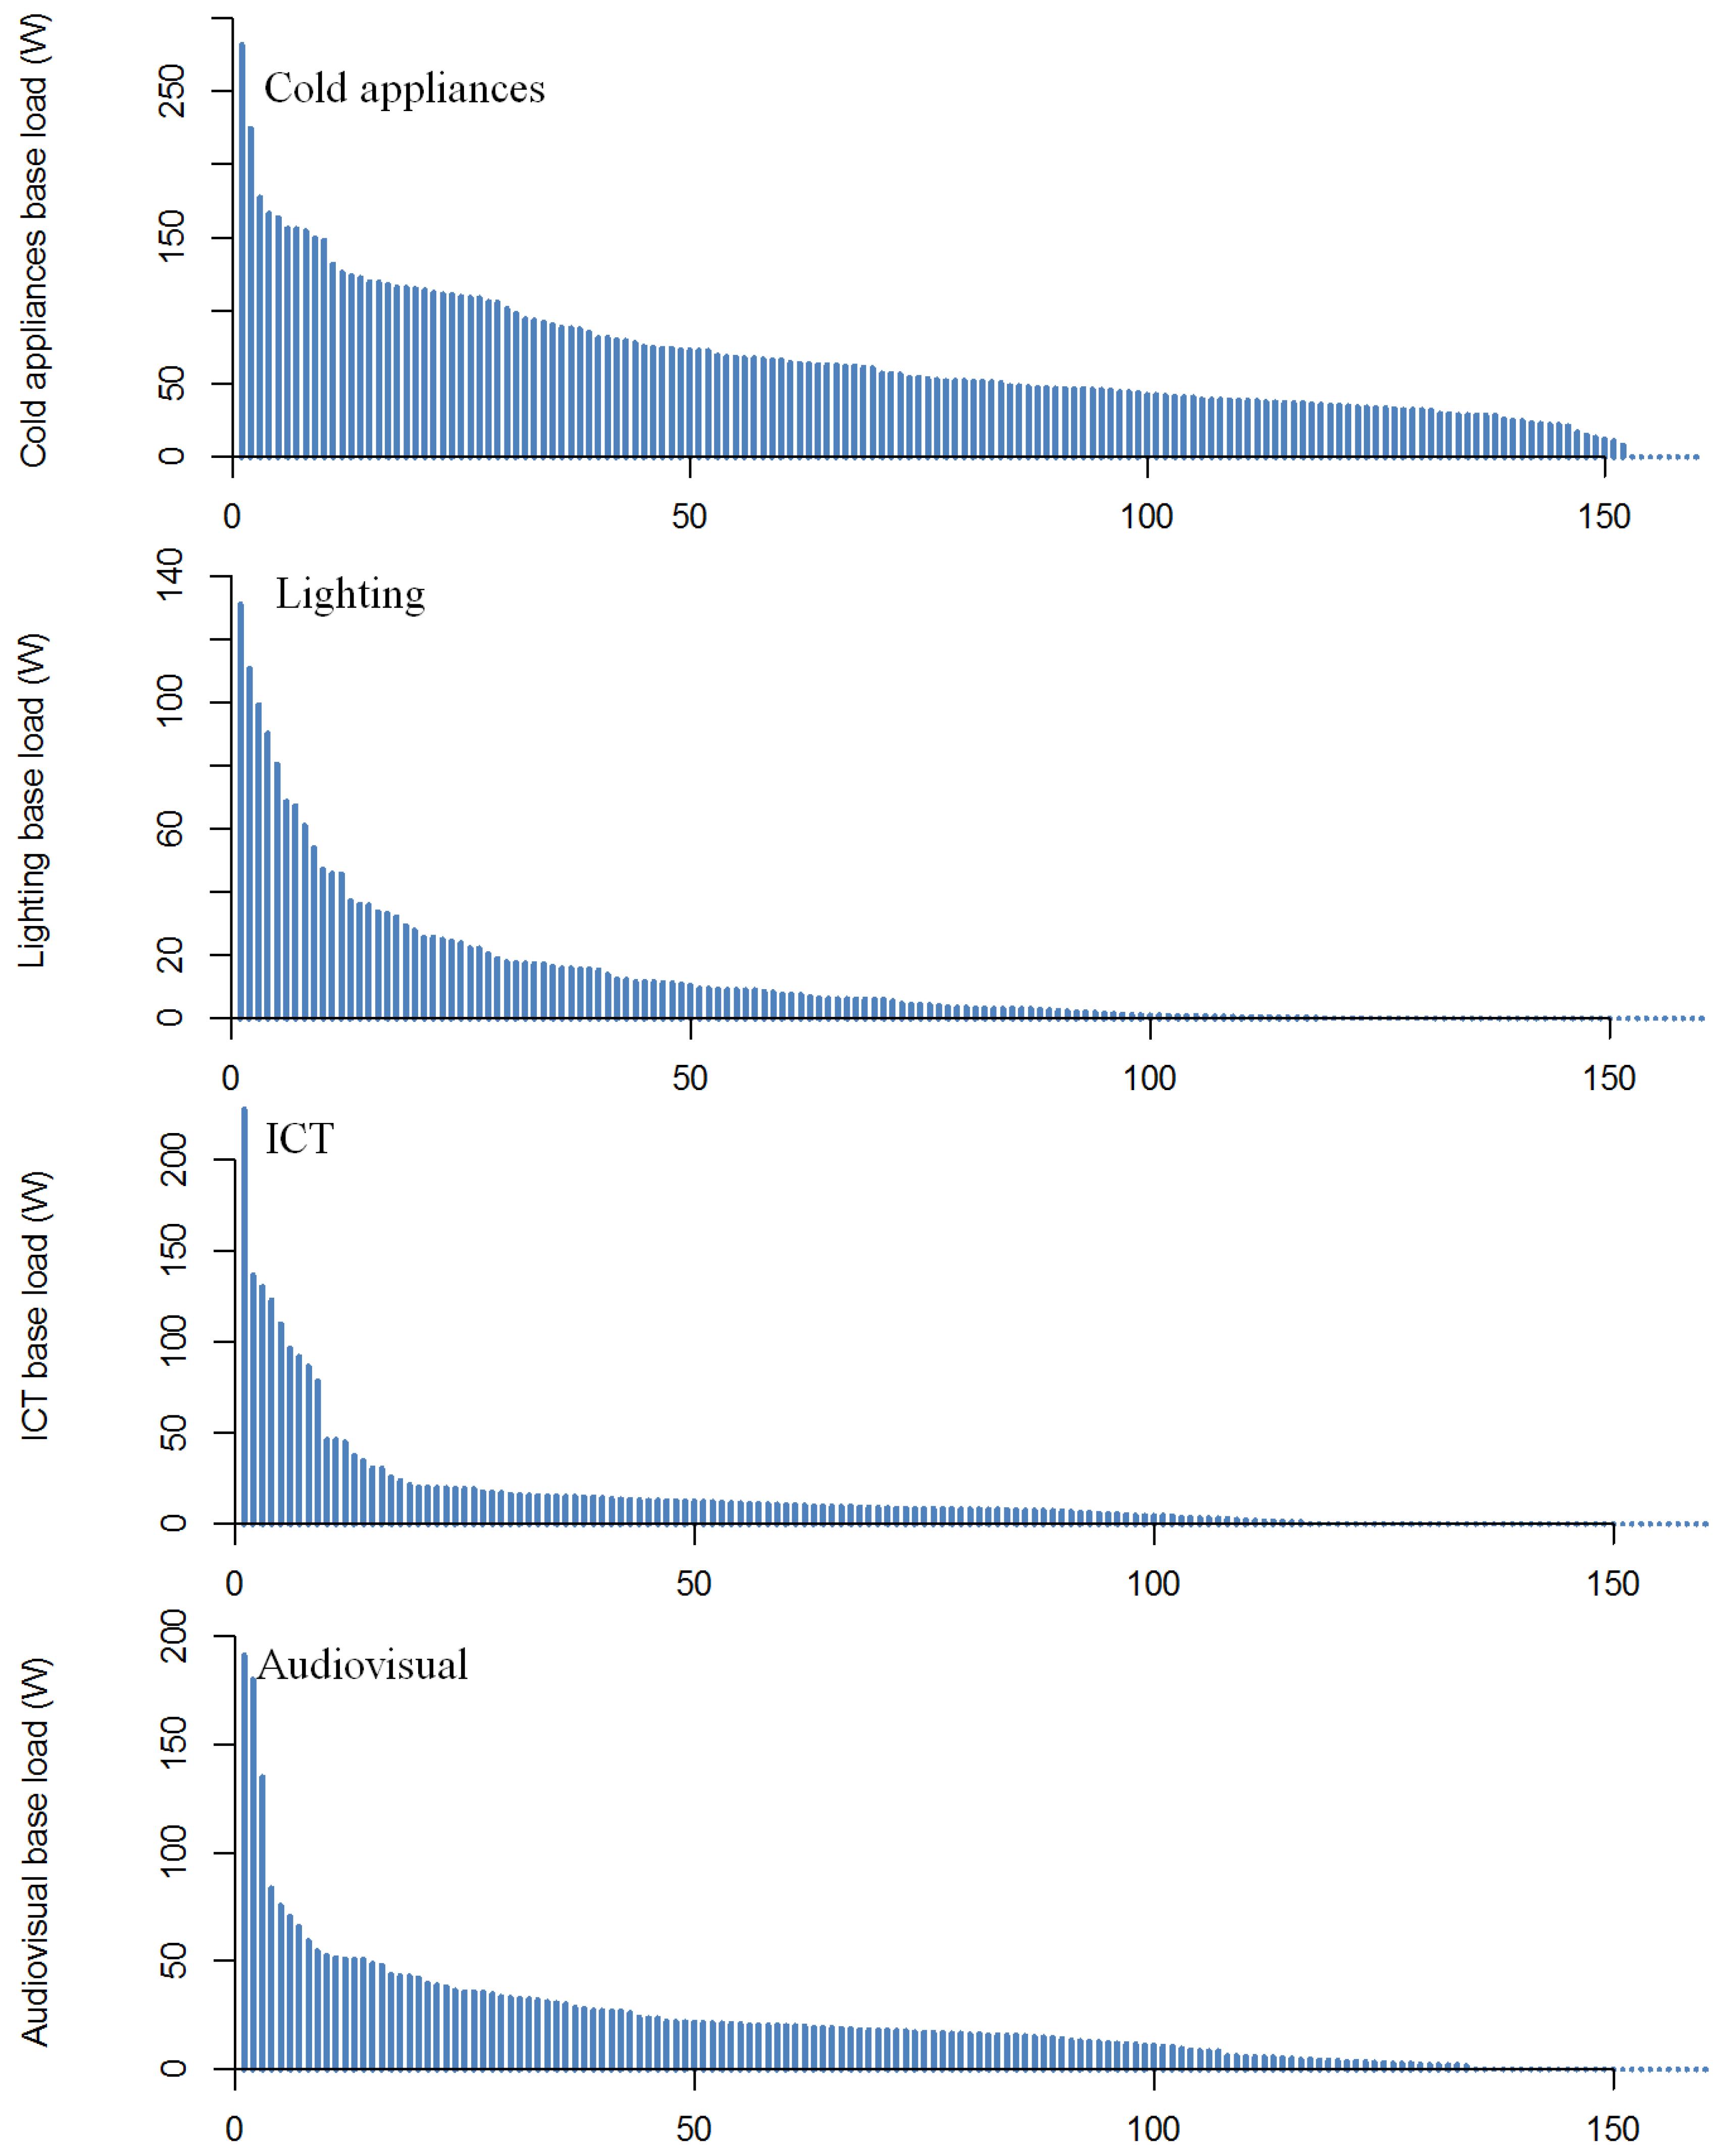
For a few appliance categories, relatively small numbers of homes were found to account for a large share of the base load power demand. For example, 17% of homes account for 71% of the total lighting base load, and there are similar skewed distributions for audiovisual and ICT base load electricity use. This suggests that, for these appliances, if policymakers wished to reduce base load power use (for instance, to allow for more overnight charging of electric vehicles, or overnight use of heat pumps), interventions targeting the key high-use households would be particularly effective—if these could be identified. By contrast, the base load for some uses, most notably cold appliances, were found to have a more uniform distribution.
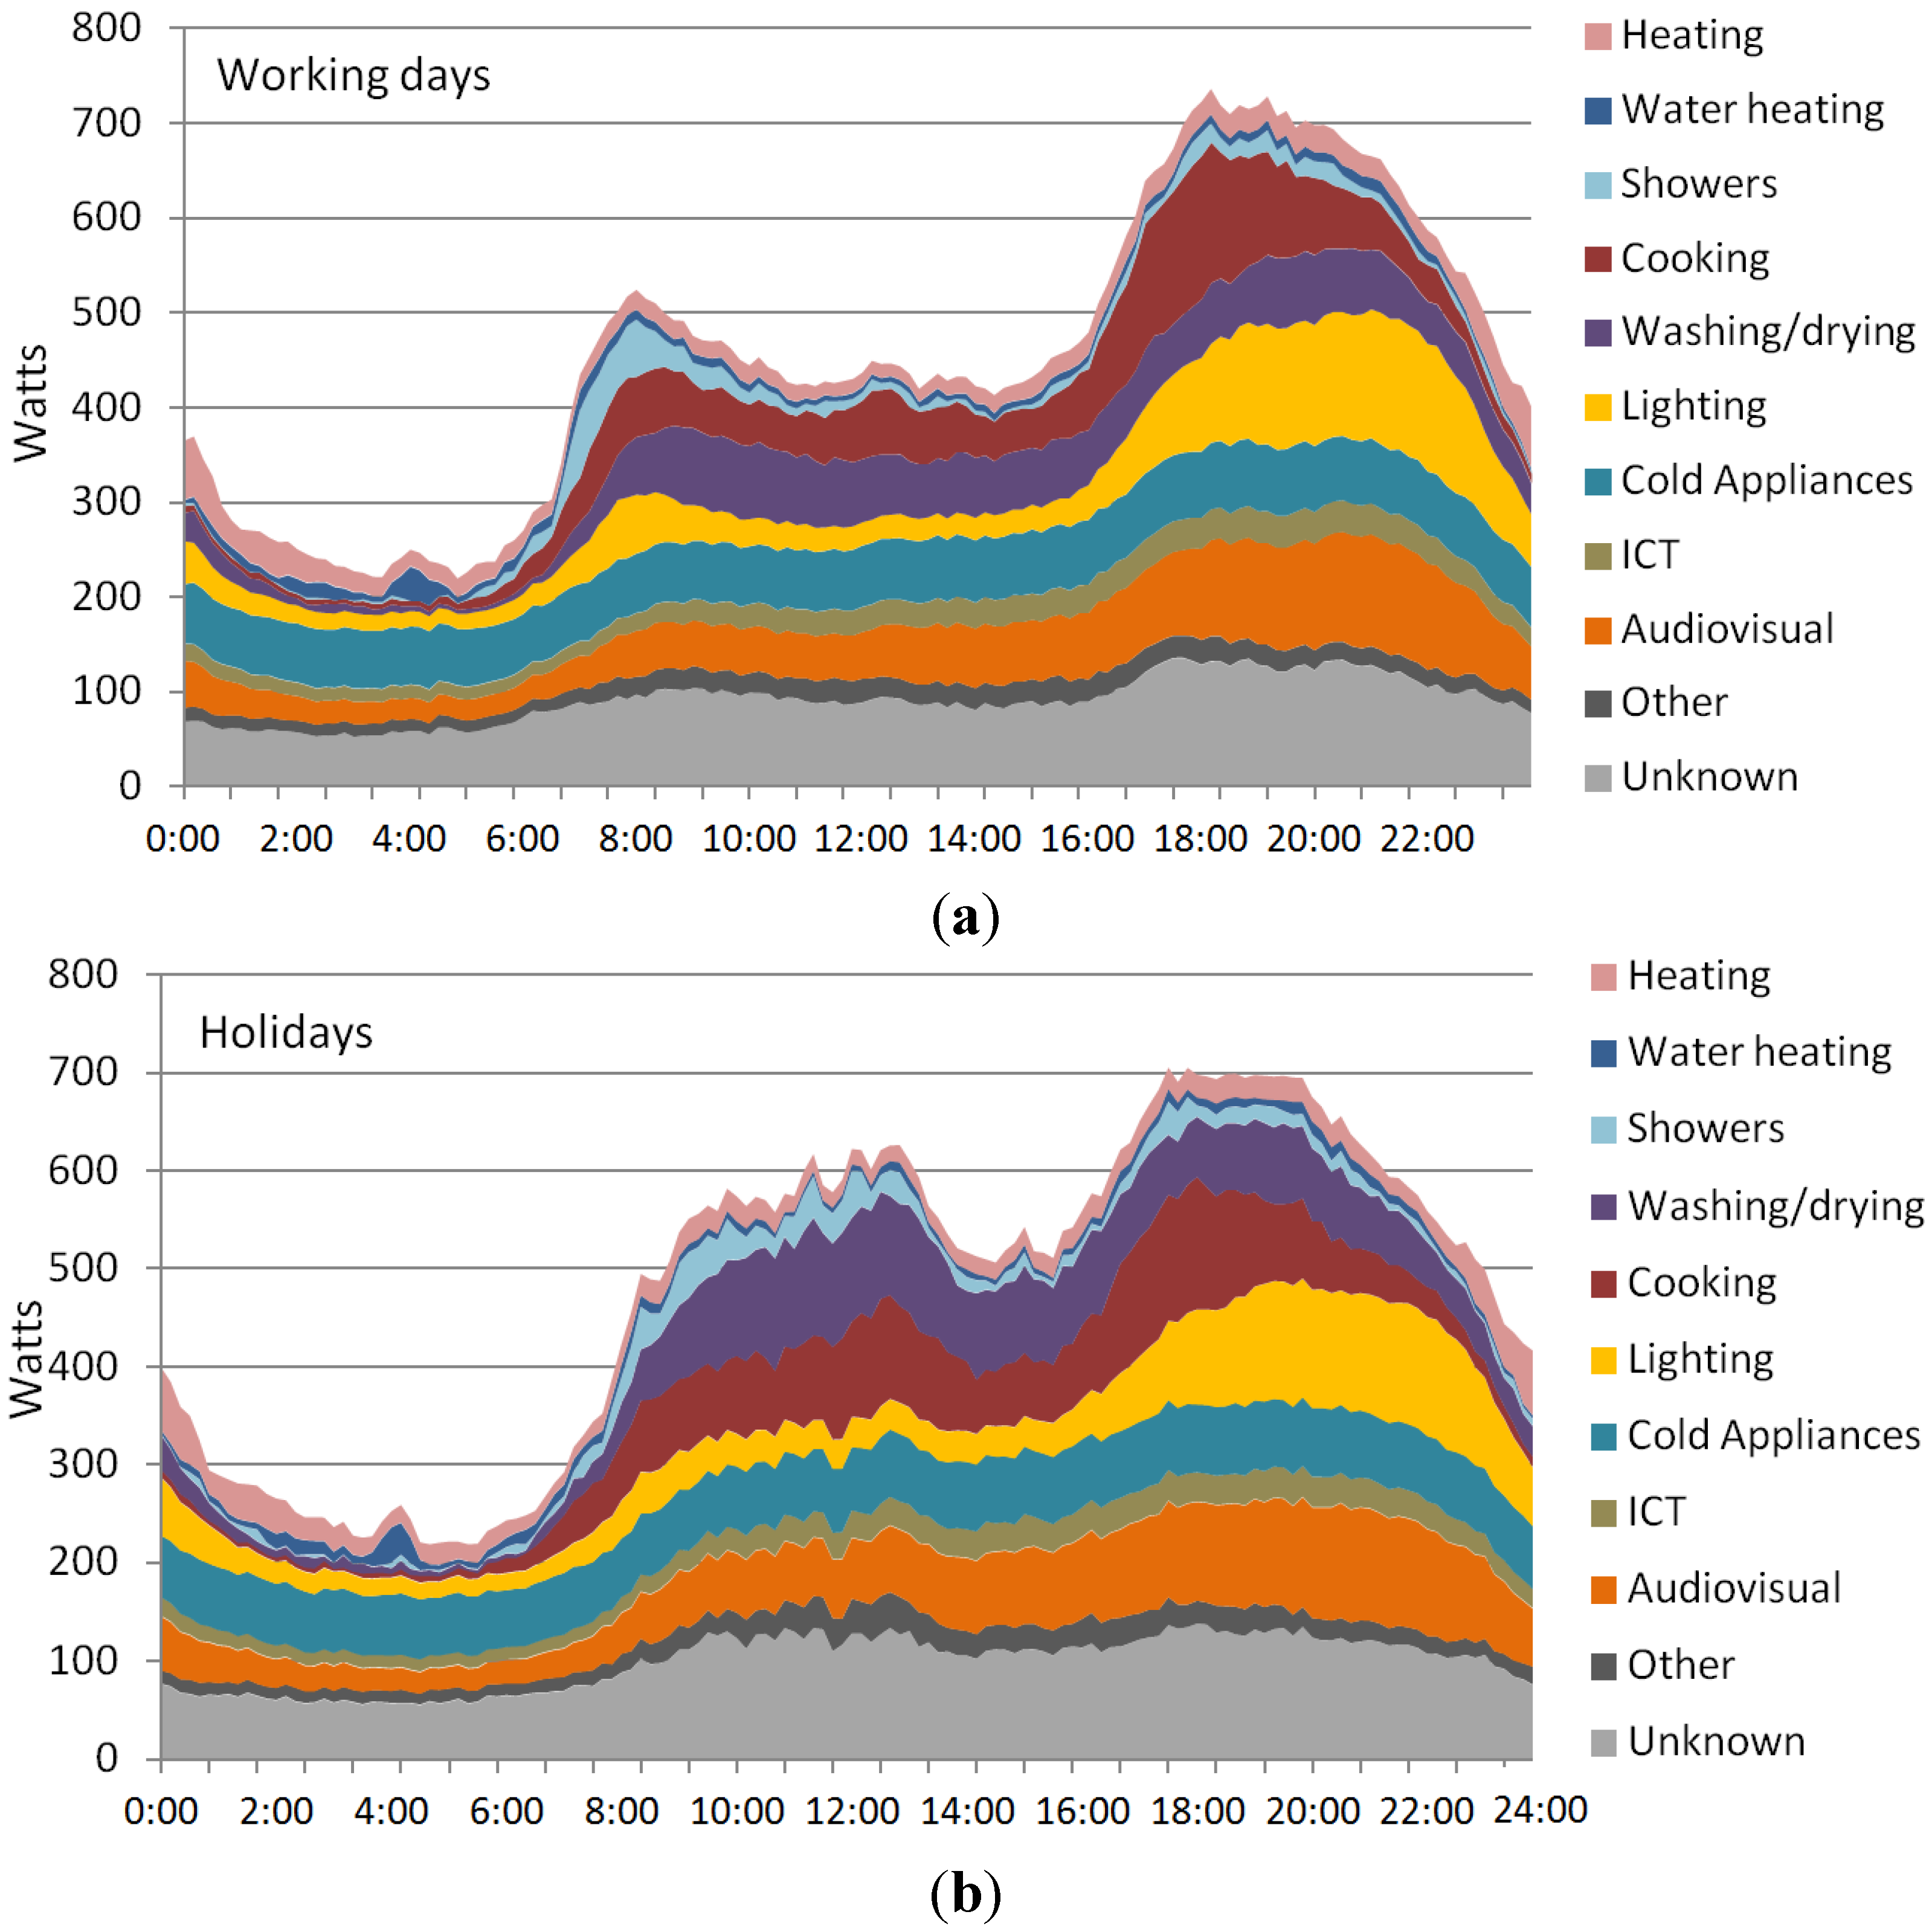
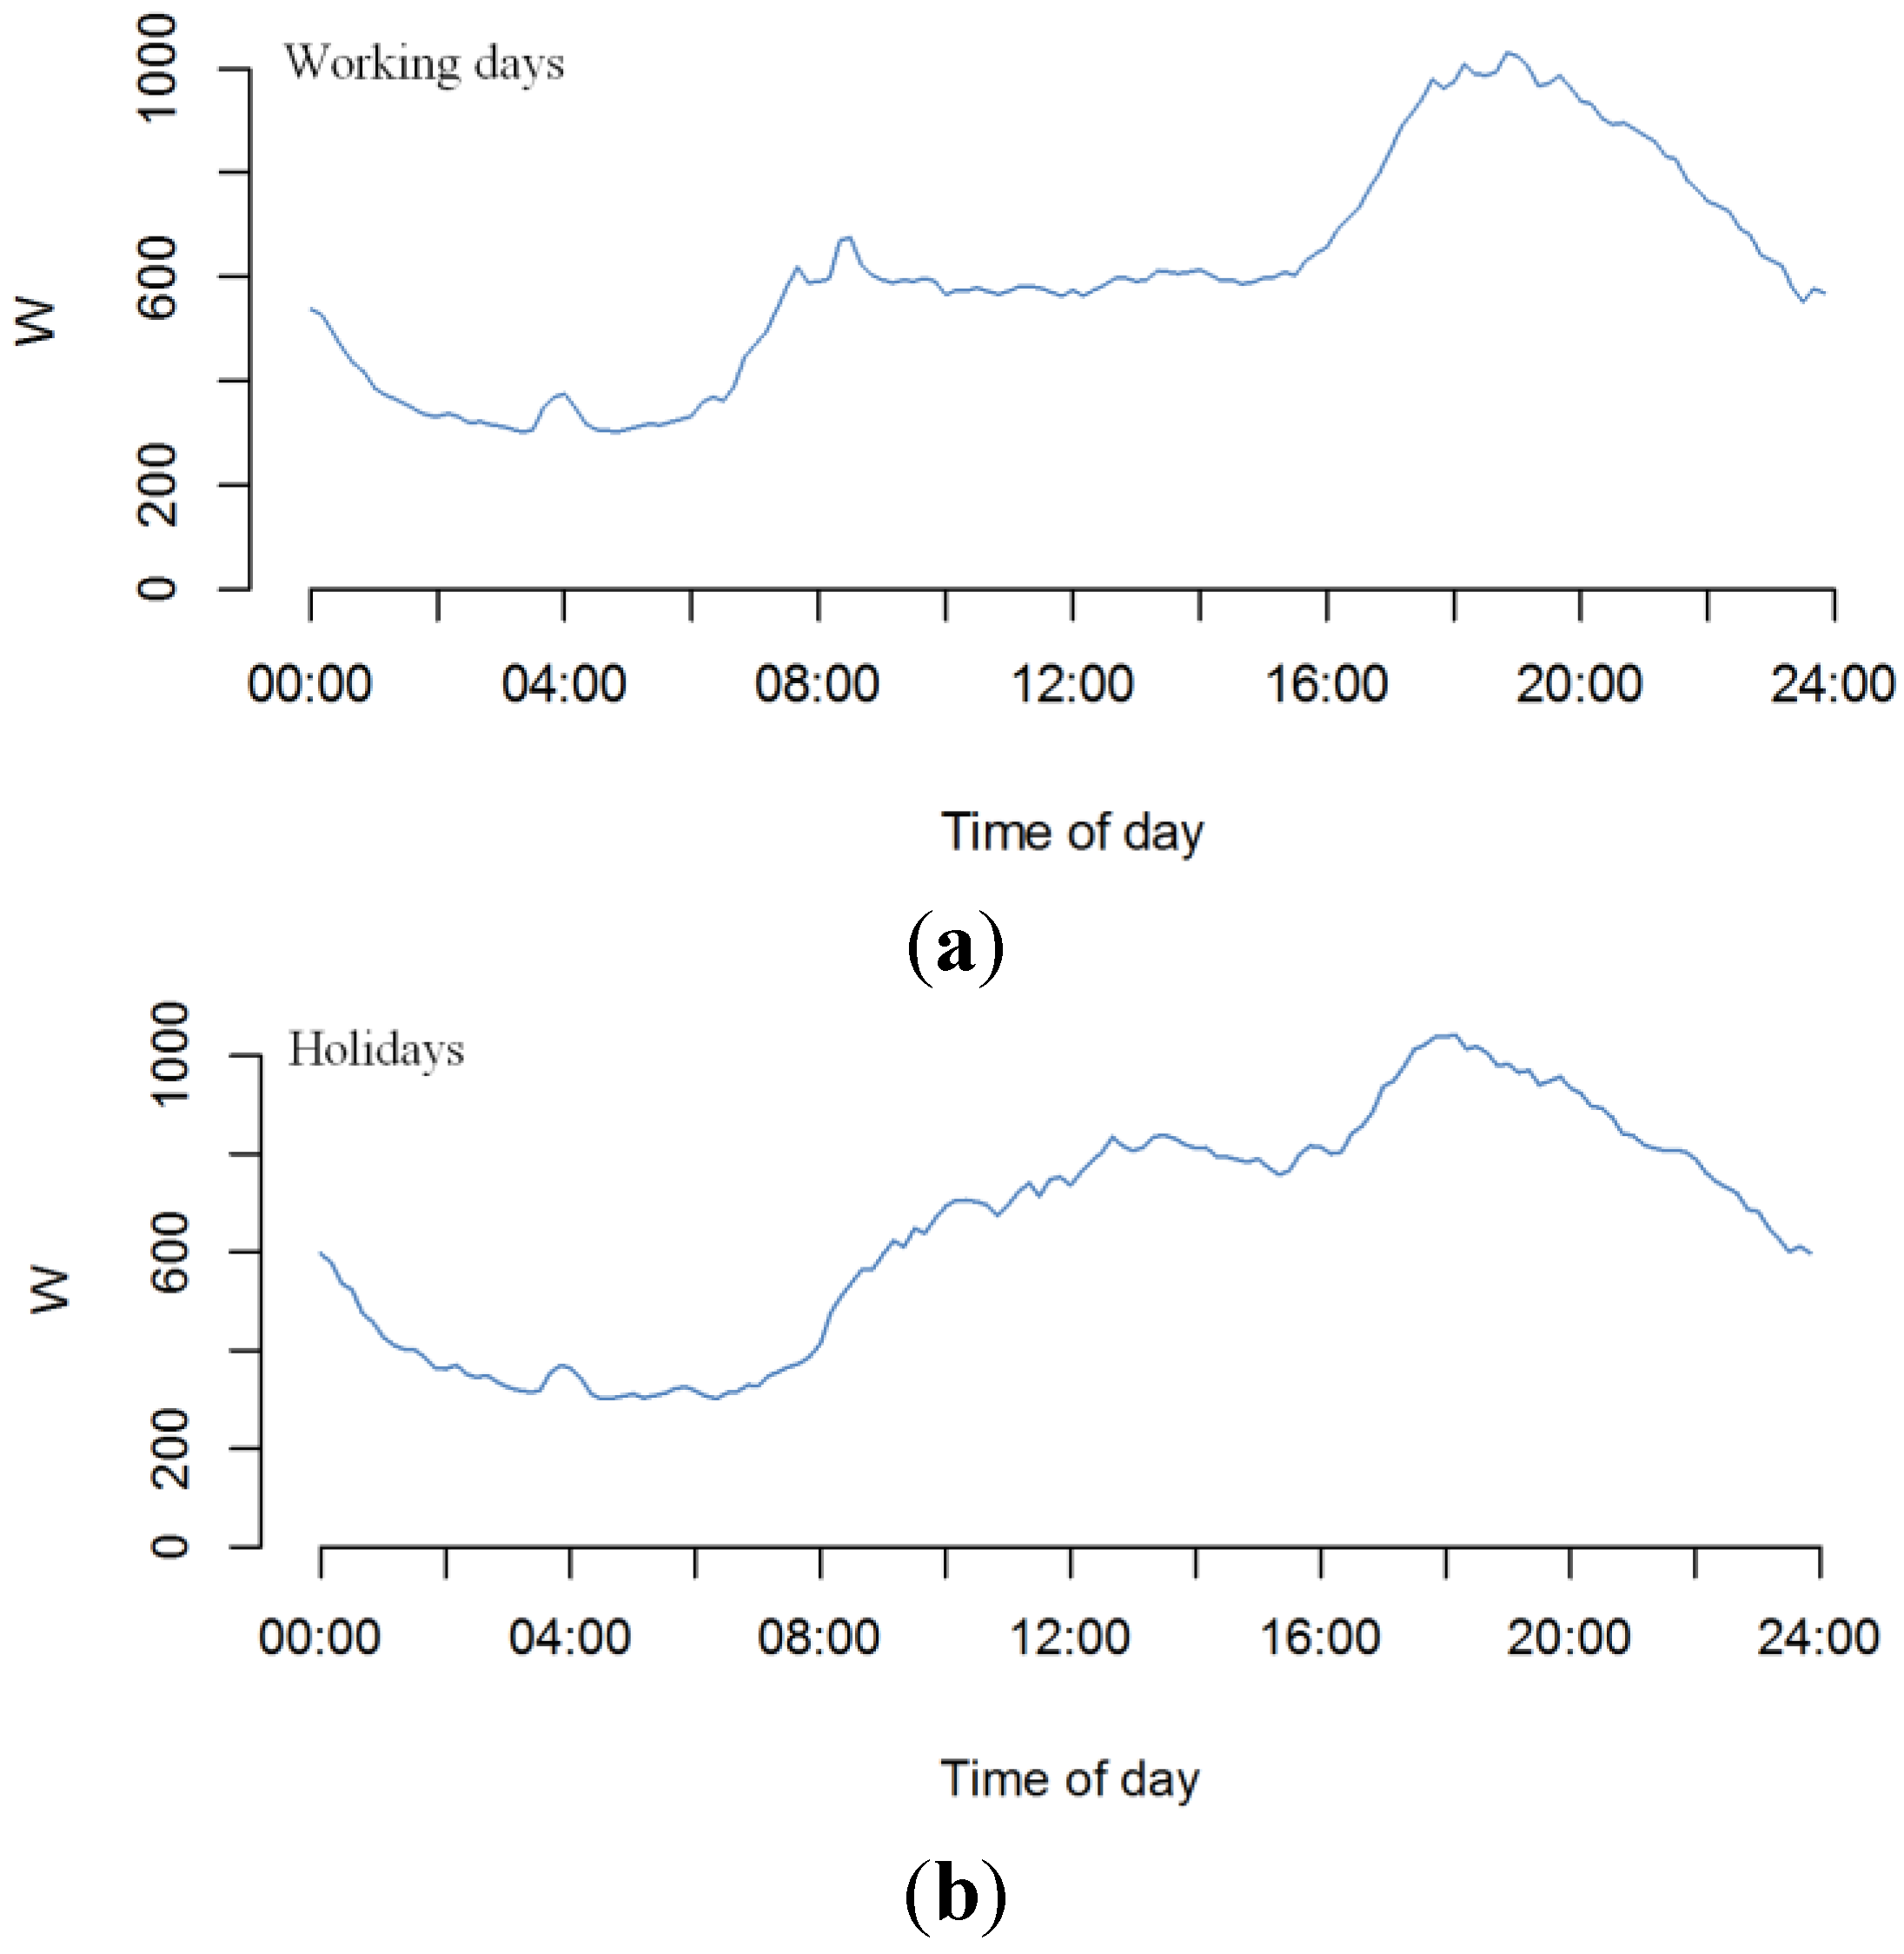
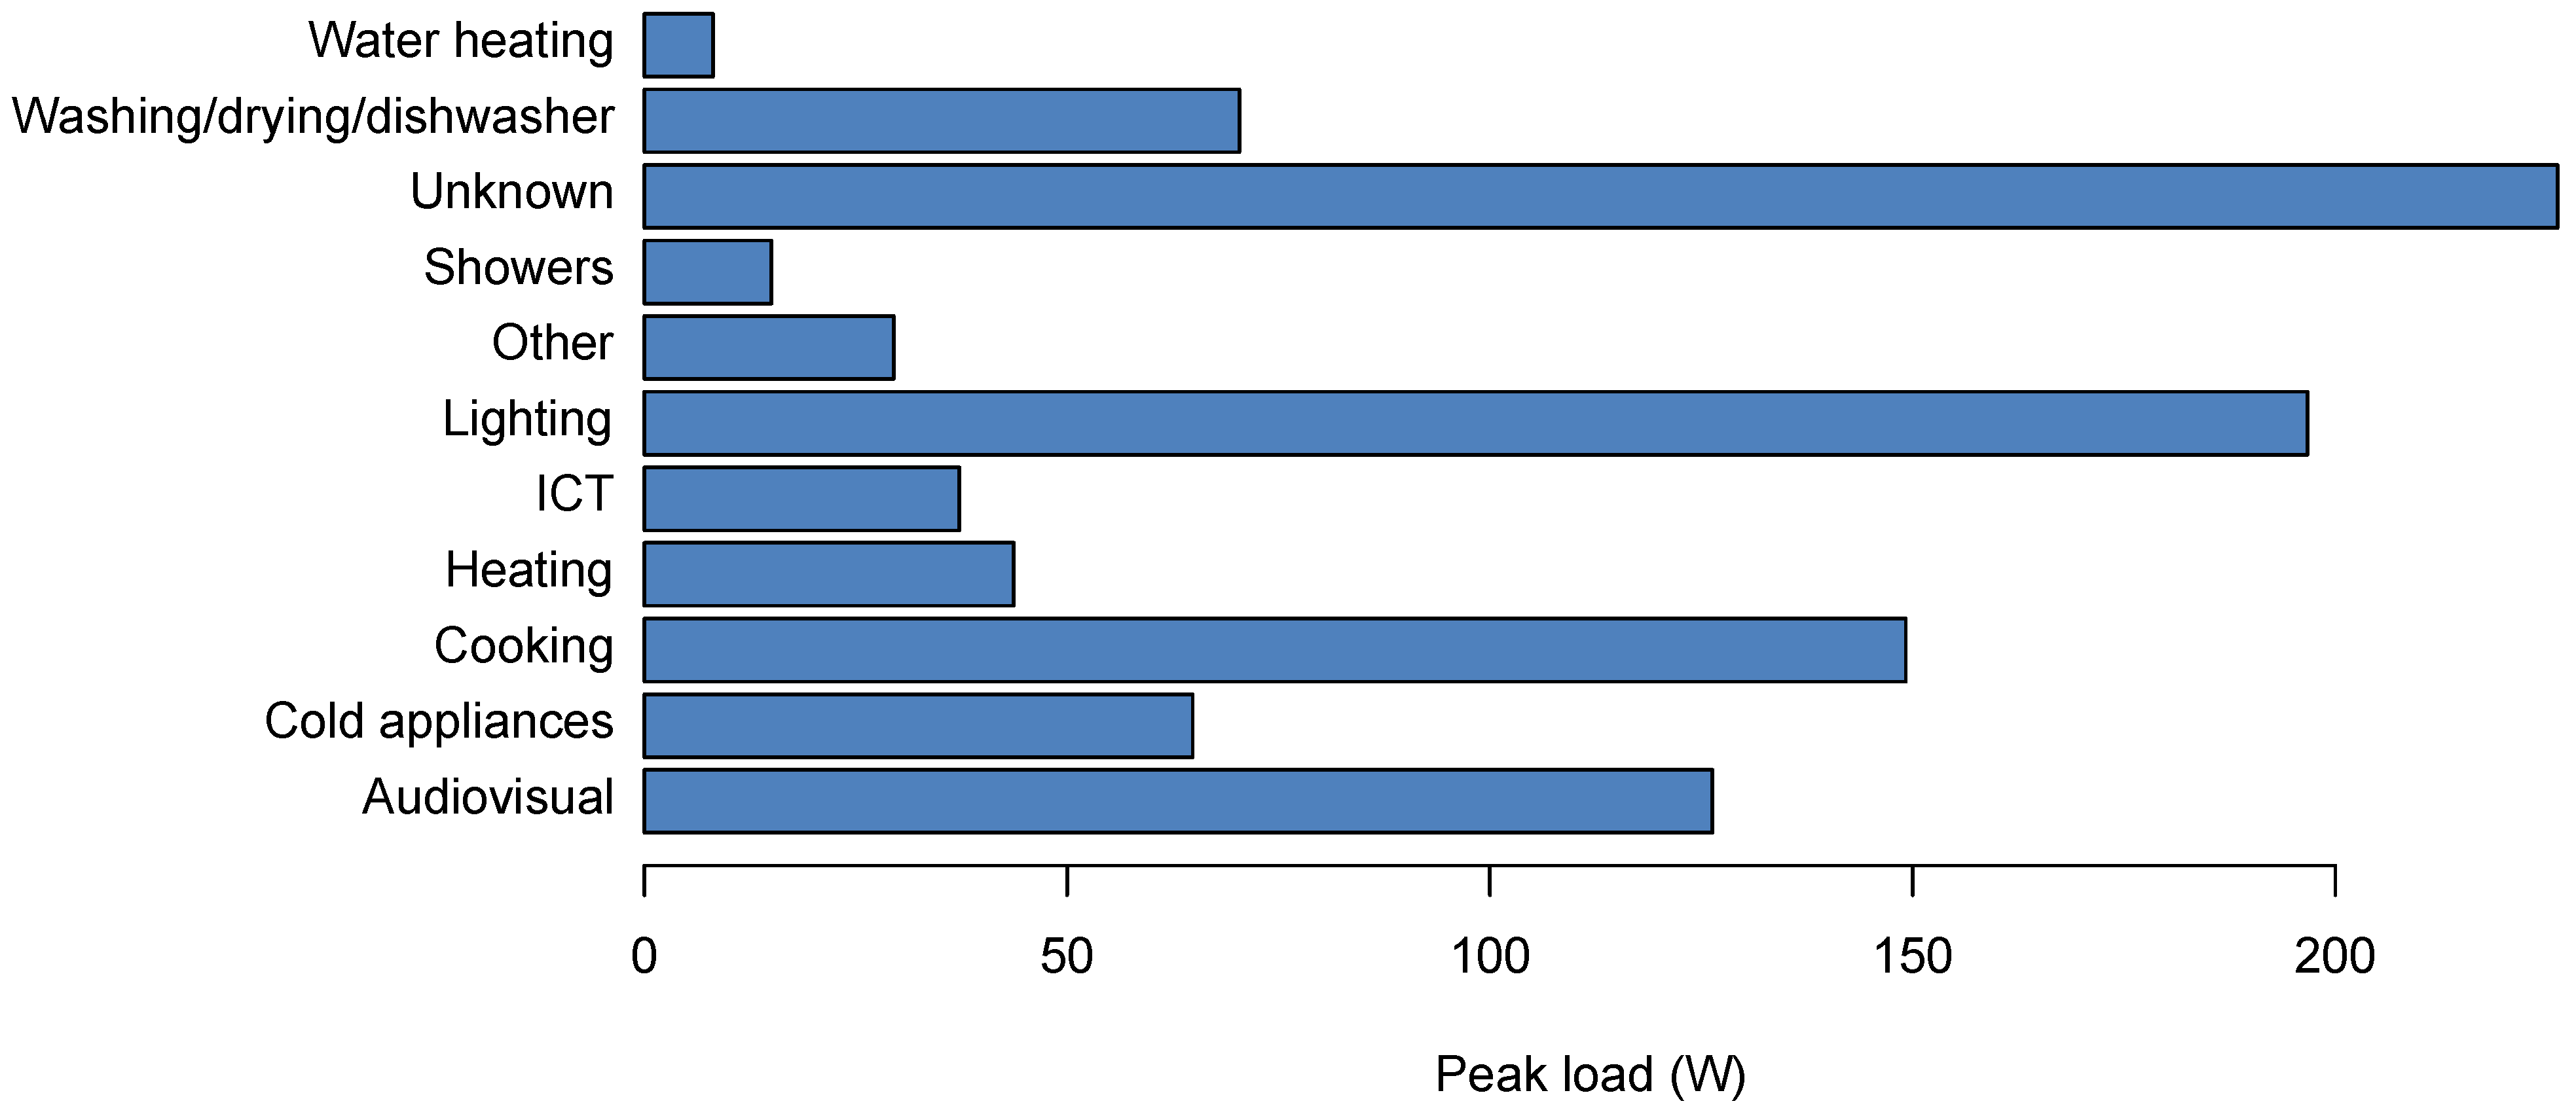
Average peak electricity use for the sample was from 6 p.m. to 7 p.m. in winter, with a mean of 970 Watts per household. The largest share of known electricity use at this time was lighting, cooking and audiovisual appliances, which unfortunately are all hard to shift to other times of day. Consequently, substituting more efficient appliances, and particularly more efficient lighting, would make a bigger difference than “peak load” interventions per se.
There is the potential for shifting the time of use of washing appliances, for instance using timers. However, there have been concerns about fire safety when using these appliances overnight [
33], and the analysis suggests that the potential savings are small: on average wet appliances account for only 7% of domestic peak power. There is also the potential for using smart cold appliances (notably controls based on frequency response, which automatically cut out for short periods when there is high power demand on the grid), but again the potential savings are likely to be small (possibly less than 3% of peak power [
34]). Although load shifting of this scale may not have large impacts for individual households, aggregated to the regional or national scale the benefits for utilities providers may be important.
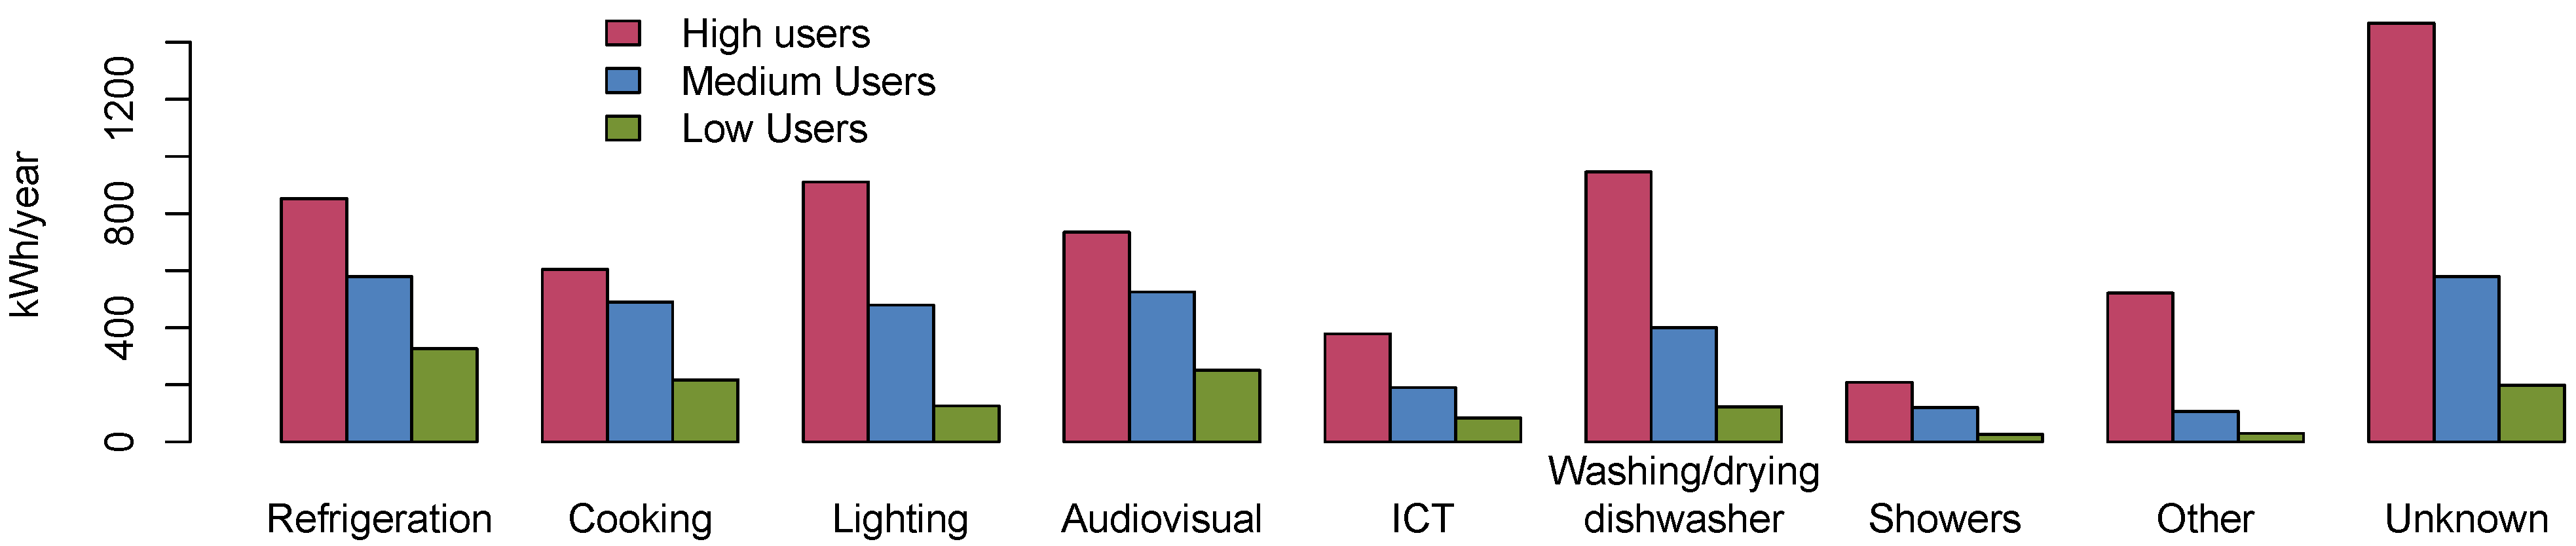
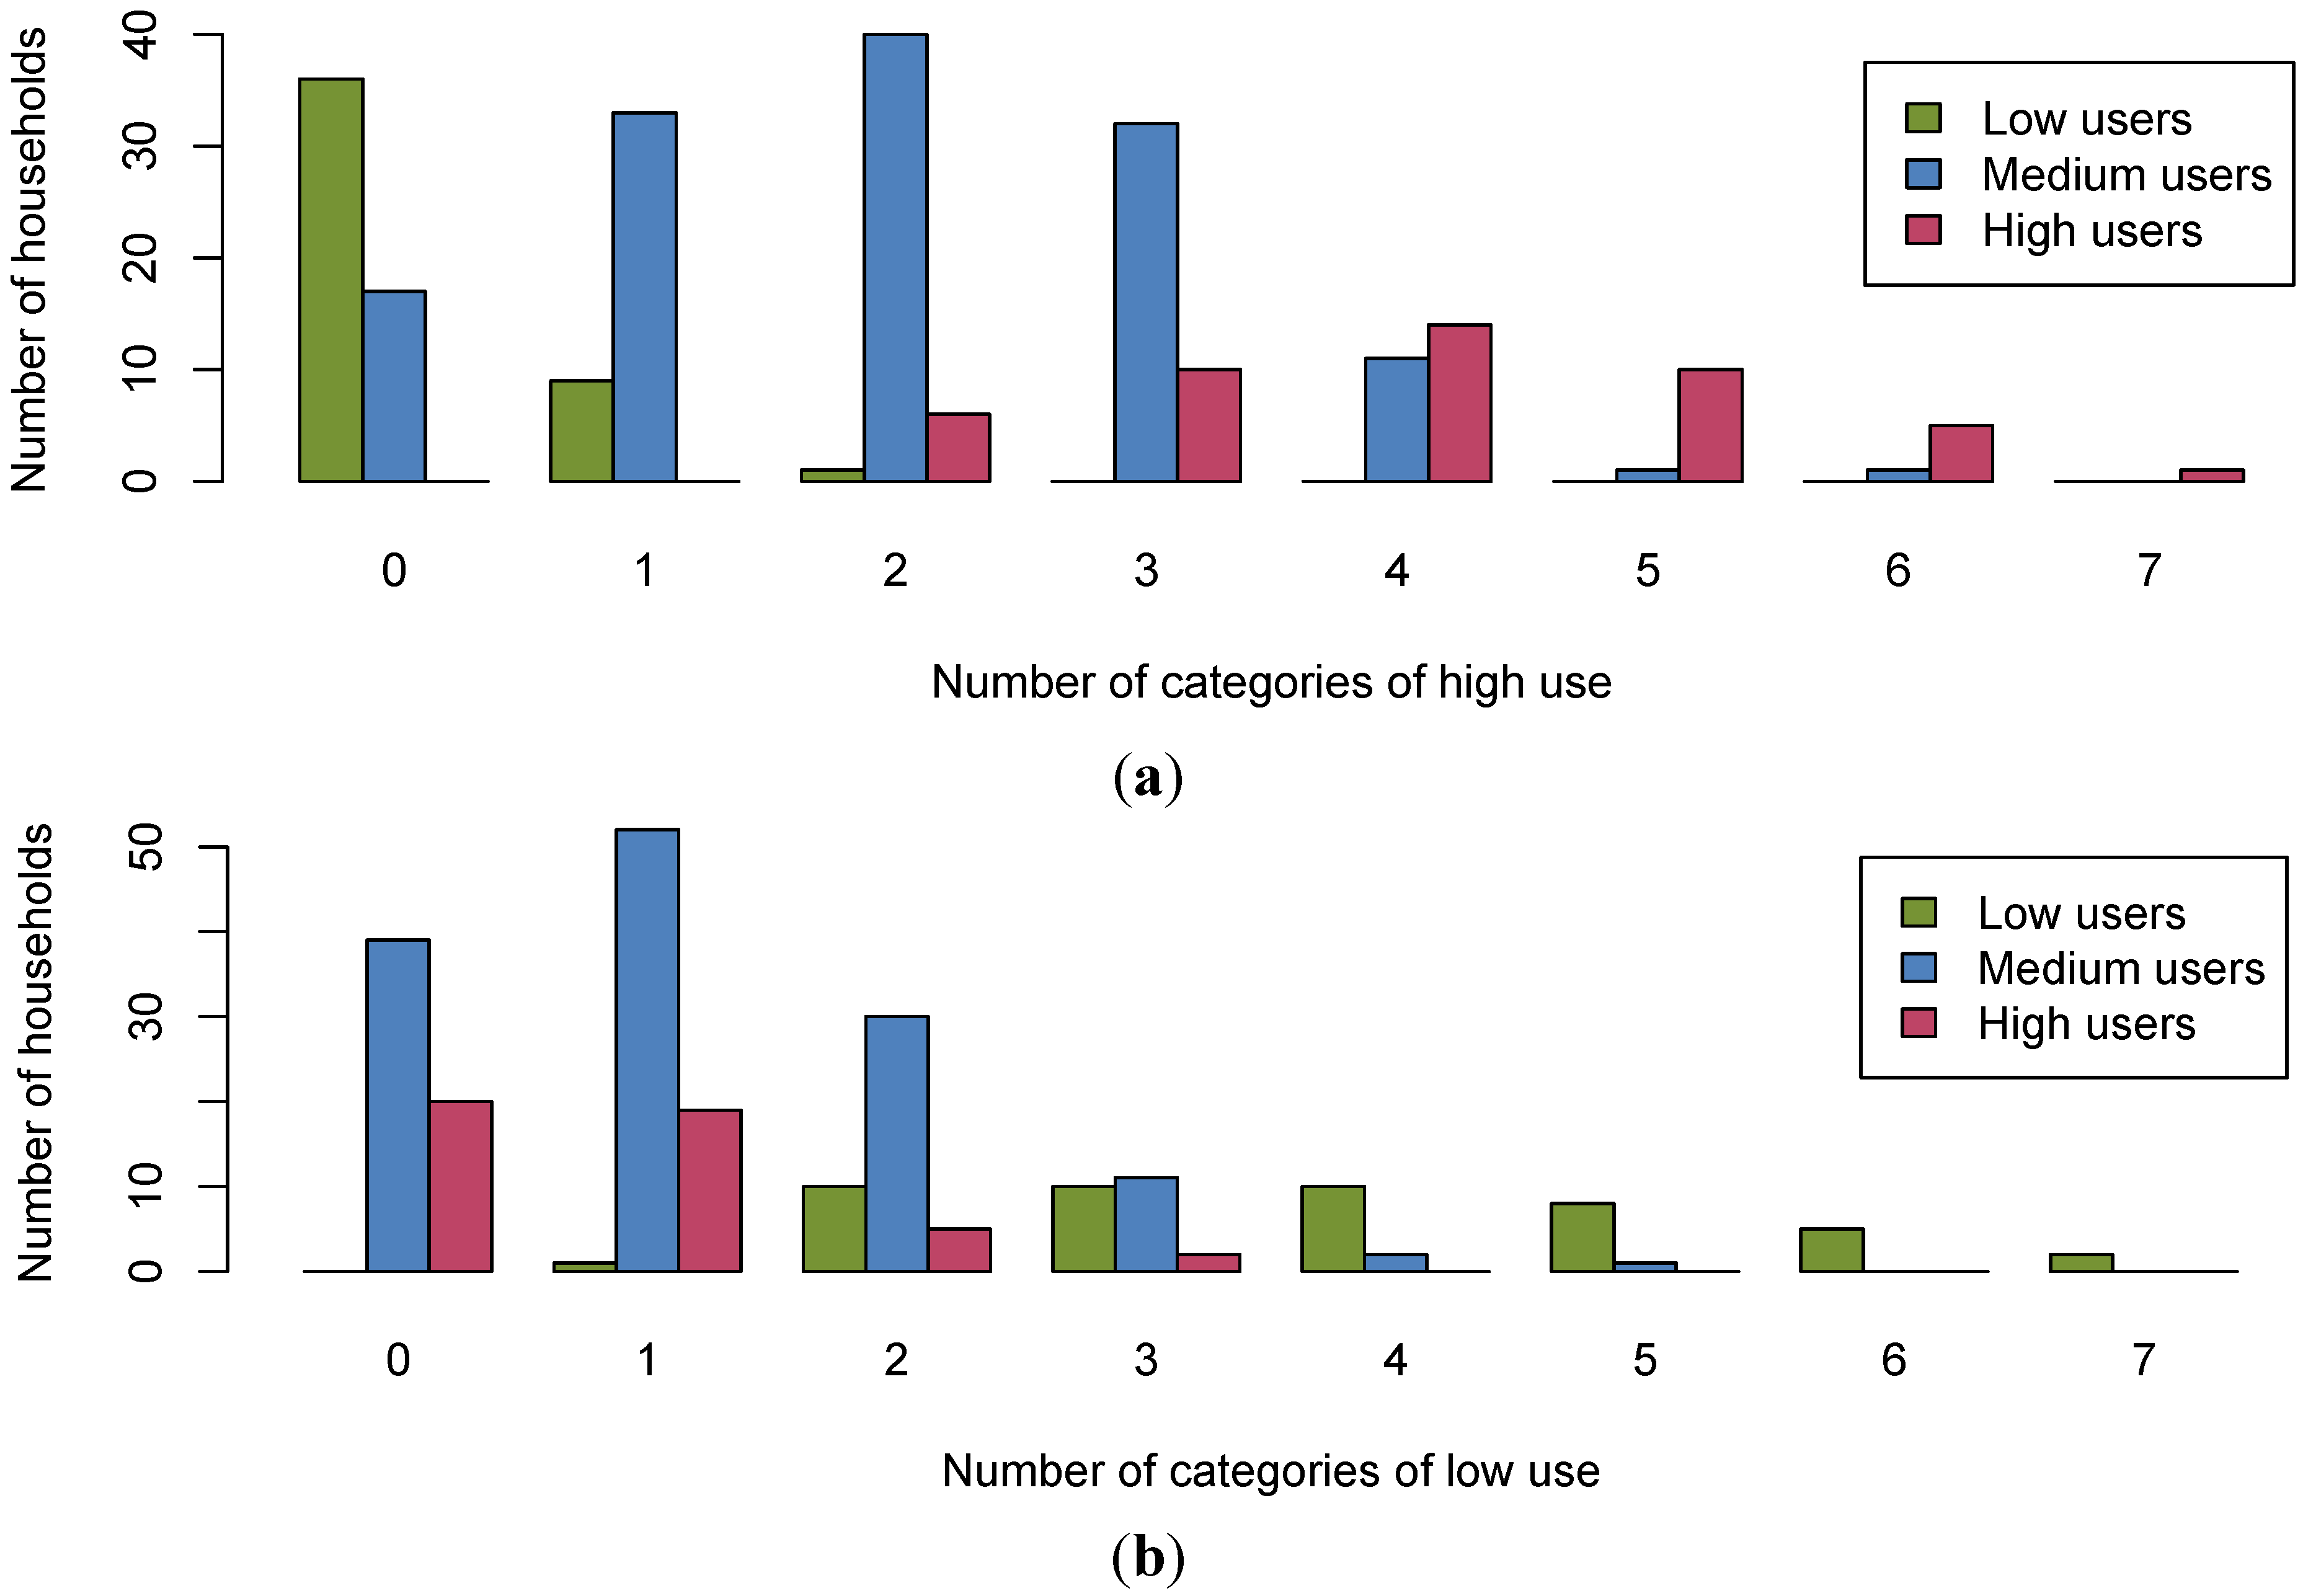
The characteristics of high and low energy consuming households were examined, both at the scale of overall electricity use, and the different appliance groups. The reasons for high and low use were found to be both varied and complex. High consuming households typically exhibited high consumption across a number of appliance groups but, significantly, rarely all of them. Consequently, reducing electricity use among high users would require identifying and making improvements across a range of different appliance types in each home. Even the low-use households were very seldom low in every appliance category-typically they were in two to five categories, and some high-use households were found to demonstrate low use in some areas.
This has implications for policy: instead of simply encouraging generic, blanket improvements to all forms of electricity use in high-consuming dwellings, it may be more effective to provide information, incentives, grants or other appropriate interventions targeted at specific high-use appliance characteristics. There may also be a case for enabling householders to compare their use of electricity for specific appliance types with their peers. Many studies have found that such comparisons, and the spirit of competition they help to engender, can be effective in helping to reduce total energy use [
35,
36]. Potentially, comparisons of energy use for specific appliances may help to prompt savings, especially if householders see that they have particularly high energy use compared to their peers.
Unfortunately, the fact that overall dwelling energy use does not necessarily indicate energy performance at the scale of the individual appliances, highlights the difficulty households may have in making improvements based solely on metering installed at the distribution board. Without understanding the internal breakdown of uses (for example through appliance-scale metering, or by switching appliances on and off with distribution-level smart metering), it may be difficult to identify the most appropriate improvement measures for each home. A related issue that further complicates research in this field is the enormous range in energy use for individual appliance types. For example, a more than tenfold variation was observed, between the highest and lowest HES energy consumers for audiovisual appliances and electric showers.
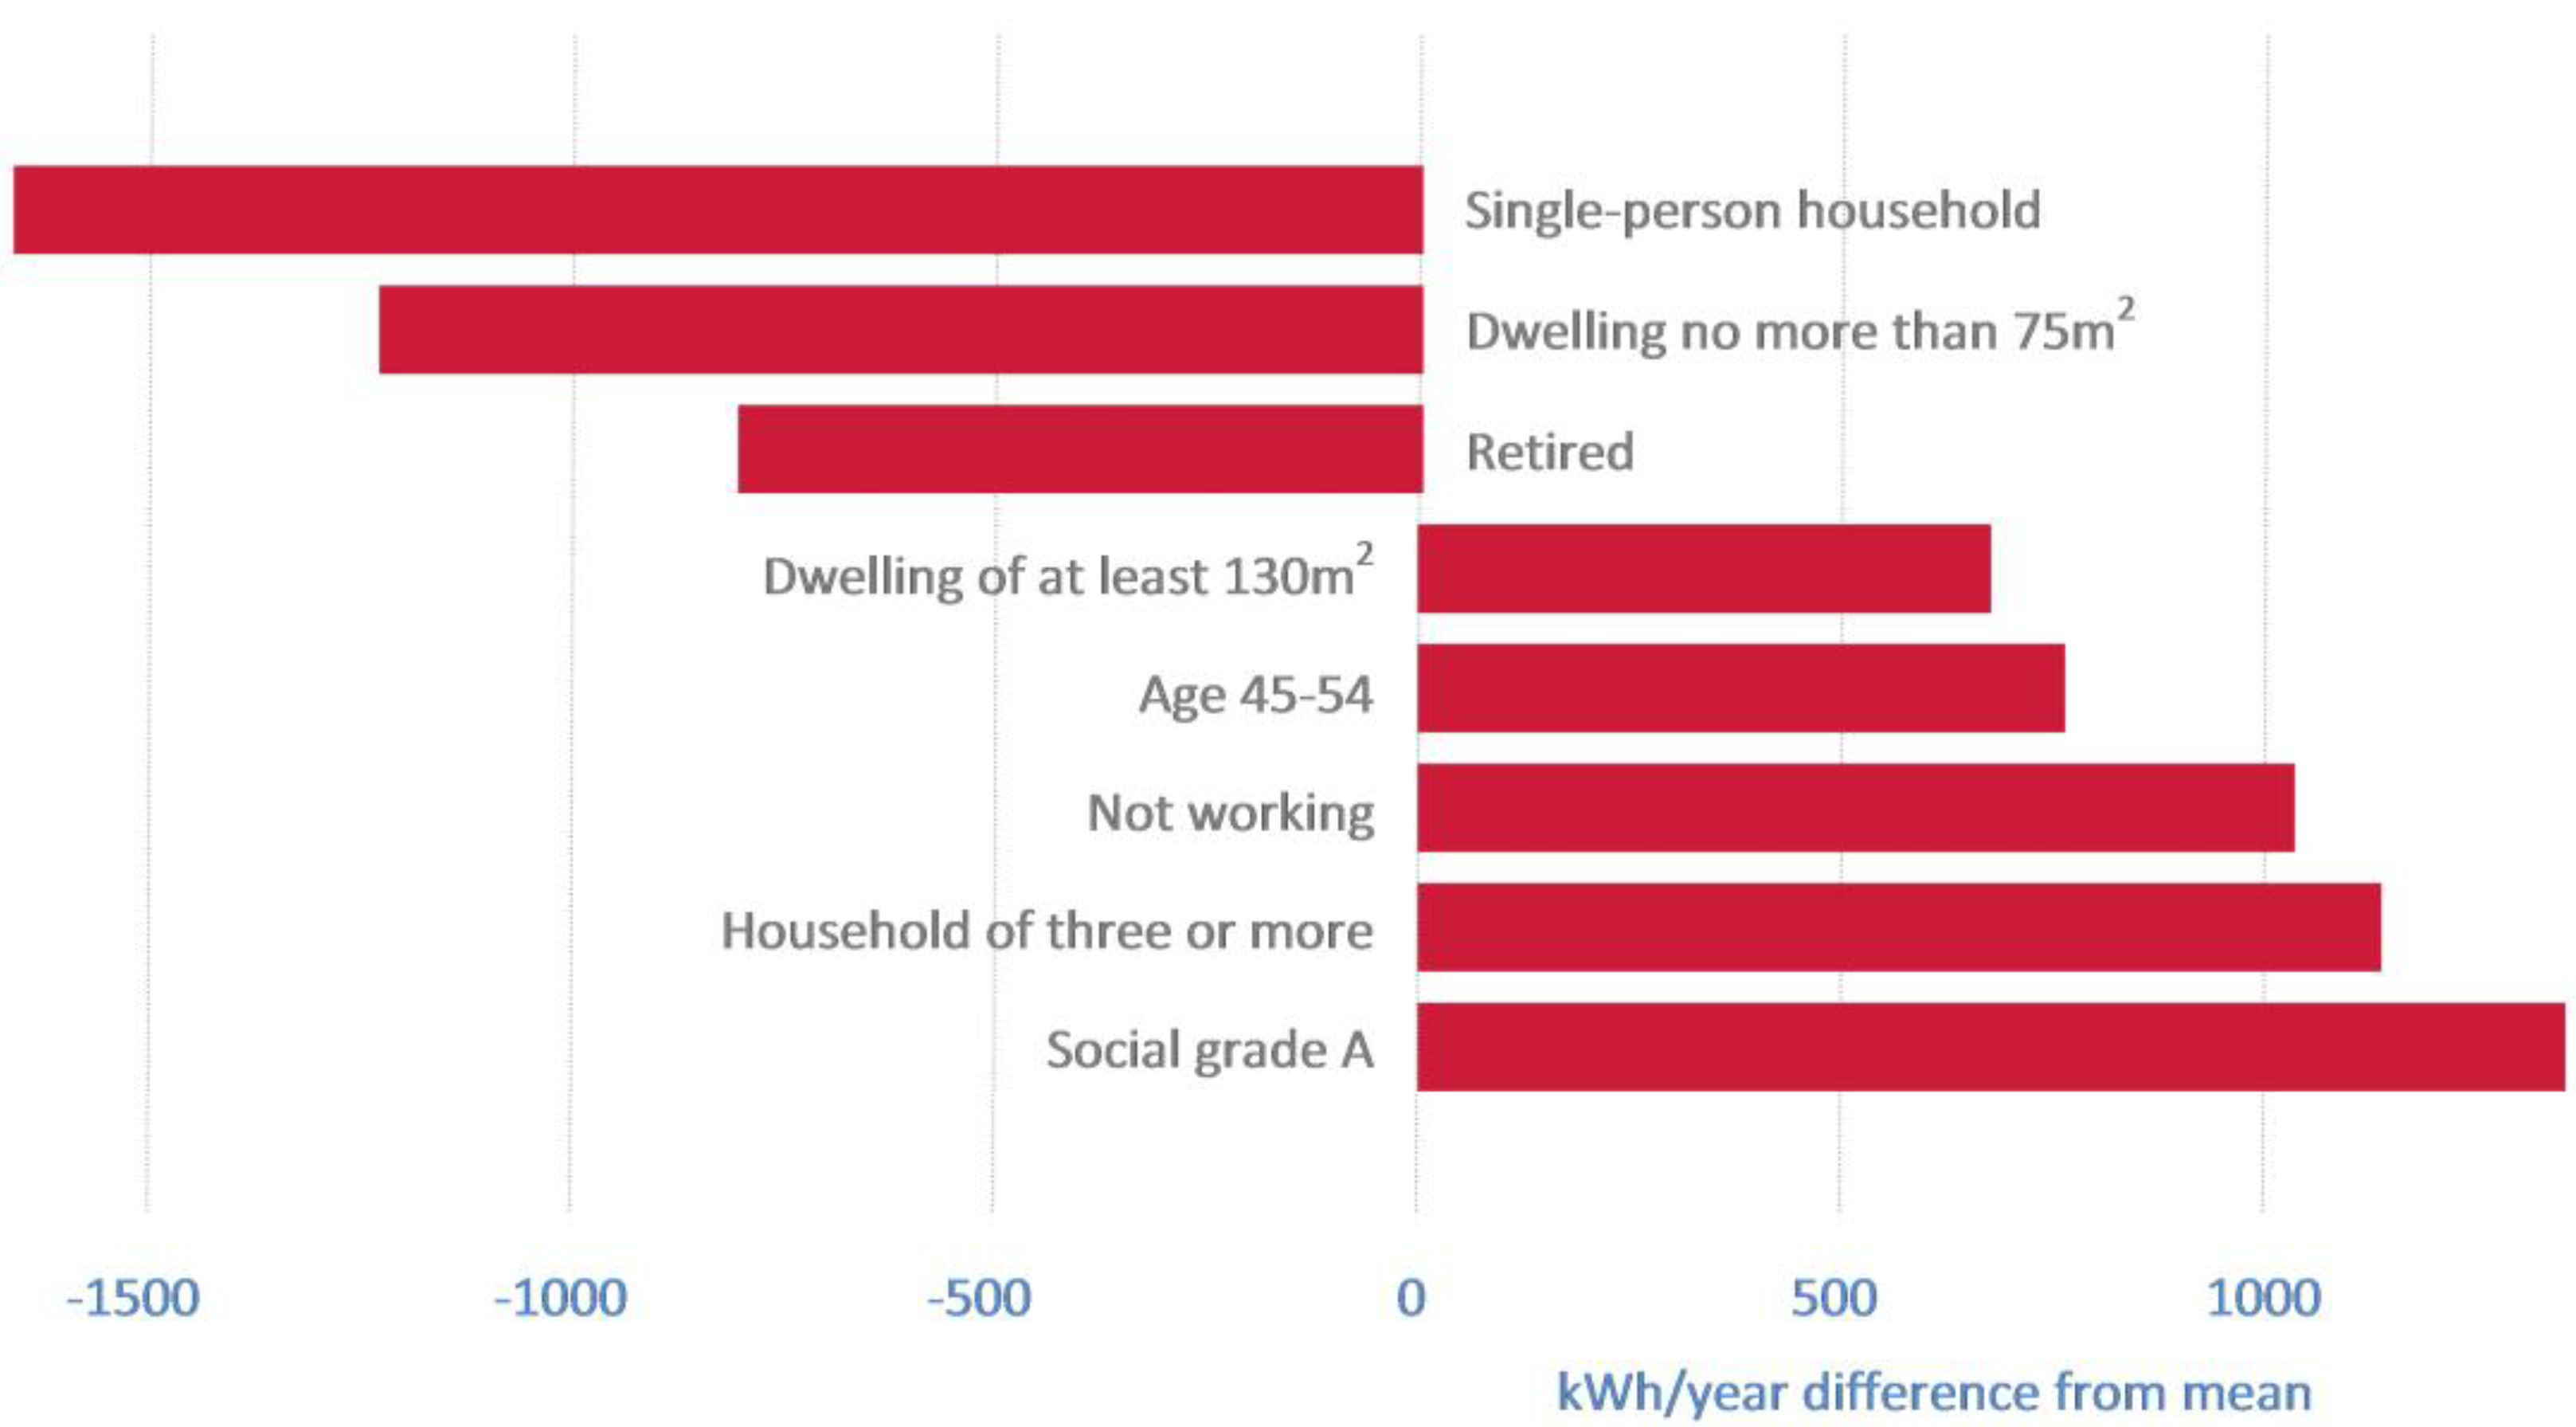
The results of the multi-variate analysis identified different demographic variables correlating with variations in household electricity use. The analysis suggests that working households have lower energy use for audiovisual appliances than other households of working age. It also indicates that energy use for lighting is highest among the highest social grades. More empirical work is needed to further explore the drivers for residential energy performance, and the multi-variate analysis is somewhat stymied by small samples.
The absence of income data for the HES households means that it is not possible to compare the results directly with past studies that have shown that income is a major driver of electricity use. However, a number of the variables examined, like dwelling size and social grade, may be indirect indicators for income suggesting that income is important. Dwelling size and the number of occupants did emerge from the analysis as important factors, consistent with past research [
15,
16,
17]. Furthermore, the findings from this paper are consistent with those of past work investigating the links between total electricity use and energy use for individual appliances [
22].
The HES survey had limitations, some of which have been mentioned already. Two of the biggest were the modest sample size and the inability to go back to the participants, following the monitoring, to examine why they used electricity as they did, or to explore how energy consumption could be reduced. (Indeed, the consent forms used during the survey specifically precluded follow-on interviews for most households.) The authors advocate further research work in this area, on greater numbers of households, alongside qualitative interviews and time-use diaries to give a more complete understanding of electricity use in homes.
Further work could also explore how biases in the HES sample impact on how representative the findings are of the overall domestic stock. In total, for 2011, the mean annual electricity use for the HES sample was within 1.5% of the UK average. It is likely that the omission of private rented and social housing from the sample distorts the data. A recent study found that owner-occupied homes use almost 14% more electricity than privately rented homes, which in turn use 8% more than social housing [
17], suggesting that the HES results may overestimate the average performance of the overall stock. However, more research is required to better understand the different patterns of electricity use at the scale of specific appliances, which have been found to vary with tenure [
21]. Furthermore, the drivers of these differences may be complex. For example, income and employment trends could impact indirectly on energy use, by correlating to variations in the average age of appliances in rented, as opposed to owner-occupied, homes. The HES bias towards households that are slightly more energy conscious than average is possibly less important than the difference in tenure. However, further empirical research could shed more light on any disparities.
Let us return to the title, “What can we learn from the Household Electricity Survey?” The depth and breadth of data gathered in the HES has presented a unique opportunity to improve the understanding of how electricity is used in contemporary UK homes. The paper highlights some of the potential that monitoring exercises have in quantifying the drivers for energy performance and how to relate this to policy issues. Despite the complexity of undertaking large-scale, long-term, detailed surveys like the HES, robust collection and analysis of actual household energy data is a key part of identifying the potential that the sector has for carbon emissions reductions, both for the UK and abroad.


