Article

The Environmental Design of Working Spaces in Equatorial Highlands Zones: The Case of Bogotá

by
Joana Carla Soares Gonçalves
1,* and
Juan Manuel Fernández
2
1
Department of Technology of Architecture and Urbanism of the Faculty of Architecture and Urbanism of the University of Sao Paulo, Rua do Lago, 876, Cidade Universitaria, Sao Paulo-SP 05508-080, Brazil
2
Architect and Environmental Consultant, Calle 109a 17-26, Bogotá, 110111 Colombia
*
Author to whom correspondence should be addressed.
Buildings 2015, 5(4), 1105-1130; https://doi.org/10.3390/buildings5041105
Submission received: 5 June 2015 / Revised: 14 September 2015 / Accepted: 17 September 2015 / Published: 9 October 2015
(This article belongs to the Special Issue Buildings, Design and Climate Change)

Abstract

:
Recent empirical investigations have indicated that the majority of occupants in office buildings would appreciate contact with the external environment, especially in cities where the climate is mild for part of the year. Supported by the possibilities of adaptive thermal models, the design of naturally ventilated buildings has been elaborated since the decade of 1990s. More communal areas rather than private ones are demanded due to the importance of social interaction and knowledge transfer among employees. In this context, this paper investigates the possibility of daylight and thermal comfort in naturally ventilated working environments, located in cities of mild climatic conditions, by redefining the parameters of a façade’s design and exploring coupling strategies with the outdoors. For this purpose, the city of Bogotá (Latitude 4°7′ N), in Colombia, a place with great potential for passive strategies, is taken as the geographic context of this research, which is supported by fieldwork with occupants of 37 office buildings and analytical work. The survey revealed that being close to a window is valued by the majority. Furthermore, 50% would like to have informal areas and outdoor spaces attached to their working environments. In additithe analytical studies showed how the combination of a set of environmental design strategies, including a schedule for coupling and decoupling of indoor spaces with the outdoors and a variation of occupancy density, made thermal comfort possible in free running working spaces in Bogotá.

1. Introduction

Since the 1990s, the growing dependency of office buildings on air conditioning systems for the cooling of internal spaces has been presented as one of the main reasons that classify the building sector as the most polluted of a country’s economy, since in global terms, the electricity demand for such an end-use has been associated with growing levels of CO2 emissions [1]. In the beginning of the 2000s, residential and commercial buildings were already responsible for 60% of the electricity produced worldwide [2,3,4,5].
In the case of commercial buildings, while the “business as usual scenario” shows an alarming growth in energy demand and consequent CO2 emissions coming from the building sector, especially in the warm region of the globe where urbanization is increasing, the potential for energy saving in buildings is also significant, given the fact that internal spaces of the conventional office building rely on air conditioning and artificial lighting during the entire occupational period. In addition, façades lack shading, daylight control, and apertures for natural ventilation. In other words, the architectural and occupancy patterns of the commercial office building have scope for improvement towards a better environmental and energy efficient response, as discussed by Gonçalves and Bode [6]. It is easy to understand why in mild climatic contexts hermetically sealed buildings might suffer from unnecessary overheating. Guidelines for energy consumption in office buildings in the United Kingdom indicate the possibility of 55% to 60% of savings (the equivalent of 127 to 145 kWh/m2 per year), as a result of the combined effect of external shading, thermal mass, and natural ventilation [7].
Despite the climatic restrictions imposed on the introduction of natural ventilation, in particular in warm regions of the world, another strong barrier to the wide adoption of natural ventilation in office buildings is the wide acceptance of the culture of artificially controlled environments and the associated image of prestige. For this reason alone, the required architectural and technological change in the conventional model of office buildings necessary for the accomplishment of naturally ventilated buildings must be accompanied by a change in the notion of environmental comfort and quality working environments.
Rethinking the conventional thermal comfort standards that supported the notion of a narrow and universal comfort zone (22 ± 2 °C) [8,9] is a fundamental step for the redefinition of internal environmental quality and the reintroduction of natural ventilation in office buildings. Parallel to the massive predominance of artificially controlled environments, several empirical investigations have indicated that the majority of occupants in office buildings would appreciate contact with the external environment, especially in cities where the climate is mild for part of the year [10]. Looking at these facts, the American Society of Heating, Refrigerating and Air Conditioning, ASHRAE, in 2004 recognized the validity of adaptive thermal comfort in buildings and, therefore, accepted the possibility of thermal comfort under natural ventilation conditions.
It is known that occupants of air conditioned buildings are intolerant to temperature fluctuations higher than 2 °C. Different from this, as demonstrated by [10], occupants of naturally ventilated buildings are more adapted to higher temperature fluctuations, according to the adaptable opportunities offered by the building and the occupation standards.
The concept of the adaptive thermal comfort is inextricably linked to the resource of adaptive strategies. It is common that in naturally ventilated buildings, occupants have more control over their environmental conditions, by means of strategies such as operable windows, flexible blinds, fans, flexible dress, a seating code, and layout possibilities, among others. The adaptive model is therefore related to behavioral change, whereby the occupants change their relationship with the thermal environment from a passive to an active one.
Curiously, the history of the design and operation of office buildings shows that air conditioning systems for the cooling of internal spaces were not common technologies until the boom of the building sector in the North American cities of New York and Chicago in the 1950s [11]. In the 1960s and 1970s, the poor air quality of urban environments in some major cities of the global economy, such as New York and London, which were noisy and polluted, created the perfect conditions for the widespread dissemination of sealed buildings.
In the two following decades (the 1970s and 1980s), while the problem of the quality of the urban environment was ameliorated in the cities of industrialized countries, it became a reality in cities of growing economies in other parts of the world, such as in São Paulo, Buenos Aires, Caracas, and Bogota in Latin America, to name just a few, given the intensity of industrial activities and the dominance of the car culture [12]. It is well known that political and environmental pressures caused by the energy crises of the 1970s, coupled with the occurrences of air quality problems in air conditioned buildings, led to the so-called sick building syndrome, later aggravated in the 1980s. This brought back the technical discussion about the possibilities and advantages of natural ventilation in office buildings, which received special attention in the European context.
Supported by the possibilities of adaptive thermal models, the reintroduction of natural ventilation has been elaborated since the 1990s. Iconic examples of naturally ventilated office buildings have revealed the central role of a differentiated architectural design in achieving a successful natural ventilation strategy [12]. As suggested by Baker and Nicol [10,13], shading devices, thermal insulation, reduction of glazing areas, thermal mass, and adaptive controls together with natural ventilation are useful for the elimination or at least the minimization of air conditioning demands. Freedom in the dress code and in choosing the working position (the possibility of choosing different places to work in floor-plan or within the building), as well as the possibility of using ceiling fans, can help to increase comfort levels (regarding the fans, these can be especially positive in areas far from windows).
As a consequence, the standards and preconceptions of building form, depth and usable height of floor-plans, treatment of façades and the operability of windows set in the conventional model, are challenged in the design of naturally ventilated office buildings, introducing narrower floor-plans, higher floor-to-ceiling heights, shaded and operable windows, and transitional spaces, among other features. The success of natural ventilation is also a result of design proportions. As an example, the rule of thumb for the single-sided ventilation strategy says that the depth of the plan should not be more than two and a half times the floor-to-ceiling height [14]. Consequently, the economic formula of the conventional model is changed, affecting indicators such as the efficiency of space and the relation of façade to floor area, to improve the environmental quality of internal spaces, as identified by Gonçalves [15].
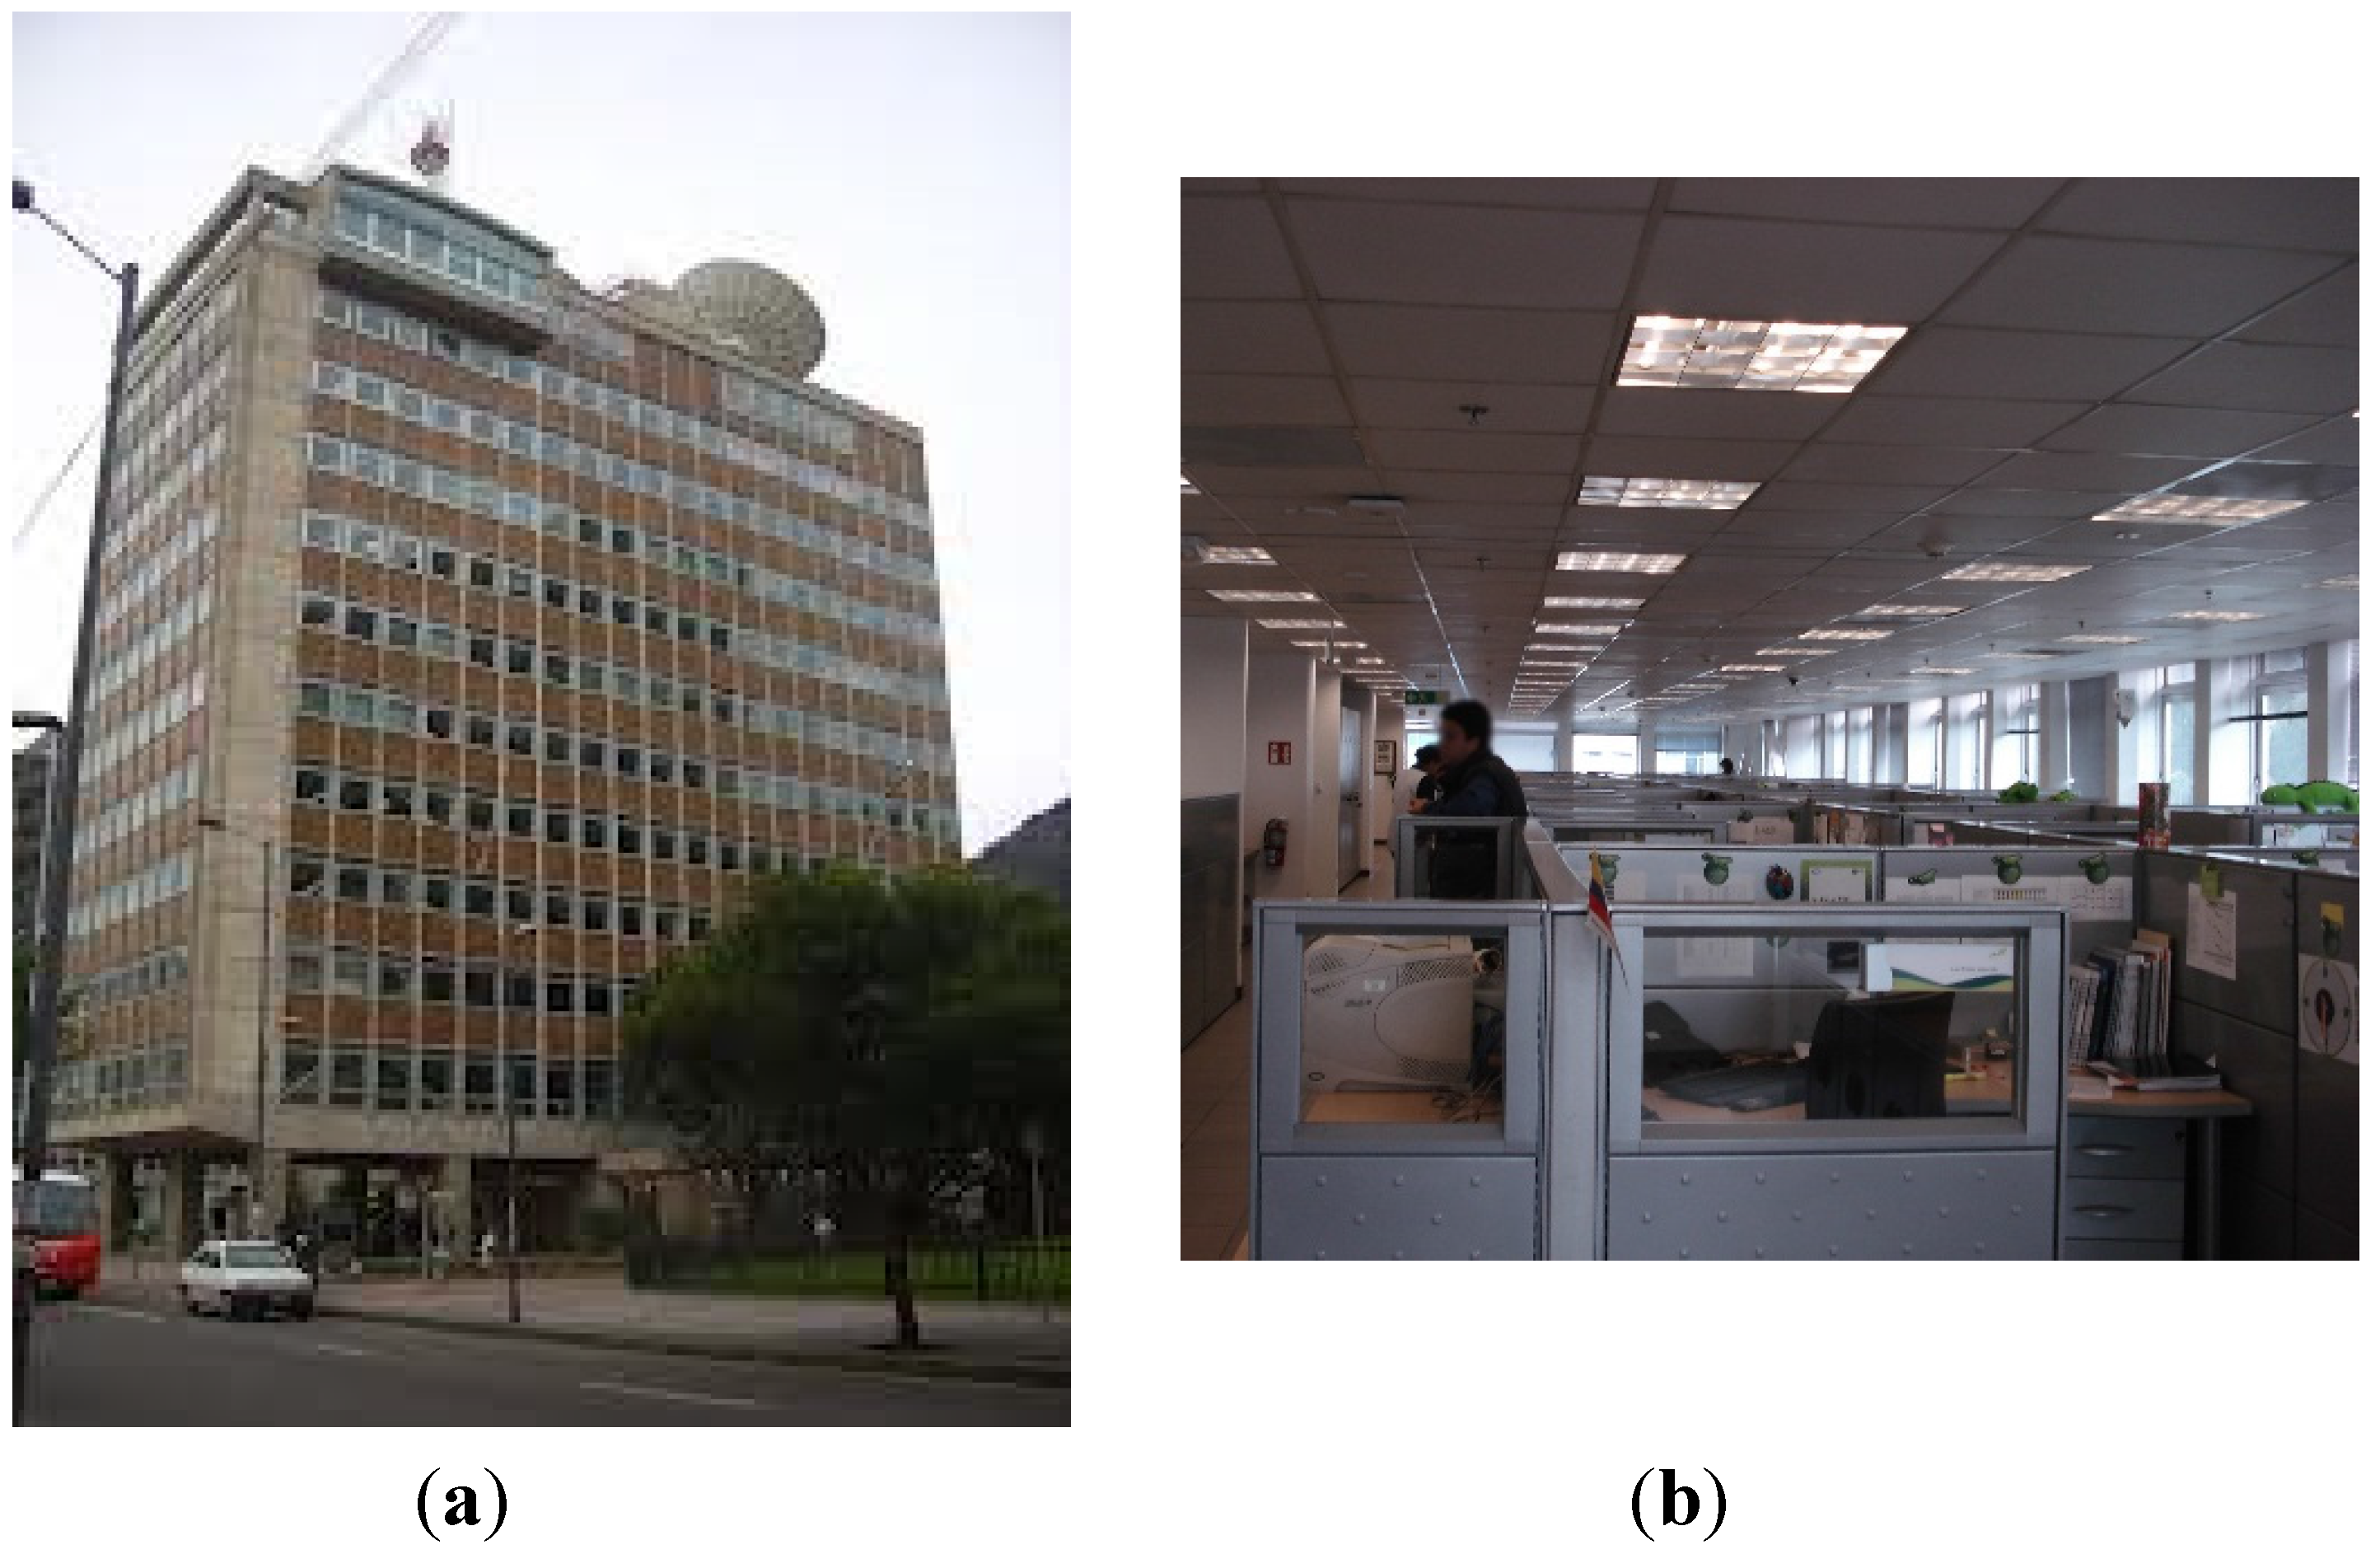
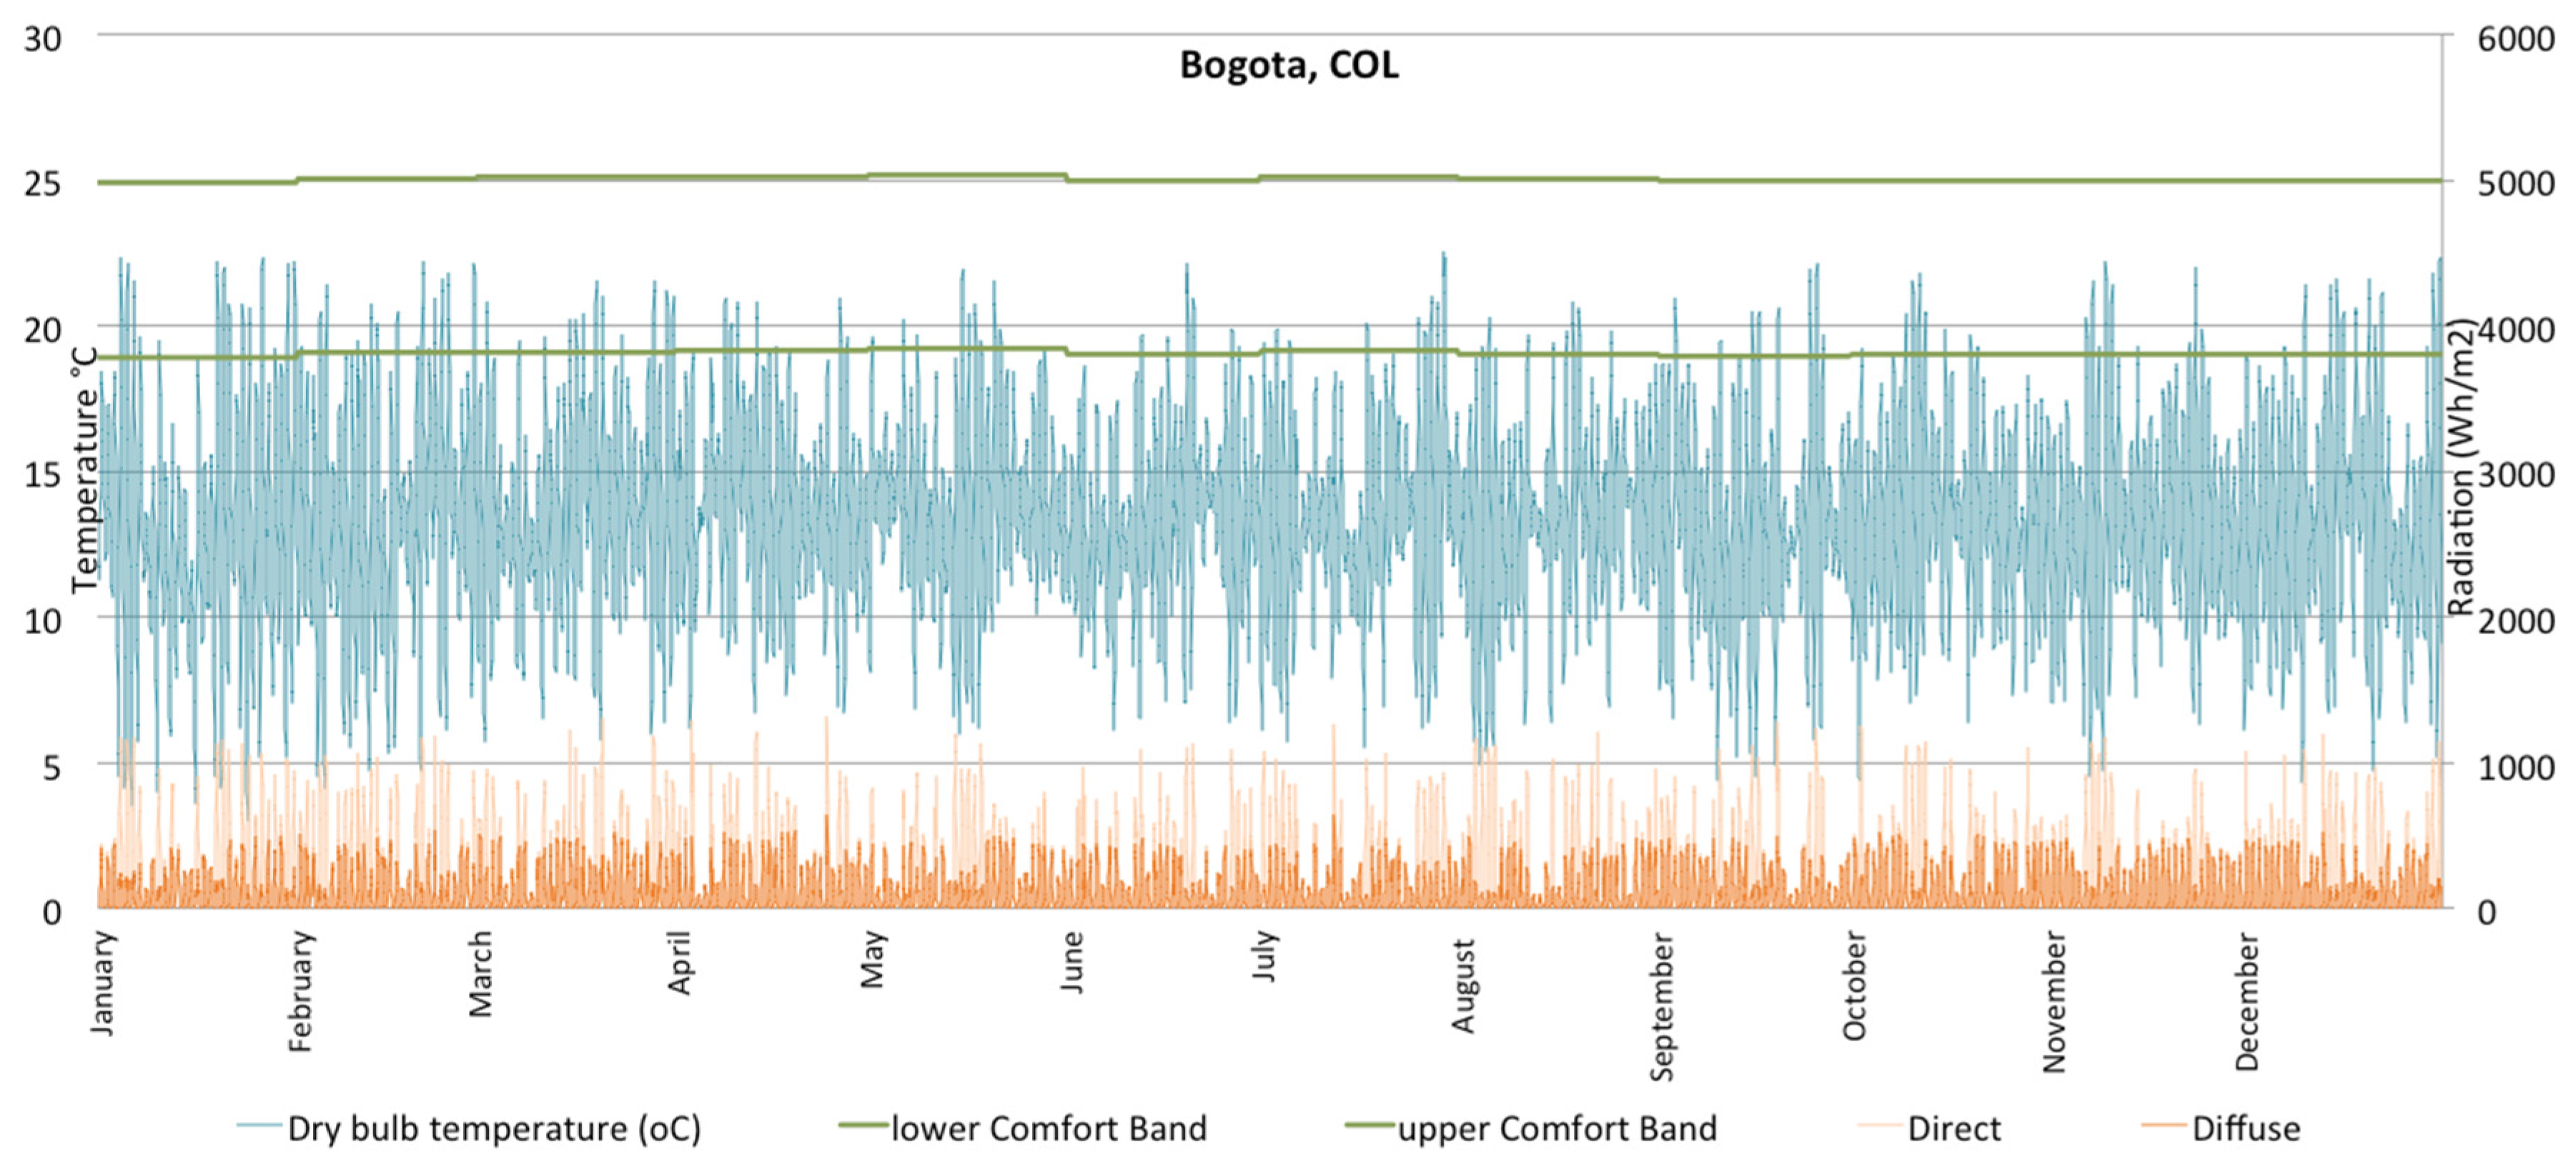
In this context of design and cultural change, this paper investigates the possibility of daylight and thermal comfort in naturally ventilated working environments, located in cities of mild climatic conditions. For this purpose, the city of Bogotá (Latitude 4°7′ N), in Colombia, the fastest growing city in South America and a place of great potential for passive strategies, was taken as the geographic context for the research, encompassing fieldwork with occupants of a sample office buildings and analytical studies that looked at the benefits of daylight and the thermal performance of working spaces in office buildings. Initially, a sample of occupants from 37 office buildings answered a questionnaire, distributed via e-mail accounts, about their perceptions of space and environmental working conditions. In the second stage of the research, parametric studies of thermal and daylight performance of different façade strategies were carried out with computer simulations, in order to verify the possible impact of climate and orientation on the environmental performance of typical office buildings in Bogotá.

2. Cultural Change: The Dynamics of the Working Environments and Space Use

The evolution of occupation patterns of working environments has been related to changes in the economic model, working processes, and new technologies over the years. The digital revolution has introduced new communication and computer technologies, which are transforming how and where it is possible to work. This fact is re-structuring the working environments, responding to the creation of a new economy based on knowledge generation and transfer. Technology and communications shaped Generation Y—those born between 1980 and 2000, who then became knowledge workers, with a flexible professional life, and are progressive, entrepreneurial, and mobile, as described by Johnston [16].
According to Duffin [17], the scale of the changes that have taken place since the beginning of the 21st century in the world of work is enormous. The fast and far-reaching technological and social changes we are experiencing are more fundamental than anything that has happened since the early years of the Industrial Revolution. The physical world is changing as the temporal environment—the way in which we structure the use of time—changes. As stated by Harrison [18], the new economy is characterized by a virtualization of products and relations in which people are not necessarily working together in the same place. On the other hand, the author highlights the importance of face-to-face interaction to the enrichment of productivity, arguing that instead of reducing the value of physical space, the focus on knowledge work and increasing productivity leads to an increased emphasis on quality working space.
Targeting the employee’s effectiveness, shared rather than individual desks are a new tendency in office layout, allowing employees to use different areas according to various needs and improving the office space efficiency. On the other hand, more communal areas rather than private ones are demanded due to the importance of social interaction and knowledge transfer among employees. In addition, new trends show that different enterprises are starting to share common areas of sporadic use to improve space efficiency [18]. Looking closer at the specificities of space use in working environments, the existing office layout can be divided into four zones: circulation (18.2%), open plan (39.5%), support (33%), and cellular (9.3%) [14]. In the new trend, common areas and facilities are more needed than cellular offices or work stations to accommodate the constant knowledge exchange and collaborative working dynamics.
It is well known that internal gains are also related to occupation and equipment density. In this sense, the type of activity will affect the internal gains of a space and the adaptability that it can offer, whether individual or in groups. An understanding of the dynamics can drive more accurate predictions about the thermal and energy performance of office buildings. Assuming a density value of 10 m2 per person, analytical studies of thermal dynamics for a shaded office building located in São Paulo (with a subtropical climate), developed by Marcondes [19], showed that internal gains, more than solar gains, cause the increase of 3 °C in the internal temperatures.
Occupancy density studies [9,15] show that 77% of office buildings in the United Kingdom have an effective density between 8 and 13 m2 per workplace; the same work shows that the maximum occupants’ use in the majority of offices is between 50% and 60% of the full occupancy capacity. Another CIBSE study [15] established that this space utilization rate can increase up to 85% through the enhancement in sensor networks that monitor environmental variables in the space (such as temperature and humidity), which can then be adjusted according to occupants’ preferred conditions. Maximum utilization and effective occupational density are fundamental factors to define the internal gains of a working environment, before establishing the design strategies for the building’s environmental performance (see Table 1).
Table 1. Effective density in office buildings in the United Kingdom (m2 per person). Source: After CIBSE [15].
Utilisation
100%95%90%85%80%75%70%65%60%55%50%
Effective Density777.47.88.28.89.31010.811.712.714
888.48.99.41010.711.412.313.314.516
999.51010.611.31212.913.81516.418
101010.511.111.812.513.314.315.416.718.220
111111.612.212.913.814.715.716.918.32022
121212.613.314.1154617.118.52021.824
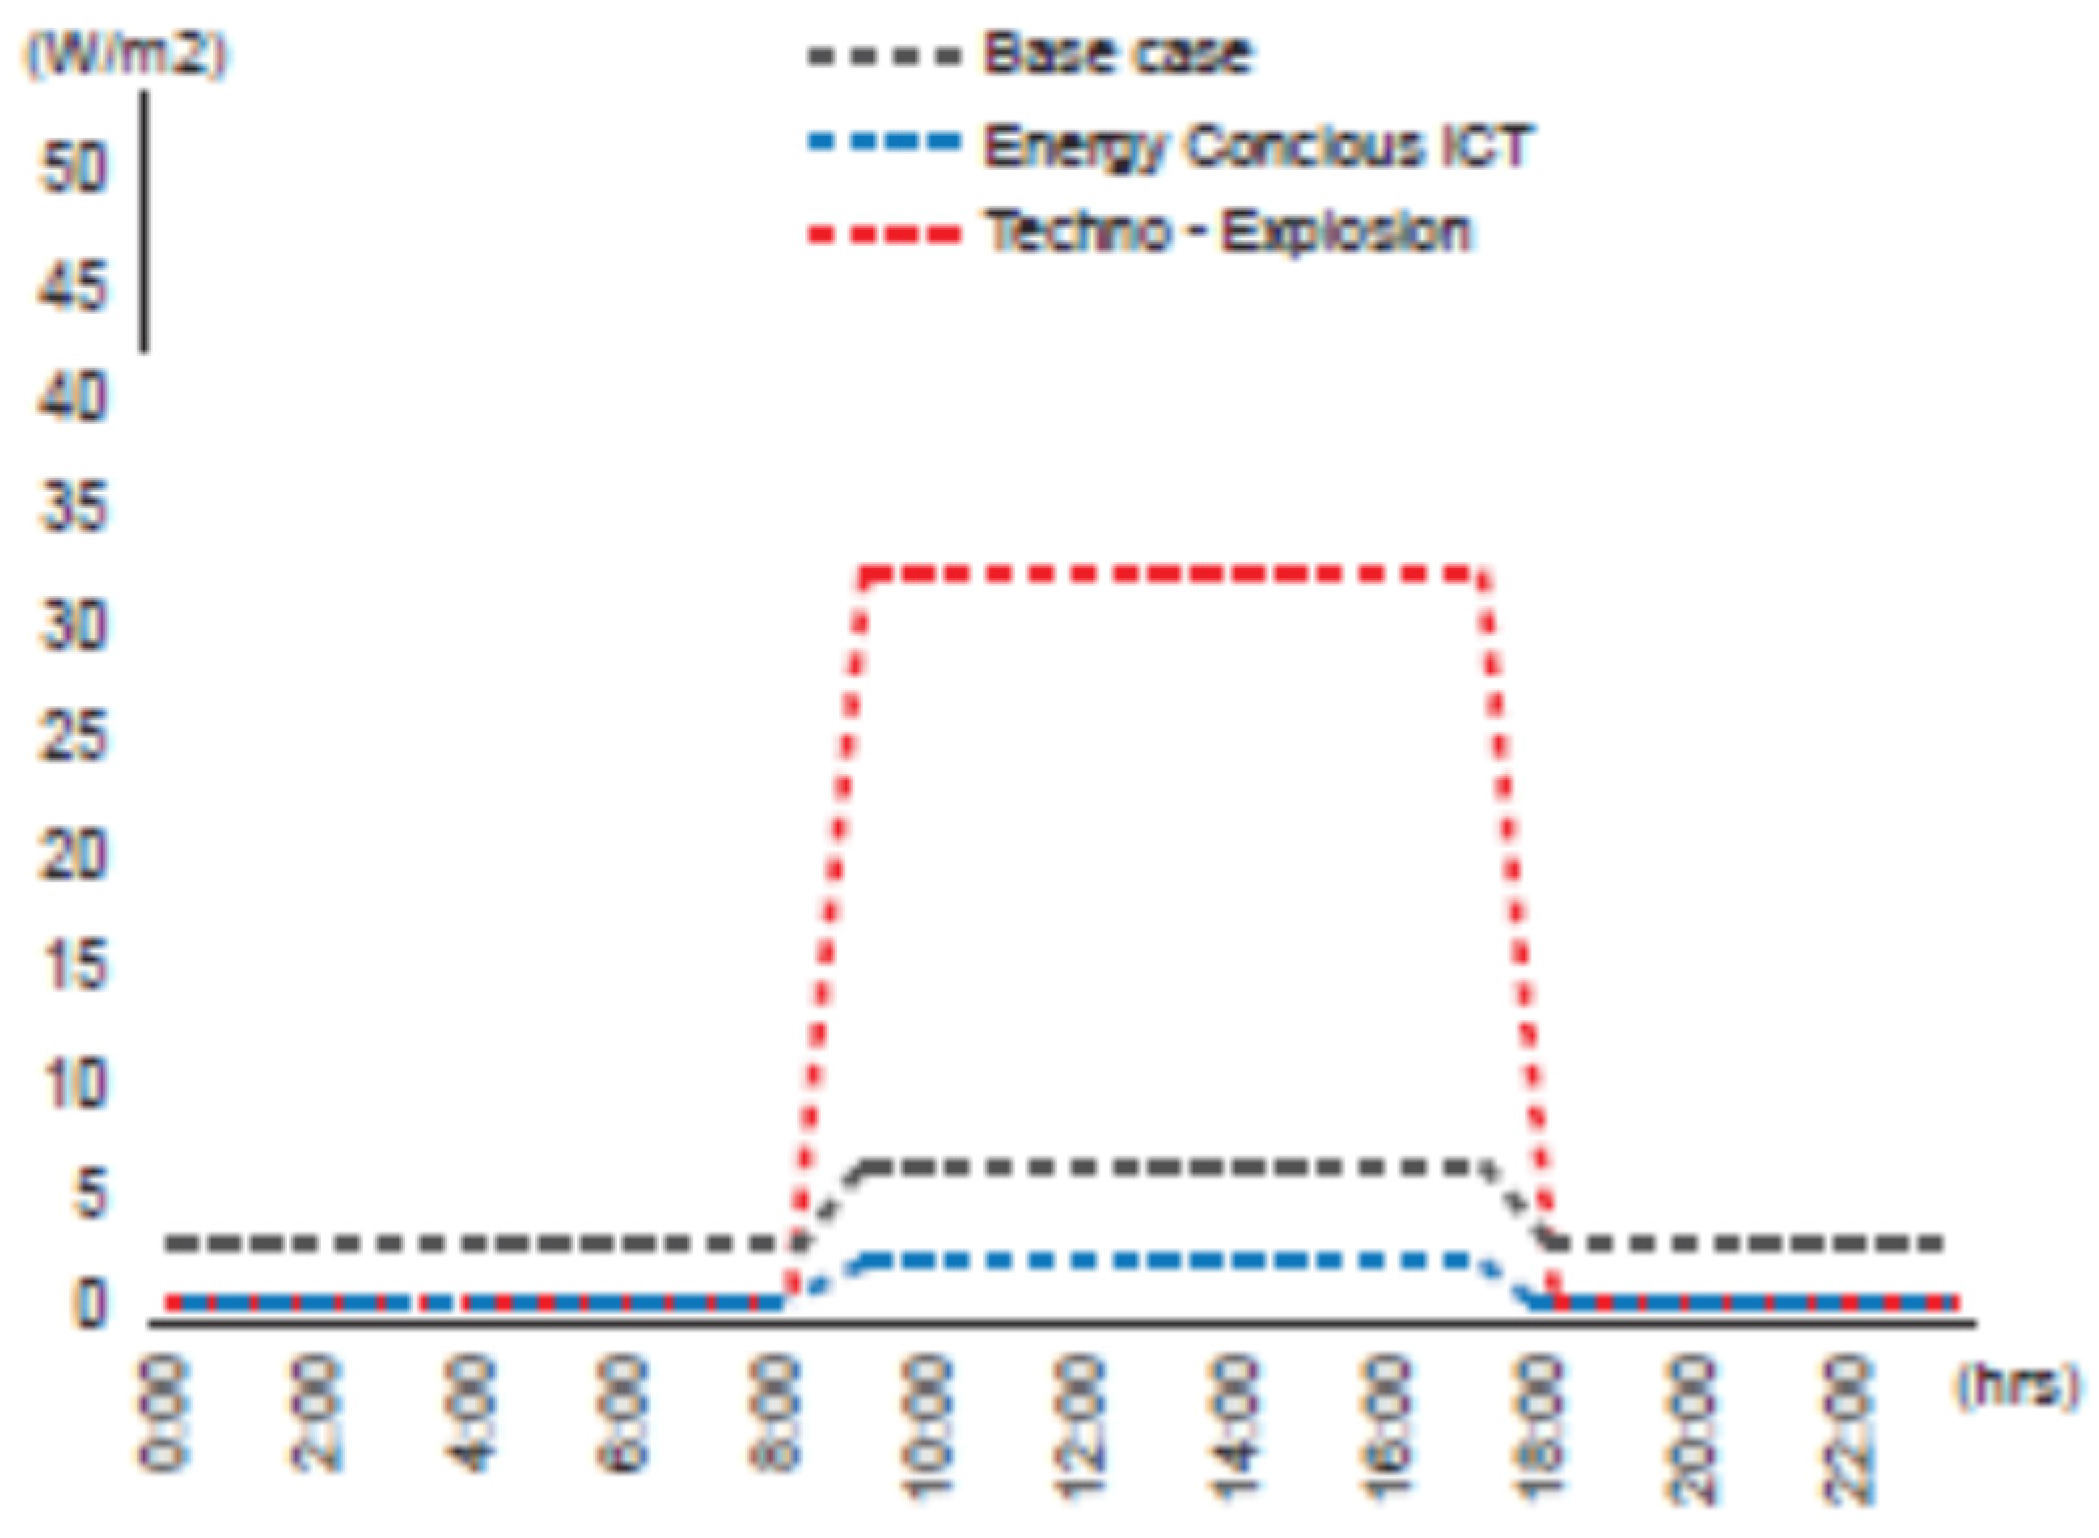
On the other hand, new technologies are affecting the amount and efficiency of appliances in working spaces. Figures provided on CIBSE Guide A [15] and Johnson, Counsell, and Strachan [9], Trends in Office Internal Gains and the Impact on Space Heating and Cooling propose three possible scenarios: a base case according to current standards, a second one illustrating an energy-conscious ICT situation where offices would reduce the number of appliances and increase their energy efficiency, and a third one, based on the techno-explosion scenario, in which users would demand more and newer technologies to develop working activities, increasing by 300% the appliances’ gains. The distribution of internal gains for the three scenarios mentioned above are shown in Figure 1.
Marcondes [19] looked at the thermal performance of naturally ventilated office buildings in São Paulo, where monthly mean temperatures very between 18 and 30 °C, a local climate that offers comfortable conditions for approximately 70% of the year. The study consisted of thermal dynamic simulations that compared the performance of different office layouts (landscape and cellular), in two distinct forms of floor-plan: a square and a rectangular one. In both cases, the limiting depth of the working area was set at 7.5 m from the window, following CIBSE recommendations [
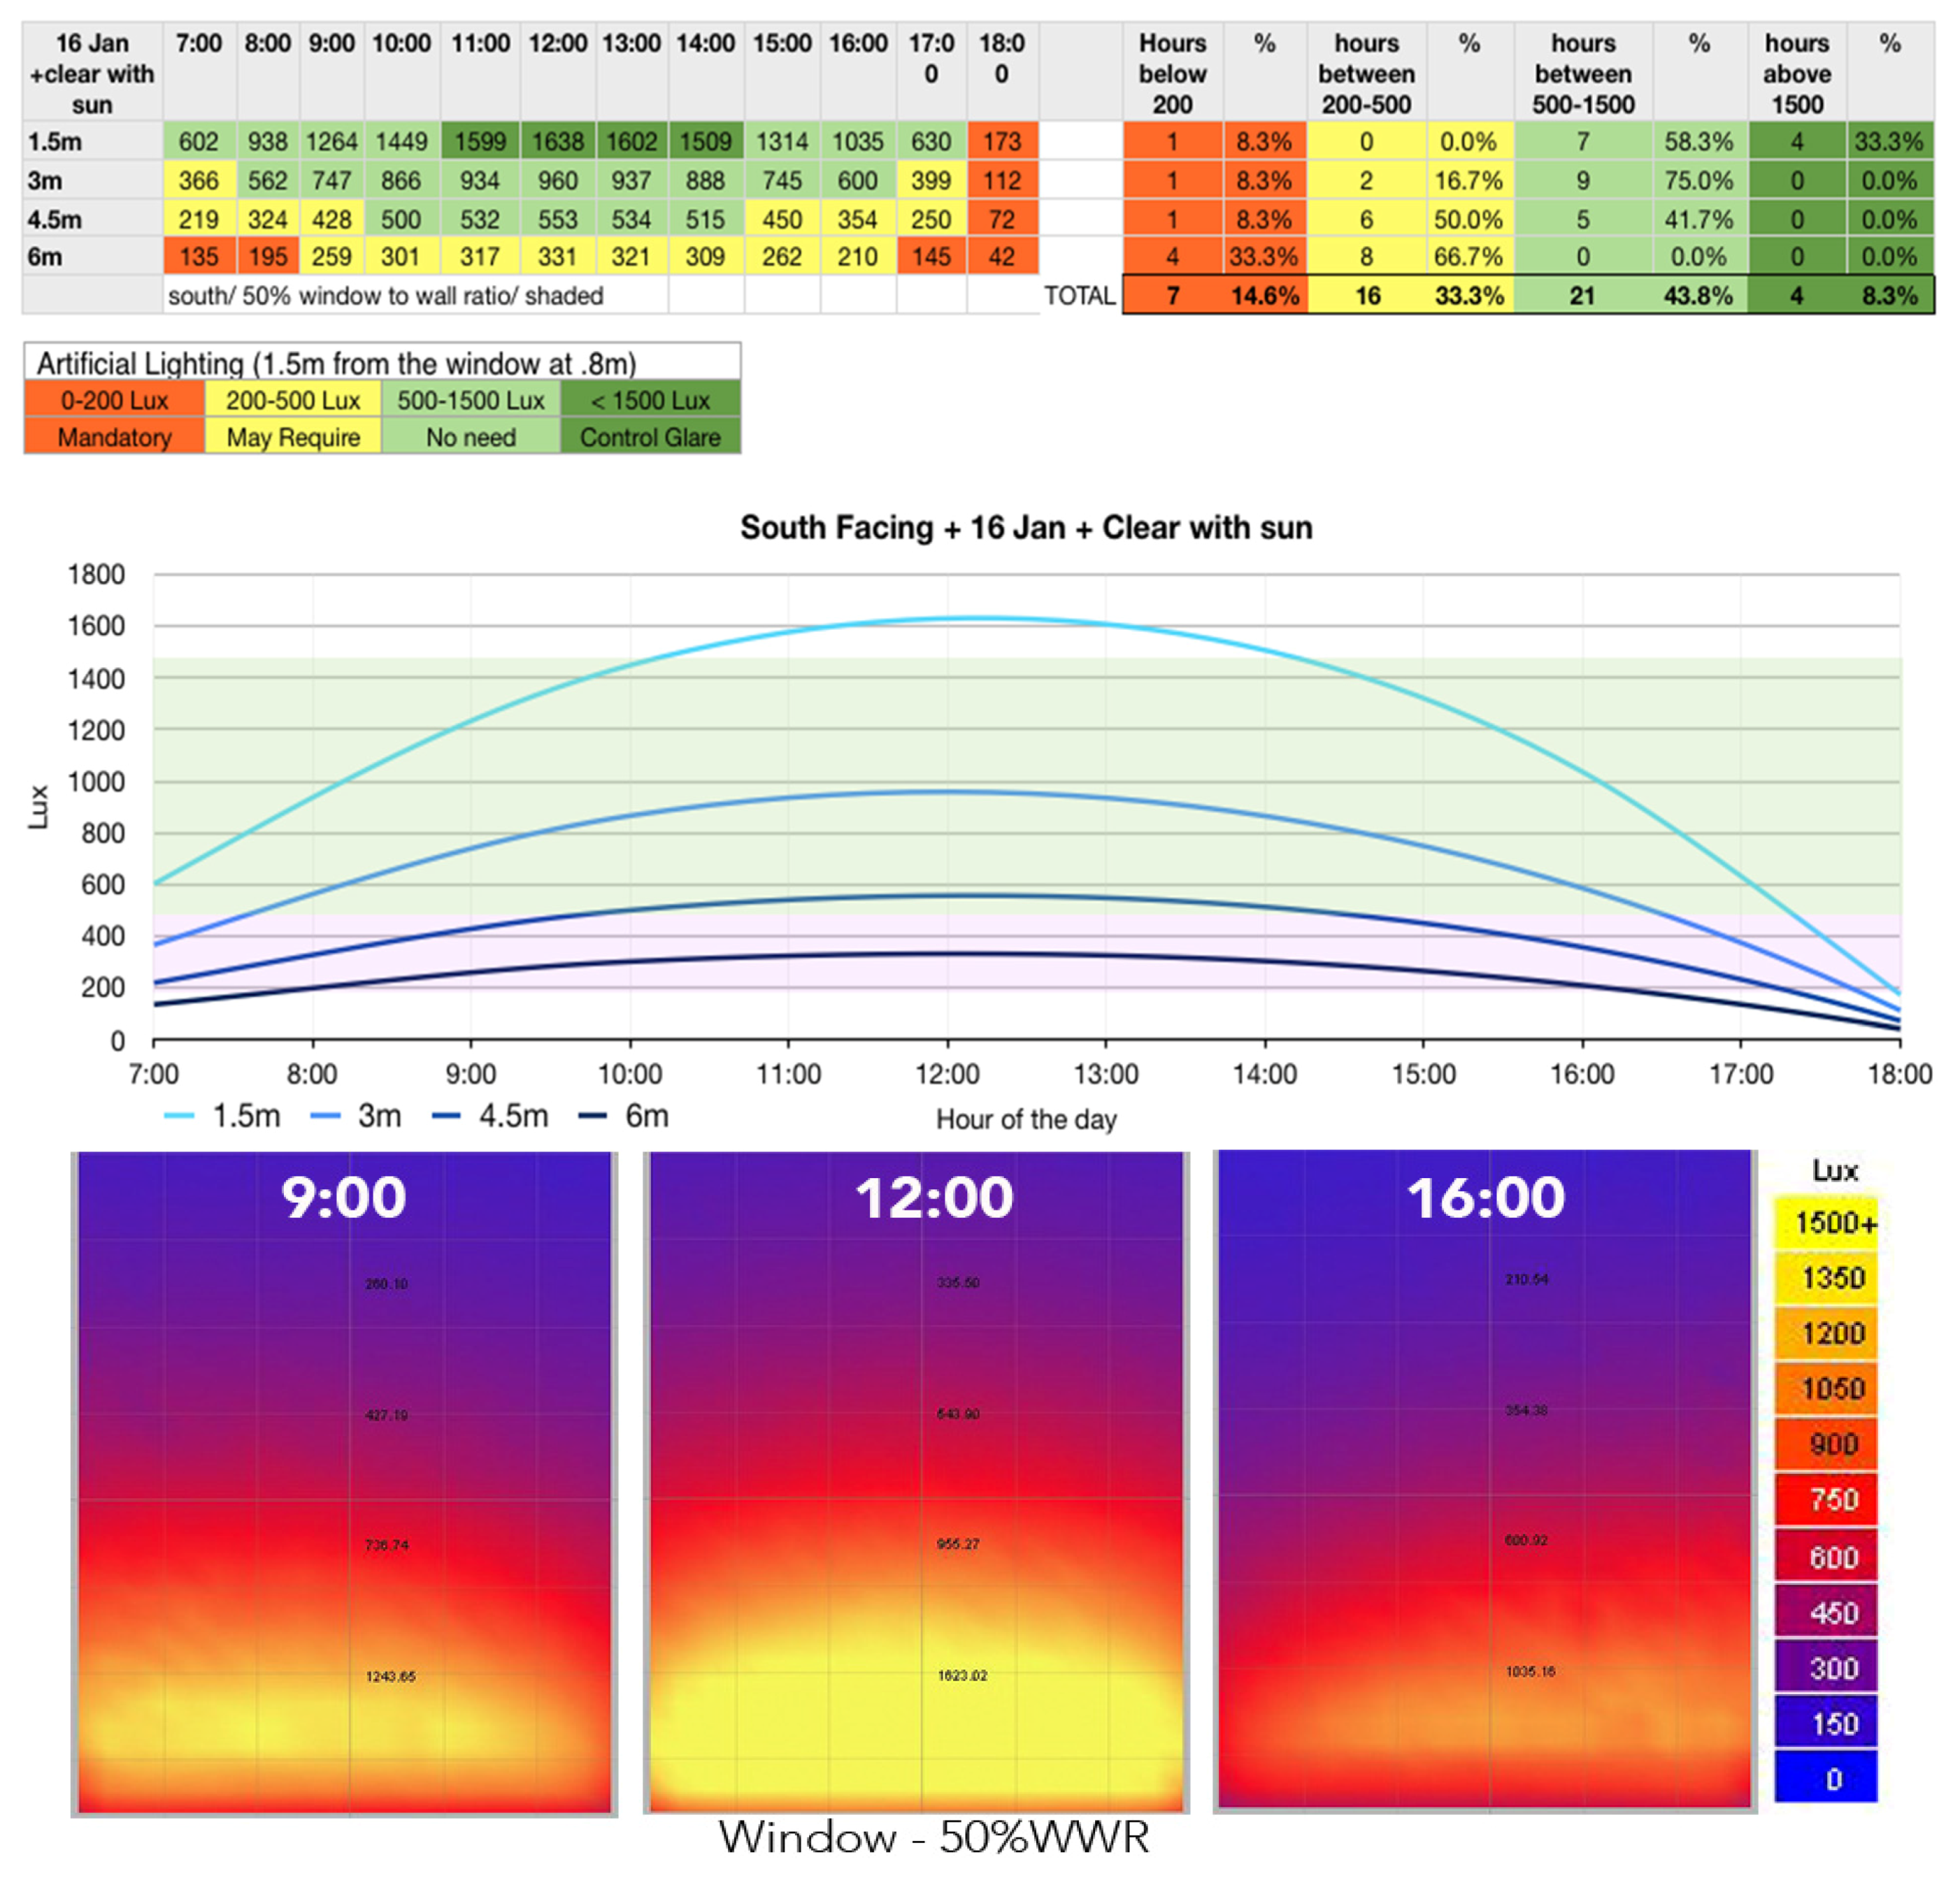
15]. Regarding the façade design, a window/wall ratio of 50% was specified, from which a 30% aperture was defined for natural ventilation, given the typical window design.
Figure 1. Appliance gains throughout a 24 h cycle in three office scenarios. Source: adapted from Johnson, Counsell, and Strachan [9] and CIBSE [15].
Buildings 05 01105 g001
According to the adaptive model proposed by ASHRAE55 [20], comfortable thermal conditions in the working environments on a passive mode were found with internal air temperatures oscillating between 19 and 29 °C [21]. Within the wide range of simulated scenarios, the best case was the rectangular north–south landscape layout, which resulted in up to 95.7% of occupational hours in thermal comfort. On the other hand, the worst results were found in the cellular office spaces oriented east and west without the influence of predominant winds (from the south and southeast), with 13% and 25%, respectively, of occupational hours in thermal comfort conditions.
In summary, the change in the culture of working environments and therefore in how people use the spaces has a direct impact on the intensity and distribution of internal gains during a typical working day. An understanding of the dynamics of occupants, their environmental requirements, and the occurrence of internal gains defines the data inputs and scenarios for the computer simulations of thermal dynamics to inform environmental design decisions. An example of such an approach is presented in detail in this paper.

3. The Case of Bogotá: The Opportunity for Passive Strategies in the Design of Working Environments

3.1. Climate Analysis

The capital of Colombia, Bogotá is located close to the Equator (Latitude 4°7′ N and Longitude 74°15′ E), in a plateau 2600 m above sea level, in the oriental branch of the Andes mountain range. With a population of 7.3 million people, the city of Bogotá has a mild climate defined by rainy and dry seasons and small temperature variation year-round, but significant temperature variation through the day, caused by the impact of solar radiation. Although seasonal changes are not so relevant, there is a strong relationship between sky conditions and temperature variations, whereby an increase in global solar radiation results in temperature increase.
The mean yearly air temperature in Bogotá is 13.6 °C, while the mean maximum is 21.5 °C and the mean minimum is 2.7 °C. The average temperature fluctuation for a sunny day is around 15 °C and for a cloudy day around 10 °C, given that the hottest period of the day is just after midday (see Figure 2). For most of the day, coupling indoor with the outdoor environment can be desirable. The high daily temperature fluctuations are associated with variations of sky conditions and the impact of solar radiation, from 2 to 4 kWh/m2 on the horizontal plane.
Figure 2. Monthly average temperatures for the city of Bogotá. Source: Meteonorm 7.0.
Buildings 05 01105 g002
Average relative humidity is around 80%, accentuating the cold thermal sensation during early mornings. The predominant winds are usually from the northeast. Despite the significant levels of solar radiation, over 60% of yearly daytime hours are in overcast conditions as a consequence of constant high humidity levels, increasing the amount of diffuse radiation out of the total global radiation. Therefore, the sky conditions are beneficial to the objective of more homogeneous distribution patterns of daylight in indoor spaces, as seen in Table 2. Yearly iluminance levels for Bogotá are shown in Figure 3.
Table 2. Frequency of occurrences of sky conditions for the city of Bogotá. Source: Meteonorm 7.0.
Sky ConditionHours%
Clear0 Octas68715
Mostly Clear1-2 Octas2746
Partly Cloudy3-4 Octas3738
Mostly Cloudy5-6 Octas3427
Cloudy7-8 Octas298464
Figure 3. Average iluminance levels for the city of Bogotá. Source: Meteonorm 7.0.
Buildings 05 01105 g003

3.2. Fieldwork: Perception and Expectation of Occupants

This survey encompasses the occupants of a sample of office buildings in Bogotá. Questions included the following issues: distribution of time of a typical working day among the different internal spaces; occupants’ perception of the thermal environment; the use of adaptive opportunities in the search for comfort; the importance of occupants’ control over the opening of windows; and satisfaction with vs. wish for change in the physical and/or environmental conditions.

3.2.1. Survey: Characteristics of the Sample and Fieldwork Method

The survey was conducted online, via access to occupants’ email addresses, 147 occupants from four different office buildings in Bogotá answered a questionnaire about their perception of space and environmental working conditions. The survey was applied during the month of July in 2012. The aim of the survey was to register people’s overall perceptions and opinions about their workplace. Having said that, given the means of consulting the occupants (online access via e-mail address), internal and external environmental conditions were not measured simultaneously with the answers given to the questioner. For this reason, rather than providing a quantitative database about the case studies, the results were useful for formulation of a qualitative overview on the environmental and design improvements, in typical air conditioned office buildings in Bogotá.

3.2.2. Results

Regarding the time spent in the office building, occupation of the actual workstation stayed between 70% and 80% for half of the population that responded the survey. The rest of the time is mainly spent in meeting rooms (33%) and informal areas (17%). In addition, Figure 4 and Figure 5 show that people in cellular offices (27% of the sample) are more satisfied with their working spaces and feel more comfortable than those working in open plan offices. This is due to the fact that it is easier for occupants to control their own environmental conditions and, therefore, adapt to the changes of the climate, when sitting in cellular offices.
Figure 4. Question: In general, how satisfied are you with your office?
Buildings 05 01105 g004
Figure 5. People occasionally feeling discomfort correlated with the office layout.
Buildings 05 01105 g005
On the issue of thermal sensation, the survey identified that during sunny days, 34% of the occupants feel warm or hot, 23% feel comfortable, and 12% feel cold (which can be attributed to the use of air conditioning systems). On the other hand, during cloudy days, the answers were the opposite, with 36% feeling cool or cold, 34% feeling comfortable, and no one feeling warm, raising the hypothesis that occupants of those office buildings are likely to be more tolerant to colder rather than to warmer conditions.
With respect to the adaptable opportunities, as shown in Figure 6, the most popular strategy to restore comfort is the drinking of cold or hot liquids, followed by the opening and closure of windows, confirming that in this mild climate there is a clear desire for coupling with the outdoors. Figure 7 shows that 64% of the people interviewed were sitting close to a window and had views of the outdoors, while Figure 8 presents the correlation between sitting position and occupants’ satisfaction with their internal environments. The results prove what has been suggested in several titles of the specialized literature [22,23], that being close to a window and having views of and contact with the outdoors is valued by the occupants of office buildings in cities of different climates.
Figure 6. Question: what do you usually do in order to restore your comfort conditions?
Buildings 05 01105 g006
Figure 7. People’s discomfort correlated with the operability of windows.
Buildings 05 01105 g007
Figure 8. People’s satisfaction correlated with the operability of windows.
Buildings 05 01105 g008
Regarding the relation between environmental conditions and occupants’ productivity, people primarily recognize the impact of visual comfort and the benefits of having informal areas, respectively, followed by the influence of thermal and acoustic conditions. The most appreciated features in the working spaces are the informal areas such as the lobby, gym, cafeteria, and game room, and the incorporation of other non-work-related activities, with a preference of 22% of the sample. Another 21% prefer balconies and outdoor areas for the possibility of performing informal activities as well as having direct contact with the external environment. As opposed to the preference for spaces and informal activities, 20% of the people prefer their own workstation because of the sense of belonging.
The wish for change indicates that 17% of the occupants want to improve daylight, acoustic, and thermal conditions; while another 17% pointed out the need for changes related to the space layout and 24% would like more informal areas and outdoor spaces. Adding weight to the opportunity for coupling with the outdoors, Figure 9 shows that when asked about a desirable feature seen in other working spaces, more than 50% of the answers mention informal areas and outdoor spaces. Figure 10 show external and internal views of the typical office building in Bogotá represented in this fieldwork.
Figure 9. Question: is there something you have seen in other offices that you would appreciate having in yours?
Buildings 05 01105 g009
Figure 10. (a) External and (b) internal views of a typical commercial office building in Bogotá. Source: Ecopetrol.
Buildings 05 01105 g010

4. Analytical Approach

4.1. Daylight Performance

In non-residential buildings, the contribution of artificial lighting to the total internal gains during the daytime can be quite significant. For this reason, good daylight performance has a relevant impact on the thermal performance of buildings. The distribution of daylight provided by side windows is a function of plan depths in relation to floor-to-ceiling heights and window/wall ratios (WWR). In this respect, through analytical work, such architectural dimensions can be precisely defined, varying according to the latitude, the climate, and the sky conditions of a certain location.
The relationship between floor plan, ceiling height, and window area will also be different in different orientations in one location. Having said that, there is no universal rule in terms of the proportion between the floor plan and usable ceiling height as well as the floor plan and the size and positioning of windows; environmentally speaking, those are defined on a case-by-case basis. Once the floor plan, ceiling height, and window area are established for adequate daylighting conditions, the thermal performance and potential for natural ventilation can be investigated and improved further by means of analytical studies.

4.1.1. Settings for the Analytical Studies

Different WWR with different window heights and shading strategies were tested in order to identify the area reached by 300 lux at desk height in different cases. In the context of this technical study, the first step of the analytical work was the definition of the passive zone for daylight (distance from the façade with the minimum of 300 lux).
The relationship between availability of daylight and the requirement for artificial lighting was calculated by means of a computer simulation using the software RADIANCE through ECOTECT Software. A distance of 1.5 m from the window is considered to be the location of the first workstation in an office layout that has circulation next to the façade. This first working station will be the most exposed to the external environment and, therefore, it will experience more intensively the external variations in air temperature and daylight levels.
A “shoe box” type of model (generic rectangular base case) was used to analyze the daylight performance of a typical office building in Bogotá. Two specific days were chosen in order to have an overview of the conditions likely to happen over one year: an overcast day (the most common) and a clear sky day, typical during the summer. In addition, because direct sun penetration is not desirable in office spaces due to glare, shading devices were included in the analysis.
Following the dimensions of the typical local practice, the base case model of the office space was sized to fit different layouts in various forms of floor-plans, being 6 m wide and with a floor-to-ceiling height of 2.8 m. Different window/wall ratios (WWR) and alternatives to the location of the glazed area in the façades were tested. In order to block sun penetration and improve the distribution of daylight, horizontal overhangs of different depths were proposed to façades of different window/wall ratios: 50 cm deep for 15% WWR, 100 cm deep for 25% WWR, 170 cm deep for 50% WWR, 300 cm deep for 75% WWR, and 400 cm deep for 100% WWR.

4.1.2. Results of Daylight Analysis

Table 3 summarizes the relationship between availability of daylight and the requirement for artificial lighting at the height of a desk.
Table 3. Depth of passive zone according to daylight penetration along the year, correlated with artificial light requirements.
Window to Wall RatioOvercastClear EastClear East ShadedClear SouthClear South ShadedClear NorthClear North Shaded
15% up1.7 m2.5 m2.3 m4.5 m2.4 m2.3 m2.2 m
1.1 m460 lux386 lux1000 lux406 lux377 lux370 lux
15% middle1.12 m2.3 m 4.0 m 2.2 m
199 lux410 lux868 lux378 lux
25% up2.4 m4.0 m3.8 m6.3 m4.0 m3.8 m3.6 m
490 lux848 lux719 lux2028 lux741 lux709 lux694 lux
25% middle1.7 m3.9 m 6.1 m 3.9 m
363 lux800 lux1758 lux691 lux
50%3.3 m6.3 m6.0 m9.3 m6.5 m6.0 m5.9 m
888 lux1667 lux1473 lux3933 lux1650 lux1386 lux1406 lux
75%4.0 m7.8 m7.5 m10.8 m7.9 m7.5 m7.3 m
1066 lux2170 lux1940 lux5162 lux2077 lux1849 lux1870 lux
100%4.3 m8.5 m8.4 m11.5 m8.6 m8.4 m8.35 m
1111 lux2727 lux2095 lux5700 lux2200 lux2000 lux2033 lux
Sky Conditions: overcast sky—8500 lux, clear sky—80000 lux; Artificial Lighting (1.5 m from the window at 0.8 m): “0–200 lux”—“orange”—Inadmissible, “200–500 lux”—“yellow”—May require, “500–1500 lux”—“green”—No need, “<1500 lux”—“dark green”—Control glare.
The simulations indicated that the bigger the window, the deeper the passive zone. However, regardless of the sky conditions (clear or overcast), the difference in the depth of the passive zone between 75% and 100% WWR was less than one meter, whereas in terms of thermal performance the two scenarios could lead to a significant difference, with 100% WWR resulting in undesirable heat losses.
According to orientation, the deepest passive zone was found in the south-facing side of the plan, where issues with glare close to the façade were also accentuated, but with more uniform daylight availability throughout the day. On the north-facing orientation, daylight levels were also found to be adequate, but without the effect of the shading devices; these façade components will be needed to avoid direct sun penetration. A WWR of 50% proved to reduce the need for solar control, and the simulated lux levels suggest that artificial lighting is not needed when considering the values found for the yearly averages across the plan.
In order to understand the daylight performance during typical days, hourly analyses were carried out for two orientations: south and east, assuming that results are applicable to the north and west, respectively (given the low latitude, solar exposure in the north and south orientation are very similar). The simulation scenarios included the four typical sky conditions of Bogota: overcast, intermediate, and clear sky with and without sun. To illustrate the daylight simulations, Figure 11 presents the simulation results in illuminance levels for the south façade under clear sky conditions (with sun). The 6 m passive zone was analyzed in detail by locating a point every 1.5 m from the façade at the height of a desk. This gave the percentage of artificial lighting required for each type of sky, as shown in Figure 12.
Regarding the Daylight Autonomy, the results indicate that under overcast sky conditions there are 13% of daytime hours in which artificial lighting is not required in the entire floor plan of the base case. This figure rises above 50% on a typical sunny day. Overall, the typical sky of Bogotá offers significant daylight availability.
During a typical overcast day, for example, at the south façade office, at 6 m from the façade artificial light is required all day long; however, close to the façade, at 1.5 m, this requirement reduces to 17% of the daytime hours. In general, up to 4.5 m from the façade, daylight is sufficient for the performance of office activities throughout the day in any sky condition, whereas near the façade, there is a need to control high levels of illuminance.
Figure 11. Daylight analysis of the office base case positioned at the south orientation, during a clear sky day. Above: table showing daylighting levels along the day at four points of the floor plan of the base case. Middle: graphic representation of the information presented in the table above. Bottom: images of the simulations showing the distribution of daylight across the floor plan at three points in the day.
Buildings 05 01105 g011
Figure 12. Artificial light requirement for each orientation during typical days. Yearly sky conditions are 71% overcast, 14% intermediate, and 15% clear.
Buildings 05 01105 g012

4.2. Thermal Performance

The key objectives of the study of thermal performance were to prove the possibility of achieving thermal comfort without the need for air conditioning systems in a typical office building in Bogotá, while exploring the potential of passive strategies.

4.2.1. Settings for the Analytical Studies

The assessment of a base case required the definition of a comfort zone. The selected model was the one adopted by ASHRAE 55 [21], resulting in a comfort zone between 19 and 25 °C along the entire year (see Figure 13). Three days of different sky conditions were selected to configure the climatic context: typical hot, intermediate, and cloudy (overcast day) (see Figure 14).
Figure 13. Hourly temperatures and comfort band for the city of Bogotá, adapted from ASHRAE 55.
Buildings 05 01105 g013
Figure 14. Fluctuations of external air temperatures over three typical days in the city Bogotá.
Buildings 05 01105 g014
The analytical work was carried out with EDSL Tas, the Thermal Analysis Simulation software. The passive zone of 6 m deep was established in the daylight studies, with a floor-to-ceiling height of 2.8 m and window/wall ratio (WWR) of 50%, defining the base case for the thermal analysis. In addition, considering the market demand for highly glazed façades, a variation of the base case with 75% WWR was also tested. The scenarios simulated are presented in Figure 15, one facing north and south, another east and west, and the third one facing all four orientations. Occupancy patterns and the consequent internal gains are shown in Table 4 and Figure 16 was taken from the literature [9,15]. This was the case since the objective of the analytical work was to test the performance of the base case to accommodate occupational scenarios from global trends, following the local occupancy patterns in Bogotá and therefore, also characteristic of the buildings where the survey was conducted. When natural ventilation was tested, simulations considered the windows being opened directly to the outside.
Figure 15. Design scenarios for the thermal dynamic simulations.
Buildings 05 01105 g015
Table 4. Occupancy pattern and internal gains for the thermal dynamic simulations.
Occupancy
People 60%80%100%100%70%20%20%70%100%80%10%
Hour123456789101112131415161718192021222324
Appliances/Heat Gains
Computer65 W3 of 4 peopleLaptop23 W1 of 4 people
Monitor36 WAllTV150 W1 each 30
Copy machine800 W1 each 20 people
(20 min/h)
Laser printer130 W1 each 20 (20 min/h)
Lights: 8 W/m2; Ventilation: 30 m3/h pp; Person Latent: 55 W; Person Sensibel: 75 W.
Figure 16. Simulation of thermal performance for the scenario of 50% WWR and four sides exposed to the outside.
Buildings 05 01105 g016

4.2.2. Results of Thermal Analysis

The two variations of window/wall ratios in a base case of one single façade to the outside (50% and 75%) perform similarly (less than 1 °C difference), with slightly higher temperatures in the second case due to incidental solar gains. The presence of occupancy showed an increase in the internal air temperatures of between 3 and 5 °C. A change in occupancy density from 10 to 5 m2 per person leads to a 2 °C increase in air temperatures.
The variation of the base case with window areas towards four orientations (four exposed façades) represents the typical commercial version of the office buildings in Bogotá (and in many other commercial centers around the world), exposed to direct solar gains and heat losses through the building’s envelope. For this reason, their performance is discussed further in this paper.
Ventilation is provided by opening the windows when air temperatures are above 23 °C, while shading is provided in all orientations when protection against solar radiation is required. Exposed thermal mass is achieved by eliminating the false ceiling and exposing the concrete structure. As expected, overheating occurs during clear sky days. As shown in Figure 16 and Figure 17, the difference in air temperature from the base case to one of the four exposed façades reaches around 10 °C, when during a cloudy day it is around just 2 °C. The most effective strategy to cool down the space is ventilation, but this also makes the space cooler during the early morning if ventilation is not controlled. The exposure of the building’s thermal mass also proved to be thermally effective, absorbing the internal gains and therefore reducing temperature fluctuations.
Figure 17. Thermal simulation for the scenario of 75% WWR and four sides exposed to the outside.
Buildings 05 01105 g017
A comparative study of annual heating and cooling loads in the different simulated scenarios showed that the north–south orientation has the best thermal performance of all scenarios (see Figure 18). The parametric tests indicated that the introduction of shading is not as effective as natural ventilation and thermal mass.
Figure 18. Prediction of cooling and heating loads for all cases that have been simulated.
Buildings 05 01105 g018
In all simulation scenarios, windows are open for more than 50% of the daytime in all cases (the main strategy for keeping temperature at a comfortable level). In order to illustrate the detailed analytical studies, Figure 19 and Figure 20 bring values of air temperatures and daylighting levels (lux) during one particular day, in the different points of the floor plan, for the 50% WWR, to the east and south orientations, under clear sky conditions. As a general rule, artificial light is required mainly at the end of the day, under overcast sky conditions, further than 4.5 m from the façade. The base case of 75% WWR requires less artificial light, especially when there is an overcast sky in the east. It also tends to be warmer, resulting in windows being opened for longer periods, especially when there is an overcast sky in the south.
Figure 19. 50% WWR + Clear sky 1.5 m from the EAST facade.
Buildings 05 01105 g019
Figure 20. 50% WWR + Clear sky 4.5 m from the SOUTH facade.
Buildings 05 01105 g020

5. Design Strategies and Recommendations

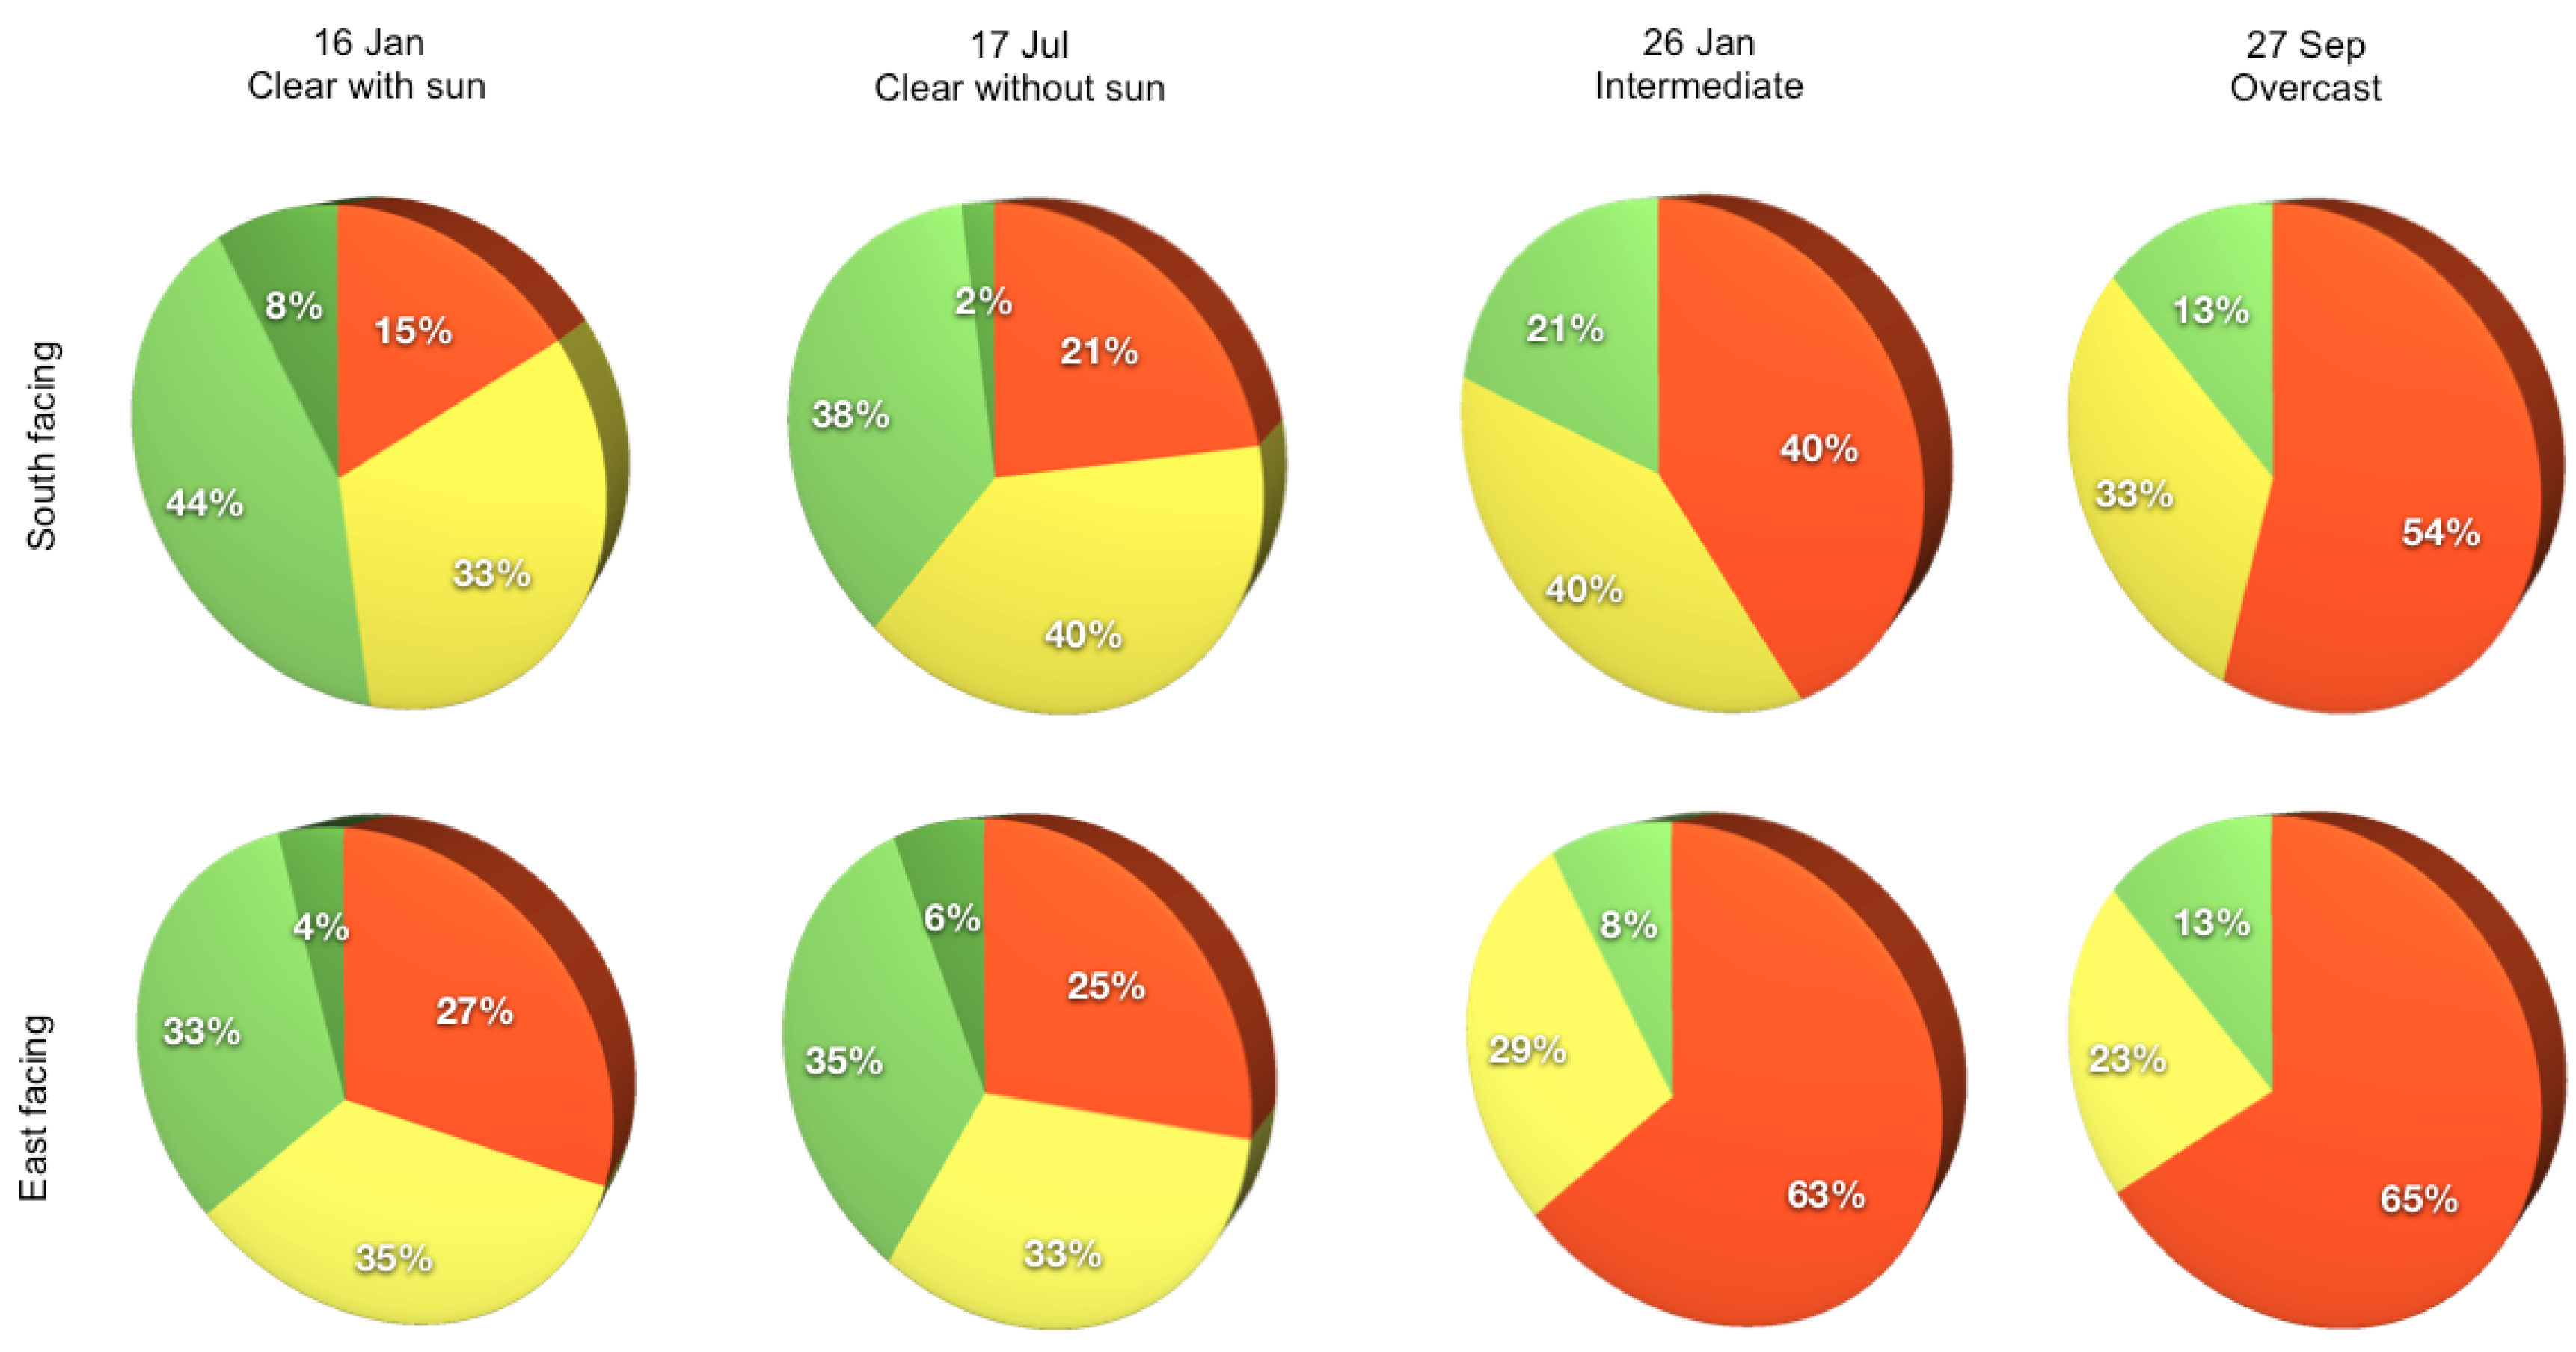
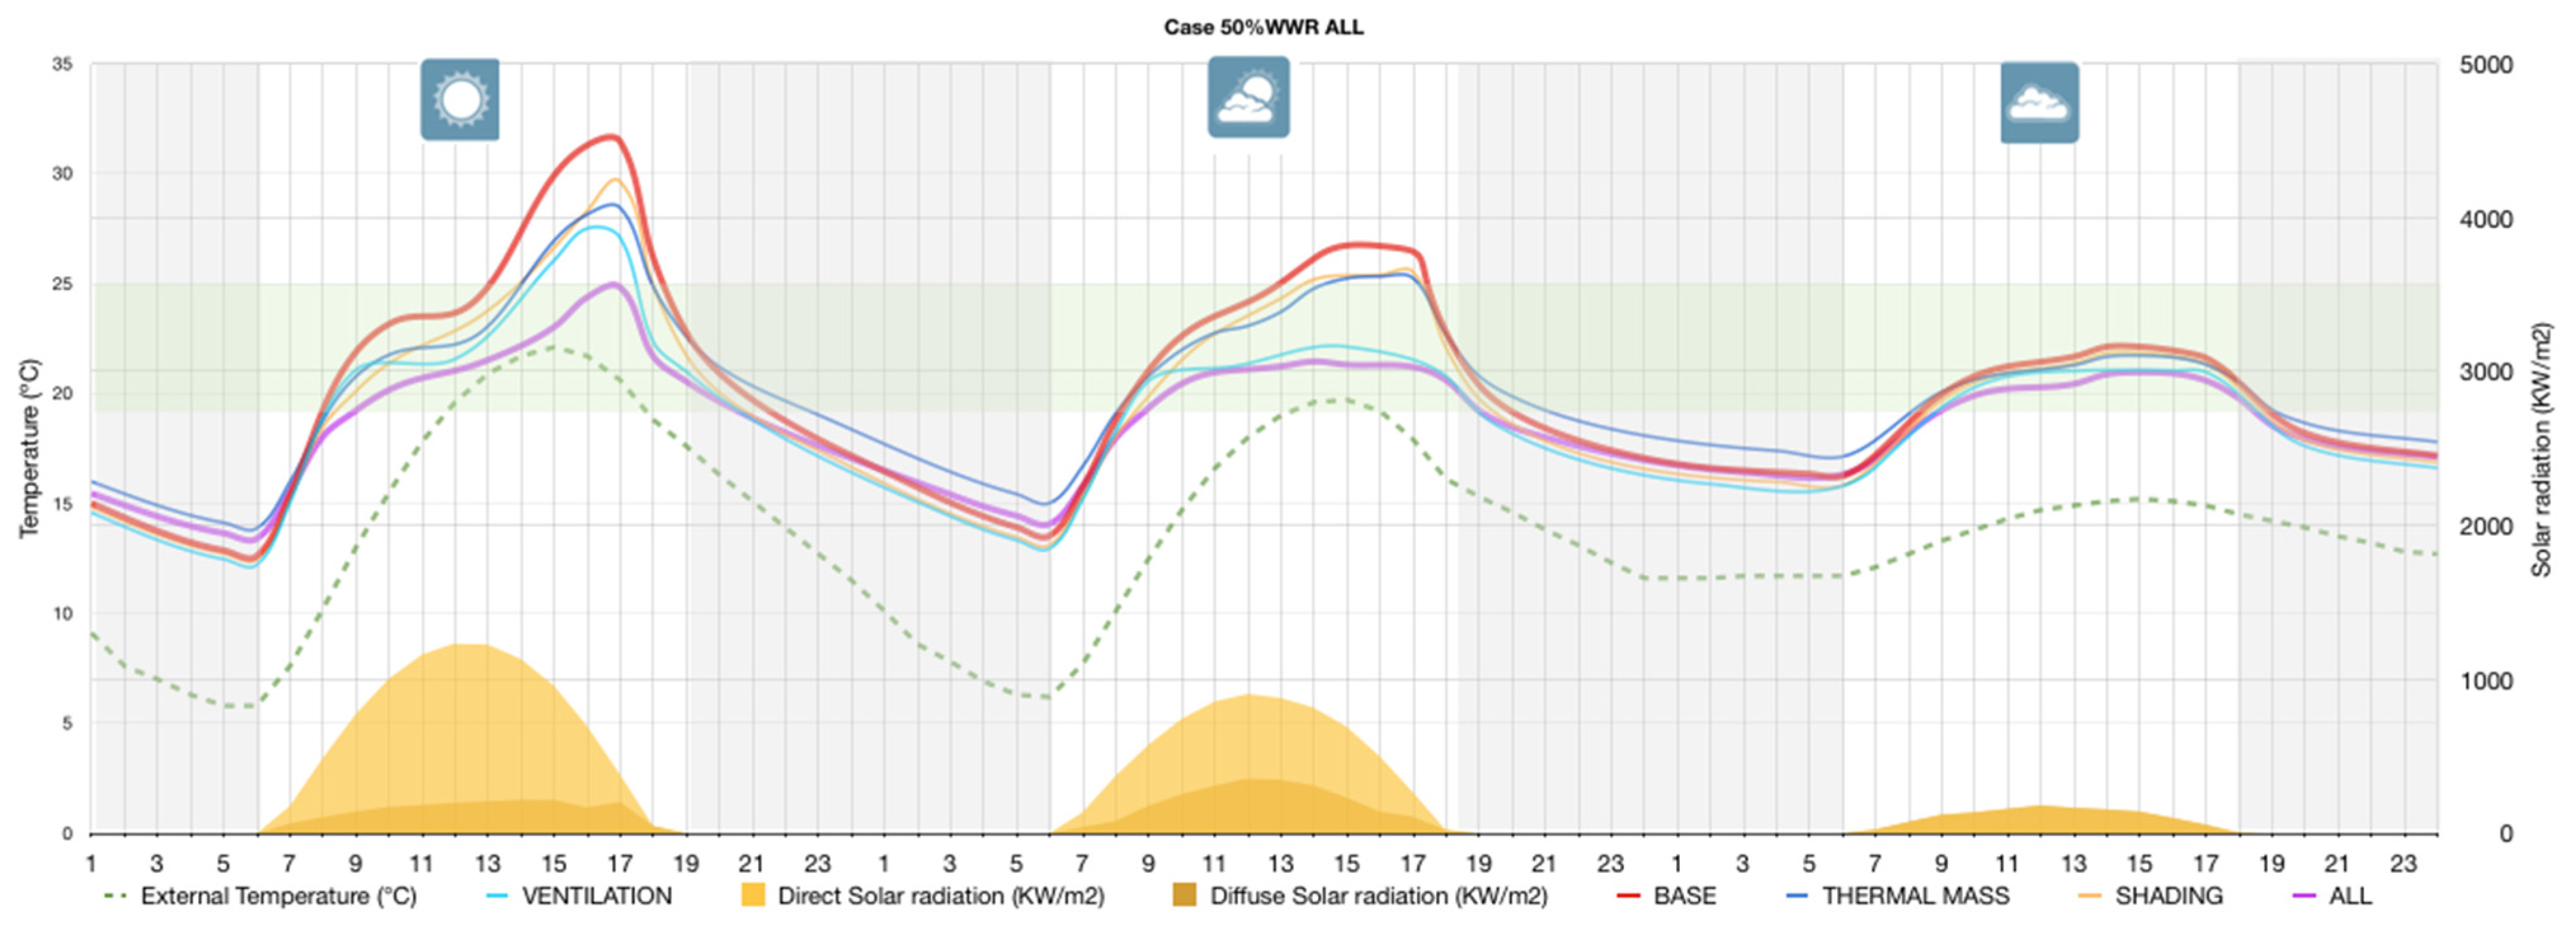
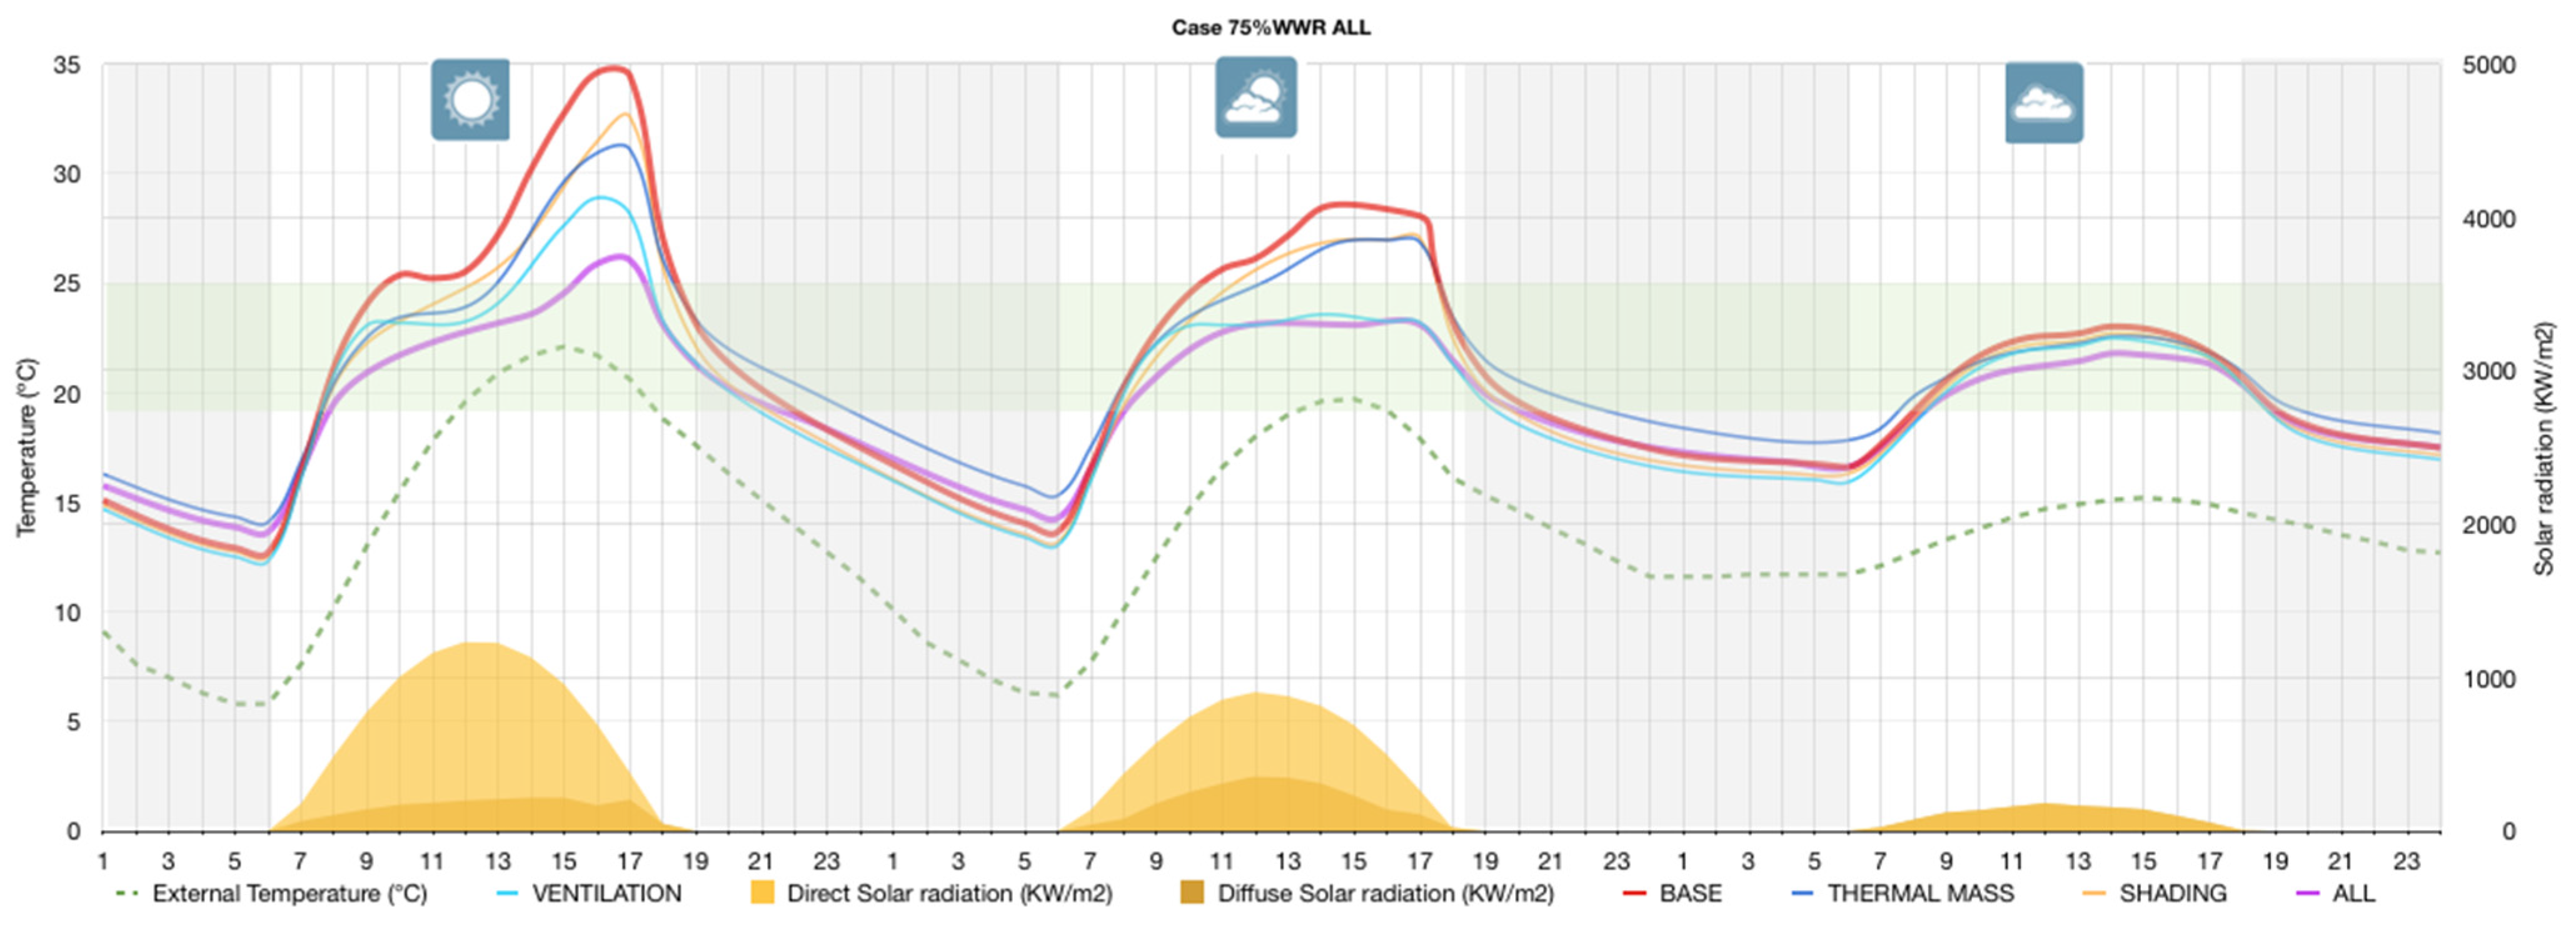
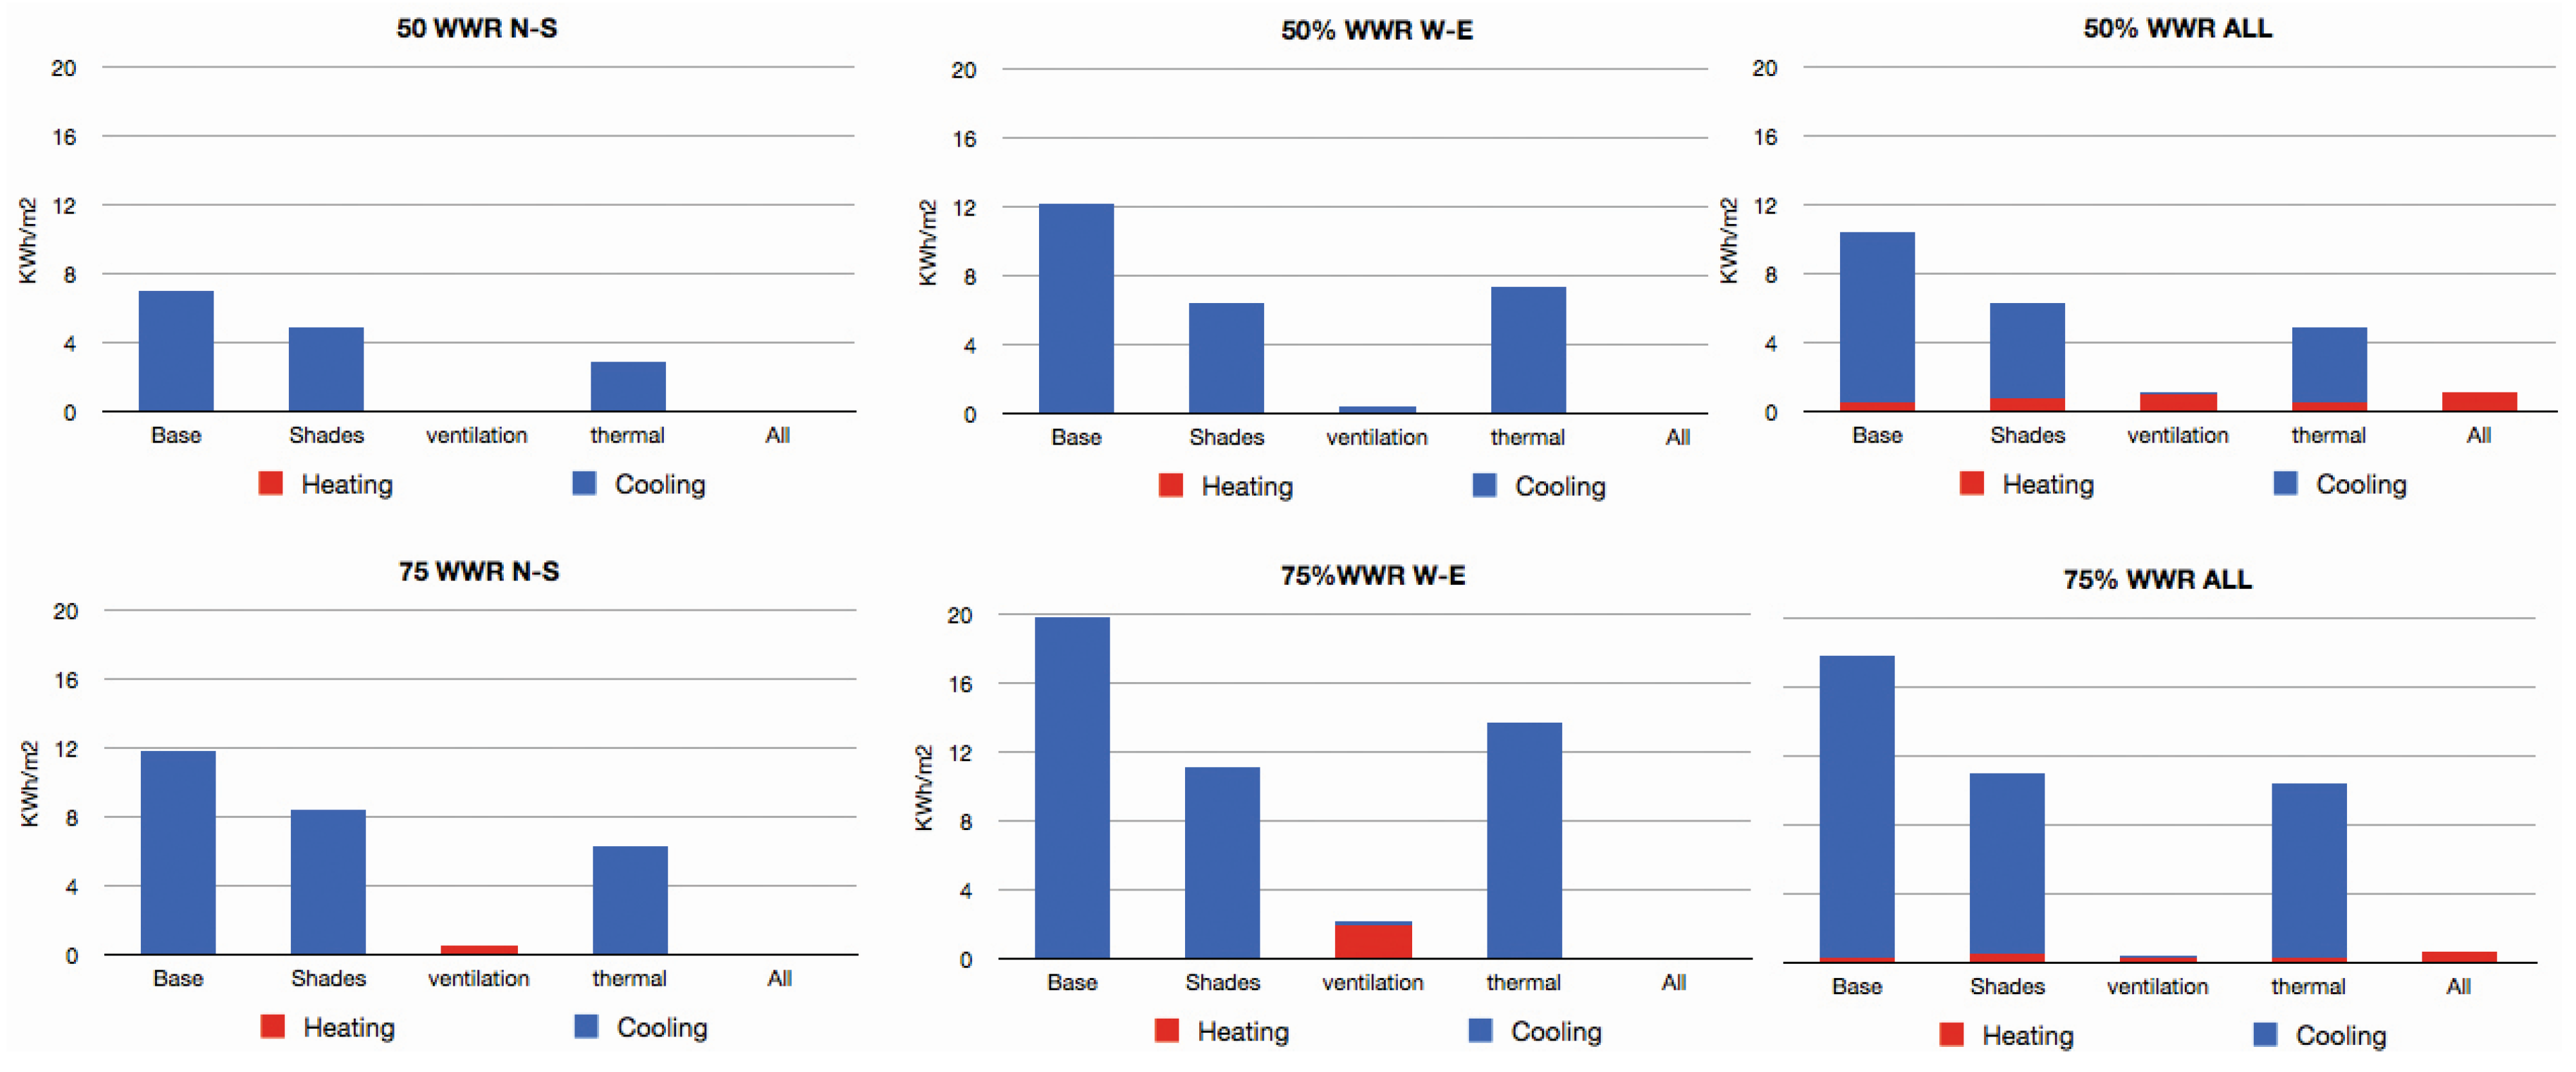
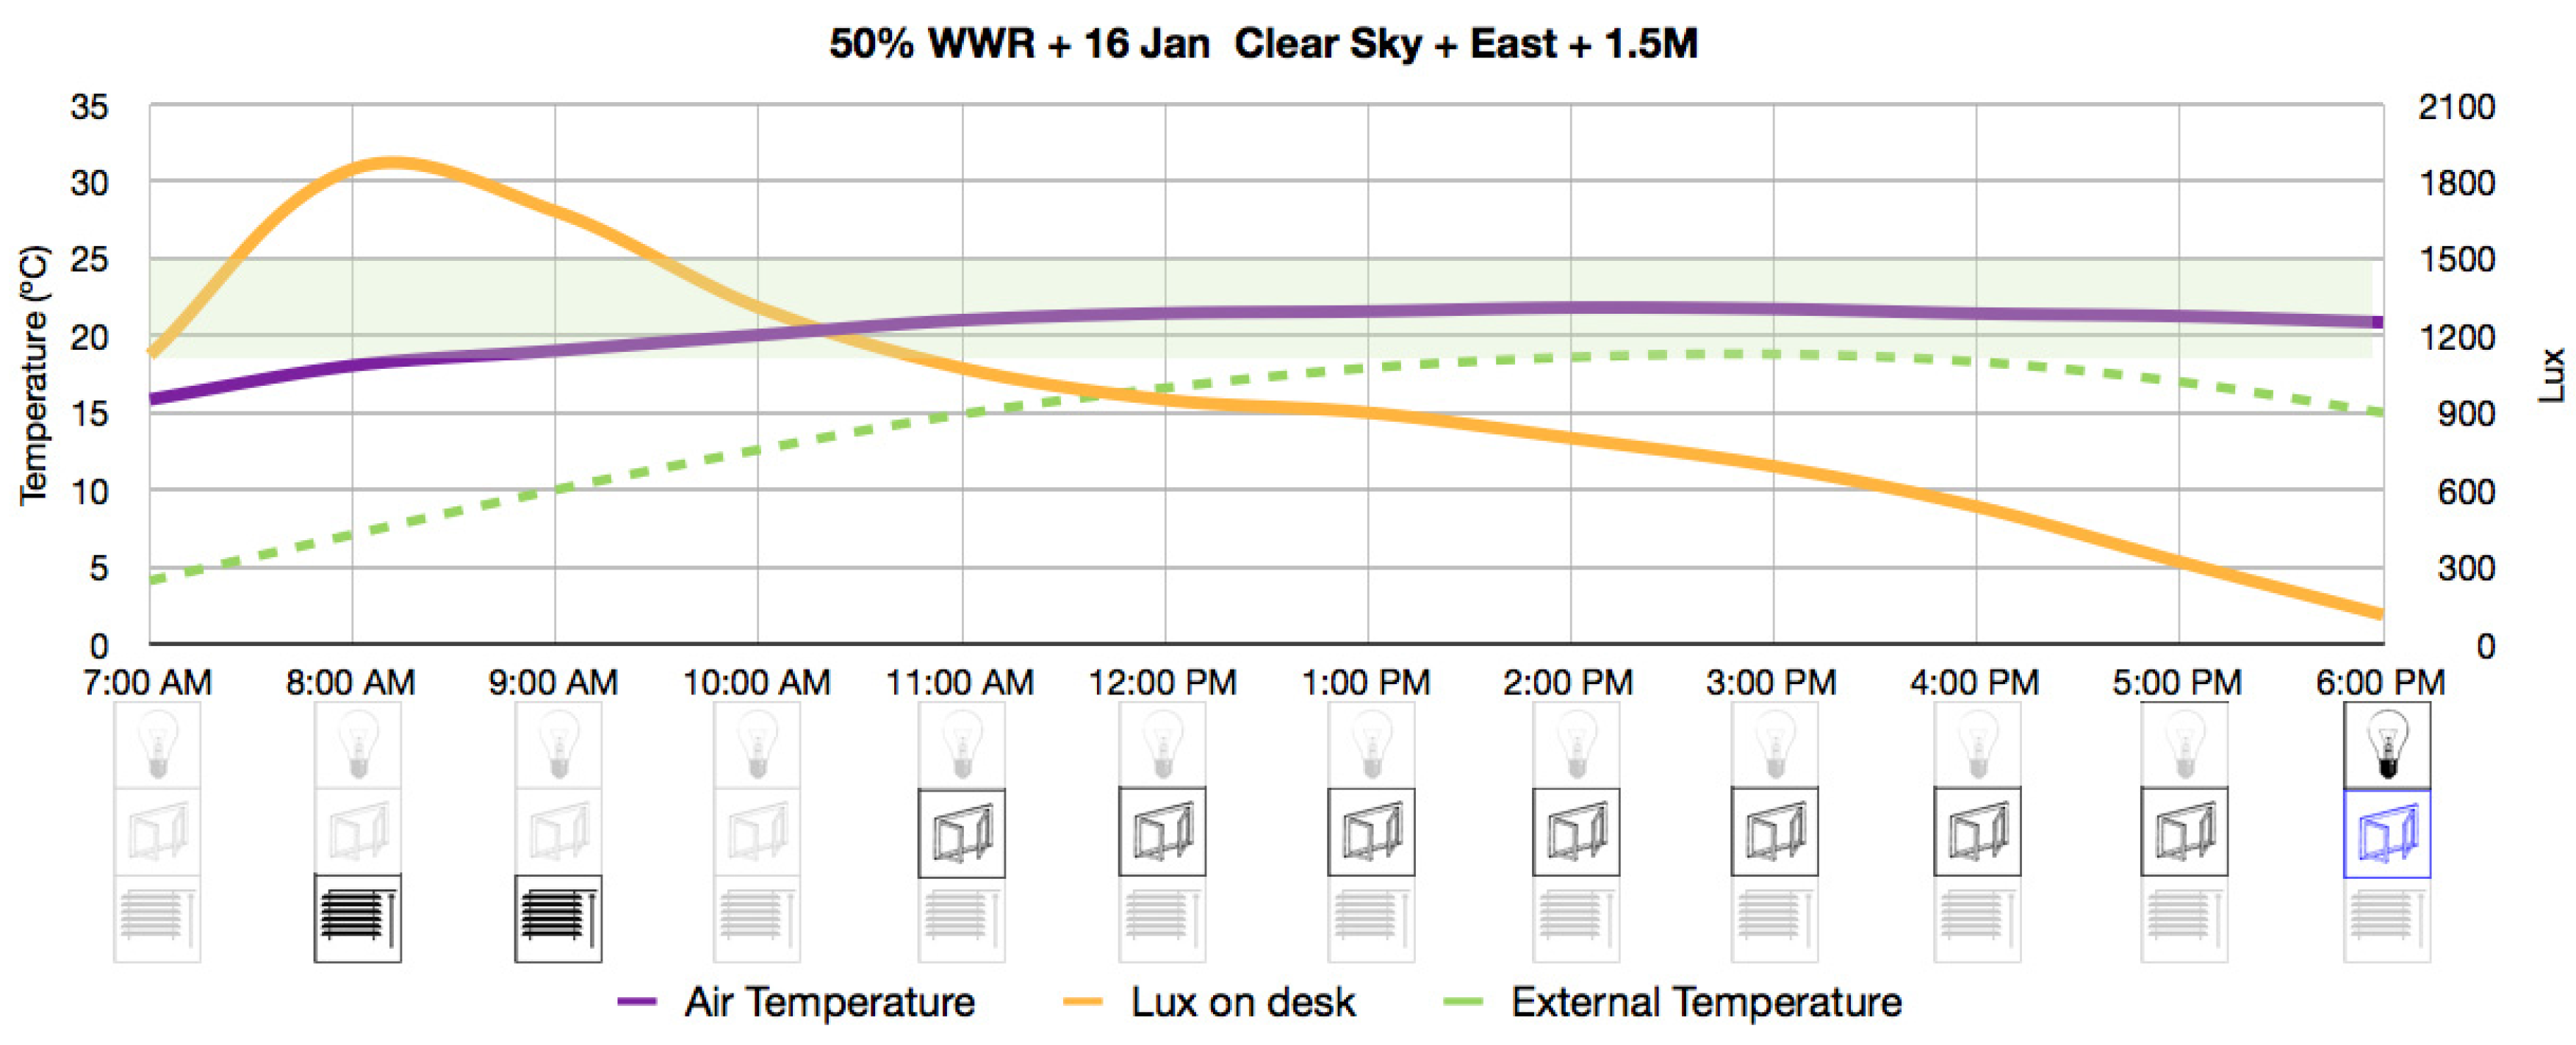
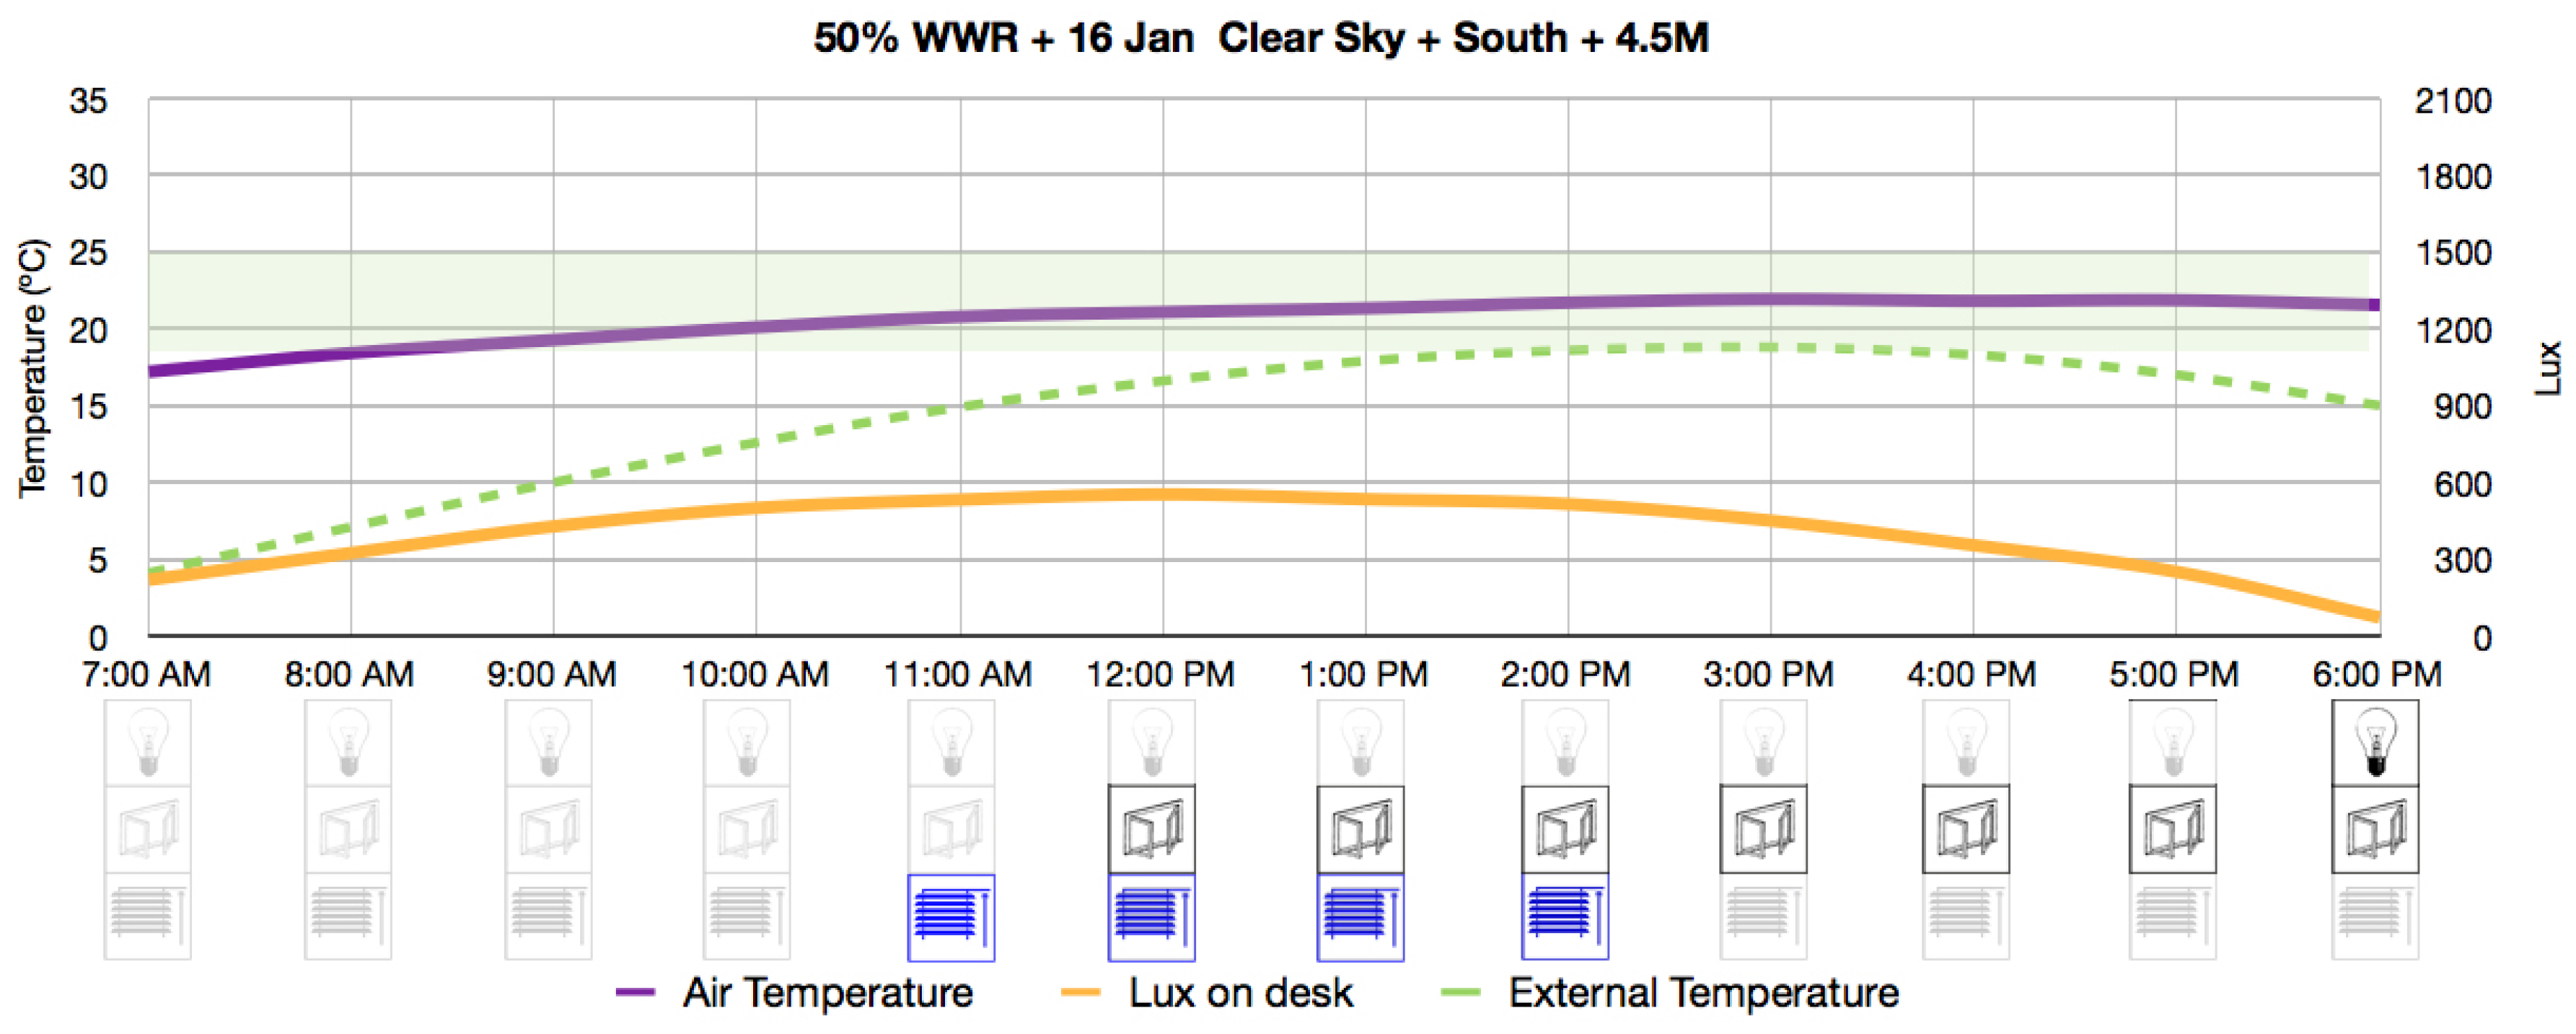
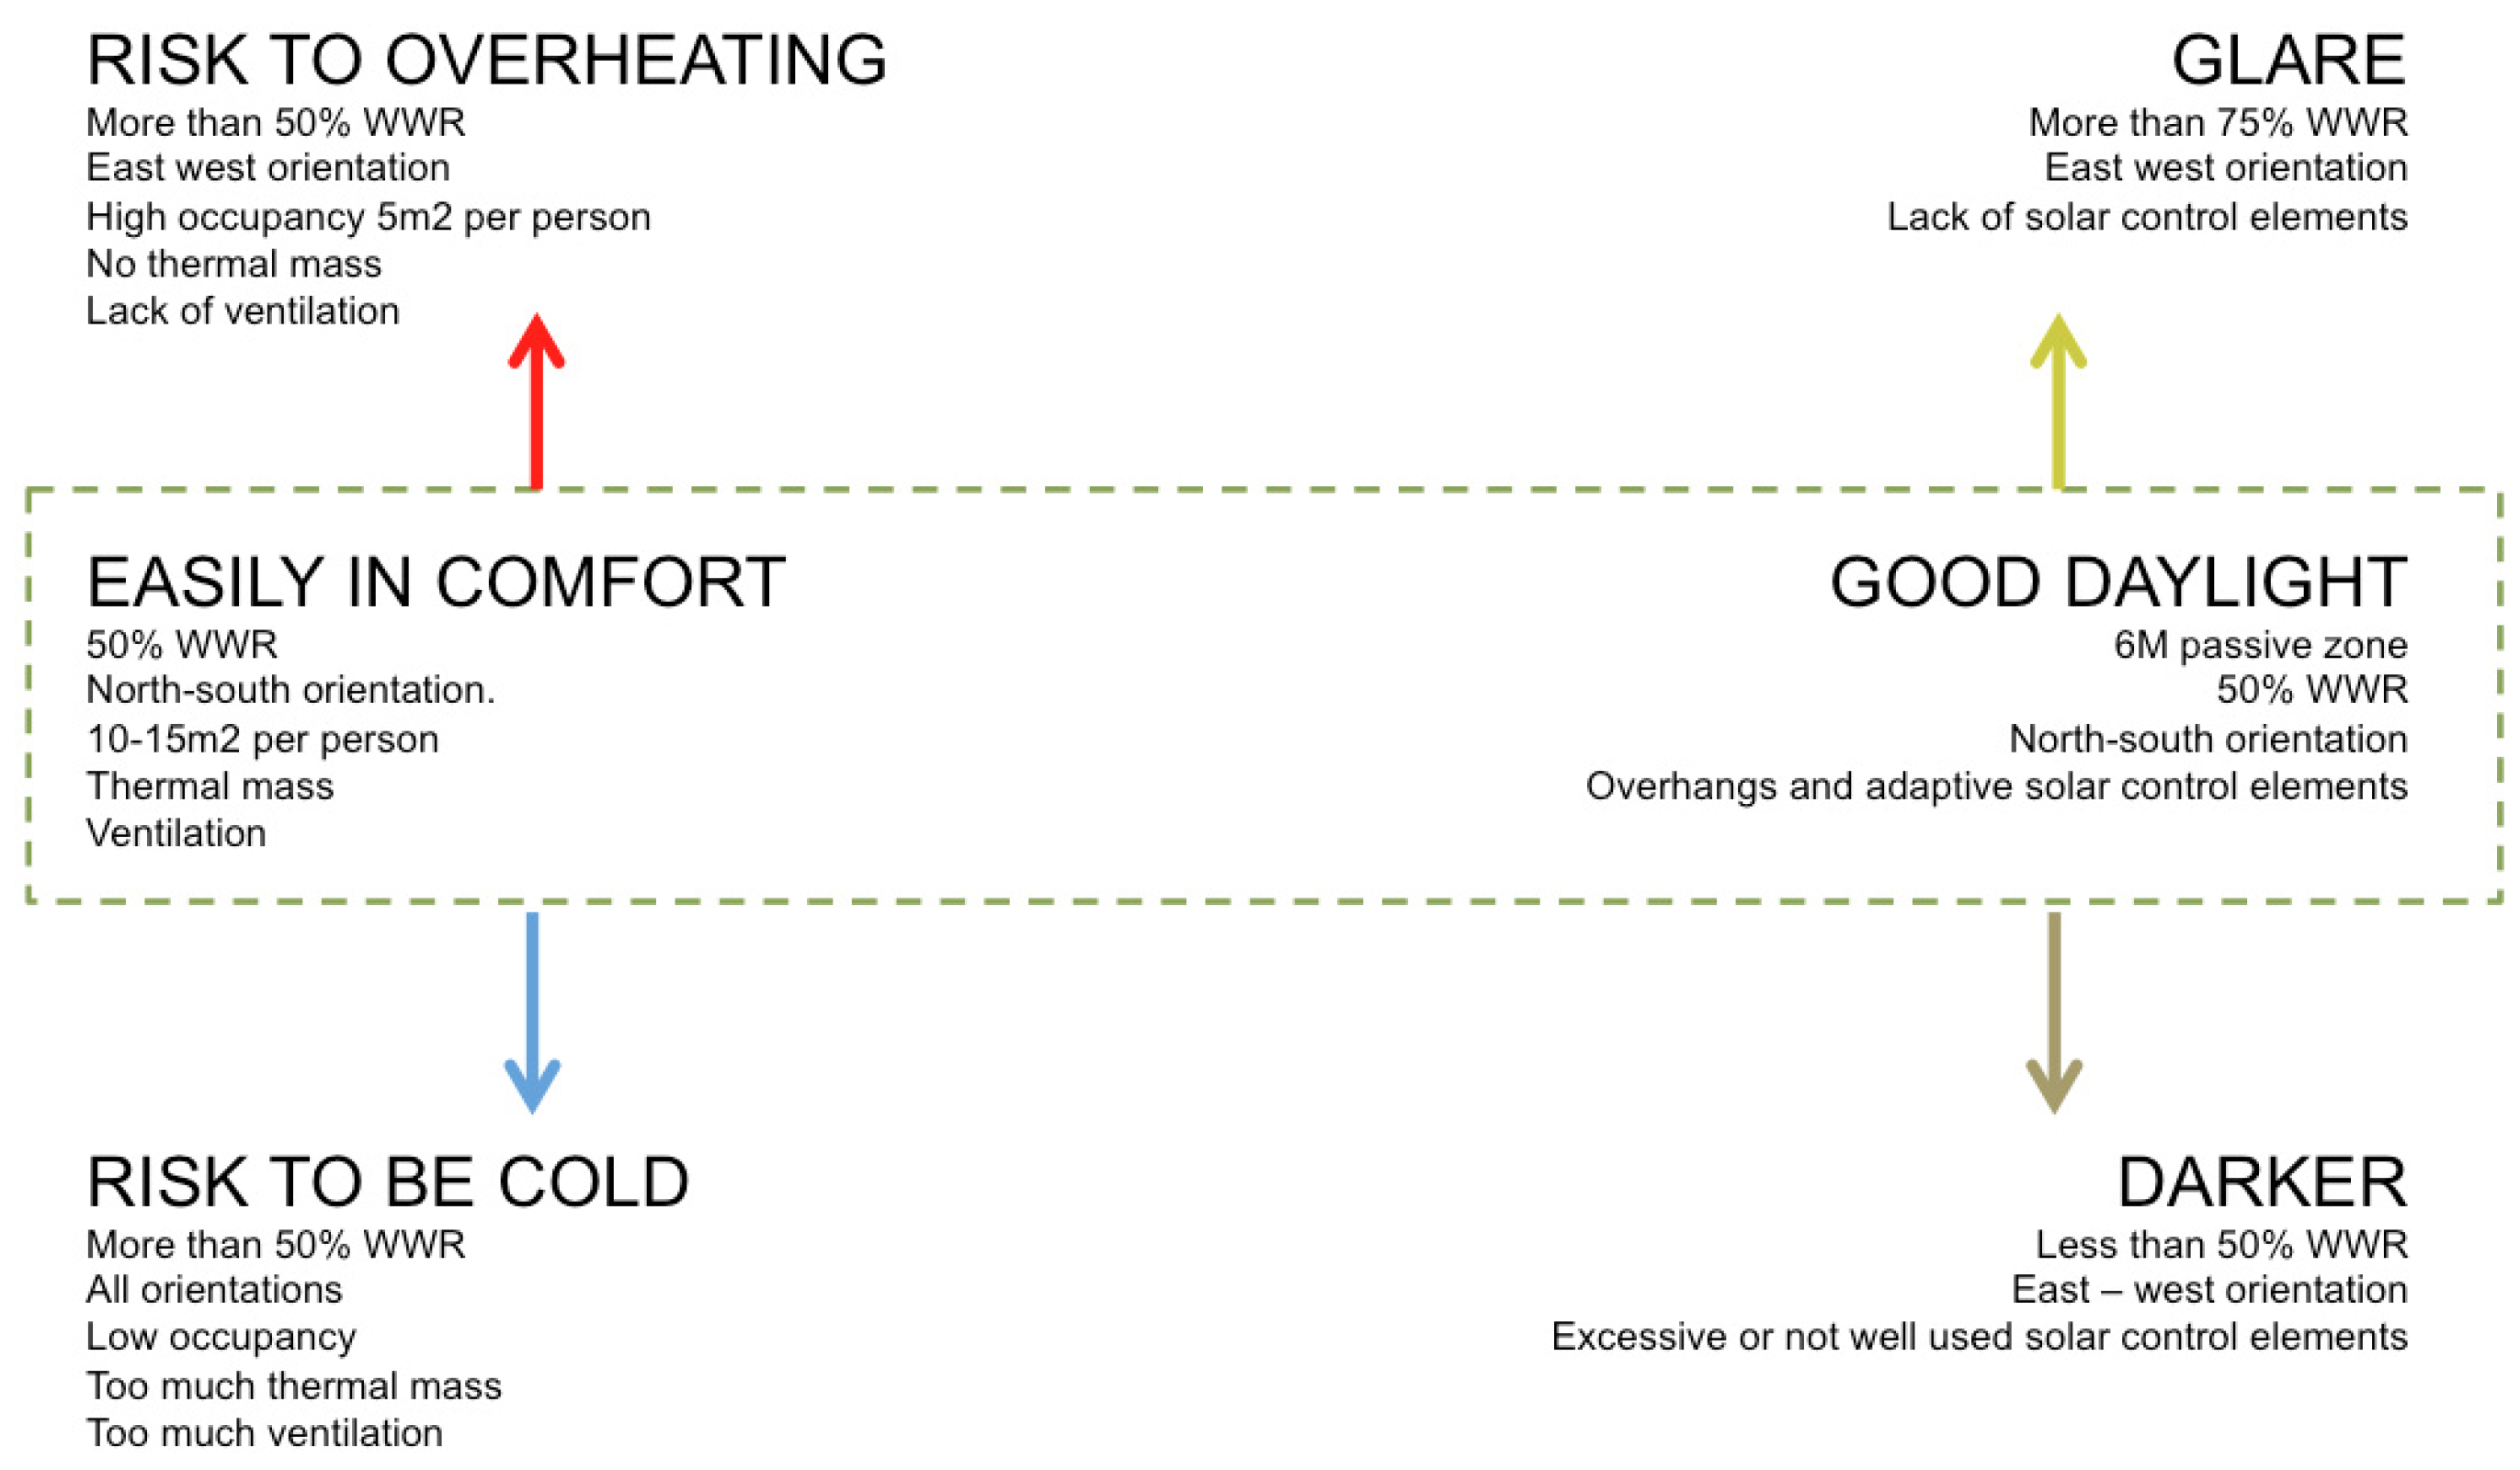
Figure 21 summarizes the outcomes of the analytic work for passive working environments in the climate of Bogotá, highlighting the changes in WWR and orientation that are likely to put thermal and daylight conditions at risk. With special attention to the window/wall ratio, values higher than 50% can cause overheating as well as excessive heat losses in different days of the year and times of the day, unless solar protection for the warmer periods and solar access for the cooler periods are provided. On the other hand, window/wall ratios smaller than 50% are likely to lead to lack of daylight.
The thermal dynamic simulations also demonstrated that free running office spaces in Bogotá can provide thermal comfort, since the adoption of a number of design strategies is guaranteed, namely natural ventilation, exposed thermal mass, protection against direct solar radiation, occupational density of no less than 10 m
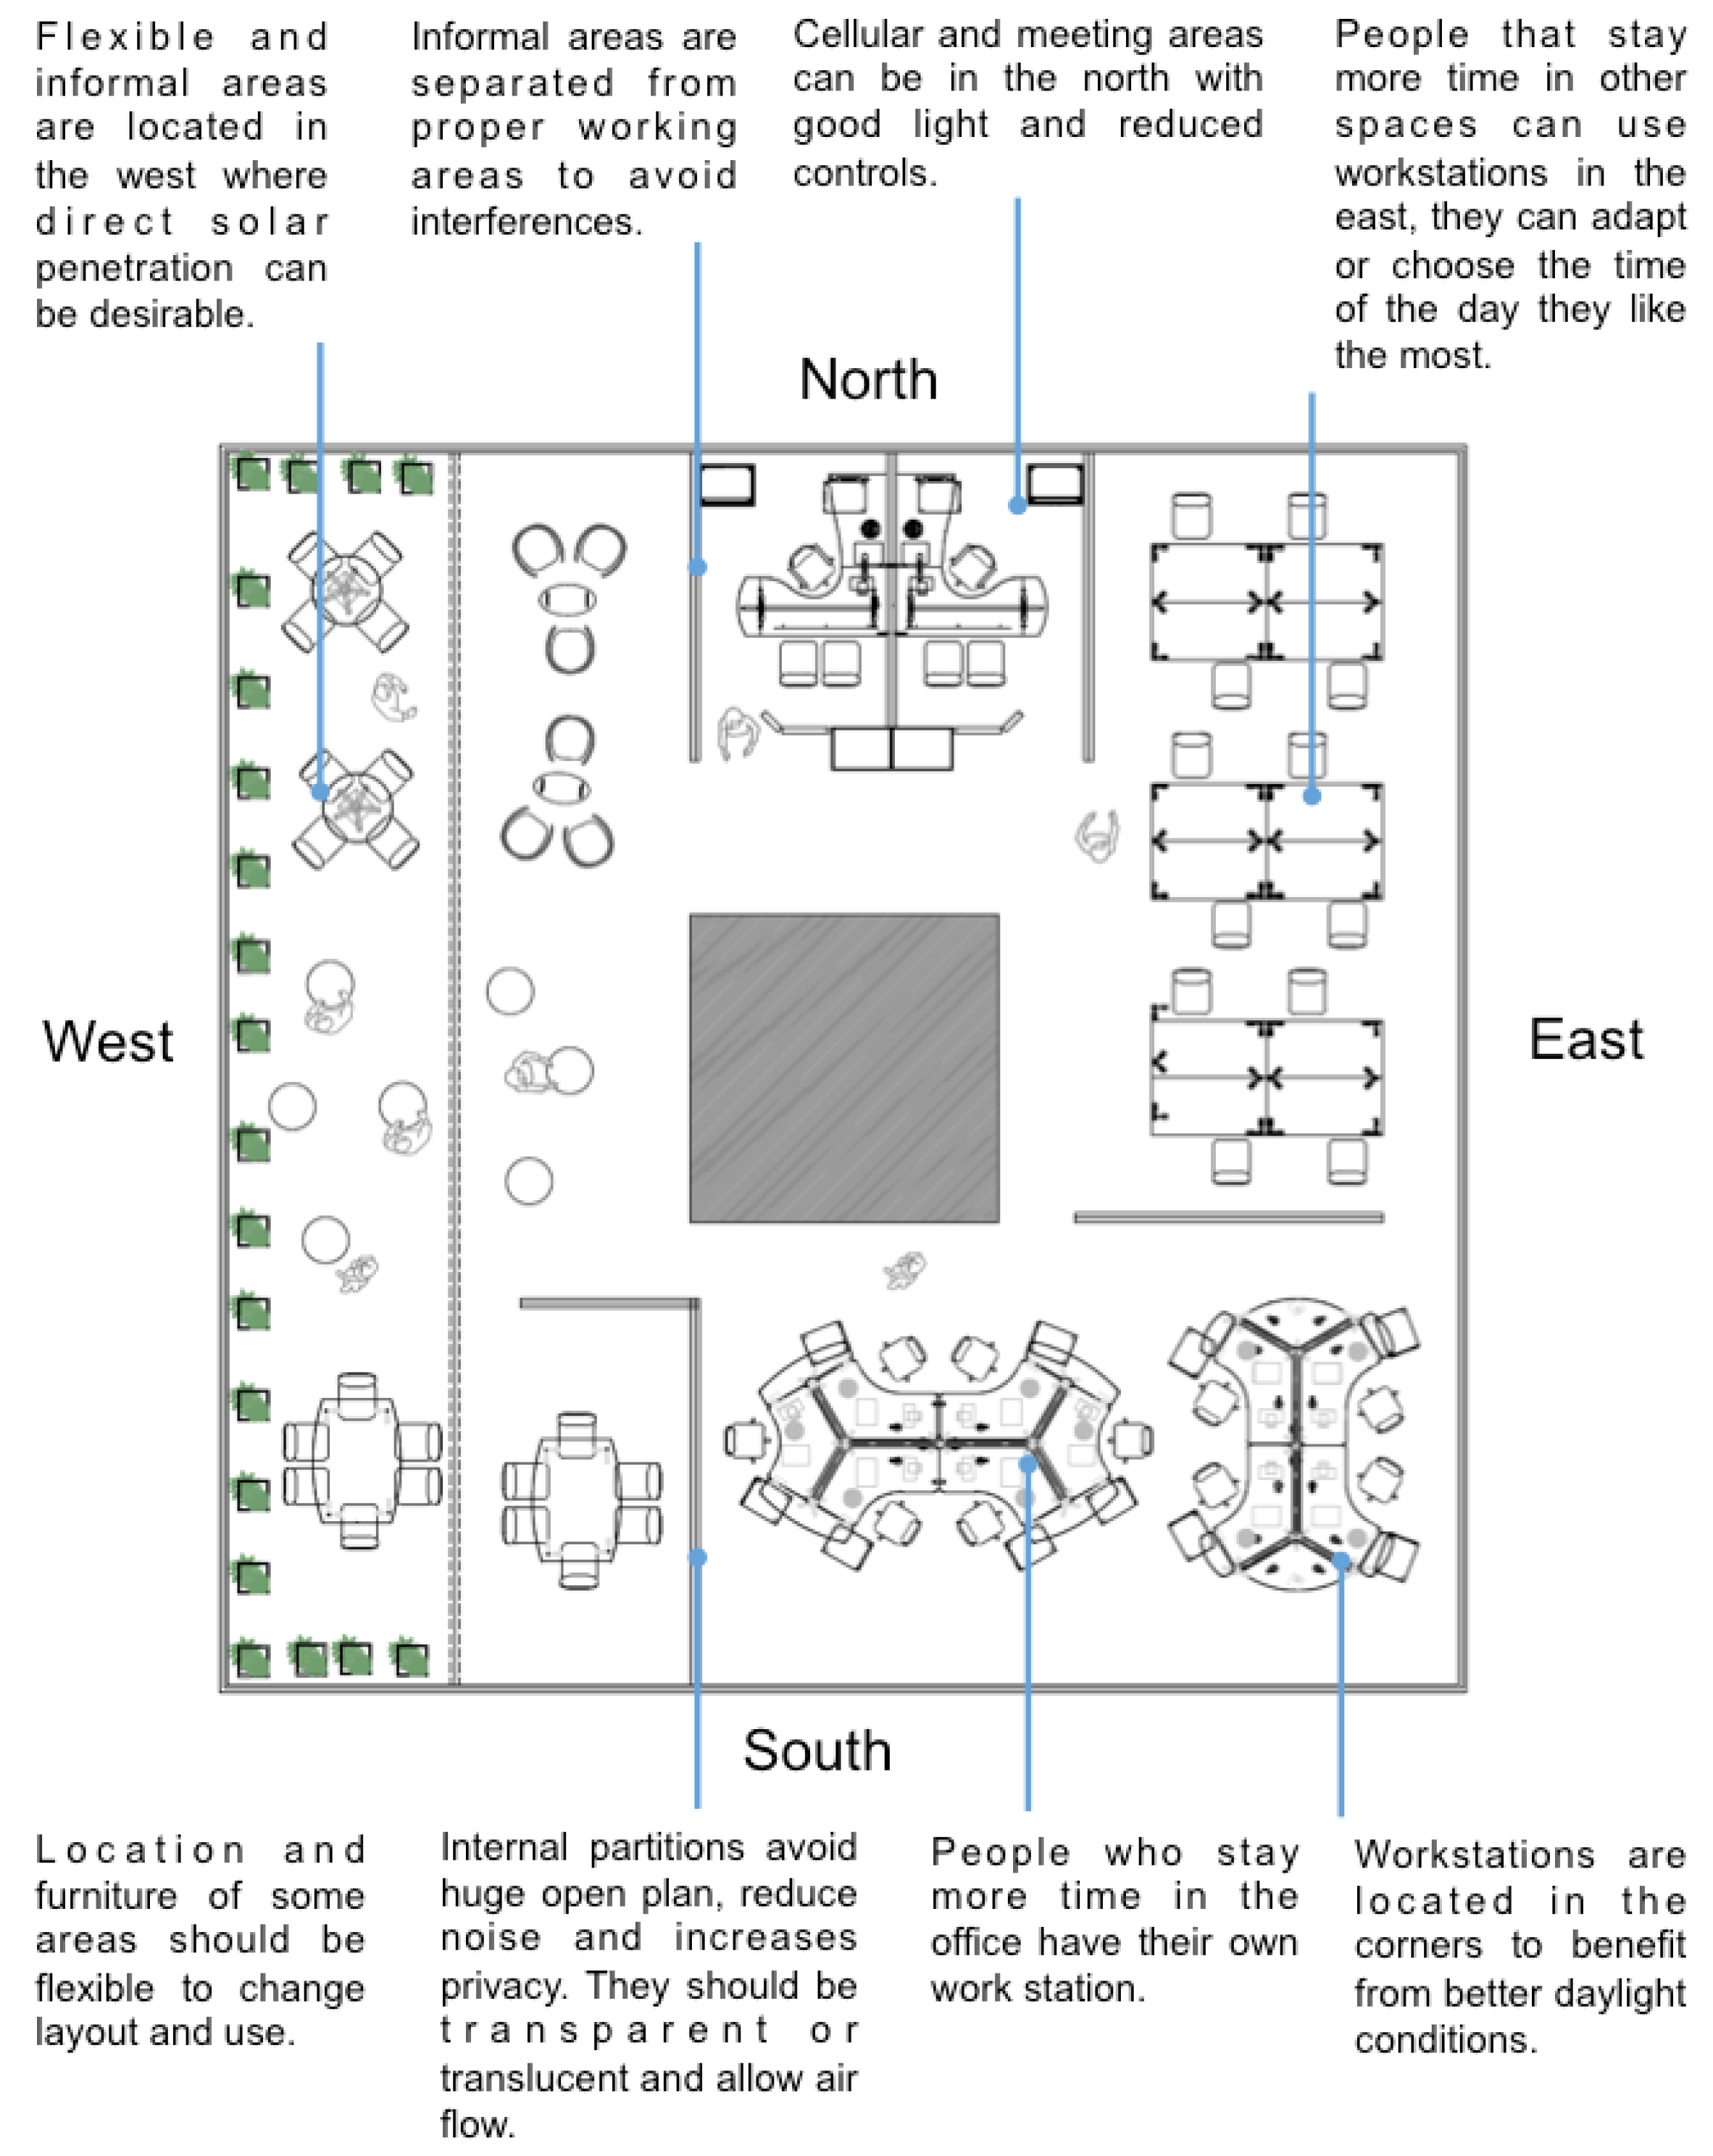
2 per person, and the admission of daylight rather than artificial lighting. With regards to space planning and office layout, from the analytical studies of thermal and daylight simulations, it was deduced that the distribution of working activities can benefit from the different environmental conditions created across the floor plan due to the impact of orientation. Having said that, Table 5 shows recommended orientation for each activity, according to specific environmental requirements. Based on such recommendations, Figure 22 presents a generic space planning and layout proposal for the occupation of a typical working floor plan.
Figure 21. Summary of the findings from the analytical studies (thermal and daylighting simulations).
Buildings 05 01105 g021
Table 5. Recommended orientation for different working activities with the same floor plan of an office building in Bogotá.
AreaThermalDaylightControlsIdeal
ConcentratedE-WN-SE-WE-W
ThinkingE-WN-SANYE-W
RoutineE-WN-SN-SN-S
CollaborativeN-SN-SANYN-S
InformalANYANYN-SE-W
MeetingN-SN-SANYN-S
PresentationN-SANYE-WE-W
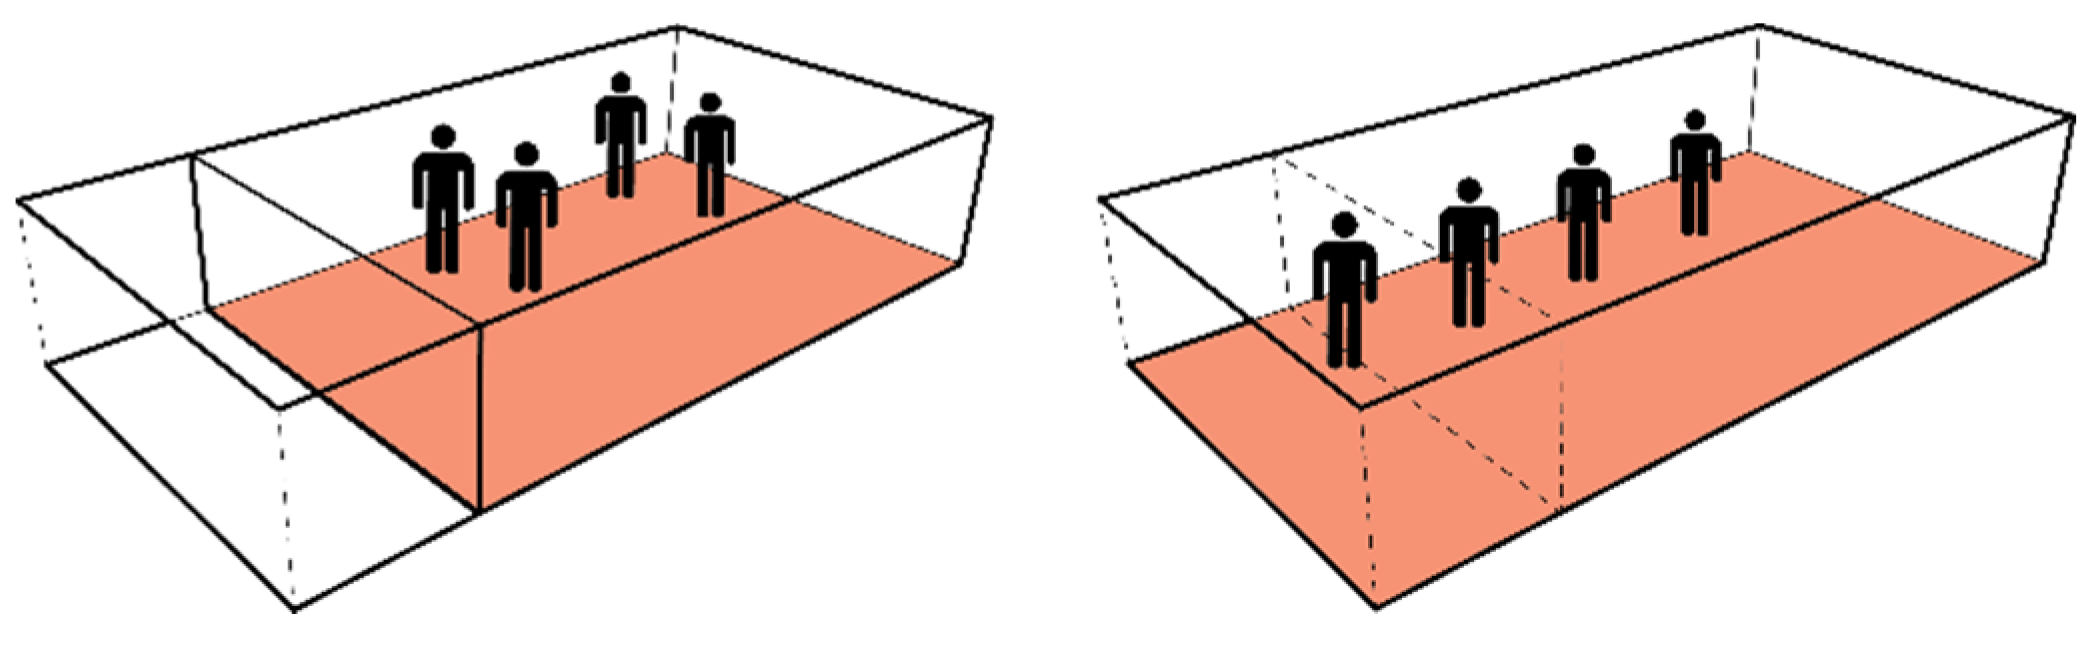
With respect to the connection with the outdoors, the opening of internal spaces was designed to redistribute occupational density and couple the indoors with the outdoors. When the space is closed, density is increased and when it is opened, not only is the internal space coupled with the outdoors, but the overall occupational density is lower because it has been redistributed, thus reducing internal gains. Considering the external climatic conditions, the analytical studies of the thermal dynamics of the base case indicate decoupling during the morning hours and coupling in the afternoon, following the schedule presented in 
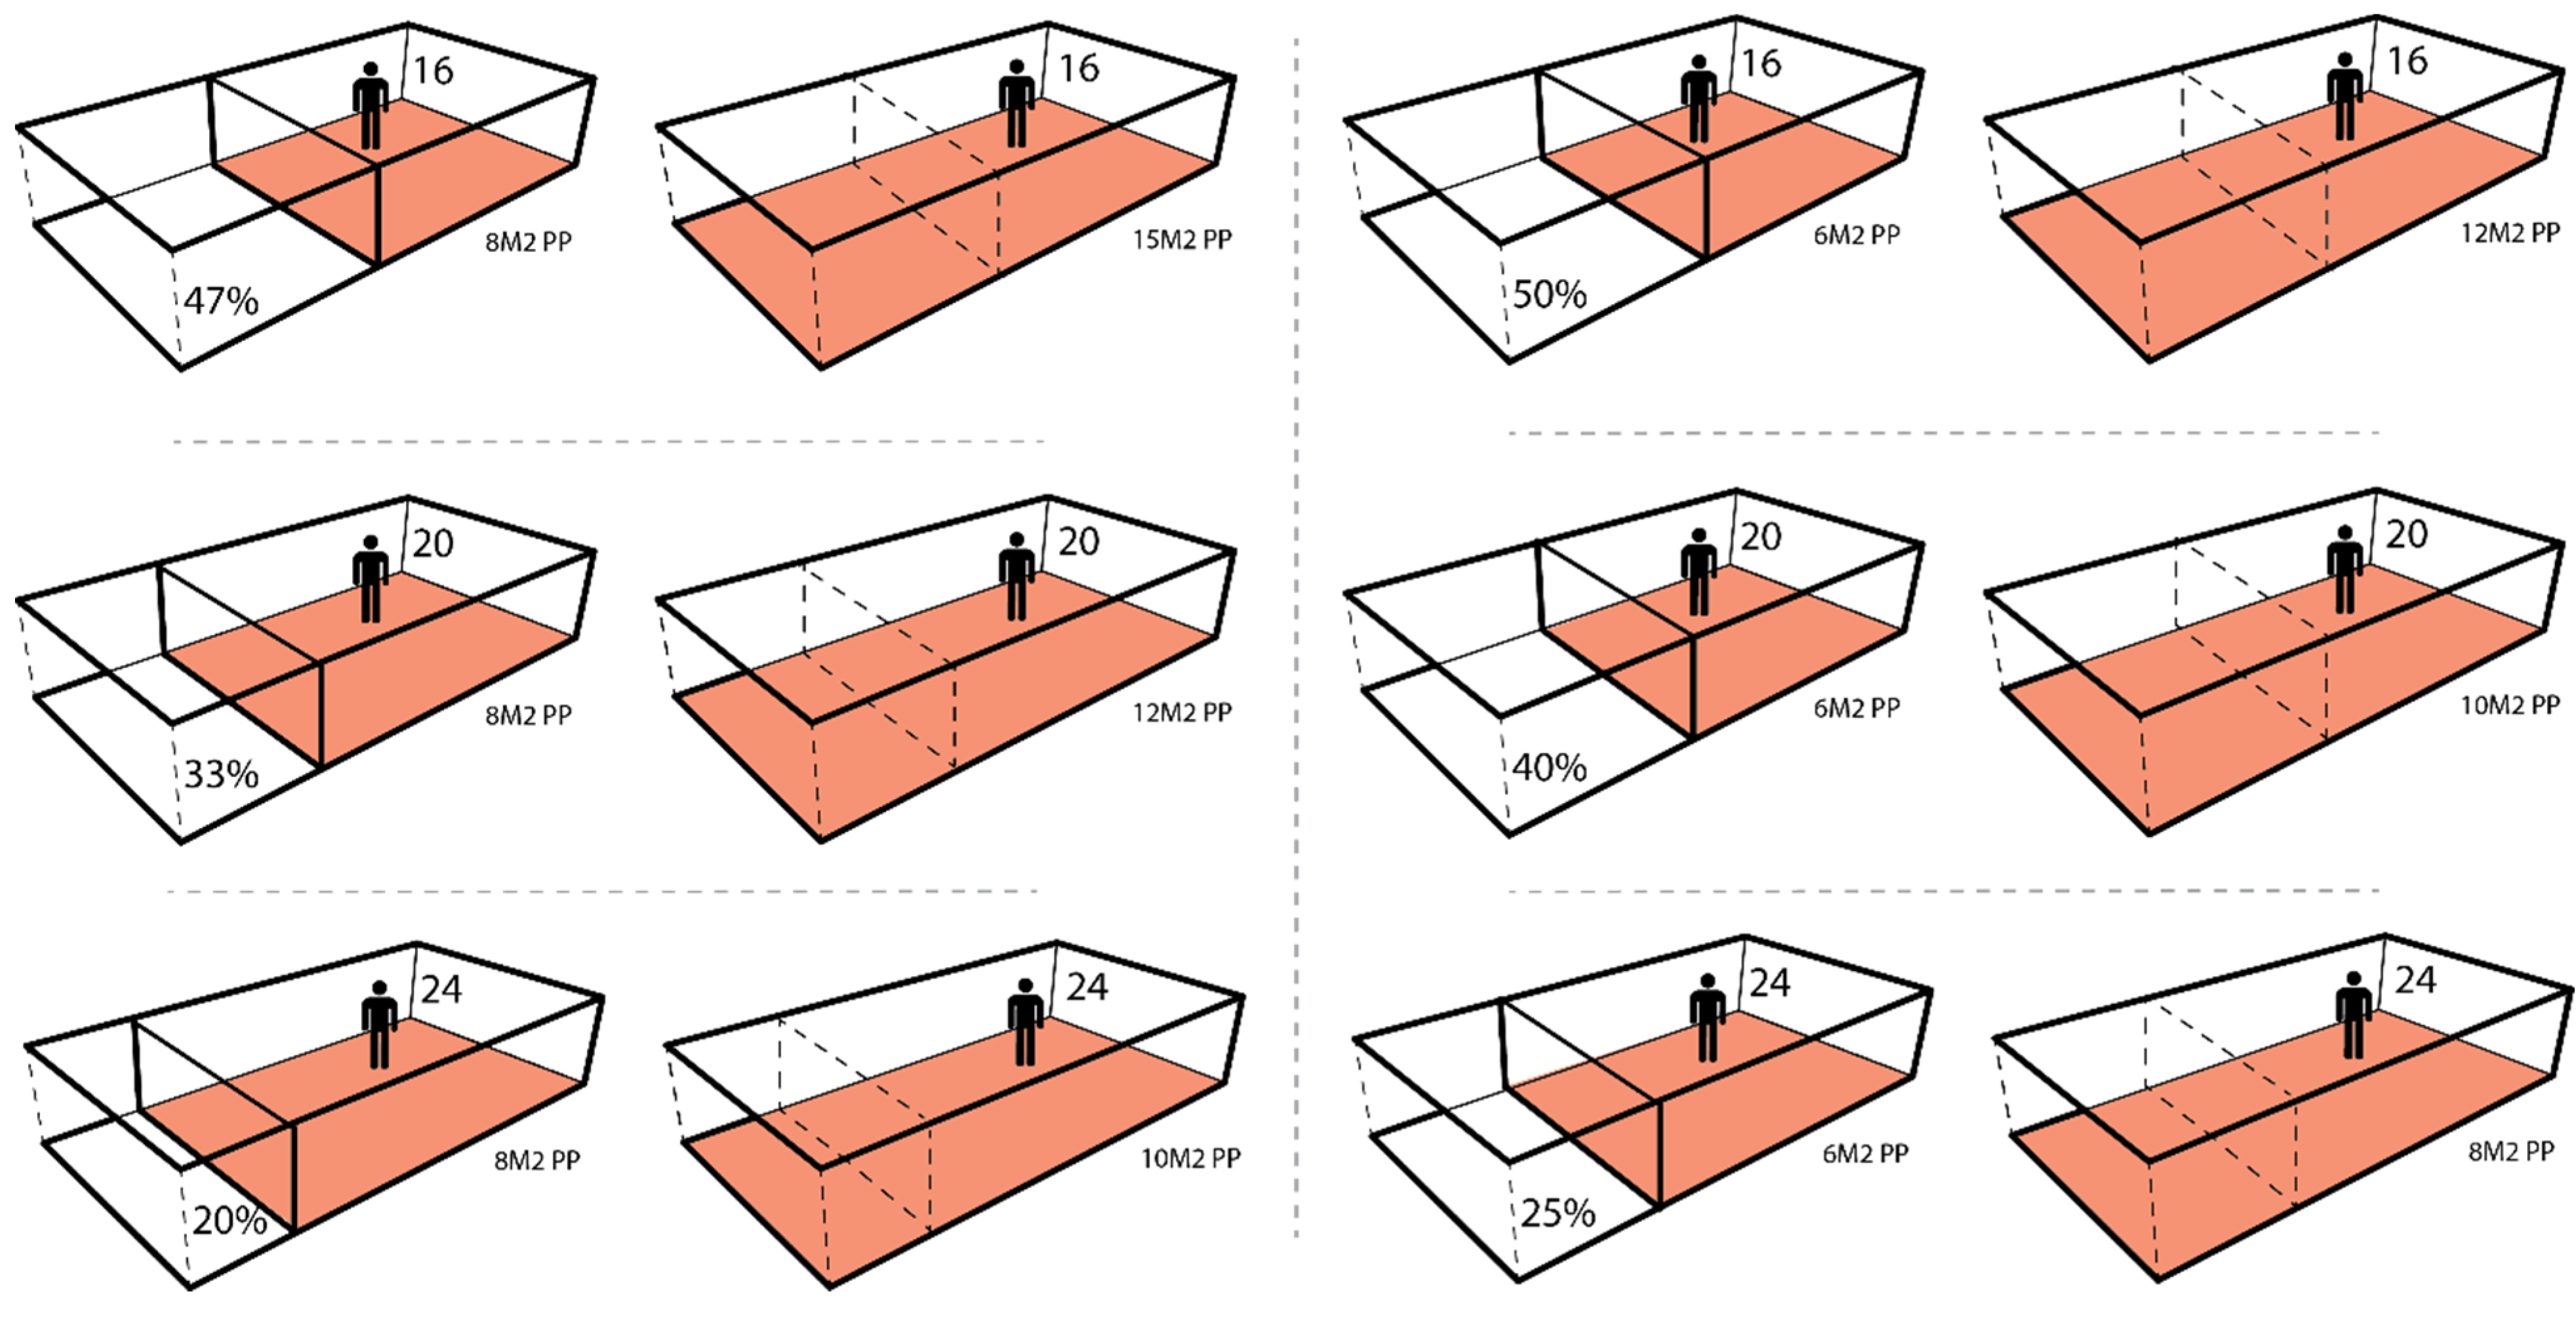
Figure 23. Regarding space dimensions, it should be considered that to allow the spillover of density, transitional spaces should have adequate dimensions to support working activities, as suggested in Figure 24. On that basis, usable working area varies between 6 and 10 m2 per person, discounting the space given to the semi-external area (the intermediate space), which varies from zero to 40% of the total office area. For the purpose of this analytical exercise, the option of having 20% of the floor plan as an intermediate space was chosen to accommodate the coupling strategy, by means of transitional spaces.
Figure 22. Diagrammatic space planning and layout proposal for the occupation of a typical working floor plan in an office building in Bogotá.
Buildings 05 01105 g022
Figure 23. Diagrammatic representation of the intermediate space coupled with the indoors.
Buildings 05 01105 g023
Humphreys’ adaptive comfort model was chosen as the criterion for the evaluation of internal and intermediate (or transitional) working spaces in this analytical exercise. Giving the coupling to the outdoors, the thermal environment in the intermediate spaces will be similar to the external conditions. The resultant yearly comfort band varies between 16 and 22 °C, encompassing 40% of the occupancy hours when external temperatures are within these limits, giving an indication of the environmental potential of open air spaces for the performance of working activities.
Figure 24. Diagrammatic representation of different relationships between internal and external areas as working areas in one typical rectangular floor plan, varying between 6 and 10 m2 per person and discounting the space given to the external area (intermediate space), which varies from zero to 40% of the total office area.
Buildings 05 01105 g024
The simulations show that temperature in the intermediate space is equal or above 16 °C for 65% of the daytime hours. 
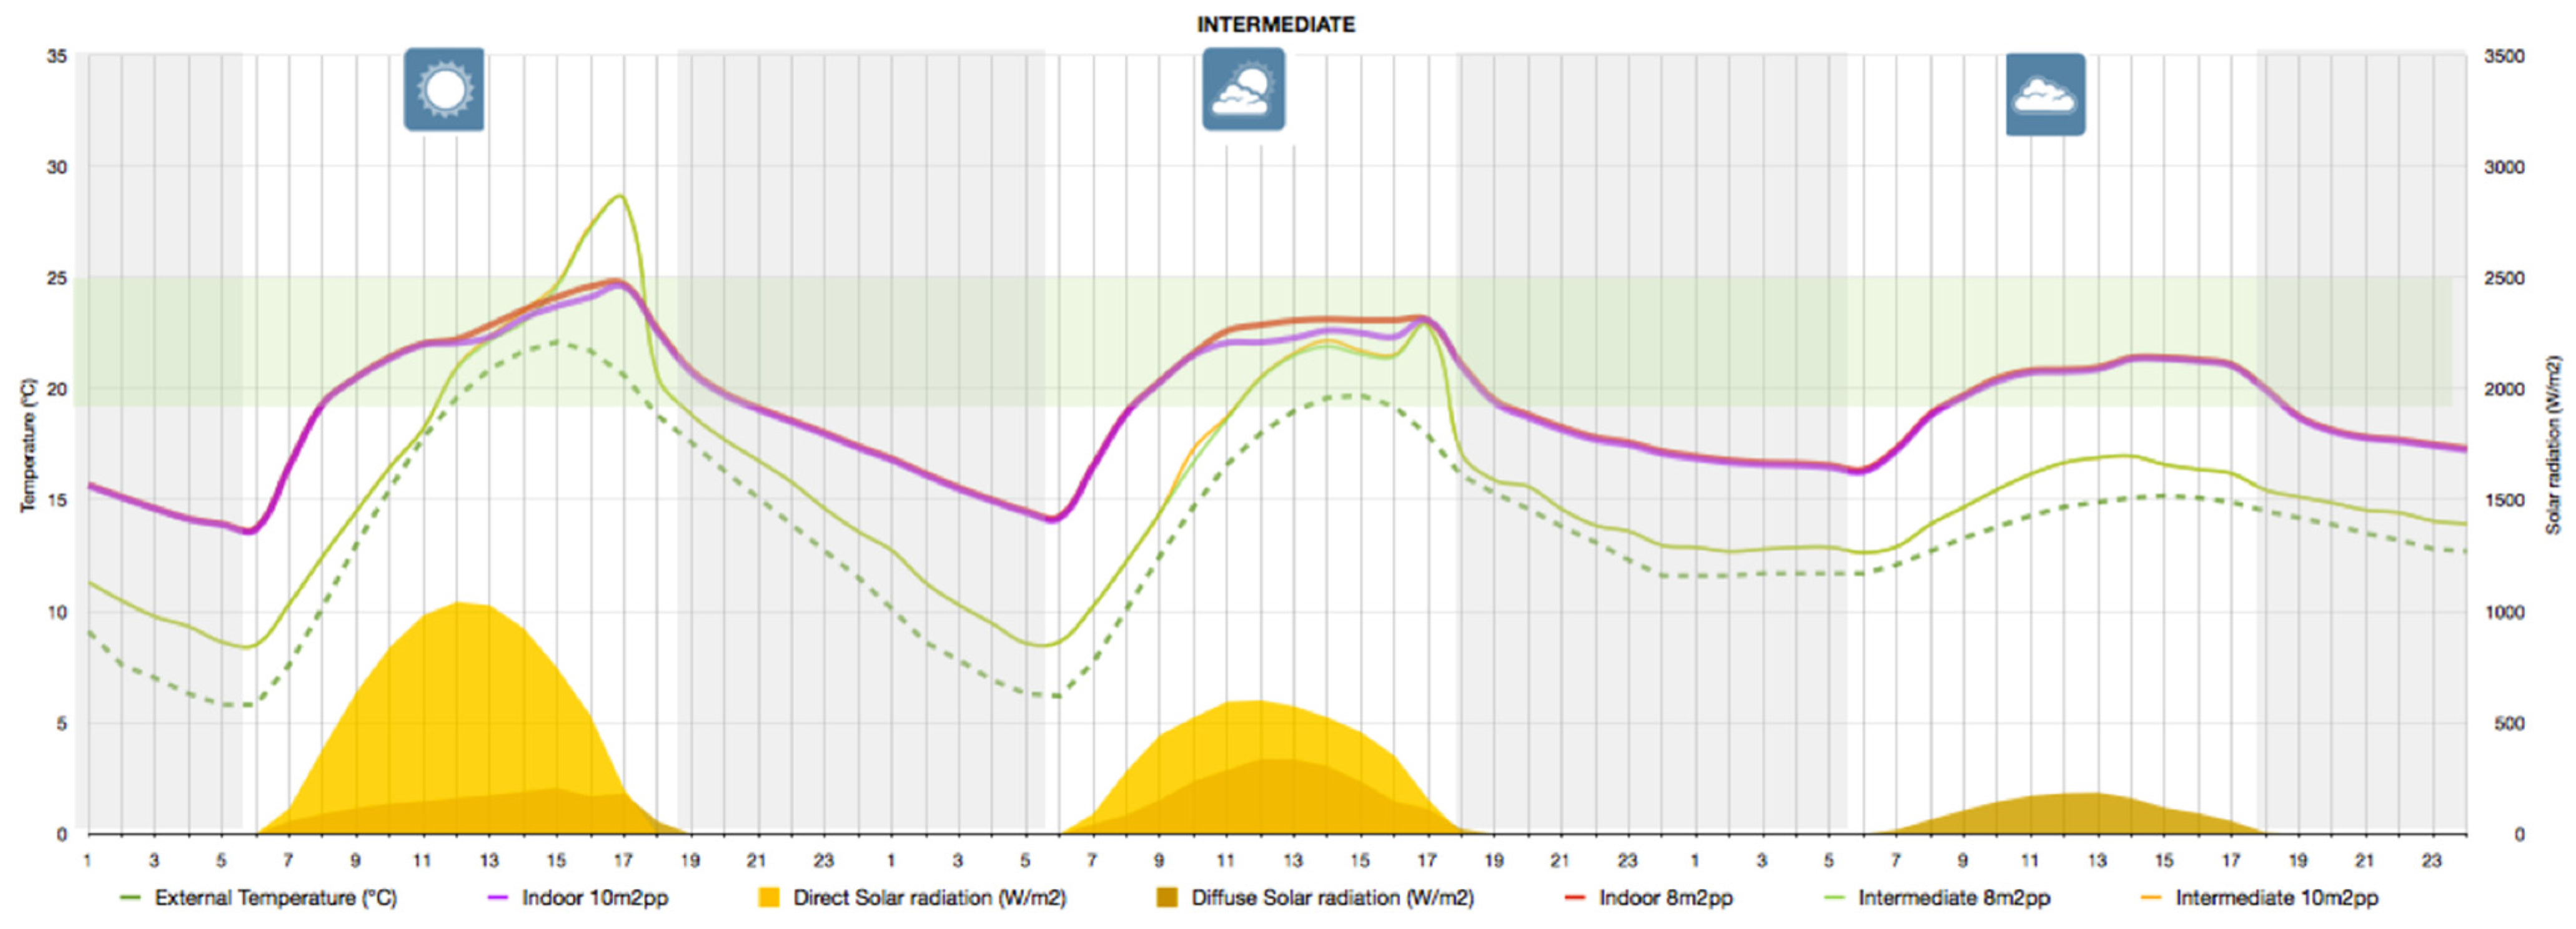
Figure 25 brings the performance of the internal working space when decoupled and coupled with the outdoors through the intermediate space. In order to avoid the risks of cooling down the internal spaces to below the limits of the comfort band, the criterion applied for the coupling with outdoors is an internal temperature of around 21 °C. In this way, the intermediate space open to the outdoors contributes to the cooling down of the internal office area.
Figure 25. Simulation of the thermal performance of the internal office area when coupled with the intermediate space. The intermediate space contributes to the cooling down of the internal spaces in the peak daily hours of heat.
Buildings 05 01105 g025

6. Final Considerations

As discussed in the literature review, the environmental design of working spaces needs to consider the different types of activities that will take place in them. Companies are promoting interactive environments in which knowledge is shared with others. The understanding of the space dynamics of such activities and their environmental requirements will result in the layout of activities for flexible occupancy patterns as well as better environmental conditions. In this respect, space dimensions, orientation, location in the plan, and façade treatment are defined according to environmental requirements, internal gains, and climatic conditions, thereby reducing the energy demand for artificial lighting and air conditioning in office buildings and motivating the use of adaptive opportunities for thermal comfort and daylight.
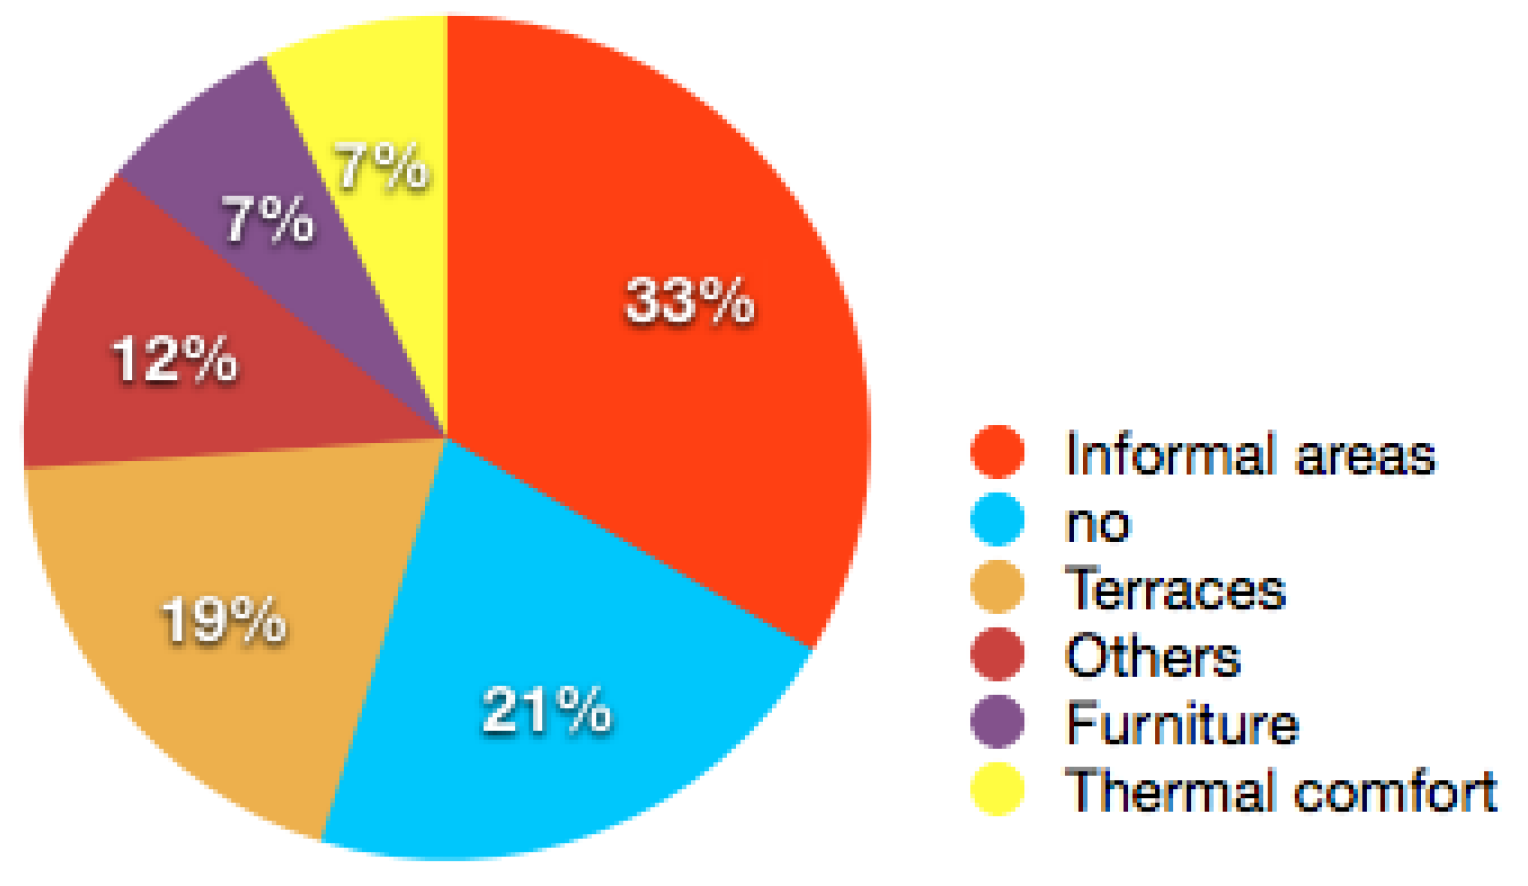
The survey of occupants of office buildings revealed that being close to a window is valued by the majority. Furthermore, 50% would like to have informal areas and outdoor spaces attached to their working environments. In addition, the analytical studies showed that the combination of a set of environmental design strategies, including a schedule for coupling and decoupling of indoor spaces with the outdoors and a variation of occupancy density, made thermal comfort possible in free running working spaces located in the mild climate of Bogotá.
Moving beyond the discussion of the technical possibility of opening the buildings to the outdoors, with a change in the culture of the office work, expectations about the environmental quality of internal working spaces will also change towards more environmentally adaptable buildings, as explained by Duffy [17]. Based on this idea, one could say that the environmental conditions of the internal spaces could become less homogeneous, with a certain degree of fluctuations, thus aligning themselves to the dynamics of the external environment and creating opportunities for more open or semi-open spaces, ultimately creating truly environmentally responsive buildings.

Acknowledgments

The authors would like to thank all the support provided by the teaching staff of the pos-graduate course Sustainable Environmental Design (SED), from the Architectural Association Graduate School, of the Architectural Association School of Architecture (AA), in London, United Kingdom.

Author Contributions

Analytical and empirical work developed by Juan Manuel Fernández and supervised by Joana Carla Soares Goncalves in the Sustainable Environmental Design (SED), from the Architectural Association School of Architecture, in London, provided the technical data presented in this paper. In addition, the background on naturally ventilated office buildings and new trends of occupation described in this paper was put together by Joana Carla Soares Goncalves.

Conflicts of Interest

The authors declare no conflict of interest.

References

  1. United Nations Environment Programme (UNEP). Buildings: Investing in Energy and Resource Efficiency. The Green Economy Report. Available online: http://www.unep.org/greeneconomy/ (accessed on 14 June 2011).
  2. International Energy Agency (IEA). World Energy Outlook 2009 (2009). Available online: http://www.iea.org/weo/electricity.asp (accessed on 10 February 2010).
  3. Laustsen, J. Energy Efficiency Requirements in Building Codes, Energy Efficiency Policies for New Buildings; IEA Information Paper; IEA: Paris, France, 2008. [Google Scholar]
  4. Marcondes, M.; Alucci, M.; Concalves, J. Façades and office buildings in São Paulo (Brazil): Aiming for thermal comfort and natural ventilation. In Proceedings of the 7th Windsor Conference, Windsor, UK, 12–15 April 2012.
  5. World Business Council for Sustainable Development (WBCSD). Energy Efficiency in Buildings. Business Realities and Opportunities; FACTS Summary Report; World Business Council Sustainable Development: Geneva, Switzerland, 2007. [Google Scholar]
  6. Goncalves, J.; Bode, K. The environmental value of buildings: A proposal for performance assessment with the reference to the case of the office tall building. Innov. Eur. J. Soc. Sci. 2011, 24. [Google Scholar] [CrossRef]
  7. Chartered Institution of Building Services Engineers (CIBSE). CIBSE Guide F, Energy Efficiency in Buildings, 2nd ed.; CIBSE: London, UK, 2004. [Google Scholar]
  8. ASHRAE Standard 55-1992 Thermal Environmental Conditions for Human Occupancy; ASHRAE: Atlanta, GA, USA, 1992.
  9. ISO 7730 Moderate Thermal Environments: Determination of the PMV and PPD Indices and Specification of the Conditions for Thermal Comfort; ISO: Geneva, Switzerland, 1994.
  10. Nicol, F.; Humphreys, M.; Roaf, S. Adaptive Thermal Comfort, Principles and Practice; Routledge: Abingdon, UK, 2012. [Google Scholar]
  11. Banham, R. The Architecture of the Well Tempered Environment; University of Chicago Press: Chicago, IL, USA, 1984. [Google Scholar]
  12. United Nations Environment Programme (UNEP). Cities: Investing in Energy and Resource Efficiency. The Green Economy Report. Available online: http://www.unep.org/greeneconomy/ (accessed on 14 June 2011).
  13. Baker, N.V. A Handbook of Sustainable Refurbishment: Non-Domestic Buildings; Earthscan: London, UK, 2009. [Google Scholar]
  14. Chartered Institution of Building Services Engineers (CIBSE). Environmental Design. Guide A, 7th ed.; CIBSE: London, UK, 2006. [Google Scholar]
  15. Gonçalves, J. The Environmental Performance of Tall Buildings; Earthscan Publications Limited: London, UK, 2010. [Google Scholar]
  16. Johnston, J.; Counsell, J.; Strachan, P.A. Trends in Office Internal Gains and the Impact on Space heating and Cooling. In Proceedings of the CIBSE Technical Symposium, De Montfort University, Leicester, UK, 6–7 September 2011.
  17. Duffy, F. The death and life of the urban office. In The Endless City; The Urban Age Project by the London School of Economics and Deutsche Bank’s Alfred Herrhausen Society; Phaidon Press Limited: London, UK, 2007. [Google Scholar]
  18. Harrison, A.; Wheeler, P.; Whitehead, C. The Distributed Workplaces; Spoon Press: London, UK, 2004. [Google Scholar]
  19. Levine, M.; Ürge-Vorsatz, D.; Blok, K.; Geng, L.; Harvey, D.; Levermore, G.; Mehlwana, A.M.; Lang, S.; Mirasgedis, S.; Novikova, A.; et al. Residential and commercial buildings. In Climate Change 2007: Mitigation. Contribution of Working Group III to the Fourth Assessment Report of the Intergovernmental Panel on Climate Change; Cambridge University Press: Cambridge, UK, 2007. [Google Scholar]
  20. ASHRAE Standard 55-2004 Thermal Environmental Conditions for Human Occupancy; ASHRAE: Atlanta, GA, USA, 2004.
  21. Fernández, J.M.A. Rethinking the Work Environment in Bogota: Improving Environmental Quality and Coupling with the Outdoor. Master’s Thesis, Environmental and Energy Programme, Architetural Association School of Architecture, London, UK, 2013. [Google Scholar]
  22. Candido, C.; Lamberts, R.; Bittencourt, L.; de Dear, R. Aplicabilidade dos limites da velocidade do ar para efeito de conforto térmico em climas quentes e úmidos; Ambiente Construído: Porto Alegre, Brasil, 2010; Volume 10, pp. 59–68. (In Portuguese) [Google Scholar]
  23. De Cotta, J.P.O. The Impact of Window Design in the Environmental Performance of Work Environments in São Paulo. Master’s Thesis, Sustainable and Environmental Design, Environmental and Energy Programme, Architetural Association School of Architecture, London, UK, 2012. [Google Scholar]

