Article

An Exploratory Study of Digital Inequities and Work in the Redevelopment of a Southeastern American City

School of Social Work, University of North Carolina at Charlotte, Charlotte, NC 28223, USA
*
Author to whom correspondence should be addressed.
Soc. Sci. 2022, 11(10), 442; https://doi.org/10.3390/socsci11100442
Submission received: 19 August 2022 / Revised: 12 September 2022 / Accepted: 20 September 2022 / Published: 26 September 2022
(This article belongs to the Special Issue Bridge the Gap: ICT Competences and Vocational Education and Training)

Abstract

:
Nearly 6 million workers support the multi-billion-dollar digital economy as one of the fastest-growing sectors in the U.S. labor market. Middle-skill jobs in the digital economy sector that pay higher wages and do not require a bachelor’s degree are underrepresented people of intersectional marginalized identities. This exploratory study builds upon previous research on digital inequities by examining the digital economy values, behavior, and interests of a small sample of residents in an area of Charlotte, North Carolina with known digital, social, and economic inequities. Analyses included descriptive and bivariate statistics. Given the exploratory nature of the study, no causal inferences are made, however, preliminary findings suggest a need for further research on digital skills training that addresses the intersectional barriers experienced in marginalized communities, and the need for place-based interventions that leverage localized policies in the areas of affordable housing, workforce development, and economic development. Implications and limitations are discussed.

1. Introduction

Valued at roughly 24 billion dollars, the United States’ digital economy (DE) accounts for 10 percent of the nation’s gross domestic product. Many internet-enabled goods and services produced by this sector (e.g., entertainment streaming services, tablets, delivery service applications) had not achieved widespread commercial availability when workers in their thirties and forties today exited America’s K-12 public education system. Yet, workforce initiatives designed to help lower-income working adults attain skills to qualify for in-demand opportunities through training have not accounted for society’s shift to greater automation and digitization fueled by the digital economy, a sector where economic growth has recently outpaced the overall U.S. economy (Bureau of Economic Analysis 2022). Middle-skill careers within the digital economy pay a livable wage of USD 15 or more per hour and often do not require a bachelor’s degree, yet they are underrepresented by workers from economically marginalized communities (Barton 2018; Burning Glass Technologies 2017; National Skills Coalition 2017) where poverty is concentrated and persistent across familial generations in many American cities (Chetty et al. 2014). Current trends in the U.S. digital economy indicate that for individuals with minimal digital skills, further technological advancements will exacerbate disparities in education and pathways to improving the economic positioning of families (Arias 2021; Berzin et al. 2016; Reardon 2021), regardless of the employment sector chosen by workers.
Digital inequities partly drive the underrepresentation of economically marginalized populations in the digital economy. Digital inequities refer to an individual’s inability to access information communication technologies (ICTs) in daily life as experienced by a lack of digital devices, affordable broadband, or the know-how (i.e., digital literacy) to use evolving technologies (National Digital Inclusion Alliance n.d.). Digital inequities are intersectional (Crenshaw 1989; Ireland et al. 2018; Tsatsou 2021; Bastick and Mallet-Garcia 2022), meaning that people of multiple marginalized social identities, particularly in regard to race, class, and gender in America, experience digital inaccessibility and illiteracy at higher rates across social environments (Bronfenbrenner 1992) that impact employment and earnings (Martínez and Gayfield 2019). Davis (2019), for instance, found that Black girls held negative beliefs about their identity toward STEM careers in a low-income urban high school setting as a result of cultural stereotypes and social inequities that presented in the primary learning environment for youth; school. Digital inequities create barriers to living wage work in the digital economy for a diverse group of workers who are eager to gain skills that translate into good-paying jobs but who lack digital literacy for work (Everyone On 2022). Digital inequities are pervasive barriers to work in communities where populations experience intersectionality because they reinforce existing inequities by contributing to localized norms where examples of society’s increased digitization are often limited to practices of consumption (i.e., communication, entertainment) rather than practices associated with ICT-based work or business practice (Ireland et al. 2018; Vargas-Solar 2022; Mobarak and Saldanha 2022). Chetty et al. (2018) elaborated on the relationship between the ecological environment and digital inequities: “those with greater capabilities can afford opportunities to gain the necessary skills to better leverage state and private sponsored investments in digital infrastructure and training.” This creates an opportunity to better understand the subjective digital identities and behaviors of economically vulnerable workers who live in areas with significant digital inequities. The research objective is twofold: First, we aim to highlight an integrated case of assessing digital inequities in the social and physical environment of a southern American city, and secondly, we aim to contribute to knowledge about multifaceted policy and programmatic avenues to holistically address personal and institutionalized environmental barriers to digital economy work. This article describes an exploratory study of digital economy identities and experiences among residents in an area of Charlotte, North Carolina (USA), with high rates of digital, social, and economic inequities. The background section broadly describes digital inequities in the U.S. and as they relate to work in the digital economy for persons of intersectional identities. Next, we provide community and policy context about the study’s geographic focal area. Results and a discussion of the description findings follow.

2. Background

2.1. Digital Inequities in the U.S.

Modern digital divides have existed in the U.S. since computers became commercially available to the general public in the 1990s (National Telecommunications and Information Administration 1995). Today these divides remain in the face of the increasing use of ICTs due to their ubiquity in U.S. society as a common resource in acquiring goods and services. Yet, only 50 percent of households earning less than USD 25,000 annually or 62 percent earning between USD 25–50,000 annually report having a home mobile and broadband internet connection compared to 80 percent earning more than USD 100,000 (National Telecommunications and Information Administration 2022a). Among racial and ethnic minorities, broadband adoption at home is also lower. Only 71 percent of Black and 65 percent of Hispanic adults report access to home broadband compared to White adults (Pew Research Center 2021). Southern states lead the nation in the lowest rates of broadband adoption at home coupled with the highest rates of mobile-only adoption, where disparities in income, education, and racial representation are more pronounced (Fishbane and Tomer 2019). Black and Latina women increasingly gained access to the internet between 2007 and 2012; however, adoption rates did not exceed 80% and remained ten percentage points below access rates for White women despite significant gains in the interim (Campos-Castillo 2015).
Regarding digital literacy, 16 percent of adults in the U.S. are not digitally literate by widely used PIAAC (Program for the International Assessment of Adult Competencies) standards, of which 53 percent hold a high school diploma only (Organisation for Economic Cooperation and Development 2013; U.S. Department of Education 2018). Doo et al. found gendered differences in problem-solving skills in a digital environment (2021). While the cost of digital devices and services is the most commonly reported barrier to adoption today (Everyone On 2022), existing research shows that digital inclusion interventions are most effective at promoting adoption when initiatives are relevant to users’ needs (Strover 2014).

2.2. Digital Economy Inequities

Low diversity rates among digital economy employers in the U.S. are widely reported. Examples from two Fortune 100 technology companies include Meta, Facebook’s parent company, where less than five percent of African Americans were employed (Meta 2022), and Intel, which reported less than four percent of its workforce as underrepresented minority women (Intel 2022). Across STEM (i.e., science, technology, engineering, and math) occupations, the percentage of women in non-Bachelor’s degree roles declined slightly (26.1 to 25.8) from 2010 to 2019, while African Americans accounted for less than 10 percent of those non-degreed roles (National Science Foundation 2022). Women and Black or Hispanic workers are disproportionately more likely to head the lowest income households (Semega 2019), where the chasm between workers’ agency to engage in digital economy work and their digital preparedness is the deepest (National Telecommunications and Information Administration 2022b; Fry et al. 2021). Digital equity provides formal and informal pathways to the digital economy workforce (Kaplan and Mossberger 2012; Chantarat and Barrett 2012; Cantor 2006) that require greater place-based workforce development solutions and anti-poverty policies that leverage ICTs.
Few studies have explored digital inequities related to work that incorporates individuals’ identities in the context of the broader social and structural environment, which plays a reflexive role in shaping behavior (Kondrat 2002). Researchers found that unemployed working-age adults in Appalachia were less likely to use the internet to look for work and that online job searching was associated with community-based cultural capital (Khan et al. 2020). In a Dutch study of internet skills and behavior across environments, van Deursen and Helsper (2018) found that self-rated satisfaction with economic outcomes was associated with respondents’ internet experience. In a systematic review of modern digital skills for work, researchers noted that most studies focused on surveys of socioeconomic or population-based predictors of digital skills in isolated use contexts where a need for research that captures workers’ creativity, critical thinking, collaboration, and communication experiences is needed (van Laar et al. 2020). Gatta (2008) called for a comprehensive workforce development policy that accounts for digital skills needs over time and in the community, while Coghill (2021) identified “growing people where they live” in a study of broadband for remote work. Understanding workers’ ICT experiences from an environmental perspective that accounts for intersectional experiences related to digital economy work allows for policy solutions that account for the institutions, relationships, and personal beliefs that collectively stand as barriers to connectors for digital economy work.

2.3. Digital Inequities, Digital Identity, and Social Capital

American workers who experience intersectional inequities often live in segregated communities (Smith 2016; Trochmann 2021). Place-based solutions to address digital inequities associated with work should address an individual’s lack of access and digital illiteracy, as well as their digital identity that collectively influences the perception of irrelevancy or detachment from the workforce pathways that lead to higher wages in the digital economy. Goode (2010) theorized technological identities as “beliefs about one’s technology skills, about opportunities and constraints to use technology, the importance of technology, and beliefs about one’s own motivation to learn more about technology.” The theoretical basis for this exploratory story is that individual and place-based digital identities shape digital economy beliefs and behavior. Moreover, the digital identities of workers in marginalized communities can be expected to exhibit traits of homophily, or social sameness, due to insulated social interactions in the face of intersectional oppression (Sonn and Fisher 1998; Lin 2000; McPherson et al. 2001; Fang et al. 2019; Chetty et al. 2022). This insulation is seen in low-income workers of intersectional identities that live in communities with high rates of digital inequities who also have lower rates of related social capital which aids in shaping their digital identities (Kuo et al. 2013; Ojokoh et al. 2014; Wang and Degol 2013). Social capital, the tangible and intangible resources attained through social relationships, is not equally distributed within communities where people of marginalized social identities and low socioeconomic status are concentrated (Lin 2000). By eliminating place-based digital inequities through a holistic approach that addresses personal and environmental ICT barriers, low-income workers will be more empowered (i.e., ready and familiarized) to chart career paths in the digital economy that lead to upward economic mobility for their families.

3. Materials and Methods
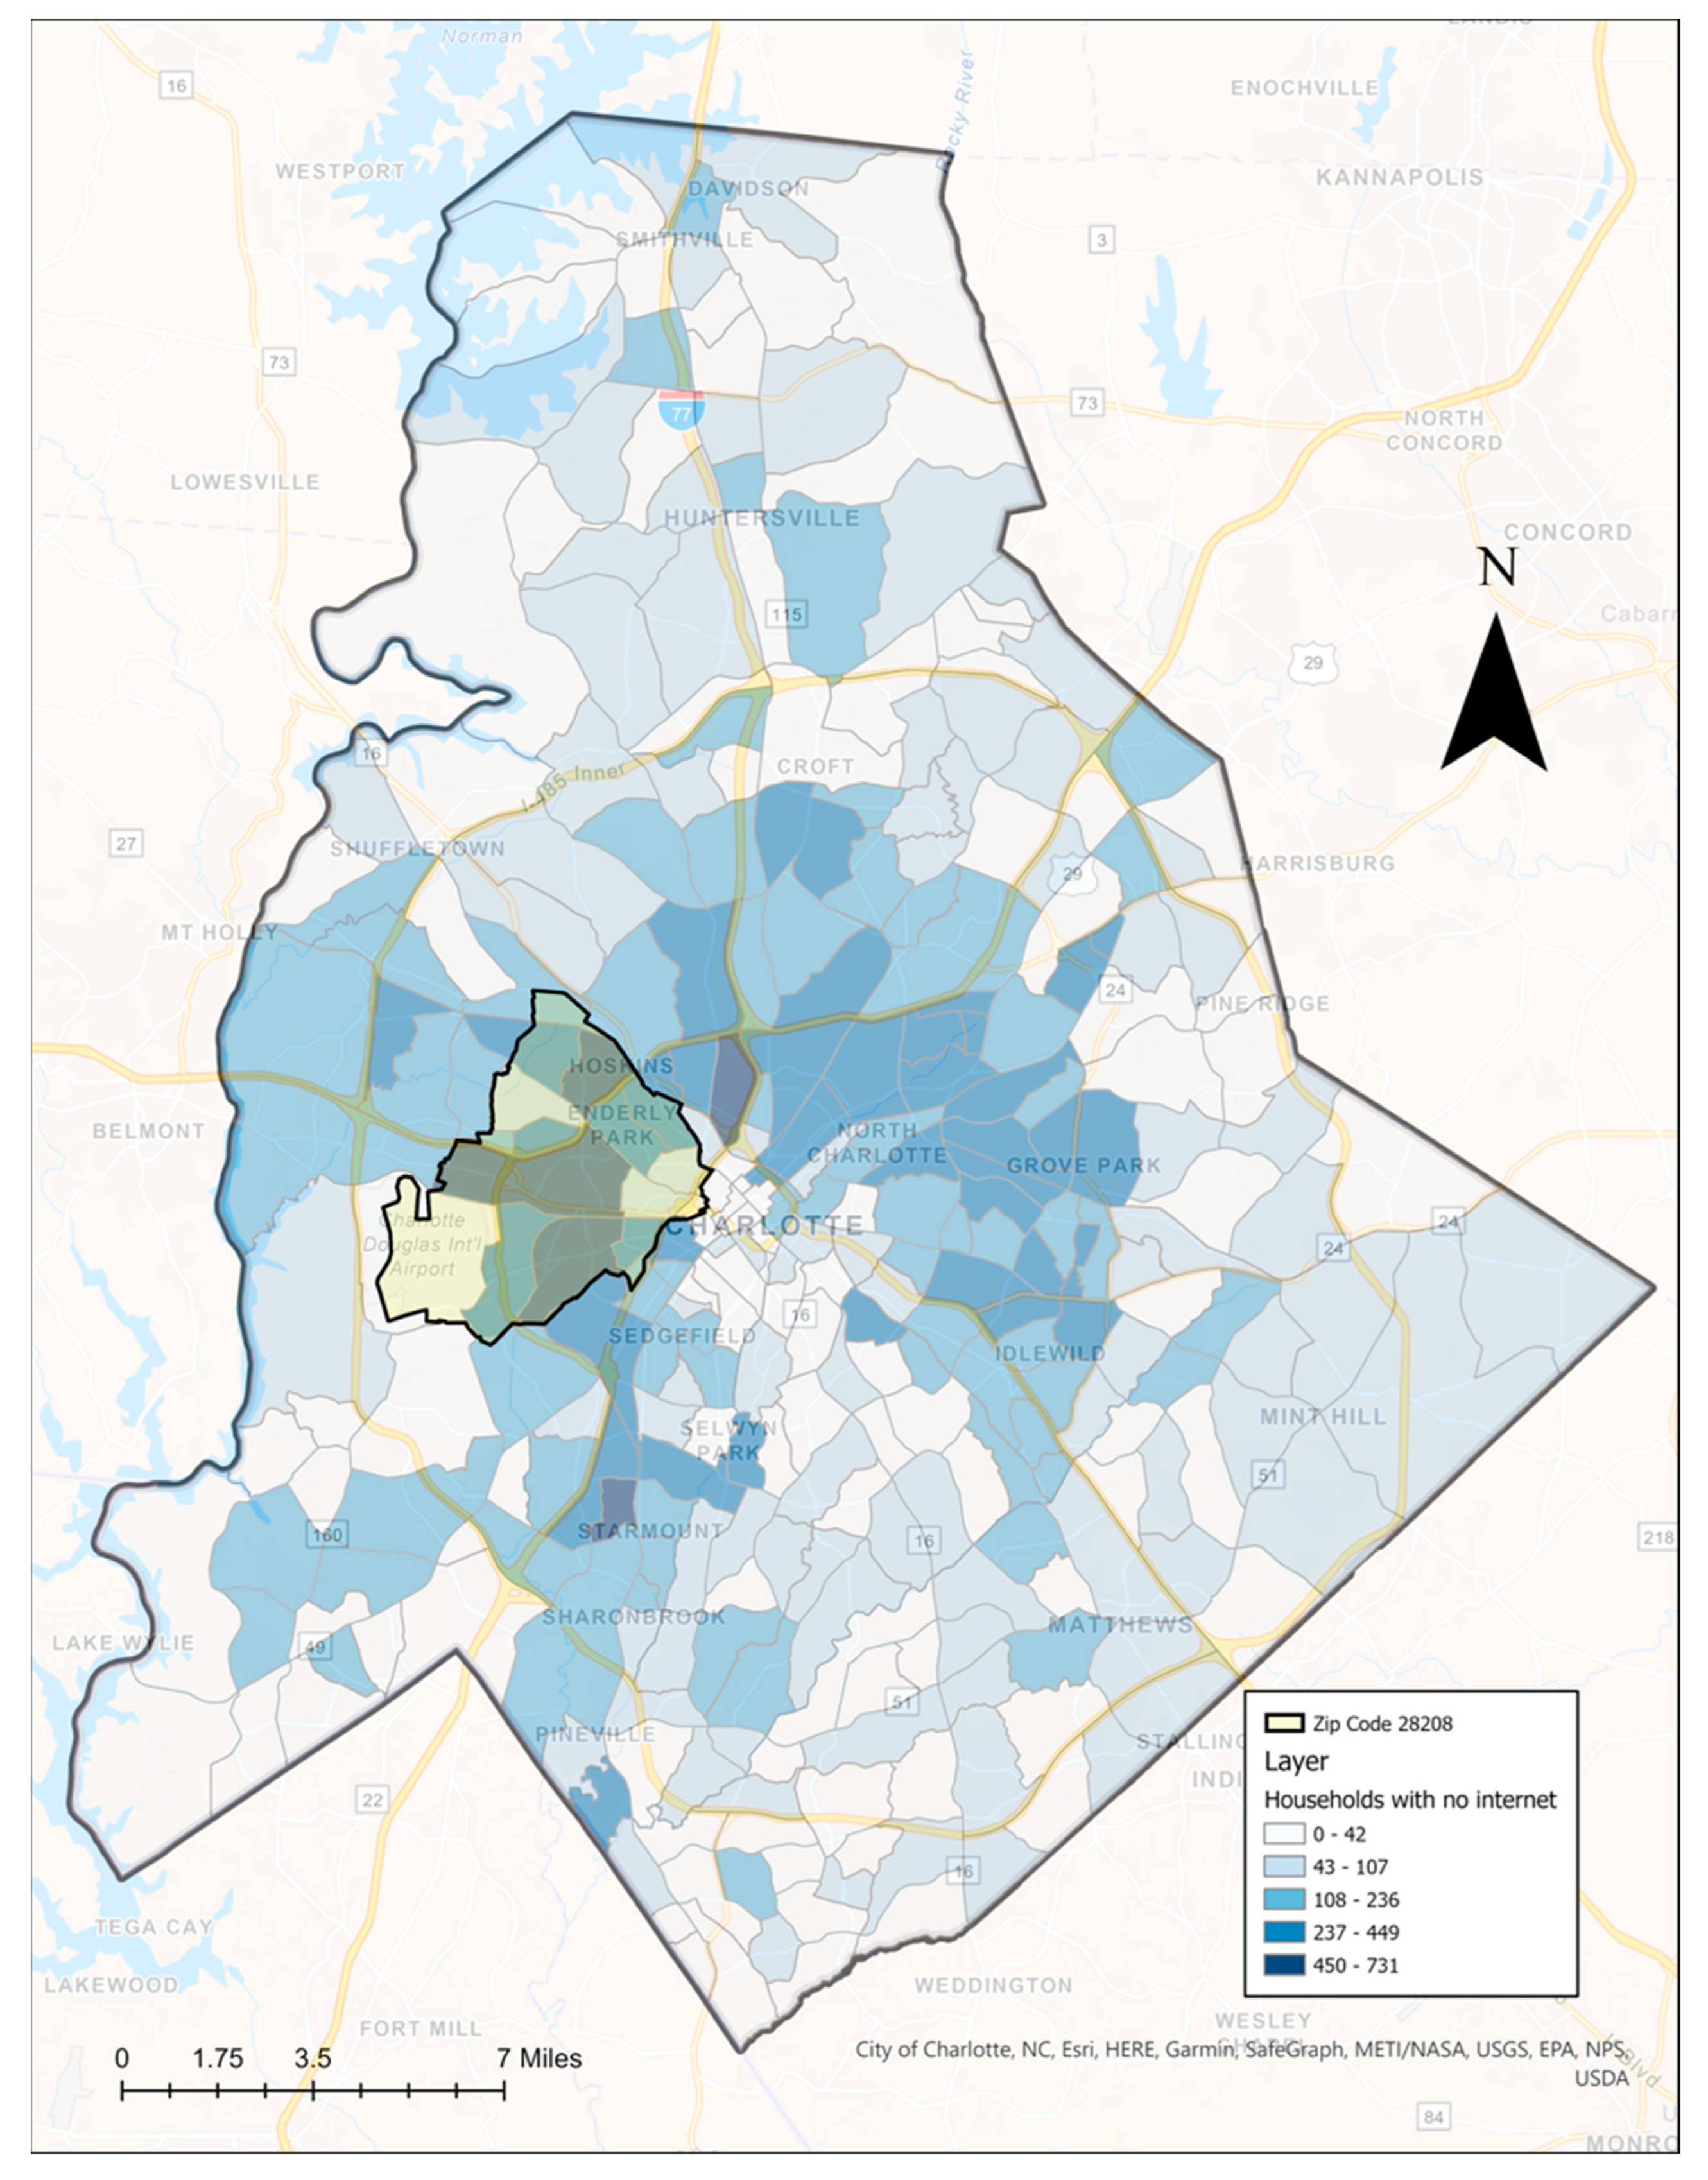
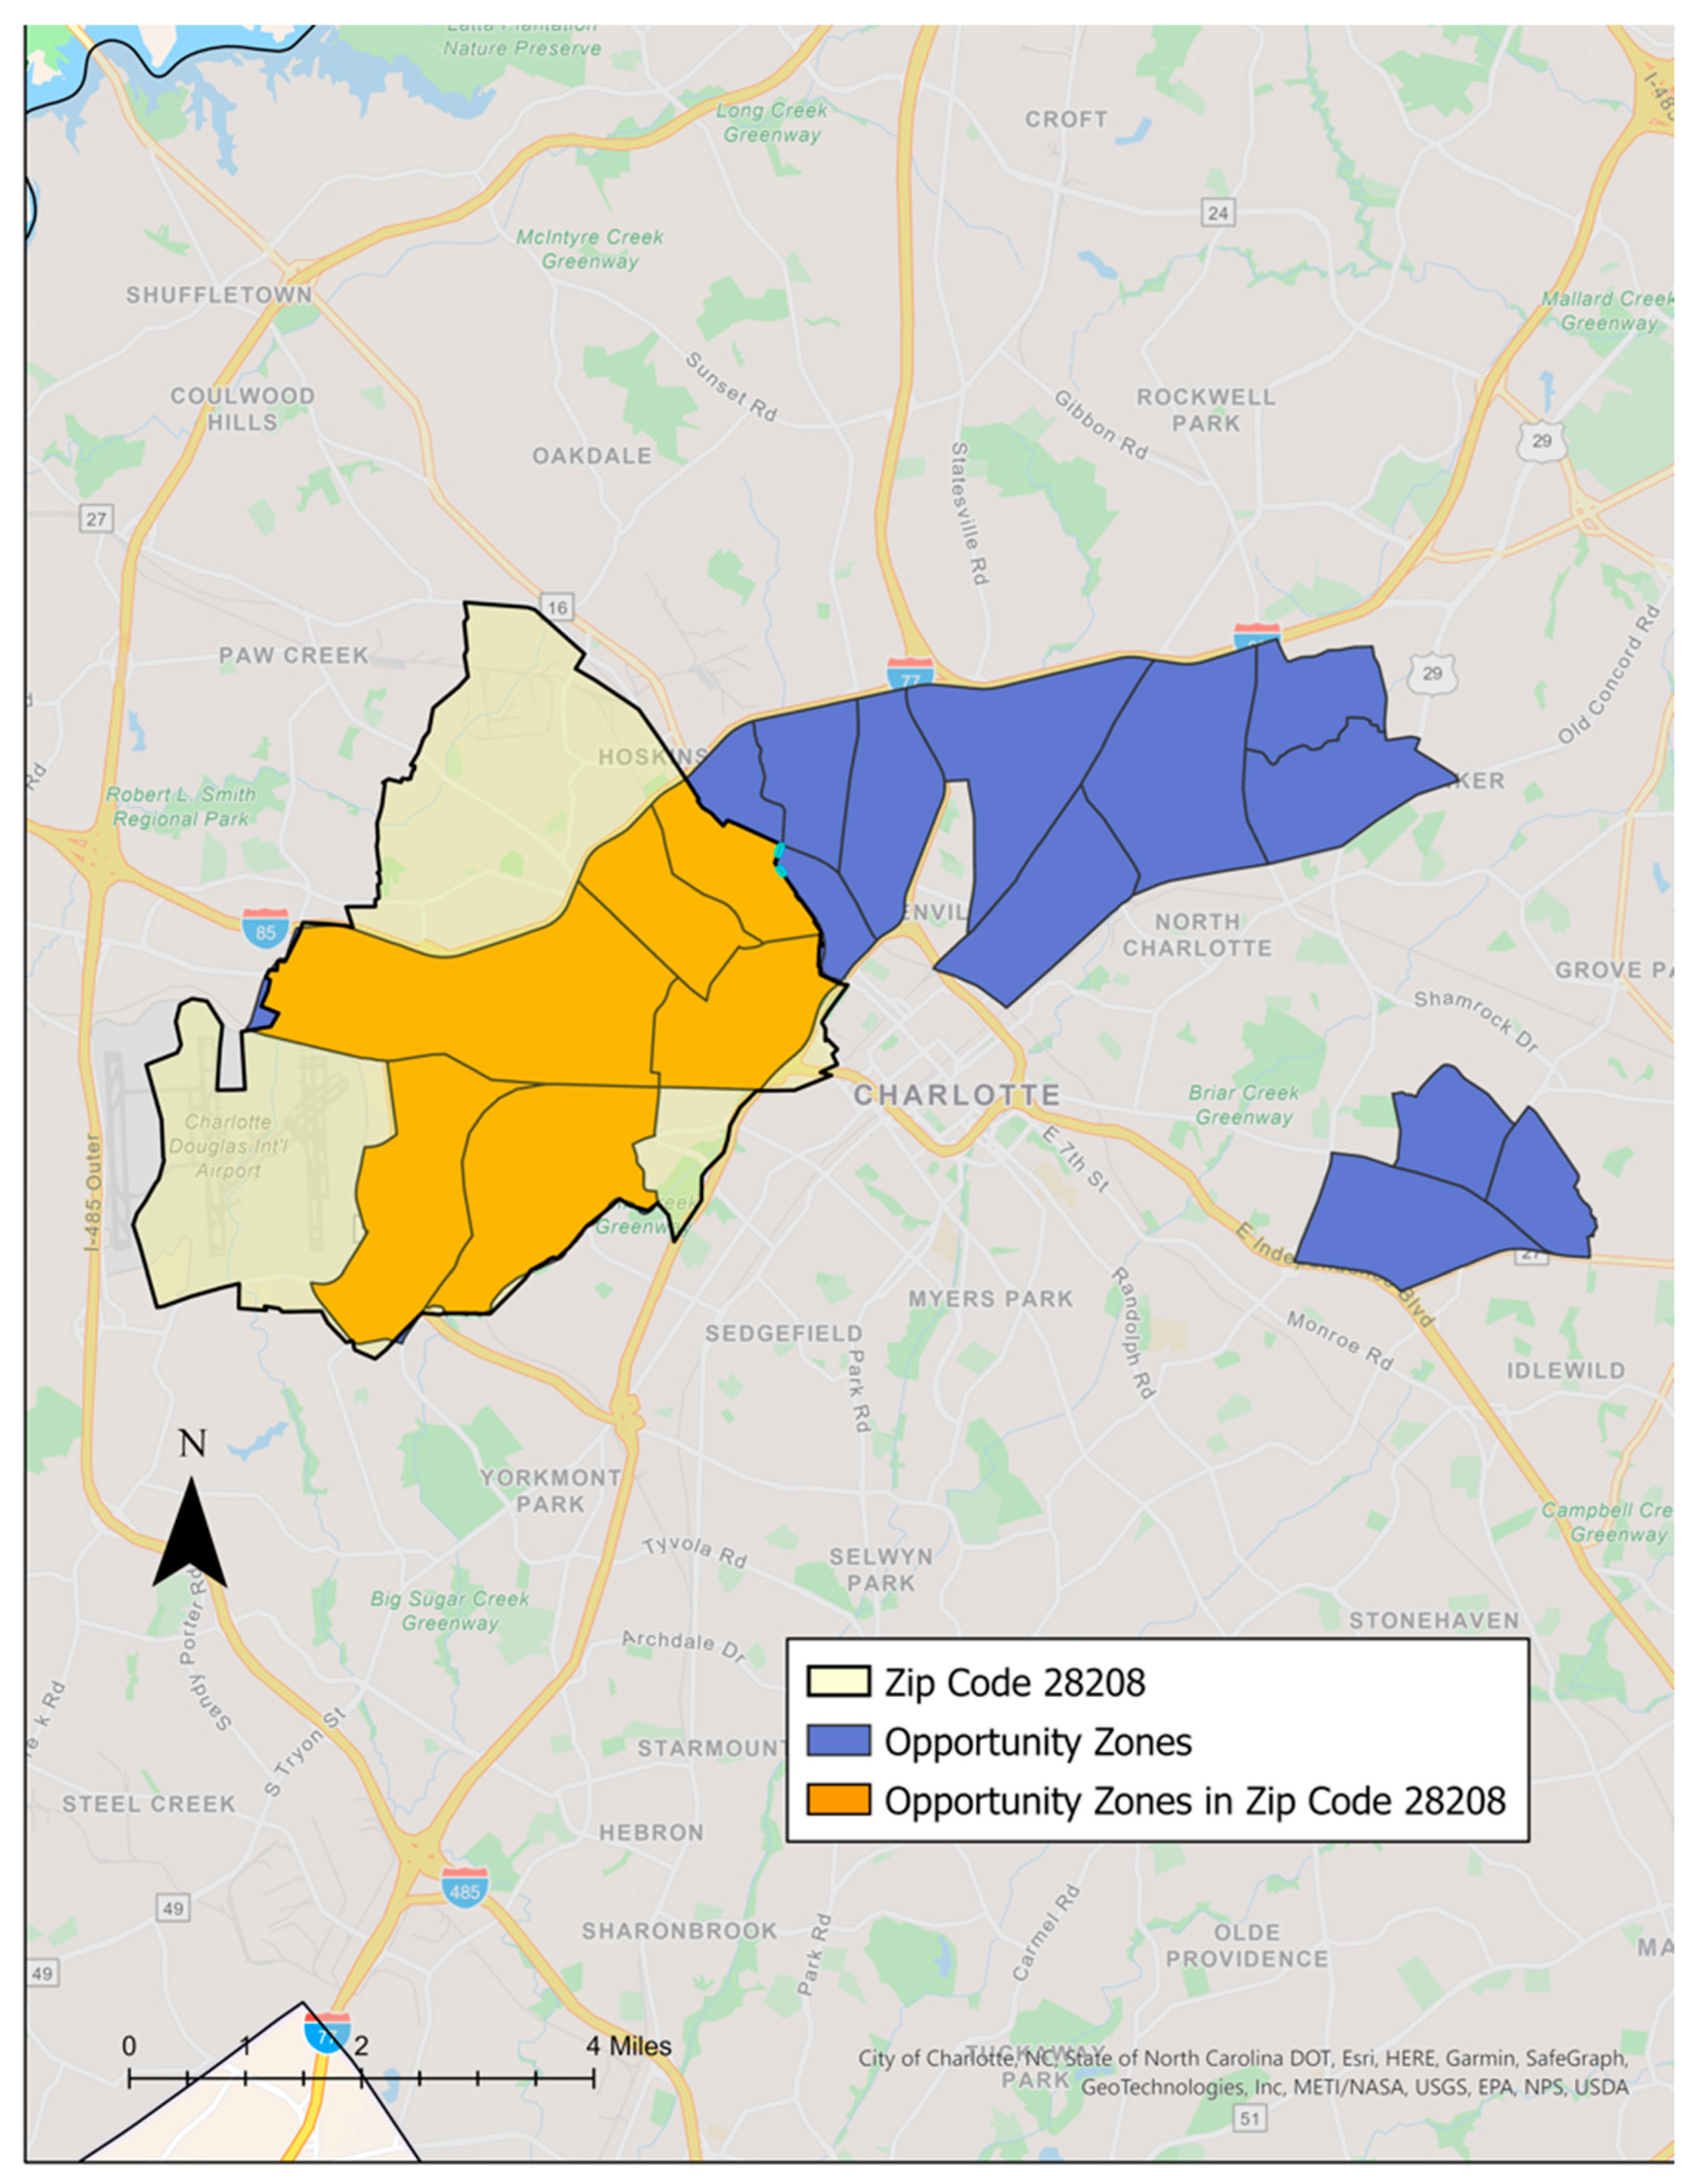
3.1. Study Setting

The following section describes some of the intersectional economic inequities in the Charlotte-Mecklenburg region and the 28208 ZIP code, which was the focal area of this pilot study within Charlotte. Charlotte, North Carolina, is a city in the southeastern U.S., an area of the country known for the highest rates of poor economic mobility and poverty in the nation while also being home to some of the most diverse segments of the American population (Chetty et al. 2014; Kurtzleben 2014). Mecklenburg County, which includes the city of Charlotte, boasts more than one million residents (U.S. Census Bureau 2020c). The median household income in Mecklenburg County is USD 69,240. Yet, for residents of this study’s focal ZIP code (28208), it is only USD 41,030, which equates to 200–250 percent of the federal poverty guidelines for a family of two to three members (U.S. Census Bureau 2020a). The ZIP code has one of the nation’s lowest rates of upward income mobility coupled with very low economic connectedness, a measure of relationships between high- and low-income earners (Opportunity Insights 2022). Income inequality is also notable at 0.47 on the Gini coefficient scale of zero to one (a high Gini coefficient is considered to be 0.50 and greater), which is greater than the average coefficient of 0.44 for ZIP codes within Mecklenburg County (U.S. Census Bureau 2020b). This means that income earnings are concentrated within segments of the population, more so within our focal ZIP code and that Charlotte-Mecklenburg embodies a tale of two regions where an abundance of residents are both economically thriving or struggling to make ends meet at the same time. One in five Black female-headed households in the 28208 ZIP code lives below the poverty line compared to less than five percent of Black married families. Due to rapidly rising housing costs, the lack of affordable housing has reached an all-time high in Charlotte, with an estimated housing shortage of 32,000 units needed (City of Charlotte n.d.). Families who rent their homes represent nearly 70 percent of Mecklenburg County households living in poverty (U.S. Census Bureau 2020f). Income and homeownership are a large part of Charlotte’s upward mobility challenge, where children from low-income households are more likely to remain in poverty as adults. Empowering workers to enter digital economy careers that pay higher wages is an interim tool to help alleviate the long-term affordable housing challenge associated with residents whose incomes can no longer afford to live in communities that are rapidly developing economically (Auerbach et al. 2020).
As a hub of the U.S. financial sector and one of the fastest-growing regions in the nation (Dowah 2021), particularly for information and communication technology (ICT) jobs (Martin 2020), the Charlotte area is well-positioned to leverage the digital economy for workforce development that supports residents’ upward income mobility. Yet, Black and Hispanic workers are significantly underrepresented in digital economy professions (Muro et al. 2018; Funk and Parker 2018). A local initiative to increase middle-skill DE workers through fiber optic installation certification yielded an 84 percent program graduation rate, affirming the demand for these career pathways in Charlotte (Urban League of the Central Carolinas n.d.). Patterns of disinvestment and neighborhood segregation can characterize many Charlotte communities marred by high poverty rates and high rates of residents’ from racial and ethnic minority identities (Smith 2016). Once economic and social well-being metrics were mapped at the county level, Charlotte resembled a “crescent and wedge” pattern (Portillo 2019) concerning which areas fared the best. The wedge of predominately White and wealthy households cuts through the southern portion of the county, flanked by suburban and urban crescent communities where residents earn less and more often identify as Black or Hispanic. Digital inequities often represent one layer of social and economic deprivation for lower-income residents in crescent communities. Figure 1 shows that digital inequities, with respect to a lack of internet access at home, also exhibits a crescent and wedge pattern in the county.
Several policies have been introduced over the years to incentivize localized economic development and to promote upward economic mobility in the Charlotte region. One such place-based approach in low- and moderate-income urban communities are enterprise zones. Investors are encouraged to help spur economic growth through capital investments in pre-identified enterprise zones. The benefit to investors is a reduction in capital gains taxes over the lifetime of the investment if the criteria specified in the policy are met. Opportunity Zones (OZs) are a type of enterprise zone enacted as part of the Tax Cuts and Jobs Act of 2017. The use of OZs as a vehicle for significant broadband deployment in urban communities was touted (Economic Development Administration 2020), given the significant cost associated with digital equity projects that aim to develop ICT infrastructure or support digital device distribution in the form of laptop or desktop computers. Several examples of OZ investments to address digital inequities have been noted (Connectivity Fund 2022; Business Wire 2021). However, the practice of OZ investment for digital equity is not widespread (Sorenson Impact Center 2021). Additionally, despite the prolonged use of these policies, they have not been found to improve the economic positioning of residents. Instead, residents are often displaced from these communities or live in areas that no longer reflect the culture and values they were known for (Morris 2019; Freedman et al. 2021; Gelfond 2019). The focal area of this exploratory study, the 28208 ZIP code of Charlotte, was specifically chosen because (a) the area includes the most OZs of any ZIP code in the city of Charlotte (Figure 2), (b) for its historic African American population that has struggled to remain rooted in the community in light of rising housing costs that outpace workers incomes, and (c) due to high rates of a lack of broadband at home (Presswood 2021).

3.2. Study Design

The purpose of this study was to understand the digital economy identities and experiences of residents in an area of Charlotte with known digital inequities that has also been targeted for economic growth, notably as OZs. To fill previously noted gaps in the literature about intersectional digital divides that appear in communities (Ireland et al. 2018; Fang et al. 2019; Tsatsou 2021; Bastick and Mallet-Garcia 2022; Newman et al. 2017), four research questions were posed in this study:
  • Is there a relationship between residents’ home broadband access and their digital behavior or digital identity?
  • Is there a relationship between residents’ gender and race and their digital identity or digital economy values?
  • Is community embeddedness (i.e., length of residency and/or home ownership status) associated with residents’ digital behavior, digital identity, or their digital economy participation?
  • Is there a relationship between residents’ digital economy social capital and their digital economy participation or digital economy skills interest?
To explore these questions, the Digital Economy Experiences, Knowledge, and Attitudes (DEEKA) survey tool was developed based on several reliable surveys (Vitak et al. 2011; Putman et al. 2015; Feuls et al. 2016). Table 1 provides a description of the domains in the survey. For digital economy social capital, respondents were asked a position generator question (e.g., web developer, influencer, software engineer) and questions regarding their awareness of a diverse group of 16 well-known technologists in the U.S.

3.3. Sample and Recruitment

The target study population was working age (18–64 years of age) residents of West Charlotte who live in the 28208 ZIP code (Figure 1). Thirty-seven percent of households in this ZIP code do not have access to the internet at home or only have access through a cell phone data subscription compared to approximately 19 percent of all Mecklenburg County households (U.S. Census Bureau 2020d). We aimed to recruit one qualified respondent per household with a target response rate of 400 surveys or 1.5 percent of all qualified residents. The initial recruitment method was door-to-door outreach with investigator-assisted survey completion via tablets, however, this approach was abandoned due to social distancing restrictions at the height of the COVID-19 pandemic in 2020. An alternative recruitment approach was employed of postcard invitation mailings to 4513 households using the United States Postal Services’ Every Door Direct Mail and ZIP code targeted social media advertising via Facebook and Instagram which reached a reported 3729 users. Respondents were directed to a smartphone-friendly online survey accessible via a short link or QR code. Despite these efforts, survey responses were very limited to 53 participants during the pandemic. As such, the analysis plan shifted from tool validation to offering descriptive and bivariate analysis for the small sample that consisted of mostly Black women. Subsequent data collection will pair resident surveys with qualitative interviews for in-depth responses regarding digital economy experiences and values.

3.4. Data Collection

A secure online survey data collection platform, Qualtrics, was used to provide informed consent and to administer the survey. Respondents were offered USD 5 compensation in the form of either a Food Lion or Walmart gift card for completing the approximately 15-min survey. All survey questions were presented in English. Most question domains were measured on 5 to 6-point ordinal Likert scales. Scaled questions were subsequently transformed to binary variables that excluded neutral responses due to the small sample size and limited variance across scaled responses. Exceptions to Likert scale questioning included respondent background questions, social capital measures, and the broadband speed test, which required respondents to read a short description about how to complete the open-source M-Lab test, which was linked to open in a new browser tab (M-Lab n.d.). After obtaining the speed test results, respondents were asked to enter their respective download and upload speeds in an open-ended field on the Qualtrics survey. The study was reviewed and approved by the University of North Carolina at Charlotte’s Institutional Review Board (IRB); 19-0408. The validity of the survey tool was evaluated by the study’s community advisory group, consisting of three advocates from North Carolina’s digital equity ecosystem with experience working in diverse urban communities. The estimated time required for survey completion was assessed by delivering the survey to five test subjects whose race and income matched U.S. Census estimates for residents in the 28208 ZIP code.

3.5. Analytic Approach

Due to the limited sample size (n = 53), quantitative reliability tests were not performed during the first phase of this survey tool’s use in the community. All ordinal Likert scale question responses were recoded as affirmative or negative dichotomous variables due to unequal groups in the small sample responses. Descriptive statistics and bivariate analyses were performed to offer preliminary assessments of the research questions in this exploratory study of West Charlotte.

4. Results

Respondents’ ages ranged from 24–64 years of age (M = 41.98) and were majority female (M = 77.36) and Black (M = 66.04). Black women represented approximately 60 percent of the sample. The rate of female sex reported exceeded U.S. Census data for the 28208 ZIP code at 53% for females and between the ages of 18–64 years of age; however, rates of Black respondents were similar to U.S. Census findings of 68.22% (U.S. Census Bureau 2020e). Approximately 55% of respondents reported annual household earnings of less than USD 40,000 compared to the U.S. Census median income of USD 41,030 (2020a). Sixty percent of respondents lived in the 28208 ZIP code for four years or less, and 54.72% of respondents owned the home they lived in, which was higher than the 38.9% reported by the U.S. Census Bureau (2020f). Most respondents worked full-time (M = 52.83) and drove alone to work (M = 56.25). Table 2 and Table 3 capture additional demographic and workforce participation information about the sample.
Survey respondents reported higher adoption rates of broadband at home (i.e., cable, fiber, DSL) at 75% compared to the 60% reported by the U.S. Census Bureau for the 28208 ZIP code (U.S. Census Bureau 2020d). Respondents who did not report a broadband connection at home accessed the internet via a cell phone or hotspot connection. The average, self-tested download speed was 98.80 megabits per second (Mb/s) and the average upload speed was 47.72 Mb/s. While these speeds exceeded the recommended broadband minimum threshold: 25 Mb/s download and 3 Mb/s upload speeds (Federal Communications Commission 2020), they were lower than the 172.3 Mb/s average download and 87.8 Mb/s average upload speed reported for Mecklenburg County reported by the Digital Divide Index (Gallardo 2022). Furthermore, the median download and upload speeds were, respectively lower at 48.47 Mb/s and 11.38 Mb/s which points to several outliers in the self-reported speed test data. Additionally, the device type and the internet connection method will affect broadband speed test outcomes and were not captured in this study (Reardon 2019).

4.1. The Relationships between Residents’ Home Broadband Access and Their Digital Behavior or Digital Identity

The frequency of residents’ digital behavior was coded into binary variables of frequent (daily, several times a week, once a week) and infrequent (several times a month, once a month, rarely, never) use. Frequent use among respondents varied by the type of digital behavior: communicate online (88.68%), bank online or make a purchase (79.25%), game online (49.06%), and locate health information online (47.17%). A chi-square test of independence revealed a significant relationship between the frequency of banking or purchasing online and residents whose primary internet connection, X2 (1, N = 53) = 3.28, p = 0.07. No other significant relationship between the type of internet connection and digital behavior was detected. Thirty-seven percent of residents typed 40 or more words per minute (wpm), while 33% of respondents estimated their typing speed at 20–40 wpm. Only three residents reported typing less than 20 wpm, and twelve respondents did not respond to this question in the survey. No significant relationship was identified between respondents’ internet access type and typing speed. A non-parametric two-tailed equality of mean test for unequal groups (Welch 1947) was performed to determine if there were statistically significant differences in respondents’ internet speeds and their digital behavior or digital identity. There was a statistically significant difference in the download speeds for frequent (M= 118.56, SD = 122.03) and infrequent (M = 17.29, SD = 16.40) internet users for respondents who banked or made purchases online; (t (36) = −4.60, p = 0.026). Similarly, there was a statistically significant difference in the upload speeds between frequent (M = 57.76) and infrequent (M = 9.79) internet users and for respondents who banked or made purchases; (t(33.7) = −2.54, p = 0.016). A significant difference was also captured between the upload and download speeds of frequent communication online and is captured in Table 4. Table 5 highlights residents varied digital identities.
Digital identity variables were measured using Likert scale categorical variables, and findings are captured in Table 5. Most respondents reported that they were very confident in their ability to use a computer (81.13%) and their ability to use the internet (88.68%); however, fewer respondents identified as being very confident in their abilities when asked about learning new technology (64.15%) or troubleshooting internet problems (43.40%). Only 45.28% of respondents strongly agreed, respectively, that they knew how to protect their data on the internet or knew how to identify trustworthy information on the internet. Approximately 60 percent of respondents reported their Microsoft Word skills as extremely well and rates varied for all other forms of software. In descending order, respondents reported being the least skilled (i.e., moderately well, slightly well, not well at all, never used software) at using the following software: Google Sheets, Google Slides, Microsoft Excel, Microsoft PowerPoint, and Google Docs. Due to limited variability, digital identity variables were recoded to binary variables of positive (i.e., extremely well and very well or strongly agree and somewhat agree) or negative (i.e., strongly agree and somewhat agree or strongly disagree or somewhat disagree) response options with any neutral responses not included in crosstabs or tests of significance. No significant relationships were identified between residents’ internet access (i.e., type or connection speeds) and their digital identities.

4.2. The Relationships between Residents’ Gender, Race, and Their Digital Identity or Digital Economy Values

Four digital economy value questions were presented on a five-point Likert scale ranging from strongly agree to strongly disagree. Most respondents strongly agreed that the internet is important to obtain information (86.79%) and that computers are important to function in the world (71.70%). While 75.47% of respondents strongly agreed that learning how to use technology was worth the effort, only 41.51% strongly agreed that people who are good at using the internet are paid more than those who do not. The latter question offered the most variable responses among the digital economy value questions. An additional 26.42% of respondents reported that they somewhat agreed, and another 22.64% of respondents neither agreed nor disagreed. The remaining nine percent of respondents either somewhat or strongly disagreed. Chi-squared and Fisher’s exact testing revealed no significant relationships between the dichotomized digital economy value variables and residents’ race (i.e., Black or non-Black) or gender. It is important to note that 73% of respondents who strongly agreed to this question earned less than USD 40,000 annually compared to 60% of respondents who somewhat agreed or remained neutral and earned more than USD 50,000 annually. The categorical income question was omitted from additional analysis due to significant missing responses (N = 32) to the optional question.

4.3. The Relationships between Residents’ Community Embeddedness and Their Digital Behavior, Identity, and Digital Participation

Community embeddedness was assessed using dichotomous variables for homeownership and length of residency (i.e., less than five years or more than five years). An interaction term for these two variables was also created. Only 18.87% of the sample owned their home and reported being a resident of the 28208 ZIP code for more than five years. Three significant relationships were found among the 22 variables assessed to answer this research question. A chi-square test of independence performed on the dichotomous variables for homeownership and frequency of online gaming behavior was found to be significant, X2 (1, N =53) = 4.34, p = 0.037. Similarly, a significant relationship was found between homeownership and the dichotomous variable of knowing how to protect oneself online, X2 (1, N = 51) = 6.08, p = 0.014. Lastly, a two-sided Fisher’s exact test revealed a significant relationship between homeownership and the belief that a lack of computer skills affected the respondent’s chances of being hired for a job, p = 0.031.

4.4. The Relationships between Residents’ Digital Economy Social Capital and Their Digital Economy Participation and Related Skills Interest

Digital economy social capital was assessed in three measures; social relationships that were sought out for job information, respondents’ knowledge of a diverse group of leaders in the digital economy, and knowledge of people working in eight non-degreed digital economy careers, which is also referred to a position generator question. Findings are reported in Table 6. Responses were mixed as to who was sought out for information about job opportunities: work or school acquaintances (24.53%) or no one (26.42%) were the most prominent social relationships noted. Respondents completed a matrix question regarding their familiarity with 16 well-known leaders in the digital economy. Nine leaders were Black, Indigenous, or another person of color (BIPOC), and seven were non-BIPOC. On average, respondents reported being familiar with 3.32 leaders out of 16. The most well-known leaders included Elon Musk (75.47%), Jeff Bezos (66.04%), and Jack Dorsey (35.85%). The most well-known BIPOC leader was Kimberly Bryant (26.42%), the founder of Black Girls Code. Despite three out of five respondents identifying as Black females, the average knowledge of non-BIPOC leaders (M = 2.17) was greater than that of BIPOC leaders (M = 1.15).
Next, respondents were asked about their knowledge of Charlotte workers in eight non-degreed digital economy positions and their interest in learning six skills sought by employers in the digital economy. Respondents most often knew someone (i.e., acquaintance, co-worker, close friend, family member, self, or no one) who worked as a computer user support specialist (43.40%), and least often knew someone who worked as a user experience designer (13.21%). Additional descriptive statistics are reported in Table 6. In order of preference, respondents were interested in gaining skills in problem-solving (62.79%), organization (55.81%), communication or writing (51.16%), detail-orientation (39.53%), teamwork (32.56%), and customer service (32.56%). Independent sample t-tests were performed comparing respondents’ mean knowledge of digital economy leaders and previously dichotomized variables on digital economy participation and interest in learning one of the above-mentioned digital economy skills sought by employers. No significant relationships were found between the social capital measures and respondents’ digital economy participation. Continuous variables for skills interests and knowledge of digital economy leaders were created to conduct two-tailed t-tests for unequal groups. The aim was to uncover any statistically significant differences in the number of skill areas that respondents were interested in receiving training and respondents’ knowledge of workers in six digital economy careers. There was a statistically significant difference in the number of skills interests for respondents who knew someone who worked as a fiber optic technician (M = 2.89, SD = 1.87) or did not know someone in that field (M = 1.83, SD = 0.75); (t (17.54) = 2.44, p = 0.026). No other relationships among the social capital variables were statistically significant.
Despite limited generalizability, results from the study provide new insights into the digital economy experiences of marginalized populations most proximal to the effects of ongoing economic development in areas with rising digital economy sectors. Moreover, the DEEKA survey tool captured the connection between access to high-speed internet service and domain-level internet usage, including significant associations between internet speed and frequency of internet use for financial purposes and communication. Implications and future directions will be discussed next.

5. Discussion

The diversification of the digital economy, fueled by the growth of internet-enabled technology, presents modern opportunities for careers that pay wages closer to middle-skill standards for non-degreed workers and requires less digital literacy workforce training. Despite limitations, this pilot study furthers efforts to promote digital equity by capturing these experiences among an intersectionally marginalized population largely excluded from the rapidly developing digital economy workforce. Despite limited generalizability, results from the study provide new insights into the digital economy experiences of marginalized populations most proximal to the effects of ongoing economic development in areas with rising digital economy sectors.

5.1. Survey Tool Use

First, the DEEKA survey is a promising tool in its ability to detect significant relationships between residents’ digital identity, skills, and behavior and their proximity to higher-wage careers in the digital economy. This study’s sample of West Charlotte residents in an area with lower rates of broadband adoption at home share characteristics with neighboring ‘crescent’ areas in the county (see Figure 1) where future piloting can be completed to further test the tool for validity and reliability. Furthermore, our finding that less than 1 in 5 respondents who owned a home had lived in the area for more than five years also aligns which existing reports that the community is undergoing population change (Harper 2022). A need exists to urgently support the lowest income earners who may soon be displaced. Next, we discuss findings related to identity, access, and behavior.

5.2. Digital Access, Identity, and Behavior

Despite respondents’ overwhelming confidence in their ability to use the computer and internet, we found similar reports in the existing literature that discrepancies exist between perceived digital skills and privacy behavior (Hargittai and Litt 2013; Barth and de Jong 2017). Digital security and privacy skills should be at the forefront of digital skills training in Charlotte for future participation or employment in the financial sector given that the region is the second-largest banking center in the U.S. (Charlotte Regional Business Alliance 2021) and will likely be at the forefront of digital economy careers in this sector. We also found that improving access to fast internet (i.e., broadband) may reduce barriers to the use of digital technologies whereas residents with faster connections used financial services and communicated online significantly more often than residents with slower connections. Access to broadband and digital literacy serves as the foundation for future pathways to digital economy work. In terms of digital economy values, our study revealed a key relationship for future exploration. Residents who earned below the median income for the 28208 ZIP code more often agreed that people who are digital skilled are paid more, while other higher earning respondents less frequently agreed with the statement. This relationship points to the previously reported low rate of economic connectedness in this area which deserves exploration in future studies (Opportunity Insights 2022).

5.3. Digital Economy Social Capital and Future Digital Skills Training

Findings also reveal racial and gender disparities in digital economy social capital, with respondents knowing more non-BIPOC or male leaders than BIPOC or women leaders (see Table 6). Moreover, few respondents’ social networks included some of the most common digital economy positions, showcasing a lack of awareness of the digital economy and non-degreed pathways to this sector. As Charlotte expands technological innovation and broadband access, inadequate digital economy knowledge and limited social capital related to the digital economy workforce may exacerbate disparities in West Charlotte or other crescent communities. Instead of accelerating the displacement of longstanding West Charlotte residents through policies such as OZs that ignore social capital, the recently passed Infrastructure Investment and Jobs Act has the potential to redirect equitable opportunities to some of the most marginalized communities through digital literacy interventions that also account for environmental and structural barriers that bar all communities from participating in the growth of the digital economy sector in Charlotte. For instance, digital skills training that includes substantial networking, shadowing, or apprenticeship opportunities for participants to build community with neighbors and local leaders. Or, local policies that do not silo initiatives across economic development, upward mobility, affordable housing, diversity equity and inclusion (DEI), or workforce development. Policies that encourage overlapping agendas will be better positioned to meet the needs of residents with intersectional identities who experience digital inequities that stifle opportunities for work and a better life.
A limited proportion of respondents indicated knowledge of someone in their Charlotte social network who worked in a non-degreed digital economy occupation, particularly as digital storytellers, fiber installation technicians, and user experience (UX) designers (see Table 6). This suggests that residents in economically marginalized communities may not pursue digital literacy for workforce opportunities or digital economy careers because of a lack of awareness of positions in the DE workforce, which can provide greater flexibility in the space and time of their work, alleviating common challenges associated with the cost of transportation or childcare services for low-income workers. This study also extends existing findings that social capital influences digital economy work (Gandini 2016) by introducing the concept that digital economy social capital in specific careers (i.e., fiber optic installation) influences the digital economy skills desired by respondents. Moreover, digital economy careers may offer long-term higher wages needed to afford housing in a rapidly redeveloping West Charlotte corridor where the need for affordable housing continues to outpace related development. Participation in the digital economy workforce afforded economic stability and protection against the effects of the pandemic on unemployment, which were relegated to economically and racially segregated residents in Charlotte. The current study underscores missed opportunities to improve economic mobility in the sample population and the importance of utilizing policy opportunities to promote equitable access to digital economy work.
Respondents’ limited digital skill levels in several forms of software are consistent with evidence that racial segregation and concentrated poverty predict technology access and digital skills (Reder 2015). Additionally, respondents in this sample recognized the importance of technology for daily functioning and success in the workforce. Local Charlotte leaders should therefore consider opportunities to maximize the impact of forthcoming digital equity federal funding through strategic investments across workforce development and digital equity programming in economically marginalized communities. Investments in technology within these communities should include efforts to improve residents’ digital literacy to prevent exacerbating extant education and opportunity disparities for those with minimal digital skills.
Place-based initiatives, defined as comprehensive efforts to strengthen a neighborhood’s material, economic, social, and structural conditions (Liu and Berube 2015; Rood and McGroder 2017), are uniquely positioned to enact potential digital equity efforts. Several place-based initiatives have been launched or expanded in Charlotte (Charlotte Opportunity Initiative 2020), many of which are located in OZs. Supporting existing initiatives through funds dispersed from the Infrastructure and Jobs Act may allow for efficient implementation of programs that respond to the needs expressed by respondents in this study. Digital equity strategies intended to address persistent workforce and mobility barriers experienced by residents in areas with known digital divides must supplement broadband deployment and essential digital device/software training efforts. Instruction should target evolving data privacy and security skills and provide industry-specific information about the digital economy to support social capital advancements in this population. With strengthened social capital, which has served as a social capital ‘multiplier’ in some racial and ethnic minority communities (Crul et al. 2017), residents can take their newly acquired knowledge to engage in digital economy workforce networks in Charlotte and beyond.

5.4. Limitations

Limitations of the study included the small sample size and modest incentive at the height of the first wave of the COVID-19 pandemic in the U.S. Within the context of the COVID-19 pandemic and high unemployment, the USD 5 incentive likely hindered participation. Moreover, the small sample size and limited response variability severely limited our ability to perform tests of reliability or more advanced statistical analyses at this phase. As a result, the results are informative for future studies but cannot be generalized to the population of this Charlotte ZIP code and additional tests of the survey tool are warranted. Additionally, the change in data collection method from a door-to-door interviewer-assisted survey to a web-based survey (albeit smartphone accessible) may have limited responses from residents with limited digital skills.

6. Conclusions

Our study describes a survey tool used to explore digital inequities that are believed to limit work in the digital economy among residents in an area of the American south with high rates of overlapping intersectional identities. We find a need for additional research to explore workforce and economic development strategies that are anchored to digital equity frameworks that promote middle-skill digital economy careers. These careers can improve dismal rates of upward mobility in Charlotte while also alleviating some of the burden to create affordable solutions in areas that undergoing significant economic development and resident upheaval. This research should explore the collective impact of broadband access, basic digital skills including privacy and security, complementary skills to the digital economy such as problem-solving and organization, and social immersion in the local digital economy ecosystem. Furthermore, qualitative studies of digital economy participation among intersectional communities can aid in validating emergent survey tools that aim to identify increasingly nuanced experiences of social and structural barriers to careers in the digital economy. Future findings from validated digital economy survey tools will provide timely information to community stakeholders in Charlotte who are engaged in place-based initiatives to address overlapping social, economic, and digital inequities. Access to digital technologies and digital literacy are the backbone of this exploratory process so marginalized groups can enhance their digital identities through skills, knowledge, and community-building.

Author Contributions

Conceptualization, T.C.; methodology, T.C.; formal analysis, T.C.; investigation, T.C.; data curation, T.C., H.C. and C.W.; writing—original draft preparation, T.C., H.C. and C.W.; writing—review and editing, T.C. and M.J.; visualization, C.P.; project administration, A.P. and R.I. All authors have read and agreed to the published version of the manuscript.

Funding

This research was funded by the University of North Carolina at Charlotte Urban Institute’s Faculty Fellows program.

Institutional Review Board Statement

The study was reviewed and approved by the University of North Carolina at Charlotte’s Institutional Review Board (IRB); 19-0408.

Informed Consent Statement

Informed consent was obtained from all subjects involved in the study.

Acknowledgments

The authors would like to acknowledge the following DEEKA Community Advisory Board members for their support of this research: Cache Owens, Gwenn Weaver, and Jerrod Jones. The authors would also like to acknowledge supporters of the manuscript process: The University of North Carolina at Charlotte Office of Undergraduate Research, Alicia Dahl, and Jessamyn Bowling in the Department of Public Health Sciences.

Conflicts of Interest

The authors declare no conflict of interest.

References

  1. Arias, Juan Diego Mazuera. 2021. Digitalization and the Latino workforce. Harvard Journal of Hispanic Policy 33: 69–78. [Google Scholar]
  2. Auerbach, Jeremy, Chirstopher Blackburn, Hayley Barton, Amanda Meng, and Ellen Zegura. 2020. Coupling data science with community crowdsourcing for urban renewal policy analysis: An evaluation of Atlanta’s Anti-Displacement Tax Fund. Environment and Planning B: Urban Analytics and City Science 47: 1081–97. [Google Scholar] [CrossRef]
  3. Barth, Susanne, and Menno D. T. de Jong. 2017. The privacy paradox—Investigating discrepancies between expressed privacy concerns and actual online behavior—A systematic literature review. Telematics and Informatics 34: 1038–58. [Google Scholar] [CrossRef]
  4. Barton, Jordana. 2018. Preparing workers for the expanding digital economy. In Investing in America’s Workforce. Edited by Stuart Andreason, Todd Greene, Heath Prince and Carl E. Van Horn. Atlanta: Federal Reserve Bank of Atlanta, pp. 251–66. Available online: https://www.investinwork.org/-/media/Project/Atlanta/IAW/Files/volume-three/Preparing-Workers-for-the-Expanding-Digital-Economy.pdf (accessed on 27 October 2021).
  5. Bastick, Zach, and Marie Mallet-Garcia. 2022. Double lockdown: The effects of digital exclusion on undocumented immigrants during the COVID-19 pandemic. New Media & Society 24: 365–83. [Google Scholar] [CrossRef]
  6. Berzin, Stephanie Cosner, Claudia J. Coulton, Robert Goerge, Laurel Hitchcok, Emily Putnam-Hornstein, Melanie Sage, and Jonathan Singer. 2016. Policy Recommendations for Meeting the Grand Challenge to Harness Technology for Social Good. Available online: https://openscholarship.wustl.edu/cgi/viewcontent.cgi?article=1791&context=csd_research (accessed on 27 October 2021).
  7. Bronfenbrenner, Urie. 1992. Ecological systems theory. In Six Theories of Child Development: Revised Formulations and Current Issues. Edited by Ross Vasta. London: Jessica Kingsley Publishers, pp. 187–249. [Google Scholar]
  8. Bureau of Economic Analysis. 2022. New and Revised Statistics of the U.S. Digital Economy, 2005–2020; Washington, DC: U.S. Department of Commerce. Available online: https://www.bea.gov/system/files/2022-05/New%20and%20Revised%20Statistics%20of%20the%20U.S.%20Digital%20Economy%202005-2020.pdf (accessed on 25 March 2022).
  9. Burning Glass Technologies. 2017. The Digital Edge: Middle-Skill Workers and Careers. Available online: https://www.burning-glass.com/wp-content/uploads/Digital_Edge_report_2017_final.pdf (accessed on 1 September 2019).
  10. Business Wire. 2021. Arctaris Funds Broadband Fiber in Opportunity Zones to Increase Digital Equity [Press Release]. Available online: https://www.businesswire.com/news/home/20210217005595/en/Arctaris-Funds-Broadband-Fiber-in-Opportunity-Zones-to-Increase-Digital-Equity (accessed on 23 February 2021).
  11. Campos-Castillo, Celeste. 2015. Revisiting the first-level digital divide in the United States: Gender and race/ethnicity patterns, 2007–2012. Social Science Computer Review 33: 423–39. [Google Scholar] [CrossRef]
  12. Cantor, Jeffrey. 2006. Lifelong learning and the academy: The changing nature of continuing education. ASHE Higher Education Report 32: 1–100. [Google Scholar]
  13. Charlotte Opportunity Initiative. 2020. 2020 Report. Opportunity Insights. Available online: https://opportunityinsights.org/wp-content/uploads/2020/11/OI-CharlotteReport.pdf (accessed on 14 December 2020).
  14. Charlotte Regional Business Alliance. 2021. Industry insights: Financial Services in the Charlotte Region. Available online: https://charlotteregion.com/blog/2021/02/25/research-data/industry-insights-financial-services-in-the-charlotte-region/#:~:text=With%20the%201998%20merger%20and,a%20title%20it%20maintains%20today (accessed on 25 March 2022).
  15. Chantarat, Sommarat, and Christopher Barrett. 2012. Social network capital, economic mobility and poverty traps. Journal of Economic Inequality 10: 299–342. [Google Scholar] [CrossRef]
  16. Chetty, Krish, Urvashi Aneja, Vidisha Mishra, Nozibele Gcora, and Jaya Josie. 2018. Bridging the digital divide in the G20: Skills for the new age. Economics. The Open-Access, Open-Assessment e-Journal 12: 1–21. [Google Scholar] [CrossRef]
  17. Chetty, Raj, Matthew O. Jackson, Theresa Kuchler, Johannes Stroebel, Nathaniel Hendren, Robert B. Fluegge, Sara Gong, Federico Gonzalez, Armelle Grondin, Matthew Jacob, and et al. 2022. Social capital I: Measurement and associations with economic mobility. Nature 608: 108–21. [Google Scholar] [CrossRef] [PubMed]
  18. Chetty, Raj, Nathaniel Hendren, Patrick Kline, and Emmanuel Saez. 2014. Where is the land of opportunity? The geography of intergenerational mobility in the United States. The Quarterly Journal of Economics 129: 1553–623. [Google Scholar] [CrossRef]
  19. City of Charlotte. n.d. Housing & Neighborhood Services. Affordable for Who? Available online: https://charlottenc.gov/HNS/Housing/Affordable-Housing/Pages/default.aspx#:~:text=The%20cost%20of%20renting%20or,quarters%20of%20the%20Panthers%20stadium (accessed on 12 July 2022).
  20. Coghill, Jeffrey G. 2021. Rural broadband internet access: The key to rural workforce development. Journal of Electronic Resources in Medical Libraries 18: 204–12. [Google Scholar] [CrossRef]
  21. Connectivity Fund. 2022. Unmet Demand. Available online: https://connectivityfund.com/fund (accessed on 27 March 2022).
  22. Crenshaw, Kimberle. 1989. Demarginalizing the intersection of race and sex. A Black feminist critique of antidiscrimination doctrine, feminist theory and antiracist politics. University of Chicago Legal Forum 1989: 8. Available online: https://chicagounbound.uchicago.edu/uclf/vol1989/iss1/8 (accessed on 2 June 2022).
  23. Crul, Maurice, Jens Schneider, Elif Keskiner, and Frans Leslie. 2017. The multiplier effect: How the accumulation of cultural and social capital explains steep upward social mobility of children of low-educated immigrants. Ethnic and Racial Studies 40: 321–38. [Google Scholar] [CrossRef] [Green Version]
  24. Davis, Shadonna. 2019. Socially Toxic Environments: A YPAR project exposes issues affecting urban black girls’ educational pathway to STEM careers and their racial identity development. The Urban Review 52: 215–37. [Google Scholar] [CrossRef]
  25. Dowah, Siegee. 2021. Charlotte Region Expected to Grow 50 Percent by 2050. WCNC Charlotte. October 1. Available online: https://www.wcnc.com/article/news/local/charlotte-region-expected-to-grow-50-percent-by-2050-population-growth-york-lancaster-diversity-south-carolina-north-carolina/275-33158760-d79f-4c2c-9da0-eb368e4ca5bf (accessed on 19 October 2021).
  26. Economic Development Administration. 2020. U.S. Department of Commerce Invests $1.7 Million to Create Broadband Network to Support Business Growth in Montgomery City, Missouri, Opportunity Zone; Washington, DC: U.S. Department of Commerce. Available online: https://www.eda.gov/archives/2021/news/press-releases/2020/12/10/montgomery-city-mo.htm (accessed on 3 February 2021).
  27. Everyone On. 2022. State of Digital Equity. Lessons Learned from Surveys and Focus Groups. Available online: https://www.everyoneon.org/2022-national-research (accessed on 19 May 2022).
  28. Fang, Mei Lan, Sarah L. Canham, Lupin Battersby, Judith Sixsmith, Mineko Wada, and Andrew Sixsmith. 2019. Exploring privilege in the digital divide: Implications for theory, policy, and practice. The Gerontologist 59: e1–e15. [Google Scholar] [CrossRef]
  29. Federal Communications Commission. 2020. Sixteenth Broadband Deployment Report Notice of Inquiry. Available online: https://www.fcc.gov/document/sixteenth-broadband-deployment-report-notice-inquiry (accessed on 25 March 2022).
  30. Feuls, Miriam, Christian Fieseler, Miriam Meckel, and Anne Suphan. 2016. Internet Experience Questionnaire. Washington, DC: APA PsycTESTS. [Google Scholar] [CrossRef]
  31. Fishbane, Lara, and Adie Tomer. 2019. Broadband Adoption is on the Rise, but States Can Do More. Washington, DC: Brookings Institute. Available online: https://www.brookings.edu/blog/the-avenue/2019/10/10/broadband-adoption-is-on-the-rise-but-states-can-do-much-more/ (accessed on 9 June 2020).
  32. Freedman, Matthew, Shantanu Khanna, and David Neumark. 2021. JUE Insight: The Impacts of Opportunity Zones on Zone Residents. Journal of Urban Economics, 103407. [Google Scholar] [CrossRef]
  33. Fry, Richard, Brian Kennedy, and Cary Funk. 2021. STEM Jobs See Uneven Progress in Increasing Gender, Racial and Ethnic Diversity. Washington, DC: Pew Research Center. Available online: https://www.pewresearch.org/science/2021/04/01/stem-jobs-see-uneven-progress-in-increasing-gender-racial-and-ethnic-diversity/ (accessed on 30 July 2022).
  34. Funk, Cary, and Kim Parker. 2018. Diversity in the STEM Workforce Varies Widely across Jobs. Pew Research Center. Available online: https://www.pewresearch.org/social-trends/2018/01/09/diversity-in-the-stem-workforce-varies-widely-across-jobs/ (accessed on 25 March 2022).
  35. Gallardo, Roberto. 2022. Digital Divide Index. West Lafayette: Purdue Center for Regional Development. Available online: http://pcrd.purdue.edu/ddi (accessed on 25 March 2022).
  36. Gandini, Alessandro. 2016. Digital work: Self-branding and social capital in the freelance knowledge economy. Marketing Theory 16: 123–41. [Google Scholar] [CrossRef]
  37. Gatta, Mary. 2008. Low-skill workers, technology, and education: A new vision for workforce development policy. The Economic and Labour Relations Review 19: 109–27. [Google Scholar] [CrossRef]
  38. Gelfond, Hilary. 2019. Opportunity zones: Driver of economic development or domestic tax shelter for the rich? Kennedy School Review 19: 7–10. [Google Scholar]
  39. Goode, Joanna. 2010. The digital identity divide: How technology knowledge impacts college students. New Media & Society 12: 497–513. [Google Scholar] [CrossRef]
  40. Hargittai, Eszter, and Eden Litt. 2013. New strategies for employment? Internet skills and online privacy practices during people’s job search. IEEE Security & Privacy 11: 38–45. [Google Scholar] [CrossRef]
  41. Harper, Briana. 2022. West Charlotte Neighbors Expand Community Land Trust to Provide Affordable Homeownership. WCNC Charlotte. February 17. Available online: https://www.wcnc.com/article/life/holidays/black-history-month/west-charlotte-community-land-affordable-homeownership/275-b51dd60d-7f07-4da5-b4f5-49b5fb865b5d (accessed on 20 April 2022).
  42. Intel. 2022. A U.S. Snapshot of Our People. Available online: https://www.intel.com/content/www/us/en/diversity/diversity-at-intel.html (accessed on 30 July 2022).
  43. Ireland, Danyelle T., Kimberley Edelin Freeman, Cynthia E. Winston-Proctor, Kendra D. DeLaine, Stacey McDonald Lowe, and Kamilah M. Woodson. 2018. (Un)hidden figures: A synthesis of research examining the intersectional experiences of Black women and girls in STEM education. Review of Research in Education 42: 226–54. [Google Scholar] [CrossRef]
  44. Kaplan, David, and Karen Mossberger. 2012. Prospects for poor neighborhoods in the broadband era: Neighborhood-level influences on technology use at work. Economic Development Quarterly 26: 95–105. [Google Scholar] [CrossRef]
  45. Khan, M. Laeeq, Howard T. Welser, Claudia Cisneros, Gaone Manatong, and Ika Karlina Idris. 2020. Digital inequality in the Appalachian Ohio: Understanding how demographics, internet access, and skills can shape vital information use (VIU). Telematics and Informatics 50: 101380. [Google Scholar] [CrossRef]
  46. Kondrat, Mary E. 2002. Actor-centered social work: Re-visioning “person-in-environment” through a critical theory lens. Social Work 47: 435–48. [Google Scholar] [CrossRef] [PubMed]
  47. Kuo, Feng-Yang, Fan-Chuan Tseng, Cecilia I. C. Lin, and Wen-Hui Tang. 2013. Critical success factors for motivating and sustaining women’s ICT learning. Computers and Education 67: 208–18. [Google Scholar] [CrossRef]
  48. Kurtzleben, Danielle. 2014. Where America’s Poverty Is Getting More and More Concentrated. Vox. June 30. Available online: https://www.vox.com/2014/6/30/5857074/where-americas-poverty-is-getting-more-and-more-concentrated (accessed on 20 September 2019).
  49. Lin, Nan. 2000. Inequality in social capital. Contemporary Sociology 29: 785–95. [Google Scholar] [CrossRef]
  50. Liu, Amy, and Alan Berube. 2015. Matching Place-Based Strategies to the Scale of the Market. Washington, DC: The Brookings Institution. Available online: https://www.brookings.edu/articles/matching-place-based-strategies-to-the-scale-of-the-market/ (accessed on 26 March 2022).
  51. Martin, Jenna. 2020. Charlotte metro moves up on CompTIA’s 2020 tech town index. Charlotte Business Journal. Available online: https://www.bizjournals.com/charlotte/news/2020/11/10/why-charlotte-ranks-as-a-top-tech-town.html (accessed on 1 December 2020).
  52. Martínez, Anthony, and Asiah Gayfield. 2019. The Intersectionality of Sex, Race, and Hispanic Origin in the STEM Workforce; Suitland-Silver Hill: U.S. Census Bureau. Available online: https://www.census.gov/content/dam/Census/library/working-papers/2019/demo/sehsd-wp2018-27.pdf (accessed on 30 July 2022).
  53. McPherson, Miller, Lynn Smith-Lovin, and James M. Cook. 2001. Birds of a feather: Homophily in social networks. Annual Review of Sociology 27: 415–44. Available online: http://www.jstor.org/stable/2678628 (accessed on 9 April 2015). [CrossRef]
  54. Meta. 2022. Annual Diversity Report. Available online: https://about.fb.com/wp-content/uploads/2022/07/Meta_Diversity-Data-Summary-Report_2022.pdf (accessed on 30 July 2022).
  55. M-Lab. n.d. Test Your Speed. Available online: https://speed.measurementlab.net/#/ (accessed on 7 June 2019).
  56. Mobarak, Ahmed Mushfiq, and Neela A. Saldanha. 2022. Remove barriers to technology adoption for people in poverty. Nature Human Behavior 6: 480–82. [Google Scholar] [CrossRef] [PubMed]
  57. Morris, Lorenzo. 2019. The Last stages of gentrification: Washington, DC, mayoral elections and housing advocacy. Social Work in Public Health 34: 39–60. [Google Scholar] [CrossRef] [PubMed]
  58. Muro, Mark, Berube Alan, and Whiton Jacob. 2018. Black and Hispanic Underrepresentation in Tech: It’s Time to Change the Equation. The Brookings Institution. Available online: https://www.brookings.edu/research/black-and-hispanic-%20underrepresentation-in-tech-its-time-to-change-the-equation/ (accessed on 19 May 2018).
  59. National Digital Inclusion Alliance. n.d. Definitions. Available online: https://www.digitalinclusion.org/definitions/ (accessed on 1 December 2019).
  60. National Science Foundation. 2022. Participation of Demographic Groups in STEM. Available online: https://ncses.nsf.gov/pubs/nsb20212/participation-of-demographic-groups-in-stem (accessed on 20 June 2022).
  61. National Skills Coalition. 2017. Middle-Skill Job Fact Sheets: North Carolina’s Forgotten Middle. Available online: https://www.nationalskillscoalition.org/resources/publications/2017-middle-skills-fact-sheets/file/North-Carolina-MiddleSkills.pdf (accessed on 19 June 2019).
  62. National Telecommunications and Information Administration. 1995. Falling through the Net: A Survey of the “Have Nots” in Rural and Urban America; Washington, DC: Department of Commerce. Available online: https://www.ntia.doc.gov/ntiahome/fallingthru.html (accessed on 25 March 2022).
  63. National Telecommunications and Information Administration. 2022a. New NTIA Data Show Enduring Barriers to Closing the Digital Divide, Achieving Digital Equity; Washington, DC: U.S. Department of Commerce. Available online: https://ntia.gov/blog/2022/new-ntia-data-show-enduring-barriers-closing-digital-divide-achieving-digital-equity (accessed on 11 May 2022).
  64. National Telecommunications and Information Administration. 2022b. NTIA Data Explorer. Internet Use at Work; Washington, DC: U.S. Department of Commerce. Available online: https://www.ntia.gov/data/explorer#sel=workInternetUser&demo=race&pc=prop&disp=chart (accessed on 15 August 2022).
  65. Newman, Lareen, Kathryn Browne-Yung, Parimala Raghavendra, Denise Wood, and Emma Grace. 2017. Applying a critical approach to investigate barriers to digital inclusion and online social networking among young people with disabilities. Information Systems Journal 27: 559–88. [Google Scholar] [CrossRef]
  66. Ojokoh, Bolanle Adefowoke, Oladele Stephen Adeola, Folasade Olubusola Isinkaye, and Chon Abraham. 2014. Career choices in information and communication technology among south western Nigerian women. Journal of Global Information Management 22: 48–77. [Google Scholar] [CrossRef]
  67. Opportunity Insights. 2022. Social Capital Atlas (ZIP 28208). Available online: https://www.socialcapital.org/?dimension=EconomicConnectednessIndividual&dim1=EconomicConnectednessIndividual&dim2=CohesivenessClustering&dim3=CivicEngagementVolunteeringRates&geoLevel=zcta&selectedId=z28208 (accessed on 19 September 2022).
  68. Organisation for Economic Cooperation and Development. 2013. Time for the U.S. to Reskill? What the Survey of Adult Skills Says. Paris: OECD Publishing. [Google Scholar] [CrossRef]
  69. Pew Research Center. 2021. Home Broadband Adoption, Computer Ownership Vary by Race, Ethnicity in the U.S. Available online: https://www.pewresearch.org/fact-tank/2021/07/16/home-broadband-adoption-computer-ownership-vary-by-race-ethnicity-in-the-u-s/ (accessed on 3 February 2022).
  70. Portillo, Ely. 2019. Five Maps that Show Inequality in Charlotte in Surprising Ways. UNC Charlotte Urban Institute. May 28. Available online: https://ui.charlotte.edu/story/five-maps-show-inequality-charlotte-surprising-ways (accessed on 20 June 2019).
  71. Presswood, Hadiya. 2021. Riding Streetcar to Revival—Or Ruin—Of Historically Black Neighborhoods. The Charlotte Post. June 10. Available online: https://www.thecharlottepost.com/news/2021/06/10/local-state/riding-streetcar-to-revival-or-ruin-of-historically-black-neighborhoods/ (accessed on 30 July 2022).
  72. Putman, S. Michael, Chuang Wang, and Seryeong Ki. 2015. Cross-Cultural Survey of Online Reading Attitudes and Behaviors. Washington, DC: APA PsycTESTS. [Google Scholar] [CrossRef]
  73. Reardon, Marguerite. 2019. Why Flawed Broadband Speed Tests Have Devastating Consequences. CNET. December 14. Available online: https://www.cnet.com/tech/services-and-software/why-flawed-broadband-speed-tests-have-devastating-consequences/ (accessed on 27 March 2022).
  74. Reardon, Marguerite. 2021. The Digital Divide has Left Millions of School Kids Behind. CNET. May 5. Available online: https://www.cnet.com/home/internet/the-digital-divide-has-left-millions-of-school-kids-behind/ (accessed on 20 June 2021).
  75. Reder, Stephen. 2015. Digital Inclusion and Digital Literacy in the United States. A Portrait from PIAAC’s Survey of Adult Skills. Arlington: American Institutes for Research. Available online: https://static1.squarespace.com/static/51bb74b8e4b0139570ddf020/t/551c3e82e4b0d2fede6481f9/1427914370277/Reder_PIAAC.pdf (accessed on 30 July 2022).
  76. Rood, Sally, and Sharon McGroder. 2017. Promoting Place-Based Strategies to Address Poverty: Exploring the Governor’s Role. National Governors Association. Available online: https://www.ddcf.org/news--insights/articles/nga-promoting-place-based-strategies-to-address-poverty/ (accessed on 26 March 2022).
  77. Semega, Jessica. 2019. Pay Is Up. Poverty is Down. How Women Are Making Strides; Suitland-Silver Hill: U.S. Census Bureau. Available online: https://www.census.gov/library/stories/2019/09/payday-poverty-and-women.html (accessed on 1 August 2022).
  78. Smith, Clint. 2016. The Desegregation and Resegregation of Charlotte’s Schools. The New Yorker. Available online: https://www.newyorker.com/news/news-desk/the-desegregation-and-resegregation-of-charlottes-schools (accessed on 29 July 2022).
  79. Sonn, Christopher C., and Adrian T. Fisher. 1998. Sense of community: Community resilient responses to oppression and change. Journal of Community Psychology 26: 457–72. [Google Scholar] [CrossRef]
  80. Sorenson Impact Center. 2021. State of the Opportunity Zone Marketplace in 2021. Forbes. September 2. Available online: https://www.forbes.com/sites/sorensonimpact/2021/09/02/state-of-the-opportunity-zone-marketplace-in-2021/?sh=52d958fd486a (accessed on 19 October 2021).
  81. Strover, Sharon. 2014. The US digital divide: A call for a new philosophy. Critical Studies in Media Communication 31: 114–22. [Google Scholar] [CrossRef]
  82. Trochmann, Maren. 2021. Identities, intersectionality, and otherness: The social constructions of deservedness in American housing policy. Administrative Theory & Praxis 43: 97–116. [Google Scholar] [CrossRef]
  83. Tsatsou, Panayiota. 2021. Vulnerable people’s digital inclusion: Intersectionality patterns and associated lessons. Information, Communication & Society 25: 1475–94. [Google Scholar] [CrossRef]
  84. U.S. Census Bureau. 2020a. Selected Financial Characteristics, 2020 American Community Survey 5-Year Estimates. Available online: https://data.census.gov/cedsci/table?q=income&g=0500000US37119_860XX00US28208&tid=ACSST5Y2020.S2503 (accessed on 5 May 2022).
  85. U.S. Census Bureau. 2020b. Gini Index of Income Inequality, 2020 American Community Survey 5-Year Estimates. Available online: https://data.census.gov/cedsci/table?text=gini%20coefficient&g=0500000US37119,37119%248600000_860XX00US28208&tid=ACSDT5Y2020.B19083&tp=true (accessed on 5 May 2021).
  86. U.S. Census Bureau. 2020c. Quick Facts: Mecklenburg County, North Carolina. Available online: https://www.census.gov/quickfacts/mecklenburgcountynorthcarolina (accessed on 20 September 2020).
  87. U.S. Census Bureau. 2020d. Types of Computers and Internet Subscriptions, 2020 American Community Survey 5-Year Estimates. Available online: https://data.census.gov/cedsci/table?text=internet&g=860XX00US28208&tid=ACSST5Y2020.S2801 (accessed on 19 August 2021).
  88. U.S. Census Bureau. 2020e. Sex by Age (Black or African American Alone). Available online: https://data.census.gov/cedsci/table?text=black&t=Age%20and%20Sex&g=860XX00US28208&tid=ACSDT5Y2020.B01001B (accessed on 20 September 2020).
  89. U.S. Census Bureau. 2020f. Demographic Characteristics for Occupied Housing Units. Available online: https://data.census.gov/cedsci/table?text=owner%20renter&g=860XX00US28208&tid=ACSST5Y2020.S2502 (accessed on 20 September 2020).
  90. U.S. Department of Education. 2018. A Description of U.S. Adults Who Are Not Digitally Literate. Available online: https://nces.ed.gov/pubs2018/2018161.pdf (accessed on 6 October 2021).
  91. Urban League of the Central Carolinas. n.d. Fiber Optic Broadband and Premise Cabling. Pre-Apprenticeship Program Case Study. Available online: http://uajp.iamempowered.com/download/ULCC%20FIBER%20PRE%20APPRENTICESHIP%20CASE%20STUDY%20.pdf (accessed on 20 September 2020).
  92. van Deursen, Alexander J.A.M., and Ellen J. Helsper. 2018. Collateral benefits of internet use: Explaining the diverse outcomes of engaging with the Internet. New Media & Society 20: 2333–51. [Google Scholar] [CrossRef]
  93. van Laar, Ester, Alexander J. A. M. van Deursen, Jan A. G. M. van Dijk, and Jos de Haan. 2020. Determinants of 21st-Century Skills and 21st-Century Digital Skills for Workers: A Systematic Literature Review. SAGE Open 10: 215824401990017. [Google Scholar] [CrossRef]
  94. Vargas-Solar, Genoveva. 2022. Intersectional study of the gender gap in STEM through the identification of missing datasets about women: A multisided problem. Applied Sciences 12: 5813. [Google Scholar] [CrossRef]
  95. Vitak, Jessica, Julia Crouse, and Robert LaRose. 2011. Internet Job Utility Measure. Washington, DC: APA PsycTESTS. [Google Scholar] [CrossRef]
  96. Wang, Ming-Te, and Jessica Degol. 2013. Motivational pathways to STEM career choices: Using expectancy–value perspective to understand individual and gender differences in STEM fields. Developmental Review 33: 304–40. [Google Scholar] [CrossRef] [Green Version]
  97. Welch, Bernard L. 1947. The generalization of ‘student’s’ problem when several different population variances are involved. Biometrika 34: 28–35. [Google Scholar] [CrossRef]
Figure 1. Map of Households Without Internet Access at Home in Mecklenburg County with Emphasis on ZIP Code 28208.
Socsci 11 00442 g001
Figure 2. Map of Opportunity Zones in Charlotte, NC with Emphasis on ZIP Code 28208.
Socsci 11 00442 g002
Table 1. Description of DEEKA Survey Tool Domains.
DimensionDescription of MeasuresNumber of Items
Qualifying questionsConsent to participate in IRB-approved study, aged 18–64, one resident per household in the 28208 ZIP code3
Background questionsRace, ethnicity, educational attainment, adults in home, children in home, gender, rent or own home, length of residency in 28208 ZIP code8
Workforce participationCriminal record that impacts work, current work status, transportation to work, travel time to work, income, skills interests6
Internet accessPresence and type of home internet connection, internet speed2
Digital behaviorbank online, game online, locate health information online, communicate online, words typed per minute5
Digital identityKnow what is trustworthy, how to protect oneself online, confidence in computer use, confidence in internet use, confidence in troubleshooting, confidence in learning digital skills, ability to use Microsoft Office (Word, Excel, PowerPoint), ability to use G Suite (Docs, Sheets, Slides)13
Digital economy valuesInternet is important, digital skills pay more, computer important for daily living, worth the effort to learn technology4
Digital economy participationComputer skills impact work opportunities, digital skills to do job well, time spent on a computer at work, online training participation within the last year, work flexibility due to technology, job search online7
Digital economy social capitalSocial support for job search information, knowledge of digital economy leaders (16), digital economy career position generator (8)3
Digital economy skills interestsInterest in gaining: teamwork skills, detail-orientation skills, problem-solving skills, communication or writing skills, organizational skills, customer service skills1
Table 2. Respondents’ Background Characteristics.
VariableMean (SD) or %N
Age42.02 (11.07)53
Gender 53
 Female77.36
 Male20.75
 Transgender1.89
Own the home they live in 53
 Own54.72
 Rent41.51
 Other3.77
Years lived in 28208 53
 Less than a year13.21
 1–4 years47.17
 5–9 years22.64
 More than a decade16.98
Educational attainment 53
 Some high school9.43
 High school diploma/GED11.32
 Some college26.42
 Associate’s degree3.77
 Bachelor’s degree35.85
 Master’s degree or higher13.21
Race 53
 Black66.04
 White26.42
 Other 7.55
Hispanic or Latinx 7.5553
Annual household income 32
 Less than USD 10,0009.38
 USD 10,000–USD 19,9993.12
 USD 20,000–USD 29,99931.25
 USD 30,000–USD 39,9999.38
 USD 40,000–USD 49,9996.25
 USD 50,000–USD 59,9996.25
 USD 60,000–USD 69,99912.50
 USD 70,000–USD 79,9996.25
 USD 100,000–USD 149,9996.25
 More than USD 150,0009.38
Adults in the home 1.85 (0.818)53
Children in the home 1.57 (0.866)53
Table 3. Respondents’ Workforce Participation.
Variable%N
Work status 53
 Unemployed16.98
 Part-time13.21
 Full-time52.83
 Self-employed3.77
 Student3.77
 Disability that prevents work5.66
 Retired3.77
Transportation to work (full-time or self-employed) 32
 Work from home31.25
 Walk or bike3.12
 Public transit3.12
 Rideshare6.25
 Drive alone56.25
Travel time to work 22
 Less than 15 min31.82
 15–29 min59.09
 30–44 min9.09
Criminal record that limits employment 53
 Yes1.89
 I do not know1.89
Frequency internet used for job search 17
 Rarely17.65
 Once a month5.88
 Several times a month5.88
 Once a week11.76
 Several times a week5.88
 Daily52.94
People good at internet use are paid more17.3152
13.46
51.92
3.85
3.85
5.77
3.85
Transportation to work (full-time or self-employed) 31
 Work from home29.03
 Walk or bike3.23
 Public transit3.23
 Rideshare6.45
 Drive alone58.06
Travel time to work 22
 Less than 15 min13.46
 15–29 min25.00
 30–44 min3.85
Criminal record that limits employment1.9251
Use internet weekly to search for work1.9252
Table 4. Frequency of Internet Use According to Residents’ Self-Reported Internet Speeds (N = 41).
Frequent UsersInfrequent Users
Mean Download and Upload (Mb/s)Mean Download/Upload (Mb/s)
Internet for banking or purchasing118.56 ***57.76 *17.29 ***9.80 *
Internet for communication110.14 **53.81 *32.68 **10.18 *
Internet for gaming125.4344.0677.9650.62
Internet for health information89.1046.88106.4048.40
Note. *** denotes p-value = 0.000, ** denotes p-value = 0.01, * denotes p-value = 0.05.
Table 5. Digital identities of survey respondents.
SkillCountPercentageSkill CountPercentage
Use a computer Microsoft Word
Very confident4381.13%Extremely well3260.38%
Somewhat confident815.09%Very well815.09%
Somewhat not confident23.77%Moderately well713.21%
Not confident at all--Slightly well47.55%
Not well at all23.77%
Use the internet Microsoft Excel
Very confident4788.68%Extremely well1630.19%
Somewhat confident611.32%Very well1018.87%
Somewhat not confident--Moderately well1222.64%
Not confident at all--Slightly well1120.75%
Not well at all35.66%
Never used software11.89%
Trouble shoot internet problems Microsoft PowerPoint
Very confident2343.40%Extremely well1935.85%
Somewhat confident2852.83%Very well815.09%
Somewhat not confident23.77%Moderately well1426.425
Not confident at all--Slightly well1018.87%
Not well at all23.77%
Ability to learn new technology Google Docs
Very confident3464.15%Extremely well1534.88%
Somewhat confident1833.96%Very well818.60%
Somewhat not confident11.89%Moderately well818.60%
Not confident at all--Slightly well613.95%
Not well at all49.30%
Never used software24.65%
Know how to identify trustworthy information Google Sheets
Strongly agree2445.28%Extremely well818.60%
Somewhat agree1935.85%Very well716.28%
Neither agree/disagree59.43%Moderately well818.60%
Somewhat disagree47.55%Slightly well511.63%
Strongly disagree11.89%Not well at all920.93%
Never used software613.95%
Know how to protect data Google Slides
Strongly agree2445.28%Extremely well1125.58%
Somewhat agree2445.28%Very well49.30%
Neither agree/disagree23.77%Moderately well716.28%
Somewhat disagree23.77%Slightly well613.95%
Strongly disagree11.89%Not well at all716.28%
Never used software818.60%
Table 6. Measures of Digital Economy (DE) Social Capital.
Mean|SD or %RangeN
Volume of network resources (knowledge of 16 diverse DE leaders)3.32|2.710–1253
Volume of network resources (knowledge of 9 BIPOC DE leaders)1.15|1.680–653
Volume of network resources (knowledge of 7 non-BIPOC DE leaders)2.17|1.410–653
Volume of network resources (knowledge of 7 female DE leaders)1.04|1.520–653
Volume of network resources (knowledge of 9 male DE leaders)2.28|1.550–753
Sought/received help with job information 53
Family7.55%
Friend18.87%
Work or school Acquaintance24.53%
Caseworker5.66%
Other16.98%
No one26.42%
Knowledge of anyone in Charlotte working in a non-degree DE occupation 53
Computer user support specialist43.40%
 Web developer37.74%
 Influencer37.74%
 Software engineer33.96%
 Network administrator24.53%
 Digital storyteller18.87%
 Fiber installation technician16.98%
 User experience (UX) designer13.21%
Note. The list of 16 tech leaders includes Elon Musk, Sheryl Sandberg, Ursala Burn, Stacey Spikes, Marcus Brownlee, Casey Neistat, Jackie Aina, Kimberly Bryant, Sundar Pichai, Ellen Pao, Jeff Bezos, Jack Dorsey, Vani Hari, Dane Gotte, and Jordi Muñoz. In error, Vani Hari was originally included in the list of non-BIPOC tech leaders which created an imbalance in the number of BIPOC and non-BIPOC leaders.
Publisher’s Note: MDPI stays neutral with regard to jurisdictional claims in published maps and institutional affiliations.

