Abstract
We examined the differences among seventeen European countries regarding the extent to which several key institutional and labor market characteristics affect the degrees of insecurity that people feel about their jobs and employment prospects, as well as their well-being (economic security and subjective well-being). We estimate how macrostructural factors affect well-being by fitting random-intercept multi-level models and decomposing the variance across national and individual levels, using data from the 2004 and 2010 European Social Surveys. We find that there is substantial country-level variation in labor market insecurity, economic security and subjective well-being. Active labor market policies, the generosity of unemployment benefits, and collective bargaining coverage explain a considerable portion of the identified differences among countries in labor market insecurity and well-being. The effects of employment protection legislation vary depending on whether the worker has a permanent or temporary contract. We did not find substantial differences between 2004 and 2010, suggesting that the effects of institutions and worker power on labor market insecurity and well-being reflect longer-term structural changes associated with the transformation of employment relations.
1. Introduction
The liberalization of labor markets and the social protection regimes in advanced capitalist countries has led to the restructuring of employment relations, creating greater uncertainty and insecurity and, often, negative consequences for individuals’ well-being. These changes have renewed academic interest in how institutions affect individuals’ welfare, a long-standing, central issue in research on social stratification and political economy. A prominent theme in the literature is how neoliberal political-economic institutions and policies have led to the rise of “precarious work,” or work that is uncertain, unstable, and insecure and in which employees bear the risks of work (as opposed to businesses or the government) and receive limited social benefits and statutory entitlements (Vosko 2010; Standing 2011; Kalleberg and Vallas 2018).
A growing number of studies have documented that the consequences of precarious work for individuals’ well-being depend on institutional contexts, such as the labor market and social welfare institutions (e.g., Anderson and Pontusson 2007; Kalleberg 2018; Appendix A, Table A1 summarizes many of these studies, their data sources, and findings). Well-developed active labor market policies that intervene in the labor market to help the unemployed find work, for example, mitigate labor market insecurity somewhat, as people who lose their jobs will have greater opportunities to transition back into new jobs (Berglund 2015; Lűbke and Erlinghagen 2014; Chung and Oorschot 2011; Anderson and Pontusson 2007). Moreover, generous income replacement policies help to alleviate labor market insecurity for those who become unemployed (Hipp 2016; Berglund 2015; Chung and Oorschot 2011; Clark and Postel-Vinay 2009; Sjöberg 2010; however, see Esser and Olsen 2012; Erlinghagen 2008).
While we know a great deal about the importance of the labor market and social welfare protections for well-being, some gaps remain. For example, we know less about how thoroughly country-based differences in labor markets and social welfare protection institutions account for individual differences in both economic security and subjective well-being. Nor do we have a good grasp on how labor market insecurity mediates the association between these institutions and economic and non-economic well-being.
We address these gaps by examining the associations between national differences in the labor market and social protection institutions and labor market insecurity and assess their direct and indirect associations with economic and non-economic well-being. We first outline our theoretical perspective and highlight the salience of labor market and welfare state institutions for explaining differences in overall labor market insecurity, along with individuals’ experiences of economic security and subjective well-being. Our conceptual model posits the interrelations among institutions, labor market insecurity, and well-being, linking macro (country) and micro (individual) levels. Next, we describe our concepts, data, and analytic strategy. Finally, we summarize our results and discuss some of their implications for understanding country differences in insecurity and well-being.
2. Theoretical Background
Social scientists disagree about how and why countries differ in their economic and employment institutions and whether these differences are likely to converge or diverge over time. Universalistic theories generally assume that factors such as globalization, market forces, and changes in technology are so strong that nations at similar stages of development must adapt to similar organizational logics. This weakens the impact of institutional contexts, such that country differences should be minimal and decline over time, leading to an evolutionary development and convergence among advanced capitalist nations (e.g., for theories of industrialism, see Kerr et al. 1960; for post-industrial society, see Bell 1973). Moreover, mainstream explanations of economic development and neoliberal-influenced policy see country differences as resulting from market forces and largely disregard or downplay the roles of political and social factors (see Howell and Kalleberg 2019).
By contrast, neo-institutionalist theories argue that the different social, economic, and political structures of capitalist societies—especially the relative strengths or weaknesses of transnational and domestic capital and labor in particular sectors of the economy—produce divergences among them in their employment systems and institutions and the subsequent consequences for individuals. Similarly, the social protections available to those with different work arrangements vary according to nation-states’ economic, political, and social policies, and the ways in which they emphasize the relative importance of markets, fiscal discipline, trade, investment, and liberalization (e.g., financial deregulation, decentralization, or privatization).
We draw on two influential neo-institutional theories of national diversity among capitalist countries to identify some of the most important labor market and social welfare protection institutions that shape the nature and consequences of labor market insecurity and well-being: the “varieties of capitalism” (VoC) or “production regime” theory (Hall and Soskice 2001) and the power resources theory (PRT) (e.g., Korpi 1985; Esping-Andersen 1990).
While both VoC and PRT emphasize a wide range of structures and policies that are important for understanding country-based differences in labor market insecurity and well-being, they tend to highlight somewhat different institutions. The VoC theory is especially relevant when accounting for differences in labor market institutions, such as those linked to the employment systems within a country—especially educational and skill formation systems—and the associated patterns of labor market mobility. On the other hand, the PRT emphasizes how the differential power resources of workers help to produce variations in the inclusiveness of welfare provisions and the degree of unemployment insurance protection and social spending in general.
These two theoretical approaches help us to identify three main institutional reasons for country-based differences in labor market insecurity and well-being. The first is labor market institutions, such as the extent of a country’s active labor market policies, which are designed to help workers transition between jobs and from unemployment to employment, the degree of employment protections for “permanent, regular” workers, and the rules governing the use of temporary and other nonstandard workers. The second reason is social welfare protection policies, such as the generosity of welfare spending and the degree to which unemployed persons receive financial support (usually in the form of unemployment insurance payments). The third reason is the differences in collective worker power, such as the degree to which workers can organize collectively to pursue their interests through unions and collective bargaining.
2.1. Labor Market Structures and Policies
Active labor market policies are designed to help working-aged people obtain jobs and transition from unemployment to employment. Active labor market policies provide workers with greater opportunities for lifelong learning and employability (Viebrock and Clasen 2009). These include opportunities for retraining, job counseling, and help in finding new jobs through placement services and job-search assistance.
Studies that focus on active labor market policies consistently show that increased expenditure on these policies is negatively associated with labor market insecurity (e.g., Berglund 2015), particularly with one’s perceived ability to find another job if laid off (Anderson and Pontusson 2007; Lűbke and Erlinghagen 2014; Chung and Oorschot 2011).
Employment protection legislation refers to a set of norms and procedures that regulate the hiring and firing practices in labor markets. There are two kinds of employment protections: (1) laws that provide protection against the firing of regular (i.e., permanent) workers and are associated with high dismissal costs to employers; and (2) regulations about the employers’ leeway when hiring temporary workers, which are associated with low dismissal costs to employers. Differences between employment protection legislation for permanent and temporary workers capture the level of labor market rigidity, the division between regular and temporary workers in the labor market (see Boeri and Van Ours 2008; Venn 2009), or the processes that generate inequalities in terms of the distribution of employment chances, which are determined by opportunities for control over the termination of one’s employment contract and access to employment opportunities (Polavieja 2003).
The findings of studies that focus on the role of employment protection legislation on the forms of labor market insecurity are more nuanced. While employment regulation does not have a statistically significant effect on perceived job insecurity (e.g., Berglund 2015; Esser and Olsen 2012; Erlinghagen 2008) or the perceived difficulty of job seeking (Lűbke and Erlinghagen 2014) in general, there is strong evidence that the effects of employment protection legislation on job insecurity depend on the employees’ contract type. Specifically, temporary workers were more likely to feel insecure in countries with stricter employment protection legislation (e.g., Clark and Postel-Vinay 2009) and a higher share of temporary work (Hipp 2016). Temporary workers were also more likely to feel insecure if the job security provisions for permanent employees were strong and the regulations on temporary contracts were strict (Balz 2017; Chung and Oorschot 2011; Lűbke and Erlinghagen 2014).
2.2. Social Welfare Protection Policies
Social welfare system institutions refer to the extent to which workers are commodified, or dependent on the labor market to maintain a basic level of income. Social welfare protection systems differ among countries in their generosity, type, and inclusiveness. We focus here on social welfare payments made to unemployed individuals to protect them from the economic risk of job loss. The generosity and eligibility conditions of such payments vary among countries. Previous research has shown that unemployment insurance—an indicator of the generosity of welfare systems—can, but does not always, play a preventive role against labor market insecurity. Some cross-national studies found that unemployment assistance, unemployment insurance, or expenditure on passive labor market policies were negatively associated with perceived job or employment insecurity (Hipp 2016; Berglund 2015; Chung and Oorschot 2011; Clark and Postel-Vinay 2009). However, other studies found that unemployment insurance was not associated with perceived labor market insecurity when the (long-term) unemployment rate in a country wascontrolled (Esser and Olsen 2012; Erlinghagen 2008). Unemployment insurance systems have also been linked to indicators of individual well-being. For example, Sjöberg (2010) shows that unemployment insurance reducesd economic insecurity and, thereby, enhanced the subjective well-being of employed individuals, while Di Tella and MacCulloch (2008) demonstrate that cross-national differences in happiness were positively related to country differences in terms of the level of welfare protection.
2.3. Worker Power
Workers can exercise power resources individually or collectively, although the latter is more salient for explaining country differences in institutions. The PRT literature emphasizes differences among countries and over time in the extent to which workers can organize to realize their economic interests by exerting collective power in the form of bargaining and establishing other institutionalized arrangements in relation to employers. Collective worker power affects the extent to which workers are protected against dismissals, as well as their pay and working conditions. It also enhances the inclusiveness of welfare provisions and the levels of unemployment insurance protection and social spending in general. Workers who are covered by collective bargaining agreements are more apt to have greater power relative to their employers, even those who are not members of a trade union. Research on worker power suggests that collective bargaining coverage is negatively associated with perceived job insecurity (Dixon et al. 2013; Esser and Olsen 2012) as well as employment insecurity—the perceived inability to find another job (Dixon et al. 2013).
2.4. Conceptual Model
Figure 1 describes the conceptual framework that summarizes our assumptions about the relationships among national differences, labor market insecurity, and well-being. The wide arrows denote the relationships between the concepts that constitute our main hypotheses. We posit that country differences in the labor market and social welfare institutions and in worker power affect individual well-being (both economic and subjective well-being), both directly and indirectly, through their impacts on labor market insecurity. The model also recognizes that national differences in economic inequality and unemployment, as well as individuals’ characteristics, will affect well-being.
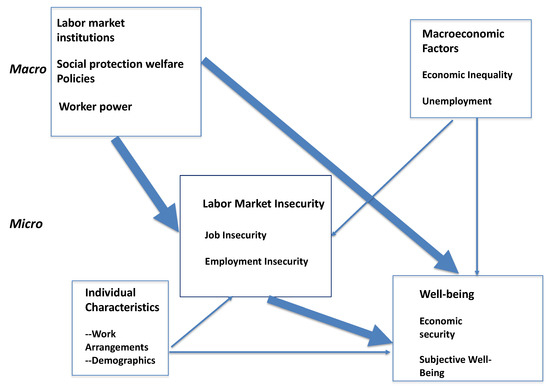
Figure 1.
Multi-level conceptual model.
2.5. Hypotheses
Hypothesis 1 (H1).
Active labor market policies are negatively associated with labor market insecurity.
The extent of active labor market policies is likely to be associated with higher levels of: (1) employment security (as activation policies are designed to help people transition to new jobs); and (2) job security (due to the support that they know they would receive in the event of a job loss due to activation policies, even if the risk of job loss is high).
Hypothesis 2 (H2).
Stricter employment protection legislation is associated with higher levels of job and employment insecurity among temporary employees compared to permanent employees.
For temporary workers, weaker restrictions on the use of temporary contracts may reduce their fear of job loss (due to low dismissal costs) but may increase their concerns about difficulty in finding a new job, should their contracts not be renewed (due to the high cost of hiring). Moreover, the stronger job security provisions offered to permanent employees may also increase the temporary workers’ fears of job loss since it is easier to fire them than to dismiss permanent employees.
Hypothesis 3 (H3).
More generous unemployment protections will be positively associated with economic security.
Hypothesis 4 (H4).
Active labor market policies and generous unemployment protections will be associated with greater subjective well-being.
Since these policies reduce individuals’ perceived labor market insecurity and/or increase their economic security, we expect that they will enhance the subjective well-being of employed people.
Hypothesis 5 (H5).
Labor market insecurity mediates, in part, the association between active labor market policies, employment protection legislation, and generous unemployment protections, on the one hand, and economic security and subjective well-being, on the other.
The importance of work for economic security in a capitalist society is well established; thus, it is likely that labor market insecurity will lead to economic insecurity, although this is apt to differ among countries depending on their social welfare protections. Numerous studies have shown that people who are insecure about their jobs have lower mental and physical health and work performance (e.g., Burgard et al. 2009; Tegund 2014). Labor market insecurity also lowers one’s trust and commitment to the employing organization, which negatively affects work-related behaviors such as performance (see the reviews by De Witte 1999; Sverke and Hellgren 2002), as well as family life (Scherer 2009; Inanc 2018). Because of the central importance of labor market insecurity for well-being, we expect that such insecurity will mediate the effects of the labor market and social welfare protection institutions on economic security and SWB.
Hypothesis 6 (H6).
Greater collective bargaining coverage is negatively associated with labor market insecurity and positively related to economic security and subjective well-being.
When workers have relatively more power compared to their employers, they are more likely to be able to negotiate better working conditions, including better job protections and pay. High collective bargaining coverage is also likely to be associated with lower labor market insecurity as well as greater economic security since it covers both union and non-union members. In addition, extensive collective bargaining coverage represents a source of trust between employers and workers, thereby promoting higher subjective well-being.
Hypothesis 7 (H7).
In general, the associations between active labor market policies and unemployment insurance, on the one hand, and labor market and economic insecurity, on the other, will be greater in 2010 than in 2004.
The economic crisis of 2008–2009 impacted some countries more than others and so they are likely to have responded differently to the economic crisis. Some increased government spending and investments in active labor market policies and unemployment insurance, while others reduced these protections. However, we expect that these kinds of protections will be more salient in an economic crisis and, thereby, mitigate insecurity more strongly, although not necessarily subjective well-being. As we do not measure the economic crisis directly, this hypothesis is more speculative than the others.
3. Data, Variables, and Analytical Strategy
3.1. Data
Our analyses of the key linkages in our model are based on data from the European Social Surveys (ESS), a research program that is co-funded by the European Commission, the European Science Foundation, and national research funding bodies. Representative population surveys were carried out in 36 participating countries and data were collected via face-to-face interviews. A total of nine surveys were conducted every two years between 2002 and 2018, with the tenth survey underway, although we restricted the analyses presented here to the 17 countries that participated in both 2004 and 2010 surveys; these two surveys contain unique modules on work and well-being and their timing allows us to capture possible differences in insecurity and SWB before and after the economic crisis of the late 2000s.1
The average response rates for the countries included in our analyses vary between 58% in Round 5 (2010) and 62% in Round 2 (2004). The country sample sizes differ across survey years. Moreover, we limited our analytic samples to employees of working age (20–65), yielding an overall sample size of 20,032. The sample for Sweden, with 1035 participants, is the smallest sample size in this study (in Round 5), while the Round 2 (2004) sample for the Czech Republic is the largest country sample size, with 2236 participants. We used a weighting factor to correct for sample selection bias.
3.2. Variables
3.2.1. Institutional Variables
Active Labor Market Policies (ALMPs): We measured ALMPs as the total of a country’s GDP spent on these policies, using the OECD public expenditure database (OECD 2017a). This measure represents the share of GDP spent on public employment service and administration, training, employment incentives, sheltered and supported employment and rehabilitation, direct job creation, and start-up. In our models, in line with Chung and Oorschot (2011), we adjusted ALMPs according to the level of unemployment. (See Appendix A, Figure A1, for the level of ALMP in each country included in our analysis).
Employment Protection Legislation: We measured employment protection legislation by using two indices compiled by the OECD (2013a). The first is EPRC, a measure of the strictness of employment protection for regular workers that runs on a 0–6 scale, with higher values representing stricter regulation. The EPRC includes laws and regulations related to the defense against procedural inconveniences due to dismissal, the provision of a notice period and severance pay, and the difficulty of dismissal. Such rules serve to protect regular employees against the abusive behavior of employers to limit dismissals and thereby reduce the transaction costs of employment, among other benefits. The second, EPT, is also measured on a 0–6 scale and represents the strictness of regulations on hiring temporary workers (higher values denote stricter regulation on using temporary workers). EPT concerns the type of work allowed with fixed-term contracts, their renewal and duration, as well as regulations regarding agency work. (See Appendix A, Figure A1, for the level of EPL in each country).
Unemployment Insurance: We measured the generosity of unemployment insurance with OECD’s net replacement rate (NRR) indicator (OECD 2016). NRR refers to the proportion of net income in work provided after job loss by unemployment and related welfare benefits. Larger values for the replacement rate indicate more generous welfare benefits for unemployed individuals. (See Appendix A, Figure A1, for the level of unemployment insurance in each country).
Collective Bargaining Arrangements: Our indicator of worker power uses the collective bargaining coverage (CBC) rate—the percentage of persons covered by collective bargaining agreements, irrespective of whether they are union members. We have gathered this information from various OECD reports (OECD 2011, p. 162; 2012, p. 146; and 2013b, p. 275). (See Appendix A, Figure A1, for the level of CBC in each country).
3.2.2. Individual-Level Outcome Variables
Labor Market Insecurity: Labor market insecurity can be measured objectively (in terms of the observed probabilities that people with certain characteristics in particular jobs might lose them and be able to find new, similar jobs) as well as subjectively (which we do in the current study). Perceived insecurity has been shown by psychologists to be strongly related to poor mental and physical health, as well as job dissatisfaction and a host of other outcomes. There is also considerable evidence that the anticipation of a negative event can be worse than experiencing the actual event itself: the dread and uncertainty of losing one’s job can be worse than losing it since insecurity constitutes an unknown that people are unsure how to deal with (Burchell 2011; Burgard et al. 2009). Moreover, subjective assessments of the chances of losing one’s job are strongly related to actual job loss rates (Manski and Straub 2000; Green 2009; Dickerson and Green 2012).
Labor market insecurity is a multidimensional concept (see Greenhalgh and Rosenblatt 1984; De Witte 1999; Sverke and Hellgren 2002) and generally refers to two kinds of uncertainty: job insecurity, or the degree to which a person perceives s/he is likely to lose the job; and employment insecurity, which concerns one’s perception of how easy or hard it will be to find a new and generally comparable job. Job insecurity is related to sustaining one’s current position with an employer, whereas employment insecurity is related to the opportunities for mobility within the labor market (Chung and Oorschot 2011). These two types of insecurity capture the different aspects of insecurity associated with labor market participation; in countries with very generous active labor market policies, for example, job insecurity may be high, but employment insecurity could be relatively low.
We measured job insecurity using the survey item “My current job is secure” (1 = very true, 2 = quite true, 3 = a little true, 4 = not at all true), where those who score 3 or 4 are considered to experience job insecurity. We measured employment insecurity using the survey item “How difficult or easy would it be for you to get a similar or better job with another employer if you had to leave your current job?” (0 = extremely easy; 10 = extremely difficult).
Economic Security: Economic security signifies the extent to which a person has sufficient and relatively stable income and assets to be able to live and pay expenses (Osberg and Sharpe 2014). Economic security can also be measured objectively, in terms of whether a person or family is classified as poor, or subjectively, as a person’s assessment or evaluation of whether his/her economic resources are sufficient to meet his or her needs (and perhaps also the needs of the family). We measure economic security subjectively, based on an item assessing one’s perception about his or her household’s income, whether the person is: 0 = living comfortably on personal income, 1 = coping on personal income, 2 = finding it difficult on personal income, 3 = finding it very difficult on personal income. We created a dichotomous variable, coding (=1) individuals who report that they cope or live comfortably on their personal income.
Subjective Well-Being (SWB): This is an overall indicator of the quality of one’s life. As Diener and his colleagues describe the concept: “These evaluations include people’s emotional reactions to events, their moods, and judgments they form about their life satisfaction, fulfillment, and satisfaction with domains such as marriage and work. Thus, subjective well-being concerns the study of what laypeople might call happiness or satisfaction” (Diener et al. 2003, p. 404; see also Pichler 2006; Di Tella and MacCulloch 2008). Our measure of SWB2 is a scale constructed as the average of the following two questions (Cronbach’s alpha = 0.82): (1) “Taking all things together, how happy would you say you are?” (0 = extremely unhappy, 10 = extremely happy), and (2) “All things considered, how satisfied are you with your life as a whole nowadays?” (0 = extremely dissatisfied, 10 = extremely satisfied).
3.2.3. Macroeconomic Controls
While our focus in this paper is on the labor market and the social protection institutions and policies described above, we recognize that they are intimately related to other important macroeconomic factors that could help to explain why workers in diverse countries differ in their labor market insecurity and well-being. We account for the aggregate level unemployment rate, as well as the level of income inequality in both years.
The unemployment rate affects individuals’ perceived job loss probabilities, as well as the degree to which joblessness is related to well-being. Individuals often assess their employment opportunities by drawing on the experiences of others around them (Glavin and Young 2017). Individuals’ perceived labor market insecurity is more accentuated when the unemployment rate is high; thus, their well-being is hampered more severely (Lam et al. 2014). We use OECD’s (2015) annual Labor Force Statistics to measure the unemployment rate.
Income inequality is also likely to be negatively associated with SWB. Because people generally have egalitarian preferences (e.g., Clark and D’Ambrosio 2014), they perceive income inequality as unfair (Ferrer-i-Carbonell and Ramos 2012). Since individuals compare themselves to others (Festinger 1954), they tend to be inequality-averse. Therefore, income inequality negatively affects SWB, although this relationship is likely to be non-linear and moderated by other factors, such as the individuals’ own income level (e.g., Oishi et al. 2011). We measure income inequality with the P90/P10 income decile ratio indicator (OECD 2017b).
3.2.4. Individual-Level Characteristics
Country differences in labor market insecurity and well-being also result from differences among individuals that affect the degree to which a person experiences insecurity and well-being. We include as controls several individual-level factors that previous research has shown to be related to insecurity and well-being. One set of these is indicators of precarious work: whether the respondent is on a temporary contract, their unemployment experiences in the previous 12 months, and their years of tenure with the employer. The other set includes demographic and other labor market characteristics: age and age squared, gender, weekly work hours (logged), firm size, income (measured in deciles), current or previous trade-union membership, education level, physical disability, and marital status, all derived from the ESS 2004 and 2010 data.
3.3. Analytic Strategy
We assessed the role of institutional factors on individual-level outcomes by fitting multilevel models where data on individuals (our Level 1) were nested within countries (our Level 2), and information on countries was nested within the two data points (our Level 3) before and after the economic crisis. This enabled us to assess the extent to which variations in individual-level measures of labor market insecurity and well-being are due to differences between countries as opposed to variability within countries. We estimated our multi-level models by fitting a random intercept model. This model allows us to interpret the variance of the error (i.e. residuals) at different levels, and assumes that the effects of our Level 1 and Level 2 predictors on labor market insecurity and well-being outcomes do not vary across counties. In our models, the fixed parameters include Level-1 and Level-2 variables (i.e., the individual characteristics, labor market and social protection institutions, and macroeconomic factors in Figure 1), whereas the random parameters are the residual variance unexplained across levels. The variance partition coefficient (VPC) is the proportion of the residual in the individual outcome that remains to be explained across countries; it is calculated as the variance at Level 2, divided by the total variance in level 1 and level 2.
We assessed the relative strength of each institutional factor in explaining this cross-national variation in our outcome variables (job insecurity, employment insecurity, economic security, and SWB) by investigating the amount of variation reduced by each institutional factor. We also investigated the relative strength of institutional factors on outcome variables before and after the crisis by calculating the predicted probabilities of reporting labor market insecurity, economic security, and SWB, respectively.
We conducted our analysis using the Stata statistical software (Texas: StataCorp), release 16, and the xtmelogit and xtmixed commands for categorical and continuous dependent variables, respectively.
4. Results
4.1. Country Differences in Labor Market Insecurity
Our null models (which include the Level-1 variables but no Level-2 measures) indicate that a sizeable share of the variation in our outcome variables differs among countries: 13% and 10% of the variation in individuals’ job and employment insecurity is attributable to cross-national differences, whereas 21% of the variation in economic security and 17% of the variation in SWB is between countries (see Appendix A Table A2 for the full models).
Table 1 shows that individuals’ precarious work experiences (measured as temporary contracts, shorter job tenure, and past unemployment) are positively associated with job insecurity. However, the inclusion of these variables and the other individual-level controls do not reduce the unexplained cross-national variation (VPC is still 13%, see Model 1a in Table 1), nor does the introduction of macro-economic indicators such as the unemployment rate, which is positively associated with job insecurity, and income inequality, which is negatively associated with job insecurity (Model 1b). This suggests that other factors explain cross-national variations in job insecurity.

Table 1.
Impact of labor market policies and welfare systems on job insecurity.
Next, we introduce our labor market and welfare variables one at a time (in models 1c through 1f) to assess their relative effectiveness in explaining the remaining cross-national variations in job insecurity. The standardized coefficients suggest that ALMPs, NRR, and CBC have statistically significant and negative effects on job insecurity that are comparable in size, and the measures of EPL have differential impacts according to contract type. Since the institutional variables are related to our macroeconomic controls—which are already included in our models—they may not necessarily reduce the VPC. Only the model with the two indicators of EPL reduces the VPC by 25 percent, followed by an eight percent reduction for CBC. While ALMPs and NRR are negatively associated with individual-level job insecurity, they do not explain any of the remaining cross-national variation in job insecurity that are not accounted for by individual and macroeconomic indicators (in model 1b).
Table 2 shows that unemployment experience is positively associated with one’s worries about being able to find a comparable job (our models for employment insecurity control for self-reported job insecurity, with which it is positively associated). Temporary contract status is unrelated to employment insecurity, which is not surprising because of its strong correlation with job insecurity (Model 2a). After the inclusion of these individual indicators of precarious work, and the other individual-level controls, the unexplained cross-national variation is still at nine percent. Our macroeconomic indicators—the unemployment rate and income inequality—explain 22% of this remaining cross-national variation (VPC is equal to seven percent in Model 2b).
Table 2.
Impact of labor market policies and welfare systems on employment insecurity.
Next, we introduce our institutional variables one at a time (Models 2c to 2f). The EPL indicators are most effective in accounting for cross-national variation in employment insecurity, each explaining about 15 percent of the remaining cross-national variation. However, ALMPs and NNRs do not further reduce the cross-national variation already explained by individual indicators, and income inequality and unemployment rate (model 2b), although they both are associated with lower economic insecurity.
The findings regarding the relationship between the labor market/welfare institutions and the individuals’ job and employment insecurity are in line with earlier studies. Workers in countries with higher levels of APLMs are less likely to report job and employment insecurity. The interaction terms for measures of EPL and contract status (Models 1d and 2d) indicate that, depending on one’s contract type, the components of EPL have a differential impact on job insecurity but not on employment insecurity. The positive and statistically significant coefficient for “Temporary contract × EPT” in Model 1d indicates that, at a given level of protection for regular workers, strict regulations on the use of temporary contracts are associated with higher levels of job insecurity for temporary workers than for permanent workers. This finding partially supports Hypothesis 2. Finally, a high CBC reduces both the dimensions of labor market insecurity, which supports Hypothesis 6.
4.2. Country Differences in Economic Security and Subjective Well-Being
Table 3 shows that job and employment insecurity are negatively and strongly associated with economic well-being, as predicted in Hypothesis 5. However, controlling for labor market insecurity, along with other individual level controls, reduces the unexplained cross-national variation by only approximately 5 percent, down to 20 percent (Model 3a). Model 3b introduces the macroeconomic indicators of the unemployment rate and levels of income inequality, both of which are negatively associated with economic well-being, which reduces the unexplained variation to 15 percent.
Table 3.
Impact of labor market policies and welfare systems on economic security.
Models 3c to 3f introduce our institutional variables one at a time. The percentage of GDP spent on ALMPs is positively associated with economic security, and accounts for the largest share of the unexplained cross-national variation. The model with the ALMPs (3c) explains more than half of the cross-national variation not accounted for by the individual-level and macro-economic variables. Employment protections have a modest effect on economic security (Model 3d), reducing unexplained cross-national variation by around 7%. Temporary employees in countries with higher levels of employment protection for permanent employees (high EPRC) are less likely to report economic security. As predicted in Hypothesis 3, the generosity of unemployment insurance protections, as measured by NRR, is significantly and positively related to economic security (Model 3e) and also helps to explain cross-national variation by the same amount as EPL. Finally, in line with Hypothesis 6, the CBC rate is positively associated with economic security (Model 3f) and reduces cross-national variation by one-third, from 15% to 10%.
Job insecurity, employment insecurity, and economic security are all strongly associated with SWB, the former two reducing the SWB while the latter enhances it, as hypothesized in Hypothesis 5 (Model 4a, Table 4). The inclusion of the indicators of labor market insecurity and economic security (along with other individual-level controls) explains another 24% of the cross-national variation in SWB, reducing the unexplained cross-national variation to 13%. Adding macroeconomic controls reduces the unexplained variation to 9%. Income inequality in a country in a year is negatively associated with the SWB of an employed individual, whereas the unemployment rate is not statistically significant (Model 4b).
Table 4.
Impact of labor market policies and welfare systems on SWB.
Models 4c to 4f assess the relative explanatory power of each institutional variable on SWB. As predicted in Hypothesis 4, the standardized coefficients for ALMPs and CBC suggest that these institutions are positively associated with SWB (models 4c and 4f), and the coefficients are comparable in size. EPL does not have a differential impact on the SWB of temporary workers (Model 4d), and the coefficient for NRR is not statistically significant, although it is in the direction predicted in Hypothesis 6 (Model 4e).
The CBC rate has the largest explanatory power among the institutional variables. It reduces the cross-national variation in SWB that is unexplained by individual and macro-economic variables by one-third (from nine percent to six percent). This is followed by the ALMPs, which explain 22 percent of the remaining cross-national variation. We found that the EPL and NRR do not add to what has already been explained by individual and macroeconomic indicators.
4.3. Changes in Country Differences in Labor Market Insecurity and Well-Being
Our two surveys were collected before and after the deep economic recession of 2008–2009. Most countries experienced a period of economic downturn that may well have exacerbated the amount and consequences of labor market insecurity, although insecurity and its effects were felt long before the crisis. Unemployment rates increased in many countries and the reregulation of social welfare protections was apt to enhance levels of job insecurity and reduce well-being. In this section, after describing the changes in the labor market and welfare system institutions, as well as in insecurity and well-being outcomes, we take a closer look at the differences in the effects of the institutions on our measures of insecurity and well-being before (2004) and after (2010) the economic crisis.
Changes in absolute levels of labor market insecurity and well-being may reflect, to a certain extent, the compositional changes in the pool of employees before and after the crisis. Hence, we assess the impact of institutions before and after the crisis on individual outcomes, using multi-level models with individual controls, where we also introduce an interaction term for each institutional variable and year of the survey. Figure 2, Figure 3, Figure 4 and Figure 5 show the effects selected from these interaction models as predicted probabilities for each of our four institutional variables on the three outcomes, before and after the economic crisis.
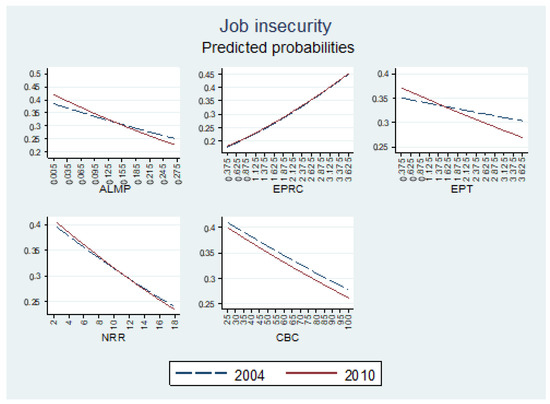
Figure 2.
Institutions, job insecurity, and the crisis. Source: pooled data from the second and fifth waves of the European Social Survey. Notes: (1) For EPRC and EPT, the sample includes only temporary workers. (2) Predicted probabilities were plotted with the full set of controls. All control variables are set to their mean. (3) Likelihood ratio tests (Prob > Chi2) for whether the interaction effect is statistically significant: ALMP = 0.02; EPRC = 0.93; EPT = 0.02; NRR = 0.61; CBC = 0.68. Confidence intervals are available upon request.
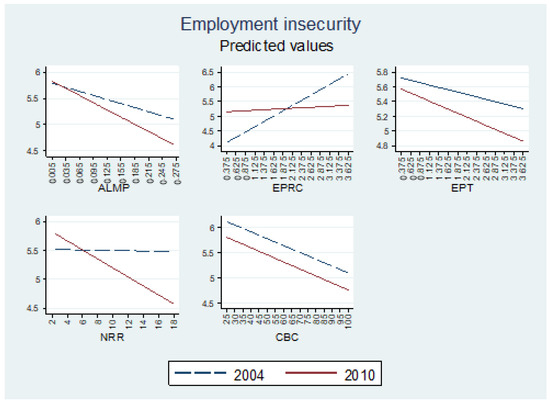
Figure 3.
Institutions, employment insecurity, and the crisis. Source: Pooled data from the second and fifth waves of the European Social Survey. Notes: (1) For EPRC and EPT, the sample includes only temporary workers. (2) Predicted probabilities were plotted with the full set of controls. All control variables are set to their mean. (3) Likelihood ratio tests (Prob > Chi2) for whether the interaction effect is statistically significant: ALMP = 0.01; EPRC = 0.01; EPT = 0.02; NRR = 0.00; CBC = 0.81. Confidence intervals are available upon request.
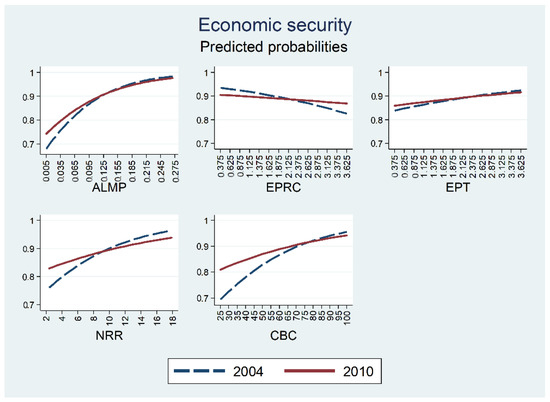
Figure 4.
Institutions, economic security, and the crisis. Source: Pooled data from the second and fifth waves of the European Social Survey. Notes: (1) For EPRC and EPT, the sample includes only temporary workers. (2) Predicted probabilities were plotted with the full set of controls. All control variables are set to their mean. (3) Likelihood ratio tests (Prob > Chi2) for whether the interaction effect is statistically significant: ALMP = 0.00; EPRC = 0.00; EPT = 0.06; NRR = 0.00; CBC = 0.00. Confidence intervals are available upon request.
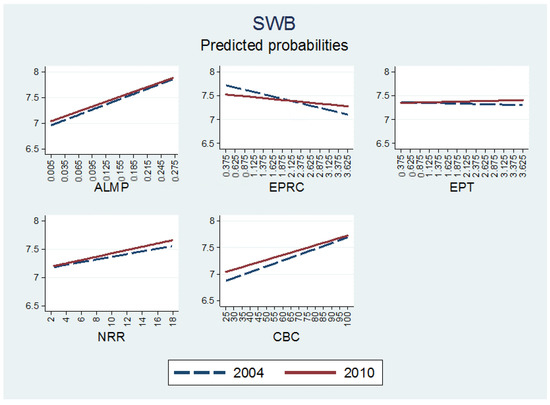
Figure 5.
Institutions, SWB, and the crisis. Source: Pooled data from the second and fifth waves of the European Social Survey. Notes: (1) For EPRC and EPT, the sample includes only temporary workers. (2) Predicted probabilities were plotted with the full set of controls. All control variables are set to their mean. (3) Likelihood ratio tests (Prob > F) for whether the interaction effect is statistically significant: ALMP = 0.48; EPRC = 0.00; EPT = 0.30; NRR = 0.27; CBC = 0.01. Confidence intervals are available upon request.
Figure 2 and Figure 3 show that the negative associations between ALMPs and the two components of labor market insecurity are stronger in 2010 than in 2004, suggesting that such policies helped to reduce labor market insecurity after the crisis. Our models using EPL only include temporary employees3 and show labor market insecurity by the changing levels of EPRC and EPT before and after the crisis. Specifically, job and employment insecurity for temporary workers are lower in labor markets that have stricter regulations on the use of temporary contracts, and these relationships became more pronounced after the economic crisis. There is more perceived insecurity in institutional settings where permanent workers are better protected; however, this relationship becomes more modest after the crisis in terms of employment insecurity. We speculate that this might indicate a narrowing of the divisions in the labor market since the levels of protection provided to permanent workers do not affect temporary workers’ perceptions of re-employment as much as they did in 2004. The NRR was more strongly and negatively related to employment insecurity in 2010, whereas the impact of CBC was broadly similar before and after the crisis.
Figure 4 shows that there is not much difference in the association between ALMP and economic security in the two time periods. Among temporary workers, stricter protection for permanent workers is associated with lower levels of economic security, but this relationship was weaker after the crisis. Difficulty in hiring and firing temporary workers had a similar impact on temporary workers’ economic security before and after the crisis: they are better off in countries with weaker restrictions on the use of temporary contracts. The effects of unemployment replacement and CBC rates on employees’ economic security weakened in 2010.
Finally, Figure 5 shows that there is not much difference in the association between ALMP and SWB, after we controlled for individual-level job and economic insecurity. Employment protection for temporary workers is not associated with their subjective well-being, as indicated by the flat lines for EPT. Stronger protections for permanent workers are associated with lower SWB among temporary workers, but this negative relationship became less prominent after the economic crisis. The unemployment replacement rate is positively related to SWB, but this effect, like that for CBC, was only slightly greater in 2010.
Taken as a whole, these results suggest that the economic crisis of 2008–2009 highlighted the importance of labor market policies such as ALMP and EPL for job and employment security, but that these policies had little additional association with well-being. This is not unexpected, as the use of only two time points strongly reduces the longitudinal variation (i.e., the within-country heterogeneity) in the institutional factors. This implies that the estimates concerning the role of single institutional characteristics rely heavily on cross-national variations. Our results are consistent with our argument that the associations between labor market policies, social welfare and worker power, on the one hand, and labor market insecurity and well-being on the other reflect structural changes associated with the transformation of employment relations over a longer period.
5. Discussion and Conclusions
How political, economic, and social institutions affect peoples’ work and non-work lives are fundamental issues in economic sociology and social stratification. In this article, we examined how selected labor market and social welfare protection institutions were related to differences in perceived labor market insecurity and in economic and subjective well-being. We found that there is substantial country-level variation in labor market insecurity, as well as in our two indicators of well-being—economic security and subjective well-being—after controlling for the relevant individual differences and country-level indicators related to the macro-economic environment.
Our multi-level analysis of country differences in Europe shows that the labor market and welfare institutions and policies, along with worker power in the form of collective bargaining, generally reduce labor market insecurity and enhance economic and subjective well-being. In particular, ALMPs are associated with less labor market insecurity (as well as greater economic security and SWB), while generous unemployment protections help to alleviate concerns about economic security. The associations involving EPL are more complex since they reflect two kinds of protections, one for regular workers and another for those who are employed on a temporary basis. Unemployment benefit generosity is generally associated with less labor market insecurity and with greater economic and subjective well-being. So, too, does the extent of CBC, our indicator of the power of workers to negotiate favorable terms in employment relations. Our findings also highlight the importance of an individual’s labor market insecurity in mediating the effects of institutional factors on individual well-being.
While the associations between the economic crisis on a country level of the institutional and individual outcomes vary, the two surveys did not seem to show strong differences in the association between institutions and individual outcomes. The weakening association of EPL for temporary workers with labor market insecurity after the economic crisis is the most prominent difference. We reiterate here that as we do not measure the economic crisis directly, any observed differences between the two time periods could also be due to a variety of other social, economic, and political factors.
Our analyses highlight the importance of considering the differences between countries in explaining the variations observed in individual level outcomes. They show further that the labor market and welfare system institutions varied in their ability to explain the cross-national differences in insecurity and well-being. EPT and CBC helped to explain the variation across countries in terms of job and employment insecurity that was unexplained by individual and macroeconomic variables.ALMPs explained more than half of the cross-national variation in economic security that was unexplained by individual and macroeconomic factors, followed by the CBC, which explained one-third of the variation. EPT and NRR were effective, but to a lesser degree, in explaining the variance in economic security Finally, for SWB, neither EPT nor NRR helped to explain cross-national variation, whereas ALMPs and CBC each explained about one-third of the unexplained cross-national variation.
Our results contribute to the growing empirical evidence regarding the importance of institutional differences when explaining cross-national differences in the nature and consequences of precarious work. However, our analysis barely scratches the surface of the complex patterns of relations among labor forces, employers, and the state which are suggested by neo-institutional theories such as the variety of capitalism power resources theories. In addition, while our models included controls for within-country differences in gender, education, family status, or organizational size, we did not examine these sub-groups in detail. Such analyses constitute important avenues for research.
European countries, along with advanced capitalist countries around the world, have had to respond to similar political and economic forces produced by an increasingly globalized and technologically driven economy, as well as to constraints on state budgets compelled by declines in economic growth and an aging labor force, among other trends. Hence, there has been a general liberalization of labor markets and a restructuring of social welfare protection systems that have transformed employment relations and increased the labor market and economic insecurity for many people. While these liberalizing trends are universal, however, the way in which they have affected individuals is cross-nationally variable, depending on the relative strength of workers and the nature of a particular country’s labor market and social welfare institutions. We have shown that ALMPs, unemployment benefits, and collective bargaining can reduce labor market insecurity and enhance well-being. These findings underscore the importance of institutions, often considerably, in terms of shaping and mediating the consequences of changing employment relations in Europe.
Author Contributions
Both authors have contributed equally to the manuscript. All authors have read and agreed to the published version of the manuscript.
Funding
This research received no external funding.
Data Availability Statement
Data used in this study are openly available in Norwegian Centre for Research Data, Norway—Data Archive and distributor of ESS data for ESS ERIC, doi:10.21338/NSD-ESS2-2004 and doi:10.21338/NSD-ESS5-2010.
Conflicts of Interest
The authors declare no conflict of interest.
Appendix A
Table A1.
Summary of the cross-national literature on institutional factors, labor market insecurity, and well-being.
Table A1.
Summary of the cross-national literature on institutional factors, labor market insecurity, and well-being.
| Study | Data Source | Analysis Method | Geographic Coverage | Definitions and Associations Found |
|---|---|---|---|---|
| Effects of ALMPs on labor market insecurity | ||||
| T. Berglund (2015) | EWCS 2010 | Multilevel models | 26 European countries | Increased expenditure on ALMP decreases the level of job insecurity. |
| Lűbke and Erlinghagen (2014) | ESS 2004 and 2010 | Multilevel models | 19 European countries | A decrease in ALMP expenditure is negatively associated with job insecurity; however, the current level of expenditure on ALMP does not affect job insecurity. |
| Chung and Oorschot (2011) | ESS 2008 | Multilevel models | 22 European countries | In countries with extensive ALMP measures, individuals are less likely to perceive employment insecurity. |
| Anderson and Pontusson (2007) | ISSP 1997 | Multilevel models | 15 OECD countries | Government spending on ALMP reduces labor market insecurity—one’s ability to find another job. |
| Effects of EPL on labor market insecurity | ||||
| L. Hipp (2016) | ISSP 2005 | Multilevel models | 23 countries | Dismissal protection (i.e., the former one-dimensional EPL index) increases cognitive job insecurity—whether one thinks that one’s job is secure if the share of temporary work is high in that country. |
| A. Balz (2017) | ESS 2004 and 2010 | Multilevel models | 17 to 22 European countries | The gap between temporary and permanent employees increased when (a) job security provisions within the employment protection legislation of a country were strong, and (b) when regulations on temporary contracts were strict. |
| T. Berglund (2015) | EWCS 2010 | Multilevel models | 26 European countries | No significant effect of the strictness of EPL on overall subjective job insecurity. However, temporary employees with insecure jobs may experience more insecurity with a stricter EPL. |
| Lűbke and Erlinghagen (2014) | ESS 2004 and 2010 | Multilevel models | 19 European countries | There is no significant association between the level of EPL with job insecurity. However, workers with temporary contracts benefit less from increased EPL than workers with unlimited contracts. |
| Esser and Olsen (2012) | ESS 2004 | Multilevel models | 19 European countries | No evidence that stricter EPL (measures as a single index) affects job insecurity. |
| Chung and Oorschot (2011) | ESS 2008 | Multilevel models | 22 European countries | There is an interaction effect between EPL for regular workers and permanent contracts, which is a positive, significant relationship. Having a permanent contract decreases the chance of feeling insecure about employment. |
| Clark and Postel-Vinay (2009) | ECHP, 1997 through 2001 | 2-step regression models | 12 European countries | Among temporary employees and permanent employees in the private sector, stricter EPL reduces the perceived risk of job loss. However, stricter EPL also, at the same time, increases unemployment duration (in other words, it reduces the outflow rate from unemployment). |
| Erlinghagen (2008) | ESS 2004 | Multilevel models | 17 European countries | Controlling for the long-term unemployment rate in a country, dismissal protection (i.e., the former one-dimensional EPL index) is not associated with perceived job insecurity. |
| Anderson and Pontusson (2007) | ISSP 1997 | Multilevel models | 15 OECD countries | Stricter EPL is associated with reduced cognitive job insecurity—the self-rated probability of losing one’s current job. |
| Effects of unemployment insurance on labor market insecurity | ||||
| L. Hipp (2016) | ISSP 2005 | Multilevel models | 23 countries | Unemployment assistance decreases affective job insecurity—workers’ worries about losing their jobs. |
| Berglund (2015) | EWCS 2010 | Multilevel models | 26 European countries | Increased expenditure on passive labor market policies reduces the level of job insecurity. |
| Chung and Oorschot (2011) | ESS 2008 | Multilevel models | 22 European countries | In countries with generous unemployment benefits, individuals are less likely to perceive employment insecurity. |
| Esser and Olsen (2012) | ESS 2004 | Multilevel models | 19 European countries | No evidence that the generosity of the unemployment benefit system affects job insecurity. |
| Clark and Postel-Vinay (2009) | ECHP, 1997 through 2001 | 2-step regression models | 12 European countries | Unemployment benefit insurance generosity is positively correlated with perceived job security. |
| Erlinghagen (2008) | ESS 2004 | Multilevel models | 17 European countries | When controlling for long-term unemployment rates in a country, social expenditure on unemployment insurance is not associated with perceived job insecurity. |
| Effects of collective bargaining arrangements on labor market insecurity | ||||
| Dixon et al. (2013) | Eurobarometer 2006 | Hierarchical linear models | 27 European countries | Perceived job and employment insecurity are generally greater in countries with lower worker unionization. |
| Esser and Olsen (2012) | ESS 2004 | Multilevel models | 19 European countries | Union density negatively affects job insecurity when introduced solely, and when tested for interaction effects with the unemployment rate. |
| Anderson and Pontusson (2007) | ISSP 1997 | Multilevel models | 15 OECD countries | Union membership is associated with decreased cognitive job insecurity (self-rated probability of losing one’s current job) but increased labor market insecurity (one’s ability to find another job). |
| Edlund and Grӧnlund (2008) | ESS 2004 | Multilevel models | 21 European countries | Trade union density is positively associated with employer–employee dependence (i.e., the difficulty of finding another job and the difficulty of the employer in replacing an employee). |
| Effects of unemployment insurance on SWB | ||||
| Sjöberg (2010) | ESS 2004 | Multilevel models | 21 European countries | Unemployment benefit generosity has a positive effect on employed individuals’ sense of well-being, especially on those who have limited economic resources or an insecure position in the labor market. |
| Di Tella and MacCulloch (2008) | Eurobarometer and GSS, 1975 to 1997 | Regression analysis | 12 OECD countries | By keeping the unemployment rate, income, and individual employment status constant, more generous benefits increase happiness. |
Source: authors’ compilation. Notes: ECHP: European Community Household Panel; ESS: European Social Survey, EWCS: European Working Conditions Survey; GSS: General Social Survey; ISSP: International Social Survey Program.

Figure A1.
Macro indicators and countries. Note: Nordic countries include Denmark, Finland, Norway, and Sweden. Continental countries include Belgium, Germany, and the Netherlands. Liberal countries include Great Britain and Ireland. Southern countries include Spain, France, and Portugal. Transitional countries include the Czech Republic, Estonia, Hungary, Poland, and Slovakia. Data source: European Social Survey.

Table A2.
Level-2 effects on labor market insecurity and well-being outcomes.
Table A2.
Level-2 effects on labor market insecurity and well-being outcomes.
| Job Insecurity | Employment Insecurity | Economic Security | SWB | |
|---|---|---|---|---|
| (1a) | (2a) | (3a) | (4a) | |
| Age | 0.07 *** (0.01) | −0.06 *** (0.01) | −0.09 *** (0.02) | −0.06 *** (0.01) |
| Age squared | −0.00 ** (0.00) | 0.00 *** (0.00) | 0.00 *** (0.00) | 0.00 *** (0.00) |
| Female | −0.00 *** (0.03) | 0.17 *** (0.04) | −0.10 ** (0.05) | 0.10 *** (0.02) |
| Illness/disability:Yes, to some extent | 0.04 (0.05) | 0.18 *** (0.05) | −0.48 *** (0.06) | −0.42 *** (0.03) |
| Illness/disability: Yes, a lot | 0.04 ** (0.12) | 0.66 *** (0.14) | −0.61 *** (0.15) | −0.98 *** (0.08) |
| 1st income decile (bottom) | 0.16 (0.11) | 0.18 (0.13) | −1.10 *** (0.12) | −0.44 *** (0.07) |
| 2nd income decile | 0.03 ** (0.09) | 0.19 * (0.10) | −0.87 *** (0.10) | −0.23 *** (0.06) |
| 3rd income decile | 0.14 * (0.08) | 0.25 *** (0.09) | −0.64 *** (0.09) | −0.14 *** (0.05) |
| 4th income decile | 0.01 (0.07) | 0.03 (0.08) | −0.16 * (0.09) | 0.09 ** (0.05) |
| 6th income decile | −0.11 * (0.07) | −0.07 (0.08) | 0.22 *** (0.08) | 0.14 *** (0.04) |
| 7th income decile | −0.21 *** (0.07) | −0.11 (0.08) | 0.67 *** (0.09) | 0.19 *** (0.04) |
| 8th income decile | −0.21 *** (0.07) | −0.03 (0.08) | 1.21 *** (0.10) | 0.27 *** (0.04) |
| 9th income decile | −0.25 *** (0.07) | −0.25 *** (0.08) | 1.15 *** (0.10) | 0.24 *** (0.04) |
| 10th income decile (top) | −0.35 *** (0.07) | −0.39 *** (0.08) | 1.55 *** (0.11) | 0.35 *** (0.04) |
| Log weekly hours | 0.02 (0.05) | −0.08 (0.05) | 0.14 ** (0.06) | −0.16 *** (0.03) |
| Firm size: 10–24 | 0.00 (0.05) | 0.04 (0.06) | −0.06 (0.07) | −0.03 (0.03) |
| Firm size: 25–99 | −0.05 (0.05) | 0.12 ** (0.05) | −0.09 (0.06) | 0.00 (0.03) |
| Firm size: 100–499 | 0.01 (0.05) | 0.26 *** (0.06) | −0.11 (0.07) | −0.03 (0.03) |
| Firm size: 500+ | 0.02 (0.06) | 0.31 *** (0.07) | 0.08 (0.09) | −0.08 ** (0.04) |
| Union member, currently | −0.01 (0.04) | 0.20 *** (0.05) | −0.02 (0.06) | 0.01 (0.03) |
| Union member, previously | 0.04 (0.05) | 0.25 *** (0.06) | −0.18 *** (0.06) | −0.05 (0.03) |
| Separated | −0.11 ** (0.13) | −0.27 * (0.15) | 0.01 (0.15) | −0.77 *** (0.08) |
| Divorced | −0.06 (0.06) | −0.22 *** (0.07) | −0.25 *** (0.07) | −0.45 *** (0.04) |
| Widow | −0.12 (0.12) | −0.05 (0.14) | −0.16 (0.14) | −0.56 *** (0.08) |
| Single | 0.05 (0.04) | −0.15 *** (0.05) | 0.26 *** (0.06) | −0.37 *** (0.03) |
| Lower secondary education | 0.07 (0.09) | 0.16 (0.10) | −0.01 (0.10) | −0.06 (0.06) |
| Upper secondary education | 0.03 (0.08) | 0.100.09) | 0.21 * (0.10) | −0.10 ** (0.05) |
| Post-secondary education | 0.03 (0.10) | −0.04 (0.12) | 0.44 *** (0.13) | −0.12 * (0.07) |
| Tertiary education | −0.26 *** (0.08) | −0.15 (0.10) | 0.70 *** (0.11) | −0.02 (0.05) |
| n | 20,030 | 20,030 | 20,030 | 20,030 |
| N | 17 | 17 | 17 | 17 |
| VPC | 0.13 | 0.10 | 0.21 | 0.17 |
Source: Authors’ calculations using the European Social Survey (2004, 2010). Notes: Three-level multi-level models where Level 1: Individual; Level 2: Country; Level 3: Survey year. Number of individuals: 20,030; number of countries: 17. VPC: variation partition coefficient. * Significantly different from zero at the 0.10 level, ** Significantly different from zero at the 0.05 level, *** Significantly different from zero at the 0.01 level. + Since the GDP spent on ALMP and NRR is adjusted for the annual unemployment rate, the yearly unemployment rate is not added as a Level-2 control in Models 3e and 3g. All Level-2 variables are standardized using z-scores. Standard errors are shown in parentheses.
Notes
| 1 | The countries included in our analysis are: Belgium, the Czech Republic, Germany, Denmark, Estonia, Finland, France, Hungary, Ireland, the Netherlands, Norway, Poland, Portugal, Sweden, Slovakia, Spain, and the United Kingdom. |
| 2 | See the OECD (2013c) module and discussion of measuring SWB. |
| 3 | Here, we limit the analysis to temporary workers only, which helps to visualize the predicted probabilities of a three-way interaction term between EPLs, contract type, and survey year. |
References
- Anderson, Christopher J., and Jonas Pontusson. 2007. Workers, worries and welfare states: Social protection and job insecurity in 15 OECD countries. European Journal of Political Research 46: 211–35. [Google Scholar] [CrossRef]
- Balz, Anne. 2017. Cross-National Variations in the Security Gap: Perceived Job Insecurity among Temporary and Permanent Employees and Employment Protection Legislation. European Sociological Review 33: 675–92. [Google Scholar] [CrossRef]
- Bell, Daniel. 1973. The Coming of Post-Industrial Society: A Venture in Social Forecasting. New York: Basic Books. [Google Scholar]
- Berglund, Tomas. 2015. Flexicurity, job insecurity, and well-being in European labor markets. In Sustainable Working Lives. Managing Work Transitions and Health Throughout the Life Course. Aligning Perspectives on Health, Safety and Well-Being. Edited by Jukka Vuori, Roland Blonk and Richard H. Price. Dordrecht: Springer, pp. 145–67. [Google Scholar]
- Boeri, Tito, and Jan Van Ours. 2008. The Economics of Imperfect Labor Markets. Princeton: Princeton University Press. [Google Scholar]
- Burchell, Brendan. 2011. A temporal comparison of the effects of unemployment and job insecurity on wellbeing. Sociological Research Online 16: 66–78. Available online: https://journals.sagepub.com/doi/10.5153/sro.2277 (accessed on 29 March 2022). [CrossRef]
- Burgard, Sarah A., Jennie E. Brand, and James S. House. 2009. Perceived Job Insecurity and Worker Health in the United States. Social Science and Medicine 69: 777–85. [Google Scholar] [CrossRef] [PubMed]
- Chung, Heejung, and Wim van Oorschot. 2011. Institutions versus Market Forces: Explaining the Employment Insecurity of European Individuals During (the Beginning of) the Financial Crisis. Journal of European Social Policy 21: 287–301. [Google Scholar] [CrossRef]
- Clark, Andrew, and Conchita D’Ambrosio. 2014. Attitudes to Income Inequality: Experimental and Survey Evidence. Working Paper No. 8136. Bonn: Institute for the Study of Labor. [Google Scholar]
- Clark, Andrew, and Fabien Postel-Vinay. 2009. Job Security and Job Protection. Oxford Economic Papers 61: 207–39. [Google Scholar] [CrossRef]
- De Witte, Hans. 1999. Job insecurity and psychological well-being: Review of the literature and exploration of some unresolved issues. European Journal of Work and Organizational Psychology 8: 155–77. [Google Scholar] [CrossRef]
- Di Tella, Rafael, and Robert J. MacCulloch. 2008. Gross national happiness as an answer to the Easterlin Paradox? Journal of Development Economics 86: 22–42. [Google Scholar] [CrossRef]
- Dickerson, Andrew, and Francis Green. 2012. Fears and Realisations of Employment Insecurity. Labour Economics 19: 198–210. [Google Scholar] [CrossRef]
- Diener, Ed, Shigehiro Oishi, and Richard E. Lucas. 2003. Personality, culture and subjective well-being: Emotional and cognitive evaluations of life. Annual Review of Psychology 54: 403–25. [Google Scholar] [CrossRef]
- Dixon, Jeffrey C., Andrew S. Fullerton, and Deanna L. Robertson. 2013. Cross-National Differences in Workers’ Perceived Job, Labour Market, and Employment Insecurity in Europe: Empirical Tests and Theoretical Extensions. European Sociological Review 29: 1053–67. [Google Scholar] [CrossRef]
- Edlund, Jonas, and Anne Grӧnlund. 2008. Protection of mutual interests? Employment protection and skill formation in different labour market regimes. European Journal of Industrial Relations 14: 245–64. [Google Scholar] [CrossRef]
- Erlinghagen, Marcel. 2008. Self-Perceived Job Insecurity and Social Context: A Multilevel Analysis of 17 European Countries. European Sociological Review 24: 183–97. [Google Scholar] [CrossRef]
- Esping-Andersen, Gϕsta. 1990. The Three Worlds of Welfare Capitalism. Princeton: Princeton University Press. [Google Scholar]
- Esser, Ingrid, and Karen M. Olsen. 2012. Perceived Job Quality: Autonomy and Job Security within a Multi-level Framework. European Sociological Review 28: 443–54. [Google Scholar] [CrossRef]
- European Social Survey. 2004. Round 2 Data. Data File Edition 3.6. NSD—Norwegian Centre for Research Data, Norway—Data Archive and Distributor of ESS Data for ESS ERIC. Available online: https://ess-search.nsd.no/en/study/5296236e-b5ee-40dc-a554-81ea09211d1d (accessed on 29 March 2022). [CrossRef]
- European Social Survey. 2010. Round 5 Data. Data File Edition 3.4. NSD—Norwegian Centre for Research Data, Norway—Data Archive and distributor of ESS Data for ESS ERIC. Available online: https://ess-search.nsd.no/en/study/fd0dc7b6-3d5a-42d4-ad46-7a78e44e3963 (accessed on 29 March 2022). [CrossRef]
- Ferrer-i-Carbonell, Ada, and Xavier Ramos. 2012. Inequality and Happiness: A Survey. GINI Discussion Paper 38. Amsterdam: Amsterdam Institute for Advanced Labour Studies. [Google Scholar]
- Festinger, Leon. 1954. A theory of social comparison processes. Human Relations 7: 117–40. [Google Scholar] [CrossRef]
- Glavin, Paul, and Marisa Young. 2017. Insecure people in insecure places: The influence of regional unemployment on workers’ reactions to the threat of job loss. Journal of Health and Social Behavior 58: 232–52. [Google Scholar] [CrossRef]
- Green, Francis. 2009. Subjective Employment Insecurity Around the World. Cambridge Journal of Regions, Economy and Society 2: 343–63. [Google Scholar] [CrossRef]
- Greenhalgh, Leonard, and Zehava Rosenblatt. 1984. Job Insecurity: Toward Conceptual Clarity. Academy of Management Review 9: 438–48. [Google Scholar] [CrossRef]
- Hall, Peter A., and David Soskice, eds. 2001. Varieties of Capitalism: The Institutional Foundations of Comparative Advantage. Oxford: Oxford University Press. [Google Scholar]
- Hipp, Lena. 2016. Insecure times? Workers’ Perceived Job and Labor Market Security in 23 OECD Countries. Social Science Research 60: 1–14. [Google Scholar] [CrossRef]
- Howell, David R., and Arne L. Kalleberg. 2019. Declining Job Quality in the United States: Explanations and Evidence. RSF: Russell Sage Foundation Journal of the Social Sciences: Changing Job Quality: The Rise of Low-Wage Jobs and Nonstandard Work Arrangements 5: 1–53. [Google Scholar] [CrossRef]
- Inanc, Hande. 2018. Unemployment, temporary work and subjective well-being: The gendered effect of spousal labor market insecurity. American Sociological Review 83: 536–66. [Google Scholar] [CrossRef]
- Kalleberg, Arne L. 2018. Precarious Lives: Job Insecurity and Well-Being in Rich Democracies. Cambridge: Polity. [Google Scholar]
- Kalleberg, Arne L., and Steven P. Vallas. 2018. Probing Precarious Work: Theory, Research, and Politics. In Precarious Work: Causes, Characteristics, and Consequences. Edited by Arne L. Kalleberg and Steven P. Vallas. Volume 31 of Research in the Sociology of Work. Bingley: Emerald, pp. 1–30. [Google Scholar]
- Kerr, Clark, John T. Dunlop, Frederick H. Harbison, and Charles A. Myers. 1960. Industrialism and Industrial Man. Cambridge: Harvard University Press. [Google Scholar]
- Korpi, Walter. 1985. Developments in the Theory of Power and Exchange. Sociological Theory 3: 31–45. [Google Scholar] [CrossRef]
- Lam, Jack, Wen Fan, and Phyllis Moen. 2014. Is insecurity worse for well-being in turbulent times? Society and Mental Health 4: 55–73. [Google Scholar] [CrossRef] [PubMed]
- Lűbke, Christiane, and Marcel Erlinghagen. 2014. Self-perceived Job insecurity Across Europe over Time: Does Changing Context Matter? Journal of European Social Policy 24: 319–36. [Google Scholar] [CrossRef]
- Manski, Charles, and John D. Straub. 2000. Worker perceptions of job insecurity in the mid-1990s: Evidence from the survey of economic expectations. Journal of Human Resources 35: 447–79. [Google Scholar] [CrossRef]
- OECD. 2011. Economic Policy Reforms 2011: Going for Growth. Chapter 3 Structural policy indicators. Paris: OECD Publishing. [Google Scholar] [CrossRef]
- OECD. 2012. Economic Policy Reforms 2012: Going for Growth. Chapter 3 Structural policy indicators. Paris: OECD Publishing. [Google Scholar] [CrossRef]
- OECD. 2013a. “Strictness of Employment Protection” Employment Protection Database. Available online: https://stats.oecd.org/Index.aspx?DataSetCode=EPL_OV (accessed on 26 April 2019).
- OECD. 2013b. Economic Policy Reforms 2013: Going for Growth. Chapter 4 Structural Policy Indicators. Paris: OECD Publishing. [Google Scholar] [CrossRef]
- OECD. 2013c. OECD Guidelines on Measuring Subjective Well-Being. Paris: OECD Publishing. [Google Scholar] [CrossRef]
- OECD. 2015. Unemployment as a percentage of civilian labour force. In OECD Labour Force Statistics 2014. Paris: OECD Publishing. [Google Scholar] [CrossRef]
- OECD. 2016. “Key Indicators” Benefits, Taxes, and Wages Database. Available online: https://stats.oecd.org/Index.aspx?DataSetCode=TAXBEN (accessed on 14 March 2019).
- OECD. 2017a. “Public Expenditure and Participant Stocks on LMP” Labour Market Programmes Database. Available online: https://stats.oecd.org/index.aspx?DataSetCode=LMPEXP (accessed on 30 September 2019).
- OECD. 2017b. “P90/P10 Income Decile Ratio”. OECD Income Distribution Database (IDD). Available online: http://stats.oecd.org/Index.aspx?DataSetCode=IDD (accessed on 20 January 2019).
- Oishi, Shigehiro, Selin Kesebir, and Ed Diener. 2011. Income inequality and happiness. Psychological Science 22: 1095–100. [Google Scholar] [CrossRef]
- Osberg, Lars, and A. Sharpe. 2014. Measuring Economic Insecurity in Rich and Poor Nations. Review of Income and Wealth Series 60: S53–S76. [Google Scholar] [CrossRef]
- Pichler, Florian. 2006. Subjective Quality of Life Among Young Europeans. Feeling Happy but Who Knows Why? Social Indicators Research 75: 419–44. [Google Scholar] [CrossRef]
- Polavieja, Javier G. 2003. Temporary Contracts and Labour Market Segmentation in Spain: An Employment-Rent Approach. European Sociological Review 19: 501–17. [Google Scholar] [CrossRef]
- Scherer, Stefani. 2009. The Social Consequences of Insecure Jobs. Social Indicators Research 93: 527–47. [Google Scholar] [CrossRef]
- Sjöberg, Ola. 2010. Social Insurance as a Collective Resource: Unemployment Benefits, Job Insecurity and Subjective Well-being in a Comparative Perspective. Social Forces 88: 1281–304. [Google Scholar] [CrossRef]
- Standing, Guy. 2011. The Precariat: The New Dangerous Class. New York: Bloomsbury. [Google Scholar]
- Sverke, Magnus, and Johnny Hellgren. 2002. The nature of job insecurity: Understanding employment uncertainty on the brink of a new millennium. Applied Psychology: An International Review 51: 23–42. [Google Scholar] [CrossRef]
- Tegund, Alina. 2014. Uncertainty about Jobs Has a Ripple Effect. New York Times. May 16. Available online: https://www.nytimes.com/2014/05/17/your-money/uncertainty-about-jobs-has-a-ripple-effect.html?_r=0 (accessed on 27 December 2020).
- Venn, Danielle. 2009. Legislation, Collective Bargaining and Enforcement: Updating the OECD Employment Protection Indicators. Paris: OECD Publishing. Available online: http://www.oecd.org/employment/emp/43116624.pdf (accessed on 2 October 2020).
- Viebrock, Elke, and Jochen Clasen. 2009. Flexicurity and Welfare Reform: A Review. Socio-Economic Review 7: 305–31. [Google Scholar] [CrossRef]
- Vosko, Leah F. 2010. Managing the Margins: Gender, Citizenship, and the International Regulation of Precarious Work. Oxford: Oxford University Press. [Google Scholar]


Publisher’s Note: MDPI stays neutral with regard to jurisdictional claims in published maps and institutional affiliations. |
© 2022 by the authors. Licensee MDPI, Basel, Switzerland. This article is an open access article distributed under the terms and conditions of the Creative Commons Attribution (CC BY) license (https://creativecommons.org/licenses/by/4.0/).