
Dimensions That Influence the Creation of Brand Value of a Music Event and Its Influence on Attendee Satisfaction


Abstract
:1. Introduction
Theoretical Framework
2. Materials and Methods
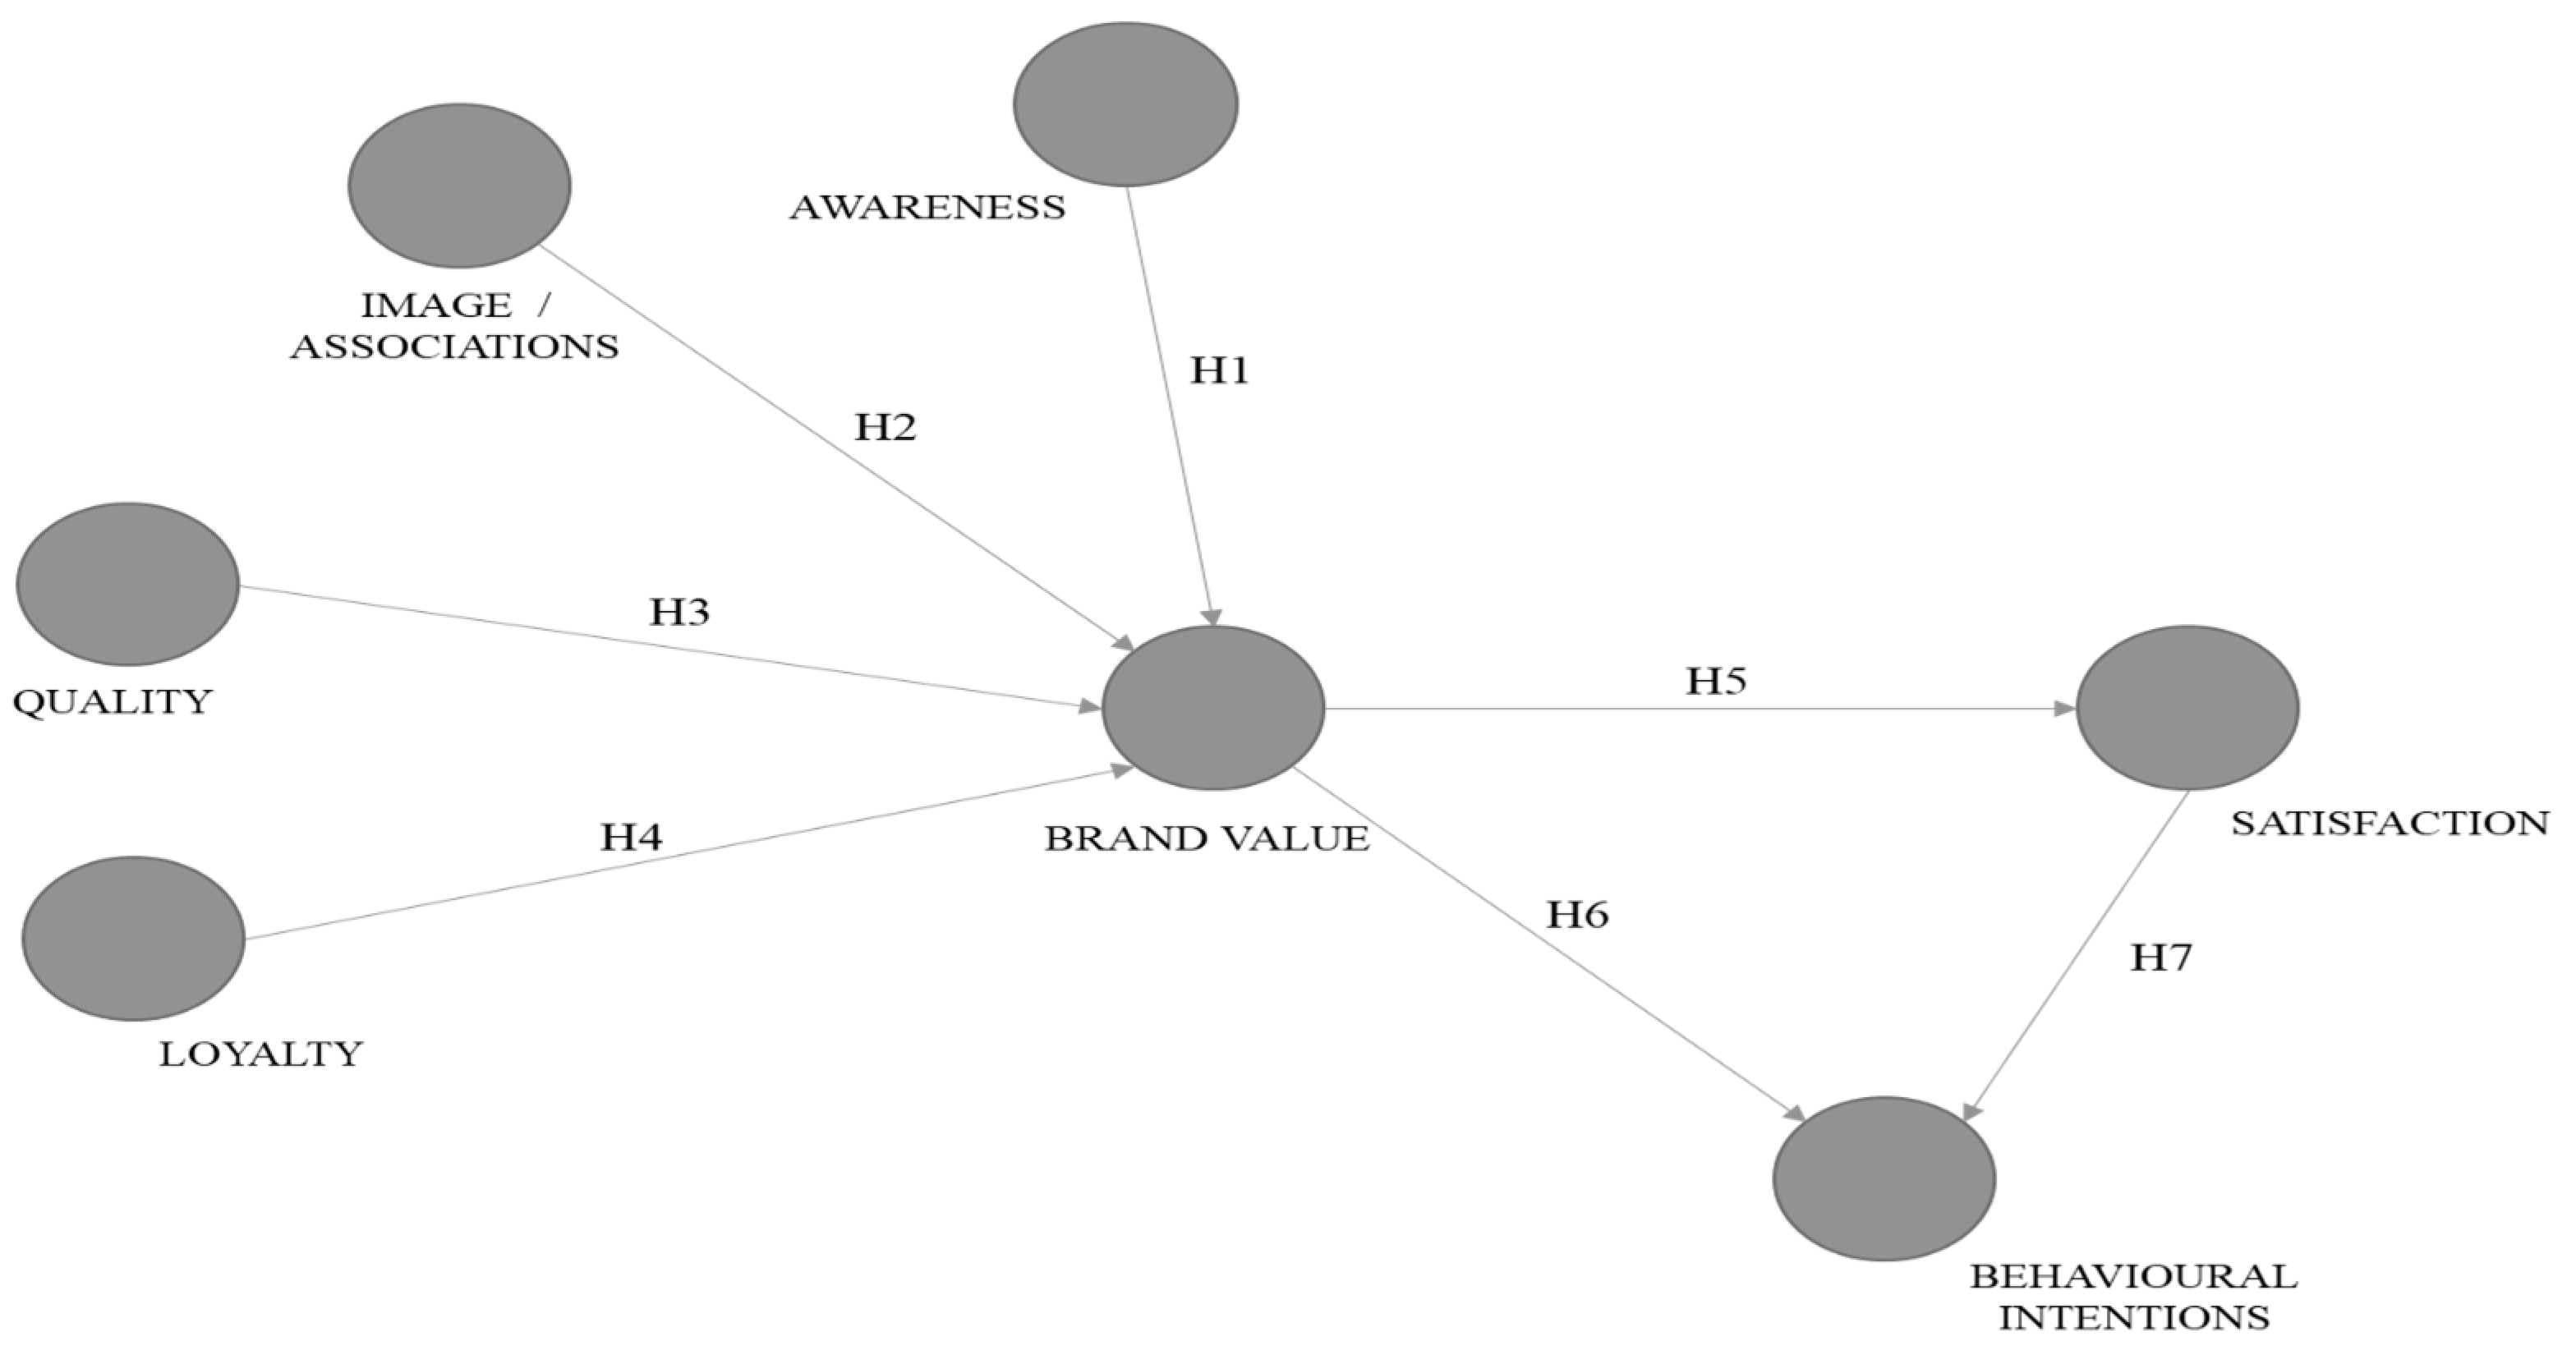
3. Results
4. Discussion
5. Conclusions
Author Contributions
Funding
Institutional Review Board Statement
Informed Consent Statement
Data Availability Statement
Conflicts of Interest
References
- Aaker, David A. 1996. Measuring brand equity across products and markets. California Management Review 38: 102. [Google Scholar] [CrossRef] [Green Version]
- Bailey, Rob, and Stephen Ball. 2006. An exploration of the meanings of hotel brand equity. The Service Industries Journal 26: 15–38. [Google Scholar] [CrossRef]
- Berry, Leonard L. 2000. Cultivating service brand equity. Journal of the Academy of Marketing Science 28: 128–37. [Google Scholar] [CrossRef]
- Bruwer, Johan. 2014. Service quality perception and satisfaction: Buying behaviour prediction in an Australian Festivalscape. International Journal of Tourism Research 16: 76–86. [Google Scholar] [CrossRef]
- Camarero, Carmen, María José Garrido, and Eva Vicente. 2010. Components of art exhibition brand equity for internal and external visitors. Tourism Management 31: 495–504. [Google Scholar] [CrossRef]
- Carmines, Edward G., and Richard A. Zeller. 1979. Reliability and Validity Assessment. Thousand Oaks: Sage Publications. [Google Scholar]
- Castro, Carlos Pérez. 2008. Valoración y evaluación de marcas: Medir para crear valor. Cambridge: Harvard University. Bilbao: Grupo Planeta (GBS). [Google Scholar]
- Chang, Hsin Hsin, and Ya Ming Liu. 2009. The impact of brand equity on brand preference and purchase intentions in the service industries. The Service Industries Journal 29: 1687–706. [Google Scholar] [CrossRef]
- Chin, Wynne W. 1998. The partial least squares approach to structural equation modeling. Modern Methods for Business Research 295: 295–336. [Google Scholar]
- Choo, Hyungsuk, Kwangho Ahn, and James F. Petrick. 2016. An integrated model of festival revisit intentions: Theory of planned behavior and festival quality/satisfaction. International Journal of Contemporary Hospitality Management 28: 818–38. [Google Scholar] [CrossRef]
- Cohen, Jacob. 1988. Statistical Power Analysis for the Behavioral Sciences, 2nd ed. Hillsdale: Erlbaum. [Google Scholar]
- Croes, Robertico, and Seung Hyun Lee. 2015. Women at a music festival: Biological sex defining motivation and behavioral intentions. Event Management 19: 275–89. [Google Scholar] [CrossRef] [Green Version]
- Ding, Hai-Meng, and Kuang-Peng Hung. 2021. The antecedents of visitors’ flow experience and its influence on memory and behavioral intentions in the music festival context. Journal of Destination Marketing & Management 19: 100551. [Google Scholar]
- Evermann, Joerg, and Mary Tate. 2014. Comparing out-of-sample predictive ability of PLS, covariance, and regression models. Paper presented at the 35th International Conference on Information Systems, Auckland, New Zealand, December 14–17. [Google Scholar]
- Falk, R. Frank, and Nancy B. Miller. 1992. A Primer for Soft Modeling. Akron: University of Akron Press. [Google Scholar]
- Fornell, Claes, and David F. Larcker. 1981. Evaluating structural equation models with unobservable variables and measurement error. Journal of Marketing Research 18: 39–50. [Google Scholar] [CrossRef]
- Henseler, Jörg, Christian M. Ringle, and Marko Sarstedt. 2015. A new criterion for assessing discriminant validity in variance-based structural equation modeling. Journal of the Academy of marketing Science 43: 115–35. [Google Scholar] [CrossRef] [Green Version]
- Horng, Jeou-Shyan, Chih-Hsing Liu, Hsin-Yu Chou, and Chang-Yen Tsai. 2012. Understanding the impact of culinary brand equity and destination familiarity on travel intentions. Tourism Management 33: 815–24. [Google Scholar] [CrossRef]
- Hossien, Emari, Jafari Ali, and Mogaddam Mehdi. 2012. The mediatory impact of brand loyalty and brand image on brand equity. African Journal of Business Management 6: 5692–701. [Google Scholar] [CrossRef]
- Huang, Rong, and Emine Sarigöllü. 2014. How brand awareness relates to market outcome, brand equity, and the marketing mix. In Fashion Branding and Consumer Behaviors. Berlin and Heidelberg: Springer, pp. 113–32. [Google Scholar]
- Jago, Leo, Laurence Chalip, Graham Brown, Trevor Mules, and Shameem Ali. 2003. Building events into destination branding: Insights from experts. Event Management 8: 3–14. [Google Scholar] [CrossRef]
- Keller, Kevin Lane. 1993. Conceptualizing, measuring, and managing customer-based brand equity. Journal of Marketing 57: 1–22. [Google Scholar] [CrossRef]
- Kim, Ji-Hern, and Yong J. Hyun. 2011. A model to investigate the influence of marketing-mix efforts and corporate image on brand equity in the IT software sector. Industrial Marketing Management 40: 424–38. [Google Scholar] [CrossRef]
- Kim, Jiun. 2015. A Study on the Invigoration Characteristics (Service Quality, Satisfaction, and Brand Value) of Gangneung Danoje Festival-With a Focus on the Visitors to 2014 Gangneung Danoje Festival. Review of Integrative Business and Economics Research 4: 317. [Google Scholar]
- Kim, Kyung Hoon, Kang Sik Kim, Dong Yul Kim, Jong Ho Kim, and Suk Hou Kang. 2008. Brand equity in hospital marketing. Journal of Business Research 1: 75–82. [Google Scholar] [CrossRef]
- Kumar, Ravi Shekhar, Satyabhusan Dash, and Prem Chandra Purwar. 2013. The nature and antecedents of brand equity and its dimensions. Marketing Intelligence & Planning 31: 41–159. [Google Scholar]
- Leenders, Mark A. A. M. 2010. The relative importance of the brand of music festivals: A customer equity perspective. Journal of Strategic Marketing 18: 291–301. [Google Scholar] [CrossRef]
- Lee, Taehwee, Gi-Tae Yeo, and Vinh V. Thai. 2014. Structural analysis of port brand equity using structural equation modeling. The Asian Journal of Shipping and Logistics 30: 349–72. [Google Scholar] [CrossRef] [Green Version]
- Lin, Hsing-Hui. 2011. A multidimensional customer-based brand equity and its application to religious events: The case of Mazu. Ph.D. thesis, Texas Tech University, Lubbock, TX, USA. [Google Scholar]
- Llopis-Amorós, Maria-Pilar, Irene Gil-Saura, and María Eugenia Ruiz Molina. 2018. The role of marketing communications in generating brand equity for an event. Event Management 22: 825–48. [Google Scholar] [CrossRef]
- Llopis-Amorós, Maria-Pilar, Irene Gil-Saura, María Eugenia Ruiz-Molina, and Maria Fuentes-Blasco. 2019. Social media communications and festival brand equity: Millennials vs Centennials. Journal of Hospitality and Tourism Management 40: 134–44. [Google Scholar] [CrossRef]
- Manthiou, Aikaterini, Juhee Kang, and Thomas Schrier. 2014. A visitor-based brand equity perspective: The case of a public festival. Tourism Review 69: 264–83. [Google Scholar] [CrossRef]
- Mason, Michela C., and Adriano Paggiaro. 2012. Investigating the role of festivalscape in culinary tourism: The case of food and wine events. Tourism Management 33: 1329–36. [Google Scholar] [CrossRef]
- Nam, Janghyeon, Yuksel Ekinci, and Georgina Whyatt. 2011. Brand equity, brand loyalty and consumer satisfaction. Annals of Tourism Research 38: 1009–30. [Google Scholar] [CrossRef]
- Nunnally, Jum C., and Ira H. Bernstein. 1993. Cognitive, Affective and Attribute Bases of the Satisfaction Response. Journal of Consumer Research 20: 418–30. [Google Scholar]
- Oh, Haemoon, and Cathy H. C. Hsu. 2014. Assessing equivalence of hotel brand equity measures in cross-cultural contexts. International Journal of Hospitality Management 36: 156–66. [Google Scholar] [CrossRef]
- Palacio, B., J. Martín, and M. Monroy. 2008. Importancia del valor de marca en la satisfacción y lealtad de los clientes en el mercado industrial. Selección de Investigaciones Empresariales 7: 63–82. [Google Scholar]
- Ravasi, Davide, Violina Rindova, Michael Etter, and Joep Cornelissen. 2018. The formation of organizational reputation. Academy of Management Annals 12: 574–99. [Google Scholar] [CrossRef]
- Sasmita, Jumiati, and Norazah Mohd Suki. 2015. Young consumers’ insights on brand equity: Effects of brand association, brand loyalty, brand awareness, and brand image. International Journal of Retail & Distribution Management 43: 276–92. [Google Scholar]
- Šerić, Maja, Irene Gil-Saura, and María Eugenia Ruiz-Molina. 2014. How can integrated marketing communications and advanced technology influence the creation of customer-based brand equity? Evidence from the hospitality industry. International Journal of Hospitality Management 39: 144–56. [Google Scholar] [CrossRef]
- Shmueli, Galit, Marko Sarstedt, Joseph F. Hair, Jun-Hwa Cheah, Hiram Ting, Santha Vaithilingam, and Christian M. Ringle. 2019. Predictive model assessment in PLS-SEM: Guidelines for using PLSpredict. European Journal of Marketing 53: 2322–47. [Google Scholar] [CrossRef]
- Tanford, Sarah, and Shinyong Jung. 2017. Festival attributes and perceptions: A meta-analysis of relationships with satisfaction and loyalty. Tourism Management 61: 209–20. [Google Scholar] [CrossRef]
- Yan, Qi, Hanqin Zhang, and Mimi Li. 2012. Programming quality of festivals: Conceptualization, measurement, and relation to consequences. International Journal of Contemporary Hospitality Management 24: 653–73. [Google Scholar] [CrossRef]
- Yasin, Norjaya Mohd, Mohd Nasser Noor, and Osman Mohamad. 2007. Does image of country-of-origin matter to brand equity? Journal of Product & Brand Management 16: 38–48. [Google Scholar]
- Yoo, Boonghee, and Naveen Donthu. 2001. Developing and validating a multidimensional consumer-based brand equity scale. Journal of Business Research 52: 1–14. [Google Scholar] [CrossRef]
- Yoo, Boonghee, Naveen Donthu, and Sungho Lee. 2000. An examination of selected marketing mix elements and brand equity. Journal of the Academy of Marketing Science 28: 195–211. [Google Scholar] [CrossRef]
- Yoon, Yoo-Shik, Jin-Soo Lee, and Choong-Ki Lee. 2010. Measuring festival quality and value affecting visitors’ satisfaction and loyalty using a structural approach. International Journal of Hospitality Management 29: 335–42. [Google Scholar] [CrossRef]


| Universe | Population attending |
| Geographical area | Seville, Spain |
| Method of data collection | Personal survey with structured questionnaire |
| Sampling procedure | Non-probabilistic convenience |
| Sample size | 150 valid questionnaires |
| Fieldwork | 20–21 May 2022 |
| Scales (Likert 5 points) | Motivations Awareness of the festival Image/associations of the festival Perceived quality of the festival Loyalty to the festival Overall brand value of the festival Satisfaction with the festival Post-festival behavioural intentions |
| Statistics software | IBM SPSS Statistics, SmartPLS |
| INDICATOR | Loadings |
|---|---|
| Quality1 | 0.827 |
| Quality2 | 0.807 |
| Quality3 | 0.846 |
| Quality4 | 0.802 |
| Quality5 | 0.712 |
| Quality6 | 0.733 |
| Image1 | 0.784 |
| Image2 | 0.843 |
| Image3 | 0.856 |
| Image4 | 0.836 |
| Behinten1 | 0.814 |
| Behinten2 | 0.330 |
| Behinten3 | 0.841 |
| Behinten4 | 0.792 |
| Behinten5 | 0.783 |
| Behinten6 | 0.661 |
| Behinten7 | 0.524 |
| Loyalty1 | 0.821 |
| Loyalty2 | 0.914 |
| Loyalty3 | 0.868 |
| Awareness1 | 0.904 |
| Awareness2 | 0.904 |
| Awareness3 | 0.849 |
| Awareness4 | 0.697 |
| Satisf1 | 0.830 |
| Satisf2 | 0.788 |
| Satisf3 | 0.874 |
| Satisf4 | 0.856 |
| Satisf5 | 0.875 |
| Brandvalue1 | 0.859 |
| Brandvalue2 | 0.920 |
| Brandvalue3 | 0.927 |
| Brandvalue4 | 0.921 |
| Construct | Cronbach’s Alpha | Composite Reliability (CR) | Average Variance Extracted (AVE) |
|---|---|---|---|
| Awareness | 0.859 | 0.906 | 0.710 |
| Image/associations | 0.852 | 0.899 | 0.690 |
| Quality | 0.878 | 0.908 | 0.623 |
| Loyalty | 0.836 | 0.902 | 0.754 |
| Satisfaction | 0.900 | 0.926 | 0.715 |
| Behavioural intentions | 0.849 | 0.898 | 0.690 |
| Brand value | 0.928 | 0.949 | 0.823 |
| Awareness | Behavioural Intentions | Brand Value | Image/Associations | Loyalty | Quality | Satisfaction | |
|---|---|---|---|---|---|---|---|
| Awareness | 0.843 | ||||||
| Behavioural intentions | 0.457 | 0.830 | |||||
| Brand value | 0.519 | 0.560 | 0.907 | ||||
| Image/associations | 0.468 | 0.432 | 0.541 | 0.830 | |||
| Loyalty | 0.454 | 0.592 | 0.698 | 0.582 | 0.868 | ||
| Quality | 0.619 | 0.597 | 0.644 | 0.644 | 0.596 | 0.789 | |
| Satisfaction | 0.474 | 0.805 | 0.535 | 0.393 | 0.468 | 0.579 | 0.845 |
| Awareness | Behavioural Intentions | Brand Value | Image/Associations | Loyalty | Quality | Satisfaction | |
|---|---|---|---|---|---|---|---|
| Awareness | |||||||
| Behavioural intentions | 0.530 | ||||||
| Brand value | 0.581 | 0.644 | |||||
| Image/associations | 0.541 | 0.506 | 0.595 | ||||
| Loyalty | 0.538 | 0.722 | 0.793 | 0.672 | |||
| Quality | 0.708 | 0.699 | 0.708 | 0.727 | 0.694 | ||
| Satisfaction | 0.542 | 0.763 | 0.582 | 0.440 | 0.540 | 0.652 |
| Coefficients Path | T-Value (Bootstrap) | Hypotheses | f2 | |
|---|---|---|---|---|
| H1: Awareness → Global Brand Value | 0.126 * | 1.979 | Accepted | 0.023 |
| H2: Image/Association → Global Brand Value | 0.045 | 0.560 | Non-Accepted | 0.003 |
| H3: Perceived Quality → Global Brand Value | 0.265 ** | 3.038 | Accepted | 0.070 |
| H4: Loyalty → Global Brand Value | 0.456 *** | 4.232 | Accepted | 0.283 |
| H5: Global Brand Value → Satisfaction | 0.536 *** | 8.257 | Accepted | 0.401 |
| H6: Global Brand Value → Behavioural Intentions | 0.143 ** | 2.810 | Accepted | 0.058 |
| H7: Satisfaction → Behavioural Intentions | 0.779 *** | 19.727 | Accepted | 1.707 |
| Original Sample (O) | Sample Mean (M) | Standard Deviation (STDEV) | T Statistics (|O/STDEV|) | p Values | |
|---|---|---|---|---|---|
| Loyalty →brand value → satisfaction → behavioural intentions | 0.190 | 0.191 | 0.048 | 3.979 | 0.000 |
| Brand value → satisfaction → behavioural intentions | 0.416 | 0.417 | 0.051 | 8.234 | 0.000 |
| Quality → brand value → satisfaction → behavioural intentions | 0.110 | 0.110 | 0.042 | 2.633 | 0.008 |
| Image/associations → brand value → satisfaction | 0.024 | 0.023 | 0.046 | 0.532 | 0.595 |
| Awareness → brand value → satisfaction | 0.068 | 0.070 | 0.037 | 1.840 | 0.066 |
| Awareness → brand value → behavioural intentions | 0.018 | 0.018 | 0.011 | 1.650 | 0.099 |
| Loyalty → brand value → behavioural intentions | 0.066 | 0.068 | 0.031 | 2.123 | 0.034 |
| Awareness → brand value → satisfaction → behavioural intentions | 0.053 | 0.054 | 0.029 | 1.833 | 0.067 |
| Loyalty → brand value → satisfaction | 0.244 | 0.246 | 0.063 | 3.877 | 0.000 |
| Image/associations → brand value → satisfaction → behavioural intentions | 0.019 | 0.018 | 0.035 | 0.533 | 0.594 |
| Quality → brand value → behavioural intentions | 0.038 | 0.037 | 0.017 | 2.200 | 0.028 |
| Quality → brand value → satisfaction | 0.142 | 0.142 | 0.053 | 2.675 | 0.007 |
| Image/associations → brand value → behavioural intentions | 0.007 | 0.006 | 0.013 | 0.520 | 0.603 |
| R2 | |
|---|---|
| Satisfaction | 0.287 |
| Behavioural intentions | 0.747 |
| Global brand value | 0.579 |
| Q2 Predict | RMSE | MAE | ||||
| Behavioural intentions | 0.375 | 0.803 | 0.608 | |||
| Brand value | 0.538 | 0.689 | 0.507 | |||
| Satisfaction | 0.297 | 0.854 | 0.635 | |||
| Q2 Predict | PLS-SEM_RMSE | PLS-SEM_MAE | LM_RMSE | LM_MAE | ||
| Behinten1 | 0.225 | 0.968 | 0.765 | 1.014 | 0.806 | |
| Behinten3 | 0.263 | 0.934 | 0.733 | 0.960 | 0.770 | |
| Behinten4 | 0.305 | 1.016 | 0.814 | 1.006 | 0.795 | |
| Behinten5 | 0.249 | 1.015 | 0.815 | 1.019 | 0.782 | |
| Brandvalue1 | 0.418 | 0.939 | 0.738 | 1.025 | 0.798 | |
| Brandvalue2 | 0.465 | 0.890 | 0.678 | 0.951 | 0.743 | |
| Brandvalue3 | 0.405 | 0.927 | 0.713 | 0.989 | 0.773 | |
| Brandvalue4 | 0.473 | 0.837 | 0.629 | 0.892 | 0.684 | |
| Satisf1 | 0.228 | 1.085 | 0.877 | 1.098 | 0.886 | |
| Satisf2 | 0.156 | 1.049 | 0.846 | 1.055 | 0.824 | |
| Satisf3 | 0.228 | 0.918 | 0.705 | 0.916 | 0.721 | |
| Satisf4 | 0.221 | 1.001 | 0.776 | 1.016 | 0.799 | |
| Satisf5 | 0.217 | 0.924 | 0.700 | 0.911 | 0.713 | |
Disclaimer/Publisher’s Note: The statements, opinions and data contained in all publications are solely those of the individual author(s) and contributor(s) and not of MDPI and/or the editor(s). MDPI and/or the editor(s) disclaim responsibility for any injury to people or property resulting from any ideas, methods, instructions or products referred to in the content. |
© 2023 by the authors. Licensee MDPI, Basel, Switzerland. This article is an open access article distributed under the terms and conditions of the Creative Commons Attribution (CC BY) license (https://creativecommons.org/licenses/by/4.0/).
Share and Cite
García-de-Soto-Camacho, E.; Garcia-Gordillo, M.A.; Vaca-Acosta, R.M. Dimensions That Influence the Creation of Brand Value of a Music Event and Its Influence on Attendee Satisfaction. Soc. Sci. 2023, 12, 177. https://doi.org/10.3390/socsci12030177
García-de-Soto-Camacho E, Garcia-Gordillo MA, Vaca-Acosta RM. Dimensions That Influence the Creation of Brand Value of a Music Event and Its Influence on Attendee Satisfaction. Social Sciences. 2023; 12(3):177. https://doi.org/10.3390/socsci12030177
Chicago/Turabian StyleGarcía-de-Soto-Camacho, Elena, Miguel Angel Garcia-Gordillo, and Rosa María Vaca-Acosta. 2023. "Dimensions That Influence the Creation of Brand Value of a Music Event and Its Influence on Attendee Satisfaction" Social Sciences 12, no. 3: 177. https://doi.org/10.3390/socsci12030177
APA StyleGarcía-de-Soto-Camacho, E., Garcia-Gordillo, M. A., & Vaca-Acosta, R. M. (2023). Dimensions That Influence the Creation of Brand Value of a Music Event and Its Influence on Attendee Satisfaction. Social Sciences, 12(3), 177. https://doi.org/10.3390/socsci12030177