Article

An Exploratory Study on the Association between Community Resilience and Disaster Preparedness in the Rio Grande Valley

Department of Sociology, University of Texas Rio Grande Valley, Edinburg, TX 78539, USA
Soc. Sci. 2023, 12(9), 496; https://doi.org/10.3390/socsci12090496
Submission received: 28 June 2023 / Revised: 26 August 2023 / Accepted: 31 August 2023 / Published: 2 September 2023

Abstract

:
(1) Background: Severe weather events have impacted over 100 million Americans in the past two years, highlighting the importance of individual disaster preparedness in building community resilience. This study aims to investigate the factors influencing individuals’ perceived disaster resiliency and preparedness in the Rio Grande Valley, Texas. (2) Methods: Data were collected from 846 respondents using the Communities Advancing Resilience Toolkit (CART) Assessment Survey instrument. The study employed structural equation modeling (SEM) to explore the association between disaster preparedness and community resilience. (3) Results: The findings of the study revealed a significant association between disaster preparedness and perceived community resilience. (4) Conclusions: The study’s findings provide an assessment of the community strengths (assets) in the Rio Grande Valley, which can be utilized to develop initiatives and programs aimed at enhancing community resilience and individual disaster preparedness. These findings contribute significantly to the theoretical understanding of the interplay between community resilience and individual preparedness for disasters.

1. Introduction

Disaster management starts with preparedness, followed by phases of mitigation, response, and recovery (D’Andrea et al. 2023; Sandoval et al. 2023). It is logical to recognize that the effectiveness of preparedness greatly influences the success of the subsequent phases. Given the escalating impact of climate change, recent disasters have increased in frequency, intensity, destructiveness, and cost (C2ES 2022; NOAA 2023). Consequently, disaster preparedness has taken center stage in building disaster resiliency (Graveline and Germain 2022). Disaster preparedness begins with individuals, as well as communities, the private and nonprofit sectors, faith-based organizations, and all levels of government: local, state, and federal (Cong et al. 2023). It is a collective responsibility that extends to the entire nation. The Federal Emergency Management Agency’s (FEMA) National Preparedness Goal emphasizes the vision of establishing a secure and resilient nation, equipped with comprehensive capabilities spanning entire communities (FEMA 2020). These capabilities are aimed at preventing, protecting against, mitigating, responding to, and recovering from the most significant threats and hazards. The goal illustrates that the ultimate objective of preparedness is to build community resilience within the nation. Community resilience pertains to the nation’s capacity to effectively anticipate, prevent, protect against, mitigate, respond to, and recover from external threats and hazards. As a result, the two vital concepts of individual disaster preparedness and community resilience are closely intertwined in a complex context.
The primary objective of individual disaster preparedness is to ensure effective response and recovery from external threats and hazards. As the foundation of a nation’s disaster preparedness lies in the actions of individuals, their level of preparedness serves as an indicator of the nation’s readiness to handle future calamities. Findings from the 2022 National Household Survey on Disaster Preparedness reveal that merely 18% of individuals are actively engaging in preparations for less than a year, while 27% are sustaining their preparedness efforts for over a year (FEMA 2022). Additionally, approximately half of the population expresses intentions to prepare at some point in the future, yet they have yet to commence their preparations (FEMA 2022). This finding highlights the urgent need for national intervention to promote the initiation of disaster preparedness efforts.
Within the past two years, over 100 million Americans have directly experienced the impact of severe weather events (The White House 2023). Amidst this escalation of disasters, the Biden–Harris administration has embarked on a groundbreaking endeavor to foster community climate resilience in the United States (The White House 2023). This commitment is demonstrated through diverse initiatives, including a USD 575 million Climate Resilience Regional Challenge to help coastal and Great Lakes communities, USD 2.3 billion to bolster grid resilience across the country, USD 50 billion in community climate resilience and adaptation, USD 15.4 billion to enhance drought resilience across the West, USD 7 billion to expand the wildland firefighter workforce, and USD 1 billion for protecting communities from extreme heat (The White House 2023). The primary objective of this fund is to aid communities in adapting to the effects of climate change and fortifying their resilience (The White House 2023).
The current measures of community resilience and disaster preparedness indicators reveal the need for significant improvements in both aspects nationwide. Despite considerable efforts and investments in community resilience building, as well as the existing level of disaster preparedness, the system is still failing. It becomes imperative to explore the potential association between these two concepts. This study has two primary objectives: Firstly, it will evaluate community resilience in the Rio Grande Valley area, utilizing the CART Assessment Survey. The unique landscape of this region exposes it to diverse natural disasters, and its socially vulnerable and marginalized population adds further significance to this research. Secondly, the study will conduct an exploratory analysis to investigate the relationship between community resilience and the disaster preparedness of individuals residing in the study area. This analysis aims to uncover potential connections and shed light on the interplay between these two crucial elements in building community resilience.

Community Resilience and Disaster Preparedness

Enhancing community resilience has emerged as a central focus on both the global and national levels. During the United Nations 2023 Sustainable Development Goals (UN 2023, SDG) Summit in May 2023, member states of the United Nations pledged to expedite efforts to bolster resilience in the face of escalating disasters (UN 2023). This commitment was reaffirmed during a two-day, high-level meeting held as part of the midterm review of the Sendai Framework for Disaster Risk Reduction 2015–2030 (UN 2023). This international agreement sets forth seven targets aimed at reducing global disaster losses (UN 2023). Despite eight years of implementing the Sendai Framework, progress has stagnated and, in certain instances, regressed (Busayo et al. 2020; van Niekerk et al. 2020).
At the federal level, the Department of Homeland Security (DHS) defines community resilience as the ability of individuals, communities, businesses, institutions, and governments to adjust to evolving circumstances and proactively prepare for, endure, and swiftly recover from disturbances to normal life, such as hazardous events (DHS 2021a). To achieve this goal, the DHS has established an office of resilience and collaborates with various government levels, private and nonprofit sectors, as well as individual citizens, aiming to enhance the nation’s capacity to withstand acts of terrorism, cyberattacks, pandemics, and catastrophic natural disasters (DHS 2021a). In their pursuit of implementing resilience, the agency primarily focuses on four key concepts: adapting to changing conditions, enduring disruptions, ensuring swift recovery, and fostering individual preparedness (DHS 2021a).
To foster individual disaster preparedness, in February 2003, FEMA introduced the Ready campaign as a means to implement the idea of promoting individual disaster preparedness. This nationwide public service advertising initiative aims to educate and empower Americans to effectively prepare for and handle various emergencies, both natural and man-made (FEMA 2023c). The primary objective of the campaign is to encourage public engagement and ultimately raise the overall level of basic preparedness across the country. Ready, along with its Spanish language counterpart, Listo, urges individuals to undertake four essential tasks: remain informed about different potential emergencies and their appropriate responses, create a family emergency plan, assemble an emergency supply kit, and actively participate in their communities by taking proactive steps to prepare for emergencies (FEMA 2023c). To facilitate these efforts, a dedicated website has been established, offering educational resources and materials (FEMA 2023c).
At the conceptual level, existing studies conceive the interconnectedness of two critical concepts: community resilience and individual preparedness. In their study, Ramanathan and Crawley (2021) conducted a comprehensive review of ten major social work journals, resulting in a conceptual model for effective intervention and research on disaster preparedness. The researchers argued that communities are comprised of individuals, and endeavors focused on capacity building contribute to enhancing community resilience, subsequently facilitating more a effective response and recovery from disasters (Ramanathan and Crawley 2021). Similarly, Zamboni (2017) conducted a systematic review to investigate the relationship between vulnerability, resilience, and preparedness within quantitative frameworks. The study found that the associations among these factors exhibited variations across different frameworks. Ma et al. (2021) conducted a study that analyzes the correlation between community resilience and residents’ disaster preparedness. Enhancing individual disaster preparedness is essential to improving community resilience (Sim et al. 2021). Initiatives for disaster preparedness are now emphasizing the enhancement of community resilience with a focus on the characteristics within communities that bolster their ability to bounce back from and address disasters (Adams et al. 2019).
Recognizing the importance of evaluating the outcomes and progress in terms of community resilience and disaster preparedness, FEMA has devised an assessment methodology aimed at measuring the nationwide level of community resilience. This method enables an accurate gauge of the effectiveness of these efforts and the achievements made in bolstering community resilience and disaster preparedness (FEMA 2023b). The agency has unveiled innovative tools for evaluating community resilience, providing scores and ratings for communities across all 50 states and the District of Columbia. Notably, counties are classified into five distinct groups, spanning from Very Low to Very High Community Resilience. This categorization underscores the uneven distribution of community resilience throughout the nation (FEMA 2023b).

2. Materials and Methods

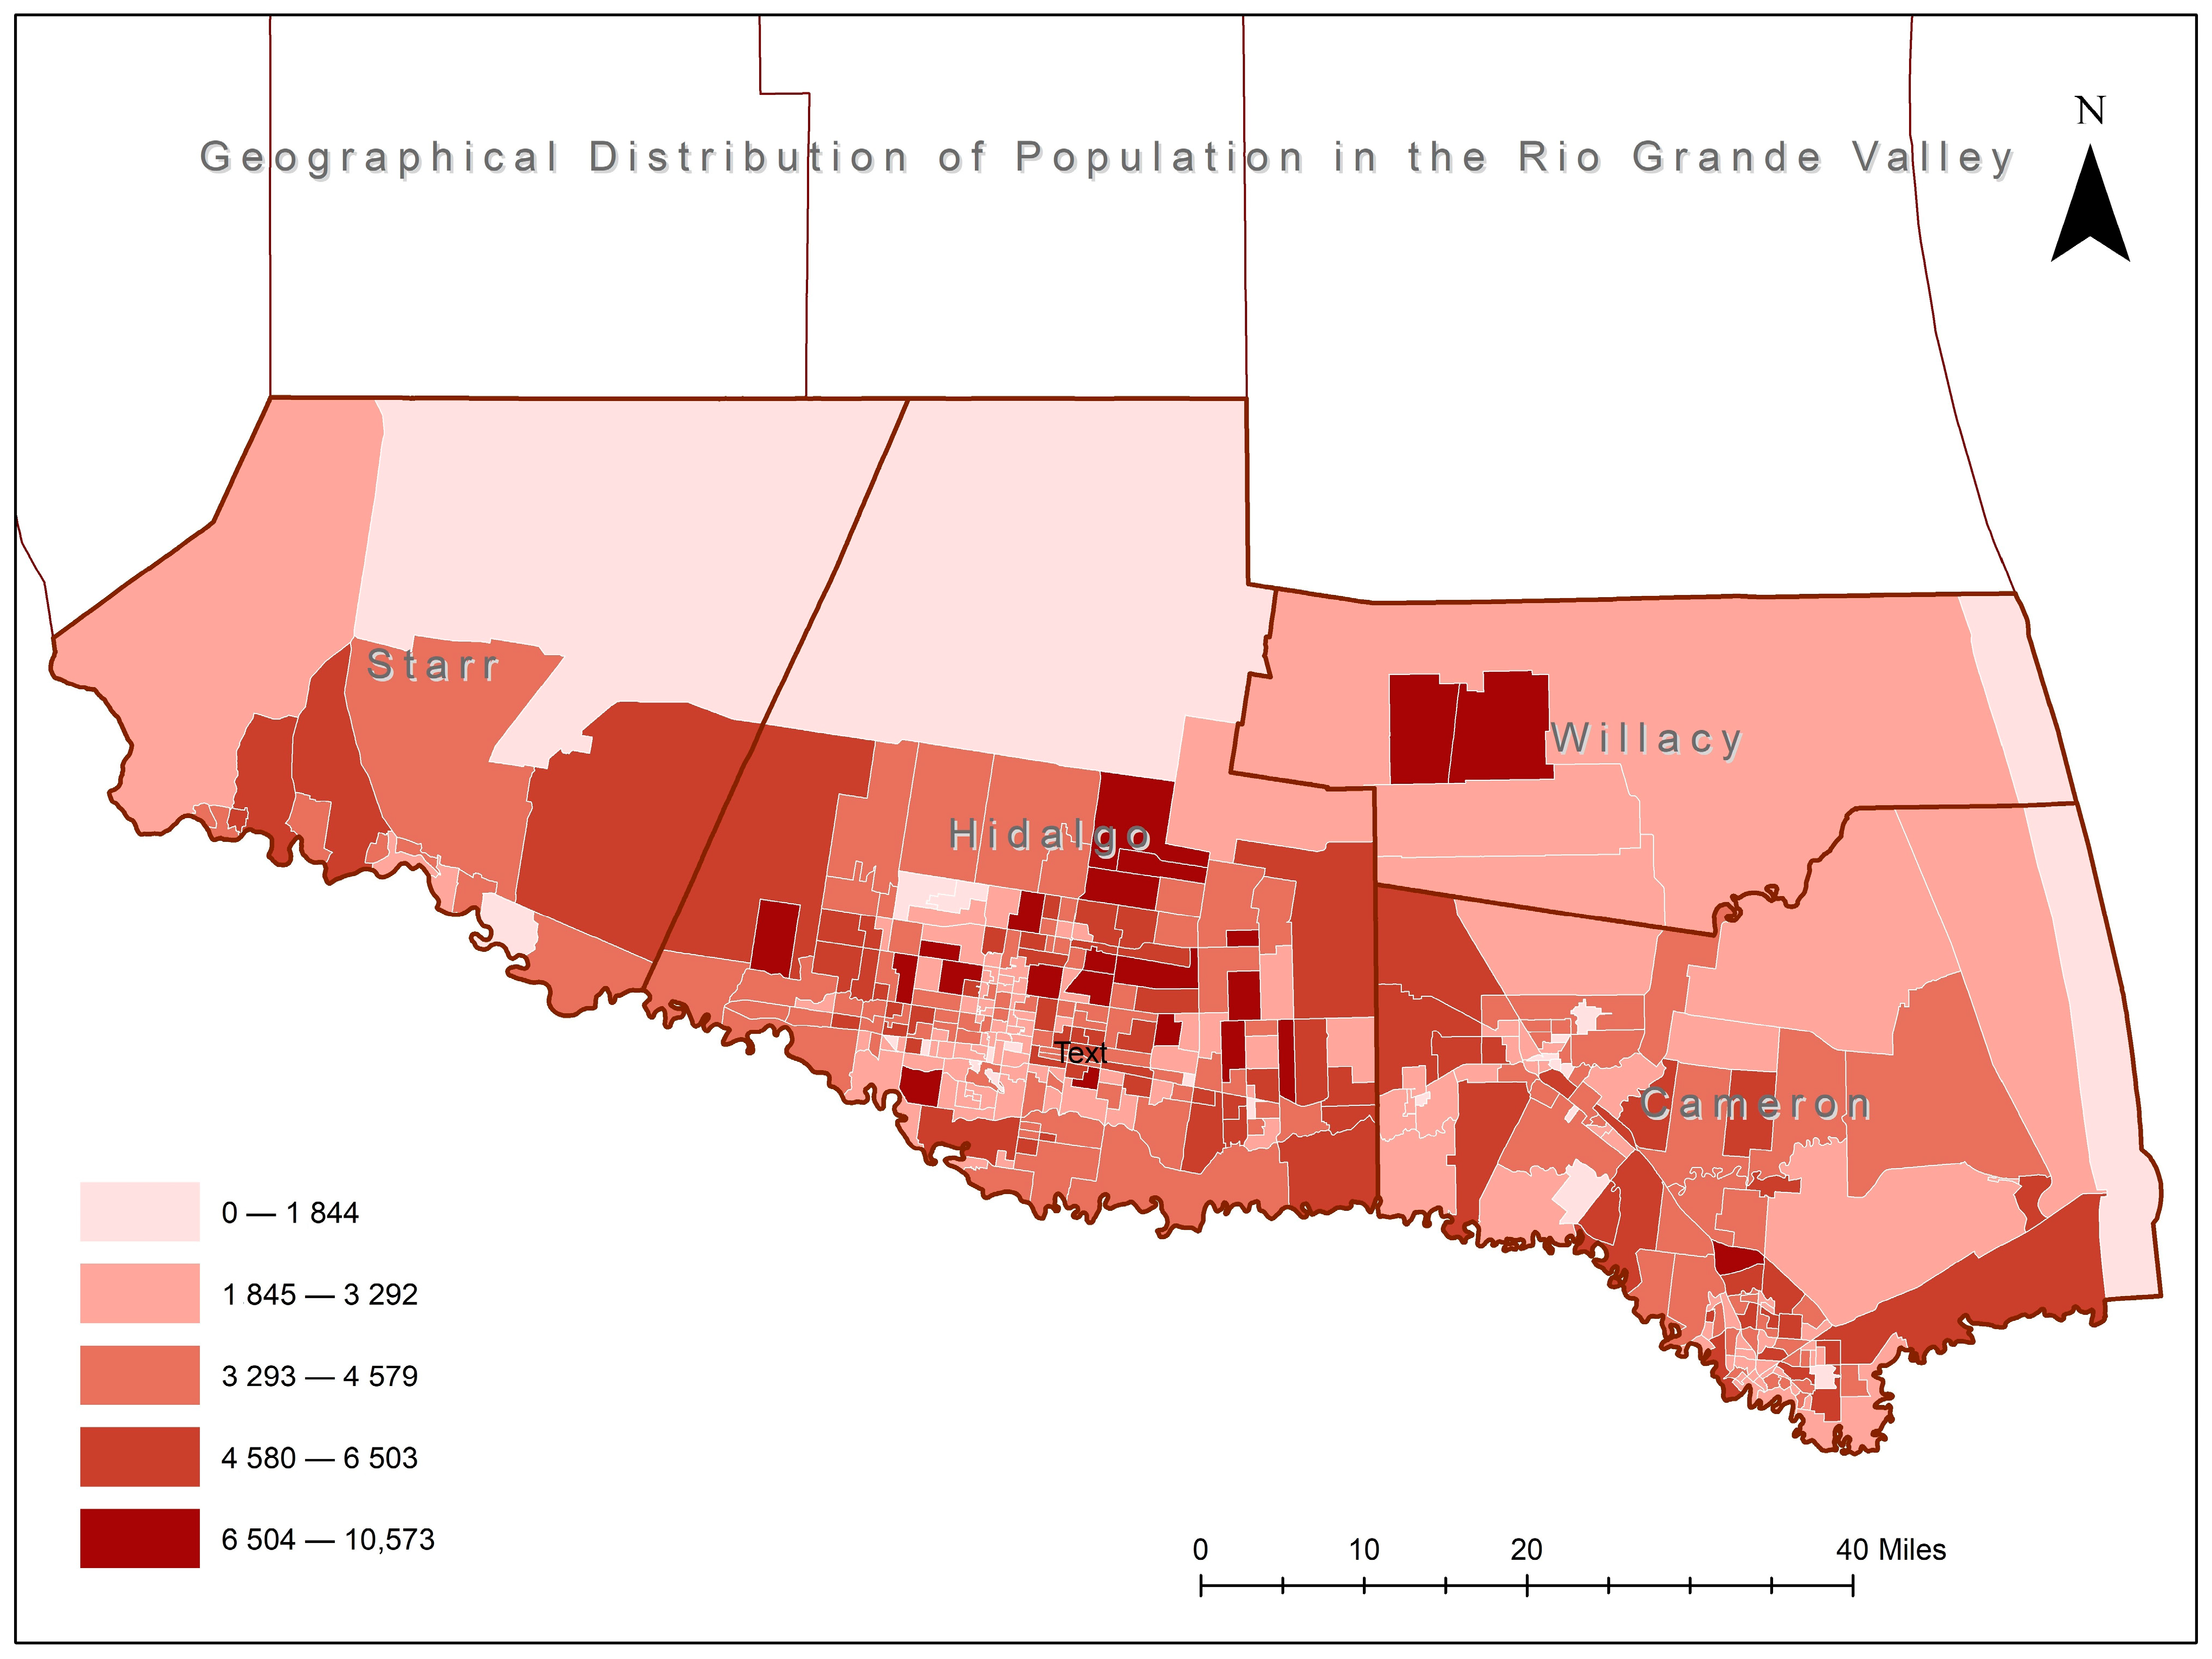
2.1. Area of Interest

The focus area of this study is the Rio Grande Valley, which encompasses four counties: Cameron, Hidalgo, Starr, and Willacy. These counties are located along the border with Mexico in the southernmost region of Texas (Figure 1). Additionally, Cameron County is situated adjacent to the Gulf of Mexico. The combined population of these counties totals 1.37 million, with specific population breakdowns as follows: Cameron (425,208), Hidalgo (888,367), Starr (65,728), and Willacy (20,143). Among these individuals, 978,261 (70%) are aged 18 or older; the corresponding figures for each county are as follows: Cameron (303,599), Hidalgo (614,750), Starr (44,564), and Willacy (15,349).
A significant proportion, approximately 92%, of the population in the Rio Grande Valley identifies as Hispanic, with varying percentages across the counties: Cameron (90%), Hidalgo (92%), Starr (96%), and Willacy (88%). It is noteworthy that around 30% of the total population in the valley, distributed across the counties, live in poverty: Cameron (25%), Hidalgo (29%), Starr (32%), and Willacy (34%) (U.S. Census Bureau 2023b).
Moreover, the Rio Grande Valley has faced a series of devastating disasters, including hurricanes, flash floods, inland floods, storms, winter storms, tornadoes, and storm surges (NWS 2021). These calamities have had a profound impact on the region, and the historical record of hurricanes in Deep South Texas, particularly in the Rio Grande Valley, is disconcerting. Numerous significant events have inflicted severe damage on the valley, such as the September 1886 storm that brought nearly 26 inches of rainfall to the Brownsville area, a storm with a 13-foot storm surge in coastal Cameron County, Hurricane Beulah in September 1967, Hurricane Allen in August 1980, Hurricane Gilbert in September 1988, Hurricane Bret in August 1999, Hurricane Dolly in July 2008, Hurricane Ike in September 2008, Hurricane Alex in June 2010, tropical storm Hermine in September 2010, Hurricane Harvey in August 2017, and Hurricane Hanna in July 2020 (Blake and Zelinsky 2018; Brown et al. 2021; NWS 2021). Furthermore, the Rio Grande Valley was severely affected by the winter storm Uri in 2021, which had devastating consequences for Texas as a whole. During the period of 14–20 February, over two-thirds, or 69 percent, of Texans experienced power outages, while nearly half, or about 49 percent, faced disruptions in water services. The impacts of the storm disproportionately affected vulnerable populations, including individuals with disabilities (Disability Rights Texas 2021; Donald 2021; Kyne 2023). Additionally, in May 2023, a tornado struck the Laguna Heights area in Cameron County, resulting in one fatality and eleven injuries. Initial estimates suggest property damages amounting to approximately USD 60 million (NWS 2023; Still et al. 2023). The cumulative effects of these recent events have left a lasting impact on the region. Therefore, the imperative to prioritize building community resilience and enhancing individual disaster preparedness cannot be underestimated or overlooked.
According to the most up-to-date data, by March 2023, the four counties constituting the Rio Grande Valley region were ranked in the Very Low category, indicating the lowest relative ranking group for community resilience (FEMA 2023b). Moreover, a study assessing the level of individual disaster preparedness uncovered that the overall preparedness level is alarmingly low. Out of the total 526 respondents, only 8% (40 individuals) were objectively prepared, while their counterparts—92% (486 individuals)—were found to be unprepared, despite their self-perceived preparedness (Kyne et al. 2020). The combination of the Rio Grande Valley’s susceptibility to natural disasters and the presence of marginalized and socially vulnerable populations underscores the significance of conducting this study. The region’s exposure to various natural disasters highlights the urgent need to comprehensively address the challenges it faces. Moreover, the presence of marginalized communities further emphasizes the importance of understanding and addressing their specific needs and vulnerabilities. This study aims to contribute to a better understanding of the unique circumstances in the Rio Grande Valley and develop targeted strategies to enhance community resilience and mitigate the impact of disasters on these vulnerable populations.

2.2. Data

The data for the study were gathered through an online survey instrument during the spring of 2020. The collection of data was facilitated by students enrolled in the Disaster Studies class, employing a convenience sampling method between 8 January 2020 and 5 May 2020. Eligible respondents were individuals aged 18 or older residing in one of the four counties in the Rio Grande Valley. A total of 940 participants took part in the survey. After excluding incomplete entries and participants residing outside the valley, the final dataset comprised 846 observations.
According to census data (U.S. Census Bureau 2023a), the population of the Rio Grande Valley is approximately 1.37 million, with 937,141 individuals (68% of the total population) being 18 years or older. To determine the sample size for this study, a sample size calculator was utilized, considering a population of 1.3 million at a 95% confidence interval. The estimated sample size was determined to be 335. It is worth noting that the dataset for this study surpasses the initially estimated sample size.

2.3. Measures

To gauge the perceived resilience of communities, the study employed the CART Assessment Survey. This survey instrument is recognized for its foundation in theory and evidence, ensuring its validity and reliability (Pfefferbaum et al. 2013a, 2013b). The CART survey consists of 21 vital items that center on community resilience, categorized into four domains: Connection and Caring, Resources, Transformative Potential, and Disaster Management (refer to Table 1) (Pfefferbaum et al. 2016). These domains are considered latent variables, meaning they are indirectly measured through the observed variables derived from the 21 items under their respective category.
The level of disaster preparedness was assessed directly using the item, “I have been prepared for at least the past 6 months”, with response options ranging from “not at all like me” to “very much like me”. The impact of natural disasters, such as earthquakes, hurricanes, floods, tornadoes, or wildfires, was measured through a question that asked about the severity, with response options ranging from “not severe at all” to “very severe”. The perception of risk regarding the occurrence of a natural disaster in one’s community was measured by asking respondents to rate the likelihood, with response choices ranging from “very unlikely” to “very likely”.
Additional sociodemographic variables considered in the study were age, gender, race, ethnicity, education level, and county of residence. The age categories included “18–25”, “26–35”, “36–45”, “46–60”, and “older than 60”. Gender was recorded as Female, Male, and Others. Race was categorized as White or Others. Ethnicity was categorized as Hispanic or Others. Education level was also taken into account. Finally, the county of residence was categorized into Hidalgo, Cameron, Willacy, and Starr. For the SEM analysis, data on gender, race, ethnicity, and county of residence were recorded, as presented in Table 1.

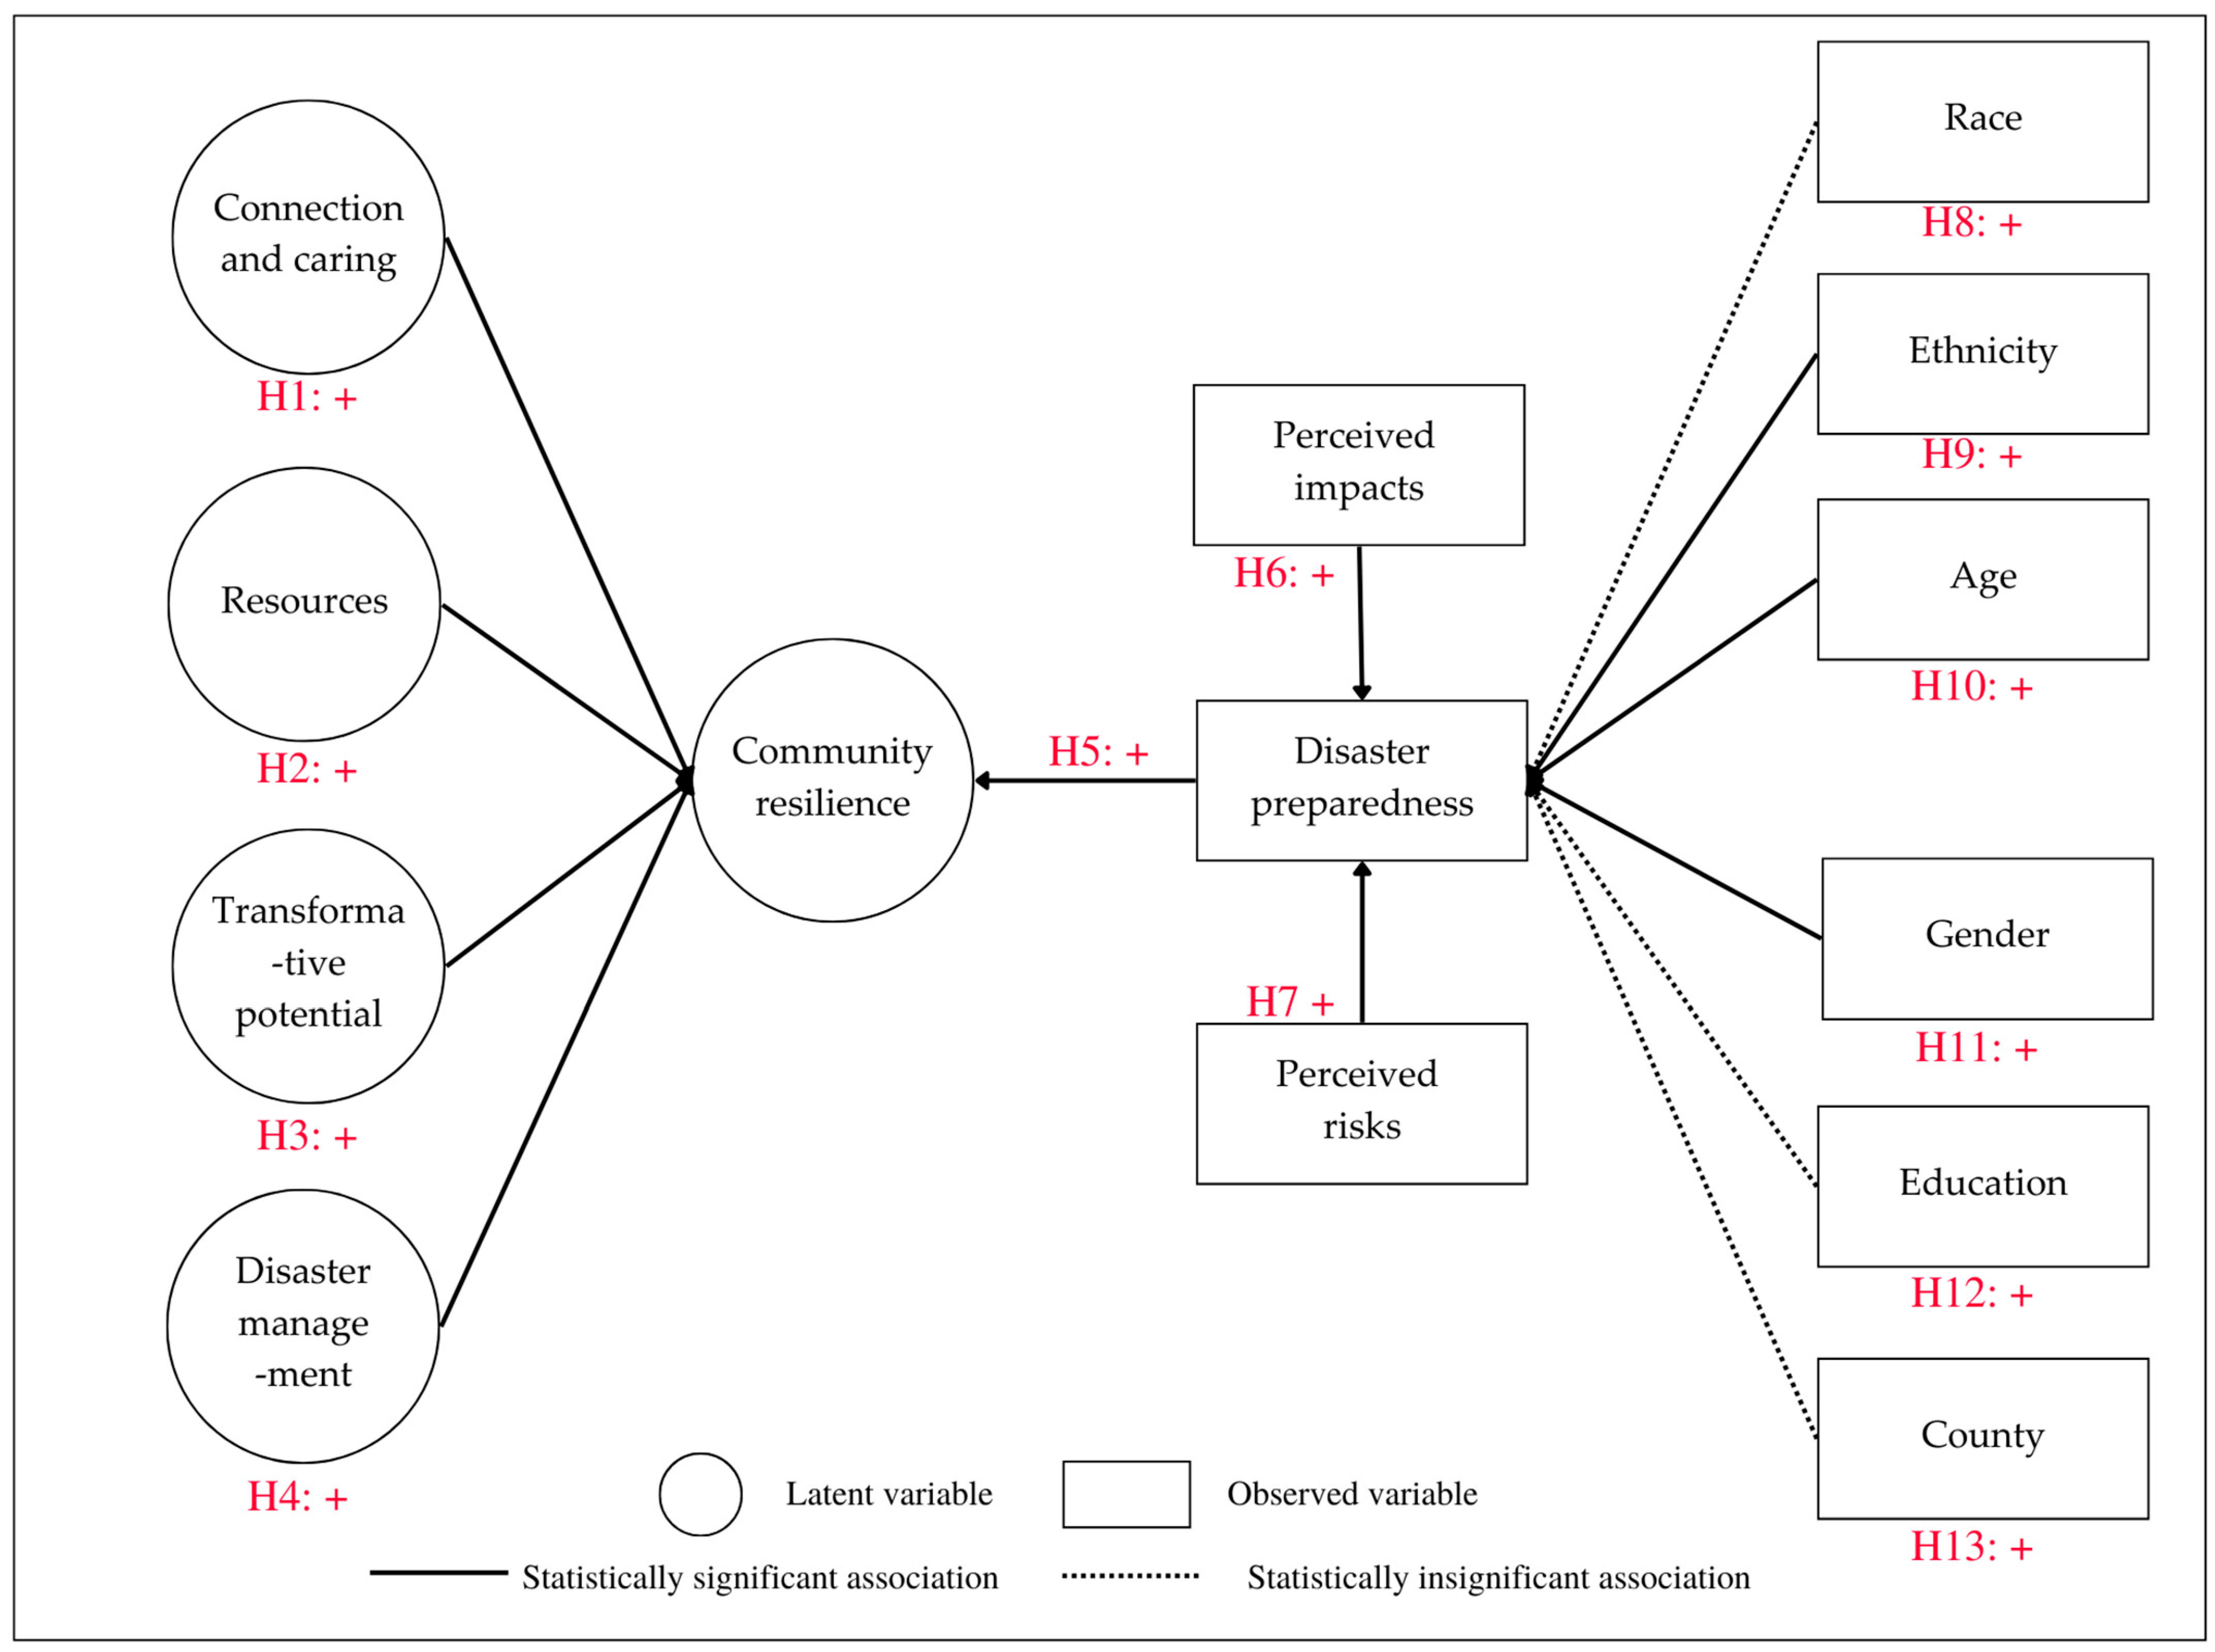
2.4. Structural Equation Modeling Methods

To investigate the associations among perceived community resilience, individual disaster preparedness, perceived risk, severity of impact, and demographic characteristics of the participants, an SEM analysis method was employed. This analytical approach allowed for a comprehensive examination of the relationships and connections between these variables.
The CART survey is a theory-based, evidence-informed instrument for assessing community resilience to disasters. Early applications of the survey, including the one described here, identified four interrelated domains: Connection and Caring, Resources, Transformative Potential, and Disaster Management (Pfefferbaum et al. 2013a). These domains are represented by the survey’s 21 core community resilience items (Pfefferbaum et al. 2016).
Community resilience consists of four interconnected domains: Connection and Caring, Resources, Transformative Potential, and Disaster Management. These domains highlight the importance of fostering relationships, utilizing resources effectively, promoting critical analysis and transformative actions, and implementing strategies for disaster prevention, preparedness, response, and recovery. Communication serves as a fundamental element across all domains, facilitating connection, resource sharing, critical reflection, and effective disaster management (Pfefferbaum et al. 2013b).
Connection and caring within a community involve fostering relatedness, shared values, participation, support systems, and equity. It is vital for individuals to experience a sense of belonging and commitment to their community, and to understand that their well-being is enhanced through their association. Active engagement in community organizations and activities nurtures a feeling of ownership, personal investment, and strengthens the community’s ability to address challenges through collaboration and civic involvement. Supportive communities that prioritize the diverse needs of their members also provide hope during personal and community crises (Pfefferbaum et al. 2013b).
The domain of Resources encompasses various types such as natural, physical, informational, human, social, and financial resources. Resilient communities demonstrate effectiveness in acquiring, investing in, allocating, and utilizing resources to meet the needs of their members and the wider community. It is crucial for communities to establish a diverse and abundant resource base, enabling them to sustain essential operations even in the face of significant disruptions. The community’s structure, roles, and responsibilities should facilitate preparedness and prompt responses during crises, allowing for flexibility in addressing unforeseen vulnerabilities and threats (Pfefferbaum et al. 2013b).
The Transformative Potential domain focuses on a community’s capacity to recognize and interpret collective experiences, critically evaluate both successes and failures, assess performance, and engage in reflective thinking. Through critical analysis of their circumstances, community leaders can set goals, make informed decisions, and formulate strategies to improve the community and the well-being of its members. Skill development at individual, family, organizational, and systemic levels, combined with critical analysis and collective action, fuels the transformative potential for positive change within the community (Pfefferbaum et al. 2013b).
The domain of Disaster Management encompasses a range of activities including prevention, mitigation, preparedness, response, and recovery. It involves efforts to avoid or control crises, reduce risks, and minimize the negative impacts on individuals and property. Mitigation aims to lower the likelihood of exposure to and loss from hazardous events. Preparedness is an ongoing process that entails identifying threats, assessing vulnerabilities, planning suitable actions, and gathering essential resources. Disaster response focuses on limiting damage, meeting basic needs, and restoring affected communities. The response phase eventually transitions into a more extended period of recovery and reconstruction as survivors rebuild their lives and the community (Pfefferbaum et al. 2013b).
Associations between community resilience and each of its four domains could be hypothesized as follows (Figure 2):
H1. 
Connecting and caring have a significant effect on perceived community resilience.
H2. 
Resources have a significant effect on perceived community resilience.
H3. 
Transformative potential has a significant effect on perceived community resilience.
H4. 
Disaster management has a significant effect on perceived community resilience.
In a study that examined the relationship between disaster preparedness and community resilience, it was found that there is a moderate association between community resilience and the ability to prevent disasters. This indicates that the overall level of disaster risk reduction aligns with the residents’ overall disaster preparedness (Ma et al. 2021). This association between community resilience and disaster preparedness is also supported by previous literature reviews (Zamboni 2017). Furthermore, it was discovered that disaster preparedness is influenced by an individual’s perception of risk and the severity of potential impacts (Abunyewah et al. 2018; Cliff et al. 2009; Miceli et al. 2008; Ng 2022). For this reason, we consider the following three hypotheses.
H5. 
Disaster preparedness has a significant effect on perceived community resilience.
H6. 
Perceived impacts have a significant effect on disaster preparedness.
H7. 
Perceived severity has a significant effect on disaster preparedness.
At the individual level, disaster preparedness is influenced by various sociodemographic characteristics of individuals (DHS 2021b; FEMA 2014, 2022).
H8. 
Race has a significant effect on disaster preparedness.
H9. 
Ethnicity risks have a significant effect on disaster preparedness.
H10. 
Age risks have a significant effect on disaster preparedness.
H11. 
Gender risks have a significant effect on disaster preparedness.
H12. 
Education level attained risks have a significant effect on disaster preparedness.
H13. 
County of residence risks have a significant effect on disaster preparedness.
To examine the hypothesized associations between the variables under study, an SEM approach was employed, utilizing the following equations.
COMRES = β1 CONCA + β2 RES + β3 TRAP + β4 DISAM
COMRES = β5 DIPRE
DIPRE = β + β6 PERR + β7 PEIMPA+ β8 RACE + β9 ETH + β10 AGE + β11 GENDER + β12 EDU + β13 COU
where:
  • COMRES = Community resilience
  • CONCA = Connecting and caring
  • RES = Resources
  • TRAP = Transformative potential
  • DISAM = Disaster management
  • DIPRE = Disaster preparedness
  • PERR = Perceived risk
  • PEIMPA = Perceived impact
  • RACE = Race
  • ETH = Ethnicity
  • AGE = Age
  • GENDER = Gender
  • EDU = Education level attained
  • COU = County of residence.
This involved the simultaneous execution of the provided equations through the STATA program, utilizing the SEM technique. The advantages of utilizing SEM include its ability to explore causal relationships among variables in the study, evaluate both their direct and indirect effects as stated by Fan et al. (2016), and its increasingly expanding utilization in the realm of social sciences as noted by Tarka (2018). Nonetheless, SEM comes with constraints, such as the exclusion of significant variables, disregard for lower-order components, challenges with parameter estimates and tests, the presence of alternative models, the potential inaccuracy of heuristic guidelines, and the pivotal role of study design and methodology as highlighted by Tomarken and Waller (2004).

3. Results

The study findings have been organized and presented across three key areas: participant characteristics, perceived community resilience, and the analysis conducted using SEM.

3.1. Characteristics of Study Participants

Table 1 provides an overview of the sociodemographic characteristics of the study participants. The respondents were categorized into different age groups: 18–25 (43%), 26–35 (22%), 36–45 (9.5%), 46–60 (9.2%), and 60 or older (17%). Regarding gender, the study’s participants consisted of 64% (472) females, 35% (254) males, and 10% (7) individuals who identified as “Others”. For the purpose of analysis, males and those identifying as “Others” were recorded as 0, while females were recorded as 1. Among the participants, 80% (572) identified themselves as White, 1.54% (11) as Black or African American, 1.68% (12) as American Indian or Alaska Native, 0.56% (4) as Native Hawaiian or other Pacific Islander, and 15.99% (114) indicated “Something Else”. For analytical purposes, individuals who identified as White were recorded as 1, while those who identified as “Something Else” were recorded as 0. Similarly, ethnicity was categorized as Hispanic (95%) and Others (5%). In terms of educational attainment, the participants’ distribution was as follows: approximately 2% had some high school but no diploma, 20% had a high school graduate or GED, 34% had some college but no degree, 22% held an associate degree, and 21% had a bachelor’s degree or higher. These findings provide a comprehensive overview of the sociodemographic profile of the study participants. Participants were requested to specify the county in which they reside. The recorded counties included Hidalgo, as well as other counties not specifically mentioned.

3.2. Perceived Community Resilience

The results from the CART survey, which assesses perceived community resilience, are presented in Table 2. Each of the 21 core items, comprising seven possible responses, has been coded on a scale from 1 to 7. The coding scale ranges from “Strongly Disagree” (1) to “Disagree” (2), “Somewhat Disagree” (3), “No Opinion” (4), “Somewhat Agree” (5), “Agree” (6), and “Strongly Agree” (7). Mean scores were calculated for each of the 21 items. Similarly, the mean value for each of the four categories was computed based on the mean values of the core items listed under them. Furthermore, the overall community resilience score was calculated using the mean value of the 12 core items.
During the assessment of community resilience, a notable strength was identified in the “Connection and Caring” domain. The primary strength observed was the response that “My neighborhood treats people fairly no matter what their background is”. This indicates a positive aspect of community resilience, emphasizing inclusivity and fairness. On the other hand, a significant challenge was noted in the “Disaster Management” domain. The primary challenge observed was the absence of sufficient services and programs in neighborhoods to assist individuals after a disaster. This highlights the need for improvement in disaster management strategies and resources within the community. These findings shed light on both the strengths and areas for improvement regarding community resilience, guiding future efforts to enhance and address specific challenges within the identified domains.
Upon evaluating the four domains of community resilience, the “Connection and Caring” domain emerged as the primary strength. This domain signifies the community’s ability to foster connections and exhibit empathy, treating individuals fairly regardless of their backgrounds.
In contrast, the “Disaster Management” domain was identified as the primary challenge for community resilience. This domain highlights the community’s preparedness and response capabilities in the face of disasters. The observed challenge suggests a need to enhance disaster management strategies and resources within the community. By recognizing these primary strengths and challenging domains, it becomes possible to focus efforts on reinforcing existing strengths and addressing the specific areas requiring improvement in community resilience.

3.3. Disaster Preparedness, Risks, and Impacts

Table 3 outlines the findings related to the participants’ perceived risk, perceived severity of impact, and their level of disaster preparedness. These findings provide insights into participants’ perceptions of risk, perceived severity of impact, and their personal level of disaster preparedness. Approximately 51% of the participants expressed the belief that some form of natural disaster is likely to occur in their community (Table 3). On the other hand, about 29% perceived the likelihood of such events as unlikely or very unlikely to happen. Around 24% of the participants indicated a neutral stance regarding the likelihood of disasters occurring in their communities. Regarding the severity of potential natural disasters such as earthquakes, hurricanes, floods, tornadoes, or wildfires, approximately 37% of the participants considered them to be not severe or not severe at all. However, a significant proportion believed these events to be severe or very severe in terms of their potential impact on their communities. When asked about their level of disaster preparedness, only 18% of the total participants stated that they had been prepared for at least the past six months. In contrast, 73% responded that they were not prepared or not prepared at all. Approximately 9% of the participants were unsure about their level of preparedness for disasters.

3.4. Results from Structural Equation Modeling Analysis

The results of the SEM analysis are presented in Table 4. The estimates column provides values for coefficients β, β1, β2, β3, β4, β5, β6, β7, β8, β9, β10, β11, and β12, indicating relationships between independent and dependent variables, while the Std. Err. column presents standard errors for these coefficients, and the subsequent columns offer z-values, 2-tailed p-values for null hypothesis testing (coefficients being 0), and 95% confidence intervals to gauge parameter range. First, individual preparedness has a positive association with perceived risk (β6 = 0.131, z = 3.24, p < 0.001), being female (β11 = 0.219, z = −4.3, p < 0.01), and age (β10 = 0.195, z = 5.14, p < 0.001), and a negative association with perceived severity of impacts (β7 = −0.092, z = −2.33, p < 0.05) and being Hispanic (β9 = −0.114, z = −3.00, p < 0.01) (Table 4). The four domains, which were measured as latent variables, Connection and Caring (β1 = 0.418, z = 10.300, p < 0.001), Resources (β2 = 0.612, z = 17.650, p < 0.001), Transformative Potential (β3 = 0.884, z = 38.900, p < 0.001), and Disaster Management (β4 = 0.802, z = 33.680, p < 0.001) show a positive association with community resilience (Table 4).

4. Discussion

This study was conducted with two main objectives: firstly, to assess the current level of community resilience, and secondly, to explore the associations between community resilience and disaster preparedness. The research utilized a sample of 846 observations and employed the CART survey instrument to measure community resilience in the Rio Grande Valley. Additionally, the analysis incorporated information on disaster preparedness, perceived risk, severity of impact, and sociodemographic variables, in order to investigate the relationship between community resilience and disaster preparedness. An SEM model was used to conduct the statistical analysis and determine the significance of the study’s associations.
Firstly, this study aimed to identify the strengths and challenges of the community in the Rio Grande Valley regarding the development of disaster-resilient communities. The strengths were primarily found in the domain of Connecting and Caring with the following rankings: (1) My neighborhood treats people fairly no matter what their background is; (2) People in my neighborhood feel like they belong to the neighborhood; (3) People in my neighborhood help each other; (4) People in my neighborhood have hope about the future, and (5) People in my neighborhood are committed to the well-being of the neighborhood. These strengths were observed across all 12 core items in the Connecting and Caring domain. Building upon this domain can significantly contribute to the development of community resilience, and, therefore, intervention programs should focus on leveraging these strengths. Considering the identified strengths, it is recommended to initiate the following programs:
(1)
Community Engagement Initiatives: These aim to boost social interactions within the community and encourage involvement in disaster readiness, as well as the planning and execution of disaster responses and recuperation efforts.
(2)
Disaster Preparedness Education: Such programs focus on imparting knowledge about disaster preparedness in the communities, helping residents comprehend the risks, likely consequences, and available resources for disaster management and response activities.
(3)
Community Health and Safety Enhancements: These programs are dedicated to the enhancement of the health and safety of community members, ensuring their well-being before, during, and post disasters.
On the other hand, the identified challenges ranked the lowest among the 21 core items related to building community resilience, and are as follows: (1) My neighborhood has services and programs to help people after a disaster; (2) My neighborhood has effective leaders; (3) My neighborhood actively prepares for future disasters; (4) My neighborhood can provide emergency services during a disaster, and (5) People in my neighborhood discuss issues so they can improve the neighborhood. Except for item number 2, which falls under the Resources domain, all of these challenges pertain to the domain of Disaster Management. Urgent attention and action are needed in addressing community leadership, organizing frequent town hall meetings to address emergency service preparedness, planning for future disaster events, and ensuring the availability of resources and programs for disaster preparedness and response. Addressing these areas will enhance community resilience in the Rio Grande Valley. To address and enhance the areas with lower ratings, the subsequent programs are proposed:
(1)
Community Social Network Initiatives: These programs emphasize building social connections within the community, facilitating the provision of essential services and resources.
(2)
Community Leadership Development: Aimed at developing and nurturing community leaders, this approach ensures they possess the requisite knowledge and capabilities to ensure the holistic well-being of the community.
(3)
Community Emergency Response Team (CERT) Training: Offering CERT (FEMA 2023a) to community members, this initiative focuses on imparting the skills and understanding needed to assist fellow community members during disasters, especially in the crucial moments before emergency teams arrive.
The study’s findings reveal statistically significant associations between disaster preparedness and community resilience, highlighting the importance of equal attention and efforts in both areas. It is essential to recognize that the community consists of individuals, and that their individual disaster preparedness is a fundamental component of community preparedness. By prioritizing and enhancing the disaster preparedness of individuals, the community’s capacity to respond and recover from future disasters can be significantly improved. Therefore, intervention programs should emphasize the enhancement of individual disaster preparedness alongside community-resilience-building initiatives.
Furthermore, two primary factors, namely perceived risk and perceived severity of impacts, were identified as influential factors in determining the level of individual disaster preparedness. These factors showed statistically significant associations with individual disaster preparedness. These findings underscore the importance of providing individuals with information regarding risk perception and the severity of potential impacts. By enhancing individuals’ understanding of risk and the severity of potential consequences, they can make more informed decisions regarding disaster preparedness.
Above all, this study aimed to assess community resilience and explore its relationship with disaster preparedness in the Rio Grande Valley. The findings highlight the strengths (assets) in the Connecting and Caring domain, which can serve as a foundation for initiatives for intervention programs. Additionally, the study identifies challenges (needs) in the areas of community leadership and resources for disaster preparedness, emphasizing the need for urgent attention to enhance community resilience. This study makes a valuable contribution to the existing knowledge and literature concerning the association between community resilience and disaster preparedness.

5. Conclusions

This exploratory study was undertaken with the primary objective of assessing the current level of community resilience in the Rio Grande Valley and investigating the association between community resilience and individual disaster preparedness. Data were gathered from 846 respondents using the CART survey, a theory-based and evidence-informed instrument designed to measure community resilience to disasters. The findings shed light on community assets and needs, thereby contributing to the understanding of how to build community resilience and enhance individual disaster preparedness. The study’s findings have established foundational knowledge that can serve as a basis for interventions aimed at enhancing the process of building community resilience in the Rio Grande Valley.

Funding

This research received no external funding.

Institutional Review Board Statement

The study was conducted according to the guidelines of the Declaration of Helsinki and approved by the Institutional Review Board of The University of Texas Rio Grande Valley (Protocol Number 19-0664 and date of approval 4 December 2019).

Informed Consent Statement

Written informed consent has been obtained from the participants to publish this paper.

Data Availability Statement

The data presented in this study are available on request from the corresponding author. The data are not publicly available due to restrictions.

Conflicts of Interest

The author declares no conflict of interest.

References

  1. Abunyewah, Matthew, Thayaparan Gajendran, and Kim Maund. 2018. Conceptual Framework for Motivating Actions towards Disaster Preparedness through Risk Communication. Procedia Engineering 212: 246–53. [Google Scholar] [CrossRef]
  2. Adams, Rachel M., David P. Eisenman, and Deborah Glik. 2019. Community Advantage and Individual Self-Efficacy Promote Disaster Preparedness: A Multilevel Model among Persons with Disabilities. International Journal of Environmental Research and Public Health 16: 2779. [Google Scholar] [CrossRef] [PubMed]
  3. Blake, Eric S., and David A. Zelinsky. 2018. Hurricane Harvey. In National Hurricane Center Tropical Cyclone Report. University Park: National Hurricane Center. [Google Scholar]
  4. Brown, Daniel P., Robbie Berg, and Brad Reinhart. 2021. Hurricane Hanna. In National Hurricane Center Tropical Cyclone Report. University Park: National Hurricane Center. Silver Spring: National Weather Service. [Google Scholar]
  5. Busayo, Emmanuel T., Ahmed M. Kalumba, Gbenga A. Afuye, Olapeju Y. Ekundayo, and Israel R. Orimoloye. 2020. Assessment of the Sendai framework for disaster risk reduction studies since 2015. International Journal of Disaster Risk Reduction 50: 101906. [Google Scholar] [CrossRef]
  6. C2ES. 2022. Extreme Weather and Climate Change. Arlington: Center for Climate and Energy Solutions. [Google Scholar]
  7. Cliff, Barbara J., Laura Morlock, and Amy B. Curtis. 2009. Is there an association between risk perception and disaster preparedness in rural US hospitals? Prehospital and Disaster Medicine 24: 512–17. [Google Scholar] [CrossRef]
  8. Cong, Zhen, Guanggang Feng, and Zhirui Chen. 2023. Disaster exposure and patterns of disaster preparedness: A multilevel social vulnerability and engagement perspective. Journal of Environmental Management 339: 117798. [Google Scholar] [CrossRef] [PubMed]
  9. D’Andrea, Alessia, Patrizia Grifoni, and Fernando Ferri. 2023. FADM: A Feasible Approach to Disaster Management. Development Policy Review 41: e12633. [Google Scholar] [CrossRef]
  10. DHS. 2021a. DHS Resilience Framework: Providing a Roadmap for the Department in Operational Resilience and Readiness. In DHS Resilience Framewor; Washington, DC: US Department of Homeland Security (DHS). [Google Scholar]
  11. DHS. 2021b. National Preparedness. In National Preparedness Report; Washington, DC: US Department of Homeland Security (DHS). [Google Scholar]
  12. Disability Rights Texas. 2021. Survey Results Reveal Alarming Danger Faced by People with Disabilities during Winter Storm. Houston: Disability Rights Texas. [Google Scholar]
  13. Donald, Jess. 2021. Winter Storm Uri 2021: The Economic Impact of the Storm; Houston: Comptroller of Texas Government.
  14. Fan, Yi, Jiquan Chen, Gabriela Shirkey, Ranjeet John, Susie R. Wu, Hogeun Park, and Changliang Shao. 2016. Applications of structural equation modeling (SEM) in ecological studies: An updated review. Ecological Processes 5: 19. [Google Scholar] [CrossRef]
  15. FEMA. 2014. Research Insights to Increase Indivdiual, Organizational, and Community Action. In Preapredness in America; Washington, DC: U.S. Federal Emergency Management Agency (FEMA). [Google Scholar]
  16. FEMA. 2020. Facilitator Guide. In Region II Individual Preparedness Activities; Washington, DC: U.S. Federal Emergency Management Agency (FEMA). [Google Scholar]
  17. FEMA. 2022. Results from the 2022 National Household Survey on Disaster Preparedness. In National Household Survey on Disaster Preparednes; Washington, DC: U.S. Federal Emergency Management Agency (FEMA). [Google Scholar]
  18. FEMA. 2023a. Community Emergency Response Team (CERT). In Emergency Management; Washington, DC: U.S. Federal Emergency Management Agency (FEMA). [Google Scholar]
  19. FEMA. 2023b. Community Resilience. In FEMA National Risk Index; Washington, DC: U.S. Federal Emergency Management Agency (FEMA). [Google Scholar]
  20. FEMA. 2023c. Ready; Washington, DC: U.S. Federal Emergency Management Agency (FEMA).
  21. Graveline, Marie-Hélène, and Daniel Germain. 2022. Disaster Risk Resilience: Conceptual Evolution, Key Issues, and Opportunities. International Journal of Disaster Risk Science 13: 330–41. [Google Scholar] [CrossRef]
  22. Kyne, Dean, Leslie Cisneros, Josue Delacruz, Bianca Lopez, Cristina Madrid, Rebecca Moran, Alma Provencio, Felix Ramos, and Maria Fernanda Silva. 2020. Empirical evaluation of disaster preparedness for hurricanes in the Rio Grande Valley. Progress in Disaster Science 5: 100061. [Google Scholar] [CrossRef]
  23. Kyne, Dean. 2023. Winter Storm Uri 2021: A Litmus Test for Extreme Event Resiliency. Journal of Extreme Events, 2250004. [Google Scholar] [CrossRef]
  24. Ma, Zhixing, Shili Guo, Xin Deng, and Dingde Xu. 2021. Community resilience and resident’s disaster preparedness: Evidence from China’s earthquake-stricken areas. Natural Hazards 108: 567–91. [Google Scholar] [CrossRef]
  25. Miceli, Renato, Igor Sotgiu, and Michele Settanni. 2008. Disaster preparedness and perception of flood risk: A study in an alpine valley in Italy. Journal of Environmental Psychology 28: 164–73. [Google Scholar] [CrossRef]
  26. Ng, Sai Leung. 2022. Effects of Risk Perception on Disaster Preparedness toward Typhoons: An Application of the Extended Theory of Planned Behavior. International Journal of Disaster Risk Science 13: 100–13. [Google Scholar] [CrossRef]
  27. NOAA. 2023. U.S. Billion-Dollar Weather and Climate Disasters. Asheville: National Centers for Environmental Information (NCEI). [Google Scholar]
  28. NWS. 2021. Hurricane Preparedness, Rio Grande Valley: Hurricane History. Silver Spring: National Weather Service. [Google Scholar]
  29. NWS. 2023. NWS Damage Survey Finds EF1 Tornado in Laguna Heights with Estimated Winds of 85 to 105 mph. In NWS Damage Survey. Silver Spring: National Weather Service. [Google Scholar]
  30. Pfefferbaum, Rose L., Barbara Pfefferbaum, Yan D. Zhao, Richard L. Van Horn, Grady S. McCarter, and McCarter B. Leonard. 2016. Assessing community resilience: A CART survey application in an impoverished urban community. Disaster Health 3: 45–56. [Google Scholar] [CrossRef]
  31. Pfefferbaum, Rose L., Barbara R. Neas, Betty Pfefferbaum, Fran H. Norris, and Richard L. Van Horn. 2013a. The Communities Advancing Resilience Toolkit (CART): Development of a survey instrument to assess community resilience. Journal of Public Health Management and Practice 15: 15–29. [Google Scholar]
  32. Pfefferbaum, Rose L., Betty Pfefferbaum, Richard L. Van Horn, Richard W. Klomp, Fran H. Norris, and Dori B. Reissman. 2013b. The Communities Advancing Resilience Toolkit (CART): An intervention to build community resilience to disasters. Journal of Public Health Management and Practice 19: 250–8. [Google Scholar] [CrossRef] [PubMed]
  33. Ramanathan, Chathapuram, and William Crawley. 2021. Conceptualizing Disaster Preparedness Interventions and Research: What Does Literature Have to Do With It? Families in Society—The Journal of Contemporary Social Services 102: 367–84. [Google Scholar] [CrossRef]
  34. Sandoval, Vicente, Martin Voss, Verena Flörchinger, Stephan Lorenz, and Parisa Jafari. 2023. Integrated Disaster Risk Management (IDRM): Elements to Advance Its Study and Assessment. International Journal of Disaster Risk Science 14: 343–56. [Google Scholar] [CrossRef]
  35. Sim, Timothy, Ziqiang Han, Chunlan Guo, Jocelyn Lau, Junlei Yu, and Guiwu Su. 2021. Disaster preparedness, perceived community resilience, and place of rural villages in northwest China. Natural Hazards 108: 907–23. [Google Scholar] [CrossRef]
  36. Still, Bryan, Diana Eva Maldonado, and Alejandra Yanex. 2023. National Weather Service confirms EF1 tornado hit Laguna Heights; 1 dead. Severe Weather (Vol. 2023): Valley Centeral News, 13 May 2023. Available online: https://www.valleycentral.com/weather/severe-weather/potential-tornado-touch-down-in-cameron-county/ (accessed on 1 June 2023).
  37. Tarka, Piotr. 2018. An overview of structural equation modeling: Its beginnings, historical development, usefulness and controversies in the social sciences. Qual Quant 52: 313–54. [Google Scholar] [CrossRef]
  38. The White House. 2023. FACT SHEET: Biden-Harris Administration Makes Historic Investments to Build Community Climate Resilience. In Briefing Room. Washington, DC: The White House. [Google Scholar]
  39. Tomarken, Andrew J., and Niels G. Waller. 2004. Structural Equation Modeling: Strengths, Limitations, and Misconceptions. Annual Review of Clinical Psychology 1: 31–65. [Google Scholar] [CrossRef]
  40. U.S. Census Bureau. 2023a. ACS Demographic and Housing Estimates: Age and Sex; Suitland: U.S. Census Bureau.
  41. U.S. Census Bureau. 2023b. QuickFacts: Starr County, Texas; Willacy County, Texas; Cameron County, Texas; Hidalgo County, Texas; Suitland: U.S. Census Bureau.
  42. UN. 2023. Press Release|UN Member States Commit to Accelerate Resilience Building in Face of Spiralling Disasters. Online. New York: United Nations. [Google Scholar]
  43. van Niekerk, Dewald, Christo Coetzee, and Livhuwani Nemakonde. 2020. Implementing the Sendai Framework in Africa: Progress Against the Targets (2015–2018). International Journal of Disaster Risk Science 11: 179–89. [Google Scholar] [CrossRef]
  44. Zamboni, Lucila M. 2017. Theory and Metrics of Community Resilience: A Systematic Literature Review Based on Public Health Guidelines. Disaster Medicine and Public Health Preparedness 11: 756–63. [Google Scholar] [CrossRef] [PubMed]
Figure 1. Geographical distribution of population in the Rio Grande Valley.
Socsci 12 00496 g001
Figure 2. This figure shows hypothesized associations among study variables.
Socsci 12 00496 g002
Table 1. Sociodemographic characteristics of study participants (N = 846).
Freq.Percent
Age group
18–25 (1)35942.69
26–35 (2)18421.88
36–45 (3)809.51
46–60 (4)779.16
60 or older (5)14116.77
Total841100
Gender
Others (0)25434.99
Female (1)47265.01
Total726100
Race
Others (0)14119.78
White (1)57280.22
Total713100
Ethnicity
Others (0)364.88
Hispanic (1)70195.12
Total737100
Education
Some high school, but no diploma (1)162.17
High school graduate or GED (2)15120.46
Some college but no degree (3)24933.74
Associate degree (4)16522.36
Bachelor’s degree or higher (5)15721.27
Total738100
County of residence
Other counties (0)9312.67
Hidalgo county (1)64187.33
Total734100
Table 2. Perceived community resilience and core survey items in the CART survey conducted in the Rio Grande Valley.
VariableNMean bSD c
Connection and Caring7454.781.31
1. People in my neighborhood feel like they belong to the neighborhood.7544.821.65
2. People in my neighborhood are committed to the well-being of the neighborhood. 7534.581.71
3. People in my neighborhood have hope about the future. 7534.761.55
4. People in my neighborhood help each other. 7514.791.61
5. My neighborhood treats people fairly no matter what their background is. d7504.941.60
Resources7384.011.47
6. My neighborhood has the resources it needs to take care of neighborhood problems.7423.781.79
7. My neighborhood has effective leaders. 7453.671.79
8. People in my neighborhood are able to get the services they need.7454.301.72
9. People in my neighborhood know where to go to get things done. 7464.291.69
Transformative Potential7153.861.71
10. My neighborhood works with organizations and agencies outside the neighborhood to get things done.7383.932.08
11. People in my neighborhood communicate with leaders who can help improve the neighborhood. 7363.891.97
12. People in my neighborhood are aware of neighborhood issues that they might address together.7364.011.88
13. People in my neighborhood discuss issues so they can improve the neighborhood. 7363.741.95
14. People in my neighborhood work together on solutions so that the neighborhood can improve. 7353.791.94
15. My neighborhood looks at its successes and failures so it can learn from the past. 7363.932.03
16. My neighborhood develops skills and finds resources to solve its problems and reach its goals.7313.921.97
17. My neighborhood has priorities and sets goals for the future. 7323.912.00
Disaster Management7333.771.79
18. My neighborhood tries to prevent disasters. 7333.921.92
19. My neighborhood actively prepares for future disasters. 7333.741.98
20. My neighborhood can provide emergency services during a disaster. 7333.741.98
21. My neighborhood has services and programs to help people after a disaster. e 7333.662.05
Overall Community Resilience a6984.101.24
Notes: SD = standard deviation. a A total of 21 core community resilience items. b Mean score: a score closer to 1 means less agreement, and a score closer to 7 means more agreement. c Response options: Very Strongly Agree = 7, Strongly Agree = 6, Agree = 5, No Opinion = 4, Somewhat Disagree = 3, Disagree = 2, Strongly Disagree = 1, (imputed). d Primary community resilience strength. e Primary community resilience challenge.
Table 3. Participants’ perception of risk and potential consequences, and their preparedness level. (N = 846).
Freq.Percent
Risk
Very unlikely (1)647.93
Unlikely (2)16920.94
Neutral (3)19323.92
Likely (4)28134.82
Very likely (5)10012.39
Total807100
Impact
Not severe at all (1)273.35
Not severe (2)10913.54
Neither severe or not severe (3)14417.89
Severe (4)36044.72
Very severe (5)16520.50
Total805100
Preparedness
Not at all like me (1)27135.38
Not like me (2)28937.73
Unsure (3)688.88
Somewhat like me (4)8010.44
Very much like me (5)587.57
Total766100
Table 4. Results from the Structural Equation Modeling Analysis.
StandardizedStandardized Coef. Std. Err.zp > z[95% Conf.Interval]
Structural
Preparedness <-
Risk0.131**0.04043.2400.0010.0520.210
Impact−0.092*0.0394−2.3300.020−0.169−0.015
Gender0.093*0.03762.4700.0140.0190.166
Age0.195***0.03795.1400.0000.1210.269
Ethnicity−0.114**0.0380−3.0000.003−0.188−0.039
Race0.048 0.03881.2400.214−0.0280.124
Education−0.033 0.0376−0.8800.379−0.1070.041
County0.001 0.03780.0400.970−0.0730.075
Constant1.683***0.29275.7500.0001.1092.257
Connection <-
Resilience0.418***0.040610.3000.0000.3380.497
Resources <-
Resilience0.612***0.034717.6500.0000.5440.680
Transformation <-
Resilience0.884***0.022738.9000.0000.8390.928
Disaster <-
Resilience0.802***0.023833.6800.0000.7550.848
Resilience <-
Preparedness0.163***0.04183.8900.0000.0810.245
Measurement
Q10_1<-
Connection0.666***0.024527.2000.0000.6180.714
Constant2.931***0.096130.5100.0002.7433.119
Q10_2<-
Connection0.865***0.014957.8700.0000.8360.894
Constant2.590***0.090828.5100.0002.4122.768
Q10_3<-
Connection0.748***0.020336.8000.0000.7080.788
Constant3.018***0.099330.3900.0002.8233.213
Q10_4<-
Connection0.755***0.020536.7600.0000.7150.795
Constant2.951***0.097830.1800.0002.7593.142
Q10_5<-
Connection0.735***0.021634.0200.0000.6920.777
Constant3.056***0.100130.5400.0002.8603.252
Q11_1<-
Resources0.776***0.021036.9600.0000.7350.818
Constant1.988***0.081724.3200.0001.8282.148
Q11_2<-
Resources0.762***0.021635.3100.0000.7200.805
Constant1.924***0.080024.0500.0001.7672.081
Q11_3<-
Resources0.802***0.020040.0700.0000.7630.841
Constant2.409***0.091426.3400.0002.2302.588
Q11_4<-
Resources0.732***0.023331.3900.0000.6860.777
Constant2.429***0.090126.9500.0002.2522.605
Q12_1<-
Transformation0.752***0.017842.2100.0000.7170.787
Constant1.703***0.084420.1900.0001.5381.868
Q12_2<-
Transformation0.791***0.015550.8700.0000.7600.821
Constant1.764***0.087220.2300.0001.5931.935
Q12_3<-
Transformation0.826***0.013461.7800.0000.7990.852
Constant1.932***0.092021.0000.0001.7512.112
Q12_4<-
Transformation0.849***0.011971.1100.0000.8250.872
Constant1.713***0.088919.2600.0001.5391.887
Q12_5<-
Transformation0.869***0.010582.7300.0000.8490.890
Constant1.743***0.090419.2700.0001.5651.920
Q12_6<-
Transformation0.900***0.0084107.2300.0000.8840.917
Constant1.705***0.091218.6900.0001.5261.884
Q12_7<-
Transformation0.922***0.0070131.1600.0000.9080.936
Constant1.751***0.093118.8100.0001.5681.933
Q12_8<-
Transformation0.887***0.009494.8700.0000.8690.905
Constant1.730***0.091019.0000.0001.5511.908
Q13_1<-
Disaster0.723***0.021134.2600.0000.6810.764
Constant1.900 0.084422.5200.0001.7352.066
Q13_3<-
Disaster0.900***0.011578.5400.0000.8780.923
Constant1.682***0.087419.2500.0001.5101.853
Q13_4<-
Disaster0.891***0.011875.6200.0000.8680.914
Constant1.578***0.085118.5400.0001.4111.744
var(e.Q10_1)0.556 0.0326 0.4960.624
var(e.Q10_2)0.252 0.0259 0.2060.308
var(e.Q10_3)0.441 0.0304 0.3850.504
var(e.Q10_4)0.430 0.0310 0.3730.495
var(e.Q10_5)0.460 0.0317 0.4020.527
var(e.Q11_1)0.397 0.0326 0.3380.466
var(e.Q11_2)0.419 0.0329 0.3590.489
var(e.Q11_3)0.357 0.0321 0.2990.426
var(e.Q11_4)0.465 0.0341 0.4030.537
var(e.Q12_1)0.435 0.0268 0.3850.490
var(e.Q12_2)0.375 0.0246 0.3300.426
var(e.Q12_3)0.318 0.0221 0.2780.365
var(e.Q12_4)0.280 0.0203 0.2430.322
var(e.Q12_5)0.245 0.0183 0.2110.283
var(e.Q12_6)0.189 0.0151 0.1620.221
var(e.Q12_7)0.150 0.0130 0.1270.178
var(e.Q12_8)0.213 0.0166 0.1830.248
var(e.Q13_1)0.478 0.0305 0.4220.541
var(e.Q13_3)0.190 0.0206 0.1530.235
var(e.Q13_4)0.206 0.0210 0.1690.252
var(e.Preparedness)0.909 0.0208 0.8690.951
var(e.Connection)0.825 0.0339 0.7620.895
var(e.Resources)0.626 0.0424 0.5480.714
var(e.Transformation)0.219 0.0401 0.1530.314
var(e.Disaster)0.357 0.0382 0.2900.441
var(e.Resilience)0.973 0.0136 0.9471.001
N661
LR test of model vs. saturated: chi2(345) = 1330.07, Prob > chi2 = 0.000
* p < 0.05, ** p < 0.01, *** p < 0.001.
Disclaimer/Publisher’s Note: The statements, opinions and data contained in all publications are solely those of the individual author(s) and contributor(s) and not of MDPI and/or the editor(s). MDPI and/or the editor(s) disclaim responsibility for any injury to people or property resulting from any ideas, methods, instructions or products referred to in the content.

