Social Determinants of School-to-School Differences in Opportunity to Learn (OTL): A Cross-National Study
Abstract
:1. Introduction
2. Background Literature
2.1. Cross-National Studies on Educational Inequality
2.2. Developmental Stage, Social Inequality, and Variation in Opportunity to Learn
2.3. Functional and Conflict Sources of Inequality in Opportunity to Learn
2.4. Education Policies and Practices as Moderators: The Role of Stratification and Standardization
3. Methods
3.1. Measurement
3.1.1. Dependent Measures
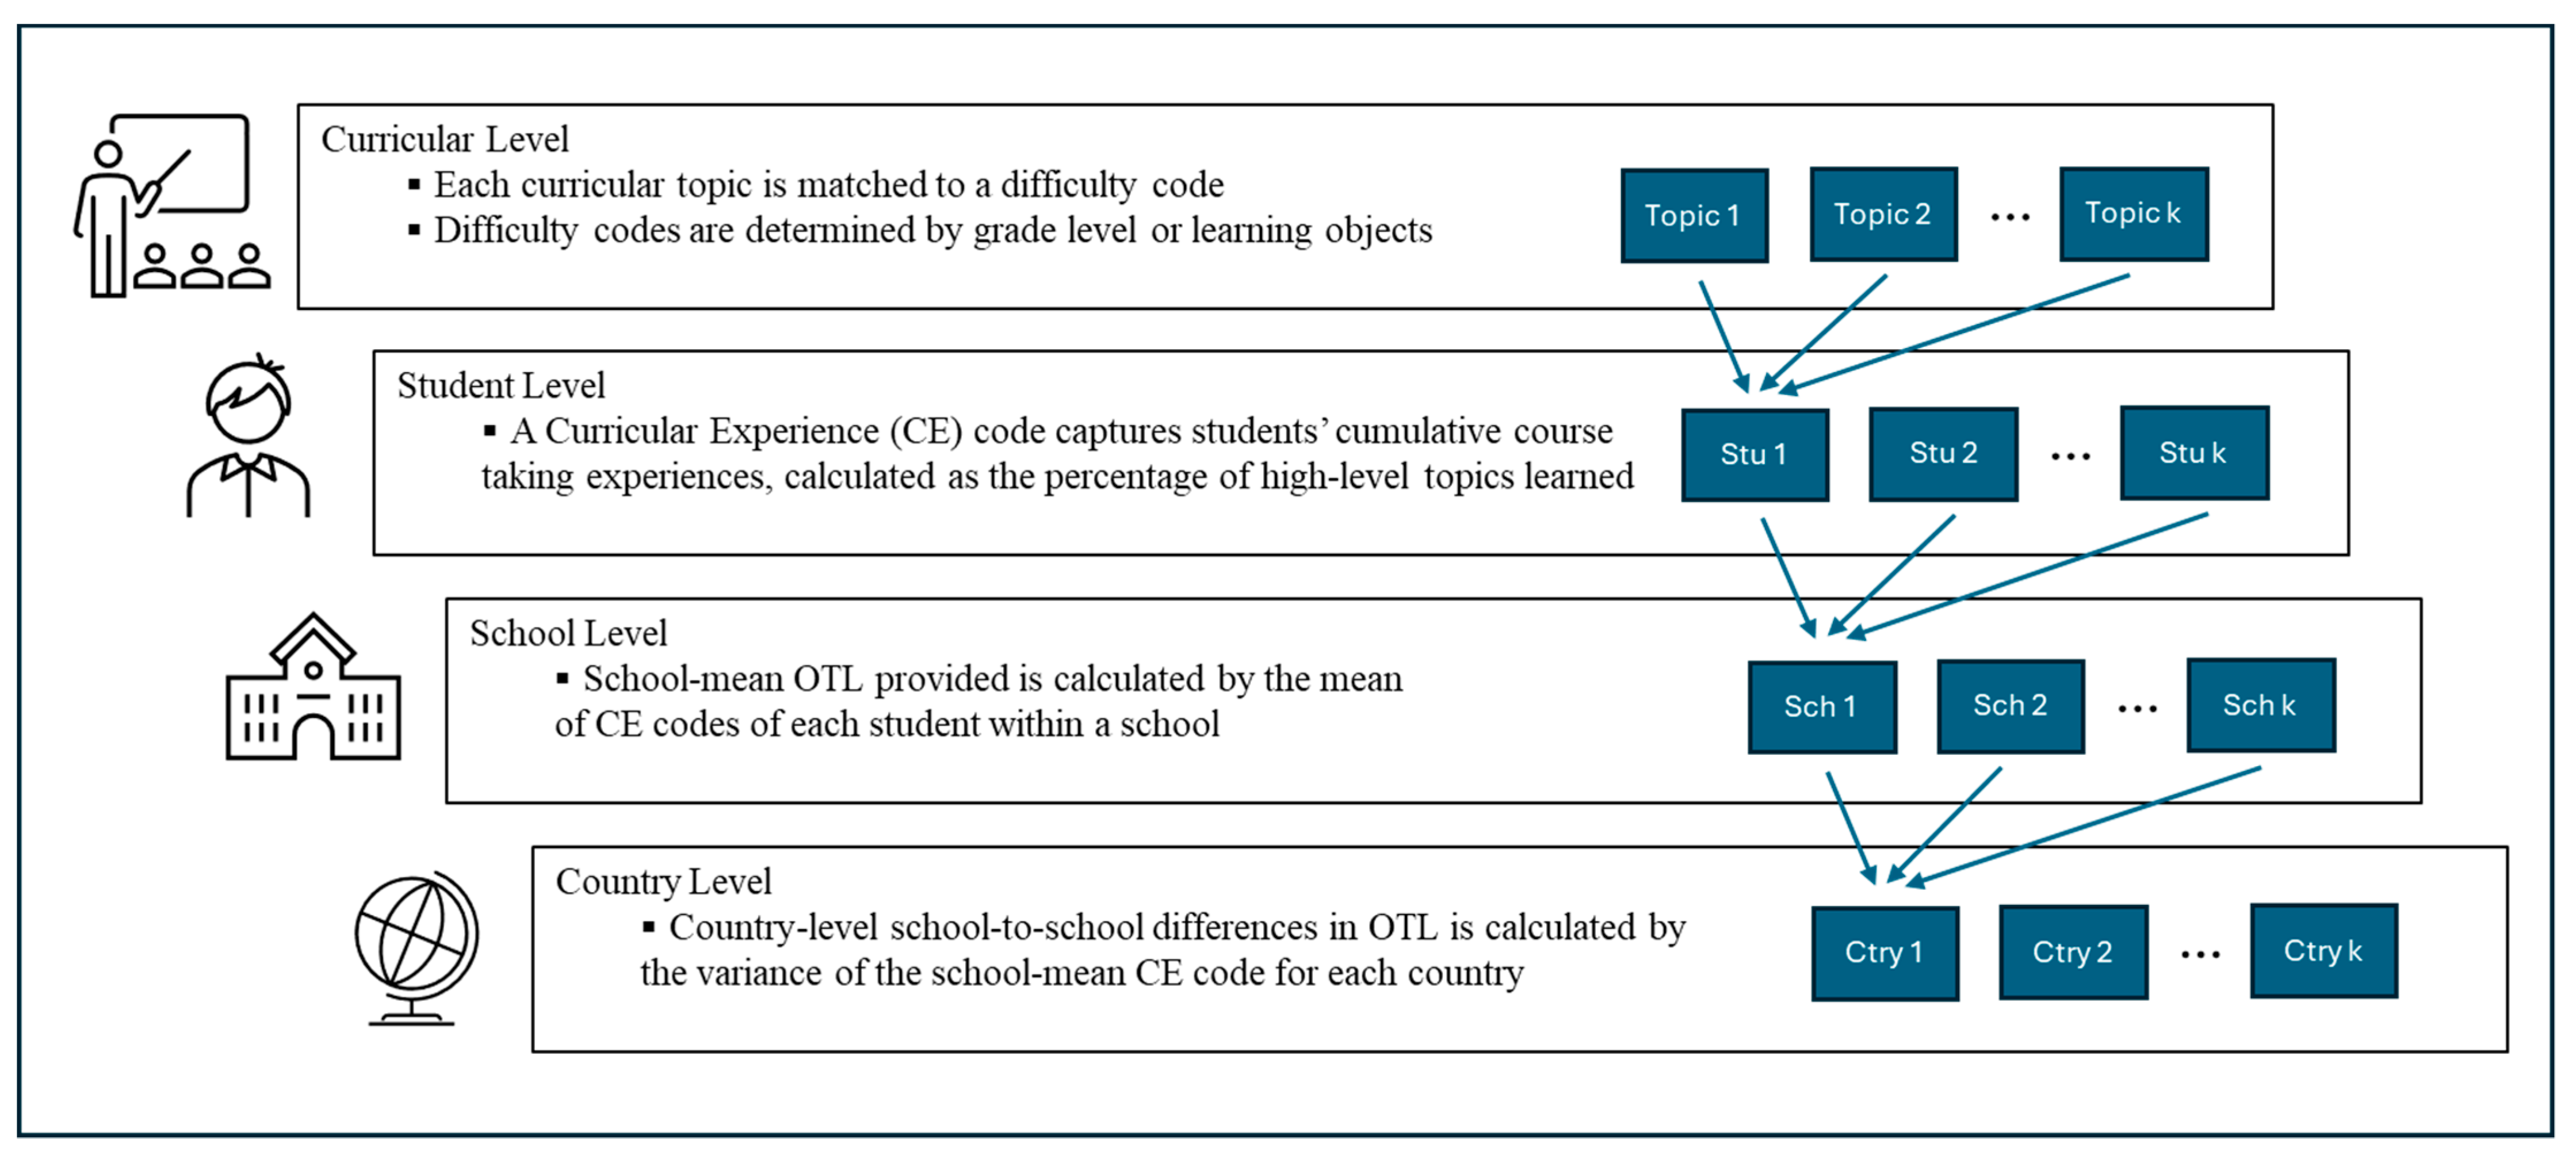
Difficulty Coding of Curricular Topic Report
Individual Student-Level Measures of Course-Taking Experience
Country-Level Measures of Inequality in OTL
3.1.2. Independent Measures
3.2. Statistical Analyses
4. Results
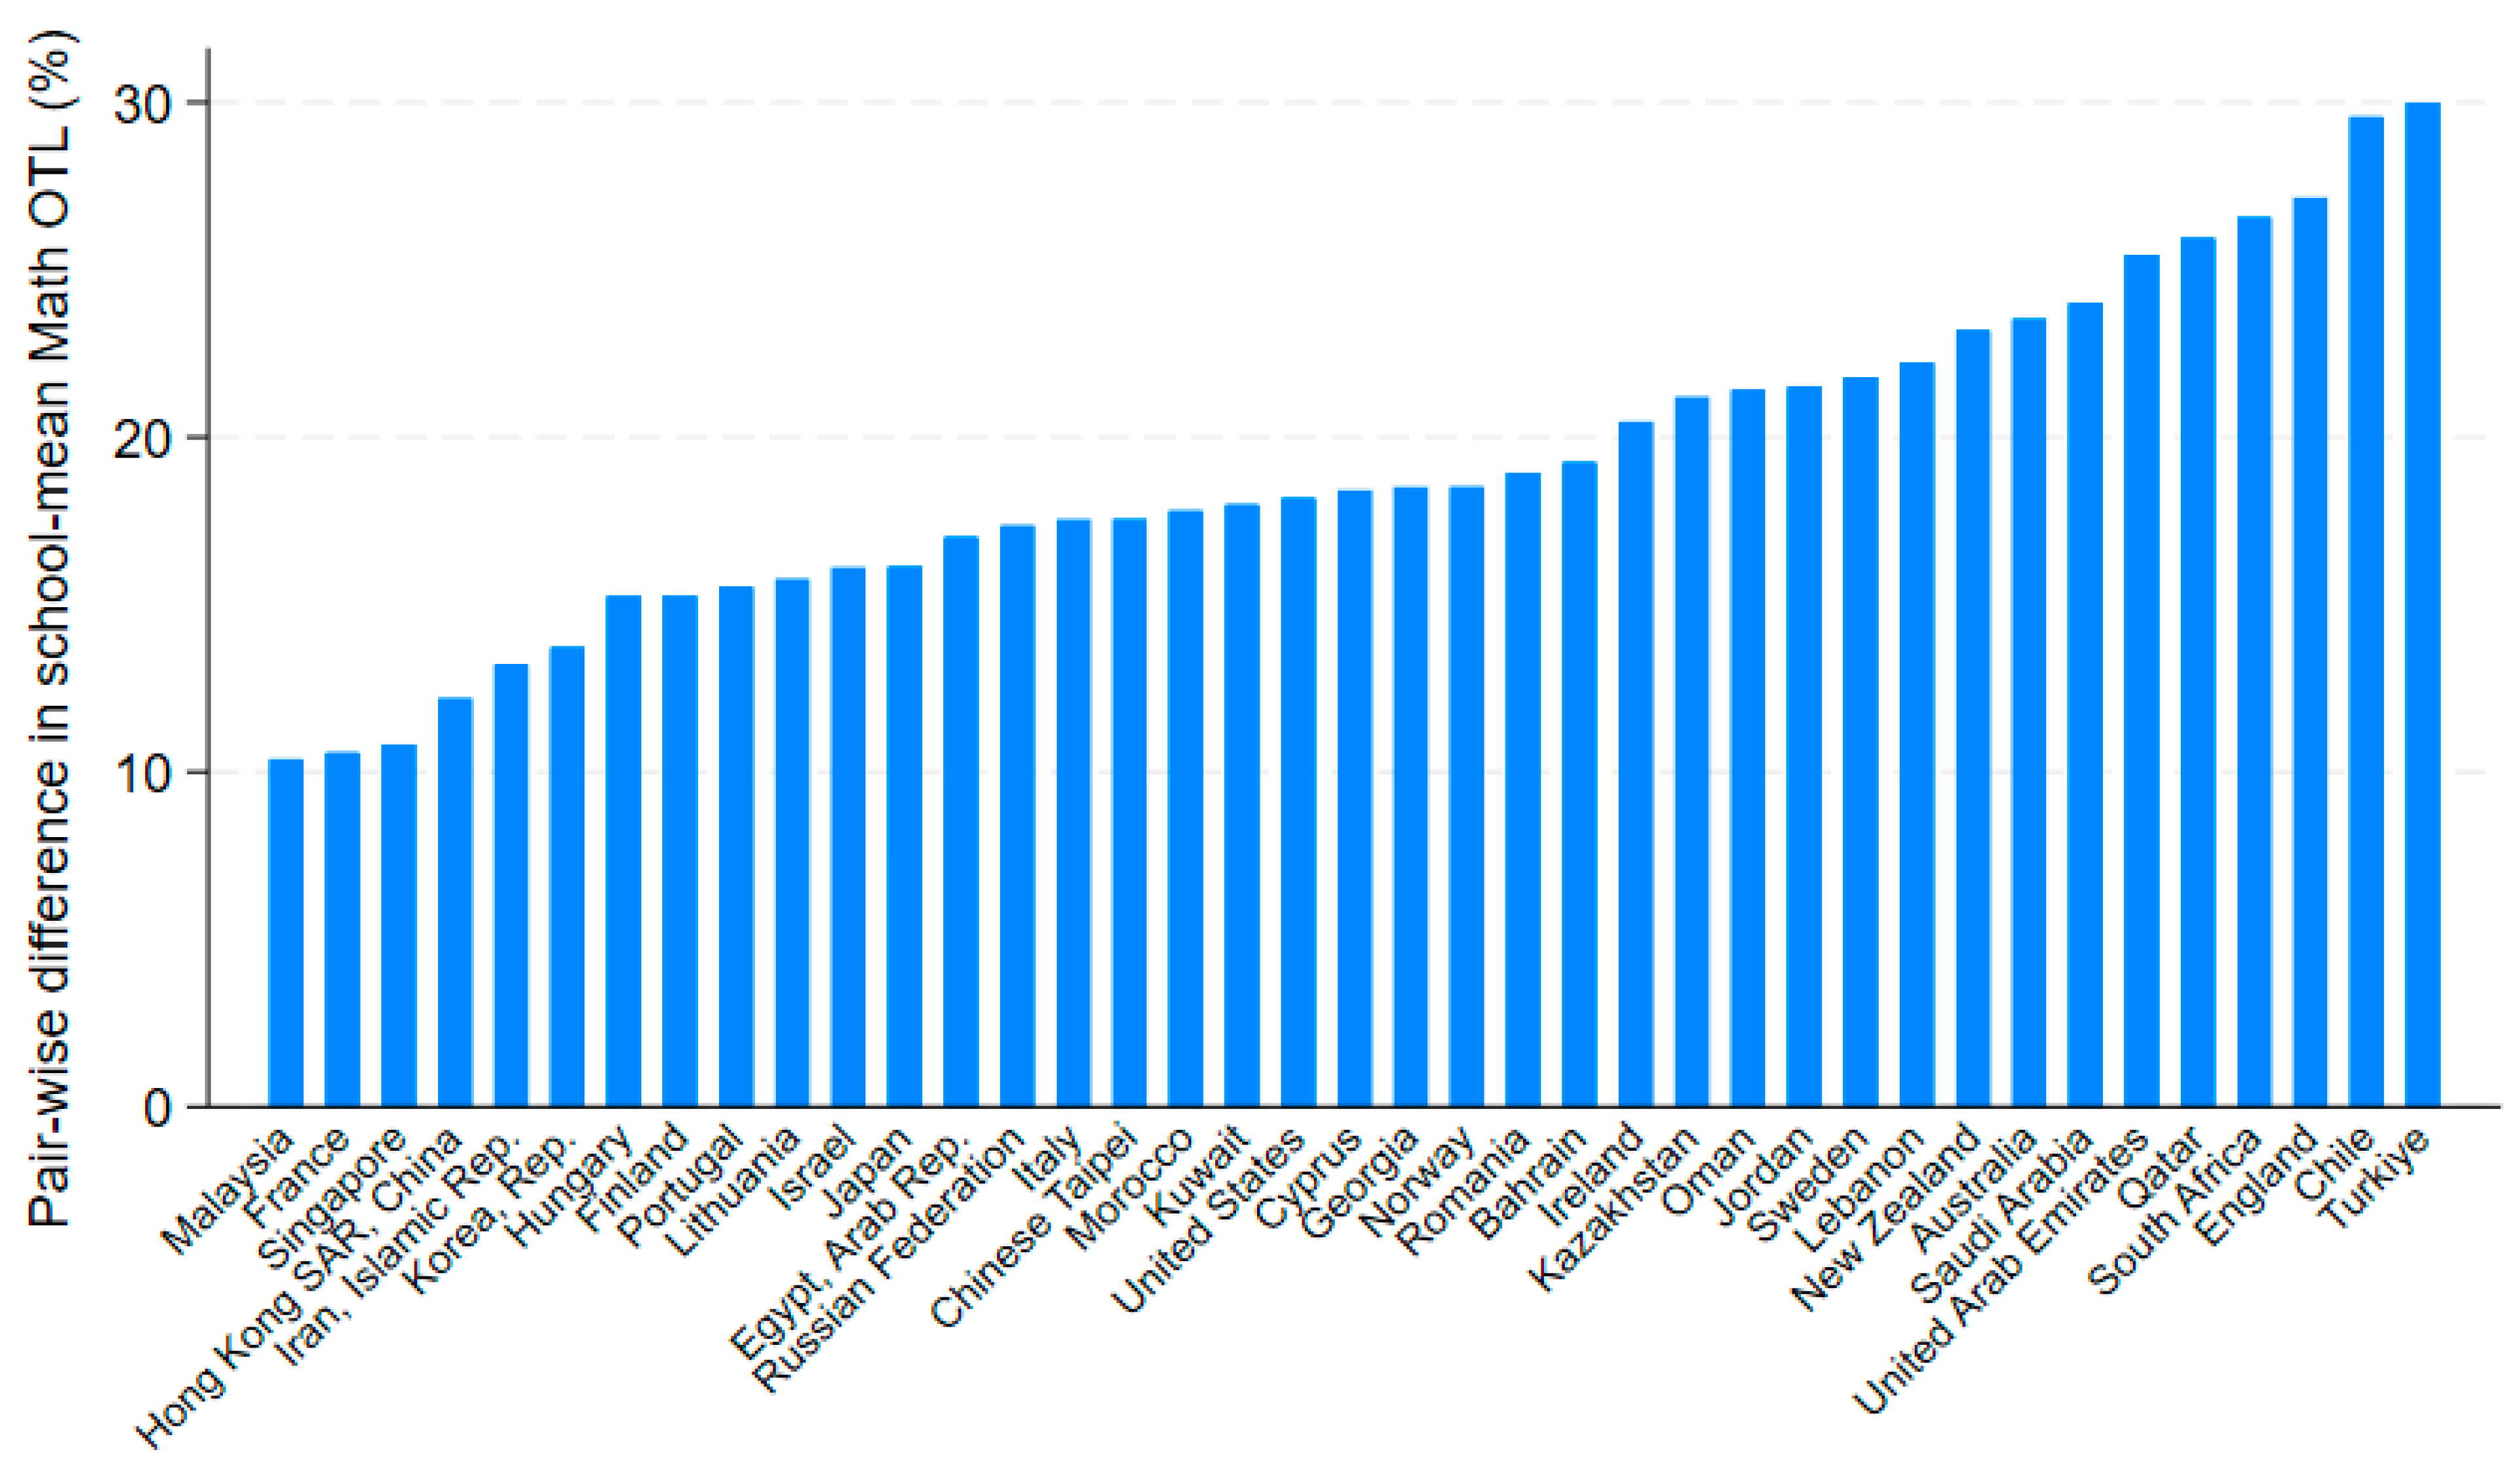
4.1. Descriptive Statistics
4.2. Model Estimation Results
4.2.1. Hypothesis 1: The Role of Social Inequality in Generating Educational Inequality
| Model 1 | Model 2 | Model 3 | Model 4 | Model 5 | |
|---|---|---|---|---|---|
| Year | −0.001 (0.009) a | −0.003 (0.008) | −0.006 (0.012) | −0.015 (0.011) | 0.006 (0.013) |
| Construct 1: Developmental Stages | |||||
| 1. Labor shift from agricultural sector (%) | −0.005 (0.004) | −0.005 (0.004) | 0.002 (0.008) | ||
| 2. Size of non-agricultural sector (%) | 0.011 (0.006) ~ | 0.017 (0.008) * | 0.069 (0.019) ** | ||
| 3. Natural population increase rate (per 1000 people) | 0.011 (0.004) ** | 0.016 (0.005) ** | 0.007 (0.005) | ||
| 4. Tertiary education enrollment rate (%) | −0.048 (0.013) ** | −0.033 (0.012) * | −0.110 (0.030) ** | ||
| 5. GDP per capita (unit: 1000 US$) | 0.001 (0.001) | 0.002 (001) * | 0.002 (0.001) ~ | ||
| Construct 2: Social Inequality Measures | |||||
| 6. Index of inequality of rural population distribution (Standardized) | 0.028 (0.007) ** | 0.140 (0.068) * | 0.177 (0.078) * | 0.110 (0.034) ** | |
| 7. Income GINI coefficient | 0.005 (0.023) | 0.020 (0.023) | 0.033 (0.022) | 0.007 (0.022) | |
| 8. GINI Square | −0.000 (0.000) | −0.000 (0.000) | −0.000 (0.000) | −0.000 (0.000) | |
| Construct 3: Functionalism | |||||
| 9. School-to-school differences in prior math achievement (standard deviation) | 0.092 (0.017) *** | 0.101 (0.022) *** | |||
| Construct 4: Educational Policy | |||||
| 10. Academic-based promotion policies | 0.031 (0.059) | ||||
| 11. Promotion × inequality of rural population distribution | −0.013 (0.058) | ||||
| 12. Within-school sorting policies | −0.033 (0.016) * | ||||
| 13. Sorting × inequality of rural population distribution | 0.156 (0.044) ** | ||||
| 14. High-stakes exam before 8th grade | 0.132 (0.112) | ||||
| 15. High-stakes exam × inequality of rural population distribution | −0.058 (0.033) ~ | ||||
| Country-level covariates | No | No | Yes | Yes | Yes |
| 0.016 | 0.015 | 0.014 | 0.012 | 0.012 | |
| 0.015 | 0.011 | 0.010 | 0.007 | 0.007 | |
| Model 1 | Model 2 | Model 3 | Model 4 | Model 5 | |
|---|---|---|---|---|---|
| Year | 0.000 (0.001) a | −0.002 (0.011) | −0.008 (0.012) | −0.007 (0.013) | −0.000 (0.016) |
| Construct 1: Developmental Stages | |||||
| 1. Labor shift from agricultural sector (%) | −0.002 (0.006) | −0.002 (0.006) | 0.003 (0.009) | ||
| 2. Size of non-agricultural sector (%) | −0.016 (0.019) | −0.016 (0.018) | −0.017 (0.017) | ||
| 3. Natural population increase rate (per 1000 people) | 0.008 (0.004) * | 0.018 (0.008) * | 0.012 (0.004) ** | ||
| 4. Tertiary education enrollment rate (%) | 0.012 (0.012) | 0.001 (0.001) | 0.002 (0.002) | ||
| 5. GDP per capita (unit: 1000 US$) | 0.000 (0.001) | 0.006 (0.002) * | 0.001 (0.001) | ||
| Construct 2: Social Inequality Measures | |||||
| 6. Index of inequality of rural population distribution (Standardized) | 0.009 (0.006) | 0.085 (0.028) ** | 0.088 (0.038) * | 0.104 (0.063) ~ | |
| 7. Income GINI coefficient | 0.012 (0.015) | 0.022 (0.020) | 0.022 (0.021) | 0.007 (0.011) | |
| 8. GINI Square | −0.000 (0.000) | −0.000 (0.000) | −0.000 (0.000) | −0.000 (0.000) | |
| Construct 3: Functionalism | |||||
| 9. School-to-school differences in prior science achievement (standard deviation) | 0.053 (0.021) * | 0.052 (0.025) * | |||
| Construct 4: Educational Policy | |||||
| 10. Academic-based promotion policies | 0.038 (0.064) | ||||
| 11. Promotion × inequality of rural population distribution | −0.015 (0.012) | ||||
| 12. Within-school sorting policies | −0.007 (0.012) | ||||
| 13. Sorting × inequality of rural population distribution | −0.094 (0.087) | ||||
| 14. High-stakes exam before 8th grade | 0.043 (0.055) | ||||
| 15. High-stakes exam × inequality of rural population distribution | −0.038 (0.031) | ||||
| Country-level covariates | No | No | Yes | Yes | Yes |
| 0.021 | 0.021 | 0.021 | 0.021 | 0.016 | |
| 0.007 | 0.005 | 0.005 | 0.002 | 0.001 | |
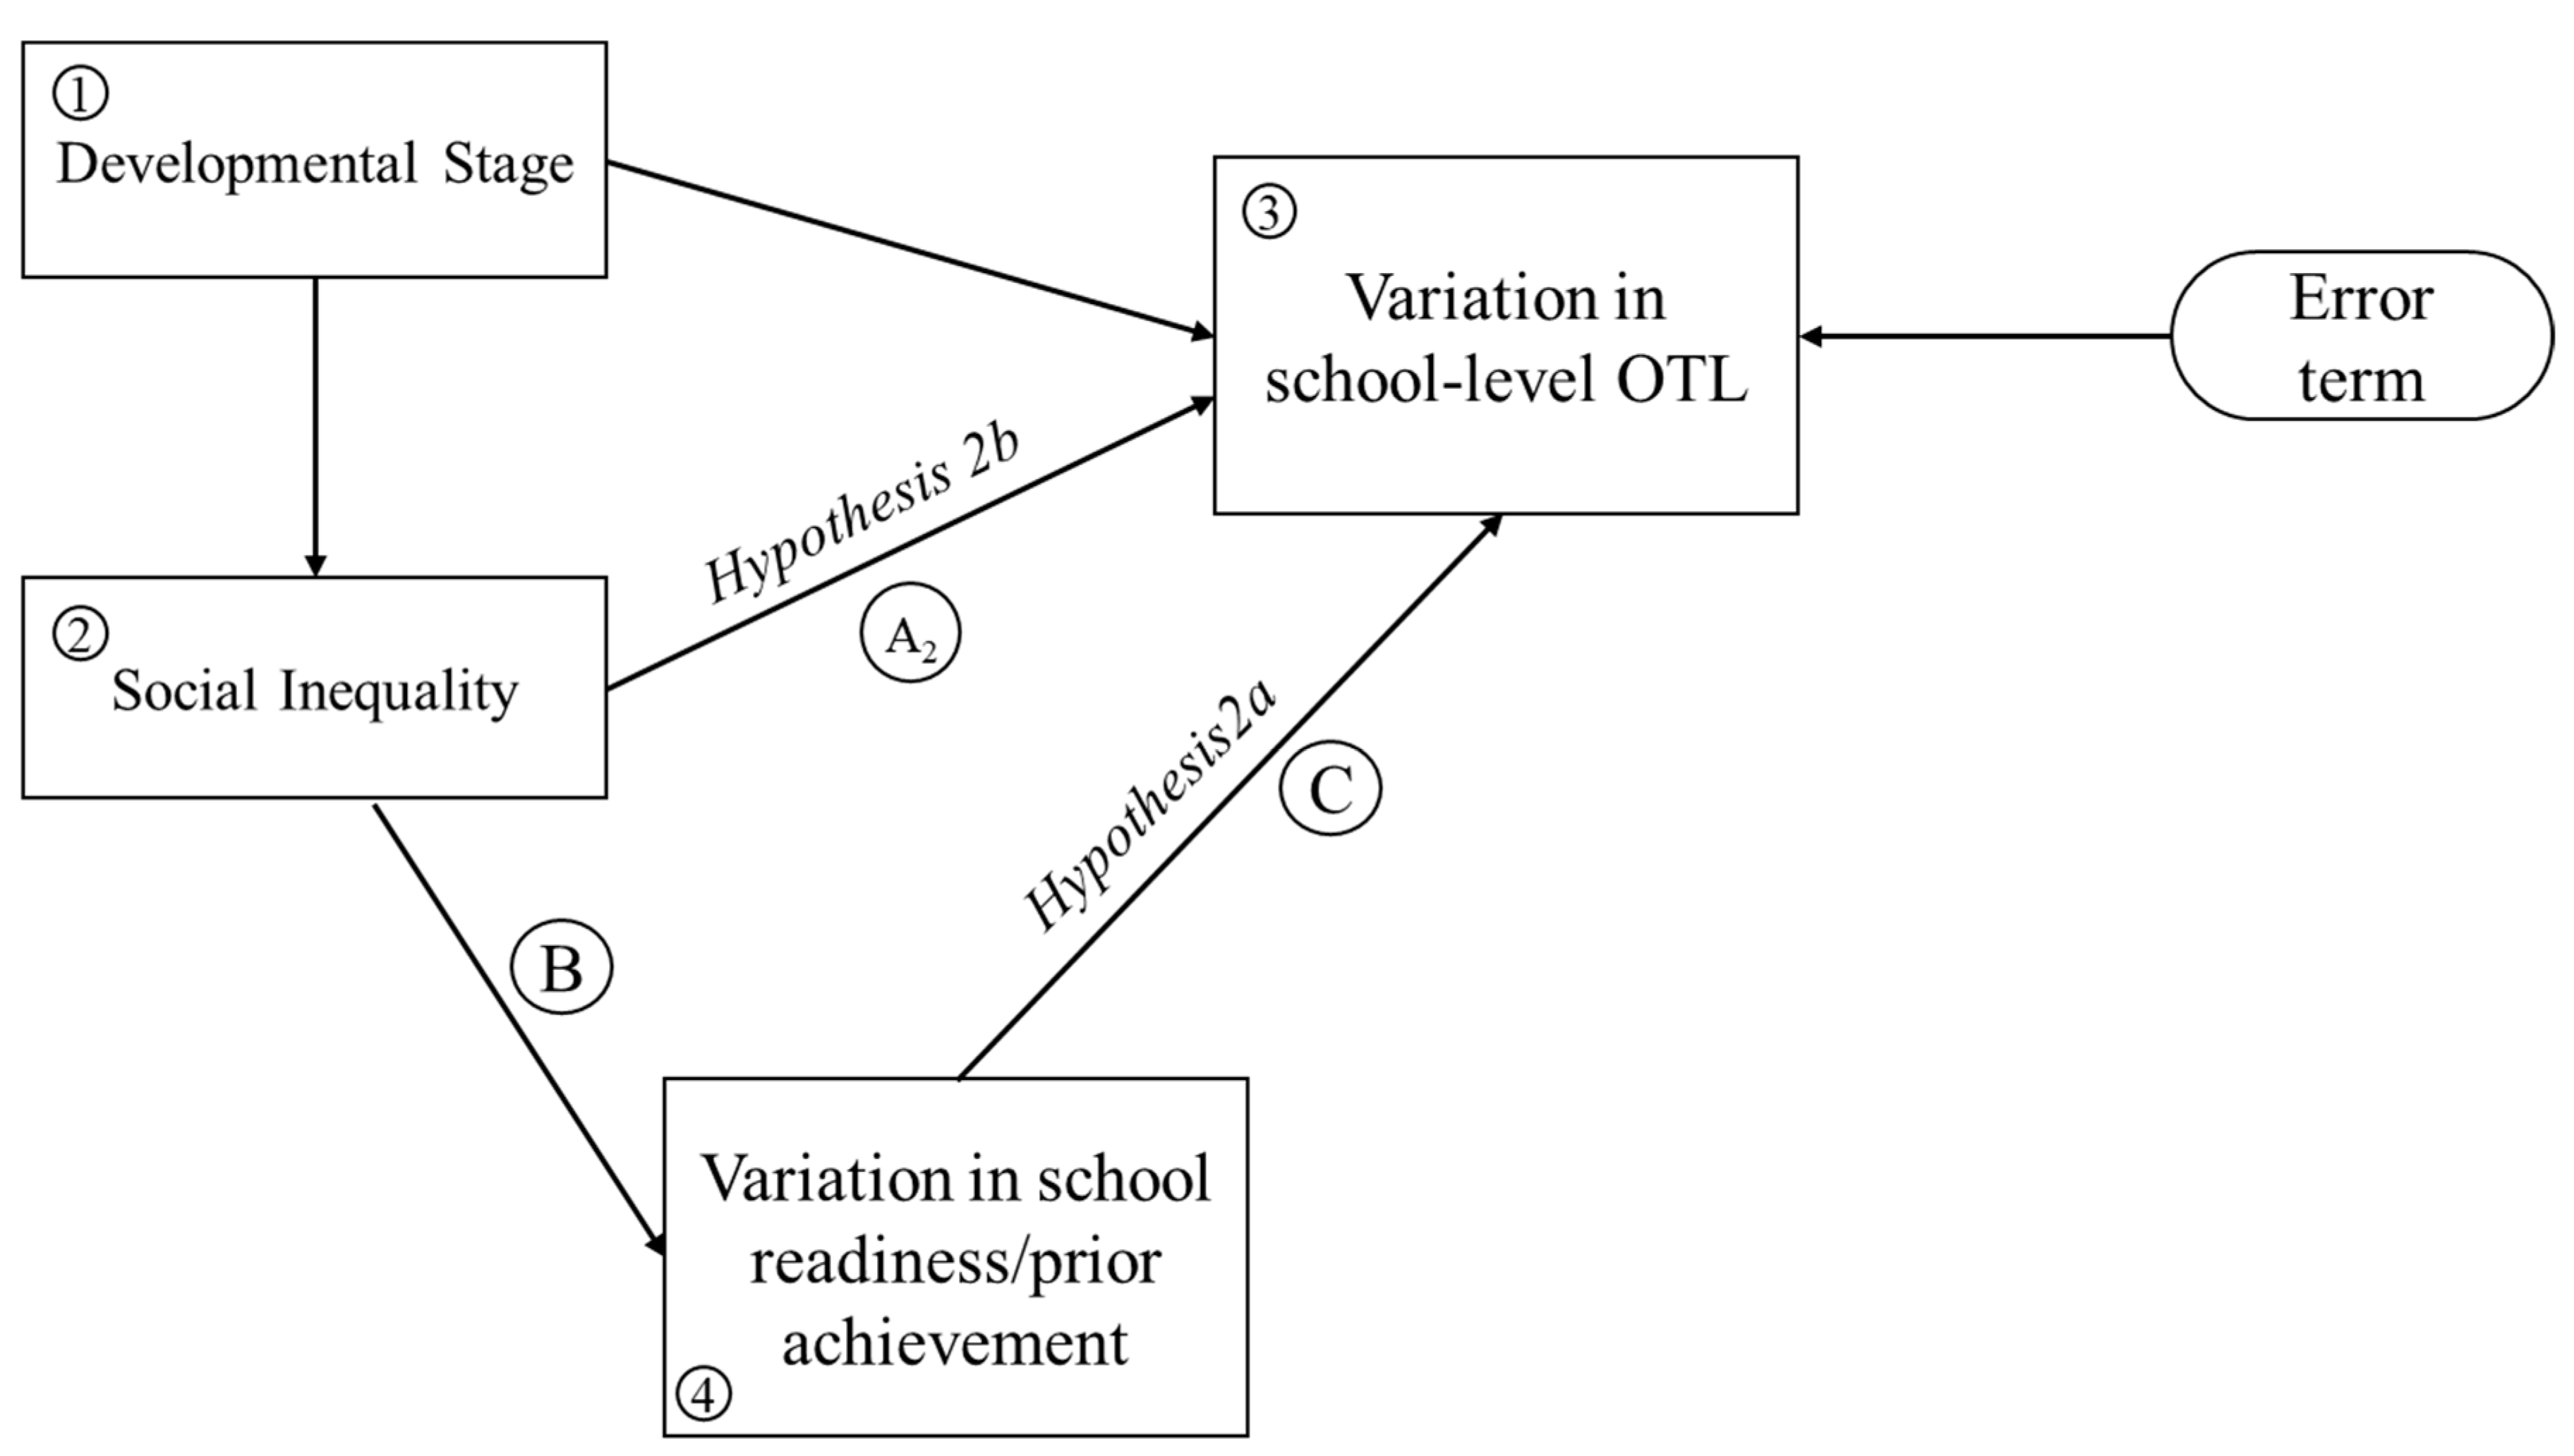
4.2.2. Hypothesis 2: Functional Sources of School-to-School Differences in OTL: Variation in School Readiness
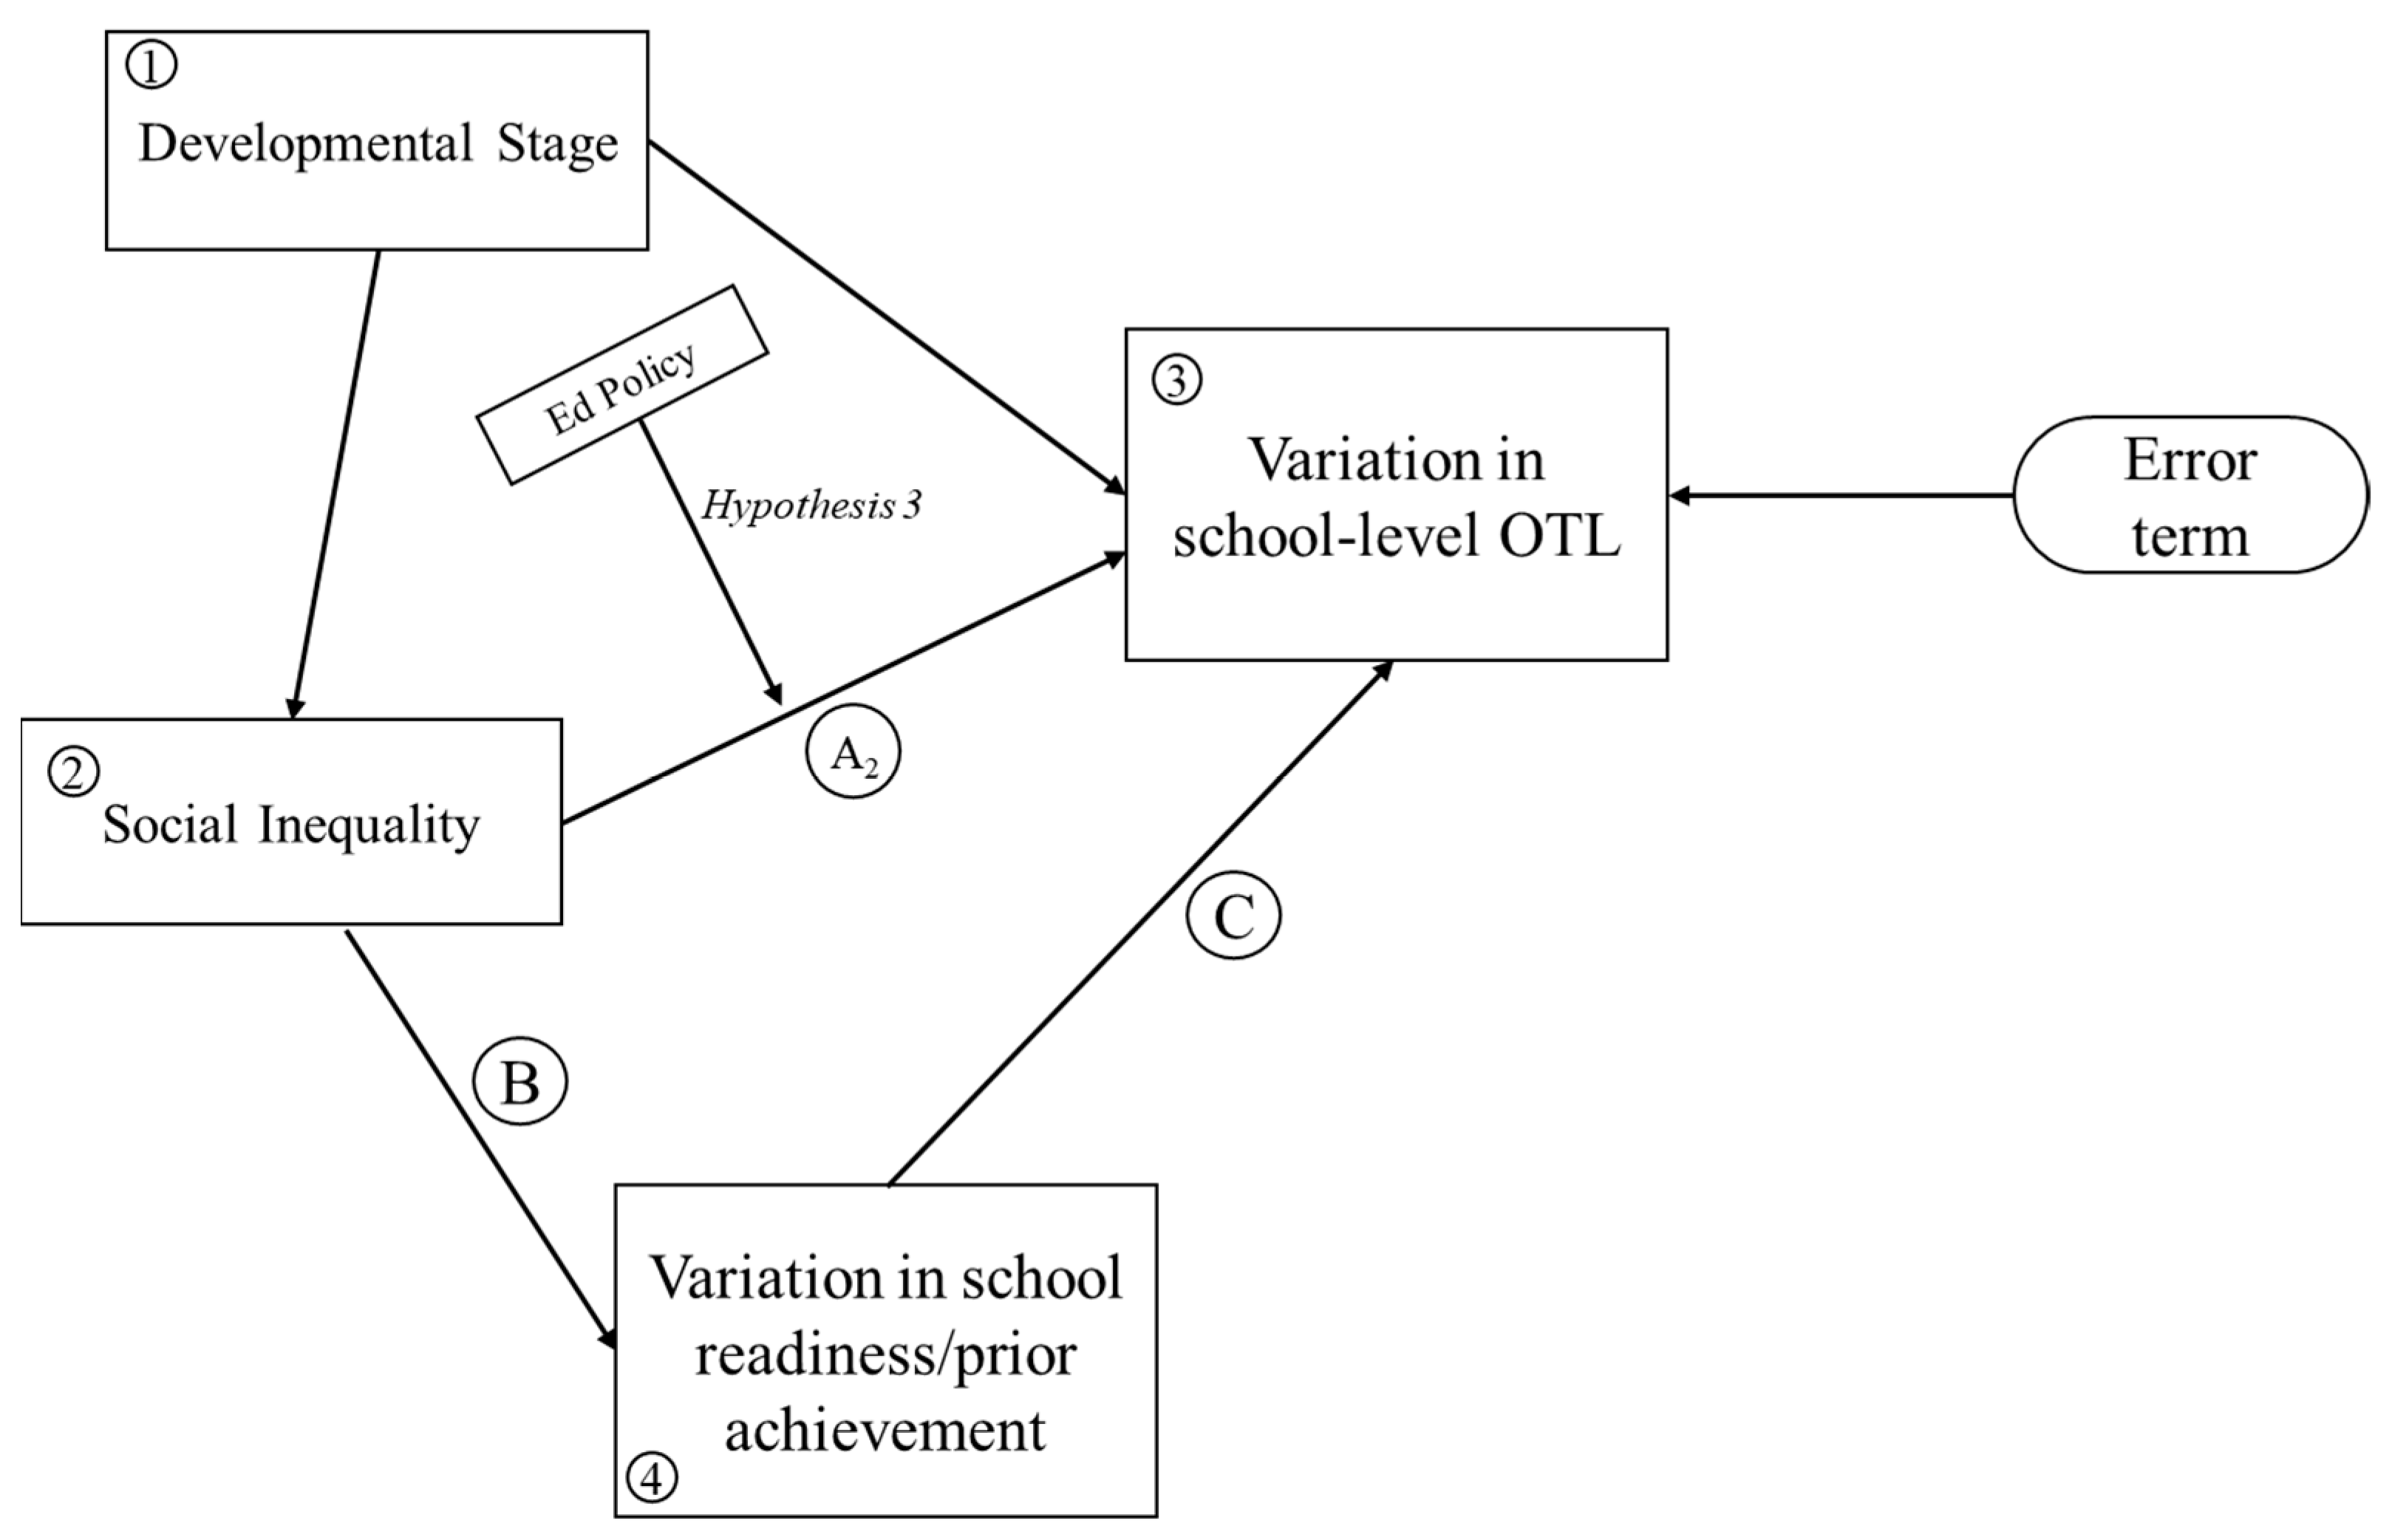
4.2.3. Hypothesis 3: Stratification and Standardization Policies as Moderator
4.3. Robustness Analysis
| Model 1: Math CE | Model 2: Science CE | |
|---|---|---|
| Year | 0.005 (0.013) a | 0.001 (0.001) |
| Construct 1: Developmental Stage | ||
| 1. Labor shift from agricultural sector (%) | 0.005 (0.007) | 0.003 (0.010) |
| 2. Size of non-agricultural sector (%) | 0.084 (0.038) * | −0.006 (0.008) |
| 3. Natural population increase rate (per 1000 people) | 0.007 (0.003) * | 0.013 (0.004) ** |
| 4. Tertiary education enrollment rate (%) | −0.131 (0.035) ** | 0.002 (0.001) |
| 5. GDP per capita (unit: 1000 US$) | 0.002 (0.001) ~ | 0.001 (0.001) |
| Construct 2: Social Inequality Measures | ||
| 6. Index of inequality of rural population distribution (Standardized) | 0.077 (0.028) ** | 0.139 (0.024) ** |
| 7. Income GINI coefficient | 0.015 (0.008) * | 0.009 (0.012) |
| 8. GINI Square | −0.000 (0.000) | −0.000 (0.000) |
| Construct 3: Functionalism | ||
| 9. School-to-school differences in prior math/science achievement (standard deviation) | 0.104 (0.022) *** | 0.049 (0.023) * |
| Construct 4: Educational Policy | ||
| 10. Academic-based promotion policies | 0.026 (0.060) | 0.034 (0.061) |
| 11. Promotion × inequality of rural population distribution | 0.007 (0.005) | −0.005 (0.052) |
| 12. Within-school sorting policies | −0.067 (0.013) ** | −0.026 (0.011) * |
| 13. Sorting × inequality of rural population distribution | 0.117 (0.054) * | 0.072 (0.074) |
| 14. High-stakes exam before 8th grade | −0.015 (0.044) | 0.044 (0.052) |
| 15. High-stakes exam × inequality of rural population distribution | −0.059 (0.029) * | 0.042 (0.047) |
| Country-level covariates | Yes | Yes |
| Model 1 | Model 2 | Model 3 | Model 4 | |
|---|---|---|---|---|
| Year | 0.016 (0.011) a | 0.015 (0.013) | 0.007 (0.012) | 0.012 (0.012) |
| Construct 1: Development Stage | ||||
| 1. Labor shift from agricultural sector (%) | 0.006 (0.007) | 0.005 (0.007) | 0.006 (0.009) | |
| 2. Size of non-agricultural sector (%) | 0.017 (0.008) * | 0.017 (0.008) * | 0.061 (0.018) ** | |
| 3. Natural population increase rate (per 1000 people) | 0.016 (0.004) *** | 0.016 (0.005) ** | 0.009 (0.005) ~ | |
| 4. Tertiary education enrollment rate (%) | −0.033 (0.015) * | −0.020 (0.008) * | −0.080 (0.016) *** | |
| 5. GDP per capita (unit: 1000 US$) | 0.001 (0.001) | 0.002 (0.001) ~ | 0.004 (0.001) ** | |
| Construct 2: Social Inequality Measures | ||||
| 6. Index of inequality of rural population distribution (Standardized) | 0.011 (0.013) | 0.040 (0.013) * | 0.081 (0.041) * | 0.111 (0.049) * |
| 7. Income GINI coefficient | 0.012 (0.008) | 0.038 (0.013) * | 0.032 (0.015) * | 0.024 (0.026) |
| 8. GINI Square | −0.000 (0.000) | −0.000 (0.000) | −0.000 (0.000) | −0.000 (0.000) |
| Construct 3: Functionalism | ||||
| 9. School-to-school differences in prior math achievement (standard deviation) | 0.079 (0.028) ** | 0.103 (0.034) ** | ||
| Construct 4: Educational Policy | ||||
| 10. Academic-based promotion policies | 0.083 (0.066) | |||
| 11. Promotion × inequality of rural population distribution | −0.024 (0.064) | |||
| 12. Within-school sorting policies | 0.138 (0.168) | |||
| 13. Sorting × inequality of rural population distribution | 0.209 (0.102) * | |||
| 14. High-stakes exam before 8th grade | 0.082 (0.059) | |||
| 15. High-stakes exam × inequality of rural population distribution | −0.030 (0.027) | |||
| Country-level Covariates | No | Yes | Yes | Yes |
5. Discussion and Limitations
5.1. Discussion
5.2. Limitations and Future Work
Supplementary Materials
Author Contributions
Funding
Institutional Review Board Statement
Informed Consent Statement
Data Availability Statement
Acknowledgments
Conflicts of Interest
| 1 | In additional to cross-national analyses, this model has been applied to single-country analyses, such as studies using US data (e.g., Partridge 2005). |
| 2 | As a reference, the weighted grand-mean of school-mean percentage of high-level math topics learned across all sampled schools for the 2019 cohort is 60.2%. A 30-percentage-point difference in math CE between two random-selected schools is almost half of the grand-mean of school-mean MCE. |
References
- Alderson, Arthur S., and François Nielsen. 1999. Income Inequality, Development, and Dependence: A Reconsideration. American Sociological Review 64: 606–31. [Google Scholar] [CrossRef]
- Allmendinger, Jutta. 1989. Educational Systems and Labor Market Outcomes. European Sociological Review 5: 231–50. [Google Scholar] [CrossRef]
- Ammermueller, Andreas. 2005. Educational Opportunities and the Role of Institutions. 05-044. Mannheim: Zentrum für Europäische Wirtschaftsforschung. [Google Scholar] [CrossRef]
- Ayalon, Hanna, and Adam Gamoran. 2000. Stratification in Academic Secondary Programs and Educational Inequality in Israel and the United States. Comparative Education Review 44: 54–80. [Google Scholar] [CrossRef]
- Baker, David P., and David L. Stevenson. 1986. Mothers’ Strategies for Children’s School Achievement: Managing the Transition to High School. Sociology of Education 59: 156. [Google Scholar] [CrossRef]
- Bol, Thijs, Jacqueline Witschge, Herman G. Van de Werfhorst, and Jaap Dronkers. 2014. Curricular Tracking and Central Examinations: Counterbalancing the Impact of Social Background on Student Achievement in 36 Countries. Social Forces 92: 1545–72. [Google Scholar] [CrossRef]
- Broaded, C. Montgomery. 1997. The Limits and Possibilities of Tracking: Some Evidence from Taiwan. Sociology of Education 70: 36–53. [Google Scholar] [CrossRef]
- Brunello, Giorgio, and Daniele Checchi. 2007. Does School Tracking Affect Equality of Opportunity? New International Evidence. Economic Policy 22: 781–861. [Google Scholar] [CrossRef]
- Buchmann, Claudia, and Ben Dalton. 2002. Interpersonal Influences and Educational Aspirations in 12 Countries: The Importance of Institutional Context. Sociology of Education 75: 99–122. [Google Scholar] [CrossRef]
- Buchmann, Claudia, and Hyunjoon Park. 2009. Stratification and the Formation of Expectations in Highly Differentiated Educational Systems. Research in Social Stratification and Mobility 27: 245–67. [Google Scholar] [CrossRef]
- Chmielewski, Anna K., Hanna Dumont, and Ulrich Trautwein. 2013. Tracking Effects Depend on Tracking Type: An International Comparison of Students’ Mathematics Self-Concept. American Educational Research Journal 50: 925–57. [Google Scholar] [CrossRef]
- Clark, Rob. 2020. Income Inequality in the Post-2000 Era: Development, Globalization, and the State. International Sociology 35: 260–83. [Google Scholar] [CrossRef]
- Cole, Wade M. 2018. Poor and Powerless: Economic and Political Inequality in Cross-National Perspective, 1981–2011. International Sociology 33: 357–85. [Google Scholar] [CrossRef]
- Coleman, James S. 1968. Equality of Educational Opportunity. Equity & Excellence in Education 6: 19–28. [Google Scholar] [CrossRef]
- Downey, Douglas. 2020. How Schools Really Matter: Why Our Assumption about Schools and Inequality Is Mostly Wrong. Chicago: University of Chicago Press. [Google Scholar]
- Hallinan, Maureen T. 1994. Tracking: From Theory to Practice. Sociology of Education 67: 79. [Google Scholar] [CrossRef]
- Hanushek, Eric A., and Ludger Wößmann. 2006. Does Educational Tracking Affect Performance and Inequality? Differences-in-Differences Evidence across Countries. The Economic Journal 116: C63–C76. [Google Scholar] [CrossRef]
- Horn, Daniel. 2009. Age of Selection Counts: A Cross-Country Analysis of Educational Institutions. Educational Research and Evaluation 15: 343–66. [Google Scholar] [CrossRef]
- Huang, Min Hsiung. 2009. Classroom Homogeneity and the Distribution of Student Math Performance: A Country-Level Fixed-Effects Analysis. Social Science Research 38: 781–91. [Google Scholar] [CrossRef]
- Kelly, Sean, and Heather Price. 2011. The Correlates of Tracking Policy: Opportunity Hoarding, Status Competition, or a Technical-Functional Explanation? American Educational Research Journal 48: 560–85. [Google Scholar] [CrossRef]
- Kerckhoff, Alan C. 2001. Education and Social Stratification Processes in Comparative Perspective. Sociology of Education 74: 3–18. [Google Scholar] [CrossRef]
- Kuznets, Simon. 1955. Economic Growth and Income Inequality. The American Economic Review 45: 1–28. [Google Scholar]
- Long, Daniel A., Sean Kelly, and Adam Gamoran. 2012. Whither the Virtuous Cycle? Past and Future Trends in Black-White Inequality in Educational Attainment. Social Science Research 41: 16–32. [Google Scholar] [CrossRef]
- Marks, Gary N. 2005. Cross-National Differences and Accounting for Social Class Inequalities in Education. International Sociology 20: 483–505. [Google Scholar] [CrossRef]
- Maurice, Marc, Francois Sellier, and Jean-Jacques Silvestre. 1985. The Social Foundations of Industrial Power: A Comparison of France and Germany. Cambridge: The MIT Press. [Google Scholar]
- Montt, Guillermo. 2011. Cross-National Differences in Educational Achievement Inequality. Sociology of Education 84: 49–68. [Google Scholar] [CrossRef]
- Müller, Walter, and Wolfgang Karle. 1993. Social Selection in Educational Systems in Europe. European Sociological Review 9: 1–23. [Google Scholar] [CrossRef]
- Nielsen, F. 1994. Income Inequality and Industrial Development: Dualism Revisited. American Sociological Review 59: 654–77. [Google Scholar] [CrossRef]
- Nielsen, F., and A. S. Alderson. 1995. Income Inequality, Development, and Dualism: Results from an Unbalanced Cross-National Panel. American Sociological Review 60: 674–701. [Google Scholar] [CrossRef]
- Nielsen, François, and Arthur S. Alderson. 1997. The Kuznets Curve and the Great U-Turn: Income Inequality in U.S. Counties, 1970 to 1990. American Sociological Review 62: 12–33. [Google Scholar] [CrossRef]
- Oakes, Jeannie. 1992. Can Tracking Research Inform Practice? Technical, Normative, and Political Considerations. Educational Researcher 21: 12–21. [Google Scholar] [CrossRef]
- Oakes, Jeannie, and Martin Lipton. 1992. Detracking Schools: Early Lessons from the Field. The Phi Delta Kappan 73: 448–54. [Google Scholar]
- Park, Hyunjoon. 2008. The Varied Educational Effects of Parent-Child Communication: A Comparative Study of Fourteen Countries. Comparative Education Review 52: 219–43. [Google Scholar] [CrossRef]
- Parker, Philip D., John Jerrim, Ingrid Schoon, and Herbert W. Marsh. 2016. A Multination Study of Socioeconomic Inequality in Expectations for Progression to Higher Education: The Role of Between-School Tracking and Ability Stratification. American Educational Research Journal 53: 6–32. [Google Scholar] [CrossRef]
- Partridge, Mark D. 2005. Does Income Distribution Affect U.S. State Economic Growth? Journal of Regional Science 45: 363–94. [Google Scholar] [CrossRef]
- Turner, R. H. 1960. Sponsored and Contest Mobility and the School System. American Sociological Review 25: 855–67. [Google Scholar] [CrossRef]
- United Nations. n.d. Goal 4: Ensure Inclusive and Equitable Quality Education and Promote Lifelong Learning Opportunities for All. Available online: https://Sdgs.Un.Org/Goals/Goal4 (accessed on 1 August 2023).
- Useem, Elizabeth L. 1991. Student Selection into Course Sequences in Mathematics: The Impact of Parental Involvement and School Policies. Journal of Research on Adolescence 1: 231–50. [Google Scholar] [CrossRef]
- Van De Werfhorst, Herman G., and Jonathan J. B. Mijs. 2010. Achievement Inequality and the Institutional Structure of Educational Systems: A Comparative Perspective. Annual Review of Sociology 36: 407–28. [Google Scholar] [CrossRef]
- Van Houtte, Mieke. 2004. Tracking Effects on School Achievement: A Quantitative Explanation in Terms of the Academic Culture of School Staff. American Journal of Education 110: 354–88. [Google Scholar] [CrossRef]
- Wells, Amy Stuart, and Jeannie Oakes. 1996. Potential Pitfalls of Systemic Reform: Early Lessons from Research on Detracking. Sociology of Education 69: 135–43. [Google Scholar] [CrossRef]
- Xu, Shangmou, and Sean Kelly. 2020. Re-Examining the Public–Catholic School Gap in STEM Opportunity to Learn: New Evidence from HSLS. Social Sciences 9: 137. [Google Scholar] [CrossRef]

| IVs | Description |
|---|---|
| Developmental Stage | |
| GDP per capita | The GDP per capita in constant 2010 US dollars. Dataset is drawn from the World Bank. |
| Labor shift from agricultural sector (%) | Labor shift is calculated as the difference between the percentage of the population in rural areas and the share of agriculture, forestry, and fishing as a percent of GDP, i.e., how impactful the rural economy is compared to its population share. Both population data and GDP data are drawn from the World Bank. |
| Size of non-agricultural sector (%) | Size of the non-agricultural sector is measured as the share of the population that do not live in rural areas. |
| Tertiary education enrollment rate (%) | Tertiary education enrollment rate is derived from the World Bank. |
| Natural population increase rate (per 1000 people) | Natural rate of population increase is calculated as the difference between crude birth rate and crude death rate. Both datasets are drawn from the World Bank. |
| Social Inequality Measures | |
| Income GINI coefficient | GINI coefficient of income inequality for each country. Data is derived from the World Bank. |
| Index of inequality of rural population distribution | Measured as Index of inequality/variation of rural population distribution. This index measures the inequality of the distribution of rural population (in percentage ), i.e., countries with a high or low percentage of the population in rural areas are less affected by the dichotomy between urban/suburban and rural life. Countries in the process of shifting from rural to urban residency have a higher degree of variation in residency. The index is calculated as . |
| Variance in Prior Achievement | |
| Variance in prior achievement | Calculated school-level variance in math std. achievement test scores, administered at the start of 8th grade from TIMSS datasets. |
| Educational Policy | |
| Academic-based promotion before 8th grade | National policy on promotion/retention based on academic progress before the end of 8th grade. Dummy variable. |
| Sorting students before 8th grade | National policy using student achievement to assign students to classes before the end of 8th grade. Dummy variable. |
| High-stakes exams before 8th grade | This variable measures whether a national educational authority administers examinations that have high-stakes consequences for individual students (such as entry to a higher school system and/or exiting/graduating from school) before the end of 8th grade. Dummy variable. |
| Other School-Level Controls | |
| Number of computers (deviation from country mean) | The variance of number of computers (in the unit of 10 computers) |
| Index of inequality/variation of concentrated economic disadvantage in schools | This index measures the inequality/variation of concentrated economic disadvantage in the percentage of schools having more than 50% of poor students. The index is calculated as such that countries with a high or low proportion of poor schools have greater homogeneity in school poverty environments. |
| Year Variable | |
| Year | The year in which TIMSS was conducted. 1—1995, 2—1999, 3—2003, 4—2007, 5—2011, 6—2015, 7—2019. |
Disclaimer/Publisher’s Note: The statements, opinions and data contained in all publications are solely those of the individual author(s) and contributor(s) and not of MDPI and/or the editor(s). MDPI and/or the editor(s) disclaim responsibility for any injury to people or property resulting from any ideas, methods, instructions or products referred to in the content. |
© 2024 by the authors. Licensee MDPI, Basel, Switzerland. This article is an open access article distributed under the terms and conditions of the Creative Commons Attribution (CC BY) license (https://creativecommons.org/licenses/by/4.0/).
Share and Cite
Xu, S.; Kelly, S. Social Determinants of School-to-School Differences in Opportunity to Learn (OTL): A Cross-National Study. Soc. Sci. 2024, 13, 499. https://doi.org/10.3390/socsci13100499
Xu S, Kelly S. Social Determinants of School-to-School Differences in Opportunity to Learn (OTL): A Cross-National Study. Social Sciences. 2024; 13(10):499. https://doi.org/10.3390/socsci13100499
Chicago/Turabian StyleXu, Shangmou, and Sean Kelly. 2024. "Social Determinants of School-to-School Differences in Opportunity to Learn (OTL): A Cross-National Study" Social Sciences 13, no. 10: 499. https://doi.org/10.3390/socsci13100499
APA StyleXu, S., & Kelly, S. (2024). Social Determinants of School-to-School Differences in Opportunity to Learn (OTL): A Cross-National Study. Social Sciences, 13(10), 499. https://doi.org/10.3390/socsci13100499


